Article

Erosion in Helico-Axial Pumps

1
Department of Mechanical Engineering, King Fahd University of Petroleum and Minerals, Dhahran 31261, Saudi Arabia
2
IRC for Renewable Energy and Power Systems, King Fahd University of Petroleum and Minerals, Dhahran 31261, Saudi Arabia
3
School of Interdisciplinary Engineering & Science, National University of Sciences and Technology, Islamabad 44000, Pakistan
*
Author to whom correspondence should be addressed.
Lubricants 2023, 11(4), 153; https://doi.org/10.3390/lubricants11040153
Submission received: 5 February 2023 / Revised: 16 March 2023 / Accepted: 21 March 2023 / Published: 23 March 2023

Abstract

:
With recent advancements in the petroleum industry, the need for multiphase pumps to transport multiphase products, such as the product of oil, water, and natural gas, arises along with their challenges. A helico-axial multiphase pump should be capable of converting fluid kinetic energy into pressure by avoiding gas–liquid separation and the gas-locking phenomenon, enabling smooth pump operation at higher gas volume fractions. In this paper, erosion on a helico-axial pump is evaluated at different flow conditions using sand particles mixed with water. A very important practical finding of this investigation is that the erosion rate increased when the flow conditions deviated from the design point of 3600 RPM. Operating the pump in off-design conditions not only reduced its hydraulic efficiency but also increased the erosion rates and hence reduces its life. It was observed that at 4800 RPM, the pump efficiency decreased by 11% and the erosion rate increased by 80%. This increase in erosion rate was attributed to the formation of local vortices upstream of the blade leading edge affecting the particle flow path and increasing its impact on the blade surface.

1. Introduction

As the transportation of multiphase products of oil and accompanying natural gas creates many challenges, a multiphase production system is required to transport multiphase fluids of petroleum products from a producing well to a distant processing facility. To utilize the depleting energy source more efficiently, some new technological advantages of helico-axial pump designs have attracted a lot of attention recently because of their capability to handle high gas volume fractions. This feature is highly needed in the petroleum industry where the oil well is mixed with natural gas, and both are pumped at the same time. In a multiphase transport system, only one multiphase pipeline is needed as the mixture of multiphase fluids is pumped simultaneously. Therefore, the cost of a multiphase transporting facility is only about 70% of a conventional separate transporting facility [1].
After the successful testing of multiphase pumps in the oil field in the early 1990s, they have been used all over the world since. The twin-screw multiphase pump and the helico-axial multiphase pump are examples of successful industrial pumps. Helico-axial pumps have a larger flow with higher toleration which are predicted to be the future direction of the subsea oil exploitation [2].
Despite the advantages of multiphase pumping like (a) increased production through lowering backpressure on wells, (b) elimination of vapor recovery systems, (c) reduction in capital equipment costs, and (d) reduction in the “footprint” of operations. Multiphase pumps do operate less efficiently depending on the gas volume fraction (30–50%) than conventional pumps and compressors (60–70% and 70–90%, respectively) [3].
The composition within oil wells constitutes a mixture of oil, gas, water, and sand particles. Conventional oil extraction methods use single phase pumps and hence, need to perform separation before transportation. This technique becomes difficult to maintain and less cost effective at underwater offshore and remote locations. A multiphase pump that can transport the mixture without separation is the viable solution for new oil and gas fields. Over the years, several multiphase pump technologies have been developed consisting of displacement-type pumps, multi-stage centrifugal pumps, and helico-axial pumps. Although there are few helico-axial pumps in use compared to the number of total multiphase pumping applications, they represent the majority of offshore and subsea installations due to their high volume pumping capabilities [4]. The presence of sand particles results in the performance degradation of helico-axial pumps [5]. Many experimental as well as computational investigations have been carried on finding the optimum helico-axial pump design; however, studies pertaining to erosion rates are lacking. This study investigates the erosion rates at design and off-design operating conditions for helico-axial pumps, and its effect on pump performance.
Research into multiphase pumps for the oil field began in mid-1970s, and the first patent for a multiphase pumping device comprising of a helical-screw blade was filed by Institut Francais Du Petrole (now IFP Énergies Nouvelles or French Institute of Petroleum) in 1976 [6]. By 1980, they had developed a hydraulic cell called Poseidon that included two helico-axial components. In 1983, a twin-screw axial pump multiphase pump was developed as a joint venture between various oil companies [7]. Bornemann also started the development of its own twin-screw multiphase pump for “live crude” which was tested for 3500 h at an onshore test rig. The Poseidon project [8] was a five-year venture aimed at developing a long life multiphase pumping mechanism for subsea applications. The project resulted in a helico-axial prototype pump that was tested for 4000 h in a desert application test rig in Tunisia [9].
Early field applications of the helico-axial pumps were characterized by relatively low flow rates. These include the pump installed in the Total Fina Elf Pecorade field, in the south of France, with a total capacity of 360 m3/h and drive power of 600 kW [10], and the pump installed in the Statoil Gullfaks A Platform in the North Sea with a capacity of 200 m3/h and drive power of 750 kW [11]. Since then, helico-axial pumps have been operating successfully at the North Sea field [12], Mutineer and Exeter field offshore of NW Australia [13], and a remote desert location onshore the Emirate of Abu Dhabi [14].
The design and performance investigations for helico-axial pumps were initially limited to experimental and analytical methods, but recently, Computational Fluid Dynamics (CFD) has also been used to study helico-axial pumps. One of the earliest experiments was performed by Falcimaigne et al. [15] who investigated flow field visualization within a single-stage helico-axial pump using Laser Doppler Anemometry. The effects of the Reynolds number on flow characteristics and bubble diameter distributions were analyzed at various rotational speeds and flow rates. Serena and Bakken [16] designed and constructed an advanced laboratory setup allowing the study of a multiphase pump model capable of relating the pump behavior and instabilities to flow phenomena in the hydraulic channels, studying the machine’s ability to handle multiphase flows and transient conditions and the influence of operating parameters on the machine performance and operating range, which were described through performance maps. The tests on the test rig provided a wide collection of test data of great value for a further understanding of the surging phenomenon, and the development of a surging onset prediction model and a control strategy [17]. Zhang et al. [18,19] performed an experimental investigation into the flow field characteristics at the entrance region of a three-stage helico-axial multiphase pump. The variations in bubble size with inlet gas volume fraction (IGVF) and rotation speed were examined under different operating conditions. It was found that bubble sizes grew with the increase of the IGVF but decreased with increasing rotation speed.
In addition to experimental investigations, various analytical models have been proposed for the design and performance estimation of helico-axial pumps. An iterative design model of a direct and inverse problem was proposed by Cao et al. [20] for the geometry of impeller blades for a specified velocity torque distribution by treating the two-phase mixture as a homogeneous fluid under the design conditions. The model was tested against experimental data for various gas volume fractions. Liu et al. [21,22] proposed a hydraulic design method of controllable blade angle for a rotodynamic multiphase pump with an impeller and diffuser based on the Oseen vortex model. The optimized blade angles improved the pressure rise by 12.8 kPa and showed uniform distribution of the gas volume fraction (GVF) and pressure. Zhang et al. [23] proposed a 3D blade hydraulic design method for a multiphase helico-axial pump by accounting for the compressibility of the gas fraction of the mixture using numerical simulations and bench tests.
CFD investigations for helico-axial pumps have been performed by various researchers. Suh et al. [24] developed the Euler–Euler multiphase flow model for the numerical simulation of the flow field of a multiphase pump and studied the hydraulic performance of the multiphase pump under different phase forces, turbulent dissipation forces, and bubble diameters. Suh et al. [25] then performed a numerical optimization on the developed model to enhance the hydraulic performance of multiphase pumps using CFD. Yu et al. [26] analyzed the effect of virtual mass force on the trajectories of bubbles in the blade area and differential pressure of the multiphase pump according to various GVFs at an unsteady state. Yu et al. [27] also studied the magnitude of four main forces (drag, lift, virtual mass, and turbulent dispersion forces) of the helico-axial multiphase pump at various operating conditions of GVF, bubble diameter, and rotational speed. The influence of the four main forces on the predicted performance of the multiphase pump was investigated. Li [28] carried out a numerical simulation of gas–liquid two-phase distribution in the multiphase pump based on a bubble number density equation, and investigated the effects of bubble polymerization and collapse on the two-phase flow pattern. Han et al. [29] investigated the impact of airfoil thickness variations on the performance of a helico-axial multiphase pump, and optimized the airfoil thickness ratio coefficient to get a higher efficiency. The results showed that, for the same hub thickness, the head coefficient and efficiency increased, and the aggregation degree of gas decreased with decreasing thickness ratio coefficient.
In addition to the performance efficiency of the pumps, their structural reliability is also a vital consideration during oil extraction operations. A comprehensive failure analysis study of Electrical Submersible Pumps (ESPs) used for oil extraction was conducted by Mubarak et al. [30]. They analyzed 501 pump failure cases and found that erosion was always a key factor that directly affects the pump performance and contributes to the failure of a pump. Hence, erosion modeling and analysis is vital to a feasible pump design. Early erosion studies on pumps were limited to slurry pump experiments and field data of operational pumps. With the improvement of computational power, 3D simulations on multiphase rotors were made possible. Stavros [31] conducted an experimental investigation of pumps using nano-indentation, impact test, and 3D surface topography to evaluate the erosion factor of different types of coatings. They also performed CFD analysis using a Finnie erosion model to predict the erosion rate of a submersible pump. It was found that the particles with higher diameters tend to increase the erosion rates inside the impeller since they collide with greater forces on the impeller surfaces, whereas smaller particles are responsible for the higher erosion rates occurring in the diffuser. Kruger [32] compared the erosion pattern of impellers resulting from experiments and the simulation, and concluded that both conventional empirical and modern numerical approaches allowed only a qualitative prediction of the erosion pattern. The complex physical behavior with material hardening and softening as well as the resolution of the boundary layer showed clear limitations for the quantitative prediction of friction-like erosion. Pagalthivarthi [33] conducted a numerical prediction of erosion wear trends in a centrifugal pump casing pumping dilute slurries using CFD. It was found that an increase in pump flow rate increased the wear rates, whereas the wear rates decreased with increased casing width. Pirouzpanah [34] numerically investigated erosion in an ESP-WJE1000, manufactured by the Baker Hughes Company, employing the Eulerian–Granular scheme in ANSYS Fluent. The key parameters affecting the erosion phenomena within the pump, such as turbulence kinetic energy, local sand concentration, and near-wall relative sand velocity, were identified and a predictive erosion model was developed by correlating the erosion key parameters with available experimental results.
Despite these erosion studies on ESPs, very few erosion studies exist for helico-axial pumps. Chen [35] performed three phase experimental erosion testing and CFD analysis on a helico-axial (Poseidon) ESP manufactured by Schlumberger. After 200 operating hours at the test rig, a combined analysis of component wear measurements, performance, and vibrations was performed to investigate the effect of 200 h of wearing on the pump. In order to evaluate the volume of metal loss by this ESP, 3D scanning technology was applied, allowing the comparison of the original and eroded impellers. CFD simulations on both the original and eroded pump geometries were carried out using ANSYS FLUENT to evaluate the performance variation. An erosion model for predicting erosion rate was introduced to the simulations and calibrated by the loss of thickness of the impeller. A case study for erosion on a helico-axial pump from the field was presented by Ekeberg [2]. The pump system was successfully installed, commissioned, and started during the spring of 2017. In August 2017, a sand screen in one of the wells failed. Following this event, the pump was subjected to significant amounts of sand before it was retrieved for a planned revision in February 2018. The retrieved pump was inspected, and the erosion on the impellers was documented. The predicted wear was compared to the wear observed on a subsea MPP retrieved from the Moho Field. The strong correlation between the Moho Field experience and experiments indicated that viscosity was the dominant source. It was concluded that the use of the viscosity factor, yielding significantly reduced wear rates due to particles being suspended in a highly viscous medium, was justified.
We can conclude from the literature review that few published research papers have dealt with erosion in pumps. Furthermore, very few papers dealt with erosion inside helico-axial pumps if any. The objective of this study is to investigate the erosion characteristics inside a helico-axial pump under liquid phase water flow accompanied with a low volume fraction of sand particles. We will look at the erosion behavior at different operating conditions of the pump and for different sand loading rates of the sand as well as different sand particle sizes.

2. Mathematical Modeling

2.1. Main Phase Flow Modeling in the Pump

A three-dimensional Reynolds-Averaged Navier–Stokes equation was used for the turbulent flow analysis in the internal flow field of the pump. The continuity and momentum equations for steady compressible turbulent flows can be written as:
x i ( u i ) = 0
t ( ρ u i ) + x j ( ρ u j u i ) = P x i + x j ( μ + μ t ) ( u j x j + u i x i ) + ρ g i
where ρ is the density, u is fluid velocity, μ is the fluid viscosity, and τ refers to the stress tensor. For single-phase flow analysis, incompressible numerical analysis was performed because of the high water density. Thus, there is no need for the energy equation. The finite volume method (FVM) is used for the numerical solution of the problem in linear or nonlinear PDEs with different boundary conditions. Turbulent flow effects are modeled using the shear-stress transport (SST) k-ω model [36]. The benefit of using a hybrid two-equation model (k-ω SST) is in its capability to capture the turbulence details in the entire flow field, which includes the viscous sub-layer.

2.2. Erosion (Second Phase) Modeling

After the completion of the fluid flow solution, particle tracking is computed from the inlet of the pump to the outlet of the pump using the discrete phase model (DPM). The turbulence effect on the particles is included and modeled using a stochastic model (the discrete random walk (DRW) model), and, to ensure the independence of erosion prediction, 50,000 particles are ejected at the inlet.
When particles move in the liquid in the Lagrangian framework, the particles interact with the pump with a force that comes from the velocity difference between the particle and the fluid. The forces on the particles are resistance, virtual mass force, pressure gradient force, gravity, Basset force, Saffman force, Magnus force, etc. The acceleration of an arbitrary particle can be written as:
d u p d t = F D + F S L + F G + F V M + F P
where t is the time, u p is particle velocity, and the forces F D ,   F S L ,   F G ,   F V M ,   and   F P are the resistance, Saffman force, gravity force, virtual mass force, pressure gradient force, and the sum of other external forces, respectively. F D is the drag per unit particle mass and is defined as the ratio of particle relative velocity ( u u p ) to residence time τ r (Eq.) which is defined in terms of Reynolds number and particle drag coefficient ( C d ) :
F D = u u p τ r
τ r = 24 × ρ p × d p 2 C d × 18 μ × R e p
The particle drag coefficient C d , which is also a function of R e p and particle sphericity ϕ, is an important parameter in modeling particle transport. Chochua and Shirazi [36] plotted a variation of C d with respect to R e p and ϕ, using the correlation for non-spherical particles [37], and showed that sphericity effects C d when the Reynold’s number is greater than 10 and that C d becomes lower as ϕ approaches 1. R e p is then expressed as:
R e p = ρ d p | u u p | μ
Other forces that have an impact on the motion of the particles in the fluid are expressed as:
F G = g ( ρ p ρ f ) ρ p
F V M = 1 × ρ f 2 × ρ p d d t ( u u p )
F P = ρ f ρ p u p u
The buoyancy force due to gravitational acceleration F G is a function of the difference in densities. The pressure F P and virtual mass force F V M (force on the particle due to the mass of fluid displaced by the particle) are included in this study because these forces have a significant impact on the solid particle motion [36].
The Saffman (shear) lift force is the force acting on the particle surface due to the high velocity gradient, and this force is considered significant when the particle velocity is greater than the fluid velocity. Therefore, in this study, this force is not considered.

2.3. Erosion Model

The erosion model adopted in this study is the Finnie model and the erosion ratio can be expressed as [38]:
E R = K V p n f ( )
where ER is the erosion ratio (kg/kg) and it is the ratio of the mass of material removed to the mass of an impinging particle. f ( ) is the impact angle function and K is a scaling parameter. The material used for the erosion analysis is stainless steel 316 which has a value of K of 2.17 × 10⁻⁸ and the number (N) of impacts per unit time is 2.41. The density ρ ω of the material is 8000 kg/m3 [39].
The Finnie model can be modified to consider other factors that influence erosion, such as the size and shape of the particles and the presence of a protective coating on the material. The model can also be used to predict the erosion of materials under different operating conditions, such as different temperatures and flow rates.

3. Solution Method and Validation

For the numerical calculation, water was selected as the working fluid, whereas for the erosion analysis, sand particles mixed in the water were modeled using the Discrete Phase Model (DPM). The Turbo-workflow module in ANSYS Fluent was used for CFD calculations. ANSYS Turbo Workflow is the new module introduced in ANSYS Fluent 2022. This module was introduced to solve turbomachinery problems in fluids.
The helico-axial pump consisted of four components: inlet, impeller, diffuser, and outlet. The Impeller consisted of 3 blades whereas, the diffuser consisted of 11 blades, resulting in a diffuser/impeller blade ratio of 1:3.667. The pump under consideration is a single-stage pump.

3.1. Geometry

Blade Gen was used to create the geometry of the pump. The geometry contains four components: inlet, impeller, diffuser, and outlet. The dimensions of the domains are summarized in Figure 1.

3.2. Meshing

A structured mesh was created on the computational model (Figure 2) of the helico-axial pump using the ANSYS Turbogrid tool. Three meshes were chosen for the mesh independence study (1.187112 million cells, 1.573507 million cells, and 1.745072 million cells). Figure 3 shows the pressure difference (KPa) between the inlet and outlet of the pump at different mesh sizes. The pump was run at a 80 m3/h flow rate and 3600 RPM rotational speed. A dotted line of the experimental result at these flow conditions is drawn as a reference. Mesh 2 (1.573507 million cells) was chosen to perform the flow and erosion analysis.
The total number of cells in the computational mesh of pump was 1.573 million, with 1.154 million cells in the impeller and inlet domain, and 0.104778 million cells in the single blade of the diffuser and outlet. It may appear from Figure 3 that a more refined mesh is needed. If we evaluate the percent error, we find that all meshes performed very well compared to experimental results. The error was 0.27% for Mesh 1, 0.38% for Mesh 2, and 0.39% for Mesh 3. Practically speaking, both experimental errors and numerical errors would be greater that those errors (about 3 to 5%). Hence, all meshes were giving very good and accurate results in terms of pressure rise. We have chosen Mesh2 (see Figure 4) because its boundary layer meshing conformed well with the erosion model prediction method and turbulent boundary rules as set by the CFD solver [37].

3.3. Method of Solution

ANSYS Fluent was used for the numerical analysis. The helico-axial pump was modeled using the Turbo-workflow module in ANSYS Fluent. A mass flow inlet condition was applied on the inlet of the pump and a pressure outlet condition on the outlet of the pump. The walls interacting with the fluid flow passage are termed as non-slip walls. However, the impeller blades and walls were given a rotational speed of 3600 RPM. The turbulence model chosen was SST K-ω. The conditions are summarized in Table 1.

3.4. Validation of Numerical Solution

3.4.1. Pump Flow Validation

For flow validation, the pressure difference between the inlet and outlet of the pump was compared with the experimental results given in [18,19]. The analysis was performed on five different flow rates: 80, 90, 100, 110, and 120 m3/h. Table 2 summarizes the conditions used for validation and Figure 5 shows the comparison of the CFD and experimental results.

3.4.2. Validation of Erosion Model

For the erosion validation, a submerged jet impingement problem was considered [39]. Its computational domain is shown in Figure 6. The discretization of this domain using a structured mesh with a refined mesh concentrated in the region between the nozzle outlet and the target is shown in Figure 7.
For the erosion analysis, the thickness loss is calculated on the line 1 mm above the target plate at which erosion is quantified. Thickness loss is the depth of erosion in the target material in meters.
T L = E r a t e × t / ρ ω
For validation of the CFD erosion model, the experimental results by Mansouri et al. [38] for the 90° impingement angle were used. The validation case was the submerged plate under the direct impact of water at 14 m/s with 30 µm sand particles at 1% sand concentration by mass. In Figure 8, it is clear that the locations of maximum and minimum erosion points are well matched, while on average, a 15% inconsistency in the erosion depth downstream from the maximum erosion point was observed.

4. Results and Discussion

To study the erosion effect on the helico-axial pump, base flow conditions (Table 3) were chosen after the validation of water flow. The water mass flow was set at 100 m3/h and the rotational speed of the impeller was 3600 RPM.
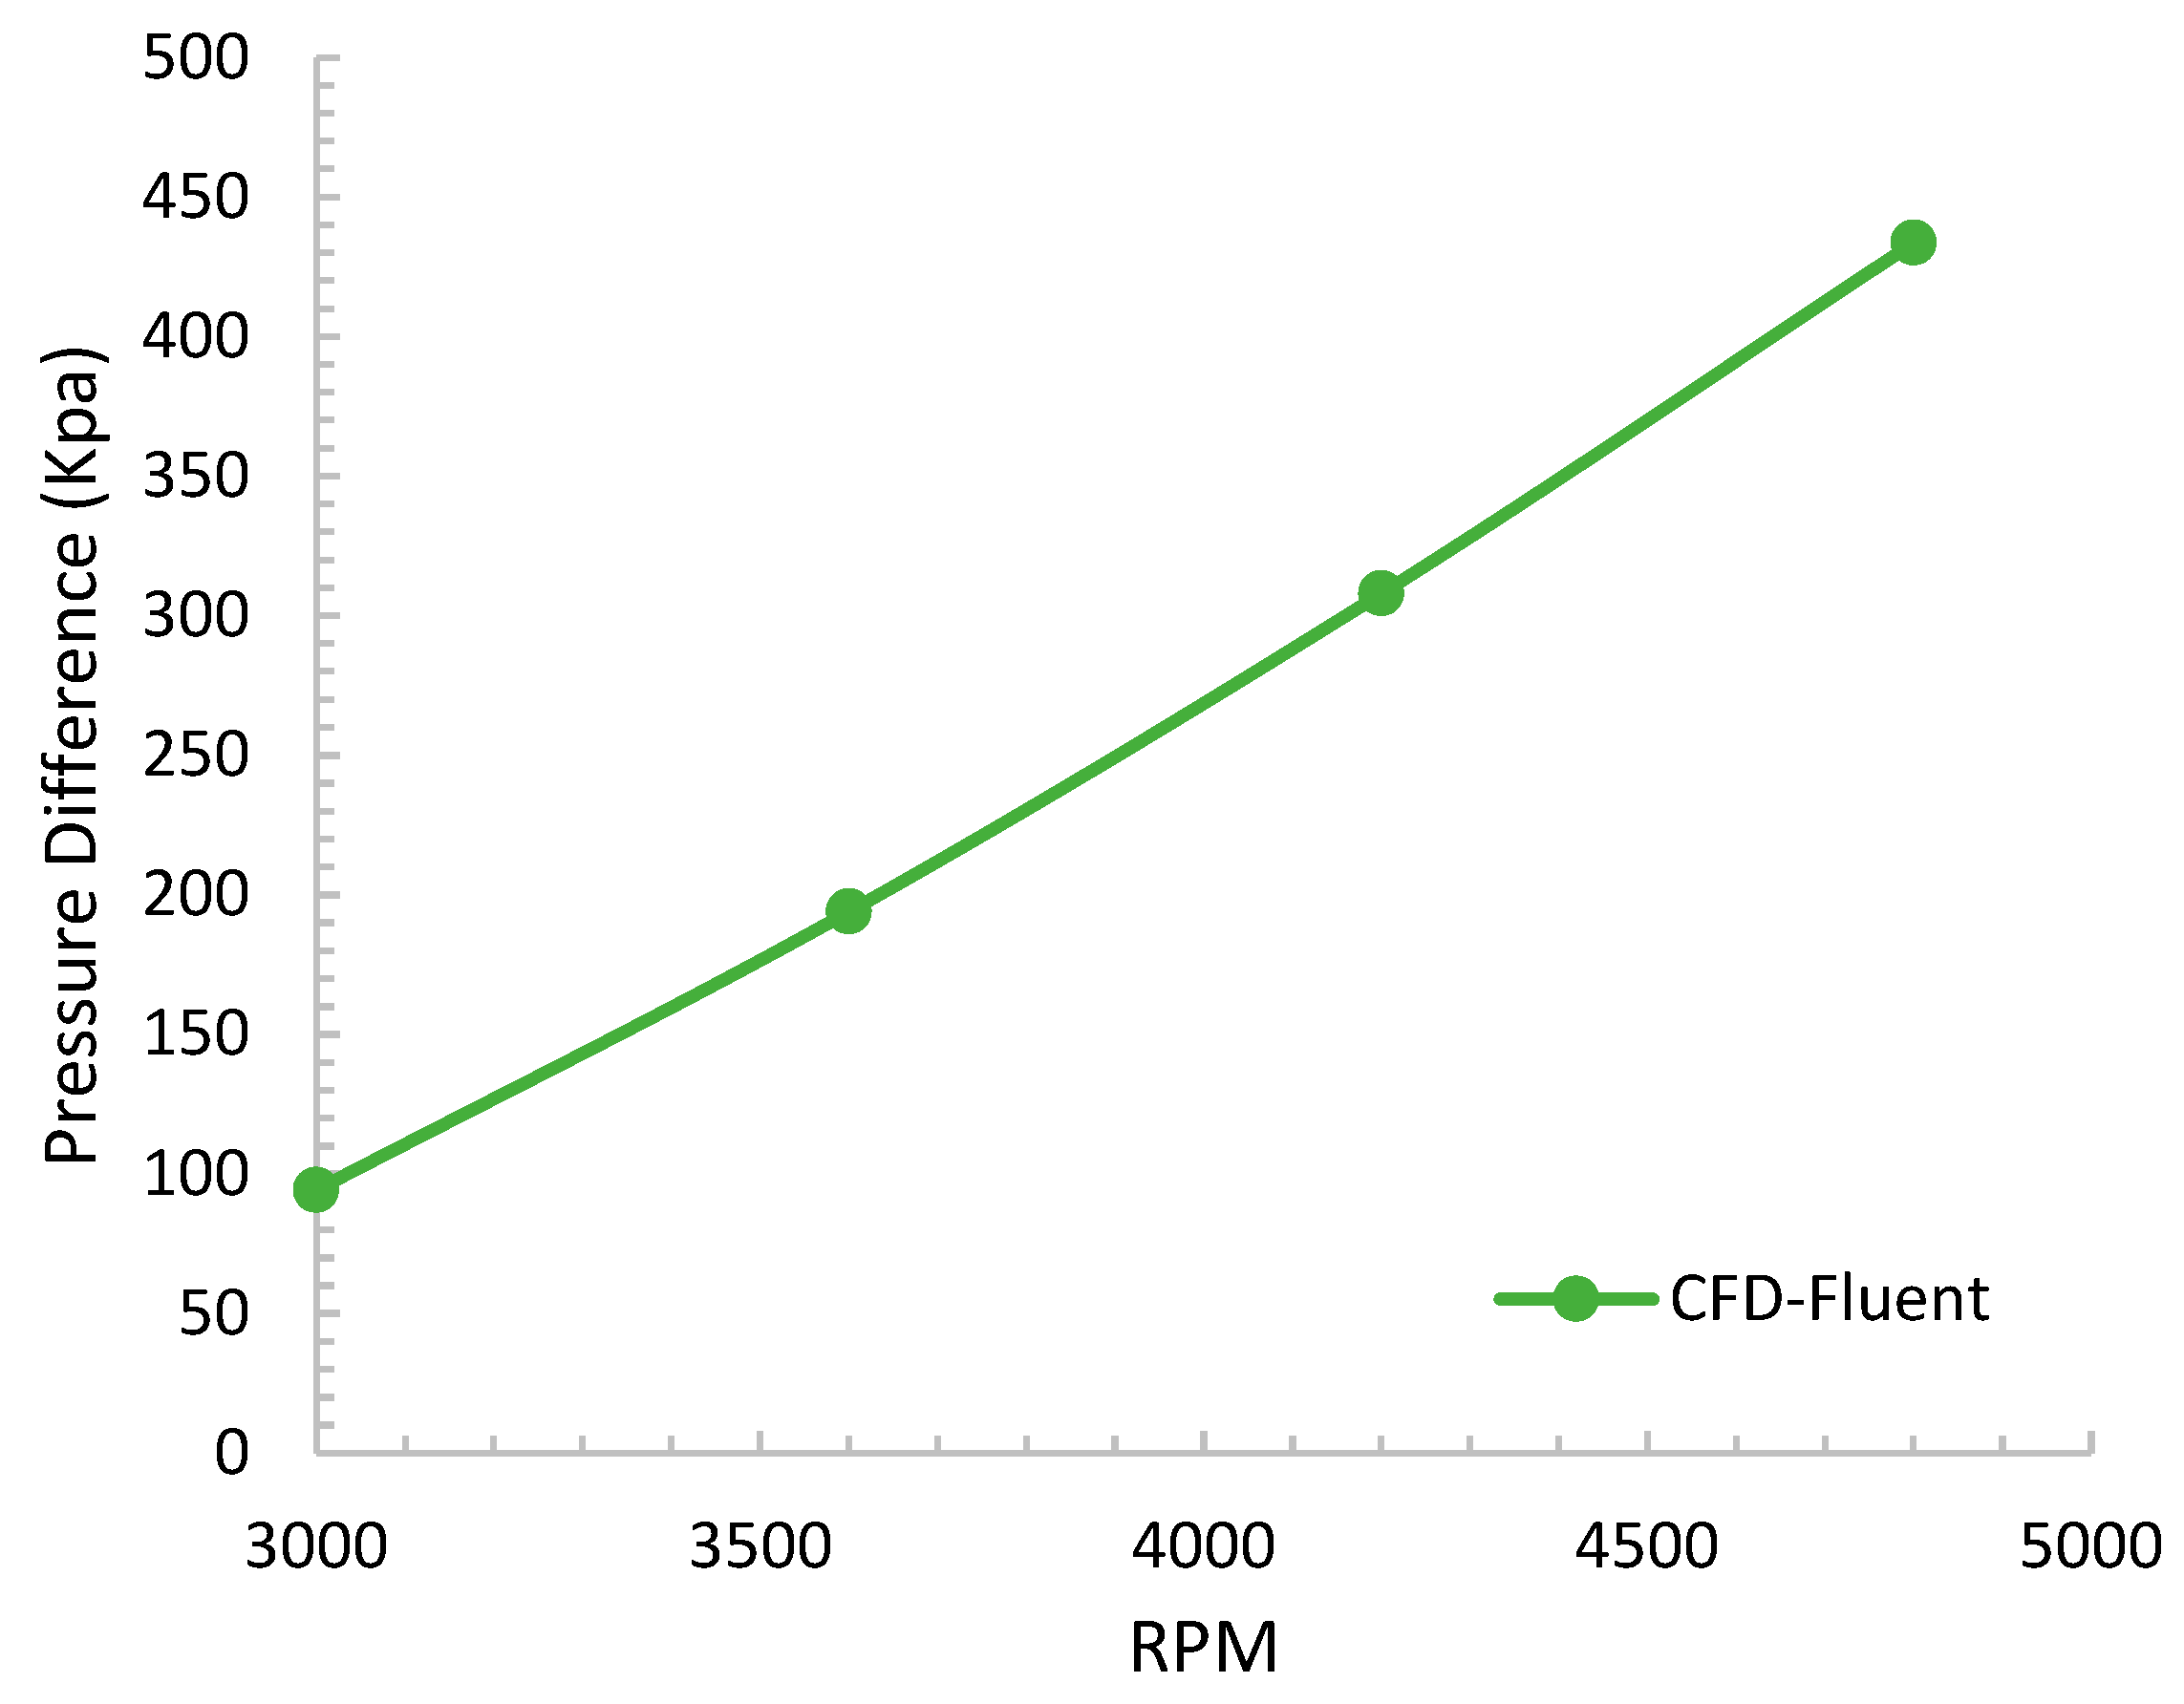
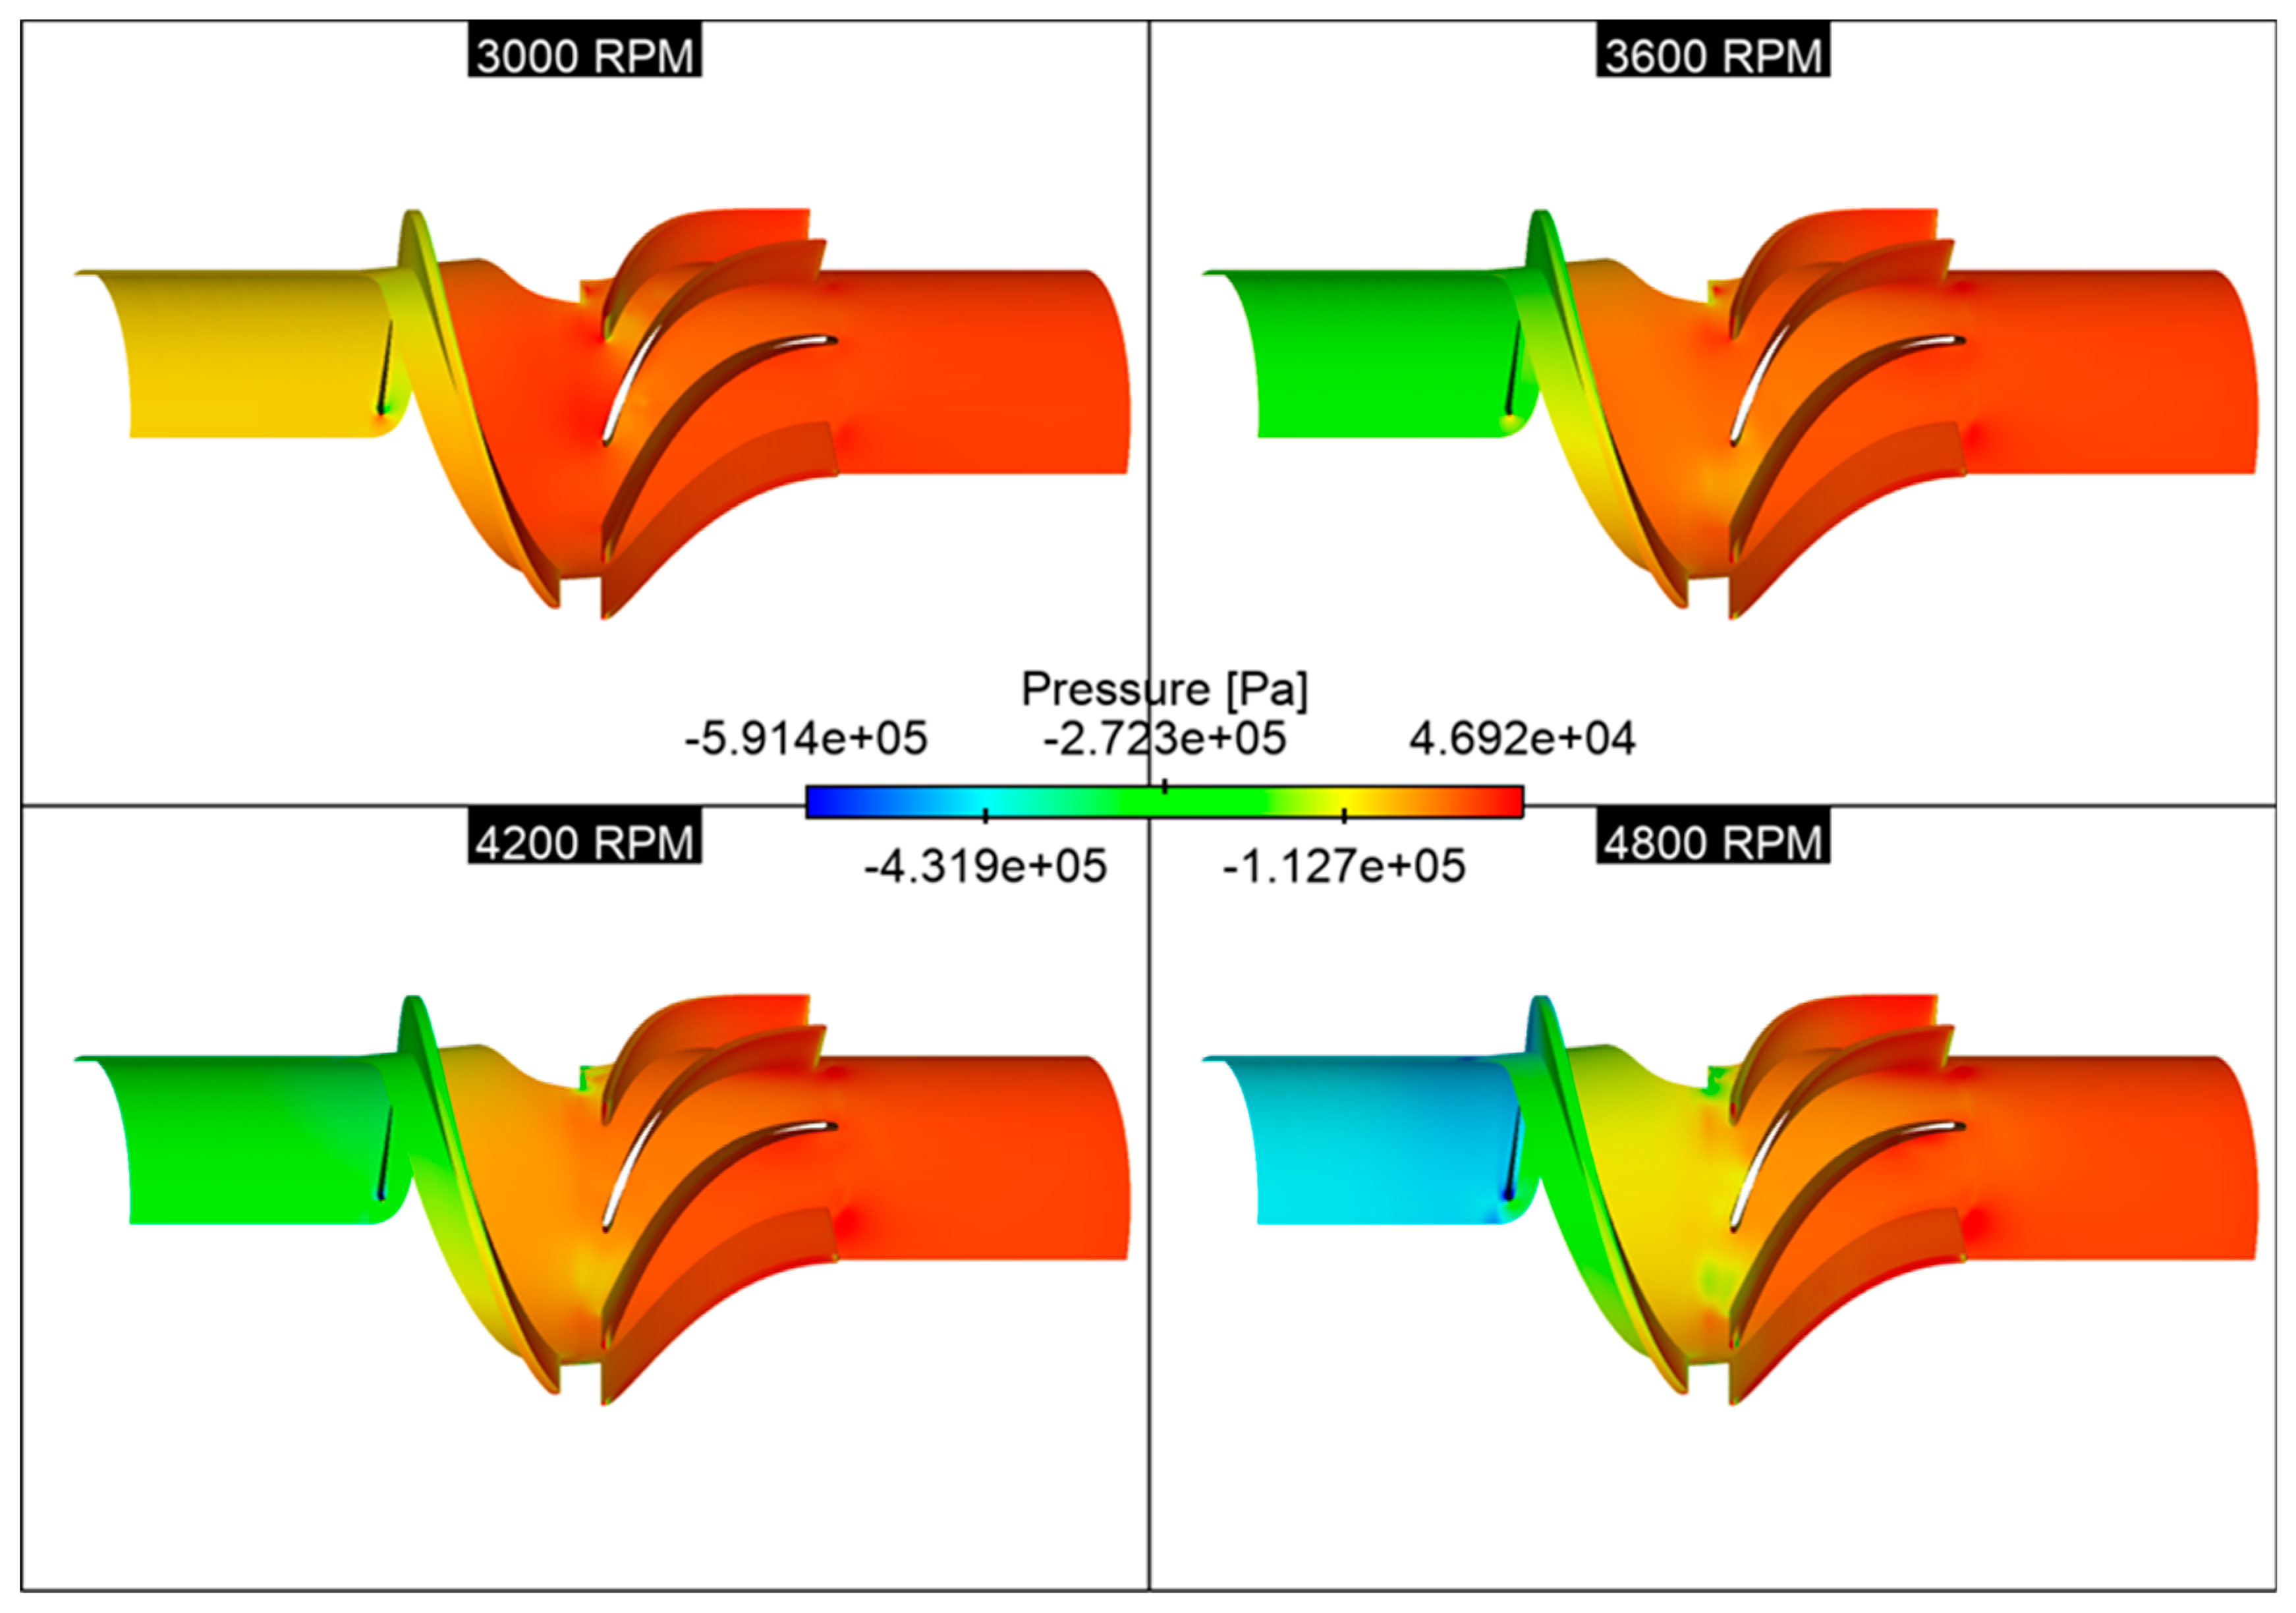
The pressure difference results shown in Figure 9; indicate that the pressure difference gradually increased as the impeller RPM increased. This effect was also represented in 
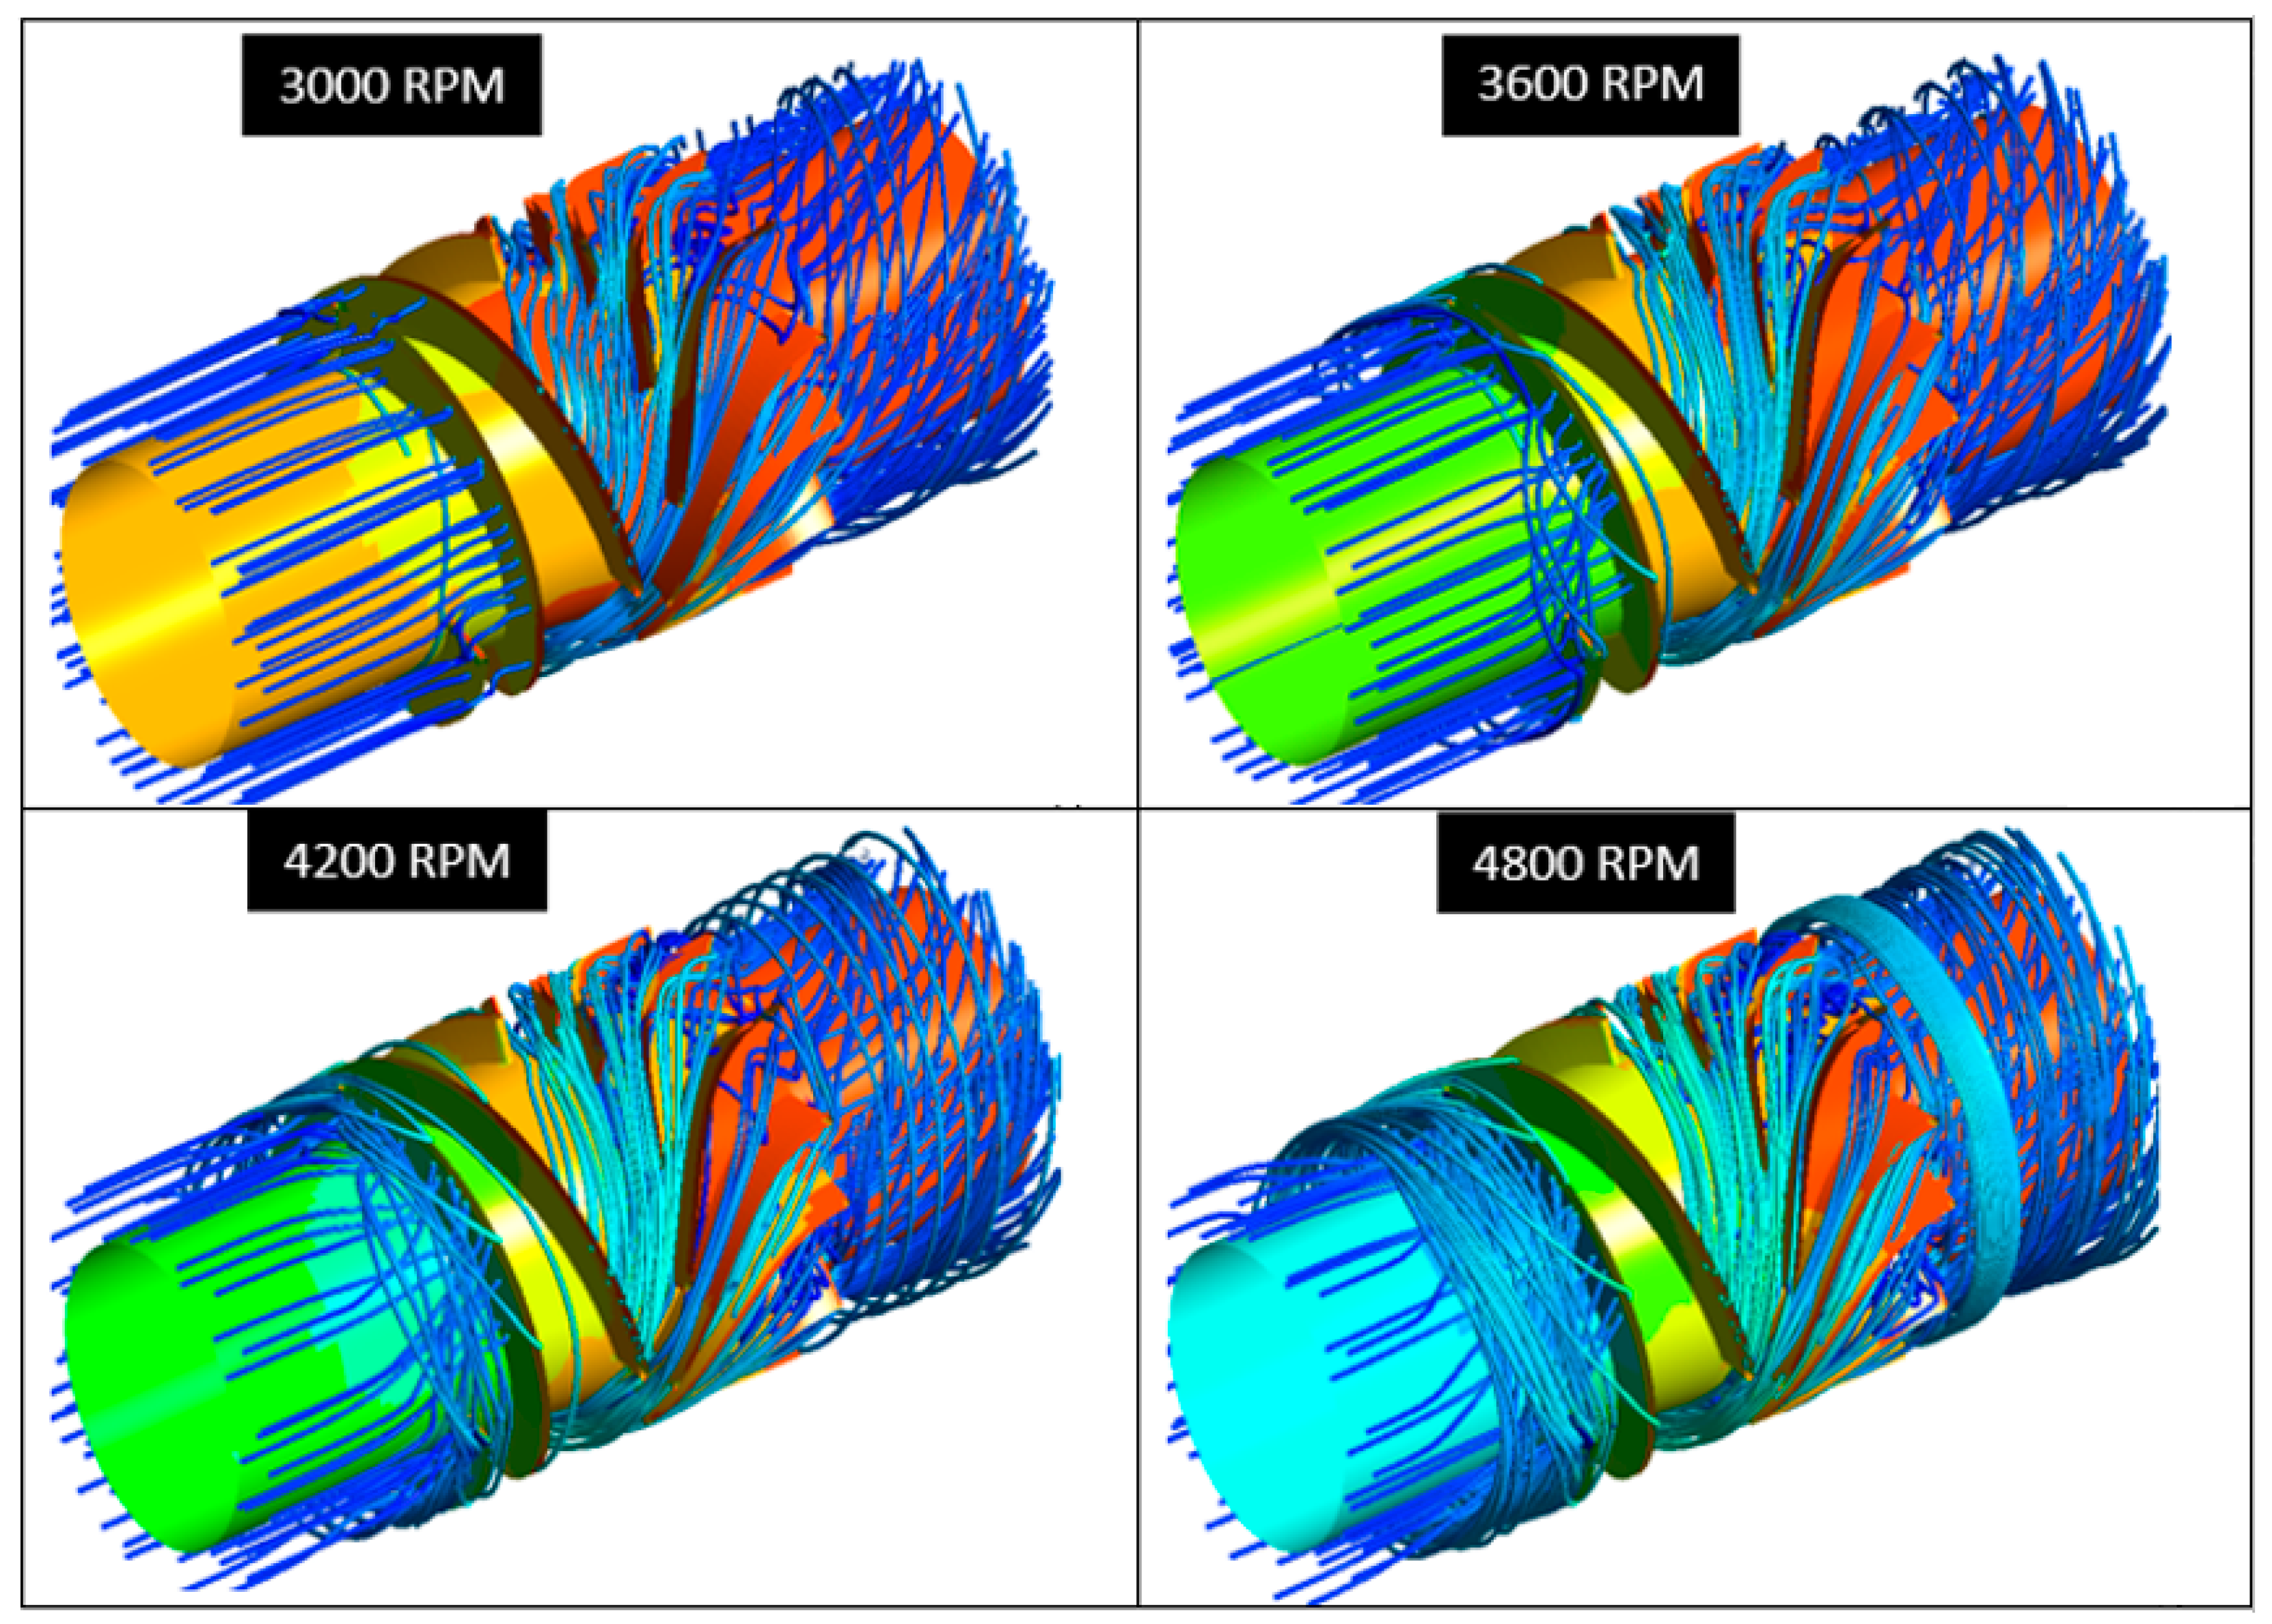
Figure 10. The outlet pressure did not change drastically but the inlet pressure decreased as the impeller RPM increased. Additionally, when the impeller was at 3600 RPM, the streamlines were almost parallel to the blades of the machine (Figure 11) compared to the impeller at other rotational speeds.
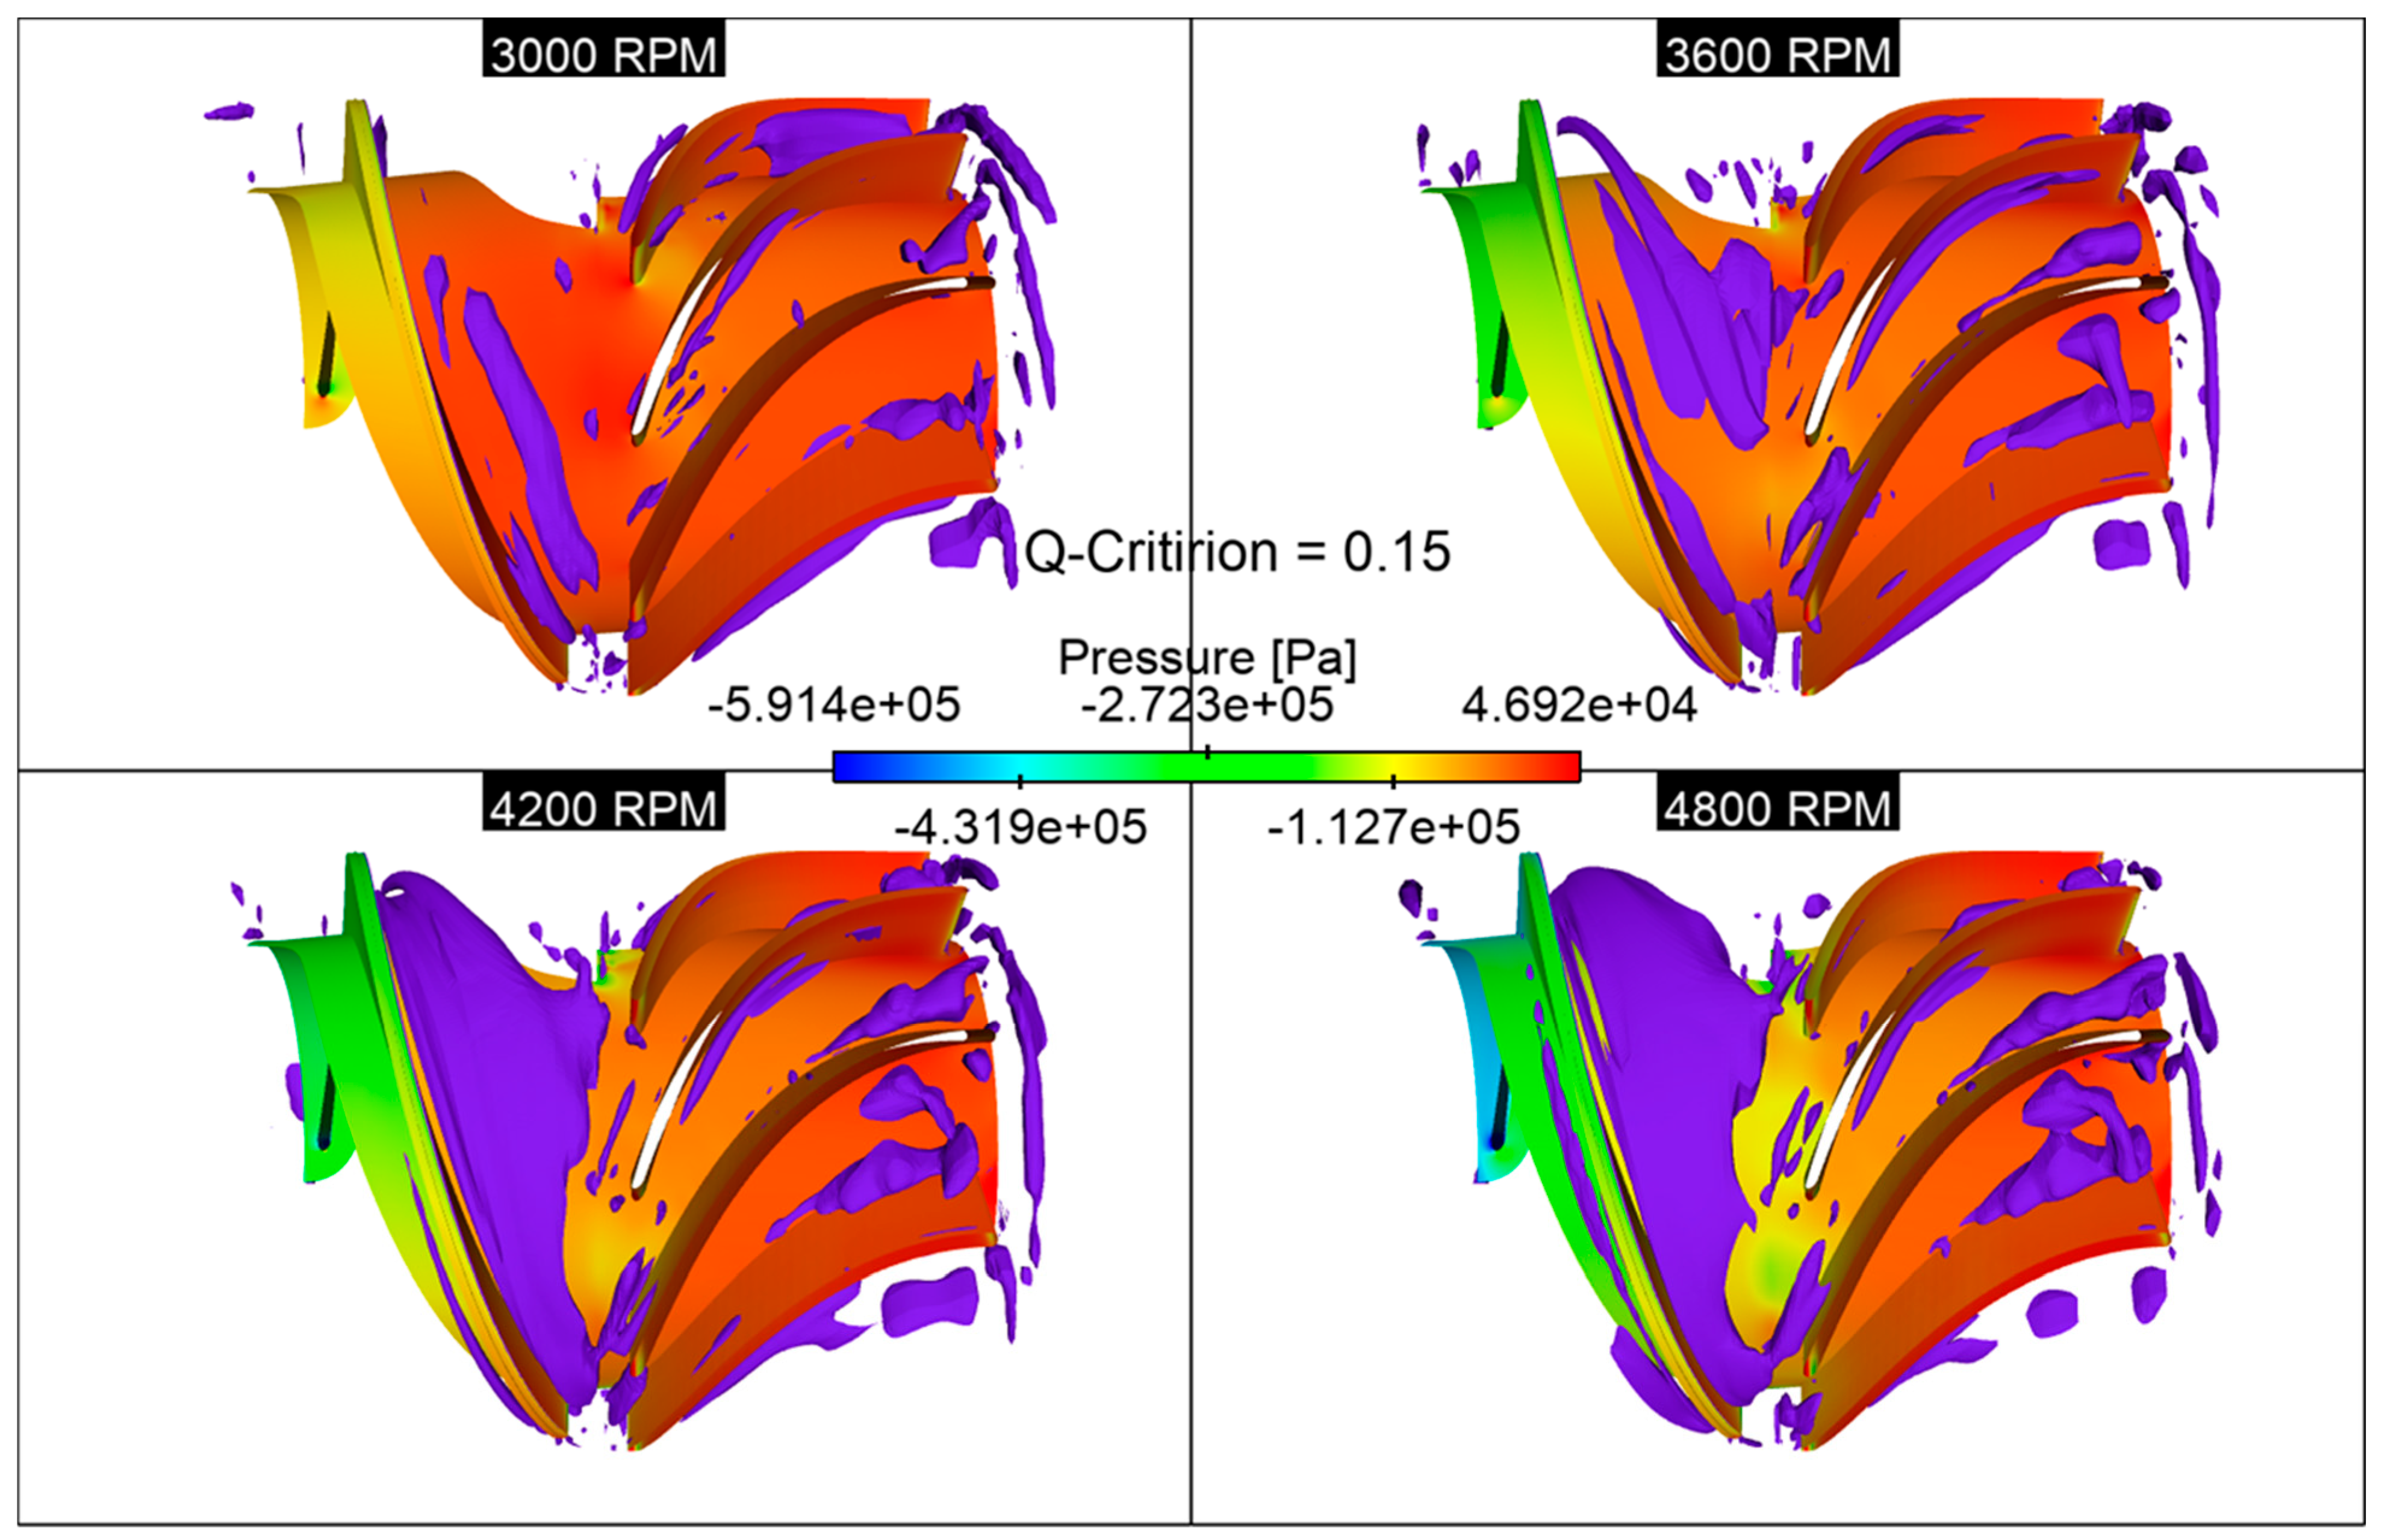
The pressure gradient in the flow field resulted in vortex generation along the blade passage. This vortex had a great influence on the particle trajectory and the region affected by particle erosion. The Q-criterion method was used for identifying vortices in the fluid passage, and the Q-criterion iso-surfaces are shown in Figure 12 for different pump rotation speeds. It was observed that as the rotational speed increased, the vortex core became stronger upstream of the blade. The particles carried by the local vortex struck against the wall in the vicinity of the vortex-affected region, resulting in increased local friction and erosion rates at higher rotational speeds.

4.1. Parametric Study

The parametric study conditions are summarized in Table 4. In this study we have varied the sand particle size from 50 to 300 microns. We looked at four different sand flowrates ranging from 0.5 to 3% of the mass flow rate of water. The fluid flow simulations were executed for four different rotational speeds of the pump ranging between 3000 and 4800 RPM.

4.2. General Discussion of Erosion Features Using 100 µm Sand Particles

Since a 100 µm sand diameter is a representative particle size for many naturally occurring abrasive materials, including sand and silt, it is frequently employed as a baseline size for erosion investigations. In lab research, this size range is frequently employed to mimic the abrasive effects of natural erosion processes.
The fact that 100 µm is within a range that is typical of the size distribution of many naturally occurring abrasive materials is one reason why this size was chosen as the baseline. The outcomes of erosion experiments can be more easily compared and extrapolated to real-world settings by selecting a size that is indicative of the materials that are frequently encountered in the environment.
Additionally, lab investigations frequently employ sand with a diameter of 100 µm since it enables the controlled examination of erosion effects. To comprehend the impact on erosion rates, for instance, it is possible to alter the size, hardness, and concentration of the abrasive particles in a laboratory setting. Researchers can compare the findings of many experiments and evaluate the relative influence of various variables on erosion rates by utilizing a baseline size of 100 µm.
Since it is typical of naturally occurring abrasive materials and a size that is frequently utilized in laboratory research, a 100 µm sand diameter was used as the baseline size for erosion investigations.

Effect of Particle Size on Erosion Rates

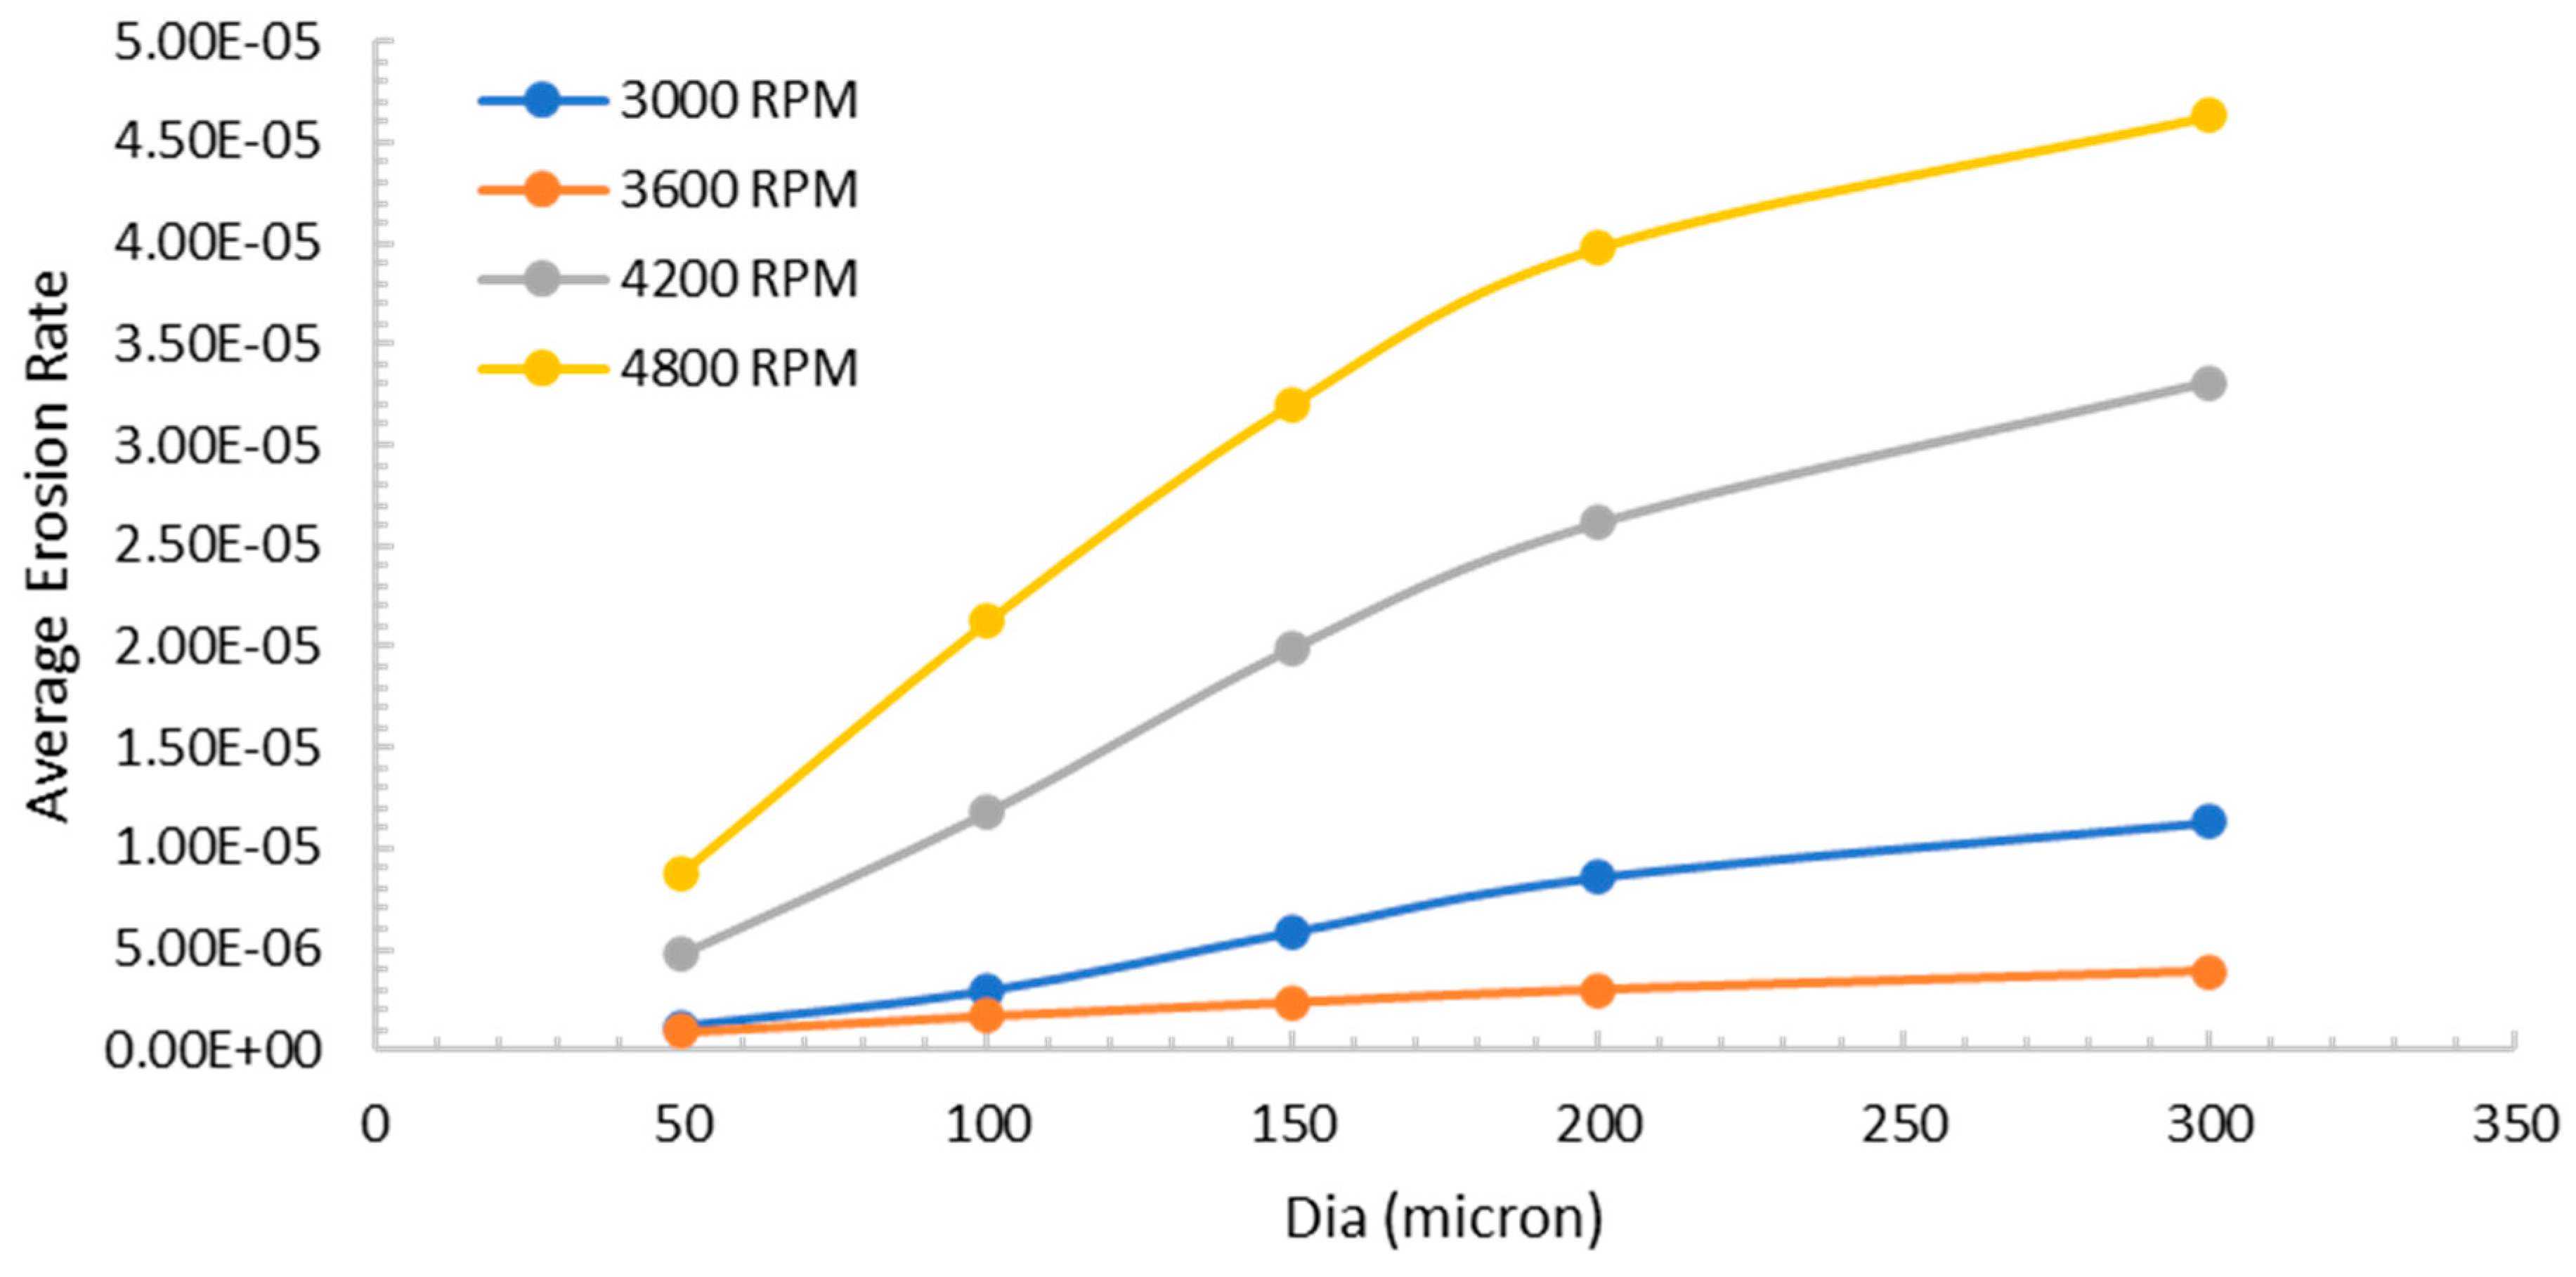
The effect of particle mass flow rate on the erosion rates was investigated for different rotational speed of the helico-axial pump ranging from 3000 RPM to 4800 RPM. Injections of particles of different diameters were used with a turbulent stochastic model to investigate this effect. The particle ranged from 50 microns to 300 microns. This choice was based on particle size distributions measured in the laboratory with proper instrumentation.
The results shown in Figure 13 show that the erosion rates increased as the particle size increased as predicted by the erosion model chosen here and by all erosion models cited in the literature review section. However, the rate of increase was different for different speeds. For example, for the 3600 RPM speed, the increase was linear and there was a constant rate of increase as the particle size increased. On the other hand, for the other speeds, the rate of increase was higher for relatively small sizes (50 to 150 microns) and then the rate of increase diminishes for larger size particles (200 to 300 microns). There are two possible explanations for this behavior. The first one is the size of the particles. For large particles, the aerodynamic drag and the weight of the particle are both taken into consideration when tracking these particles; in most situations, both forces work in opposition to the inertia of the particles and as a result, reduce their speed of impact at the solid walls of the pump and hence reducing the erosion rates.
The second reason for the reduction in the erosion rate increase is that the rotational speeds of 3000, 4200, and 4800 RPM are rotational speeds that are off-design points of the pump which has a design speed of 3600 RPM. When the pump operates at off-design speeds, the fluid losses increase due to more circulation and higher turbulence. These losses are automatically transferred to losses in the particles’ speed and as a result, a reduction in the rates of increase of erosion rates is observed as the particle size increases.
Before we proceed to the next important result, it is important to distinguish between the absolute erosion rate and the rate of increase of the erosion rate with particle size. Referring again to Figure 13, it is clear that the predicted erosion rates were the smallest for the design speed of the pump which is 3600 RPM. The erosion rates were smaller for a lower off-design speed of 3000 RPM and also for higher off-design speeds of 4200 and 4800 RPM. This is a very important and practical result. Operating a pump off-design not only decreases its hydrodynamic efficiency but also leads to much higher erosion rates caused by the produced circulation or vorticity and also the higher level of turbulence.
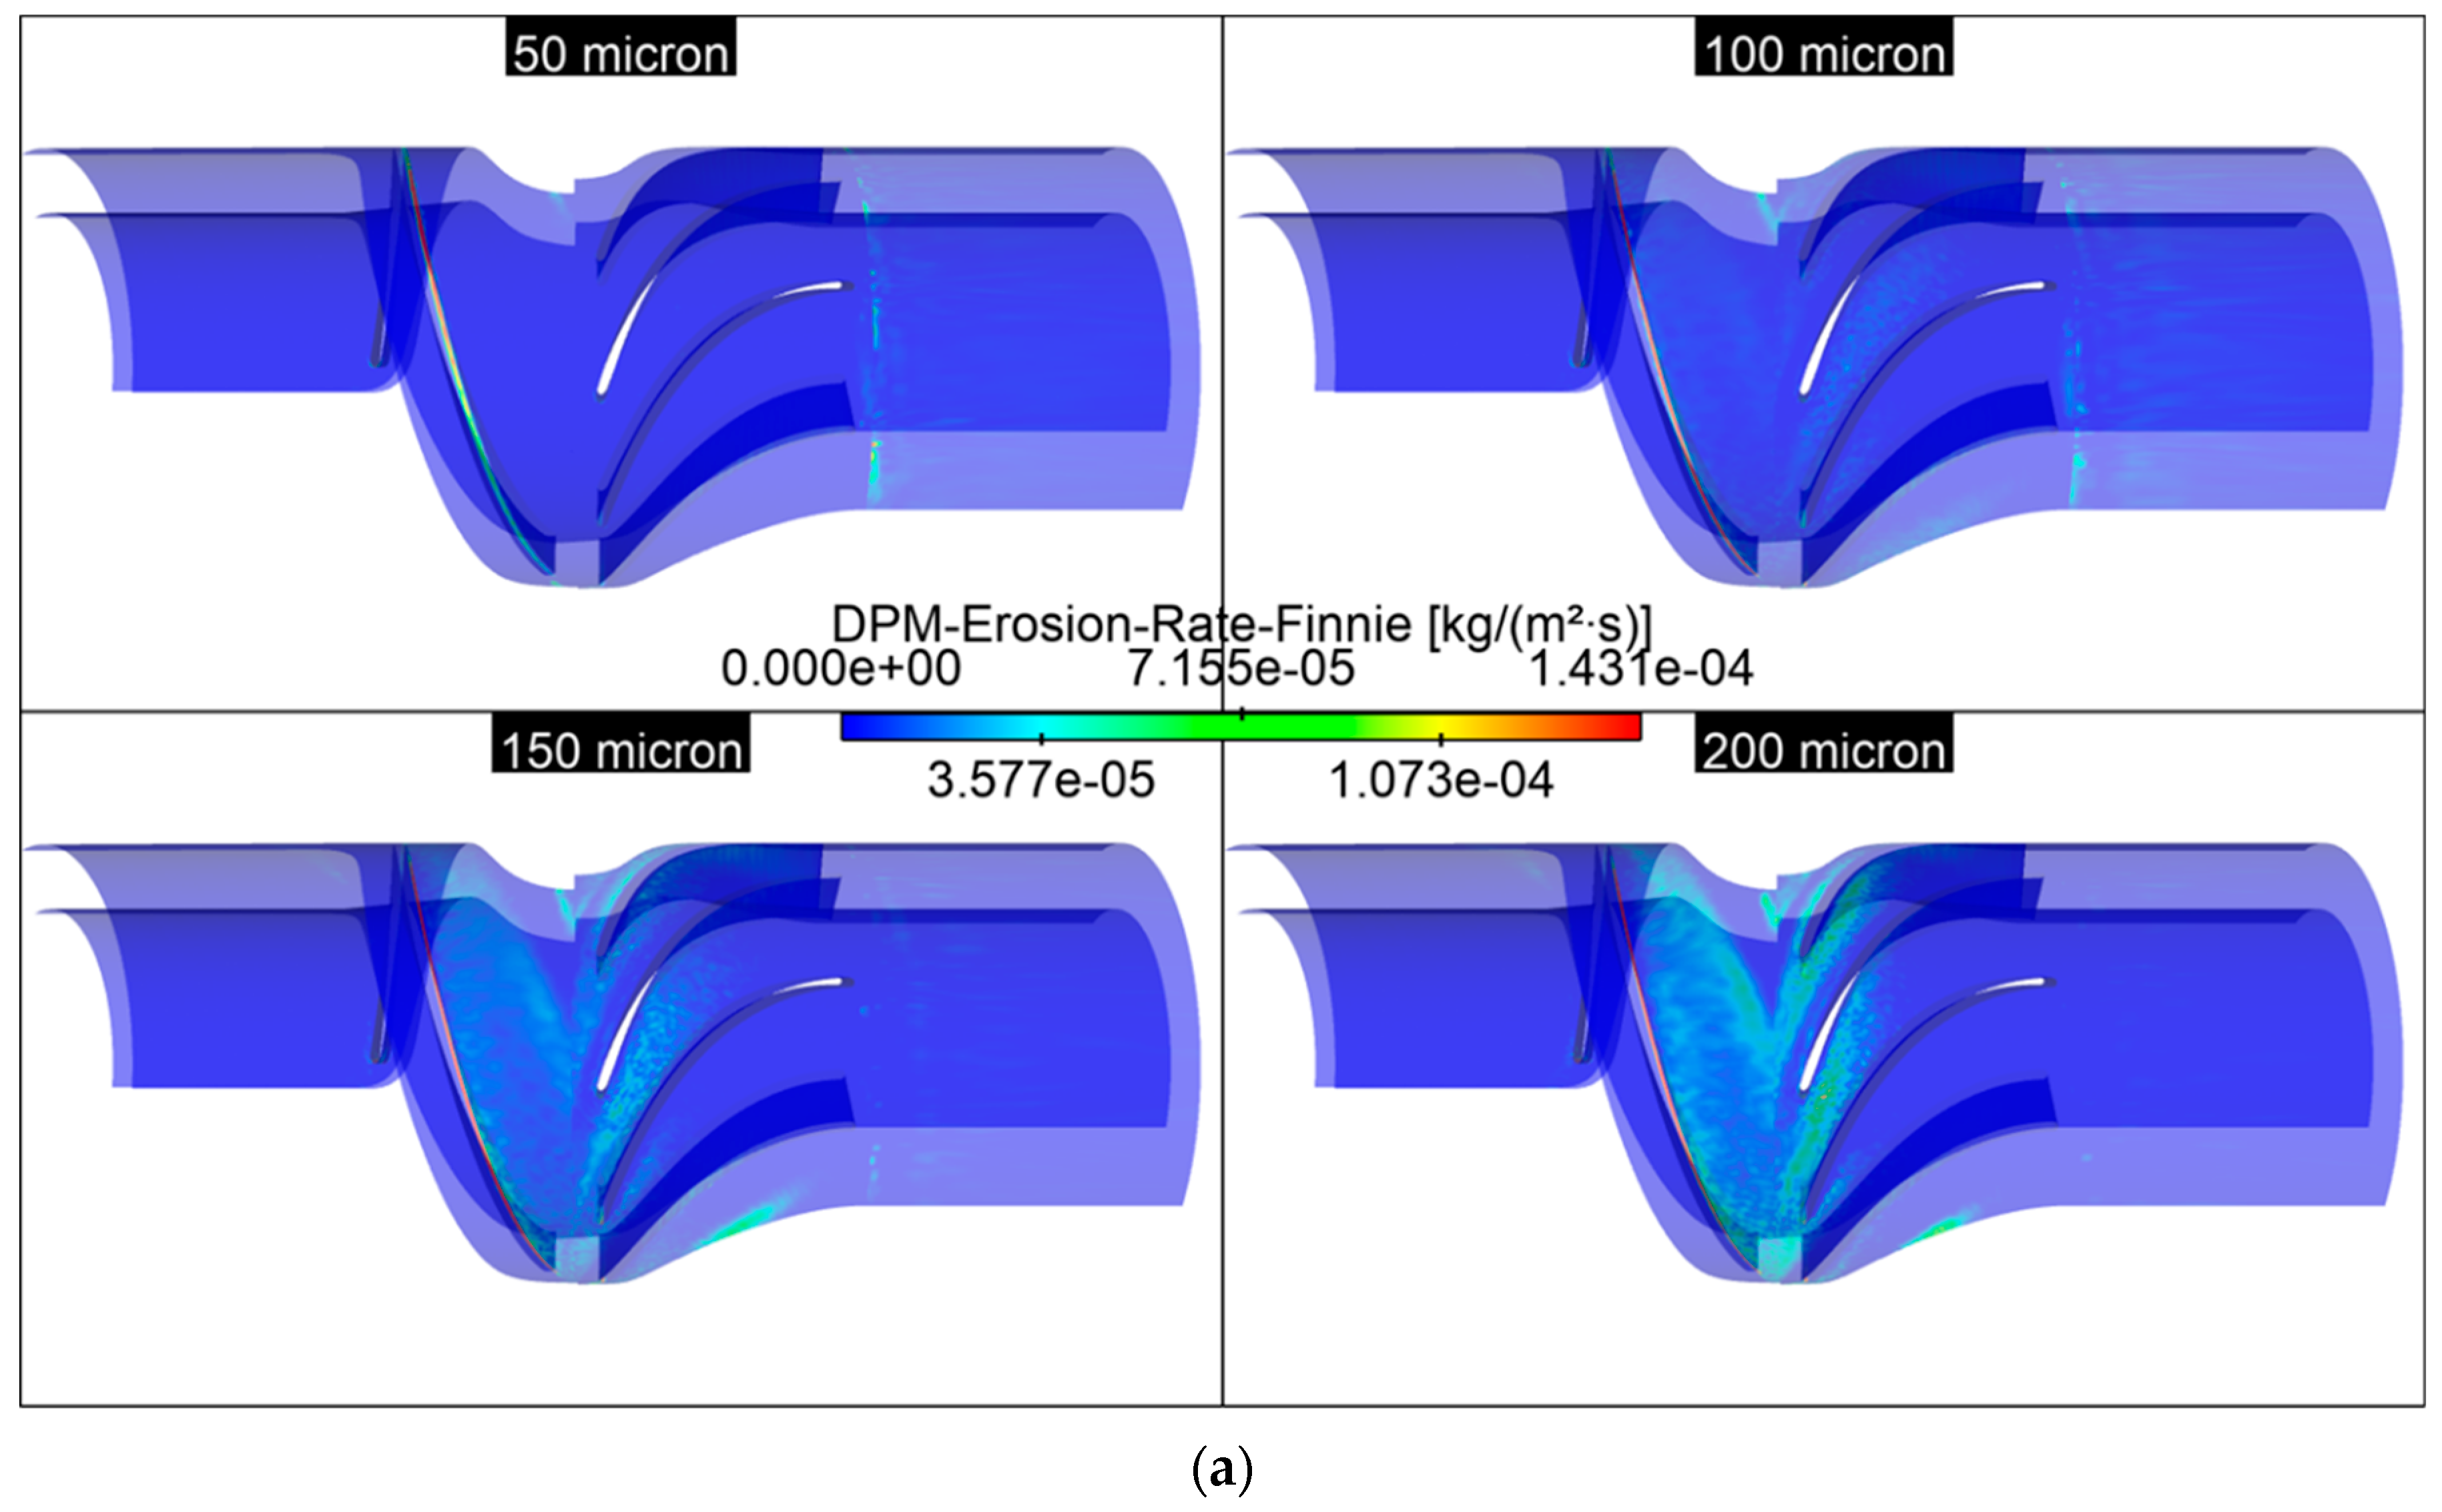
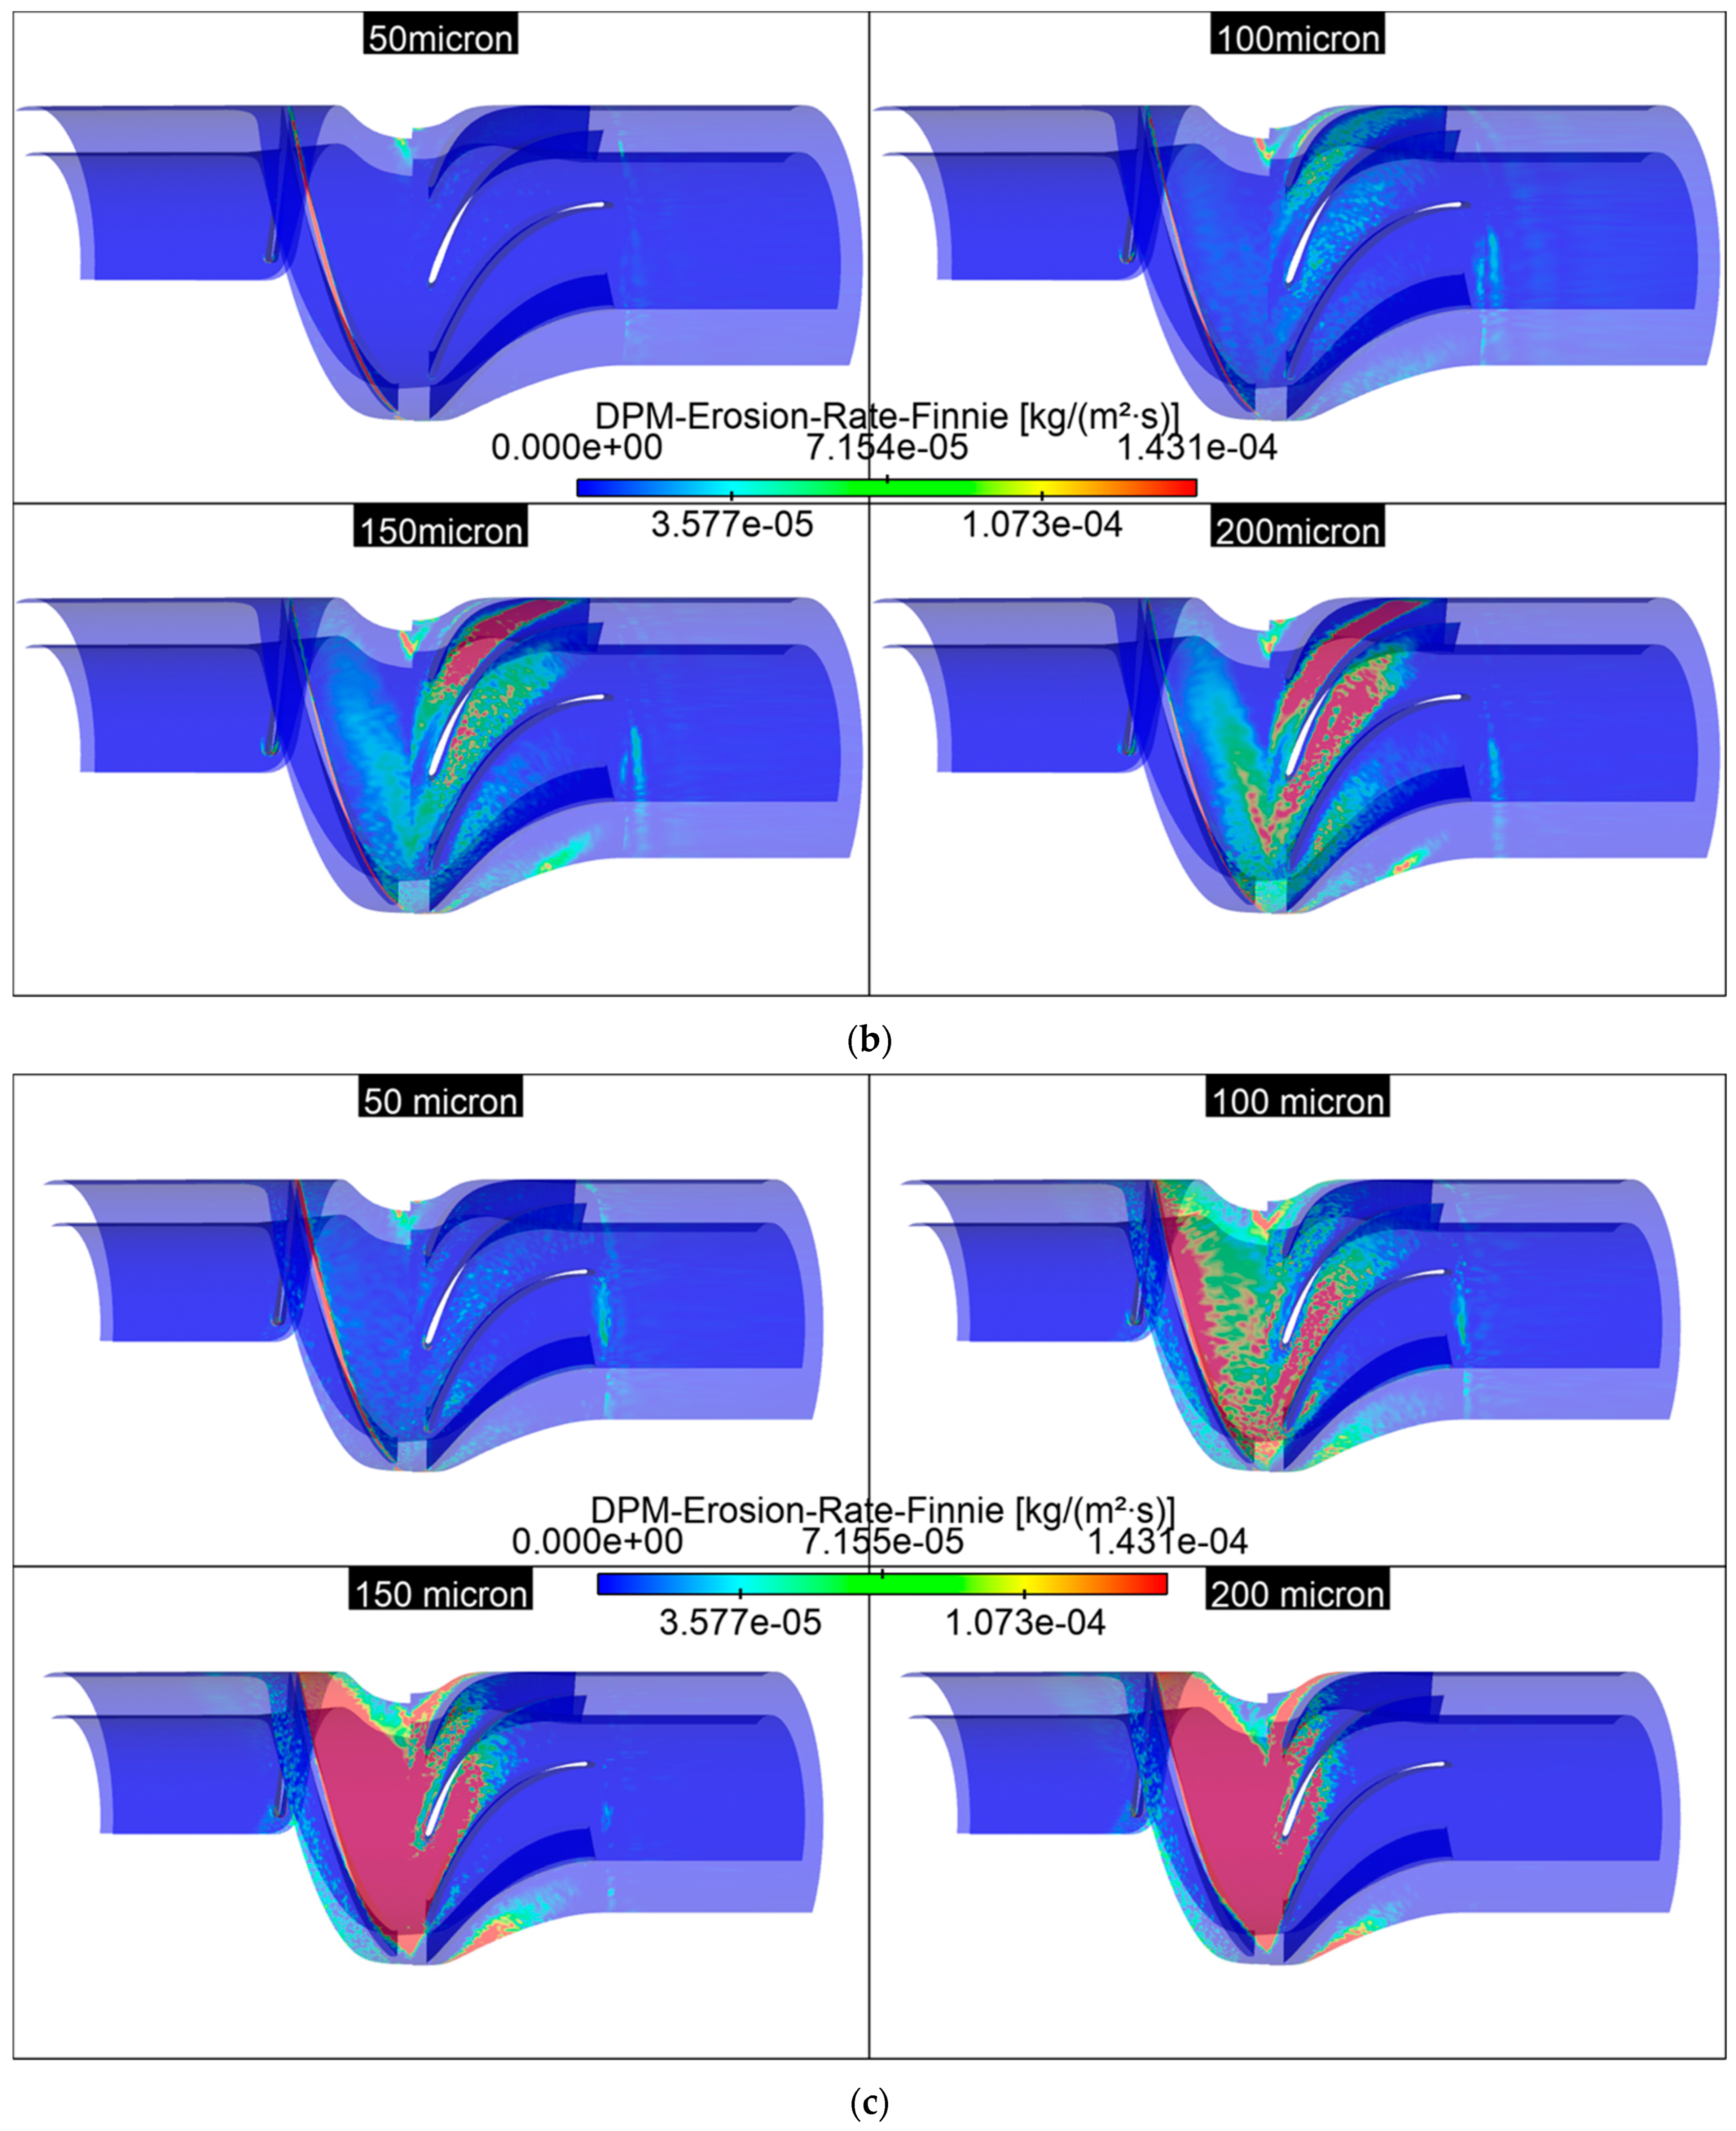
To better visualize the erosion rates at the design speed of 3600 RPM for different particle diameters (50, 100, 150, and 200), we present the contours of the erosion rates in Figure 14a. For the off-design speed of 3000 RPM, the erosion rate contours are depicted in Figure 14b. The contours not only showed higher erosion rates but also more spreading of the erosion over the pump walls. The situation was even more severe for the off-design speed of 4200 RPM as the pump was operating off-design and at a higher velocity making the erosion rates much larger and spread even further over the impeller blades and the diffuser vanes as shown in Figure 14c

4.3. Effect of Erodent Mass Flow Rate

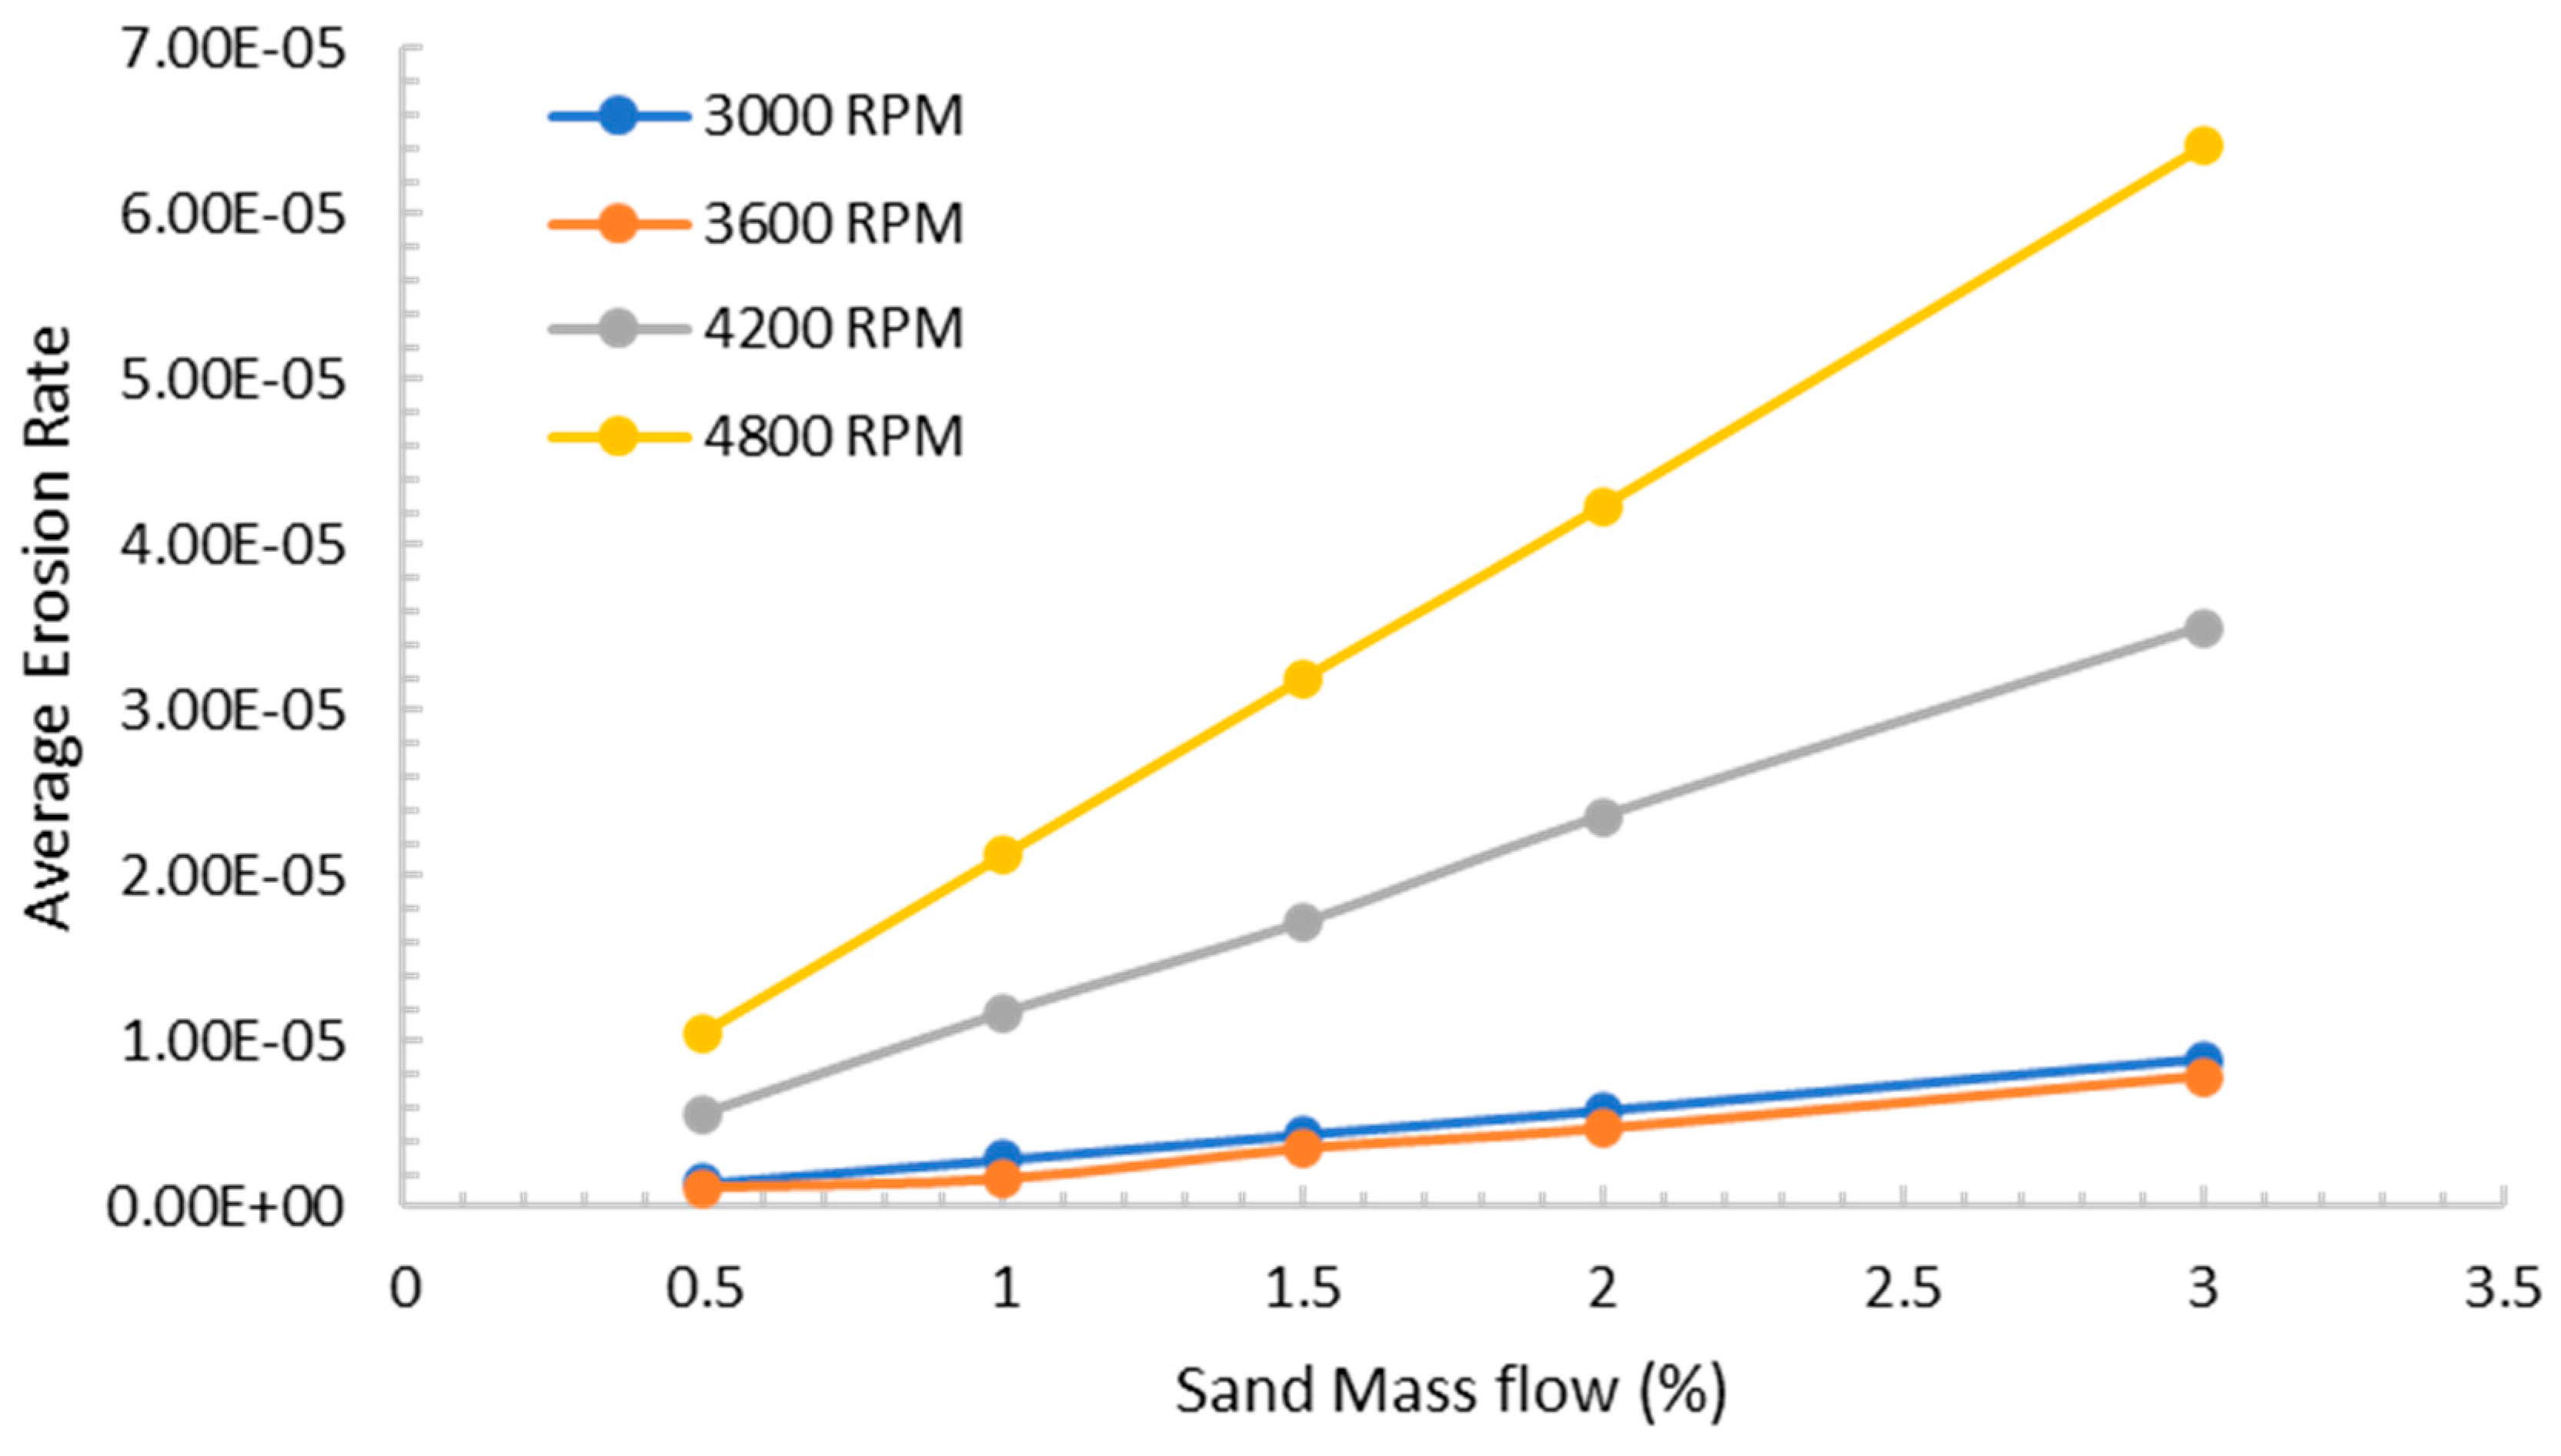
The effect of erodent mass flow rate was investigated for different rotational speeds of the pump ranging between 3000 and 4800 RPM and resulting erosion rates are shown in Figure 15. The water flow rate was kept at 100 m3/h and the erodent particle had a diameter of 100 microns.
There are two observations to make here. The first one is that the erosion rates were linearly proportional to the erodent mass flow rate. This is in complete accordance with the experimentally derived erosion model used in this numerical study. Note here that we limited the erodent mass flow rate to 3%. This is equivalent to restricting ourselves to less than 2% volume flow rate of the sand. This limitation is important for the validity of the discrete particle model [37], which is used in this study. This assumption satisfies two facts: (1) we have one-way coupling such that the sand particles do not affect the water main flow field and (2) there is very little interaction between the sand particles justifying the independent particle tracking of each particle.
The second observation deals with the fact that the erosion rates were the smallest for the design speed of 3600. Then, they increased as we operate at off-design speeds. Note also that the increase in erosion around the design speed was not symmetric. In other words, the increase in erosion rate by changing the speed from the design speed of from 3600 RPM by 600 RPM (3000 RPM for −600 RPM and 4200 RPM for +600) was not the same. As a matter of fact, moving down to 3000 rpm resulted in an increase of erosion in an amount that is less than one-tenth of the amount produced by moving up to 4200 RPM. This is due to the shear increase of velocity magnitude in the flow field and hence the particle impact velocity on the pump walls as we increased the rotational speed and that is the most important factor in the erosion rates.

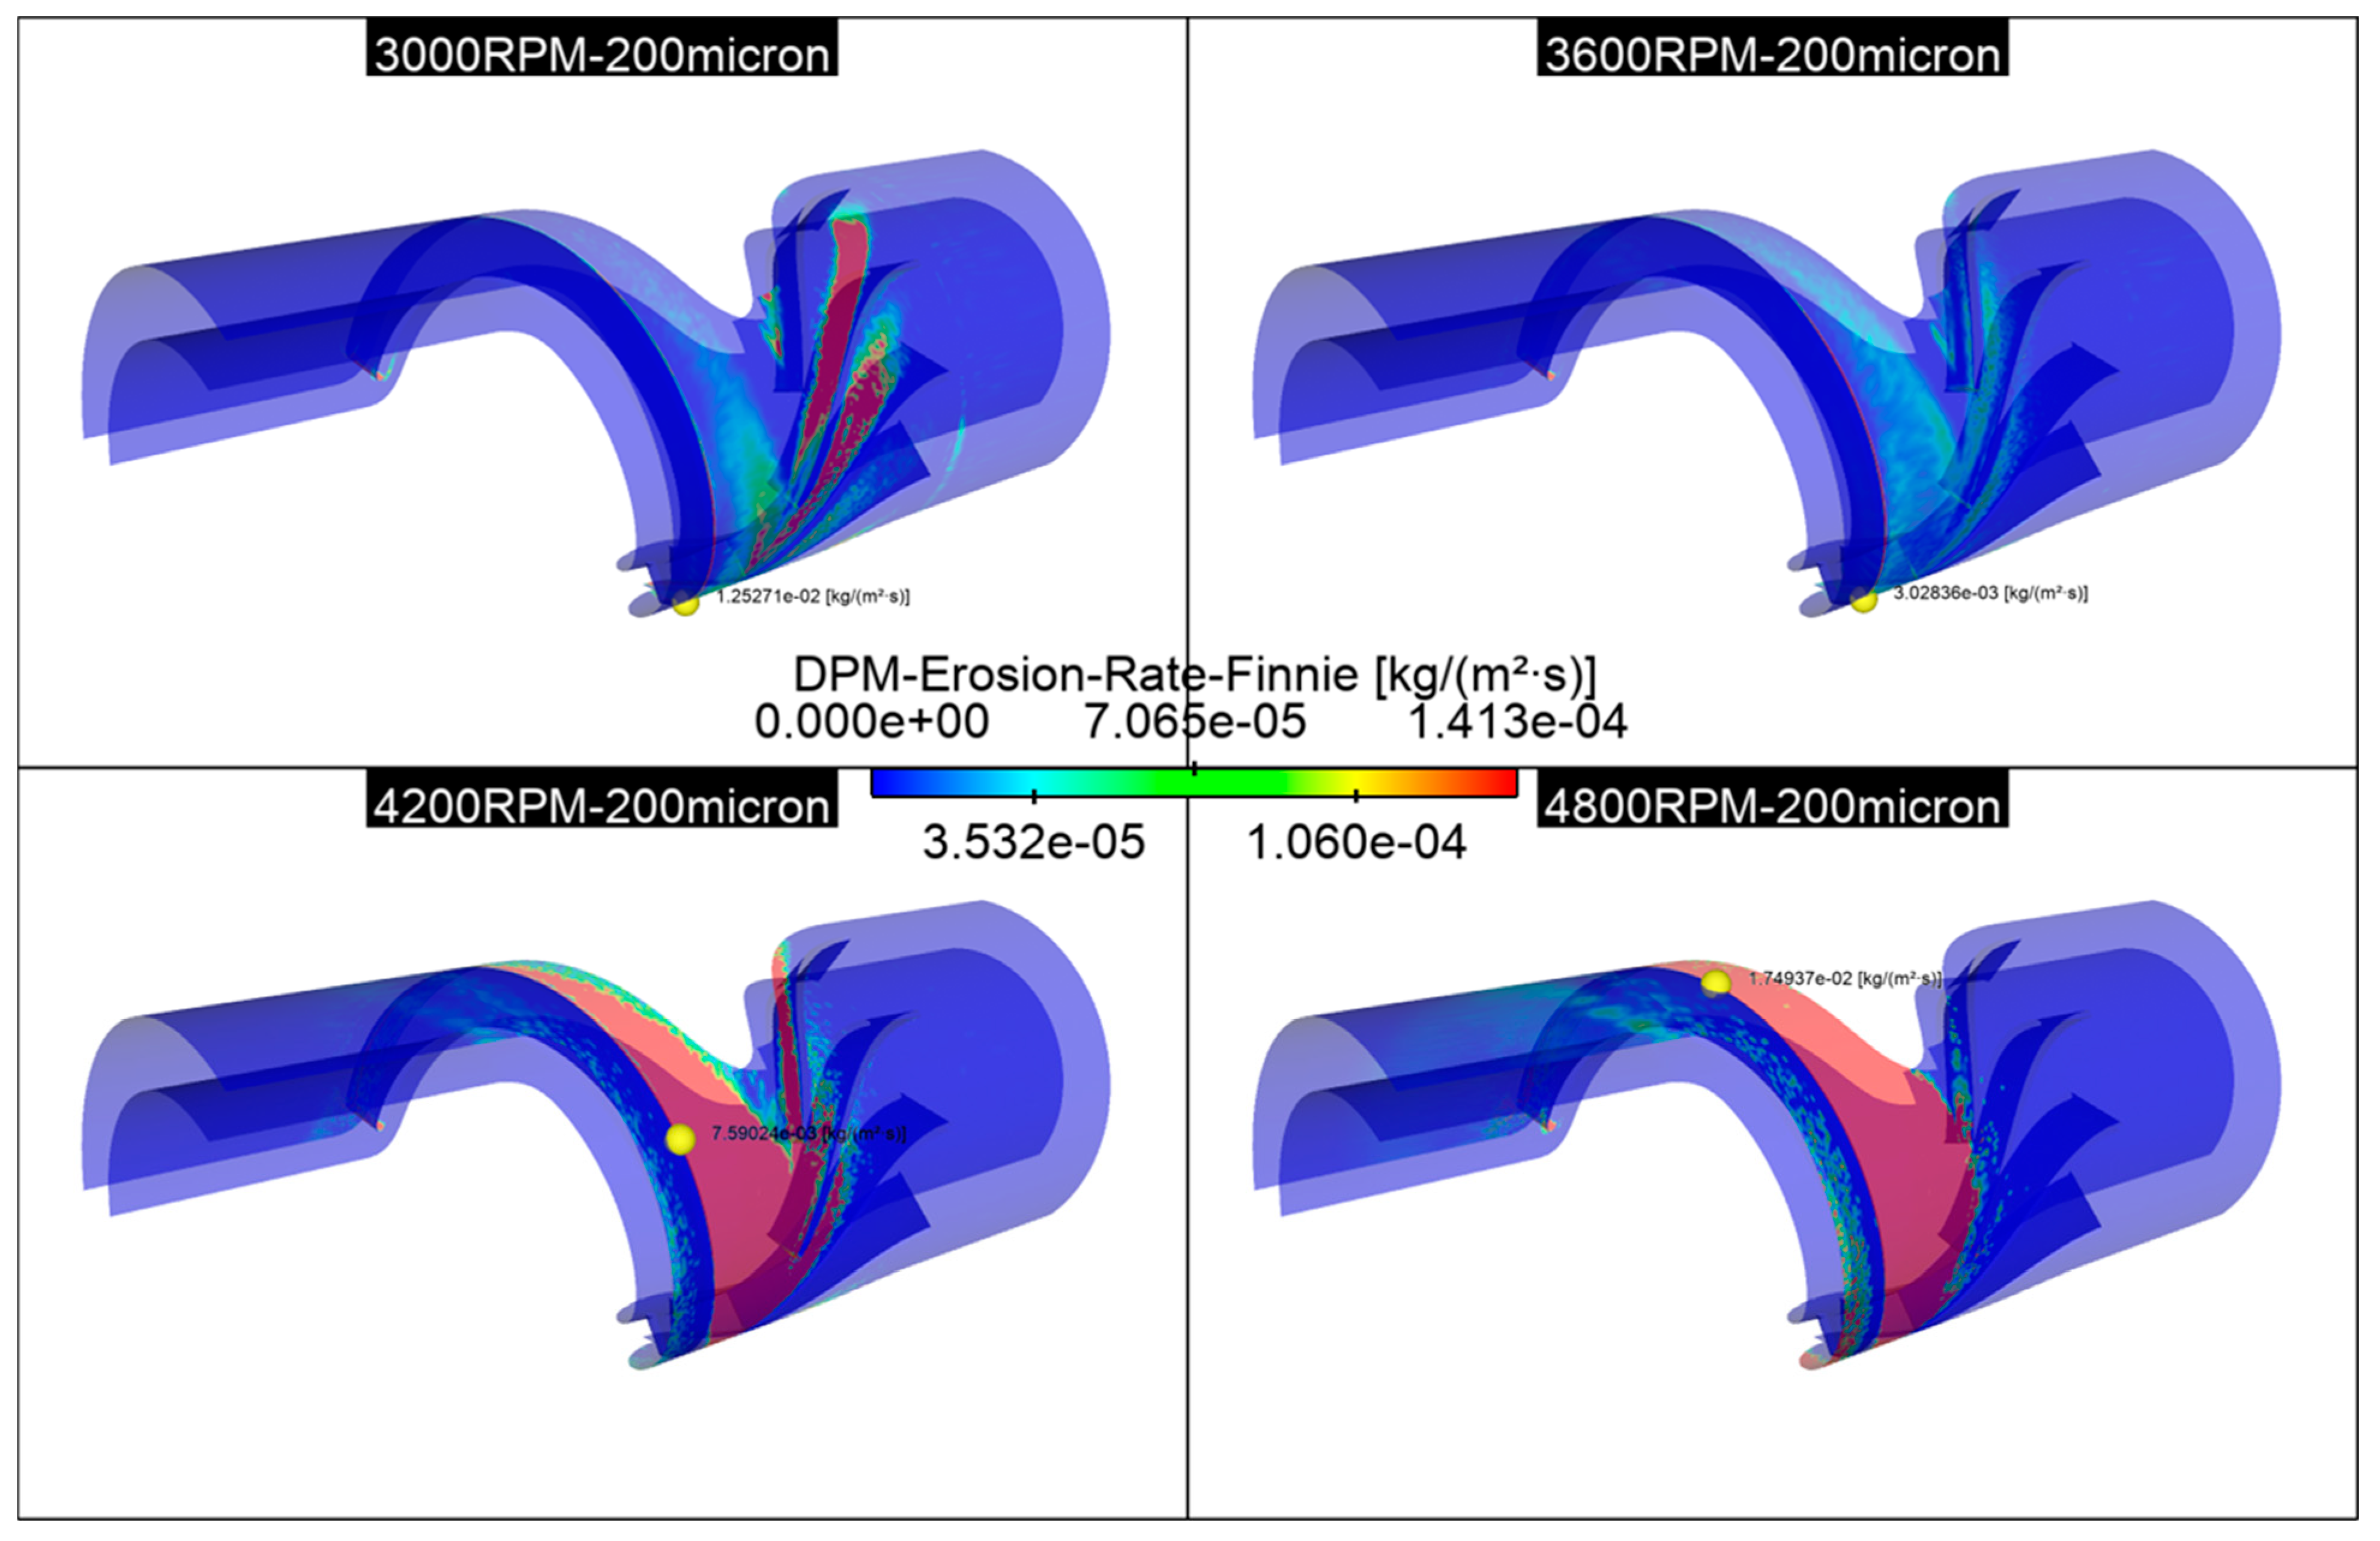
4.4. Effect of Pump Rotational Speed

The effect of the rotational speed of the pump has been already discussed in the previous two sections. Nevertheless, it is important to reiterate these findings because of their practical importance, especially in the production of oil and pumping of well water, where sand is always present in varying amounts. The authors believe that these findings are new and have been discovered in these numerical simulations for the first time. Referring to Figure 13 and Figure 15, it can be seen from the results of the erosion rates as a function of rotational speed that erosion rates increase when the pump is operated at off-design conditions of 3600 RPM and 100 m3/h. This is interesting and it has a clear physical explanation. When operating at the design point, the total velocity vector leaving the impeller blades enters the diffuser tangentially to the diffuser blades. The pump achieves not only the highest efficiency at the design conditions, but more interestingly, the minimum erosion rate as well. Hence, the erosion rates are expected to increase at off-design conditions. Indeed, the erosion rates at 3000 RPM were higher that the erosion rates at 3600 RPM for all sand particle diameters as seen in Figure 13. Similarly, when we go to speeds higher than 3600 RPM, we expect the erosion rates to increase as we move away from the design point. What is happening at off-design point speeds is that part of the flow velocity is now impinging on the diffuser blade and hence causing more erosion. These results have been visualized in a clearer method by showing the erosion contours on the pump walls in Figure 16 below. The results are depicted for the 200-micron particles at different RPMs.

5. Conclusions

A detailed investigation has been carried out to investigate the erosion rates on a metallic helico-axial pump. The study was conducted using a commercial CFD code to simulate water–sand flow at different rotational speeds ranging between 3000 and 4800 RPM with a water flow of 100 m3/h and mass sand loading up to 3% for particle sizes ranging between 50 and 300 microns.
The main concluding remarks can be summarized as follows:
a.
The effect of particle size on erosion rates has shown the expected experimental trends that have been shown in different studies. The rates of erosion increased linearly with particle diameter with a high slope. The slope of the erosion rates decreased at higher particle diameters.
b.
The erosion rates increased linearly with the sand loading mass flow rate as predicted by the erosion model.
c.
The most important practical finding of the study is that the erosion rates reached a minimum at the design rotating speed of the pump.
d.
Operating the pump at off-design conditions, even at a lower speed of 3000 RPM, resulted in higher erosion rates.
e.
The erosion rates became more severe and spread out over the pump impeller blades and diffuser vanes at higher off-design speeds of 4200 and 4800 RPM.
Therefore, running a pump at off-design speeds not only reduces its hydraulic efficiency but also increases the erosion rates that reduce its design life.

Author Contributions

Conceptualization, R.B.-M.; methodology, R.B.-M.; software, R.B.-M., H.R. and Z.T.; validation, R.B.-M.; formal analysis, R.B.-M., H.R. and Z.T.; investigation, R.B.-M., H.R. and Z.T.; resources, R.B.-M.; writing—original draft preparation, R.B.-M., H.R. and Z.T.; writing—review and editing, R.B.-M., H.R. and Z.T.; visualization, R.B.-M., H.R. and Z.T.; supervision, R.B.-M.; project administration, R.B.-M.; funding acquisition, R.B.-M. All authors have read and agreed to the published version of the manuscript.

Funding

This research received no external funding.

Data Availability Statement

Not applicable.

Acknowledgments

The first and second authors would acknowledge the support of the ME department at KFUPM during this study. The second author would like to acknowledge the Computational Aeronautics Lab (CAL) at the School of Interdisciplinary Engineering & Science (SINES), NUST, for providing the computational facility to carry out part of this work.

Conflicts of Interest

The authors declare no conflict of interest.

References

  1. Hua, G.; Falcone, G.; Teodoriu, C.; Morrison, G. Comparison of Multiphase Pumping Technologies for Subsea and Downhole Applications. Oil Gas Facil. 2012, 1, 36–46. [Google Scholar] [CrossRef]
  2. Ekeberg, I.; Bibet, P.J.; Knudsen, H.; Reimers, Ø.; Torbergsen, E. Sand management and erosion prediction in subsea multiphase pumps. J. Glob. Power Propuls. Soc. 2022, 6, 24–38. [Google Scholar] [CrossRef]
  3. Dal Porto, D.F.; Larson, L.A. Multiphase-Pump Field Trials Demonstrate Practical Applications for the Technology. SPE Prod. Facil. 1997, 12, 159–164. [Google Scholar] [CrossRef]
  4. Shippen, M.; Scott, S. Multiphase pumping as an alternative to conventional separation, pumping and compression. In Proceedings of the PSIG Annual Meeting 2002, Portland, Oregon, 23–25 October 2002. [Google Scholar]
  5. Chen, Y.; Patil, A.; Chen, Y.; Morrison, G.; Rojas, M. An Experimental Investigation on the Erosion of a Helico-Axial Pump With Gas Presence. Am. Soc. Mech. Eng. Fluids Eng. Div. FEDSM 2020, 1. [Google Scholar] [CrossRef]
  6. Sourieau, P.; Arnaudeau, M. Devices for Pumping a Fluid Comprising at Least a Liquid. U.S. Patent GB1561454A, 20 February 1980. [Google Scholar]
  7. Dolan, P.J.; Goodridge, R.A.; Leggate, J.S. Development of a Twin-Screw Pump for Multiphase Duties. SPE Prod. Eng. 1988, 3, 629–632. [Google Scholar] [CrossRef]
  8. Furuholt, E.M.; Torp, T.A. With Poseidon Technology Towards Year 2000. In Proceedings of the Annual Offshore Technology Conference, Houston, TX, USA, 2–5 May 1988; pp. 255–262. [Google Scholar] [CrossRef]
  9. Gié, P.; Buvat, P.; Bratu, C.; Durando, P. Poseidon Multiphase Pump: Field Tests Results. In Proceedings of the Annual Offshore Technology Conference, Houston, TX, USA, 4–7 May 1992; pp. 489–502. [Google Scholar] [CrossRef]
  10. Falcimaigne, J.R.; Franãis, I. Multiphase Flow: A Cost-Efficient Solution for Marginal Field Developments. In Proceedings of the European Petroleum Conference, Cannes, France, 16–18 November 1992; pp. 463–469. [Google Scholar] [CrossRef]
  11. Vangen, G.; Carstensen, C.; Bakken, L.E. Gullfaks Multiphase Booster Project. In Proceedings of the Offshore Technology Conference, Houston, TX, USA, 1–4 May 1995; pp. 579–585. [Google Scholar] [CrossRef]
  12. Leporcher, E.; Delaytermoz, A.; Renault, J.F.; Gerbier, A.; Burger, O. Deployment of Multiphase Pumps on a North Sea Field. In Proceedings of the SPE Annual Technical Conference and Exhibition, New Orleans, LA, USA, 30 September–3 October 2001; pp. 1755–1766. [Google Scholar] [CrossRef]
  13. Grimstad, H.J. Subsea Multiphase Boosting—Maturing technology Applied for Santos Ltd’s Mutineer and Exeter field. In Proceedings of the SPE Asia Pacific Oil and Gas Conference and Exhibition, Perth, Australia, 18–20 October 2004. [Google Scholar] [CrossRef]
  14. Saadawi, H. Operating multiphase helicoaxial pumps in series to develop a satellite oil field in a remote desert location. In Proceedings of the SPE Annual Technical Conference and Exhibition, Anaheim, CA, USA, 11–14 November 2007; pp. 1–16. [Google Scholar]
  15. Falcimaigne, J.; Brac, J.; Charron, Y.; Pagnier, P.; Vilagines, R. Pompage polyphasique: Réalisations et perpectives. Oil Gas Sci. Technol. 2002, 57, 99–107. [Google Scholar] [CrossRef] [Green Version]
  16. Serena, A.; Bakken, L.E. Design of a Multiphase Pump Test Laboratory Allowing to Perform Flow Visualization and Instability Analysis. In ASME Power Conference; American Society of Mechanical Engineers: New York, NY, USA, 2015. [Google Scholar] [CrossRef]
  17. Serena, A.; Bakken, L.E. Experimental Characterization of the Flow Instabilities of a Mixed-Flow Multiphase Pump Operating Air and Water through Local Visualization and Analysis of Dynamic Measurements. In ASME International Mechanical Engineering Congress and Exposition; American Society of Mechanical Engineers: New York, NY, USA, 2015. [Google Scholar] [CrossRef]
  18. Zhang, J.; Cai, S.; Zhu, H.; Zhang, Y. Experimental investigation of the flow at the entrance of a rotodynamic multiphase pump by visualization. J. Pet. Sci. Eng. 2015, 126, 254–261. [Google Scholar] [CrossRef]
  19. Zhang, J.; Cai, S.; Li, Y.; Zhu, H.; Zhang, Y. Visualization study of gas-liquid two-phase flow patterns inside a three-stage rotodynamic multiphase pump. Exp. Therm. Fluid Sci. 2016, 70, 125–138. [Google Scholar] [CrossRef]
  20. Cao, S.; Peng, G.; Yu, Z. Hydrodynamic design of rotodynamic pump impeller for multiphase pumping by combined approach of inverse design and CFD analysis. J. Fluids Eng. Trans. ASME 2005, 127, 330–338. [Google Scholar] [CrossRef]
  21. Liu, M.; Tan, L.; Cao, S. Design method of controllable blade angle and orthogonal optimization of pressure rise for a multiphase pump. Energies 2018, 11, 1048. [Google Scholar] [CrossRef] [Green Version]
  22. Liu, M.; Tan, L.; Cao, S. Dynamic mode decomposition of gas-liquid flow in a rotodynamic multiphase pump. Renew. Energy 2019, 139, 1159–1175. [Google Scholar] [CrossRef]
  23. Zhang, Y.; Zhang, J.; Zhu, H.; Cai, S. 3D blade hydraulic design method of the rotodynamic multiphase pump impeller and performance research. Adv. Mech. Eng. 2014, 2014, 1–10. [Google Scholar] [CrossRef]
  24. Suh, J.W.; Kim, J.W.; Choi, Y.S.; Kim, J.H.; Joo, W.G.; Lee, K.Y. Development of numerical Eulerian-Eulerian models for simulating multiphase pumps. J. Pet. Sci. Eng. 2018, 162, 588–601. [Google Scholar] [CrossRef]
  25. Suh, J.W.; Kim, J.H.; Choi, Y.S.; Joo, W.G.; Lee, K.Y. A study on numerical optimization and performance verification of multiphase pump for offshore plant. Proc. Inst. Mech. Eng. Part A J. Power Energy 2017, 231, 382–397. [Google Scholar] [CrossRef]
  26. Yu, Z.; Zhu, B.; Cao, S.; Liu, Y. Effect of virtual mass force on the mixed transport process in a multiphase rotodynamic pump. Adv. Mech. Eng. 2014, 2014, 958352. [Google Scholar] [CrossRef] [Green Version]
  27. Wu, Y.T.; Porté-Agel, F. Modeling turbine wakes and power losses within a wind farm using LES: An application to the Horns Rev offshore wind farm. Renew. Energy 2015, 75, 945–955. [Google Scholar] [CrossRef]
  28. Li, Y.; Yu, Z.; Zhang, W.; Yang, J.; Ye, Q. Analysis of bubble distribution in a multiphase rotodynamic pump. Eng. Appl. Comput. Fluid Mech. 2019, 13, 551–559. [Google Scholar] [CrossRef]
  29. Han, W.; Li, X.; Su, Y.; Su, M.; Li, R.; Zhao, Y. Effect of thickness ratio coefficient on the mixture transportation characteristics of helical-axial multiphase pumps. Appl. Sci. 2020, 10, 345. [Google Scholar] [CrossRef] [Green Version]
  30. Mubarak, H.A.; Khan, F.A.; Oskay, M.M. ESP Failures/Analysis/Solutions in Divided Zone—Case Study. Proc. Middle East Oil Show 2003, 13, 569–574. [Google Scholar] [CrossRef]
  31. Hadjiyannis, S.; Charalambous, N.; Tourlidakis, A.; Michaelides, K. An Experimental and Computational Study of the Erosion in Submersible Pumps and the Development of a Methodology for Selecting Appropriate Protective Coatings. Proc. ASME Turbo Expo 2010, 6, 61–72. [Google Scholar] [CrossRef]
  32. Krüger, S.; Martin, N.; Dupont, P. Assessment of Wear Erosion in PUMP Impellers. In Proceedings of the 26th International Pump Users Symposium, Texas A&M University, Houston, TX, USA; 2010. [Google Scholar] [CrossRef]
  33. Pagalthivarthi, K.V.; Gupta, P.K.; Tyagi, V.; Ravi, M.R. CFD Prediction of Erosion Wear in Centrifugal Slurry Pumps for Dilute Slurry Flows. J. Comput. Multiph. Flows 2011, 3, 225–246. [Google Scholar] [CrossRef] [Green Version]
  34. Pirouzpanah, S.; Morrison, G.L. Predictive Erosion Modeling in an ESP Pump. In Fluids Engineering Division Summer Meeting; American Society of Mechanical Engineers: New York, NY, USA, 2014. [Google Scholar] [CrossRef]
  35. Chen, Y.I. Three Phase Erosion Testing and CFD Analysis of a Helico Axial Pump. Ph.D. Thesis, Texas A & M University, Houston, TX, USA, 2017. [Google Scholar]
  36. Menter, F.R. Zonal Two Equation kw Turbulence Models for Aerodynamic Flows. In Proceedings of the 23rd Fluid Dynamics, Plasmadynamics, and Lasers Conference, Orlando, FL, USA, 6–9 July 1993. [Google Scholar] [CrossRef]
  37. ANSYS Inc. ANSYS Fluent Theory Guide v17.1; ANSYS 17.1 Doc.; Ansys Inc.: Canonsburg, PA, USA, 2016; Volume 15317. [Google Scholar]
  38. Mansouri, A.; Arabnejad, H.; Shirazi, S.; McLaury, B. A combined CFD/experimental methodology for erosion prediction. Wear 2015, 332–333, 1090–1097. [Google Scholar] [CrossRef]
  39. Ben-Mansour, R.; Badr, H.; Araoye, A.A.; Toor, I.U.H. Computational Analysis of Water-Submerged Jet Erosion. Energies 2021, 14, 3074. [Google Scholar] [CrossRef]
Figure 1. Schematic representation of the computational domain.
Lubricants 11 00153 g001
Figure 2. Perspective view of the computational domain.
Lubricants 11 00153 g002
Figure 3. Mesh independence plot.
Lubricants 11 00153 g003
Figure 4. Perspective view of the computational mesh.
Lubricants 11 00153 g004
Figure 5. Flow validation plot for helico-axial pump.
Lubricants 11 00153 g005
Figure 6. Computational domain of submerged jet impingement [39].
Lubricants 11 00153 g006
Figure 7. Computational mesh of the submerged jet impingement [39].
Lubricants 11 00153 g007
Figure 8. Comparison of thickness loss along the radial position in stainless steel at a 90-degree jet impingement on a flat plate [39].
Lubricants 11 00153 g008
Figure 9. Pressure difference at different impeller RPMs.
Lubricants 11 00153 g009
Figure 10. Pressure comparison with the change in impeller RPM.
Lubricants 11 00153 g010
Figure 11. Flow pathlines at different impeller RPMs.
Lubricants 11 00153 g011
Figure 12. Pressure and iso-surface of Q-criterion comparison with the change in impeller RPM.
Lubricants 11 00153 g012
Figure 13. Effect of sand particle size on erosion rates for different rotational speeds of the simulated helico-axial pump.
Lubricants 11 00153 g013
Figure 14. (a) Erosion rate comparison with the change in particle diameter at 3600 RPM. (b) Erosion rate comparison with the change in particle diameter at 3000 RPM. (c) Erosion rate comparison with the change in particle diameter at 4200 RPM.
Lubricants 11 00153 g014aLubricants 11 00153 g014b
Figure 15. Effect of sand mass flow rate (erodent) on erosion rate.
Lubricants 11 00153 g015
Figure 16. Contours of erosion rate for different rotational speeds for 200-micron sand particles at 100 m3/h water flow rate.
Lubricants 11 00153 g016
Table 1. Boundary conditions.
Surface/sBoundary ConditionDiscrete Phase Equation
Pump InletMass Flow InletEscape
Pump OutletPressure OutletEscape
Impeller and Diffuser BladesNo slip wallReflect
Hub and Shroud of PumpNo slip wallEscape
Table 2. Pump flow conditions for validation.
Flow ConditionValueUnit
Mass Flow80, 90, 100, 110, 120m3/h
Rotational Speed of Impeller3600RPM
Table 3. Flow conditions for different impeller RPMs.
Flow ConditionValueUnits
Mass Flow100 or 27.7m3/h or kg/s
Rotational speed of Impeller3000, 3600, 4200, 4800RPM
Table 4. Summary of all the parametric study conditions.
Flow ConditionValueUnit
Mass Flow27.7 or 100Kg/s or m3/h
Sand Diameter50, 100, 150, 200, 300microns
Sand Flow Rate0.5, 1, 1.5, 2, 3% of the water flow rate
Rotational Speed of the Impeller3000, 3600, 4200, 4800RPM
Material for ErosionStainless Steel
Erosion ModelFinnie Model
Disclaimer/Publisher’s Note: The statements, opinions and data contained in all publications are solely those of the individual author(s) and contributor(s) and not of MDPI and/or the editor(s). MDPI and/or the editor(s) disclaim responsibility for any injury to people or property resulting from any ideas, methods, instructions or products referred to in the content.

