Article

Search for New Participants in the Pathogenesis of High-Grade Serous Ovarian Cancer with the Potential to Be Used as Diagnostic Molecules

by
Angelika V. Timofeeva
1,*,
Aleksandra V. Asaturova
1,
Maya V. Sannikova
1,
Grigory N. Khabas
1,
Vitaliy V. Chagovets
1,
Ivan S. Fedorov
1,
Vladimir E. Frankevich
1,2 and
Gennady T. Sukhikh
1
1
National Medical Research Center for Obstetrics, Gynecology and Perinatology Named after Academician V.I. Kulakov Ministry of Healthcare of The Russian Federation, Ac. Oparina 4, 117997 Moscow, Russia
2
Laboratory of Translational Medicine, Siberian State Medical University, 634050 Tomsk, Russia
*
Author to whom correspondence should be addressed.
Life 2022, 12(12), 2017; https://doi.org/10.3390/life12122017
Submission received: 12 October 2022 / Revised: 25 November 2022 / Accepted: 1 December 2022 / Published: 3 December 2022
(This article belongs to the Special Issue Cancer Biology, Genomics and Metabolomics)

Abstract

:
Recent studies have attempted to develop molecular signatures of epithelial ovarian cancer (EOC) based on the quantitation of protein-coding and non-coding RNAs to predict disease prognosis. Due to the heterogeneity of EOC, none of the developed prognostic signatures were directly applied in clinical practice. Our work focuses on high-grade serous ovarian carcinoma (HGSOC) due to the highest mortality rate relative to other types of EOC. Using deep sequencing of small non-coding RNAs in combination with quantitative real-time PCR, we confirm the dualistic classification of epithelial ovarian cancers based on the miRNA signature of HGSOC (type 2), which differs from benign cystadenoma and borderline cystadenoma—precursors of low-grade serous ovarian carcinoma (type 1)—and identified two subtypes of HGSOC, which significantly differ in the level of expression of the progesterone receptor in the tumor tissue, the secretion of miR-16-5p, miR-17-5p, miR-93-5p, miR-20a-5p, the level of serum CA125, tumor size, surgical outcome (optimal or suboptimal cytoreduction), and response to chemotherapy. It was found that the combined determination of the level of miR-16-5p, miR-17-5p, miR-20a-5p, and miR-93-5p circulating in blood plasma of patients with primary HGSOC tumors makes it possible to predict optimal cytoreduction with 80.1% sensitivity and 70% specificity (p = 0.022, TPR = 0.8, FPR = 0.3), as well as complete response to adjuvant chemotherapy with 77.8% sensitivity and 90.9% specificity (p = 0.001, TPR = 0.78, FPR = 0.09). After the additional verification of the obtained data in a larger HGSOC patient cohort, the combined quantification of these four miRNAs is proposed to be used as a criterion for selecting patients either for primary cytoreduction or neoadjuvant chemotherapy followed by interval cytoreduction.

1. Introduction

In recent years, ovarian cancer ranks seventh in the order of overall cancer incidence, fifth among the causes of death from all malignant tumors in women [1], and is the leading cause of gynecological cancers according to the International Agency for Research on Cancer (IARC). Epithelial ovarian cancer (EOC) accounts for 60% of all cases of diagnosed ovarian cancer, is a heterogeneous group of carcinomas and consists of several histological subgroups, among which the most common are high-grade serous carcinoma, low-grade serous carcinoma, endometrioid carcinoma, clear cell carcinoma and mucinous carcinoma, each characterized by individual molecular genetic characteristics [2,3]. Among them, the serous type accounts for 75–80% of epithelial malignant neoplasms, and most serous carcinomas are diagnosed at already advanced stages of the disease. The highest mortality (about 70%) is observed among patients with high-grade serous ovarian carcinoma (HGSOC).
There are no clinical diagnostic and molecular biological methods for the early detection of EOC. EOC is characterized by high tumor heterogeneity and genomic instability, changes in the methylation status of the promoters of protein-coding genes and non-coding regions of the genome, and changes in the expression level of both proteins and their regulators at the post-transcriptional level [4,5,6,7,8,9,10,11,12], which provide multicomponent and multilevel pathogenesis of EOC and complicates the search for marker molecules to characterize this disease. HGSOC is characterized by mutations in the TP53 gene in 96% of cases with or without somatic mutations in the NF1, BRCA1, BRCA2, RB1, and CDK12 genes, 113 significant DNA copy number aberrations and changes in the methylation status of 168 genes, associated with the differential expression of 253 genes. Point mutations are much less common for low-grade serous ovarian carcinoma (LGSOC), in which the most frequent mutations are in BRAF and KRAS genes. A more complete and detailed molecular biological study of EOC is needed to identify new target molecules, which will serve as a basis for the development of methods for early diagnosis and effective therapeutic treatment of this disease.
Currently used diagnostic markers (including CA125 and HE4) do not have sufficient sensitivity and specificity to detect EOC [13]. It is known that increased levels of CA125 in the blood serum can also be detected in patients with endometriosis, adenomyosis, uterine fibroids, benign cysts, or inflammatory diseases in the pelvis. For example, in a retrospective analysis of serum samples from 5500 women in Sweden, an increase in CA125 levels was detected in 175 women, of whom only six were diagnosed with ovarian cancer, while three women with normal CA125 levels were diagnosed with ovarian cancer [14].
The main regulators of genome stability and gene expression at the epigenetic and post-transcriptional levels are small non-coding RNAs, including microRNAs (miRNAs). The same miRNA can be involved in the regulation of hundreds of target genes, while each of the structural genes is a target for different miRNAs [15]. Theoretically, the expression of 60% of human genes is under miRNA control [16]. Most miRNAs have oncogenic or oncosuppressive activity and can regulate various biological processes, including cell metabolism, proliferation, apoptosis, and chemoresistance [17,18]. Since miRNA expression is tissue-specific, detectable in blood, and correlates with clinical manifestations of cancer, miRNA can be used as potential diagnostic and prognostic tumor markers [19,20,21,22,23,24].
Many research teams have worked on the creation of a molecular portrait of HGSOC, comparing miRNA expression profiles in ovarian carcinoma with normal ovarian tissue or cell lines derived from the surface epithelium of the ovaries [25,26,27,28]. However, according to modern concepts of the pathogenesis of serous ovarian cancer, based on morphological and molecular genetic studies, the most likely source of development of serous ovarian carcinomas is the epithelium of the fallopian tube fimbriae [29,30,31,32]. There are two main pathways for the pathogenesis of serous carcinomas. One of them is the dissemination of fallopian tube epithelial stem cells to the surface of the ovary (presumably at the site of ovulation) with the formation of cystic inclusions, which can increase in volume with the formation of benign serous cystadenoma (BSC) with subsequent transformation into a serous borderline tumor (SBT) and low-grade serous carcinoma (LGSOC). The formation of HGSOC presumably occurs according to a different mechanism and begins with the secretory cells’ outgrowth with the occurrence of a mutation in the TP53 (p53 signature) and the formation of a serous tubal intraepithelial lesion (STIL). With the acquisition of additional somatic mutations, serous tubal intraepithelial carcinoma (STIC) is formed, the cells of which disseminate to the surface of the ovary and form a tumor.
In order to test two hypotheses of the pathogenesis of serous ovarian tumors, miRNA expression profiles in the BSC, SBT and HGSOC samples were compared relative to the that in samples of histologically unchanged fallopian tube fimbriae by new-generation sequencing (NGS). The top miRNAs from the signature of HGSOC were evaluated for specificity and potential for use as diagnostic molecules while comparing their expression level in the peripheral blood plasma of patients with various ovarian tumors or endometriosis.

2. Materials and Methods

2.1. Patients

In total, 122 women aged between 25 and 77-years-old were enrolled in the study and comprised the following groups: apparently healthy, n = 26; endometriosis, n = 24; benign serous cystadenoma, n = 18; borderline serous cystadenoma, n = 21; low-grade serous ovary cancer, n = 10; high-grade serous ovary cancer, n = 23 (Section 3.1 and Section 3.3). Written informed consent was obtained from each patient and the study was approved by the ethics committee of the National Medical Research Center for Obstetrics, Gynecology, and Perinatology, named after Academician V.I. Kulakov of the Ministry of Healthcare of the Russian Federation.

2.2. RNA Isolation from Peripheral Blood Plasma

Venous blood samples from women were collected into S-MONOVETTE tubes containing EDTA KE (Sarstedt AG&Co., Ltd., Nümbrecht, Germany, cat. No. 04.1915.100), centrifuged for 20 min at 300× g (4 °C), followed by plasma collection and re-centrifugation for 10 min at 16,000× g. RNA was extracted from 200 µL of blood plasma using an miRNeasy Serum/Plasma Kit (Qiagen, Germany, cat. No. 217184).

2.3. RNA Isolation from Fimbriae and Ovary Tumor Tissues

Fimbriae and ovary tumor tissues were collected for study during surgery and immediately frozen in liquid nitrogen for subsequent storage at –80 °C. Total RNA was extracted from 5–40 mg of tissue using the miRNeasy Micro Kit (Qiagen, Hilden, Germany, catalog No. 217084), followed by the RNeasy MinElute Cleanup Kit (Qiagen, Germany, catalog No. 74204). The RNA concentration was measured using the Qubit fluorometer 3.0 (Life Technologies, Petaling Jaya, Malaysia, cat.Q33216). The sample quality of the total RNA was examined on the Agilent Bioanalyzer 2100 (Agilent, Waldbronn, Germany, cat. No G2939A) using the RNA 6000 Nano Kit (Agilent Technologies, Santa Clara, CA, USA, cat. No. 5067-1511). Total RNA samples with an RNA integrity number (RIN) of at least 8 were used for further study.

2.4. miRNA Deep Sequencing

cDNA libraries were synthesized using 500 ng of total RNA from the fimbriae and ovary tumor tissues using the NEBNext® Multiplex Small RNA Library Prep Set for Illumina® (Set11 and Set2, New England Biolab®, Frankfurt am Main, Germany, cat. No. E7300S, E7580S), amplified for 14 and 18 PCR cycles, respectively, and sequenced on the NextSeq 500 platform (Illumina, San Diego, AC, USA, cat. No. SY-415-1001). The adapters were removed with Cutadapt. All trimmed reads shorter than 16 bp and longer than 30 bp were filtered, and only reads with a mean quality higher than 15 were retained. The remaining reads were mapped to the GRCh38.p15 human genome and miRBase v21 with the bowtie aligner [33]. Aligned reads were counted with the featureCount tool from the Subread package [34] and with the fracOverlap 0.9 option, so the whole read was forced to have a 90% intersection with sncRNA features. Differential expression analysis of the sncRNA count data was performed with the DESeq2 package [35].

2.5. Reverse Transcription and Quantitative Real-Time PCR

Seven microliters from 14 µL of total RNA column eluate (miRNeasy Serum/Plasma Kit, Qiagen, Germany, cat. No. 217184) extracted from 200 µL of blood plasma, or 250 ng of total RNA from the fimbriae or ovary tumor tissue, were converted into cDNA in a reaction mixture (20 µL) containing 1× Hispec buffer, 1× Nucleics mix, and miScript RT, in accordance with the miScript® II RT Kit protocol (Qiagen, Germany, cat. No. 218161); then, the sample volume was adjusted with deionized water to 200 µL. The synthesized cDNA (2 µL) was used as a template for real-time PCR using a forward primer specific for the studied RNA (Table 1) and the miScript SYBR Green PCR Kit (Qiagen, Germany, cat. No. 218075). The following PCR conditions were used: (1) 15 min at 95 °C and (2) 40 cycles at 94 °C for 15 s, an optimized annealing temperature (52–62 °C) for 30 s and 70 °C at 30 s in a StepOnePlusTM thermocycler (Applied Biosystems, Waltham, MA, USA, cat. No. 4376600). The relative expression of miRNA in the blood plasma sample was determined by the ∆Ct method using miR-30d-5p as the reference RNA. The relative expression of miRNA in the tissue sample was determined by the ∆Ct method using SNORD68 as the reference RNA.

2.6. Immunohistochemistry

Tissue samples were fixed using 10% buffered formalin solution. Four to five-micrometer sections of formalin-fixed paraffin-embedded specimens were cut and immunohistochemical staining was performed with an automated immunostainer Ventana Benchmark Ultra and the prescribed Ventana protocol for progesterone receptor (PgR) staining. Monoclonal antibodies against PgR (clone 1E2) manufactured by Ventana were used, recognized A and B isoforms of PgR. Immunohistochemical results were evaluated in a semi-quantitative manner and scored according to intensity and the percentage of positively stained nuclei with an Allred scale. The Allred scale is a clinical instrument based on the percentage of cells that are stained by immunohistochemistry for steroid receptors (on a scale of 0 to 5) and the intensity of that staining (on a scale of 0 to 3, for a possible total score of 8 [36]. Appropriate controls were included.

2.7. Statistical Analysis of the Obtained Data

For statistical processing, scripts written in R language [34] and RStudio [37] were used. The correspondence of the analyzed parameters to the normal distribution law was assessed by the Shapiro–Wilk test. When the distribution of data was different from normal, the Mann–Whitney test for paired comparison was used, and data were described as the median (Me) and Q1 and Q3 quartiles in the format Me (Q1; Q3). Since both quantitative and qualitative characteristics were analyzed, a correlation analysis was performed using Spearman’s nonparametric correlation test. The 95% confidence interval for the correlation coefficient was determined using the Fisher transformation. The value of the threshold significance level (p) was taken as equal to 0.05. If the p value was less than 0.001, then p was indicated in the format p < 0.001.

3. Results

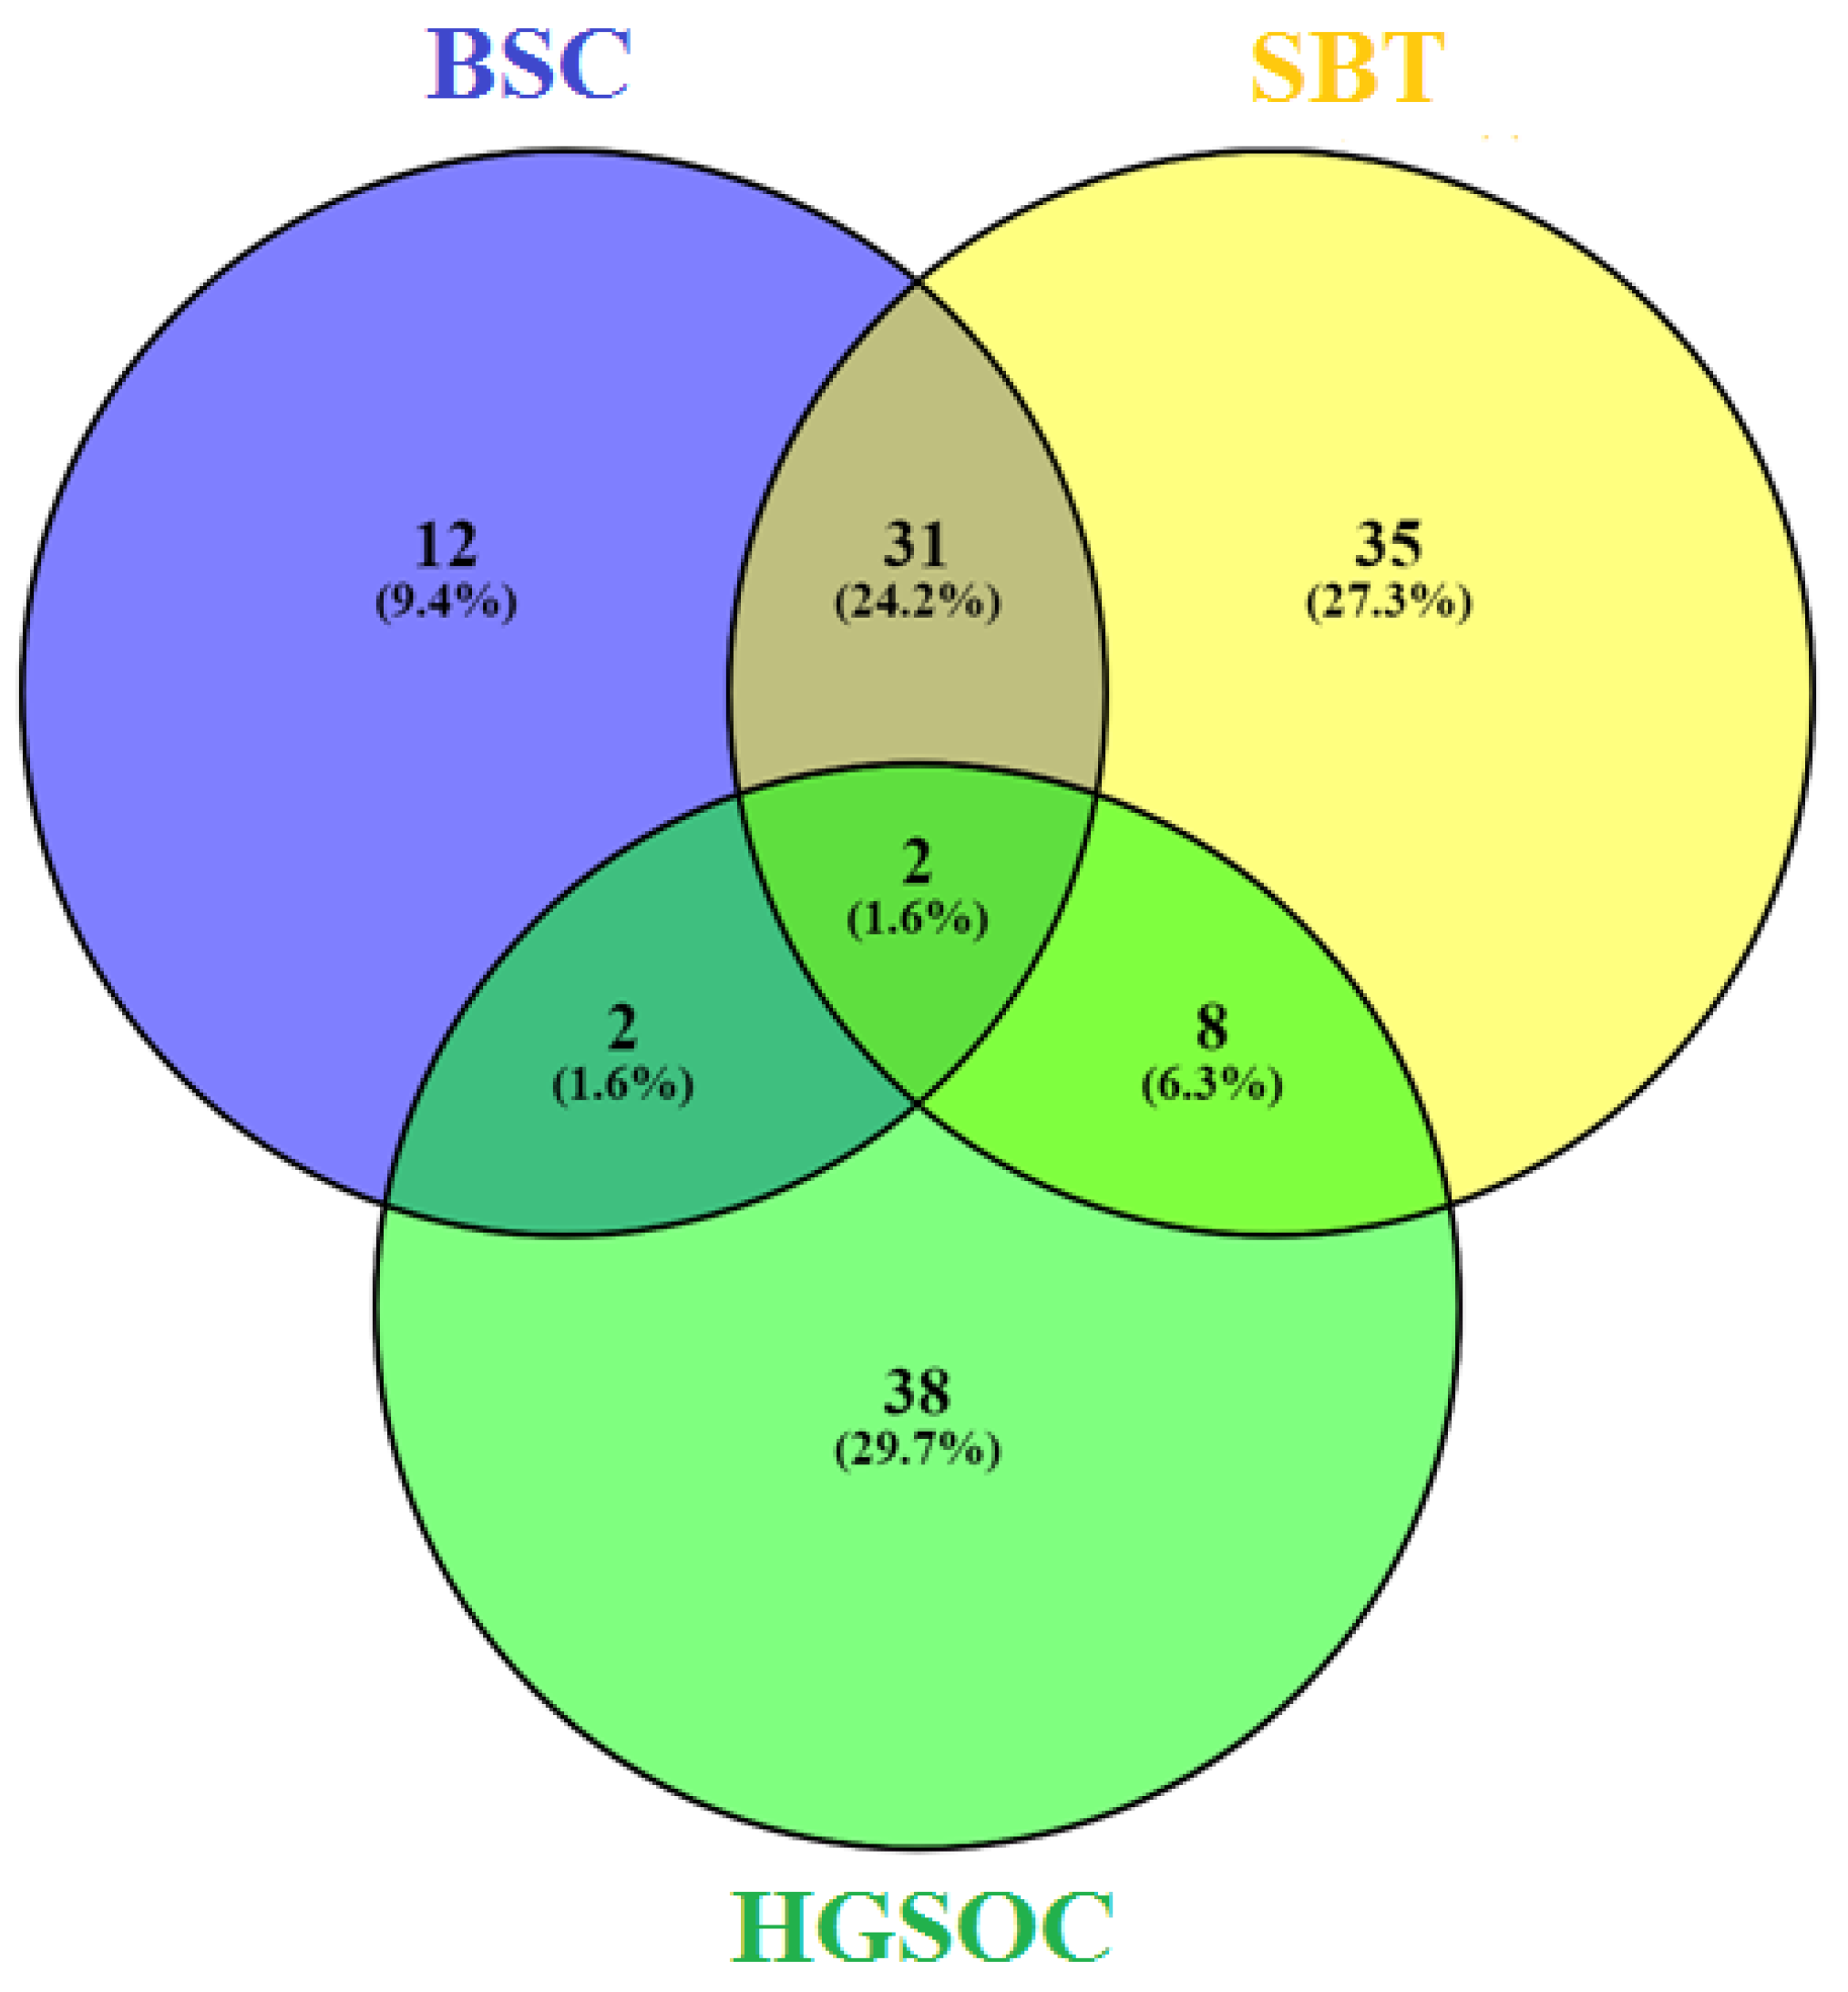
3.1. miRNA Signatures of the BSC, SBT and HGSOC According to NGS Data

In order to test two hypotheses of the pathogenesis of serous ovarian tumors, tissue samples from patient cohort 1 (Table 2) were used to compare miRNA expression profiles in the BSC, SBT and HGSOC samples with that in samples of histologically unchanged fallopian tube fimbriae by NGS.
The obtained miRNA expression profiles were analyzed by the hierarchical clustering method, and it was found that samples of HGSOC (s18, s21, s34) form a separate cluster, which differs markedly from the second cluster formed by SBT samples (s2, s10, s24) and BSC samples (s6, s8 s30), as demonstrated in Figure 1.
When comparing the miRNA read counts in the analyzed samples of ovarian tumors with those in samples of histologically normal fallopian tube fimbriae, the lists of differentially expressed miRNAs were obtained for each type of tumor, namely, for BSC (Table S1, Sheet 1), for SBT (Table S1, Sheet 2) and for HGSOC (Table S1, Sheet 3). When comparing identified miRNA signatures for each kind of ovarian serous tumor by constructing a Venn diagram, the similarity of the BSC and SBT was revealed, but molecular biological profiles of both kinds of tumors, BSC and SBT, were almost completely different from that of HGSOC (Figure 2).
The obtained data confirm the hypothesis of two different pathogenetic mechanisms for the formation of serous ovarian tumors: a common mechanism for BSC and SBT, and another mechanism for HGSOC (see the Introduction section). The list of miRNAs that significantly differentiated BSC and SBT from HGSOC is presented in Table S1, Sheet 4. To validate the NGS data by quantitative RT-PCR, we randomly selected eight miRNAs from Table S1, Sheet 4, namely: hsa-miR-17-5p, hsa-miR-425-5p, hsa-miR-20a-5p, hsa-miR-93-5p, hsa-miR-30d-5p and hsa-miR-16-5p, with a high level of expression in HGSOC relative to BSC and SBT, and hsa-miR-101-3p and hsa-miR-140-3p, with a lower level of expression in HGSOC relative to BSC and SBT (Table 3).

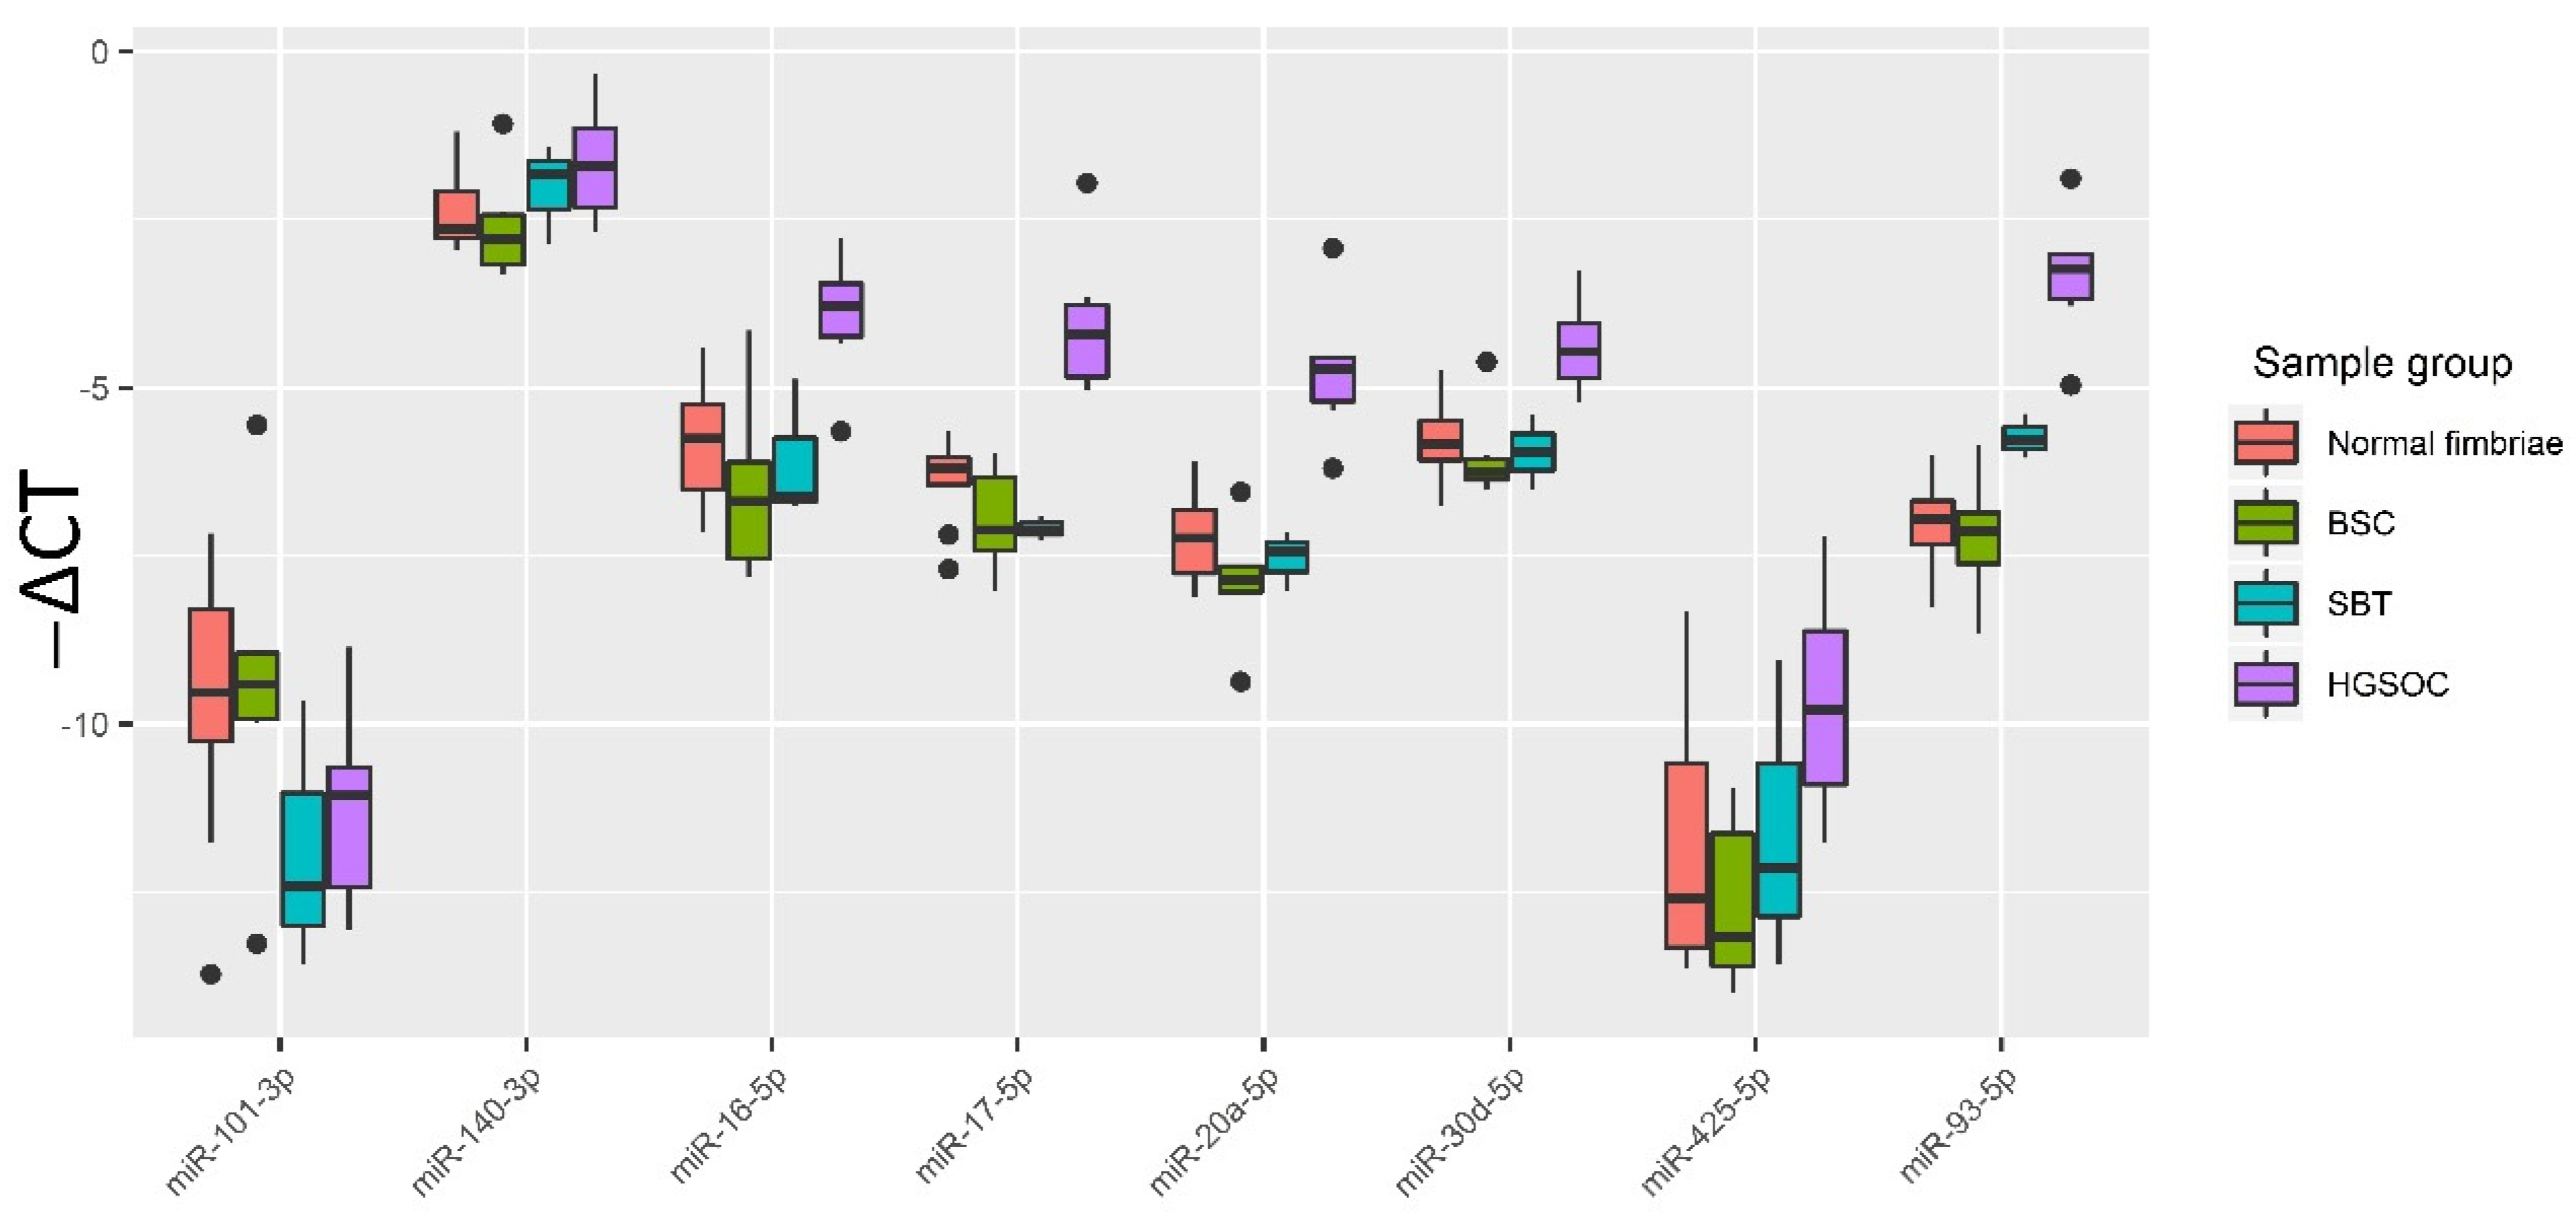
3.2. Validation of NGS Data by Quantitative RT-PCR

The relative expression of hsa-miR-17-5p, hsa-miR-425-5p, hsa-miR-20a-5p, hsa-miR-93-5p, hsa-miR-30d-5p, hsa-miR-16-5p, hsa-miR-101-3p and hsa-miR-140-3p in all samples from Table 1 (normal fimbriae, n = 9; BSC, n = 6; SBT, n = 3; HGSOC, n = 6) was determined by the ∆Ct method using SNORD68 as the reference RNA. To visualize the data obtained, a box diagram was plotted (Figure 3).
A two-tailed Wilcoxon–Mann–Whitney test was used to evaluate the significance of the differences of the matched groups by miRNA expression level (-∆Ct values), and the data are presented in Table 3. From Table 4 and Figure 3, it follows that, in HGSOC, the expression levels of miR-16-5p, miR-17-5p, miR-20a-5p, miR-93-5p and miR-30d-5p are statistically significantly elevated compared to normal tubal fimbriae or BSC or SBT, which is consistent with NGS data (Table S1, Sheet 1–4).

3.3. Evaluation of the Diagnostic Potential of miR-16-5p, miR-17-5p, miR-20a-5p, miR-93-5p and miR-30d-5p, Circulating in the Peripheral Blood Plasma of Patients with HGSOC

The expression level of miR-16-5p, miR-17-5p, miR-20a-5p, miR-93-5p and miR-30d-5p, which are tissue-specific for serous ovarian tumors and statistically significantly differentiate HGSOC from BSC and SBT, was analyzed by quantitative RT-PCR in peripheral blood plasma of the second cohort of patients included in the following groups: 1 control group of 13 patients aged 33 to 54-years-old (average level of CA125 was equal to 16.5 U/mL in the range from 9.7 to 42.0 U/mL); 2 control groups of 13 patients aged 25 to 33-years-old (average level of CA125 was equal to 11 U/mL in the range from 2 to 19 U/mL); 20 HGSOC patients aged 33 to 77-years-old (average level of CA125 was equal to 791 U/mL in the range from 30 to 3808 U/mL); 12 BSC patients aged 34 to 64 (average level of CA125 was equal to 18 U/mL in the range from 4.8 to 31.2 U/mL); 18 SBT patients aged 27 to 52-years-old (average level of CA125 was equal to 32 U/mL in the range from 2.9 to 143 U/mL); 10 LGSOC patients aged 27 to 54-years-old (average level of CA125 was equal to 324.6 U/mL in the range from 56.3 to 603.9 U/mL); 11 patients with ovarian endometrioma aged 33–47-years-old (average level of CA125 was equal to 34.9 U/mL in the range from 14.8 to 52 U/mL); 12 patients with deep infiltrating endometriosis aged 28–42-years-old (average level of CA125 was equal to 45.6 U/mL in the range from 26.2 to 65 U/mL). miR-30d-5p was used as an endogenous control RNA due to minor deviations in the level in the blood plasma (standard deviation is 0.25) in the entire second cohort of patients.
Principal component analysis of the miR-16-5p, miR-17-5p, miR-20a-5p and miR-93-5p levels in two control and HGSOC groups revealed the formation of two clusters of HGSOC samples (Figure 4).
The detailed characteristics of 20 HGSOC patients are presented in Table 5.
Samples from cluster 1 and cluster 2 (Figure 4) were statistically significantly different in RECIST 1.1 MRI/CT criteria (p = 0.0191): pre-surgery CA 125 level (p = 0.05), tumor size (tumor length, p = 0.0114; tumor height, p = 0.0192; tumor width, p = 0.0483), surgery time (p = 0.013), surgery blood loss (p = 0.0175), hsa-miR-16-5p miRNA expression level (p = 0.0001), hsa-miR-17-5p (p = 0.0001), hsa-miR-20a-5p (p < 0.0001) and hsa-miR-93-5p (p < 0.0001). When analyzing the expression level of the progesterone receptor in HGSOC tissues, a negative immunohistochemical reaction was detected in 12 out of 13 samples (92.3%) of cluster 1 HGSOC, while a positive immunohistochemical reaction was detected in 5 out of 7 samples (71.4%) of cluster 2 HGSOC. Representative images of the immunohistochemical staining of HGSOC tissue sections from clusters 1 and 2 are shown in Figure 5.
Spearman correlation analysis revealed that the expression level of the progesterone receptor in the HGSOC tissue was statistically significantly inversely correlated with the level of miR-17-5p (r = −0.46, p = 0.043) and miR-16-5p (r = −0.49, p = 0.0282), which in turn were inversely correlated with tumor size (length: r = −0.58 and p = 0.0069 for miR-17-5p, r = −0.75 and p = 0.0002 for miR-16-5p; width: r = −0.64 and p = 0.0022 for miR-17-5p, r = −0.67 and p = 0.0012 for miR-16-5p; height: r = −0.7 and p = 0.0006 for miR-16-5p, r = −0.7 and p = 0.0006 for miR-16-5p), surgery time (r = −0.63 and p = 0.0035 for miR-17-5p, r = −0.59 and p = 0.0076 for miR-16-5p), surgery blood loss (r = −0.55 and p = 0.0119 for miR-17-5p, r = −0.49 and p = 0.0294 for miR-16-5p). Eight out of thirteen (61.5%) patients with HGSOC (cluster 1) underwent suboptimal cytoreduction, and in the remaining cases (38.5%), complete cytoreduction was conducted (Table 5). In contrast, five out of seven patients (71.4%) with HGSOC (cluster 2) underwent a complete cytoreduction and only 28.6% of patients underwent suboptimal cytoreduction (Table 5). According to the RECIST 1.1 criteria, three out of thirteen patients (23%) with HGSOC (cluster 1) showed a complete tumor response to ongoing chemotherapy (carboplatin AUC 6 + paclitaxel 175 mg/m2); in 7 out of 13 cases (54%), there was a stabilization of the condition, and in 3 out of 13 cases (23%), there was a progression of the disease (Table 5). Among patients with HGSOC (cluster 2), there was a complete tumor response to chemotherapy in six out of seven cases (85.7%) and disease progression in one out of seven cases (14.3%).
The “-ΔCt” values in two HGSOC molecular subtypes were compared with those in two control groups (control 1, control 2), as well as with groups of women with other serous ovarian tumors and groups of women with endometriosis. In spite of the fact that only ovarian clear cell carcinoma and endometrioid ovarian cancer have links to endometriosis, groups of women with ovarian endometriosis and deep infiltrating endometriosis were included in this study as a variant of the female reproductive organ diseases. Furthermore, the endometrium is derived from the intermediate mesoderm via mesenchymal-to-epithelial transition during the development of the urogenital system, and during the pathogenesis of deep infiltrating endometriosis, endometrial epithelial cells may be prone to return to this state via epithelial-to-mesenchymal transition (EMT) [40]. In light of the above, we aimed to compare the blood plasma of patients with HGSOC and pelvic endometriosis by the quantitation of the miR-16-5p, miR-17-5p, miR-20a-5p and miR-93-5p as the key molecules in the EMT (see Section 3.5). The results of the comparison are presented in the form of box diagrams in Figure 6, Table 6, with indication of the “-ΔCt” median values and Q1 and Q3 quartiles, and Table 7, with indication of the significance of differences between the compared groups using a two-sided Wilcoxon–Mann–Whitney test. It was found that miR-16-5p, miR-17-5p, miR-20a-5p and miR-93-5p significantly differentiated the HGSOC of the cluster 1 group from the following groups: (i) HGSOC of cluster 2, (ii) LGSOC, (iii) SBT, (iv) BSC, (v) ovarian endometrioma and (vi) deep infiltrating endometriosis. At the same time, in comparison with the control groups, which differed in the patients’ age (control 1, 33–54-years-old; control 2, 25–33-years-old), the level of expression of all four miRNAs was significantly higher in the group of patients with HGSOC of cluster 1 than in all other groups of patients with serous tumors and groups of patients with endometriosis. Importantly, the two control groups differed statistically significantly in their levels of circulating miR-93-5p (p = 0.0096) and miR-16-5p (p < 0.0001), with elevated levels of their expression in the older group. On the contrary, no dependence of miR-17-5p and miR-20a-5p levels in peripheral blood plasma on the age of the patients was found, and these two miRNAs were specific plasma markers of progesterone receptor-negative HGSOC (cluster 1), statistically significantly differentiating patients with this subtype of HGSOC from apparently healthy women and patients with other types of serous ovarian tumors or external genital endometriosis. In the blood plasma of patients with HGSOC, highly expressing the progesterone receptor, a statistically significant decrease in the level of miR-93-5p was found, in contrast to patients with a progesterone receptor-negative HGSOC tissue, in whose blood plasma a statistically significant increase in the level of miR-93-5p was detected, when compared with control group 1. A statistically significant decrease in the level of miR-93-5p was also found in the blood plasma of patients with endometrioid ovarian cysts when compared with control group 1, so this miRNA cannot be considered a unique HGSOC marker.

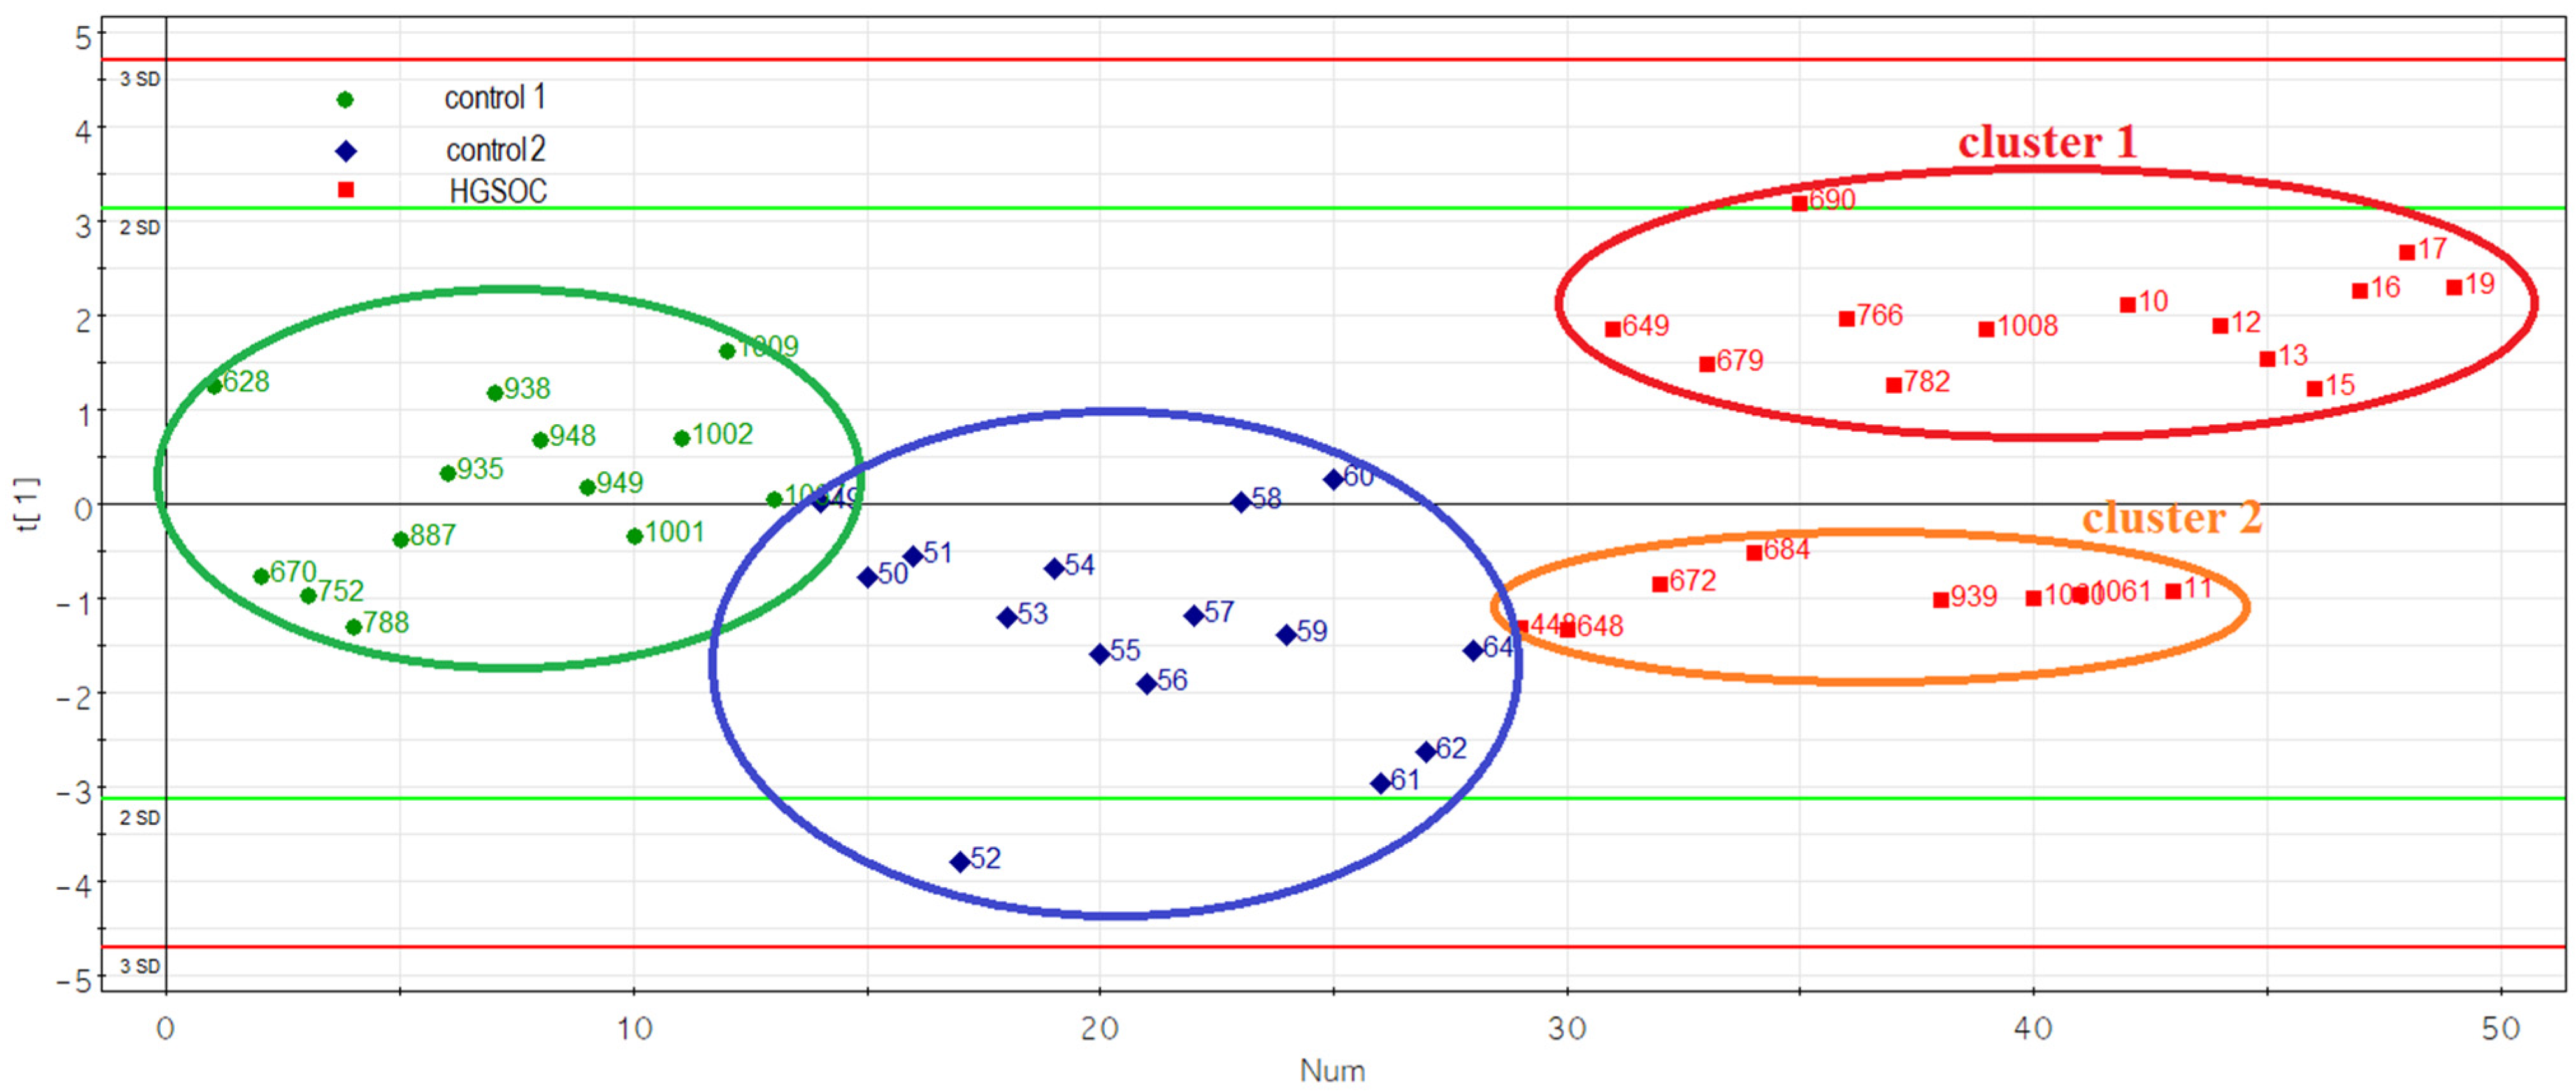
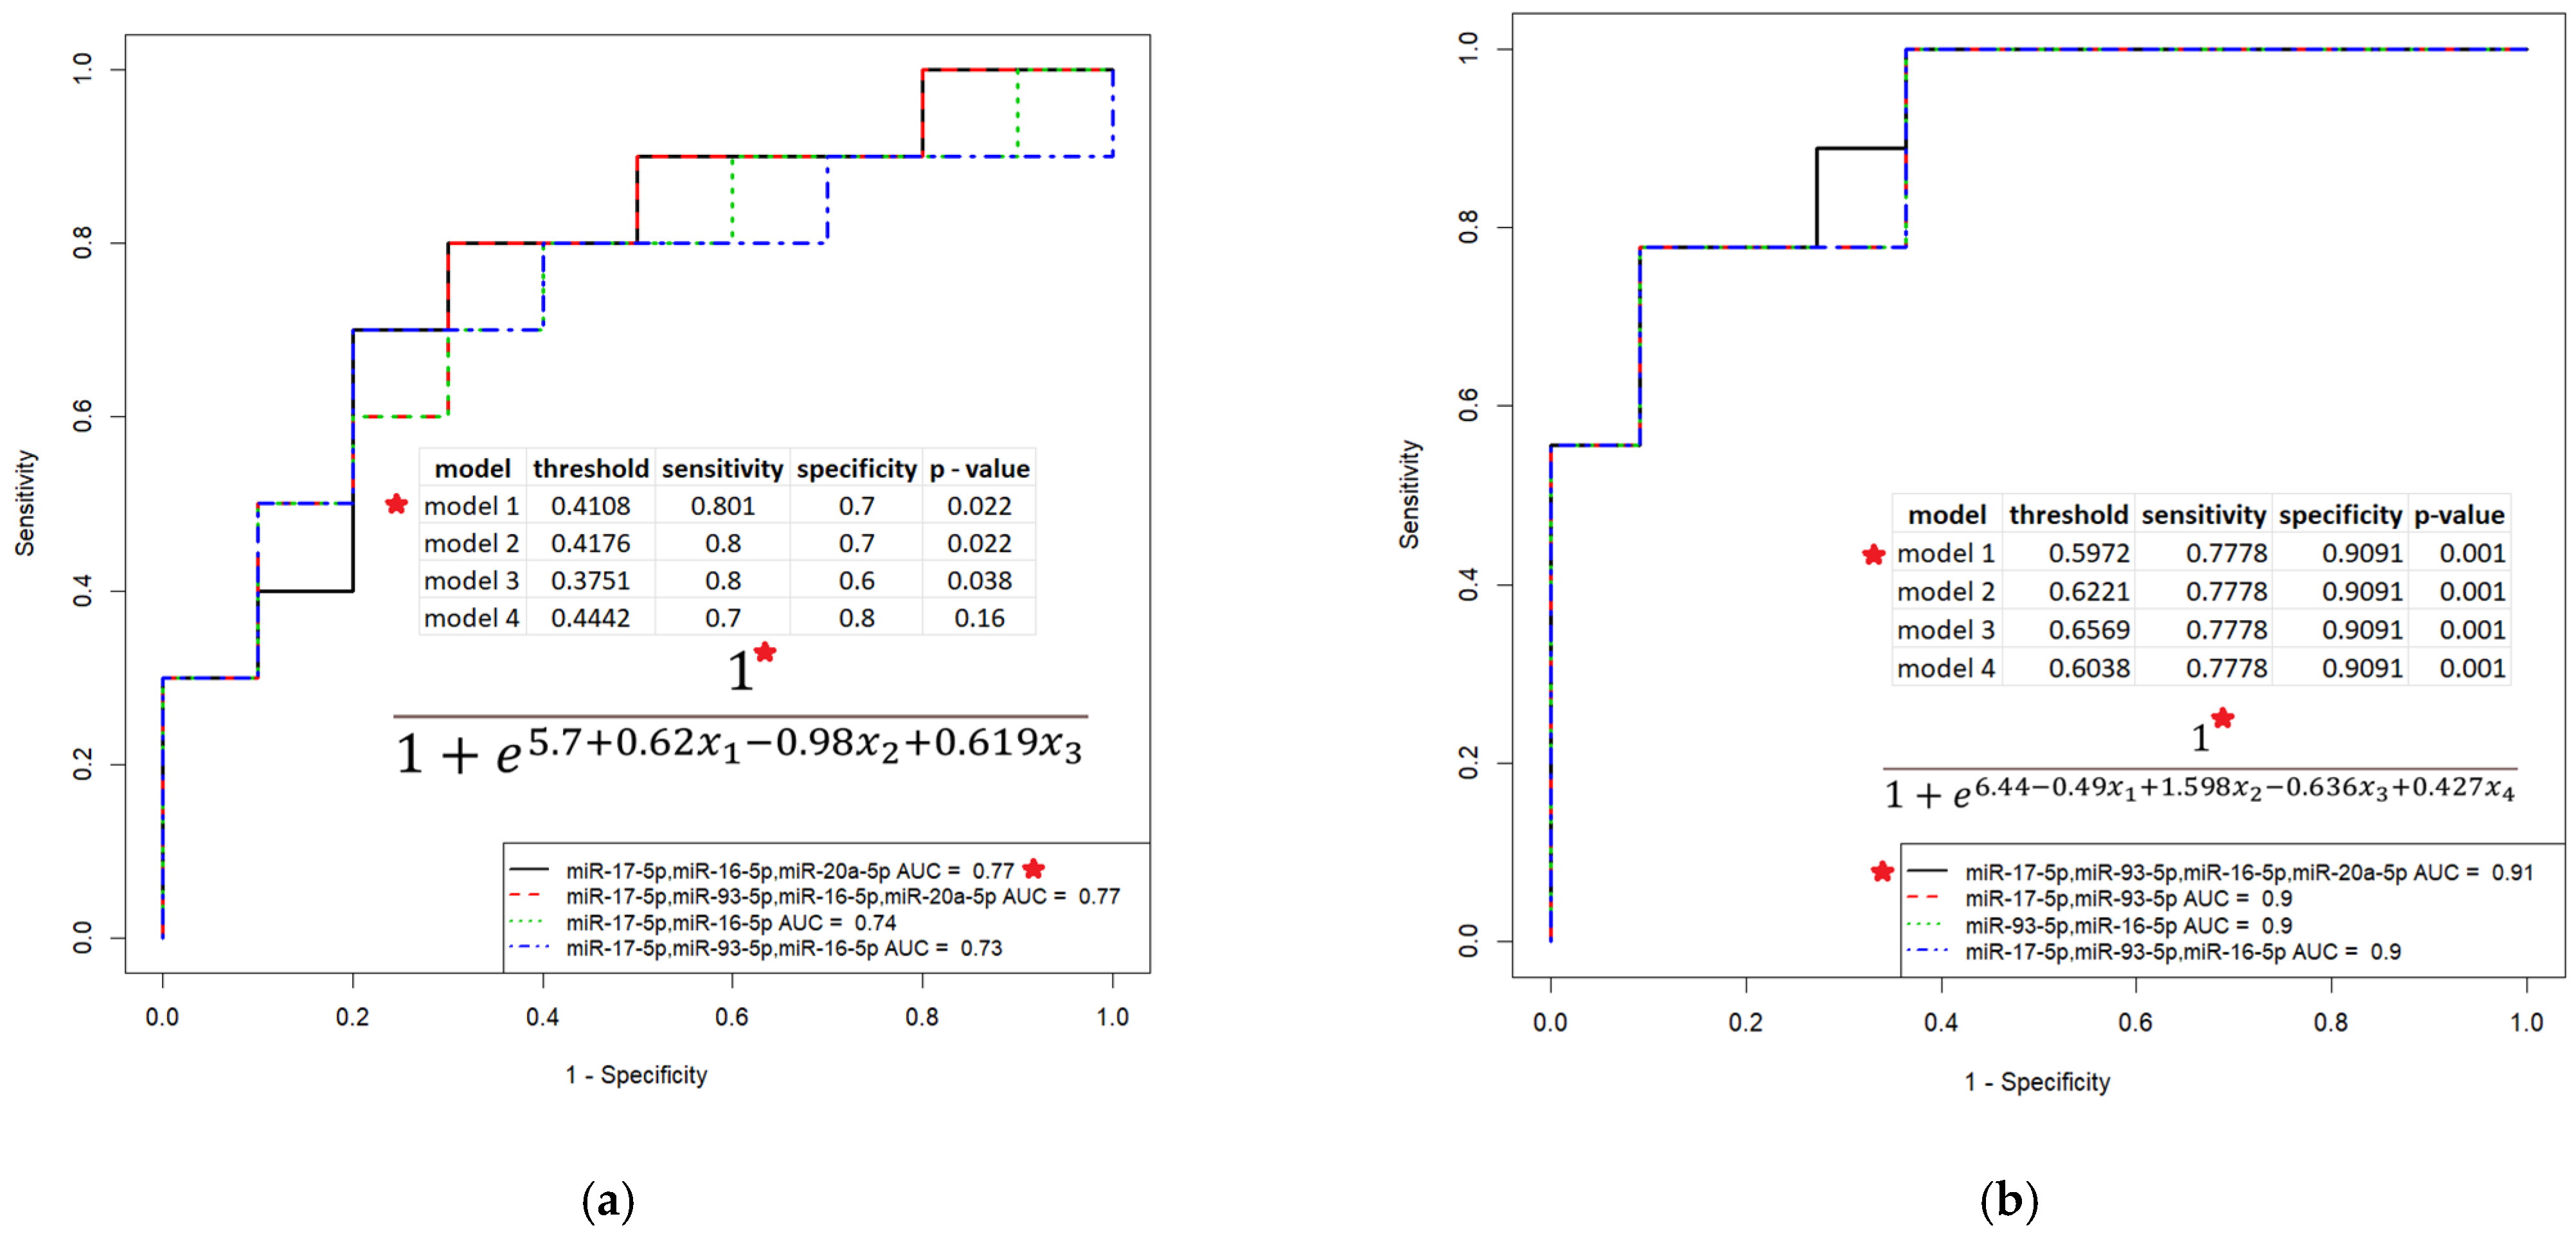
3.4. Evaluation of the Prognostic Potential of miR-16-5p, miR-17-5p, miR-20a-5p and miR-93-5p, Circulating in the Peripheral Blood Plasma of Patients with HGSOC

In light of the above, the possible link between the level of circulating miR-16-5p, miR-17-5p, miR-20a-5p and miR-93-5p in the blood of HGSOC patients with surgical outcome and post surgery response to chemotherapy was evaluated. This analysis of the data is relevant, since there is no clinically applicable biomarker that can predict suboptimal cytoreduction, which is associated with poor overall survival, as discussed in a number of systematic reviews [41,42,43]. To develop prediction models of logistic regression, clinical characteristics of the HGSOC patients from Table 4 (surgical outcome—complete or suboptimal cytoreduction; RECIST 1.1 data—complete response or resistance to chemotherapy in the case of partial response, stable disease and progressive disease) and -∆Ct values for each of the miR-16-5p, miR-17-5p, miR-20a-5p and miR-93-5p were used. The developed models are presented in Figure 7.
It was found that the combined determination of the level of circulating miR-16-5p, miR-17-5p, miR-20a-5p and miR-93-5p circulating in blood plasma in patients with primary HGSOC tumors makes it possible to predict the optimal cytoreduction with 80.1% sensitivity and 70% specificity (Figure 7a, model 1: p = 0.022, TPR = 0.8, FPR = 0.3, probability of optimal cytoreduction at calculated values according to formula of the model > 0.4108) and the complete response to post surgery chemotherapy with 77.8% sensitivity and 90.9% specificity (Figure 7b, model 1: p = 0.001, TPR = 0.78, FPR = 0.09, probability of chemosensitivity at calculated values according to formula of the model > 0.5972). The use of these models can predict cases where complete cytoreduction cannot be achieved due to difficulty in resecting tumors that have invaded vital organs. In such cases it would be preferable to forego primary cytoreduction surgery and use neoadjuvant chemotherapy to reduce the residual tumor mass and increase the chances of achieving complete interval cytoreduction. For instance, the addition of hyperthermic intraperitoneal chemotherapy to interval cytoreductive surgery after three cycles of neoadjuvant chemotherapy with carboplatin and paclitaxel resulted in a 12-month increase in overall survival for patients who were not eligible for an initial macroscopic complete resection [44].

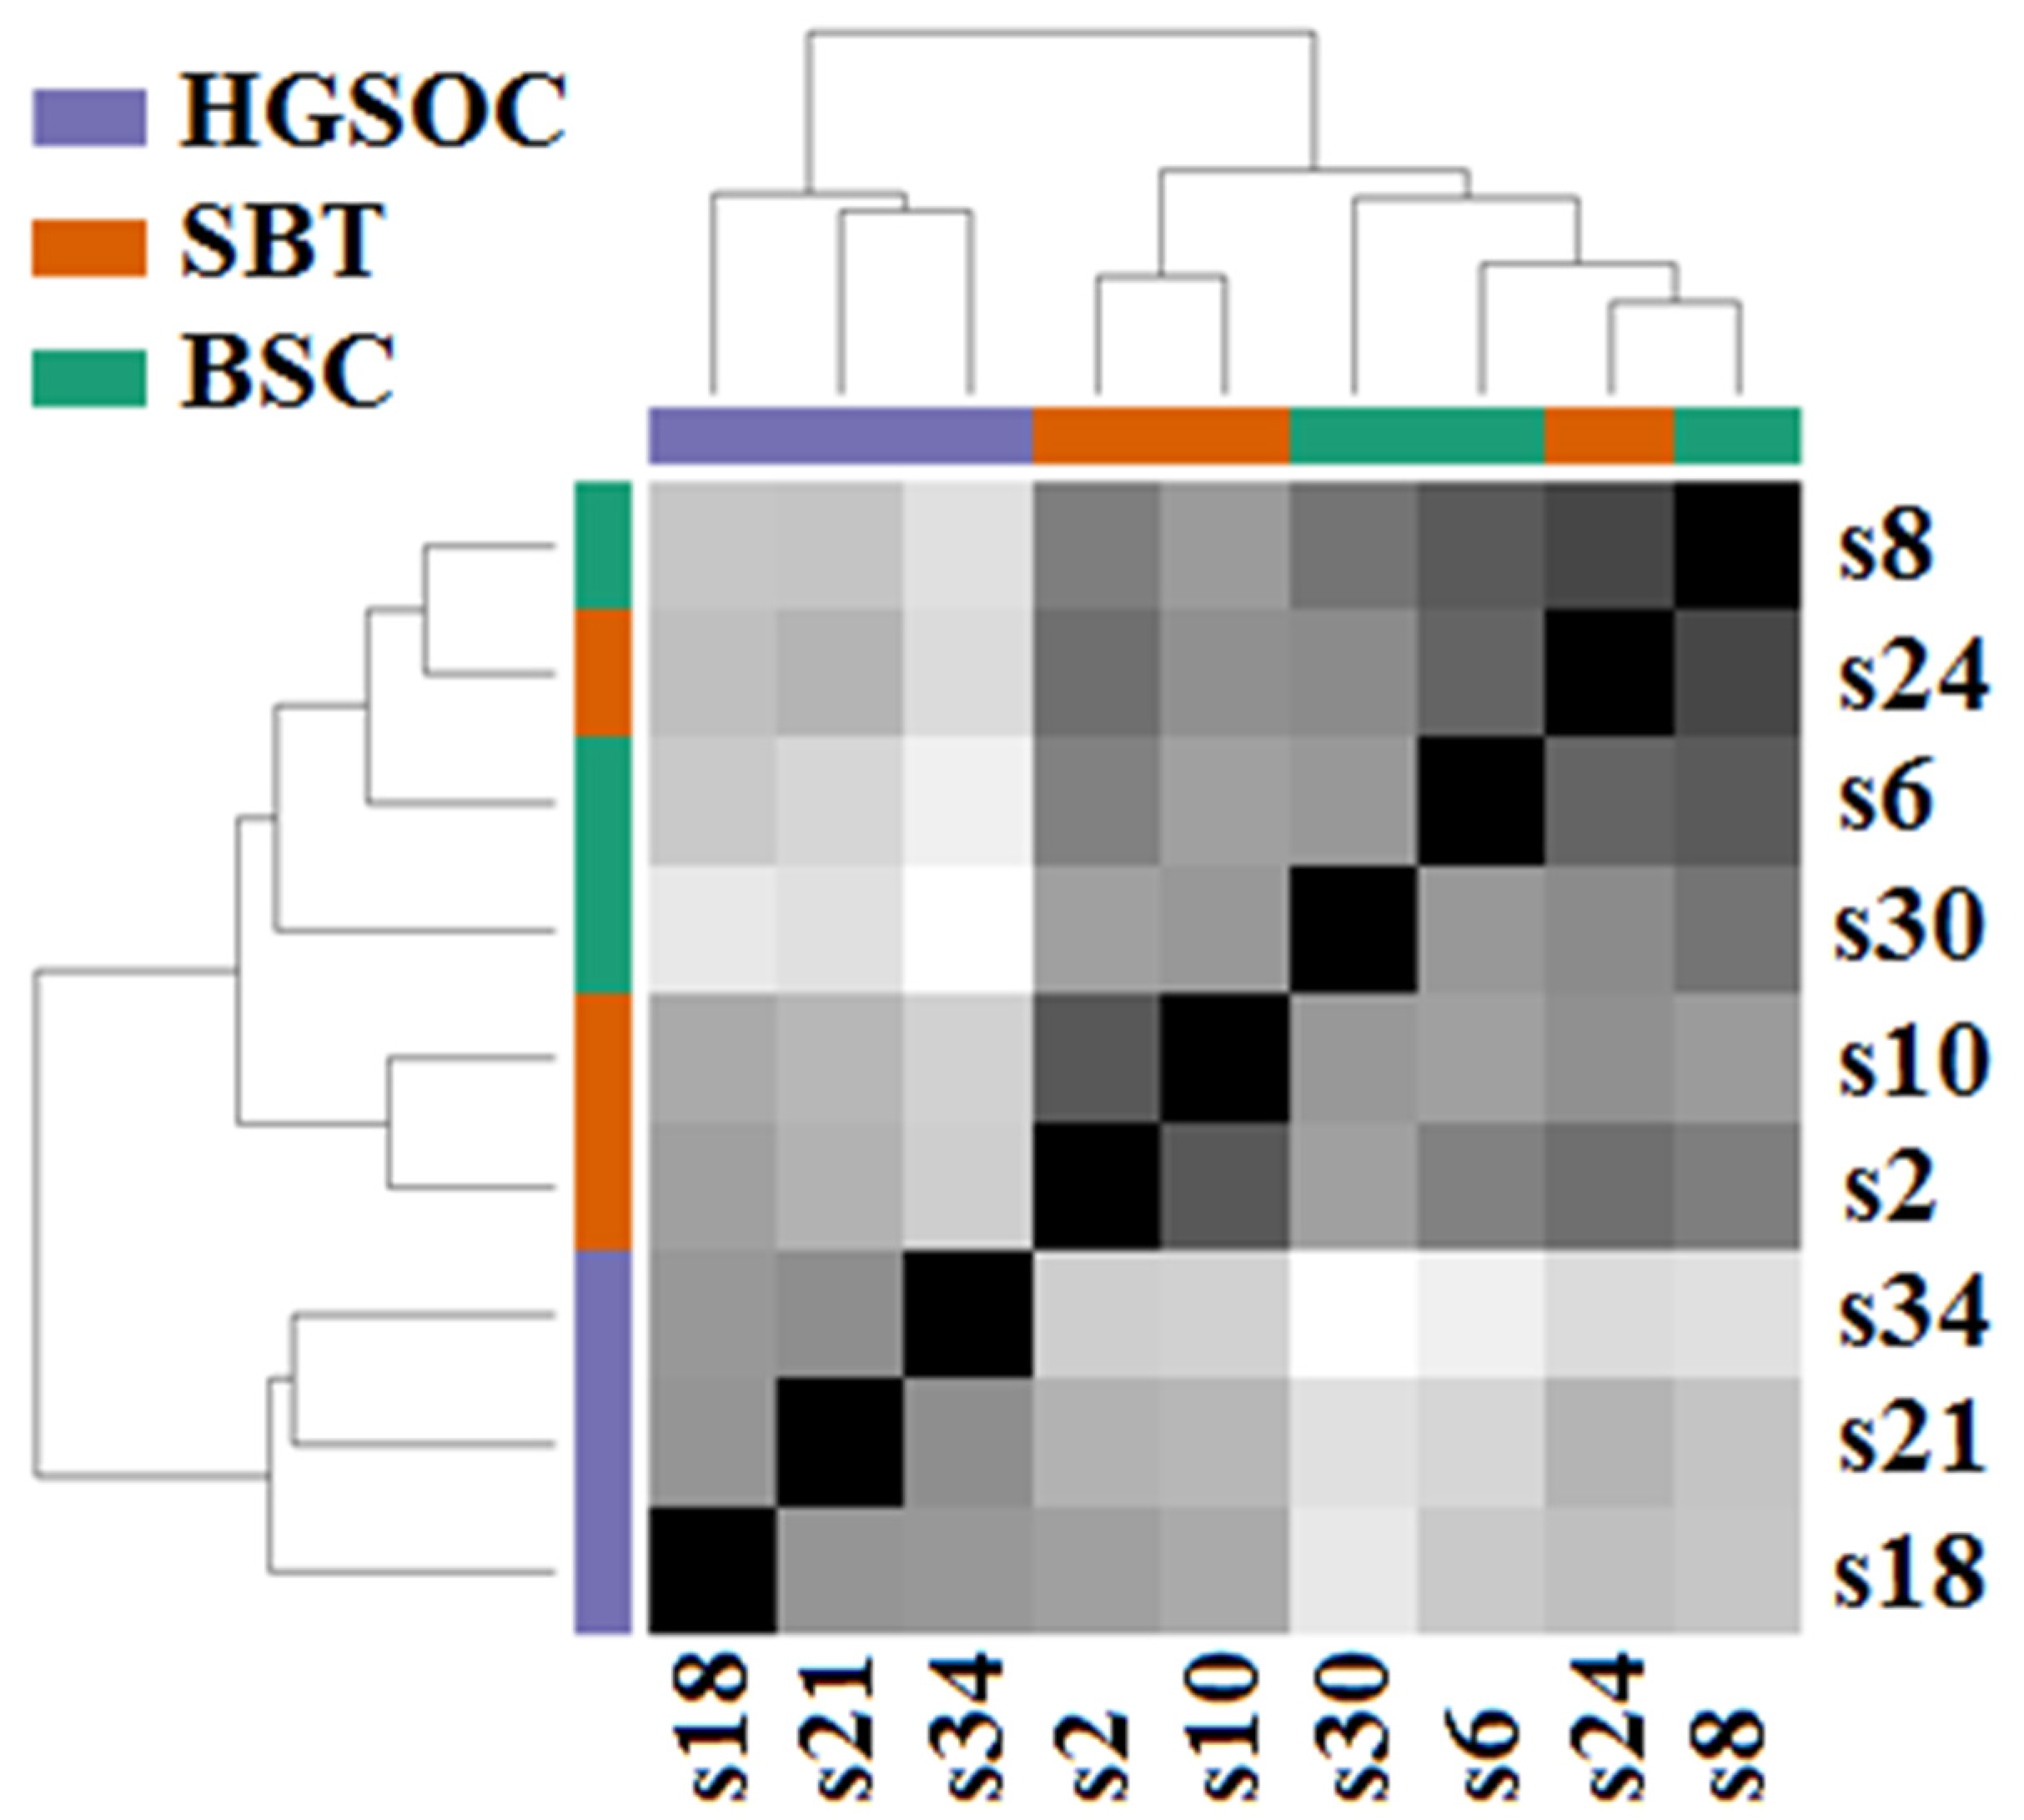
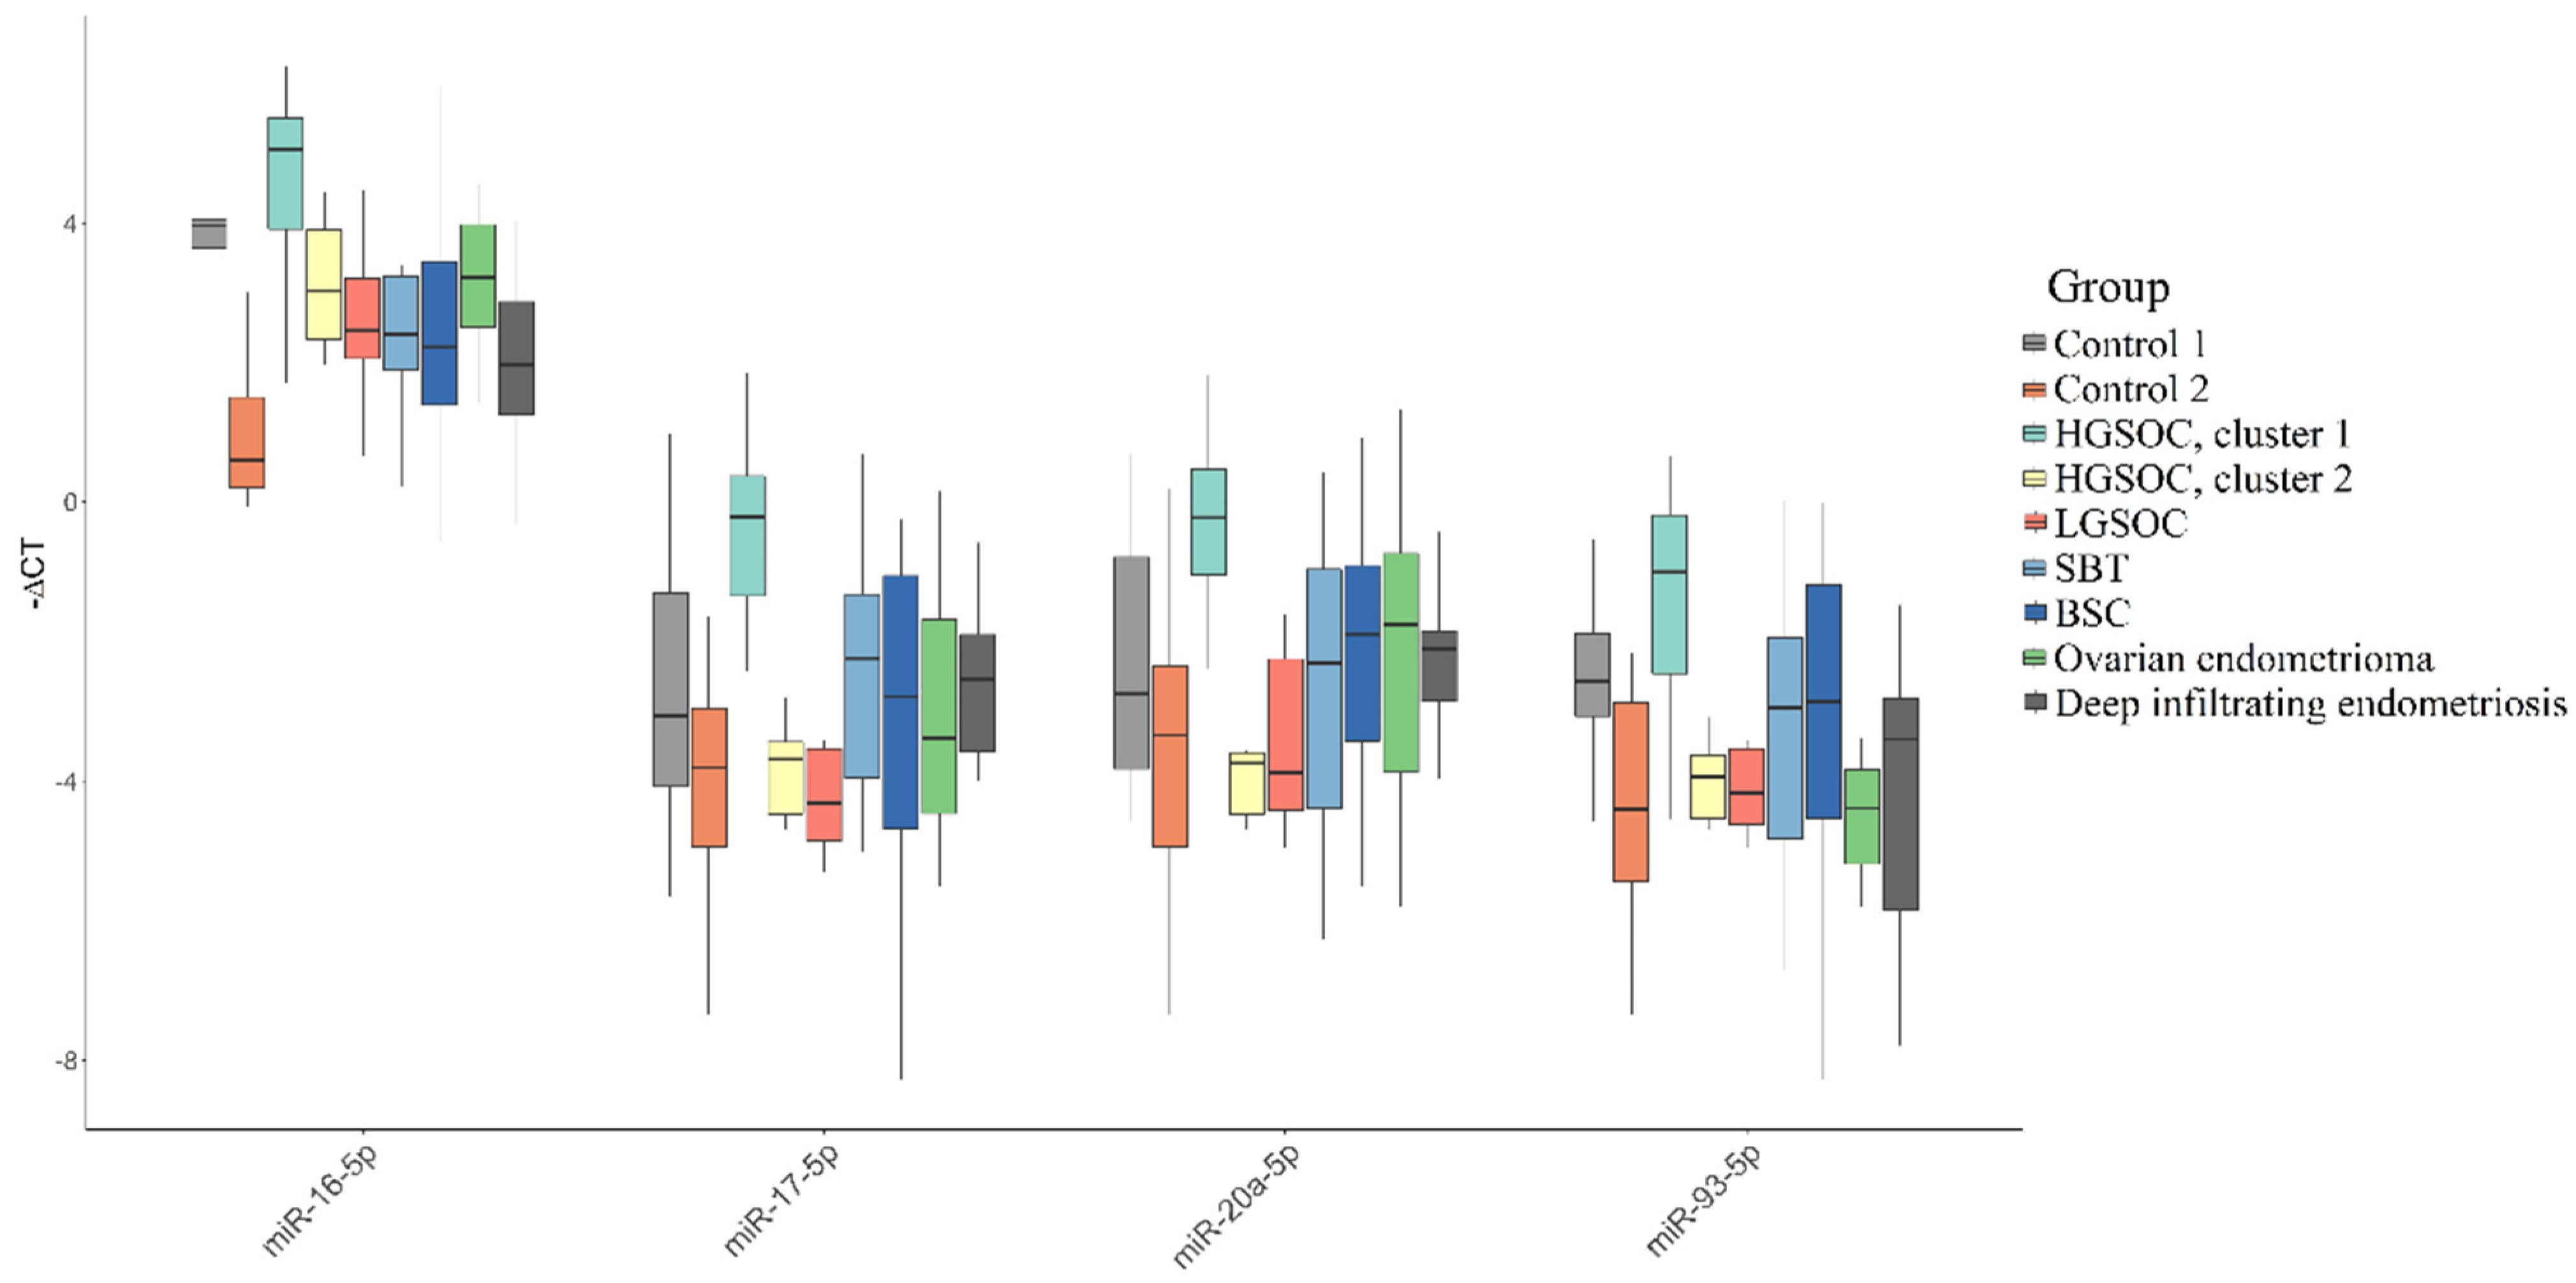
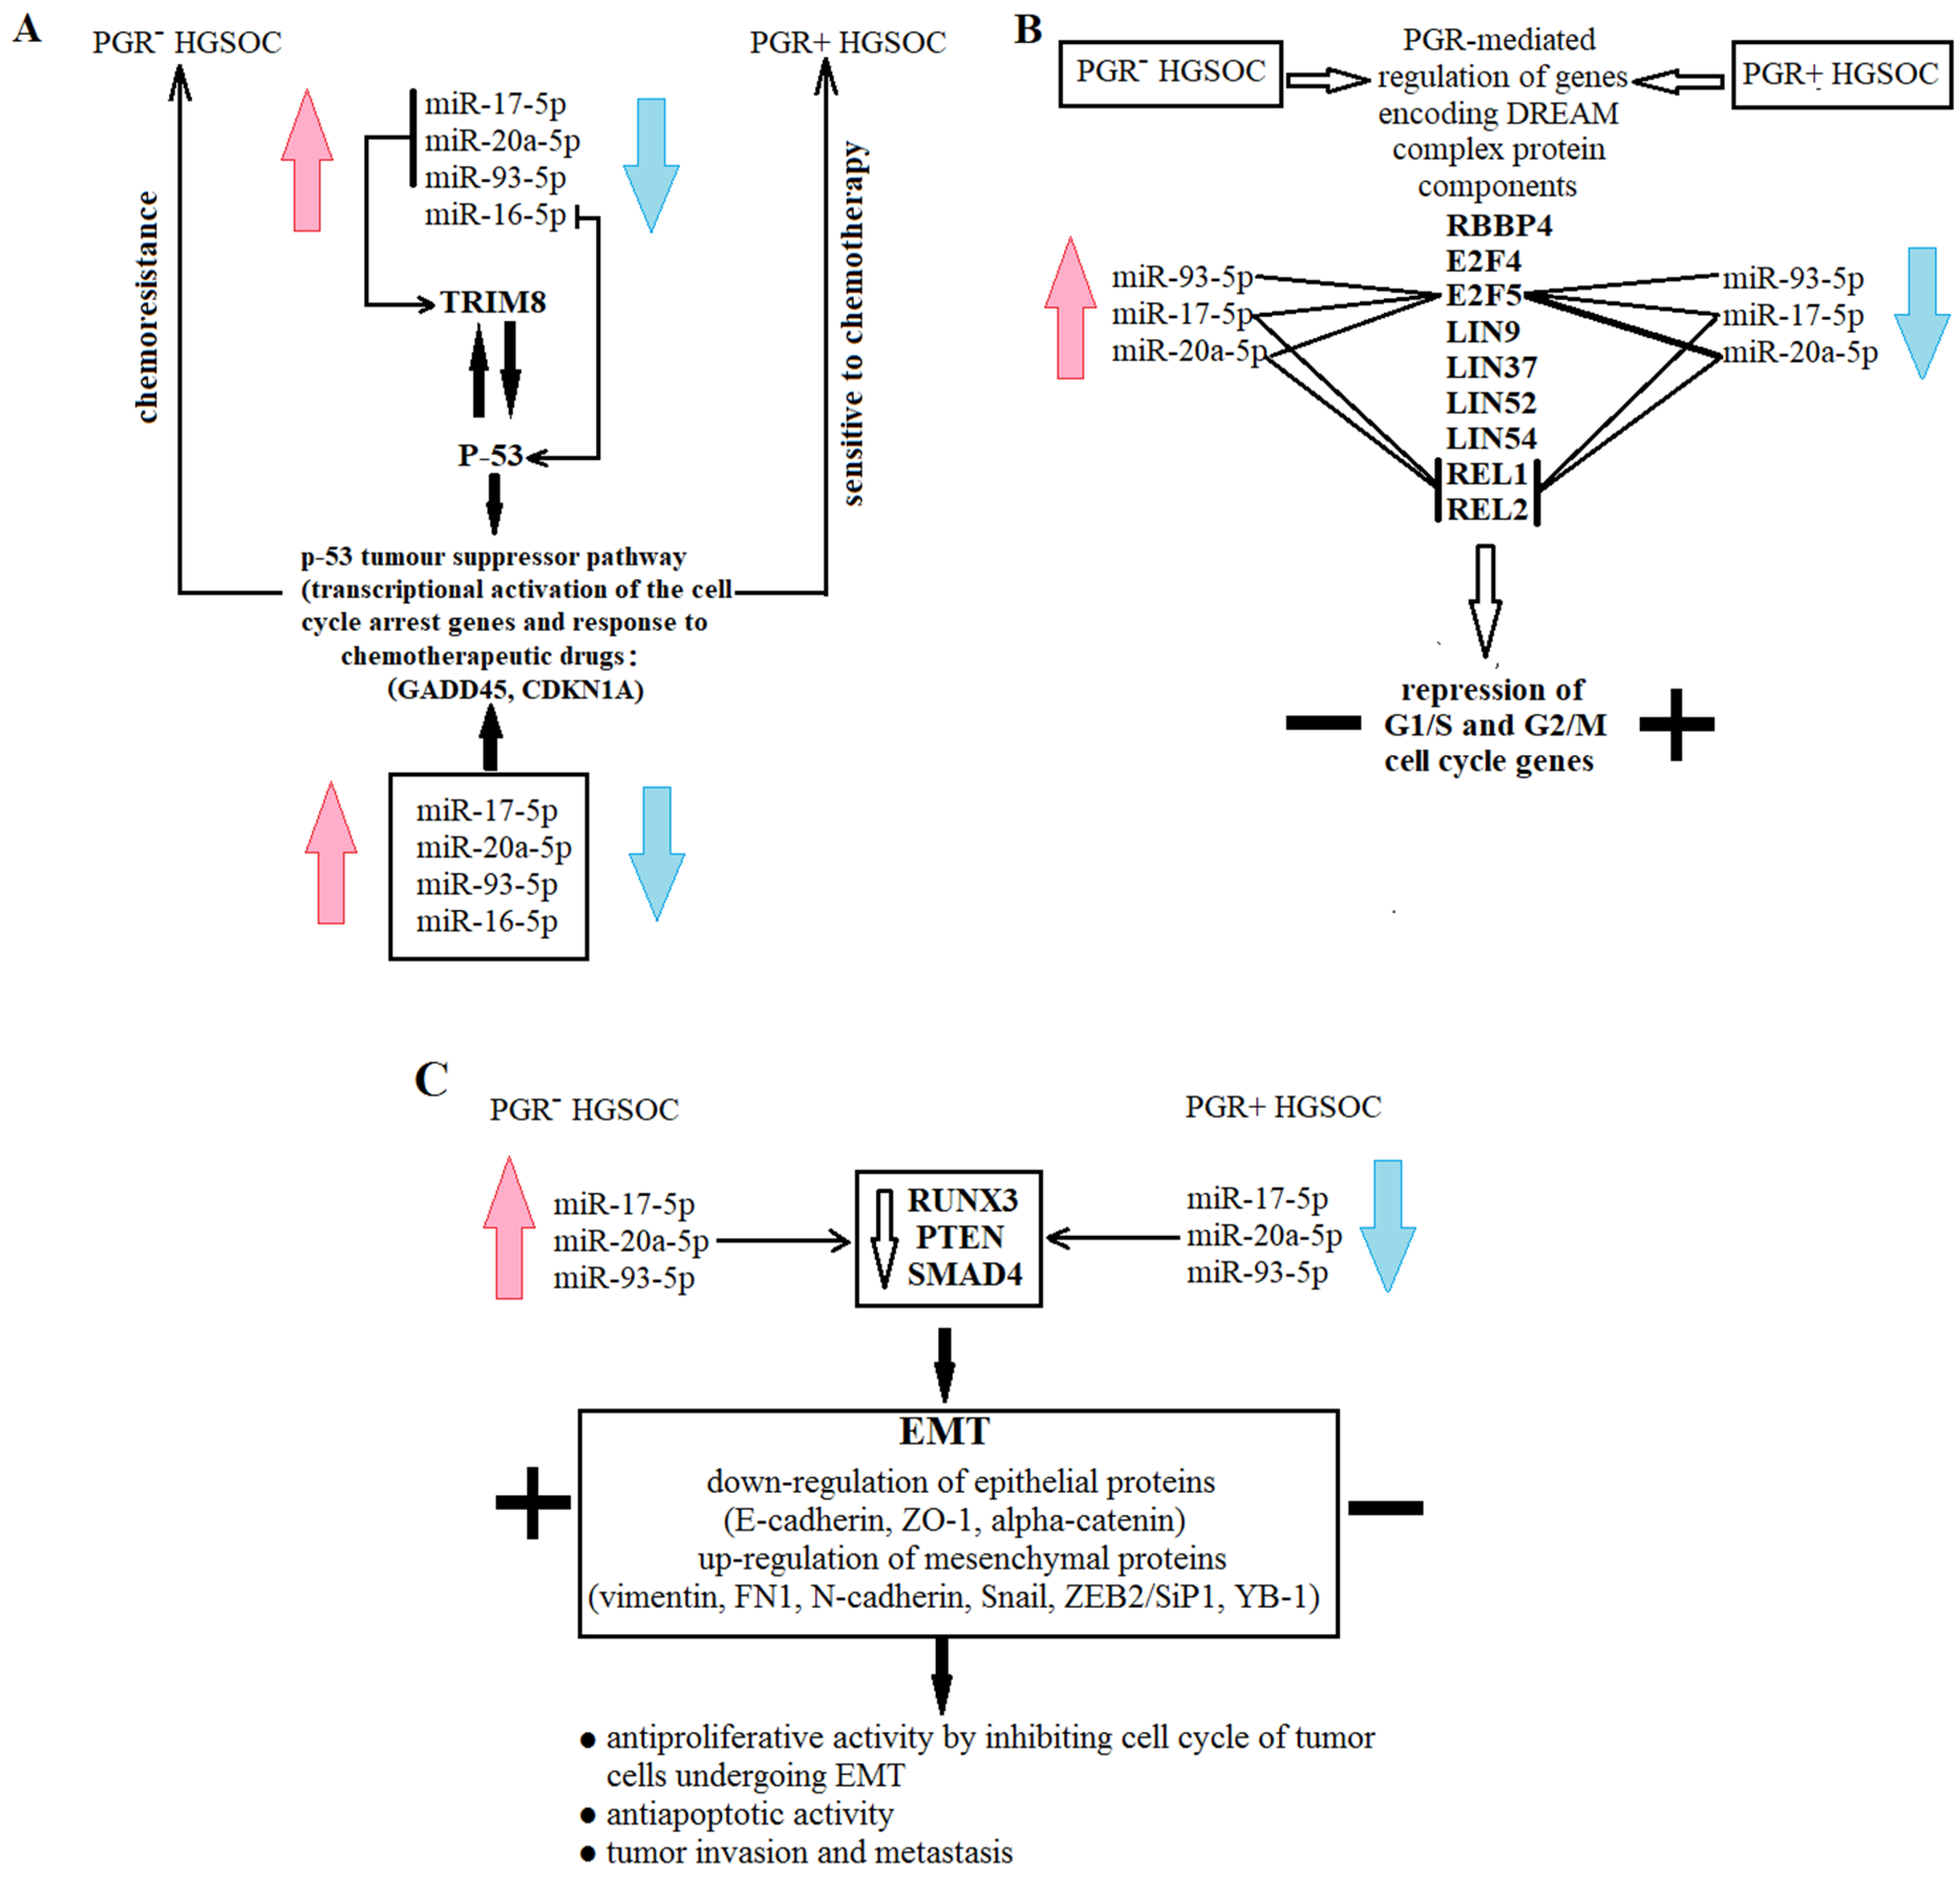
3.5. Functional Significance of miR-16-5p, miR-17-5p, miR-20a-5p and miR-93-5p in Determination of Different HGSOC Subtypes

Using the MiRTargetLink database (https://ccb-compute.cs.uni-saarland.de/mirtargetlink2/bidirectional_search/) (accessed on 30 August 2022), we focused our attention on those miRNA target genes that can determine the proliferative, invasive and metastatic properties of primary HGSOC tumors, which in turn determine the success of cytoreduction and sensitivity to postoperative chemotherapy (Figure 8).
According to this database, miR-17-5p, miR-20a-5p and miR-93-5p negatively regulate TRIM8, which is a direct target of the P53 gene [45]—the main participant in the p53 tumor suppressor pathway [46,47,48]. In turn, the p53 protein level is controlled by miR-16-5p (MiRTargetLink data) and by TRIM8, aninducer of the degradation of the MDM2 protein, which is the principal negative regulator of p53 stability [45]. TRIM8 deficit, in particular due to miR-17-5p upregulation, contributes to the impairment of p53-mediated responses to chemotherapeutic drugs and results in chemoresistance and oncogenesis [49]. Moreover, miR-17-5p may perform a role in the development of drug resistance in cancer cells by targeting the anti-apoptotic p21 protein (CDKN1A) [50]. Therefore, there is a feedback loop with the participation of p53, TRIM8 and miRNAs, which control their protein levels: p53 promotes the transcription of TRIM8, which, in turn, interacting with p53, induces its stabilization and the p53-dependent transcriptional activation of cell cycle arrest genes, such as CDKN1A and GADD45, and this axis is under the control of miR-17-5p, miR-20a-5p, miR-93-5p and miR-16-5p (according to MiRTargetLink data) in defining drug responsiveness and cell proliferation (Figure 8a).
The two molecular subtypes of HGSOC that we detected differed in the expression level of the progesterone receptor (PGR-negative and PGR-positive), and the PGR-negative phenotype of HGSOC was associated with the upregulation of miR-17-5p, miR-20a-5p, miR-93-5p and miR-16-5p. Although these miRNAs do not directly regulate the level of the PGR, their experimentally proven target genes are transcription factors binding to promoter/enhancer sites of the PGR gene, according to the MiRTargetLink database; in particular: miR-17-5p downregulates PKNOX1, CBX8, MNT; miR-16-5p—POLR2A, TBP, SMARCA4, NFIC, PKNOX1, ZFX; miR-93-5p—PKNOX1, CBX8, ZIC2, POLR2A, EZH2; miR-20a-5p—PKNOX1, CBX8. The common target for all four miRNAs is the homeobox protein PKNOX1 gene. The action of progesterone through the PGR mediates the transcriptional regulation of DREAM complex proteins supporting the DREAM/DYRK1-mediated repression of cell cycle-dependent genes [51]. According to the MiRTargetLink data, the expression level of some of the DREAM complex proteins, namely, E2F5, REL1 and REL2, are under the control of the miR-17-5p, miR-20a-5p and miR-93-5p (Figure 8b), providing the proliferative potential and survival of the tumor cells.
The experimentally proven target genes of miR-17-5p, miR-20a-5p and miR-93-5p (from MiRTargetLink data base) are RUNX3, PTEN and SMAD4, which cause the activation of the downstream EMT signaling in the case of their decreased expression level (Figure 8c); in particular: upregulation of mesenchymal proteins—vimentin, FN1, N-cadherin, Snail, ZEB2/SiP1, YB-1, and downregulation of epithelial proteins—E-cadherin, ZO-1, α-catenin [52,53,54,55,56,57,58,59,60]. It was found that cells undergoing EMT are characterized by the antiproliferative properties with high invasiveness, metastatic ability, resistance to apoptosis, radio- and chemotherapy [61,62,63]. So it was suggested that high cell proliferation is necessary for the initial stages of the pathogenesis of primary tumor and its maintenance, while inhibition of cell division is a key step for ensuring the invasion and migration of tumor cells [58].

4. Discussion

Ovarian cancer incidence and mortality cases increased by 88.01 and 84.20%, respectively, from 1990 to 2017, all over the world [64]. Serous ovarian cancer accounts for 75–80% of ovarian malignancies. A better understanding of the pathogenesis and molecular classification of ovary cancer is urgently needed because the mortality rate has remained high and five-year survival rates are low; in particular, for the dominant tumor histologic type in epithelial ovarian cancers, HGSOC, these values are approximately equal to 40.6% [65] or to 70–80% [66].
In the present study, we focused on the identification of the miRNA signature of HGSOC tissue in comparison with other serous ovarian tumors (BSC and SBT) by deep sequencing, followed by the validation of selected miRNAs by real-time quantitative PCR. An analysis of differentially expressed miRNAs in ovarian tumor tissues relative to normal fallopian tube fimbriae revealed scant similarity between HGSOC and BSC (3.2% of 128 analyzed miRNAs) and SBT (7.9%), but a greater similarity between BSC and SBT (33%). The hierarchical clustering of miRNA profiles of tumor tissues demonstrated the formation of a separate cluster of HGSOC samples and a common cluster of BSC and SBT samples. The data obtained confirm the dualistic classification of epithelial ovarian cancers based on the differences in morphological types with specific molecular changes and differences in prognosis [67]: type I ovarian neoplasms are usually low-grade tumors without TP53 mutations, with slow progression and with a good prognosis if they are diagnosed in the early stages (LGSOC, mucinous carcinomas, clear cell carcinomas, and endometroid ovarian carcinomas), and type II ovarian neoplasms (HGSOC), which are characterized by mutations of TP53 and frequently diagnosed in the advanced stages with a poor prognosis. The precursor lesion of HGSOC is considered to be serous tubal intraepithelial carcinomas (STICs), which was proved by revealing identical somatic TP53 mutations in STICs and concurrent HGSOCs [68] and the identification of STICs in 11–61% of cases with HGSOC [69]. As for LGSOC, it is thought to progress from BSC in a stepwise fashion via SBT, which was confirmed by an in vitro carcinogenic model [12] and by genetic analyses of the serous cystadenomas [70]. Another hypothesis is that a papillary tubal hyperplasia (PTH) is the source of origin for LGSOC. According to this hypothesis, the PTH, as a precancerous lesion, develops in the fallopian tube and involves the ovary secondary having the same morphology as an SBT (papillary structures, branching, psammoma bodies and salpingoliths) [71,72,73]. Consequently, only the progression from an SBT to LGSOC occurs in the ovary.
Two subtypes of HGSOC were identified, which significantly differ in the level of expression of the progesterone receptor in the tumor tissue, the secretion of miR-16-5p, miR-17-5p, miR-93-5p and miR-20a-5p, and the level of serum CA125, tumor size, surgical outcome (optimal or suboptimal cytoreduction) and response to chemotherapy. In particular, we identified patients with the progesterone receptor-negative subtype of HGSOC, characterized by an increased level of miR-16-5p, miR-17-5p, miR-93-5p and miR-20a-5p in peripheral blood, by lower serum CA-125 levels, smaller tumor size, suboptimal cytoreduction in 61.5% of cases and a complete response to adjuvant chemotherapy in only 20% of cases, in comparison with the progesterone receptor-positive subtype of HGSOC, with optimal cytoreduction in 71.4% of cases and a complete response to adjuvant chemotherapy in 85.7% of cases. It was found here that the combined determination of the level of circulating miR-16-5p, miR-17-5p, miR-20a-5p and miR-93-5p circulating in blood plasma in patients with primary HGSOC tumors makes it possible to predict the optimal cytoreduction with 80.1% sensitivity and 70% specificity; furthermore, the combination of miRNAs can predict a complete response to post surgery chemotherapy with 77.8% sensitivity and 90.9% specificity. It is assumed that the success of cytoreductive surgery, as well as response to chemotherapy, are dictated by EOC biology, and the low probability of optimal cytoreduction is associated with the progression of the disease and poor overall survival [41,42,74]. While comparing primary tumors from optimally and suboptimally cytoreduced patients, Liu Z. and colleagues [74] revealed the gene network associated with increased stromal activation and lymphovascular invasion of a distinct mesenchymal molecular subtype of EOC. This molecular signature (POSTN, FAP, TIMP3, CTSK, TNFAIP6, CXCL14, FAP, TIMP3 and COL11A1) is overlapped with the gene signature of suboptimal debulking identified by Riester M. [75] and by Tucker S. [76], among which the expression of POSTN, FAP and TIMP3 was associated with therapeutic resistance in EOC [77].
The main regulators of the expression of key genes involved in the pathogenesis of certain molecular subtypes of serous ovarian cancer are small non-coding RNAs, including miRNAs. These small molecules could be used as diagnostic and prognostic molecules [78], as they regulate multiple pathways implicated in cell proliferation, differentiation, cell migration and apoptosis [79,80], by targeting mRNAs and repressing translation as a part of the RISC [81,82]. Kuznetsov VA and colleagues, using big-data analytics, identified 19 miRNAs and 31 miRNAs expressed in tumors as prognostic classifiers, allowing the separation of the HGSOC patients into low-, intermediate- and high-risk subgroups with a five-year survival rate of 51.6–85%, 20–38.1% and 0–10%, respectively, which were also correlated with post surgery chemotherapy response [83]. In particular, low- and high-risk patients were significantly correlated with the “proliferative, sensitive to chemotherapy” and “mesenchymal, chemoresistance” subtypes of HGSOC, respectively. It has been established that it is rapidly dividing cells that are sensitive to chemotherapy, which explains the resistance to chemotherapy of a mesenchymal-type tumor with signs of stemness, in contrast to a proliferative-type tumor with a good response to chemotherapy [66,84,85,86,87]. In the present study, we divided the HGSOC samples into two subtypes according to the content of miR-16-5p (from mir-15 family), miR-17-5p and miR-20a-5p (from the miR-17/92 cluster of the mir-17 family), and miR-93-5p (from the miR-106b/25 cluster of the mir-17 family) circulating in the blood plasma of patients. The participation of these miRNAs in the induction of EMT was revealed, in particular, by targeting RUNX3 [52], by the silencing of CYB7B1 [88], through the PTEN/Akt pathway [59,89] and by downregulating Smad4 [55].
Our data are in good agreement with those of other colleagues who showed increased levels of miR-20a-5p, miR-16-5p and miR-93-5p in serous ovarian cancer tissues compared with the corresponding normal tissues [28,90], upregulated miR-16-5p and miR-17-5p in the peripheral blood lymphocytes of patients with ovarian cancer [91], and upregulated miR-93-5p in the serum of patients with SOC [92]. The overexpression of miR-19a and miR-19b-1, the key oncogenic components of the miR-17-92 cluster, triggers the EMT of lung cancer cells, providing cancer invasion and metastatic dissemination, the resistance of tumor cells to radiotherapy and chemotherapy, and apoptosis, associated with poor prognosis of cancer patients [58]. The authors of this article underline that the upregulation of cell proliferation is important for the initiation and maintenance of primary tumors, but during EMT, the proliferative rates of tumor cells decrease to enable them to reach their new destinations.
The identification of miR-16-5p, miR-17-5p, miR-20a-5p and miR-93-5p in blood plasma, elevated in suboptimally versus optimally cytoreduced patients, their increased HGSOC tissue expression level and the association with the mesenchymal tumor type make it reasonable to speculate that a changed level of these miRNAs in blood plasma reflects the biological characteristics of the tumor tissue itself. Jaynish S. Shah with colleagues proposed a combination of miR-34a-5p and CA125 levels to classify women with an optimal or suboptimal cytoreduction with an AUC of 0.818 and an accuracy of 0.786 [93]. However, according to the authors of the study themselves, the elevated miR-34a-5p in the blood plasma of suboptimally cytoreduced patients did not originate from the tumor tissue itself but may reflect a systemic inflammatory response to the pattern of spread of HGSOC. Consistent with our NGS data, miR-34a-5p did not significantly differentiate BSC and SBT from HGSOC (p = 0.449, data are not shown). That is why we did not validate this miRNA by RT-PCR in tissue and plasma samples.
We also observed statistically significant differences between the two molecular subtypes of HGSOC in terms of tumor size, where a smaller tumor volume was characteristic of progesterone receptor-negative HGSOC, with increased levels of extracellular miR-16-5p, miR-17-5p, miR-93-5p and miR-20a-5p, and with more aggressive tumor behavior responsible for the failure of optimal surgical resection in most cases. In addition, in our study, HGSOC patient groups (PGR-positive and PGR-negative tumors) significantly differed by the serum CA125 levels, with a more pronounced increase in CA125 in the group of patients with a high level of expression of the PGR in the tumor. Our data reflect the proven relationship between CA125 and tumor cell invasiveness through binding with E-cadherin and β-catenin complexes, and in the case of the downregulation of cell-surface CA125/MUC16, EMT is promoted [94]. In light of this fact, it is not excluded that the possibility of increased EMT under decreased CA125 and the upregulation of miR-16-5p, miR-17-5p, miR-93-5p and miR-20a-5p in the case of PGR-negative HGSOC results in a smaller tumor size, unresectable tumor and worse survival compared to PGR-positive HGSOC. According to a systematic review and meta-analysis, the high expression of circulating miR-20a is a risk factor for unfavorable prognosis for patients with cancers [95]. It was demonstrated that an increased expression of miR-20a could promote the activation of the NFκB pathway by targeting NFKBIB (alternative name IκBβ) and result in the increased expression of p65, livin and survivin, which potentially contribute to a decrease in the gastric cancer cell apoptosis induced by cisplatin and chemoresistance [96]. The other members of the miR-17/92 cluster have also been associated with an unfavorable prognosis and reduced overall survival [97,98,99,100]. In our study, complete cytoreduction and responsiveness to chemotherapy was observed in HGSOC patients with reduced plasma levels of miR-20a-5p and miR-17-5p relative to controls. On the contrary, a pronounced increased level of miR-20a-5p and miR-17-5p in patients with HGSOC in blood plasma relative to the control was associated with the inability to carry out a complete cytoreduction and with an incomplete response to chemotherapy.
In the present study, we found that two molecular subtypes of HGSOC, with increased and decreased levels of secretion miR-16-5p, miR-17-5p, miR-93-5p and miR-20a-5p, are characterized by the absence or presence of progesterone receptor expression, respectively. Moreover, statistically significant inverse correlations of the expression level of the progesterone receptor in the HGSOC tissue with the level of circulating miR-17-5p (r = −0.46, p = 0.043) and miR-16-5p (r = −0.49, p = 0.0282) were estimated. Although miR-16-5p, miR-17-5p, miR-93-5p and miR-20a-5p do not directly regulate the level of the PGR, their experimentally proven target genes are transcription factors binding to promoter/enhancer sites of the PGR gene, according to the MiRTargetLink database. In addition, the common target for all four miRNAs is found to be the homeobox protein PKNOX1 gene. PKNOX1 (alternative name is PREP1) is a tumor suppressor gene that is linked to the definition of DNA replication timing of a significant portion of the genome and prevents DNA damage [101]. Unlike normal human tissues expressing PREP1, the vast majority of human cancers lack PREP1 and are characterized by genomic instability and DNA damage [102,103]. Thus, the elevated secretion of miR-17-5p, miR-20a-5p, miR-93-5p and miR-16-5p by HGSOC tissue, associated with high tumor invasiveness and low probability of optimal cytoreduction, may reflect DNA instability and damage in tumor tissue and provide the PGR-negative phenotype of HGSOC.
The PGR has a crucial role in protecting against the occurrence of ovarian cancer by clearance of p53-defective lesions through the TNF-a/RIPK1/RIPK3/MLKL pathway, inducing cell necroptosis [104]. It is believed that HGSOC, in contrast to other ovarian cancer subtypes, originates predominantly from serous tubal intraepithelial carcinomas (STICs) possessing TP53 mutations and showing little to no proliferative activity under the PGR regulation of DREAM complex genes, repressing 900 cell cycle genes [51]. Whether the transition from “dormant” STICs with low proliferation to “active” STICs with high proliferation, able to shed and disseminate, is accompanied by a change in PGR signaling is not known. However, according to the western blot analyses carried out by Mauro L.J. and colleagues, all analyzed normal human fallopian tube tissues have a robust expression of both PGR isoforms; PGR staining was observed in STICs, and this expression was retained in invasive HGSC tissue, but only ~35% of metastatic HGSC tumors expressed abundant progesterone receptors [51]. This is consistent with the data of Tone A.A. et al. [105], which demonstrated a strong downregulation of PGR expression in HGSOC, with >10% positivity for PR-A and PR-B in 20% and 25% of all HGSOC cases, respectively. In our HGSOC patient cohort, 6/20 (30%) showed an Allred score ≥ 3 and were considered positive for PGR-A/B. Since the level of the PGR expression was found to be different in the two subtypes of HGSOC we identified, and PGR level was associated with a certain miRNA signature, the possibility of optimal cytoreduction, and sensitivity to chemotherapy, larger studies are needed to confirm/refute these relationships.

5. Conclusions

To date, there is no clinically applicable biomarker that can predict suboptimal cytoreduction. The search for such biomarkers is very important for the HGSOC patient because, in the case where primary complete cytoreduction cannot be achieved due to difficulty in resecting tumors that have invaded vital organs, patients are more likely to benefit from neoadjuvant chemotherapy to reduce the tumor burden and increase the chances of achieving complete interval cytoreduction surgery. We found that the combined determination of the level of circulating miR-16-5p, miR-17-5p, miR-20a-5p and miR-93-5p circulating in blood plasma in patients with primary HGSOC tumors makes it possible to predict optimal cytoreduction with 80.1% sensitivity and 70% specificity (p = 0.022, TPR = 0.8, FPR = 0.3). Closer examination of the molecules, in particular, circulating miRNAs, that have already been identified in association with the mesenchymal subtype of HGSOC and poor overall survival [7,106,107,108,109], in addition to our results, may reveal important information about the biology of unresectable HGSOC and can make a significant contribution to the creation of a test system for predicting suboptimal cytoreduction.

Supplementary Materials

The following supporting information can be downloaded at: https://www.mdpi.com/article/10.3390/life12122017/s1, Table S1: NGS data on read counts of miRNAs in tumor tissues.

Author Contributions

Conceptualization, A.V.T.; methodology, A.V.T., A.V.A. and V.V.C.; software, V.V.C.; validation, V.V.C. and I.S.F.; formal analysis, M.V.S.; investigation, A.V.T.; resources, G.N.K.; data curation, V.E.F.; writing—original draft preparation, A.V.T.; writing—review and editing, A.V.A., A.V.T., and V.E.F.; visualization, A.V.A. and I.S.F.; supervision, G.T.S.; project administration, V.E.F.; funding acquisition, V.E.F. All authors have read and agreed to the published version of the manuscript.

Funding

This research was funded by the Russian Science Foundation (RSF) grant «Development of a method for differential diagnosis of ovarian masses by high resolution mass spectrometry», grant number 20-65-46014.

Institutional Review Board Statement

All patients signed an informed consent to participate in the study, approved by the Ethics Committee of the NMRC for OGP (Protocol No. 10 of 05 December 2019). We confirm that the study was conducted in accordance with the ethical standards of the institutional research committee, the Federal Laws of the Russian Federation (No 152, 323, 1,130 etc.,) and with the 1964 Helsinki Declaration.

Informed Consent Statement

Informed consent was obtained from all subjects involved in the study.

Data Availability Statement

Not applicable.

Conflicts of Interest

The authors declare no conflict of interest.

References

  1. Reid, B.M.; Permuth, J.B.; Sellers, T.A. Epidemiology of ovarian cancer: A review. Cancer Biol. Med. 2017, 14, 9–32. [Google Scholar] [CrossRef] [PubMed] [Green Version]
  2. Seidman, J.D.; Kurman, R.J. Pathology of ovarian carcinoma. Hematol. Oncol. Clin. N. Am. 2003, 17, 909–925. [Google Scholar] [CrossRef] [PubMed]
  3. Shih, I.-M.; Kurman, R.J. Ovarian tumorigenesis: A proposed model based on morphological and molecular genetic analysis. Am. J. Pathol. 2004, 164, 1511–1518. [Google Scholar] [CrossRef]
  4. Levanon, K.; Crum, C.; Drapkin, R. New insights into the pathogenesis of serous ovarian cancer and its clinical impact. J. Clin. Oncol. Off. J. Am. Soc. Clin. Oncol. 2008, 26, 5284–5293. [Google Scholar] [CrossRef] [Green Version]
  5. Integrated genomic analyses of ovarian carcinoma. Nature 2011, 474, 609–615. [CrossRef] [PubMed] [Green Version]
  6. Kanchi, K.L.; Johnson, K.J.; Lu, C.; McLellan, M.D.; Leiserson, M.D.M.; Wendl, M.C.; Zhang, Q.; Koboldt, D.C.; Xie, M.; Kandoth, C.; et al. Integrated analysis of germline and somatic variants in ovarian cancer. Nat. Commun. 2014, 5, 3156. [Google Scholar] [CrossRef] [Green Version]
  7. Yang, D.; Sun, Y.; Hu, L.; Zheng, H.; Ji, P.; Pecot, C.V.; Zhao, Y.; Reynolds, S.; Cheng, H.; Rupaimoole, R.; et al. Integrated analyses identify a master microRNA regulatory network for the mesenchymal subtype in serous ovarian cancer. Cancer Cell 2013, 23, 186–199. [Google Scholar] [CrossRef] [Green Version]
  8. Song, X.; Ji, J.; Gleason, K.J.; Yang, F.; Martignetti, J.A.; Chen, L.S.; Wang, P. Insights into Impact of DNA Copy Number Alteration and Methylation on the Proteogenomic Landscape of Human Ovarian Cancer via a Multi-omics Integrative Analysis. Mol. Cell. Proteomics 2019, 18, S52–S65. [Google Scholar] [CrossRef] [Green Version]
  9. Wrzeszczynski, K.O.; Varadan, V.; Byrnes, J.; Lum, E.; Kamalakaran, S.; Levine, D.A.; Dimitrova, N.; Zhang, M.Q.; Lucito, R. Identification of tumor suppressors and oncogenes from genomic and epigenetic features in ovarian cancer. PLoS ONE 2011, 6, e28503. [Google Scholar] [CrossRef]
  10. Garziera, M.; Cecchin, E.; Canzonieri, V.; Sorio, R.; Giorda, G.; Scalone, S.; De Mattia, E.; Roncato, R.; Gagno, S.; Poletto, E.; et al. Identification of Novel Somatic TP53 Mutations in Patients with High-Grade Serous Ovarian Cancer (HGSOC) Using Next-Generation Sequencing (NGS). Int. J. Mol. Sci. 2018, 19, 1510. [Google Scholar] [CrossRef]
  11. Jones, S.; Wang, T.-L.; Kurman, R.J.; Nakayama, K.; Velculescu, V.E.; Vogelstein, B.; Kinzler, K.W.; Papadopoulos, N.; Shih, I.-M. Low-grade serous carcinomas of the ovary contain very few point mutations. J. Pathol. 2012, 226, 413–420. [Google Scholar] [CrossRef] [PubMed] [Green Version]
  12. Dey, P.; Nakayama, K.; Razia, S.; Ishikawa, M.; Ishibashi, T.; Yamashita, H.; Kanno, K.; Sato, S.; Kiyono, T.; Kyo, S. Development of Low-Grade Serous Ovarian Carcinoma from Benign Ovarian Serous Cystadenoma Cells. Cancers 2022, 14, 1506. [Google Scholar] [CrossRef] [PubMed]
  13. Sturgeon, C.M.; Duffy, M.J.; Stenman, U.-H.; Lilja, H.; Brünner, N.; Chan, D.W.; Babaian, R.; Bast, R.C.J.; Dowell, B.; Esteva, F.J.; et al. National Academy of Clinical Biochemistry laboratory medicine practice guidelines for use of tumor markers in testicular, prostate, colorectal, breast, and ovarian cancers. Clin. Chem. 2008, 54, e11–e79. [Google Scholar] [CrossRef] [PubMed] [Green Version]
  14. Einhorn, N.; Sjövall, K.; Knapp, R.C.; Hall, P.; Scully, R.E.; Bast, R.C.J.; Zurawski, V.R.J. Prospective evaluation of serum CA 125 levels for early detection of ovarian cancer. Obstet. Gynecol. 1992, 80, 14–18. [Google Scholar] [CrossRef] [PubMed]
  15. Gerstein, M. Genomics: ENCODE leads the way on big data. Nature 2012, 489, 208. [Google Scholar] [CrossRef] [Green Version]
  16. Sayed, D.; Abdellatif, M. MicroRNAs in development and disease. Physiol. Rev. 2011, 91, 827–887. [Google Scholar] [CrossRef]
  17. Calin, G.A.; Croce, C.M. MicroRNA signatures in human cancers. Nat. Rev. Cancer 2006, 6, 857–866. [Google Scholar] [CrossRef]
  18. Wang, F.; Song, X.; Li, X.; Xin, J.; Wang, S.; Yang, W.; Wang, J.; Wu, K.; Chen, X.; Liang, J.; et al. Noninvasive visualization of microRNA-16 in the chemoresistance of gastric cancer using a dual reporter gene imaging system. PLoS ONE 2013, 8, e61792. [Google Scholar] [CrossRef] [Green Version]
  19. Petrick, J.L.; Pfeiffer, R.M.; Liao, L.M.; Abnet, C.C.; Wu, X.; Gammon, M.D.; Vaughan, T.L.; Cook, M.B. Circulating MicroRNAs in Relation to Esophageal Adenocarcinoma Diagnosis and Survival. Dig. Dis. Sci. 2021, 66, 3831–3841. [Google Scholar] [CrossRef]
  20. Gatto, L.; Franceschi, E.; Di Nunno, V.; Tosoni, A.; Lodi, R.; Brandes, A.A. Liquid Biopsy in Glioblastoma Management: From Current Research to Future Perspectives. Oncologist 2021, 26, 865–878. [Google Scholar] [CrossRef]
  21. Van Laar, R.; King, S.; McCoy, R.; Saad, M.; Fereday, S.; Winship, I.; Uzzell, C.; Landgren, A. Translation of a circulating miRNA signature of melanoma into a solid tissue assay to improve diagnostic accuracy and precision. Biomark. Med. 2021, 15, 1111–1122. [Google Scholar] [CrossRef] [PubMed]
  22. Izumi, D.; Zhu, Z.; Chen, Y.; Toden, S.; Huo, X.; Kanda, M.; Ishimoto, T.; Gu, D.; Tan, M.; Kodera, Y.; et al. Assessment of the Diagnostic Efficiency of a Liquid Biopsy Assay for Early Detection of Gastric Cancer. JAMA Netw. Open 2021, 4, e2121129. [Google Scholar] [CrossRef] [PubMed]
  23. Abe, S.; Matsuzaki, J.; Sudo, K.; Oda, I.; Katai, H.; Kato, K.; Takizawa, S.; Sakamoto, H.; Takeshita, F.; Niida, S.; et al. A novel combination of serum microRNAs for the detection of early gastric cancer. Gastric Cancer 2021, 24, 835–843. [Google Scholar] [CrossRef] [PubMed]
  24. Ueta, E.; Tsutsumi, K.; Kato, H.; Matsushita, H.; Shiraha, H.; Fujii, M.; Matsumoto, K.; Horiguchi, S.; Okada, H. Extracellular vesicle-shuttled miRNAs as a diagnostic and prognostic biomarker and their potential roles in gallbladder cancer patients. Sci. Rep. 2021, 11, 12298. [Google Scholar] [CrossRef]
  25. Dahiya, N.; Sherman-Baust, C.A.; Wang, T.-L.; Davidson, B.; Shih, I.-M.; Zhang, Y.; Wood, W., 3rd; Becker, K.G.; Morin, P.J. MicroRNA expression and identification of putative miRNA targets in ovarian cancer. PLoS ONE 2008, 3, e2436. [Google Scholar] [CrossRef] [Green Version]
  26. Iorio, M.V.; Visone, R.; Di Leva, G.; Donati, V.; Petrocca, F.; Casalini, P.; Taccioli, C.; Volinia, S.; Liu, C.-G.; Alder, H.; et al. MicroRNA signatures in human ovarian cancer. Cancer Res. 2007, 67, 8699–8707. [Google Scholar] [CrossRef] [Green Version]
  27. Zhang, L.; Volinia, S.; Bonome, T.; Calin, G.A.; Greshock, J.; Yang, N.; Liu, C.-G.; Giannakakis, A.; Alexiou, P.; Hasegawa, K.; et al. Genomic and epigenetic alterations deregulate microRNA expression in human epithelial ovarian cancer. Proc. Natl. Acad. Sci. USA 2008, 105, 7004–7009. [Google Scholar] [CrossRef] [Green Version]
  28. Wyman, S.K.; Parkin, R.K.; Mitchell, P.S.; Fritz, B.R.; O’Briant, K.; Godwin, A.K.; Urban, N.; Drescher, C.W.; Knudsen, B.S.; Tewari, M. Repertoire of microRNAs in epithelial ovarian cancer as determined by next generation sequencing of small RNA cDNA libraries. PLoS ONE 2009, 4, e5311. [Google Scholar] [CrossRef] [Green Version]
  29. Prat, J. Pathology of cancers of the female genital tract. Int. J. Gynaecol. Obstet. 2015, 131, S132–S145. [Google Scholar] [CrossRef] [Green Version]
  30. Perets, R.; Wyant, G.A.; Muto, K.W.; Bijron, J.G.; Poole, B.B.; Chin, K.T.; Chen, J.Y.H.; Ohman, A.W.; Stepule, C.D.; Kwak, S.; et al. Transformation of the fallopian tube secretory epithelium leads to high-grade serous ovarian cancer in Brca;Tp53;Pten models. Cancer Cell 2013, 24, 751–765. [Google Scholar] [CrossRef]
  31. Poole, E.M.; Rice, M.S.; Crum, C.P.; Tworoger, S.S. Salpingectomy as a potential ovarian cancer risk-reducing procedure. J. Natl. Cancer Inst. 2015, 107. [Google Scholar] [CrossRef] [PubMed] [Green Version]
  32. Koshiyama, M.; Matsumura, N.; Konishi, I. Recent concepts of ovarian carcinogenesis: Type I and type II. BioMed Res. Int. 2014, 2014, 934261. [Google Scholar] [CrossRef] [PubMed] [Green Version]
  33. Langmead, B.; Trapnell, C.; Pop, M.; Salzberg, S.L. Ultrafast and memory-efficient alignment of short DNA sequences to the human genome. Genome Biol. 2009, 10, R25. [Google Scholar] [CrossRef] [Green Version]
  34. Team, R.C. A Language and Environment for Statistical Computing; R Foundation for Statistical Computing: Vienna, Austria, 2021; Available online: https://www.r-project.org (accessed on 10 March 2021).
  35. Love, M.I.; Huber, W.; Anders, S. Moderated estimation of fold change and dispersion for RNA-seq data with DESeq2. Genome Biol. 2014, 15, 550. [Google Scholar] [CrossRef] [PubMed] [Green Version]
  36. Daltoé, R.D.; Madeira, K.P.; de Carvalho, A.A.; de Rezende, L.C.D.; Silva, I.V.; Rangel, L.B.A. Evaluation of the progesterone receptor status in breast cancer using three different antibodies: A comparison by Allred score system. Int. J. Clin. Exp. Pathol. 2014, 7, 331–339. [Google Scholar]
  37. R Team. RStudio: Integrated Development for R. RStudio. Available online: http://www.rstudio.com/ (accessed on 23 March 2021).
  38. Mutch, D.G.; Prat, J. 2014 FIGO staging for ovarian, fallopian tube and peritoneal cancer. Gynecol. Oncol. 2014, 133, 401–404. [Google Scholar] [CrossRef] [PubMed]
  39. Carcangiu Kurman, R.J.; Carcangiu, M.L.; Herrington, C.; Simon, M.L. WHO Classification of Tumours of Female Reproductive Organs. 2014. Available online: https://publications.iarc.fr/Book-And-Report-Series/Who-Classification-Of-Tumours/WHO-Classification-Of-Tumours-Of-Female-Reproductive-Organs-2014 (accessed on 5 May 2022).
  40. Yang, Y.-M.; Yang, W.-X. Epithelial-to-mesenchymal transition in the development of endometriosis. Oncotarget 2017, 8, 41679–41689. [Google Scholar] [CrossRef] [PubMed] [Green Version]
  41. Nick, A.M.; Coleman, R.L.; Ramirez, P.T.; Sood, A.K. A framework for a personalized surgical approach to ovarian cancer. Nat. Rev. Clin. Oncol. 2015, 12, 239–245. [Google Scholar] [CrossRef] [PubMed] [Green Version]
  42. Schorge, J.O.; McCann, C.; Del Carmen, M.G. Surgical debulking of ovarian cancer: What difference does it make? Rev. Obstet. Gynecol. 2010, 3, 111–117. [Google Scholar]
  43. Borley, J.; Wilhelm-Benartzi, C.; Brown, R.; Ghaem-Maghami, S. Does tumour biology determine surgical success in the treatment of epithelial ovarian cancer? A systematic literature review. Br. J. Cancer 2012, 107, 1069–1074. [Google Scholar] [CrossRef] [Green Version]
  44. van Driel, W.J.; Koole, S.N.; Sikorska, K.; Schagen van Leeuwen, J.H.; Schreuder, H.W.R.; Hermans, R.H.M.; de Hingh, I.H.J.T.; van der Velden, J.; Arts, H.J.; Massuger, L.F.A.G.; et al. Hyperthermic Intraperitoneal Chemotherapy in Ovarian Cancer. N. Engl. J. Med. 2018, 378, 230–240. [Google Scholar] [CrossRef] [PubMed]
  45. Caratozzolo, M.F.; Micale, L.; Turturo, M.G.; Cornacchia, S.; Fusco, C.; Marzano, F.; Augello, B.; D’Erchia, A.M.; Guerrini, L.; Pesole, G.; et al. TRIM8 modulates p53 activity to dictate cell cycle arrest. Cell Cycle 2012, 11, 511–523. [Google Scholar] [CrossRef] [PubMed] [Green Version]
  46. Vogelstein, B.; Lane, D.; Levine, A.J. Surfing the p53 network. Nature 2000, 408, 307–310. [Google Scholar] [CrossRef] [PubMed]
  47. Lane, D.; Levine, A. p53 Research: The past thirty years and the next thirty years. Cold Spring Harb. Perspect. Biol. 2010, 2, a000893. [Google Scholar] [CrossRef] [PubMed] [Green Version]
  48. Riley, T.; Sontag, E.; Chen, P.; Levine, A. Transcriptional control of human p53-regulated genes. Nat. Rev. Mol. Cell Biol. 2008, 9, 402–412. [Google Scholar] [CrossRef]
  49. Mastropasqua, F.; Marzano, F.; Valletti, A.; Aiello, I.; Di Tullio, G.; Morgano, A.; Liuni, S.; Ranieri, E.; Guerrini, L.; Gasparre, G.; et al. TRIM8 restores p53 tumour suppressor function by blunting N-MYC activity in chemo-resistant tumours. Mol. Cancer 2017, 16, 67. [Google Scholar] [CrossRef] [Green Version]
  50. Wang, Z.; Ji, F. Downregulation of microRNA-17-5p inhibits drug resistance of gastric cancer cells partially through targeting p21. Oncol. Lett. 2018, 15, 4585–4591. [Google Scholar] [CrossRef] [Green Version]
  51. Mauro, L.J.; Seibel, M.I.; Diep, C.H.; Spartz, A.; Perez Kerkvliet, C.; Singhal, H.; Swisher, E.M.; Schwartz, L.E.; Drapkin, R.; Saini, S.; et al. Progesterone Receptors Promote Quiescence and Ovarian Cancer Cell Phenotypes via DREAM in p53-Mutant Fallopian Tube Models. J. Clin. Endocrinol. Metab. 2021, 106, 1929–1955. [Google Scholar] [CrossRef]
  52. Wang, X.; Wei, P.; Yang, L.; Liu, F.; Tong, X.; Yang, X.; Su, L. MicroRNA-20a-5p regulates the epithelial-mesenchymal transition of human hepatocellular carcinoma by targeting RUNX3. Chin. Med. J. 2022, 135, 2089–2097. [Google Scholar] [CrossRef]
  53. Tanaka, S.; Shiraha, H.; Nakanishi, Y.; Nishina, S.-I.; Matsubara, M.; Horiguchi, S.; Takaoka, N.; Iwamuro, M.; Kataoka, J.; Kuwaki, K.; et al. Runt-related transcription factor 3 reverses epithelial-mesenchymal transition in hepatocellular carcinoma. Int. J. Cancer 2012, 131, 2537–2546. [Google Scholar] [CrossRef] [Green Version]
  54. Xiao, Z.; Tian, Y.; Jia, Y.; Shen, Q.; Jiang, W.; Chen, G.; Shang, B.; Shi, M.; Wang, Z.; Zhao, X. RUNX3 inhibits the invasion and migration of esophageal squamous cell carcinoma by reversing the epithelial-mesenchymal transition through TGF-β/Smad signaling. Oncol. Rep. 2020, 43, 1289–1299. [Google Scholar] [CrossRef] [PubMed]
  55. Cheng, D.; Zhao, S.; Tang, H.; Zhang, D.; Sun, H.; Yu, F.; Jiang, W.; Yue, B.; Wang, J.; Zhang, M.; et al. MicroRNA-20a-5p promotes colorectal cancer invasion and metastasis by downregulating Smad4. Oncotarget 2016, 7, 45199–45213. [Google Scholar] [CrossRef] [PubMed]
  56. Zhang, B.; Halder, S.K.; Kashikar, N.D.; Cho, Y.-J.; Datta, A.; Gorden, D.L.; Datta, P.K. Antimetastatic role of Smad4 signaling in colorectal cancer. Gastroenterology 2010, 138, 963–969. [Google Scholar] [CrossRef] [PubMed] [Green Version]
  57. Park, J.W.; Jang, S.H.; Park, D.M.; Lim, N.J.; Deng, C.; Kim, D.Y.; Green, J.E.; Kim, H.K. Cooperativity of E-cadherin and Smad4 loss to promote diffuse-type gastric adenocarcinoma and metastasis. Mol. Cancer Res. 2014, 12, 1088–1099. [Google Scholar] [CrossRef] [Green Version]
  58. Li, J.; Yang, S.; Yan, W.; Yang, J.; Qin, Y.-J.; Lin, X.-L.; Xie, R.-Y.; Wang, S.-C.; Jin, W.; Gao, F.; et al. MicroRNA-19 triggers epithelial-mesenchymal transition of lung cancer cells accompanied by growth inhibition. Lab. Investig. 2015, 95, 1056–1070. [Google Scholar] [CrossRef] [Green Version]
  59. Bao, C.; Liu, T.; Qian, L.; Xiao, C.; Zhou, X.; Ai, H.; Wang, J.; Fan, W.; Pan, J. Shikonin inhibits migration and invasion of triple-negative breast cancer cells by suppressing epithelial-mesenchymal transition via miR-17-5p/PTEN/Akt pathway. J. Cancer 2021, 12, 76–88. [Google Scholar] [CrossRef]
  60. Khanbabaei, H.; Ebrahimi, S.; García-Rodríguez, J.L.; Ghasemi, Z.; Pourghadamyari, H.; Mohammadi, M.; Kristensen, L.S. Non-coding RNAs and epithelial mesenchymal transition in cancer: Molecular mechanisms and clinical implications. J. Exp. Clin. Cancer Res. 2022, 41, 278. [Google Scholar] [CrossRef]
  61. Thiery, J.P.; Sleeman, J.P. Complex networks orchestrate epithelial-mesenchymal transitions. Nat. Rev. Mol. Cell Biol. 2006, 7, 131–142. [Google Scholar] [CrossRef]
  62. Evdokimova, V.; Tognon, C.; Ng, T.; Sorensen, P.H.B. Reduced proliferation and enhanced migration: Two sides of the same coin? Molecular mechanisms of metastatic progression by YB-1. Cell Cycle 2009, 8, 2901–2906. [Google Scholar] [CrossRef]
  63. Polyak, K.; Weinberg, R.A. Transitions between epithelial and mesenchymal states: Acquisition of malignant and stem cell traits. Nat. Rev. Cancer 2009, 9, 265–273. [Google Scholar] [CrossRef]
  64. Zhou, Z.; Wang, X.; Ren, X.; Zhou, L.; Wang, N.; Kang, H. Disease Burden and Attributable Risk Factors of Ovarian Cancer From 1990 to 2017: Findings From the Global Burden of Disease Study 2017. Front. Public Health 2021, 9, 619581. [Google Scholar] [CrossRef] [PubMed]
  65. Fabbro, M.; Colombo, P.-E.; Leaha, C.M.; Rouanet, P.; Carrère, S.; Quenet, F.; Gutowski, M.; Mourregot, A.; D’Hondt, V.; Coupier, I.; et al. Conditional Probability of Survival and Prognostic Factors in Long-Term Survivors of High-Grade Serous Ovarian Cancer. Cancers 2020, 12, 2184. [Google Scholar] [CrossRef] [PubMed]
  66. Bowtell, D.D.; Böhm, S.; Ahmed, A.A.; Aspuria, P.-J.; Bast, R.C.J.; Beral, V.; Berek, J.S.; Birrer, M.J.; Blagden, S.; Bookman, M.A.; et al. Rethinking ovarian cancer II: Reducing mortality from high-grade serous ovarian cancer. Nat. Rev. Cancer 2015, 15, 668–679. [Google Scholar] [CrossRef] [PubMed] [Green Version]
  67. Kurman, R.J. WHO classification of tumours of female reproductive organs. In World Health Organization Classification of Tumours, 4th ed.; International Agency for Research on Cancer: Lyon, France, 2014; ISBN 9789283224358. [Google Scholar]
  68. Kuhn, E.; Kurman, R.J.; Vang, R.; Sehdev, A.S.; Han, G.; Soslow, R.; Wang, T.-L.; Shih, I.-M. TP53 mutations in serous tubal intraepithelial carcinoma and concurrent pelvic high-grade serous carcinoma—Evidence supporting the clonal relationship of the two lesions. J. Pathol. 2012, 226, 421–426. [Google Scholar] [CrossRef] [Green Version]
  69. Chen, F.; Gaitskell, K.; Garcia, M.J.; Albukhari, A.; Tsaltas, J.; Ahmed, A.A. Serous tubal intraepithelial carcinomas associated with high-grade serous ovarian carcinomas: A systematic review. BJOG Int. J. Obstet. Gynaecol. 2017, 124, 872–878. [Google Scholar] [CrossRef] [Green Version]
  70. Cheng, E.J.; Kurman, R.J.; Wang, M.; Oldt, R.; Wang, B.G.; Berman, D.M.; Shih, I.-M. Molecular genetic analysis of ovarian serous cystadenomas. Lab. Investig. 2004, 84, 778–784. [Google Scholar] [CrossRef] [Green Version]
  71. Kurman, R.J.; Vang, R.; Junge, J.; Hannibal, C.G.; Kjaer, S.K.; Shih, I.-M. Papillary tubal hyperplasia: The putative precursor of ovarian atypical proliferative (borderline) serous tumors, noninvasive implants, and endosalpingiosis. Am. J. Surg. Pathol. 2011, 35, 1605–1614. [Google Scholar] [CrossRef] [Green Version]
  72. Vang, R.; Shih, I.-M.; Kurman, R.J. Fallopian tube precursors of ovarian low- and high-grade serous neoplasms. Histopathology 2013, 62, 44–58. [Google Scholar] [CrossRef]
  73. Wolsky, R.J.; Price, M.A.; Zaloudek, C.J.; Rabban, J.T. Mucosal Proliferations in Completely Examined Fallopian Tubes Accompanying Ovarian Low-grade Serous Tumors: Neoplastic Precursor Lesions or Normal Variants of Benign Mucosa? Int. J. Gynecol. Pathol. 2018, 37, 262–274. [Google Scholar] [CrossRef]
  74. Liu, Z.; Beach, J.A.; Agadjanian, H.; Jia, D.; Aspuria, P.-J.; Karlan, B.Y.; Orsulic, S. Suboptimal cytoreduction in ovarian carcinoma is associated with molecular pathways characteristic of increased stromal activation. Gynecol. Oncol. 2015, 139, 394–400. [Google Scholar] [CrossRef] [Green Version]
  75. Riester, M.; Wei, W.; Waldron, L.; Culhane, A.C.; Trippa, L.; Oliva, E.; Kim, S.-H.; Michor, F.; Huttenhower, C.; Parmigiani, G.; et al. Risk prediction for late-stage ovarian cancer by meta-analysis of 1525 patient samples. J. Natl. Cancer Inst. 2014, 106, dju048. [Google Scholar] [CrossRef] [PubMed] [Green Version]
  76. Tucker, S.L.; Gharpure, K.; Herbrich, S.M.; Unruh, A.K.; Nick, A.M.; Crane, E.K.; Coleman, R.L.; Guenthoer, J.; Dalton, H.J.; Wu, S.Y.; et al. Molecular biomarkers of residual disease after surgical debulking of high-grade serous ovarian cancer. Clin. Cancer Res. 2014, 20, 3280–3288. [Google Scholar] [CrossRef] [PubMed]
  77. Ryner, L.; Guan, Y.; Firestein, R.; Xiao, Y.; Choi, Y.; Rabe, C.; Lu, S.; Fuentes, E.; Huw, L.-Y.; Lackner, M.R.; et al. Upregulation of Periostin and Reactive Stroma Is Associated with Primary Chemoresistance and Predicts Clinical Outcomes in Epithelial Ovarian Cancer. Clin. Cancer Res. 2015, 21, 2941–2951. [Google Scholar] [CrossRef] [PubMed] [Green Version]
  78. Wittmann, J.; Jäck, H.-M. Serum microRNAs as powerful cancer biomarkers. Biochim. Biophys. Acta 2010, 1806, 200–207. [Google Scholar] [CrossRef] [PubMed]
  79. Shih, K.K.; Qin, L.-X.; Tanner, E.J.; Zhou, Q.; Bisogna, M.; Dao, F.; Olvera, N.; Viale, A.; Barakat, R.R.; Levine, D.A. A microRNA survival signature (MiSS) for advanced ovarian cancer. Gynecol. Oncol. 2011, 121, 444–450. [Google Scholar] [CrossRef]
  80. Tang, Z.; Ow, G.S.; Thiery, J.P.; Ivshina, A.V.; Kuznetsov, V.A. Meta-analysis of transcriptome reveals let-7b as an unfavorable prognostic biomarker and predicts molecular and clinical subclasses in high-grade serous ovarian carcinoma. Int. J. Cancer 2014, 134, 306–318. [Google Scholar] [CrossRef]
  81. Bhaskaran, M.; Mohan, M. MicroRNAs: History, biogenesis, and their evolving role in animal development and disease. Vet. Pathol. 2014, 51, 759–774. [Google Scholar] [CrossRef] [Green Version]
  82. Bartel, D.P. MicroRNAs: Genomics, biogenesis, mechanism, and function. Cell 2004, 116, 281–297. [Google Scholar] [CrossRef] [Green Version]
  83. Kuznetsov, V.A.; Tang, Z.; Ivshina, A. V Identification of common oncogenic and early developmental pathways in the ovarian carcinomas controlling by distinct prognostically significant microRNA subsets. BMC Genom. 2017, 18, 692. [Google Scholar] [CrossRef] [Green Version]
  84. Ahmed, N.; Abubaker, K.; Findlay, J.; Quinn, M. Epithelial mesenchymal transition and cancer stem cell-like phenotypes facilitate chemoresistance in recurrent ovarian cancer. Curr. Cancer Drug Targets 2010, 10, 268–278. [Google Scholar] [CrossRef]
  85. Marchini, S.; Fruscio, R.; Clivio, L.; Beltrame, L.; Porcu, L.; Fuso Nerini, I.; Cavalieri, D.; Chiorino, G.; Cattoretti, G.; Mangioni, C.; et al. Resistance to platinum-based chemotherapy is associated with epithelial to mesenchymal transition in epithelial ovarian cancer. Eur. J. Cancer 2013, 49, 520–530. [Google Scholar] [CrossRef]
  86. Alvero, A.B.; Chen, R.; Fu, H.-H.; Montagna, M.; Schwartz, P.E.; Rutherford, T.; Silasi, D.-A.; Steffensen, K.D.; Waldstrom, M.; Visintin, I.; et al. Molecular phenotyping of human ovarian cancer stem cells unravels the mechanisms for repair and chemoresistance. Cell Cycle 2009, 8, 158–166. [Google Scholar] [CrossRef] [PubMed]
  87. Yin, G.; Chen, R.; Alvero, A.B.; Fu, H.-H.; Holmberg, J.; Glackin, C.; Rutherford, T.; Mor, G. TWISTing stemness, inflammation and proliferation of epithelial ovarian cancer cells through MIR199A2/214. Oncogene 2010, 29, 3545–3553. [Google Scholar] [CrossRef] [PubMed] [Green Version]
  88. Xi, X.-P.; Zhuang, J.; Teng, M.-J.; Xia, L.-J.; Yang, M.-Y.; Liu, Q.-G.; Chen, J.-B. MicroRNA-17 induces epithelial-mesenchymal transition consistent with the cancer stem cell phenotype by regulating CYP7B1 expression in colon cancer. Int. J. Mol. Med. 2016, 38, 499–506. [Google Scholar] [CrossRef] [PubMed] [Green Version]
  89. Fang, Y.; Xu, C.; Fu, Y. MicroRNA-17-5p induces drug resistance and invasion of ovarian carcinoma cells by targeting PTEN signaling. J. Biol. Res. 2015, 22, 12. [Google Scholar] [CrossRef] [Green Version]
  90. Nam, E.J.; Yoon, H.; Kim, S.W.; Kim, H.; Kim, Y.T.; Kim, J.H.; Kim, J.W.; Kim, S. MicroRNA expression profiles in serous ovarian carcinoma. Clin. Cancer Res. 2008, 14, 2690–2695. [Google Scholar] [CrossRef] [PubMed] [Green Version]
  91. Saral, M.A.; Tuncer, S.B.; Odemis, D.A.; Erdogan, O.S.; Erciyas, S.K.; Saip, P.; Ozel, S.; Yazici, H. New biomarkers in peripheral blood of patients with ovarian cancer: High expression levels of miR-16-5p, miR-17-5p, and miR-638. Arch. Gynecol. Obstet. 2022, 305, 193–201. [Google Scholar] [CrossRef] [PubMed]
  92. Resnick, K.E.; Alder, H.; Hagan, J.P.; Richardson, D.L.; Croce, C.M.; Cohn, D.E. The detection of differentially expressed microRNAs from the serum of ovarian cancer patients using a novel real-time PCR platform. Gynecol. Oncol. 2009, 112, 55–59. [Google Scholar] [CrossRef] [PubMed]
  93. Shah, J.S.; Gard, G.B.; Yang, J.; Maidens, J.; Valmadre, S.; Soon, P.S.; Marsh, D.J. Combining serum microRNA and CA-125 as prognostic indicators of preoperative surgical outcome in women with high-grade serous ovarian cancer. Gynecol. Oncol. 2018, 148, 181–188. [Google Scholar] [CrossRef]
  94. Comamala, M.; Pinard, M.; Thériault, C.; Matte, I.; Albert, A.; Boivin, M.; Beaudin, J.; Piché, A.; Rancourt, C. Downregulation of cell surface CA125/MUC16 induces epithelial-to-mesenchymal transition and restores EGFR signalling in NIH:OVCAR3 ovarian carcinoma cells. Br. J. Cancer 2011, 104, 989–999. [Google Scholar] [CrossRef] [Green Version]
  95. Zhang, Q.; Wang, Q.; Sun, W.; Gao, F.; Liu, L.; Cheng, L.; Li, Z. Change of Circulating and Tissue-Based miR-20a in Human Cancers and Associated Prognostic Implication: A Systematic Review and Meta-Analysis. BioMed Res. Int. 2018, 2018, 6124927. [Google Scholar] [CrossRef] [Green Version]
  96. Du, Y.; Zhu, M.; Zhou, X.; Huang, Z.; Zhu, J.; Xu, J.; Cheng, G.; Shu, Y.; Liu, P.; Zhu, W.; et al. miR-20a enhances cisplatin resistance of human gastric cancer cell line by targeting NFKBIB. Tumour Biol. 2016, 37, 1261–1269. [Google Scholar] [CrossRef] [PubMed]
  97. Wang, Z.; Zhang, J.; Zhang, Z.; Jiang, Y.; Li, M.; Li, Q.; Bai, L.; Yao, D.; Wang, M.; Wang, X. Prognostic value of miR-17-5 p in gastrointestinal cancers: A systematic review and meta-analysis. OncoTargets. Ther. 2018, 11, 5991–5999. [Google Scholar] [CrossRef] [PubMed] [Green Version]
  98. Mogilyansky, E.; Rigoutsos, I. The miR-17/92 cluster: A comprehensive update on its genomics, genetics, functions and increasingly important and numerous roles in health and disease. Cell Death Differ. 2013, 20, 1603–1614. [Google Scholar] [CrossRef] [PubMed]
  99. Xu, X.; Zhu, S.; Tao, Z.; Ye, S. High circulating miR-18a, miR-20a, and miR-92a expression correlates with poor prognosis in patients with non-small cell lung cancer. Cancer Med. 2018, 7, 21–31. [Google Scholar] [CrossRef] [PubMed]
  100. Wang, M.; Gu, H.; Wang, S.; Qian, H.; Zhu, W.; Zhang, L.; Zhao, C.; Tao, Y.; Xu, W. Circulating miR-17-5p and miR-20a: Molecular markers for gastric cancer. Mol. Med. Rep. 2012, 5, 1514–1520. [Google Scholar] [CrossRef]
  101. Palmigiano, A.; Santaniello, F.; Cerutti, A.; Penkov, D.; Purushothaman, D.; Makhija, E.; Luzi, L.; di Fagagna, F.D.; Pelicci, P.G.; Shivashankar, V.; et al. PREP1 tumor suppressor protects the late-replicating DNA by controlling its replication timing and symmetry. Sci. Rep. 2018, 8, 3198. [Google Scholar] [CrossRef] [Green Version]
  102. Longobardi, E.; Iotti, G.; Di Rosa, P.; Mejetta, S.; Bianchi, F.; Fernandez-Diaz, L.C.; Micali, N.; Nuciforo, P.; Lenti, E.; Ponzoni, M.; et al. Prep1 (pKnox1)-deficiency leads to spontaneous tumor development in mice and accelerates EmuMyc lymphomagenesis: A tumor suppressor role for Prep1. Mol. Oncol. 2010, 4, 126–134. [Google Scholar] [CrossRef] [Green Version]
  103. Briu, L.-M.; Maric, C.; Cadoret, J.-C. Replication Stress, Genomic Instability, and Replication Timing: A Complex Relationship. Int. J. Mol. Sci. 2021, 22, 4764. [Google Scholar] [CrossRef]
  104. Wu, N.-Y.; Huang, H.-S.; Chao, T.H.; Chou, H.M.; Fang, C.; Qin, C.-Z.; Lin, C.-Y.; Chu, T.-Y.; Zhou, H.H. Progesterone Prevents High-Grade Serous Ovarian Cancer by Inducing Necroptosis of p53-Defective Fallopian Tube Epithelial Cells. Cell Rep. 2017, 18, 2557–2565. [Google Scholar] [CrossRef] [Green Version]
  105. Tone, A.A.; Virtanen, C.; Shaw, P.A.; Brown, T.J. Decreased progesterone receptor isoform expression in luteal phase fallopian tube epithelium and high-grade serous carcinoma. Endocr. Relat. Cancer 2011, 18, 221–234. [Google Scholar] [CrossRef] [PubMed] [Green Version]
  106. Li, L.; Gu, H.; Chen, L.; Zhu, P.; Zhao, L.; Wang, Y.; Zhao, X.; Zhang, X.; Zhang, Y.; Shu, P. Integrative Network Analysis Reveals a MicroRNA-Based Signature for Prognosis Prediction of Epithelial Ovarian Cancer. BioMed Res. Int. 2019, 2019, 1056431. [Google Scholar] [CrossRef] [PubMed]
  107. Zhao, L.; Wang, W.; Xu, L.; Yi, T.; Zhao, X.; Wei, Y.; Vermeulen, L.; Goel, A.; Zhou, S.; Wang, X. Integrative network biology analysis identifies miR-508-3p as the determinant for the mesenchymal identity and a strong prognostic biomarker of ovarian cancer. Oncogene 2019, 38, 2305–2319. [Google Scholar] [CrossRef] [PubMed] [Green Version]
  108. Yoshida, K.; Yokoi, A.; Matsuzaki, J.; Kato, T.; Ochiya, T.; Kajiyama, H.; Yamamoto, Y. Extracellular microRNA profiling for prognostic prediction in patients with high-grade serous ovarian carcinoma. Cancer Sci. 2021, 112, 4977–4986. [Google Scholar] [CrossRef]
  109. Lopacinska-Jørgensen, J.; Oliveira, D.V.N.P.; Wayne Novotny, G.; Høgdall, C.K.; Høgdall, E. V Integrated microRNA and mRNA signatures associated with overall survival in epithelial ovarian cancer. PLoS ONE 2021, 16, e0255142. [Google Scholar] [CrossRef] [PubMed]
Figure 1. Hierarchical clustering of NGS data on read counts of miRNA from BSC (s6, s8, s30), SBT (s2, s10, s24,) and HGSOC (s18, s21, s34) samples.
Life 12 02017 g001
Figure 2. Venn diagram of differentially expressed miRNAs in serous ovarian tumors.
Life 12 02017 g002
Figure 3. Quantitative RT-PCR data on the miRNA expression level (−∆Ct values) in the tissue samples from patient cohort 1. Data are presented as the median of the “−∆Ct” values, quartiles Q1 and Q3, and outliers as the dots.
Life 12 02017 g003
Figure 4. Principal component analysis (PCA) plot based on the miRNA dataset in the control and HGSOC groups.
Life 12 02017 g004
Figure 5. Immunohistochemical analysis of the HGSOC samples from 1st and 2nd clusters formed by PCA in Figure 4. (A) Hematoxylin and eosin and (B) anti-progesterone receptor antibody staining of 1st cluster tumor (sample ID 19); (C) hematoxylin and eosin and (D) anti-progesterone receptor antibody staining of the 2nd cluster tumor (sample ID 672).
Life 12 02017 g005
Figure 6. Comparative analysis of miRNA expression level in blood plasma samples of apparently healthy women, patients with different histotypes of serous ovarian tumors, endometriosis by quantitative real-time PCR. Data are presented as the median of the “-∆Ct” values, quartiles Q1 and Q3, and outliers as the dots.
Life 12 02017 g006
Figure 7. Models of logistic regression for HGSOC patients based on the ∆Ct values for the miR-16-5p, miR-17-5p, miR-20a-5p and miR-93-5p in the peripheral blood plasma. (a) Prediction for complete cytoreduction; (b) Prediction for complete response to post surgery chemotherapy. For the combination of miRNA molecules indicated by a red asterisk, the parameters and formula of the logistic regression model are given.
Life 12 02017 g007
Figure 8. Scheme of functional significance of miR-16-5p, miR-17-5p, miR-20a-5p and miR-93-5p. Schematic participation of miRNAs in chemoresistance (A), cell proliferation (B), and EMT (C) is presented in the form of different blocks.
Life 12 02017 g008
Table 1. miRNA parameters.
miRNAmiRNA Accession Number (miRBase), available online: http://www.mirbase.org/ (accessed on 15 August 2022)Nucleotide Sequence of Sense Primer for PCR, 5’-3’PCR Primer Annealing Temperature, °C
hsa-miR-16-5pMIMAT0000069TAGCAGCACGTAAATATTGGCG62
hsa-miR-17-5pMIMAT0000070CAAAGTGCTTACAGTGCAGGTAG55
hsa-miR-20a-5pMIMAT0000075TAAAGTGCTTATAGTGCAGGTAG52
hsa-miR-93-5pMIMAT0000093CAAAGTGCTGTTCGTGCAGGTAG55
hsa-miR-425-5pMIMAT0003393AATGACACGATCACTCCCGTTGA60
hsa-miR-101-3pMIMAT0000099TACAGTACTGTGATAACTGAA55
hsa-miR-140-3pMIMAT0004597TACCACAGGGTAGAACCACGG55
hsa-miR-30d-5pMIMAT0000245TGTAAACATCCCCGACTGGAAG55
Table 2. Sample characteristics of patient cohort 1.
Sample IDSample DescriptionLocation in Lower PelvisPatient IDAgeMenstrual Cycle DayDuration of Menopause, YearsDiagnosisFIGO [38]pTNM [39]NGSPCR
s26Normal fimbriaeleft sideP127200Endometriosis of the sacro-uterine ligament. Mature cystic teratoma of the left ovary--YesYes
s27Normal fimbriaeright side--NoYes
s25Normal fimbriaeright sideP230130Serous cystadenoma of the left ovary, bicornuate uterus with non-functioning closed horn--YesYes
s11Normal fimbriaeright sideP371021Right ovarian benign serous cystadenoma--NoYes
s12BSCright side--NoYes
s28Normal fimbriaeleft sideP464012Right ovarian benign serous cystadenoma--NoYes
s29Normal fimbriaeright side--NoYes
s30BSCright side--YesYes
s5Normal fimbriaeleft sideP577022Benign serous cystadenomas of both ovaries--NoYes
s7Normal fimbriaeright side--NoYes
s6BSCleft side--YesYes
s8BSCright side--YesYes
s15Normal fimbriaeright sideP645280Right ovarian benign serous cystadenoma--YesYes
s16BSCright side--NoYes
s4BSCright sideP769019Benign serous cystadenomas of both ovaries--NoYes
s2SBTright sideP85102Borderline serous papillary cystadenoma of the right ovary. Multiple myoma of the uterine corpus. Adenomyosis.Ic1pT1c1N0M0YesYes
s10SBTleft sideP929120Borderline serous papillary cystadenoma of the left ovary.IapT1aCN0M0YesYes
s24SBTright sideP102770Borderline serous papillary cystadenoma of the right ovary. IIapT2aCN0M0YesYes
s18HGSOCright sideP114501High-grade serous carcinoma of the right ovary.IIapT2aCN0M0YesYes
s21HGSOCright sideP1258010High-grade serous carcinoma of the right ovary. Ascites. Adhesive process in the abdominal cavity.IIIa2pT3aCN0M0YesYes
s14HGSOCleft sideP1344220High-grade serous carcinomas of both ovaries. Small-size uterine myomas.IIIa2pT3aCN0M0NoYes
s22HGSOCright sideP145303High-grade serous carcinoma of the right ovary. Ascites.IIIa2pT3aCN0M0NoYes
s33HGSOCleft sideP1524028High-grade serous carcinomas of both ovaries. Metastases in the inguinal lymph nodes. Adhesive process in the abdominal cavity. Endometrial polyp.IVBpT3aN0M1NoYes
s34HGSOCright sideYesYes
Table 3. NGS data on read counts of miRNAs in serous ovarian tumors.
miRNAlog2 (Fold Change in Expression Level)lfcSEp-Value *s6s8s30s2s24s10s18s21s34
BSCSBTHGSOC
hsa-miR-17-5p3.20.53.4 × 10−1170.056.948.662.161.190.4703.3294.1675.4
hsa-miR-425-5p2.80.58.9 × 10−956.648.475.597.653.7119.5548.0357.7316.9
hsa-miR-20a-5p2.80.53.4 × 10−875.875.173.852.844.465.5693.2237.4607.9
hsa-miR-93-5p2.70.51.8 × 10−7386.9207.7131.6366.0218.3342.71487.41260.62003.0
hsa-miR-101-3p−2.50.52.2 × 10−7989.62245.52097.1724.51243.3983.9353.5238.5353.3
hsa-miR-30d-5p1.40.41.5 × 10−414401.115283.711120.314318.115006.912790.138252.026761.846379.9
hsa-miR-140-3p−1.90.54.1 × 10−41836.62932.85613.02193.92908.53463.5717.21319.7709.2
hsa-miR-16-5p1.90.76.9 × 10−336.050.3127.560.935.2111.6116.2249.9423.5
* Significance value of differences while comparing HGSOC vs. BSC and SBT.
Table 4. Wilcoxon–Mann–Whitney test data on pairwise comparison of normal fimbriae, BSC, SBT and HGSOC groups by miRNA expression level in tissue samples. Significance level (p) values are indicated for the corresponding compared groups.
miRNAGroupNormal FimbriaeBSCSBT
miR-16-5pBSC0.223810.7143
miR-16-5pSBT0.72730.71431
miR-16-5pHGSOC0.00480.00870.0476
miR-425-5pBSC0.327710.5476
miR-425-5pSBT10.54761
miR-425-5pHGSOC0.06630.01520.1667
miR-17-5pBSC0.272111
miR-17-5pSBT0.145511
miR-17-5pHGSOC0.00040.00220.0238
miR-20a-5pBSC0.388410.5476
miR-20a-5pSBT0.72730.54761
miR-20a-5pHGSOC0.00080.00220.0238
miR-93-5pBSC0.775610.0476
miR-93-5pSBT0.01820.04761
miR-93-5pHGSOC0.00040.00220.0238
miR-30d-5pBSC0.455910.9048
miR-30d-5pSBT0.86360.90481
miR-30d-5pHGSOC0.00160.00870.0238
miR-140-3pBSC0.455910.3810
miR-140-3pSBT0.48180.38101
miR-140-3pHGSOC0.06630.09310.5476
miR-101-3pBSC0.863910.2619
miR-101-3pSBT0.20910.26191
miR-101-3pHGSOC0.14470.24030.7143
Table 5. Sample characteristics of the HGSOC patients.
Sample IDAge, YearsFIGOCA 125 Level before Treatment, U/mLRisk of Malignancy Index (RMI) Neoadjuvant ChemotherapyTumor Length, cm *Tumor Width, cm *Tumor Height, cm *Ascites, mLExtent of Blood Loss, mLSurgery Time, min0—Complete Cytoreduction (Size of Residual Tumor Foci Less than 2.5 mm), 1—Suboptimal Cytoreduction (Size of Residual Tumor Foci 2.5 mm–2.5 cm)Progesterone Receptor Expression in Tumor, Allred Score **Cluster Number in Figure 4RECIST 1.1 MRI/CT Criteria: 1—Complete Response, 2—Partial Response, 3—Stable Disease, 4—Progressive Disease
100838IVB124410,359No710.51120007004801013
76654IIB29261No433201501400011
69048IVB134012,060No5.53.54507002060013
67951IIIC200018,000No9.56810007502350013
64954IIIC2001800Yes56730006502851014
1557IIC1981782No18141010004001901014
1963IIIC411206No62.44.62004002651011
78245IIB5171551No161611.7505002150213
1044IIIB129387No6767005001751511
1371IIIB5171551yes13108102501651014
1245IIA60180No43210100800013
1644IIIC92277No544103001851013
1747IA6060No8.37.16.6101501511013
106077IIIC120310,827No109812006503650421
93933IIIC59270No13121020008002051621
67241IIIC10883264No97.51015008002750321
68442IIIC12933879No148615005002800321
44851IVB380811,424No1517181030003600021
106149IIIC17565540No29.91518.8900030005901021
1148IC189567No18108103003750624
* Intraoperative size. ** The Allred score combines the percentage of positive cells and the intensity of the reaction product in most of the carcinomas. Scores of 0–2 are considered negative. Scores of 3–8 are considered positive.
Table 6. miRNA expression levels in blood plasma samples of apparently healthy women, patients with various histotypes of ovarian tumors and endometriosis.
miR-16-5p *miR-17-5p *miR-20a-5p *miR-93-5p *
Control 13.96 (−4.06; −3.64)−3.07 (1.31; 4.08)−2.76 (0.79; 3.83)−2.57 (1.88; 3.07)
Control 20.59 (−1.5; −0.2)−3.81 (2.96; 4.94)−3.34 (2.35; 4.94)−4.41 (2.87; 5.45)
HGSOC, cluster 15.06 (−5.51; −3.91)−0.21 (−0.37; 1.35)−0.22 (−0.47; 1.05)−1.01 (0.19; 2.46)
HGSOC, cluster 23.03 (−3.9; −2.33)−3.69 (3.44; 4.47)−3.75 (3.59; 4.47)−3.94 (3.63; 4.53)
LGSOC2.45 (−3.21; −2.06)−4.32 (3.54; 4.86)−3.88 (2.25; 4.42)−4.17 (3.54; 4.63)
SBT2.4 (−3.23; −1.89)−2.24 (1.33; 3.96)−2.31 (0.97; 4.39)−2.95 (1.95; 4.83)
BSC2.22 (−3.45; −1.39)−2.79 (1.06; 4.69)−1.89 (0.91; 3.42)−2.87 (1.2; 4.54)
Ovarian endometrioma3.22 (−3.98; −2.51)−3.39 (1.69; 4.46)−1.76 (0.74; 3.87)−4.39 (3.84; 5.19)
Deep infiltrating endometriosis1.97 (−2.87; −1.25)−2.54 (1.9; 3.58)−2.11 (1.85; 2.85)−3.4 (2.81; 5.85)
* Data are presented as median values “-ΔCt”, first and third quartiles, namely: Me (Q1; Q3).
Table 7. Results of statistical analysis of miRNA expression levels in blood plasma samples of apparently healthy women, patients with various histotypes of ovarian tumors and endometriosis.
miRNAGroupControl 1 (33–54 Age) *Control 2 (25–33 Age) *HGSOC, Cluster 1 *HGSOC, Cluster 2 *LGSOC *SBT *BSC *Ovarian Endometrioma *Deep Infiltrating Endometriosis *
miR-17-5pControl 2 (25–33 age)0.1077NANANANANANANANA
miR-17-5pHGSOC, cluster 10.0170NANANANANANANA
miR-17-5pHGSOC, cluster 20.24410.96990.0024NANANANANANA
miR-17-5pLGSOC0.13060.9350.00190.7925NANANANANA
miR-17-5pSBT0.67870.02020.02240.08950.0987NANANANA
miR-17-5pBSC0.76890.21740.00310.33550.53870.5732NANANA
miR-17-5pOvarian endometrioma0.6490.16390.01080.35020.34940.4120.9279NANA
miR-17-5pDeep infiltrating endometriosis10.05940.00310.12460.28290.66150.84280.8328NA
miR-93-5pControl 2 (25–33 age)0.0096NANANANANANANANA
miR-93-5pHGSOC, cluster 10.04132.00 × 10−4NANANANANANANA
miR-93-5pHGSOC, cluster 20.01250.96990.0062NANANANANANA
miR-93-5pLGSOC0.04930.49520.00540.9578NANANANANA
miR-93-5pSBT0.37320.0930.01060.34320.7595NANANANA
miR-93-5pBSC0.64950.12570.06670.24960.41760.8187NANANA
miR-93-5pOvarian endometrioma0.00730.91880.00160.66050.51160.22040.1896NANA
miR-93-5pDeep infiltrating endometriosis0.05970.86670.00170.43710.82120.26650.26570.4865NA
miR-16-5pControl 2 (25–33 age)0NANANANANANANANA
miR-16-5pHGSOC, cluster 10.11840NANANANANANANA
miR-16-5pHGSOC, cluster 20.24410.00160.0365NANANANANANA
miR-16-5pLGSOC0.0080.01920.00290.4923NANANANANA
miR-16-5pSBT0.00730.0010.00660.45370.9812NANANANA
miR-16-5pBSC0.04570.00870.00630.38450.97420.7231NANANA
miR-16-5pOvarian endometrioma0.08216.00 × 10−40.00370.88360.19710.29620.4491NANA
miR-16-5pDeep infiltrating endometriosis6.00 × 10−40.04145.00 × 10−40.06680.3810.30480.55120.0688NA
miR-20a-5pControl 2 (25–33 age)0.2005NANANANANANANANA
miR-20a-5pHGSOC, cluster 10.00441.00 × 10−4NANANANANANANA
miR-20a-5pHGSOC, cluster 20.210.7910.0062NANANANANANA
miR-20a-5pLGSOC0.13060.80651.00 × 10−40.9578NANANANANA
miR-20a-5pSBT0.89020.18960.00270.27960.2449NANANANA
miR-20a-5pBSC0.76890.15230.01190.24960.08040.8187NANANA
miR-20a-5pOvarian endometrioma0.86460.21710.03620.25610.19710.80790.8801NANA
miR-20a-5pDeep infiltrating endometriosis0.46960.05290.00210.10250.10720.88410.84280.9759NA
* The table shows the values of the statistical significance of the differences between the compared groups using the two-tailed Wilcoxon–Mann–Whitney test.
Publisher’s Note: MDPI stays neutral with regard to jurisdictional claims in published maps and institutional affiliations.

