Article

A Simple Calibration Method for a Fringe Projection System Embedded within an Additive Manufacturing Machine

EPSRC Future Advanced Metrology Hub, Department of Engineering and Technology, School of Computing and Engineering, University of Huddersfield, Huddersfield HD1 3DH, UK
*
Author to whom correspondence should be addressed.
Machines 2021, 9(9), 200; https://doi.org/10.3390/machines9090200
Submission received: 26 July 2021 / Revised: 10 September 2021 / Accepted: 13 September 2021 / Published: 17 September 2021
(This article belongs to the Special Issue Precision Measurement and Machines)

Abstract

:
In additive manufacturing (AM), especially for advanced powder fusion machines, it is of high importance to develop an in situ inspection system to monitor the printed surface and pre-print powder bed as the build cycle proceeds. Consequently, high resolution, high precision and fast detection measurement systems need to be investigated, as such optically based measurement systems can provide feedback for manufacturing process optimisation. Fringe projection technology has a great advantage in the measurement of topography in such environments. The implementation of a fringe projection system requires that the system is pre-calibrated in order to obtain high measurement resolution and repeatability. This paper presents a simple calibration method for an AM-based in situ fringe projection system using a phase-depth calibration model. If a calibration plate with certificated marks is used, however, the texture of the plate will affect the measured phase accuracy. A simple calibration method to reduce the calibration plate texture effect in the process of calibration is outlined. Experimental results show that the proposed method can eliminated these effects and improve measurement resolution and repeatability. The proposed in situ/in process inspection technique has been implemented within a commercial electron beam powder bed fusion additive manufacturing machine (EBAM), to demonstrate the capability for effective feedback during the manufacturing process.

1. Introduction

Additive manufacturing (AM) techniques have been developing in recent decades with new machine providers continually joining the market. As AM has a strong manufacturing affinity for providing new solutions, especially for the building of complex geometries with internal structures, it has significant potential and space for development [1]. For any manufacturing technology, in situ/online metrology is an effective supervision approach that can provide timely feedback to the process, thus improving the manufacturing efficiency [2]. In AM processing, fringe projection systems and infrared detection systems have been implemented for in situ detection methods [3]. In particular, fringe projection technology can provide a full-field, fast, high-resolution and high-precision layer-by-layer areal surface measurement [4]. For example, in the AM process environment, measurement can allow the inspection of the powder bed, the printed surface and the consequent 3D reconstruction of the part shape. Such a measurement can help classify and predict defects [5]. Consequently, the assessment of manufacturing quality by such methods would be advantageous in the process and provide feedback for process control.
A significant step for an in situ optical imaging system is calibration [6]. Calibration is a process of determining the geometrical relationship between a camera and a projector, as well as the relationship between the world coordinate and the camera image coordinate, which affects the measurement resolution and repeatability. System calibration can be divided into camera calibration and geometric calibration. Existing geometric calibration methods for 3D inspection systems can be categorized into model-based [7], polynomial [8] and least-squares [9].
The model-based method [10] is based on a geometrical model. The geometrical relationship between the camera and the projector is established by triangulation theory. After calculating system parameters, 3D data can be obtained by the phase map. The least-squares method seeks to find the nonlinear relationship between the phase map and the 3D data. In this case, the calibration procedure becomes more flexible and easier, because system geometric parameters do not need to be directly calculated. For example, Zhang [11] proposed a method using a white plate with discrete precision markers on the surface to calibrate horizontal and vertical parameters, a one-to-one mapping between camera points and projector points is then established, which can be implemented in practical environments without the need for precise translating stages. The polynomial method seeks to express the relationship between the phase and depth coordinates by a polynomial relation, and the relation fits the relative position between the camera and the projector. Since the phase and depth relationship of the fringe projection system is close to linear, but due to nonlinear effects, lens distortion and other factors, more than three polynomials are needed to ensure the measurement repeatability. Windecker [12] proposed a calibration method to determine the sensitivity field by using a low-order polynomial, which builds up the transfer function of the phase and the height. Sutton [13] used a third-order polynomial to calculate phase and height information pixel-by-pixel by a phase–height transformation. Huang et al. [14] used a typically single colour pattern because different colour channels can code different phase information. In this case, the shape acquisition results are affected by the variations of the object’s surface colour. Quan [15] proposed the relationship between phase and the depth by using a reference plane to move to a known distance. Guan [16] used a composite structured light pattern to realize real-time 3D shape measurement. Reich [17] proposed a 3D measurement method for complex objects by using photogrammetry and fringe projection. All equipment is fixed.
The measurement principle of the fringe projection technique is shown in Figure 1b. Figure 1a is illustration of a fringe projection system with one camera and one projector. It has a similar measurement principle to stereo vision systems, but one of the cameras in the stereo vision system is replaced with a projector. The projector projects fringe patterns onto the object, and the fringe is deformed because of the form/shape of the test object. The camera captures the deformed fringes and analyses them. 3D results can be reconstructed from the deformed fringes.
In the calibration process of such a system, a calibration board with calibrated marks is often employed as shown in the present case as etched dark rings, Figure 2a. However, the marks themselves affect the phase information recorded as shown in Figure 2b, which causes phase error in the calibration process. A calibration method using circle ring calibration plate was studied, and the phase error caused by the rings was eliminated by using the fitting algorithm [19]. This method eliminated the phase error in the circle rings region and reduced the random noise. However, there are still some disadvantages. Because of the lens distortion of the camera and the projector, uneven fringe projection, and nonlinear effects, the absolute phase map was not a flat but a curved surface. Although the camera lens distortion was corrected and nonlinear effect corrections make the absolute phase map close to a plane, it was still difficult to find a perfectly matched surface fitting formula. In this paper, a simple calibration method to address this so-called “marks effect” to obtain high-quality calibration results is proposed. One whiteboard was used to calibrate vertical direction, and the circle ring board was used to calibrate transverse direction. Experimental results show that the proposed method eliminates the “marks effect” and improves measurement resolution and repeatability. Post calibration, the AM deployed fringe projection system has the capability to detect manufacturing defects, which can improve manufacturing accuracy and control the process during the manufacturing. The developed system has been fully employed within a commercial AM machine along with the associated control software.

2. Materials and Methods

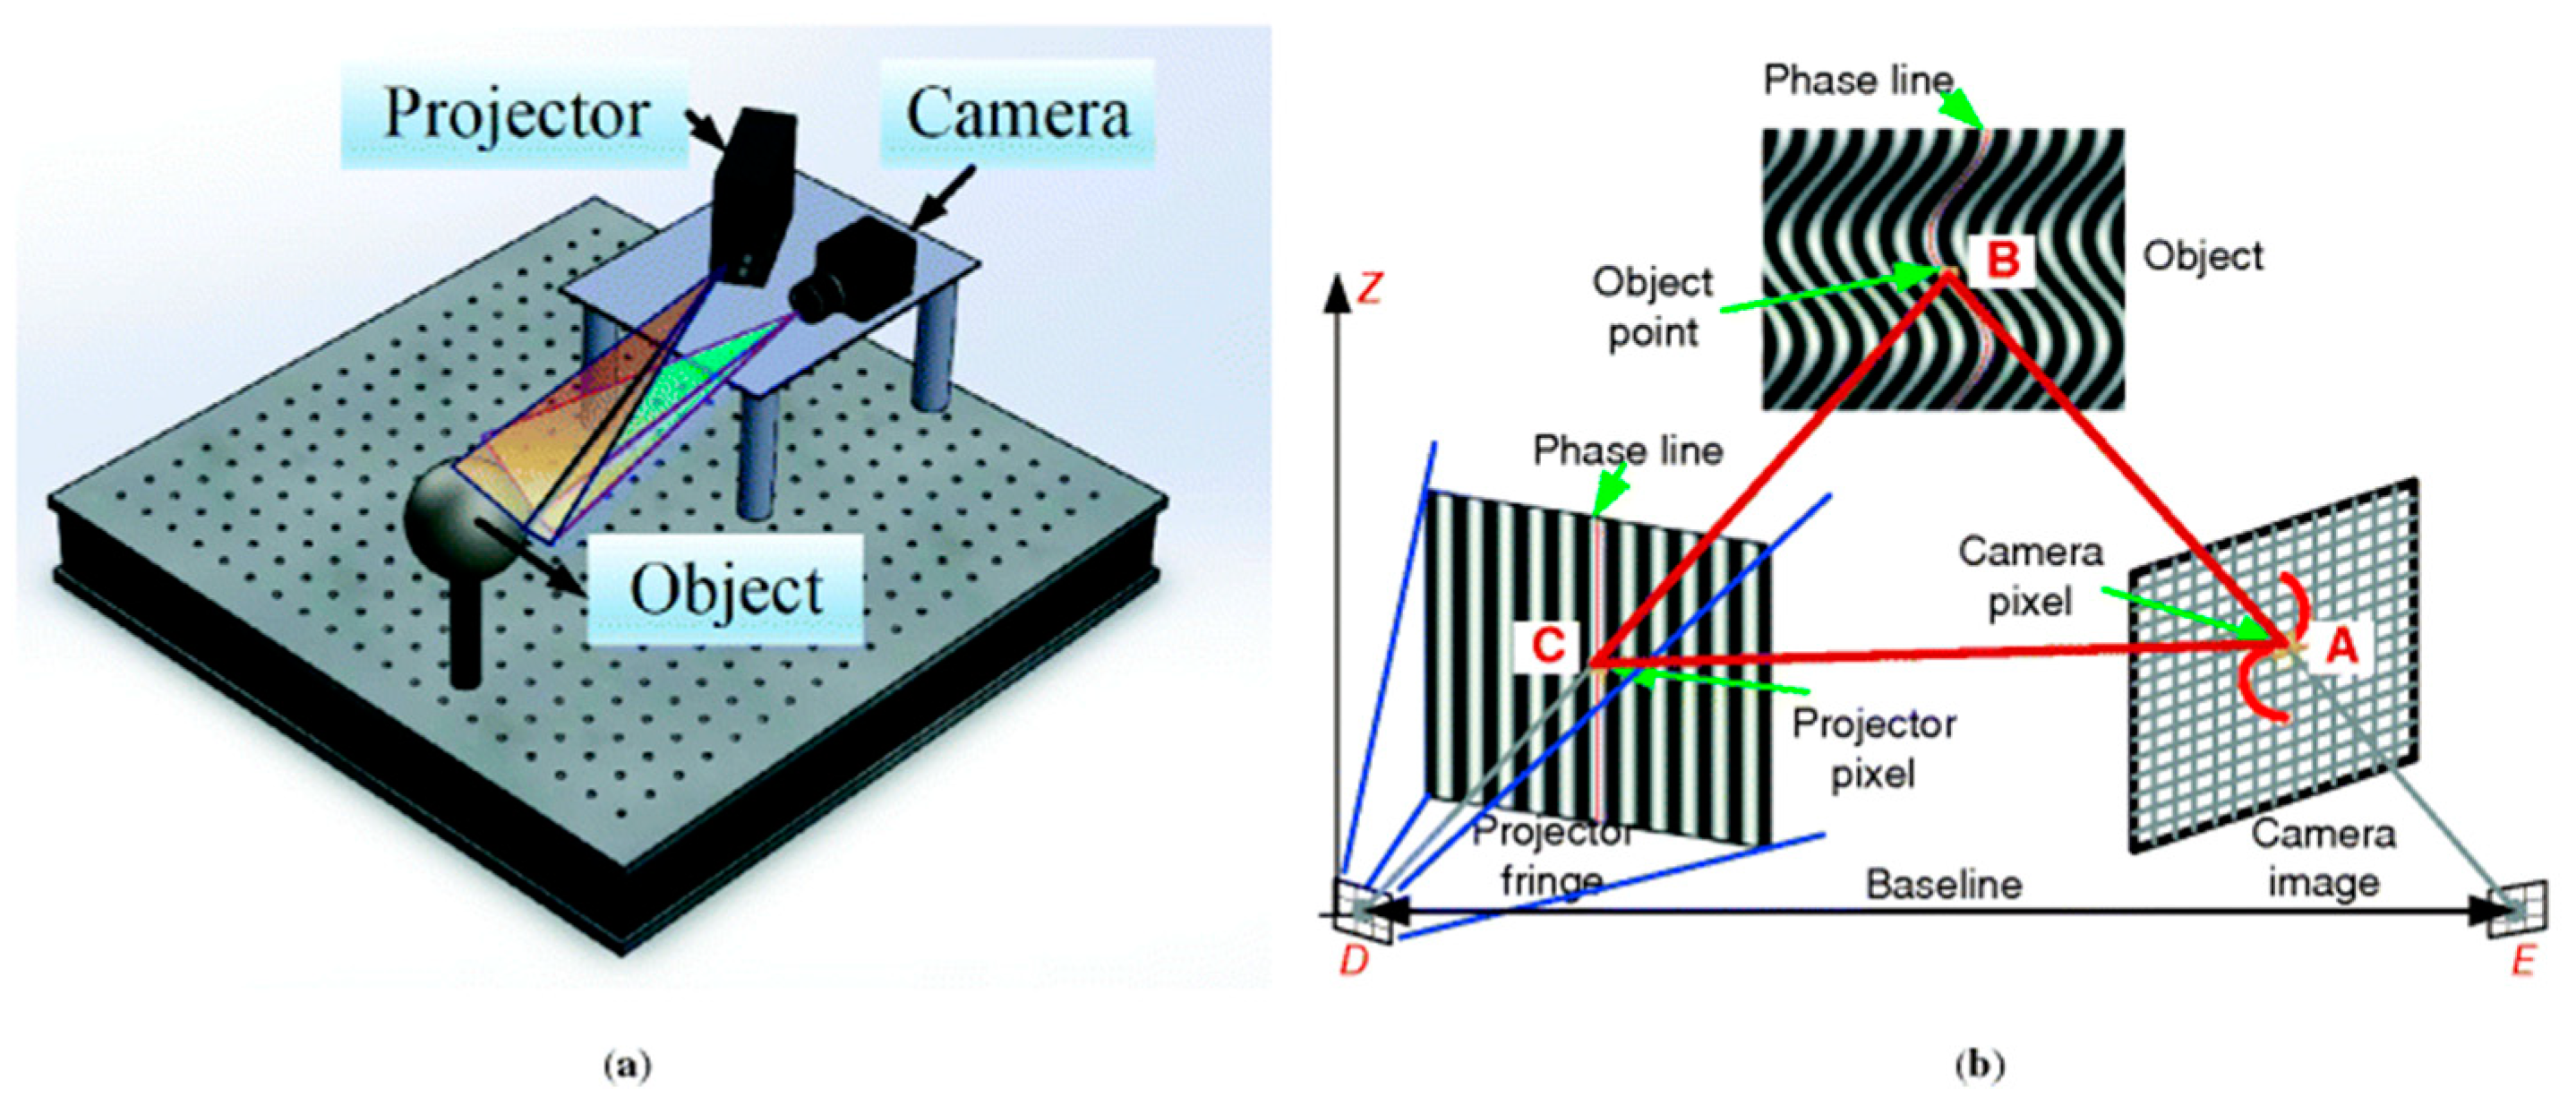
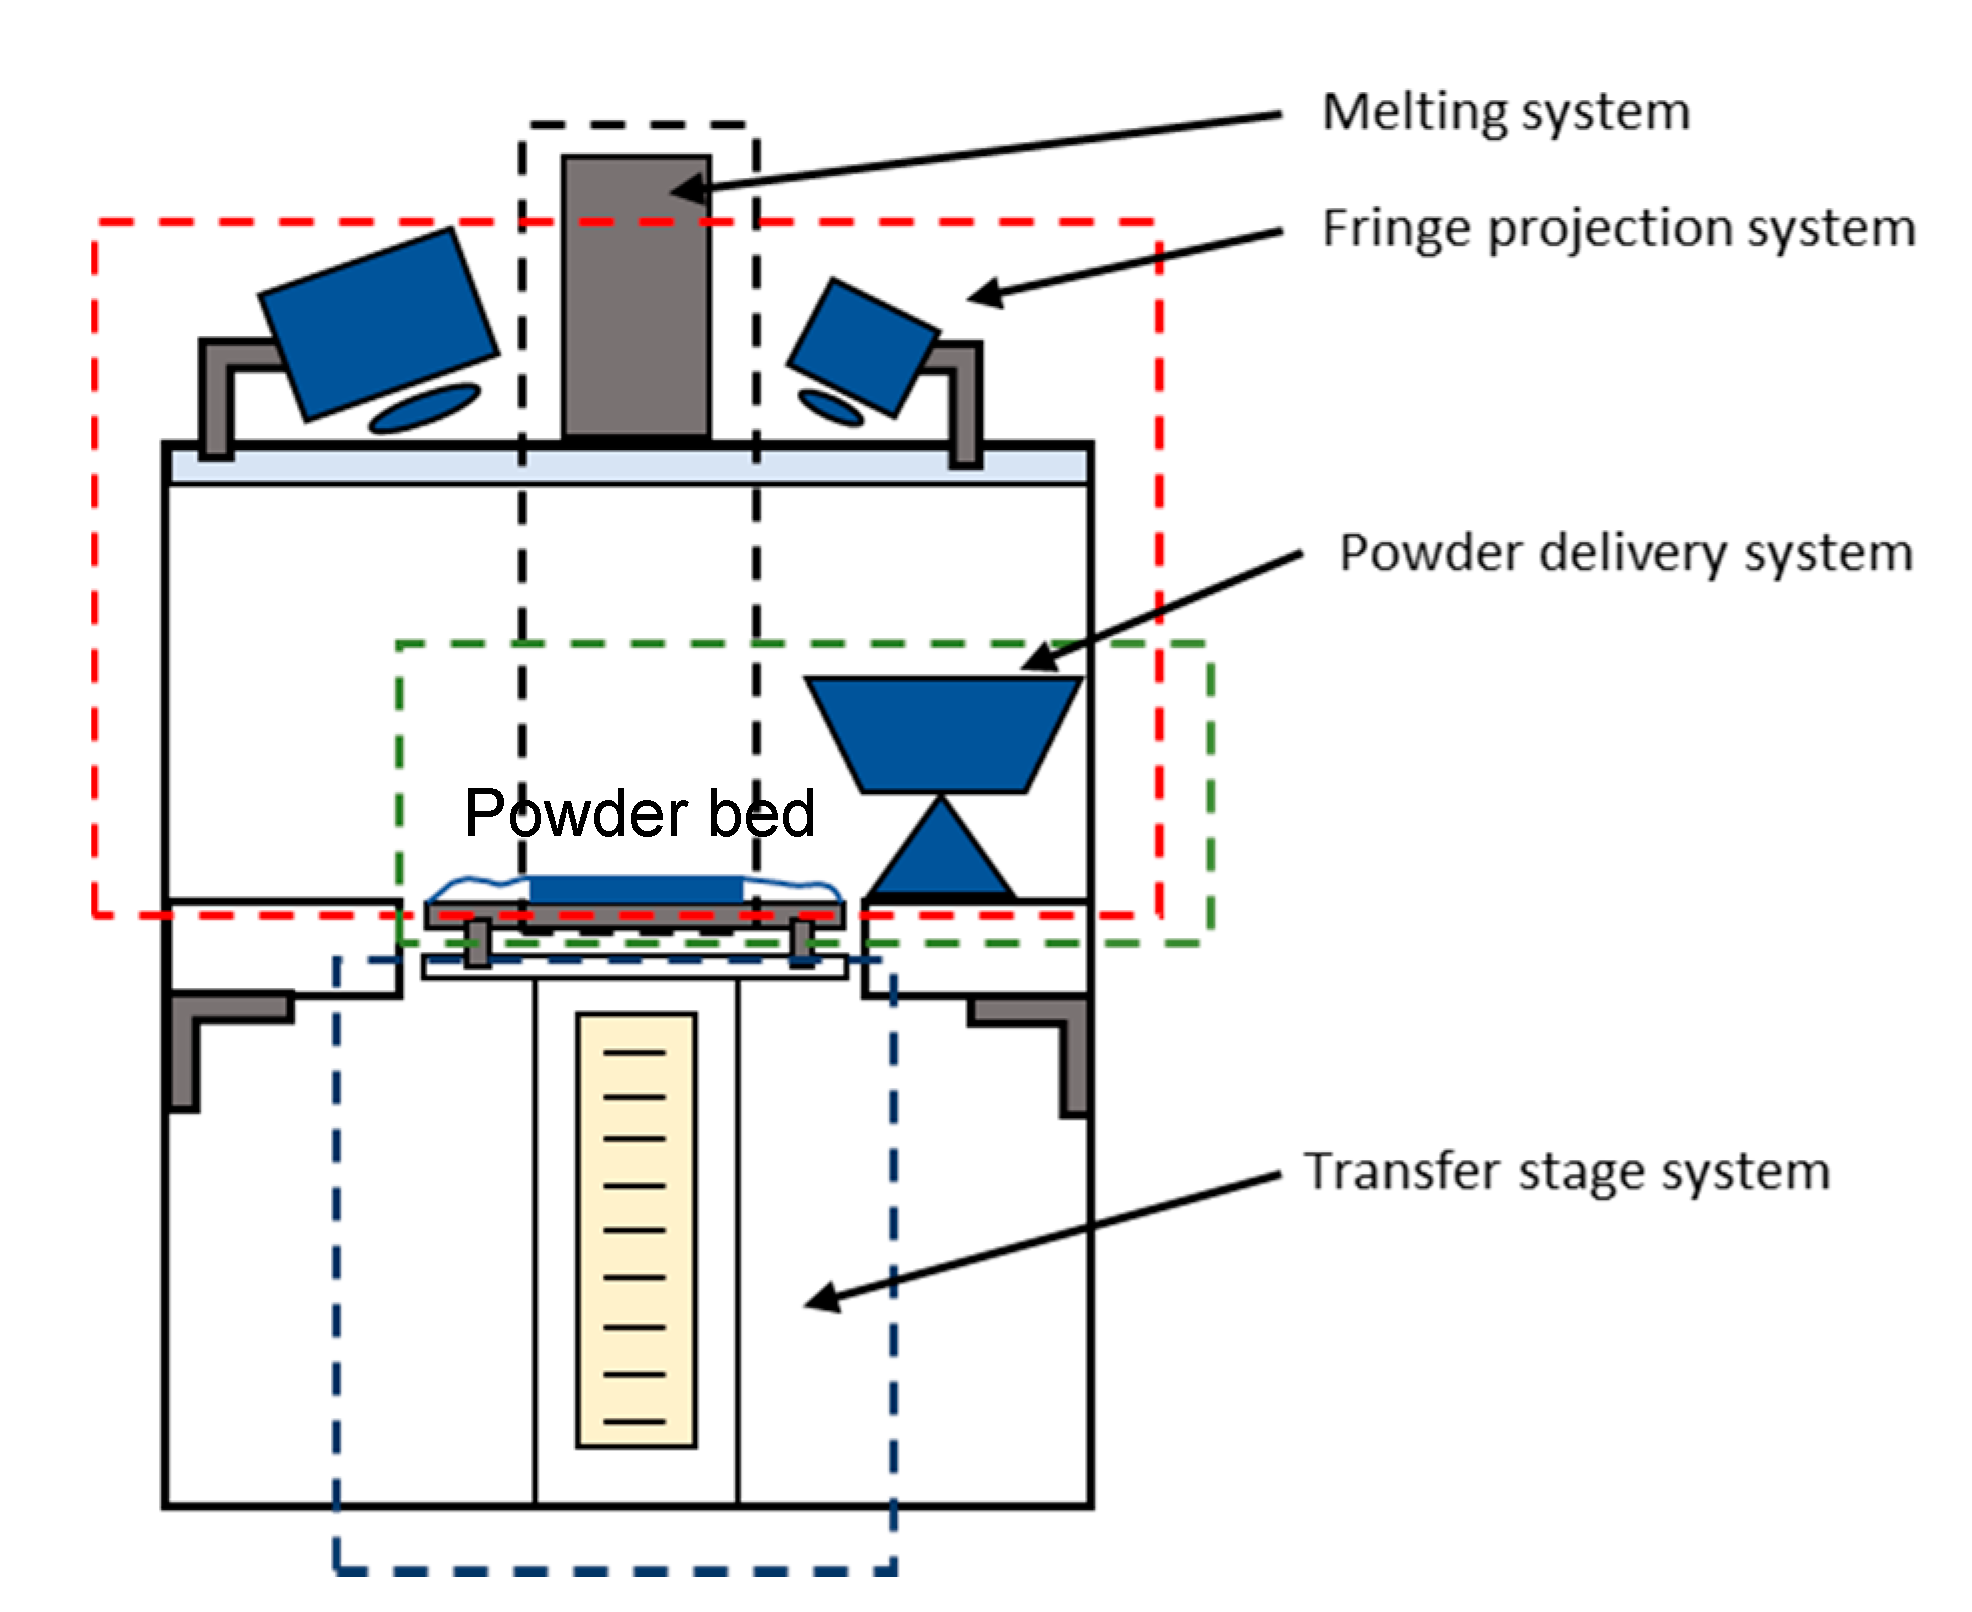
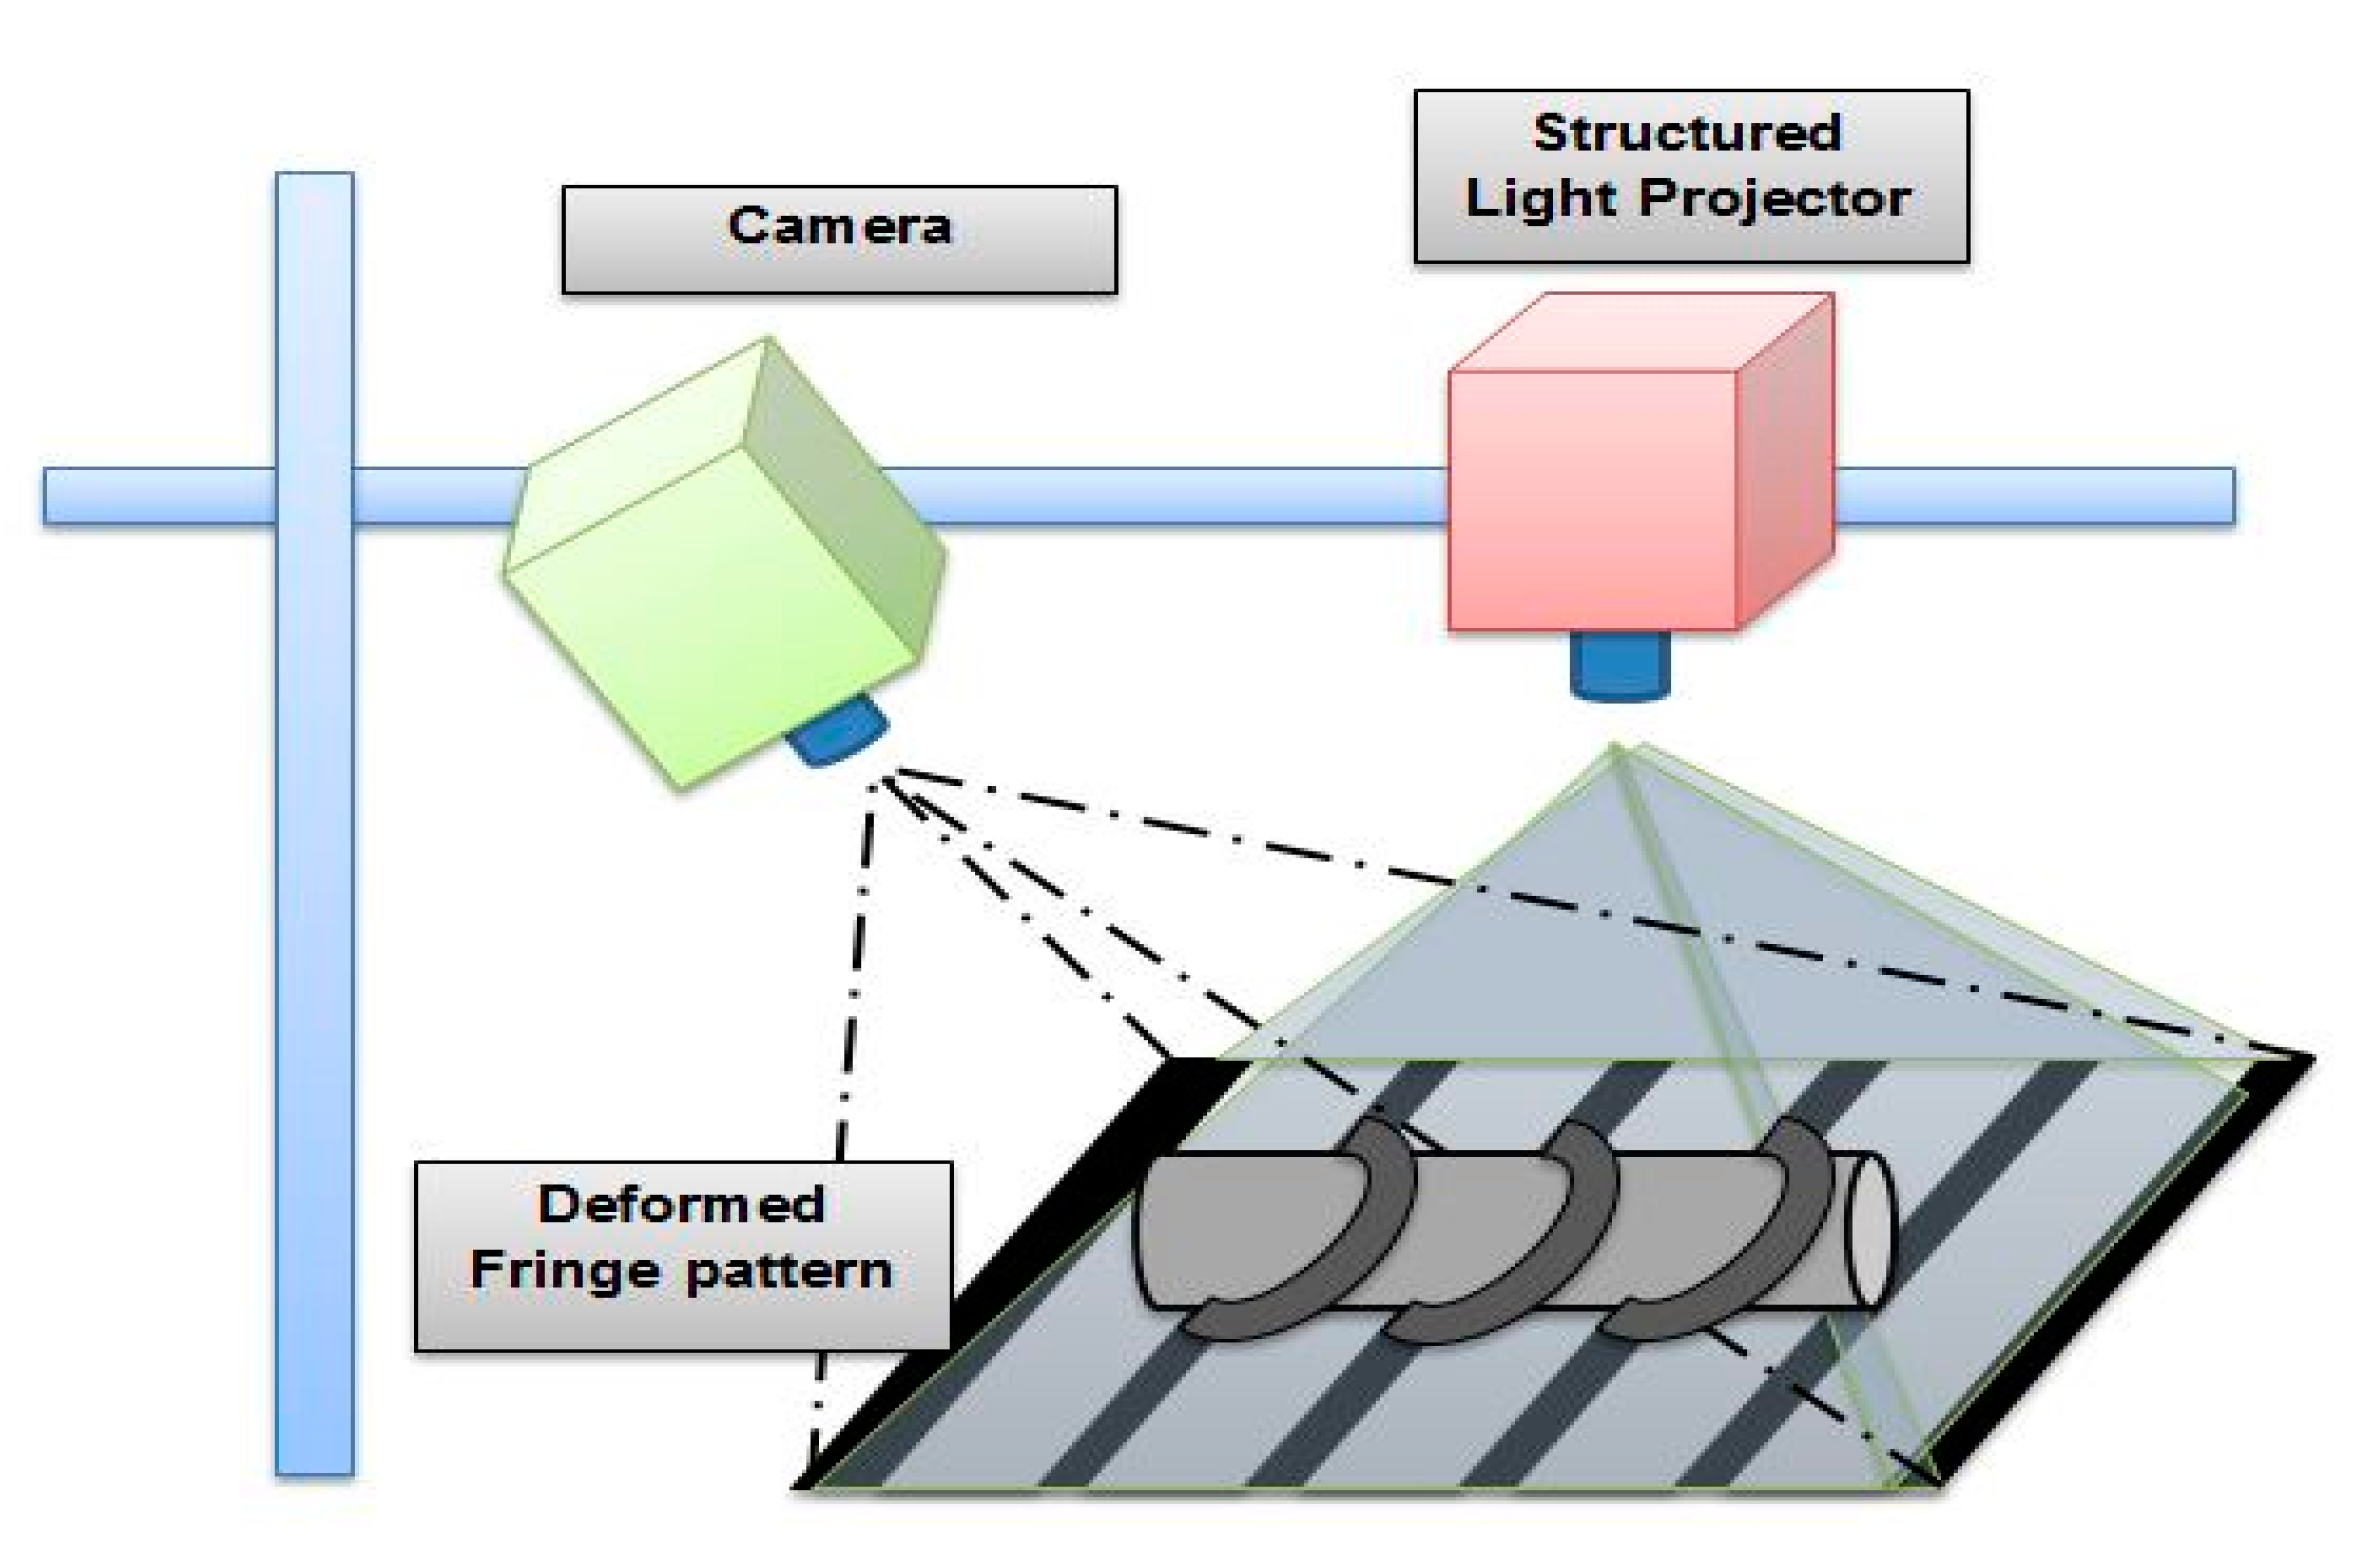
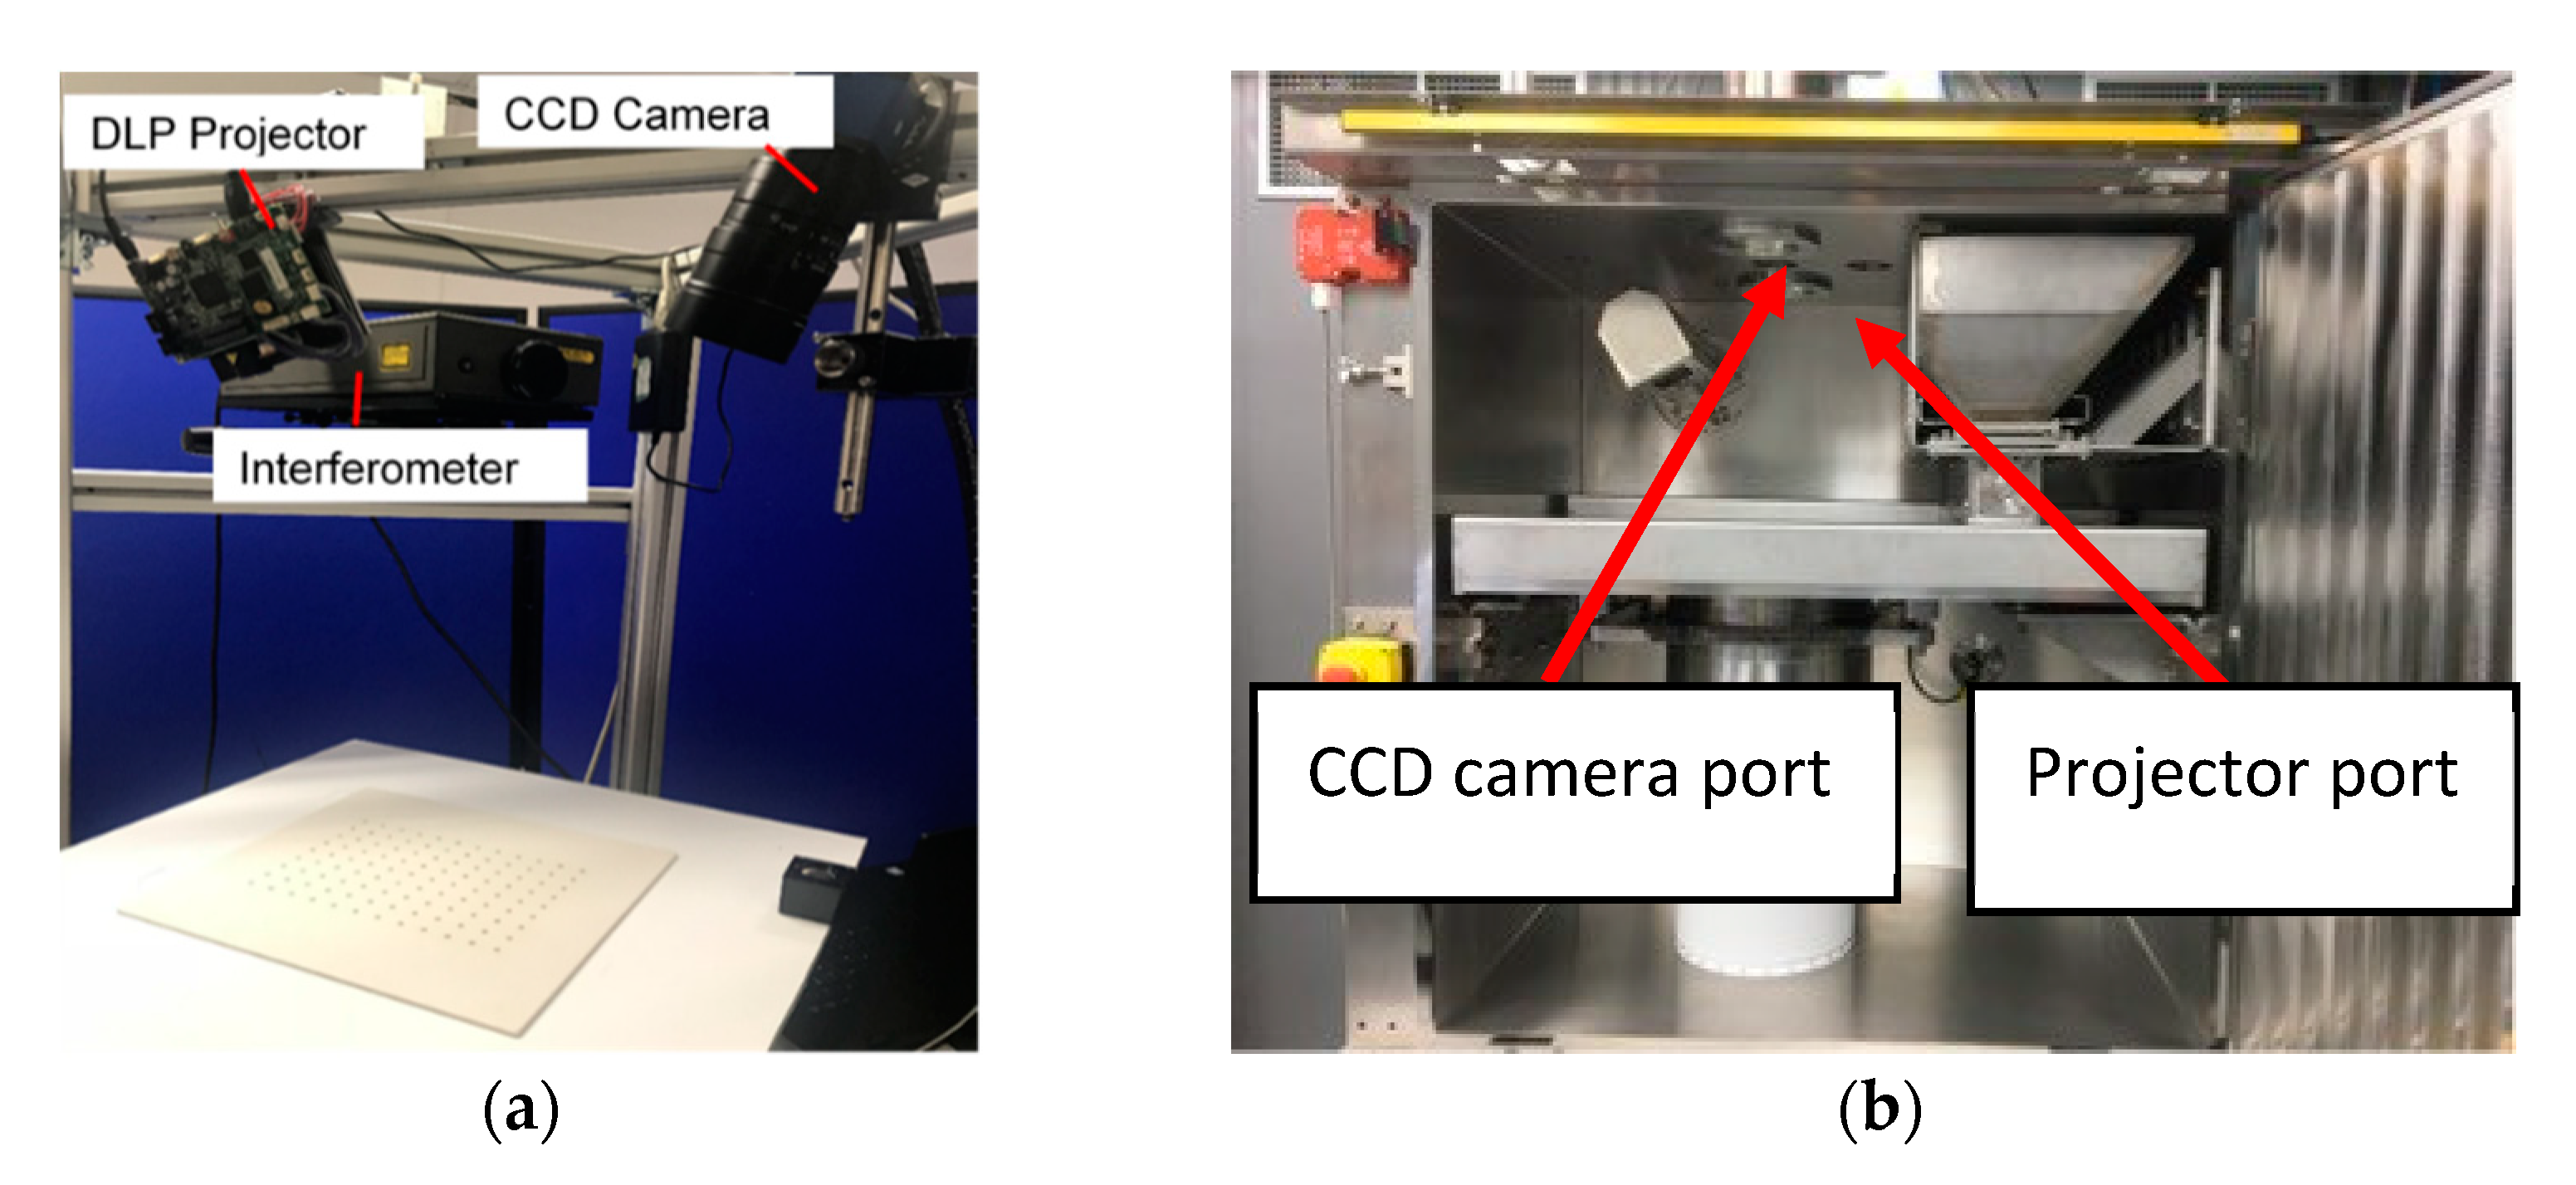
2.1. The Setup of Fringe Projection System

A conceptual illustration of the EBM machine setup with the fringe projection system is shown in Figure 3. The AM machine consists of four parts with different functions: these are an electron beam melting source, a powder delivery system, a powder bed transfer stage, and the fringe projection inspection system. The final implementation was within a commercial EBM machine. The inside of the machine chamber was under vacuum during the AM process. The fringe projection system was therefore fixed on top of the machine outside of the build chamber and the build area was “viewed” through two leaded glass windows, the windows were protected during the powder melting phase by Kapton film. The fringe projection system consists of a charge-coupled device (CCD) camera and a digital light processing (DLP) projector. The camera and projector were located on either side of the electron beam melting source. The position of the projector and the camera were fixed with the angle between the optical axes of circa 30°. The inspected surface was at the intersection of the axes.

2.2. Measurement Principle of Fringe Projection System

The principle of the fringe projection technique is based on triangulation [20]. To obtain shape information, the geometric relationship of the DLP projector and the CCD camera should be determined, as illustrated in Figure 4. The sinusoidal fringe patterns were projected from the projector onto the tested surface where the fringe patterns were deformed due to surface form and the deformed fringes were captured by the camera. The pixel relationship between the camera and the projector can be determined from the captured fringe images, namely the absolute phase map. The phase map was computed from the captured deformed fringe patterns. After system calibration, 3D shape data can be obtained using this absolute phase map.
The phase information represents the pixel position in the projector and the corresponding pixel position in the camera. According to the triangulation method, the geometric relationship of the projector to the camera can be represented by a mathematical model between the absolute phase map and depth data [21] as follows:
Z = L 0 2 π L 0 2 L cos θ P 0 Δ φ ( x , y ) ( L 0 + x cos θ sin θ ) 2 L cos θ sin θ L 0 + x cos θ sin θ + 1
The model was established in a reference coordinate system, where Z is the height difference value relative to the reference plane. Δ φ is the absolute phase difference between the measured surface and the reference place. Therefore, the height values across the surface can be calculated with the phase information and system parameters. The geometric relation is approximated to be a linear relation, however, because of the element of nonlinear response and lens distortion, the geometric relation cannot be a perfect linear mapping. It can, however, be fitted by a higher-order polynomial as illustrated in Equation (2):
Z r ( x , y ) = n = 0 N a n ( x , y ) Δ φ ( x , y ) n

2.3. Phase Analyses Methods

All height information is derived from absolute phase information. In this paper, a four steps phase-shifting algorithm and a three-frequency selection algorithm were used to obtain the absolute phase information. In the present case, the sinusoidal fringe pattern is generated and projected by the projector and the intensity value of the projected image is illustrated in Equation (3):
I i ( x , y ) = 120 + 100 cos ( 2 π x W i t N f j + δ i ) , δ i = 1 2 π , π , 3 2 π , 2 π
where i indicates the ith image, Ii is the captured fringe pattern intensity, Wit is the image width of the projector, δ i is number of phase shifting steps, N f j is the projection fringe number. After the camera captures the intensity images I c i the wrapped phase can be calculated by the following equation:
W ( φ ) = arctan ( i = 1 N I c i ( x , y ) sin ( δ i ) i = 1 N I c i ( x , y ) cos ( δ i ) )
After obtaining the wrapped phase W, the unwrapped phase map, namely the absolute phase data, can be calculated by a temporal phase unwrapping method (three-frequency selection algorithm). Sets of sequential sinusoidal fringe patterns were projected onto the tested surface; the number of fringes is defined by the following Equation (5):
N f j = N f 0 ( N f 0 ) j 1 m 1 , j = 1 , 2 , , m 1
where Nf0 is the maximum number of fringes, Nfj is the number of fringes in the jth fringe set, and m is the number of fringe sets used. In this paper, the maximum number of fringes is 100, and m = 3, therefore Nf1 = 99 and Nf2 = 90.

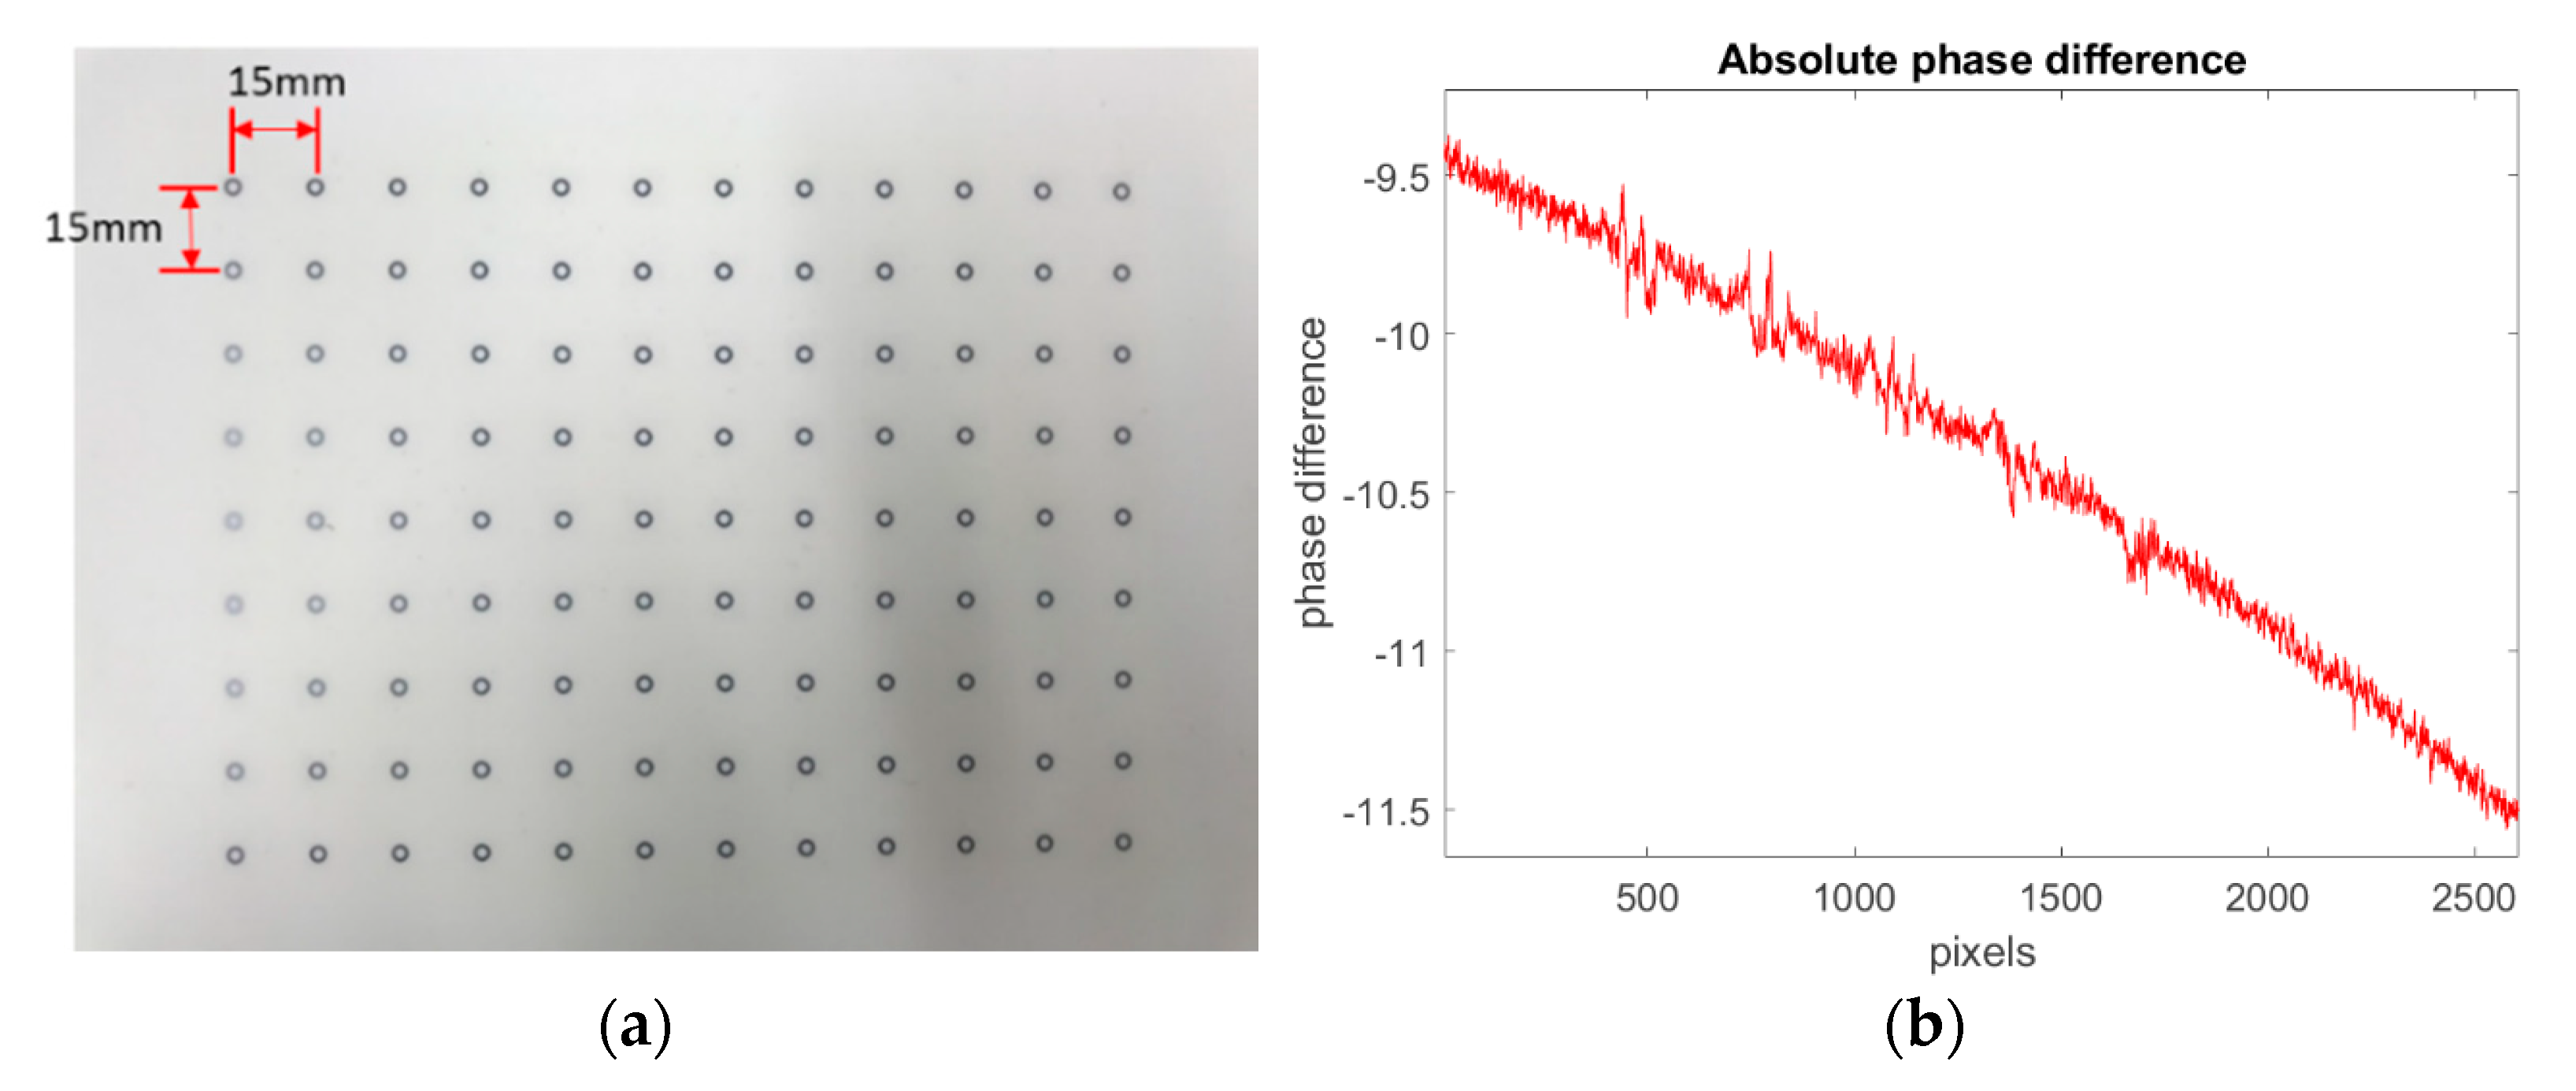
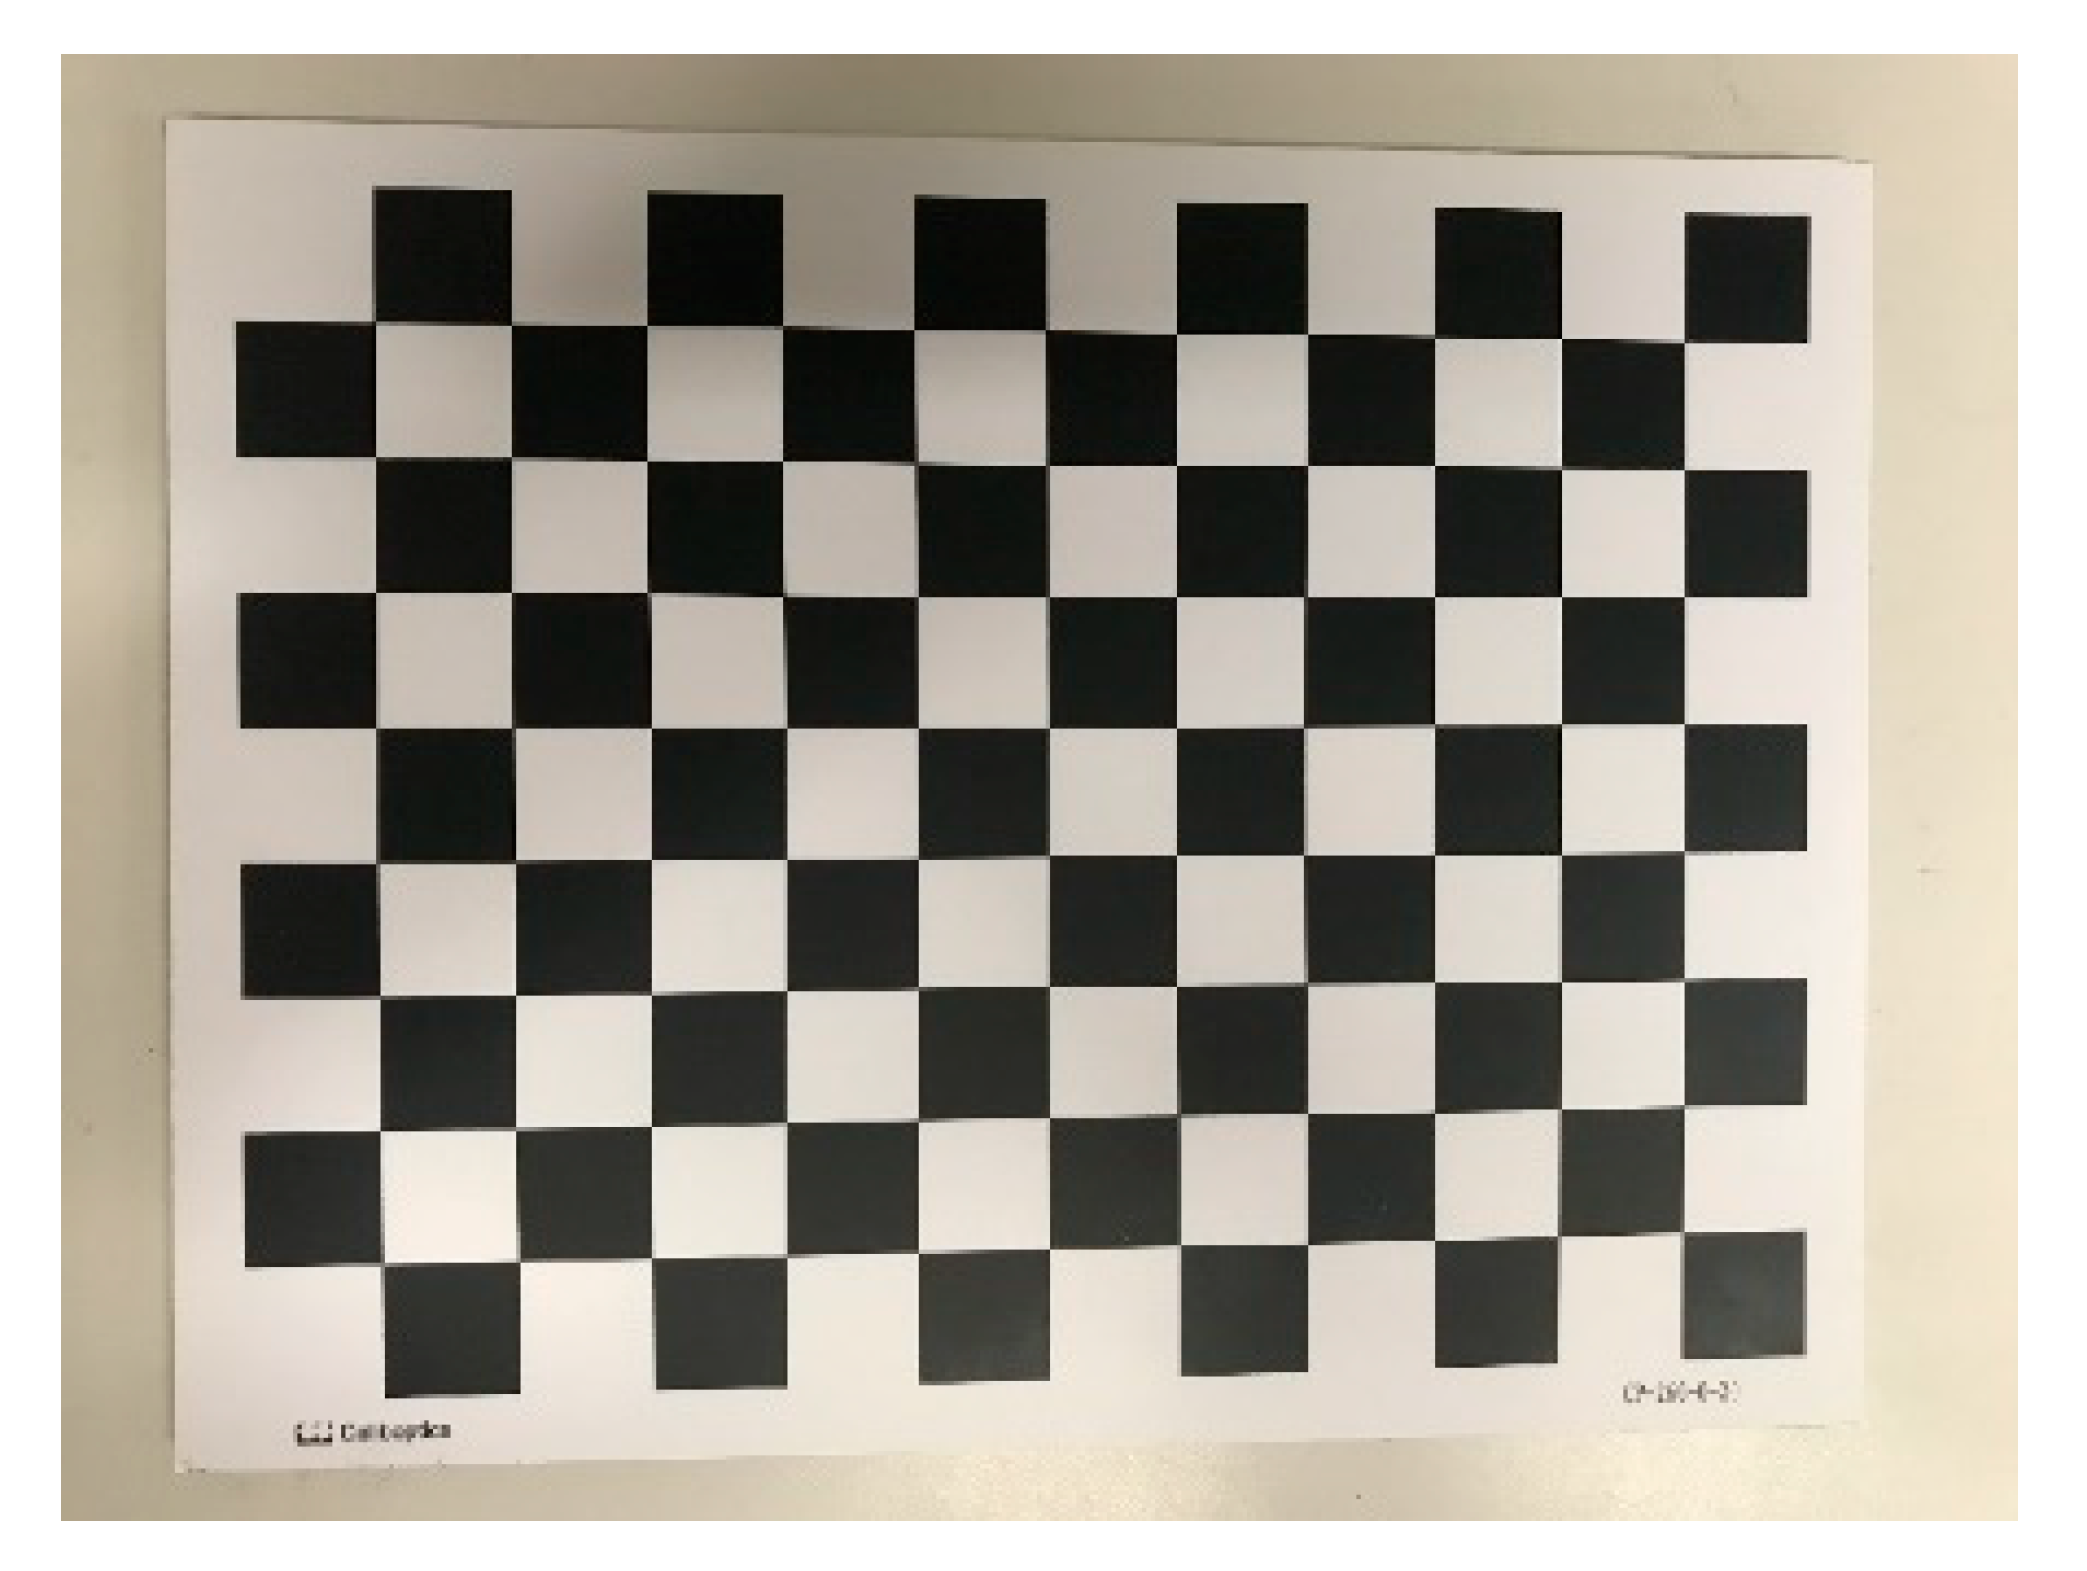
3. System Calibration

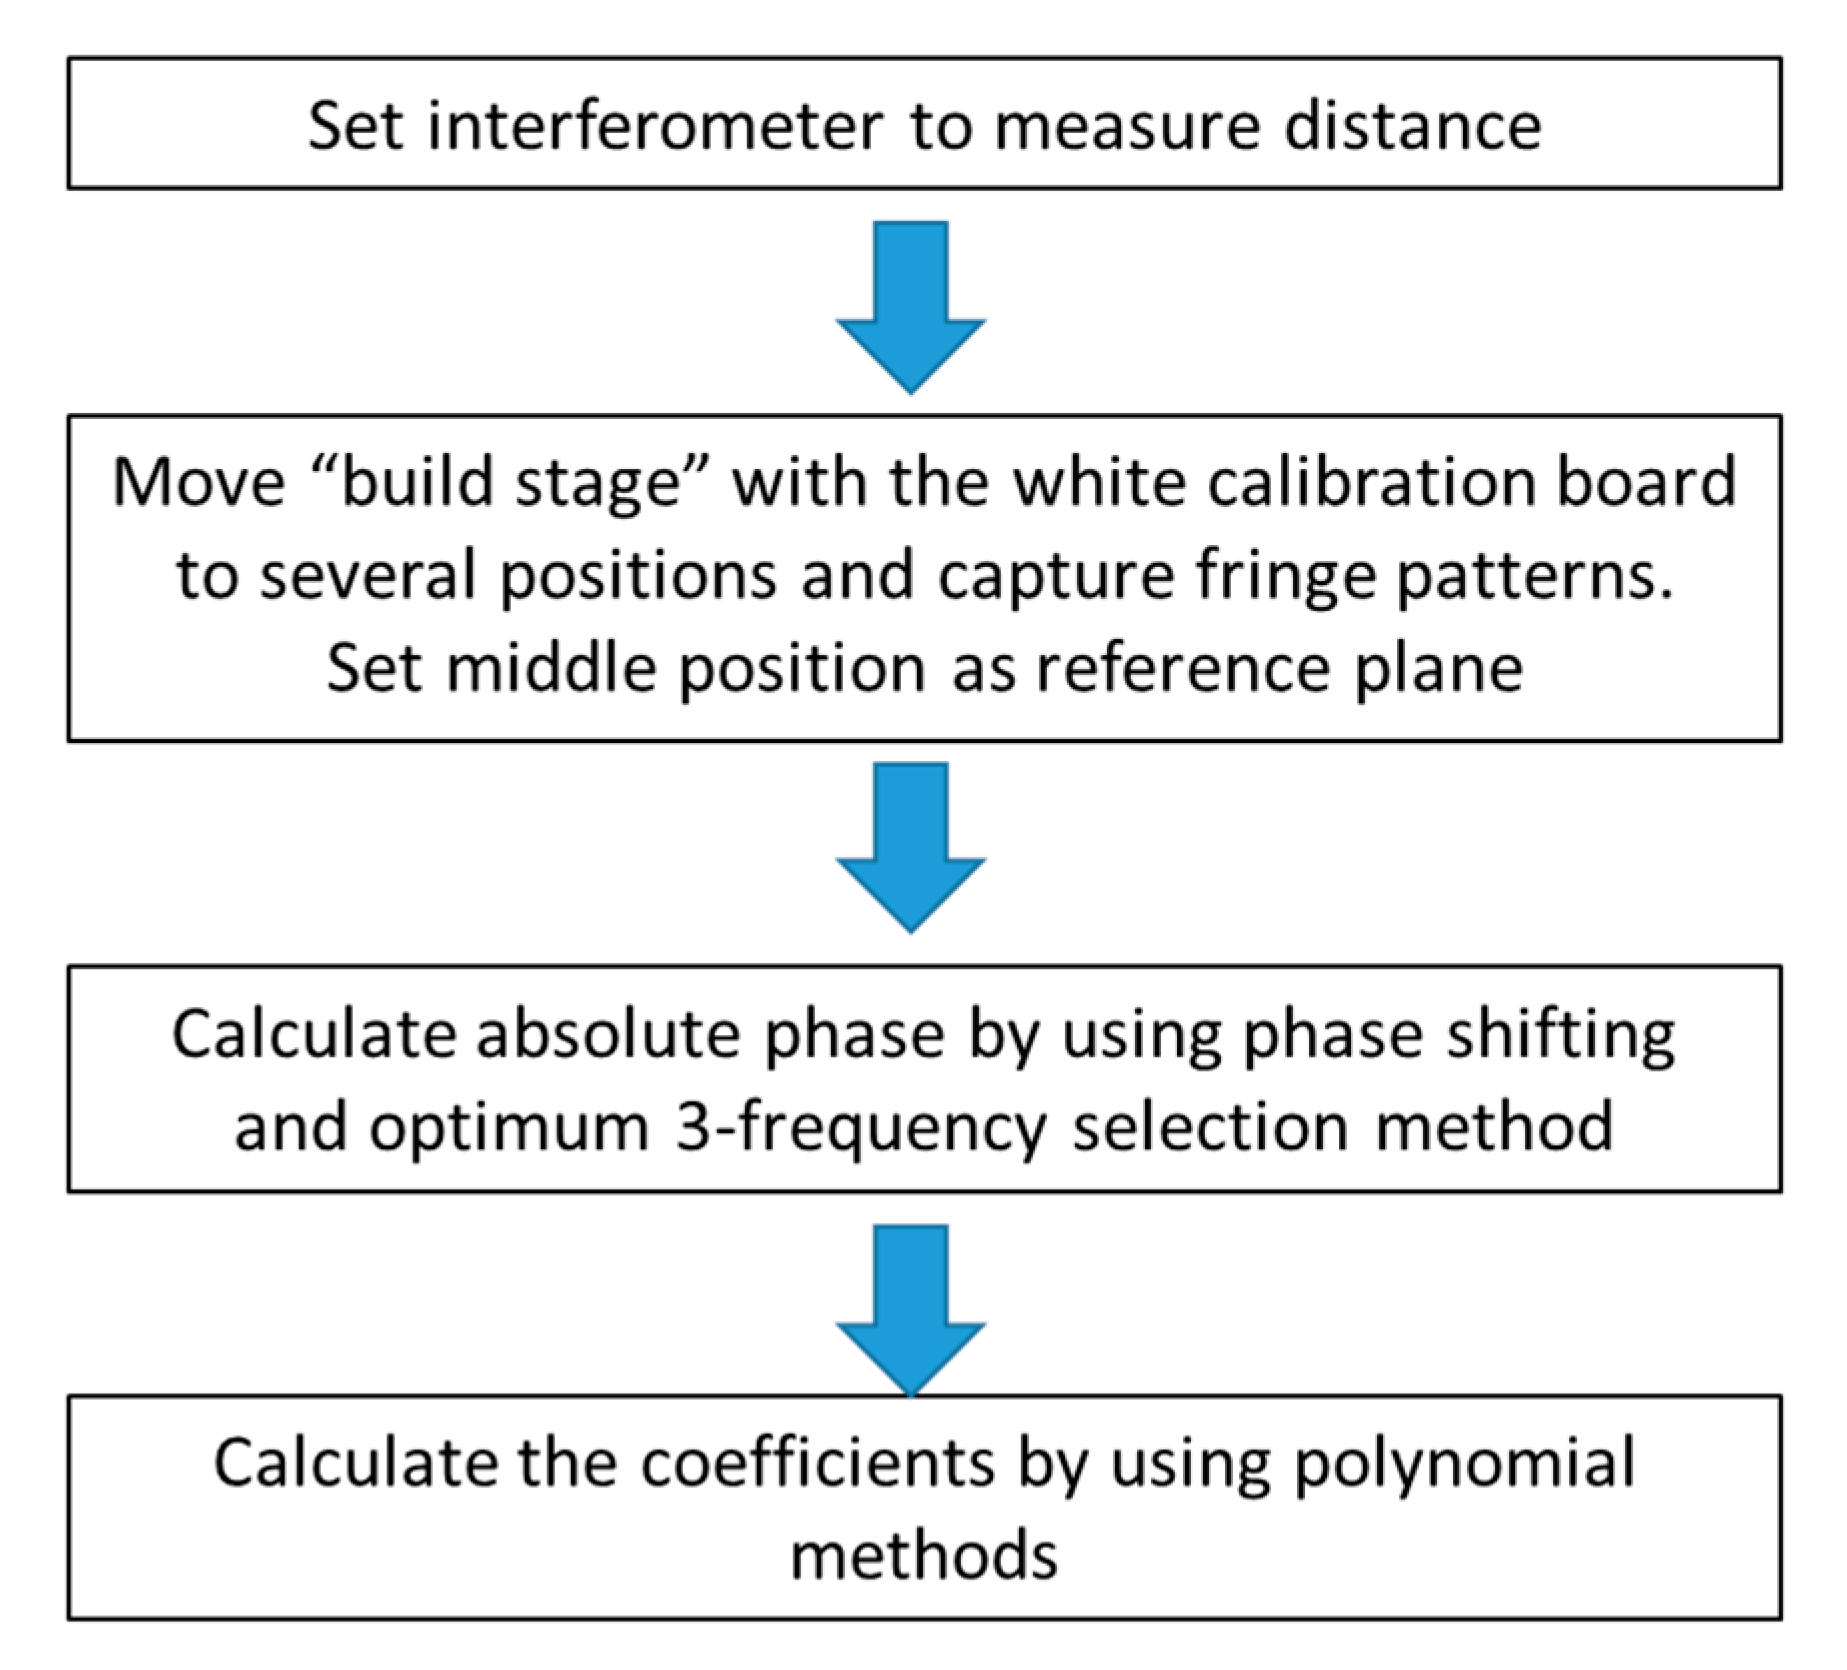
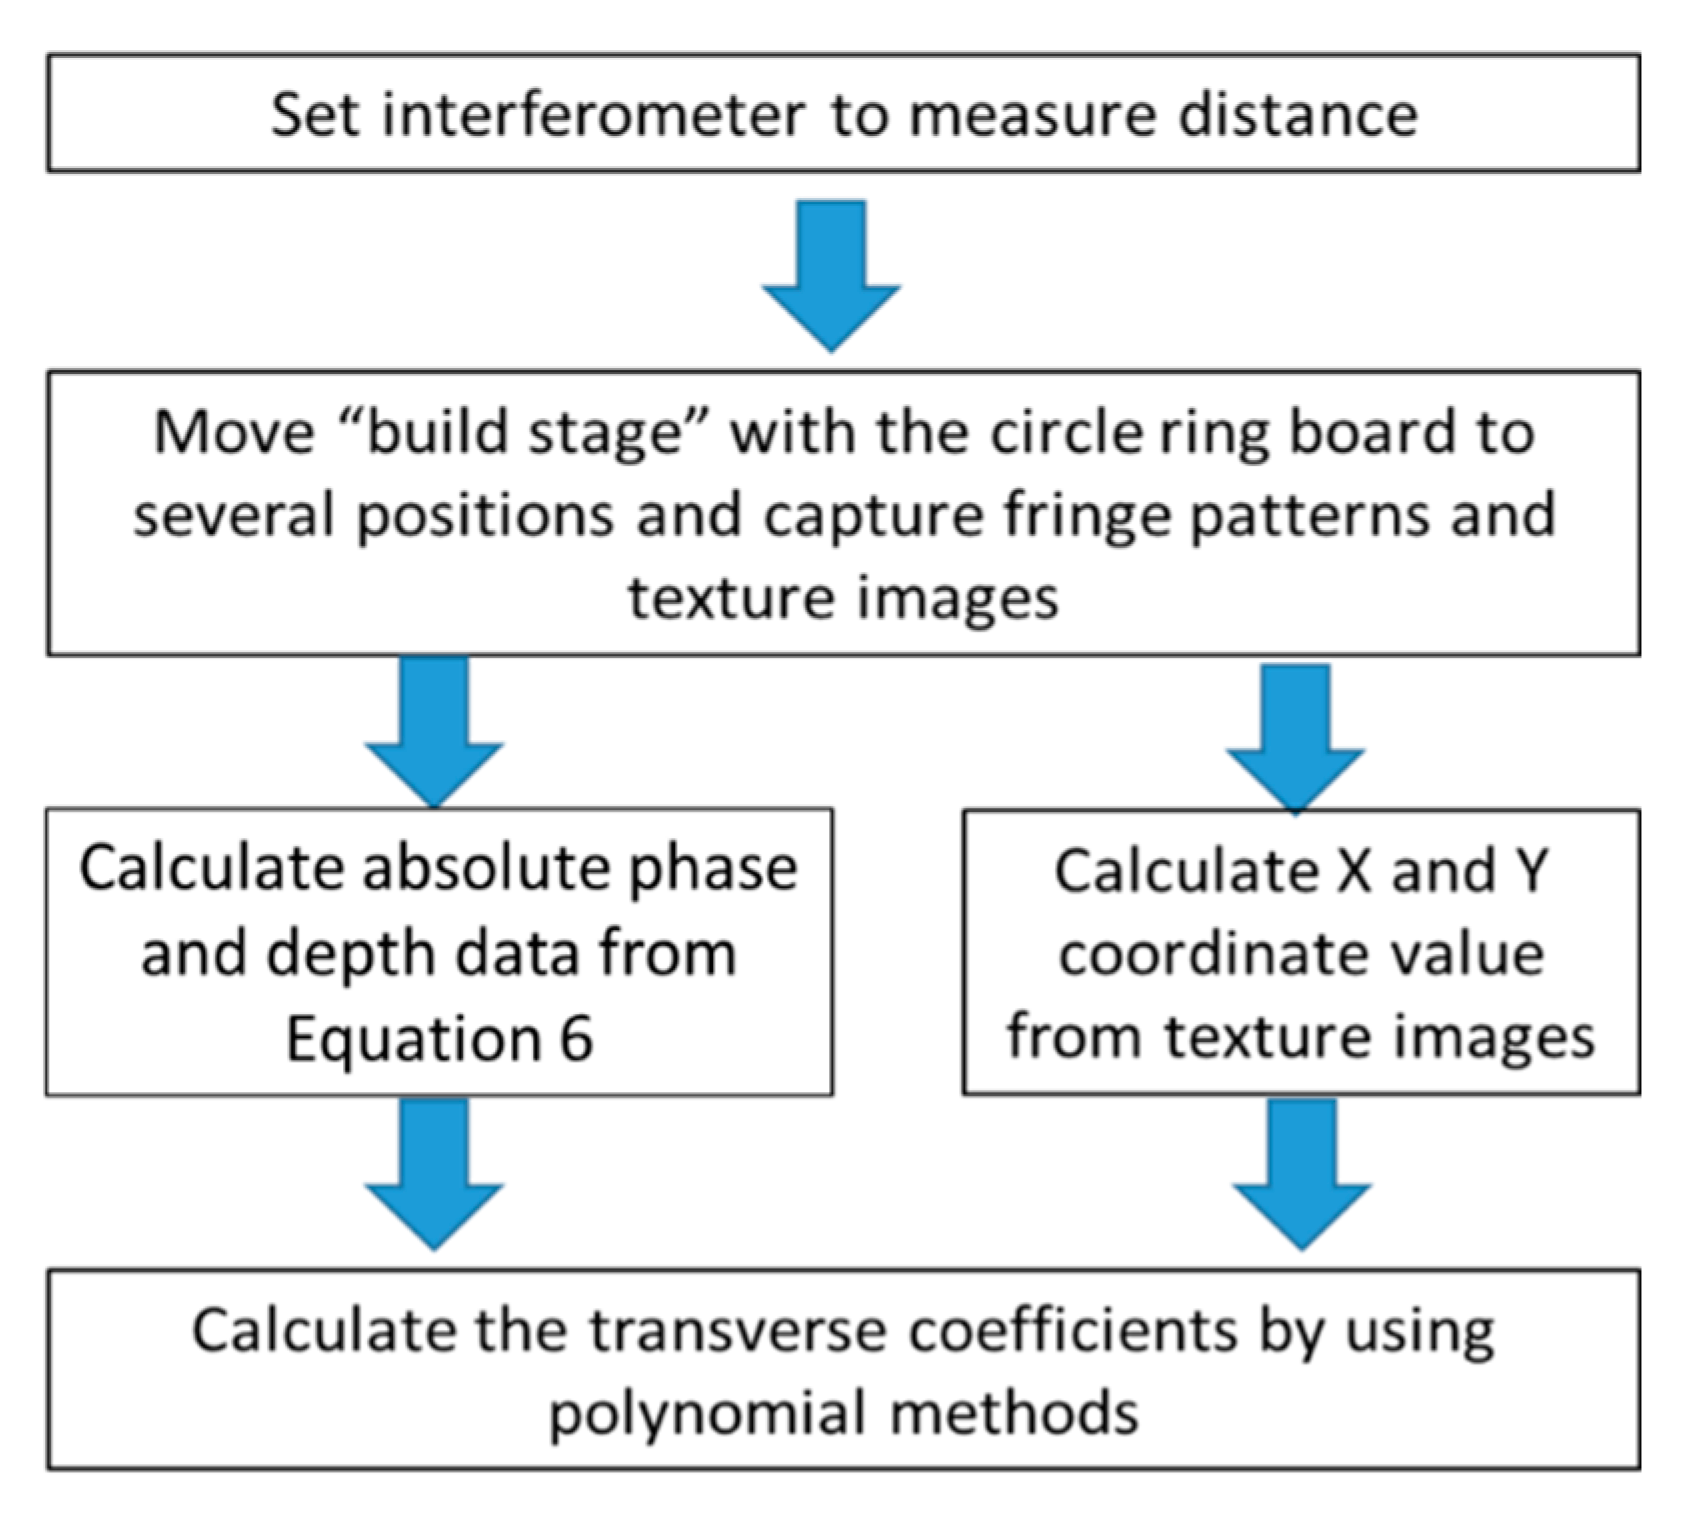
3.1. Calibration Method

In the system calibration, calibration plates with markers are often used. These markers are used to mark pixel positions to establish a positional relationship between pixel coordinates and spatial coordinates. The checkerboard mark, as shown in Figure 5, is commonly used as a calibration board, but it is not the best choice for depth calibration because the light is absorbed by the black portion of the checkerboard, which will affect the accuracy of phase acquisition. Therefore, it is necessary to select a calibration plate that can mark the pixel position and affect the phase acquisition accuracy to the least extent. Therefore, a certified ceramic flat plane with concentric circle rings with known separation distances was employed, as shown in Figure 2a. Due to the presence of the black circle rings on the calibration board, they will still affect the phase value as shown Figure 2b. The captured fringe patterns have low fringe contrast, which results in phase error and measurement error. The circle ring area is black which can absorb the light intensity, and the profile image of the absolute phase difference that crosses the circle ring area is shown in Figure 2b.
A simple calibration method can be used to solve this issue. It can be applied to the system, which requires higher accuracy in the vertical direction but lower accuracy in the transverse direction.
Figure 6 shows the procedure for the calibration method. The calibration method is a two-part calibration: (i) depth calibration and (ii) transverse calibration. In the depth calibration, a fifth-order polynomial as shown in Equation (6) needs to be fitted. The phase and depth information are nearly a linear relationship, though some researchers, however, use a linear model to solve the problem [6]. A fifth order polynomial was employed here to improve the measurement accuracy. The impact of the degree of the polynomials was investigated, and it was found that the accuracy was significantly increased initially, but the improvement became negligible when the order was higher than five. Therefore, a fifth-order polynomial was the optimal choice, balancing the accuracy and the computational complexity. A white flat calibration board is employed to obtain the clean phase data:
Δ H = a 0 + a 1 Δ φ + a 2 ( Δ φ ) 2 + a 3 ( Δ φ ) 3 + a 4 ( Δ φ ) 4 + a 5 ( Δ φ ) 5
Δ φ is the phase difference between the reference surface and the position of the calibration surface, which is obtained from the whiteboard. Δ H is the corresponding movement distance between the reference surface and the calibration position.
In practical application, the whiteboard is placed on the ‘build stage’ and moved to 21 positions. The simulation experiment of the number of moving positions was carried out in a previous paper [19]. When the number of movement positions is more than 20, the measurement accuracy of approximately six microns can be achieved. Based on the position of the calibration board, the middle position is taken as a reference surface. Based on the reference surface, a reference coordinate system (representing the world coordinate system) can be constructed. Movement is implemented in the Z axis. At each position, the movement distance can be measured by an independent traceable distance interferometer. At each position, the fringe patterns are projected onto the white calibration board. The phase information from the projected fringe patterns of the calibration board is collected. After being moved to 21 positions, 21 absolute phase maps can be obtained along with the corresponding moving distance measured by the interferometer (AM machine z scale). Based on this obtained phase data and depth data, namely Δ φ and Δ H , a least-squares algorithm is applied to optimize the coefficient values of Equation (6). A set of high accuracy coefficients of Equation (6) can be calculated pixel by pixel, which as a result of the least squares fitting, do not now have the black ring effect.
After obtaining the coefficients of Equation (6), the depth calibration is completed. The whiteboard is replaced by the circle ring board on the ‘build stage’. The circle ring board is moved to 10 positions, which are in the field of calibrated depth. The same sinusoidal fringe patterns are projected on the circle ring board. The camera captures them and a texture image at each position. The phase maps and the corresponding marked points images are obtained. The height difference between the movement position of the circle ring board and the reference surface can be calculated by Equation (6). A cross-section line of the calculated height was selected where it does not intersect any ring area, and the selected height was fitted by the polynomial equation. The fitted height was used for calculating the coefficients of transverse direction, namely in Equations (7) and (8). Therefore, the coefficients of Equations (7) and (8) are optimised by using the fitted height results and the world coordinates of X and Y calculated by the centre of the concentric circle as parameters. Figure 7 shows the procedure. The transverse calibration is now completed:
X = b 1 + b 2 Δ H + b 3 ( Δ H ) 2
Y = c 1 + c 2 Δ H + c 3 ( Δ H ) 2
Consequently, the geometric relationship between the camera and the projector can be determined.

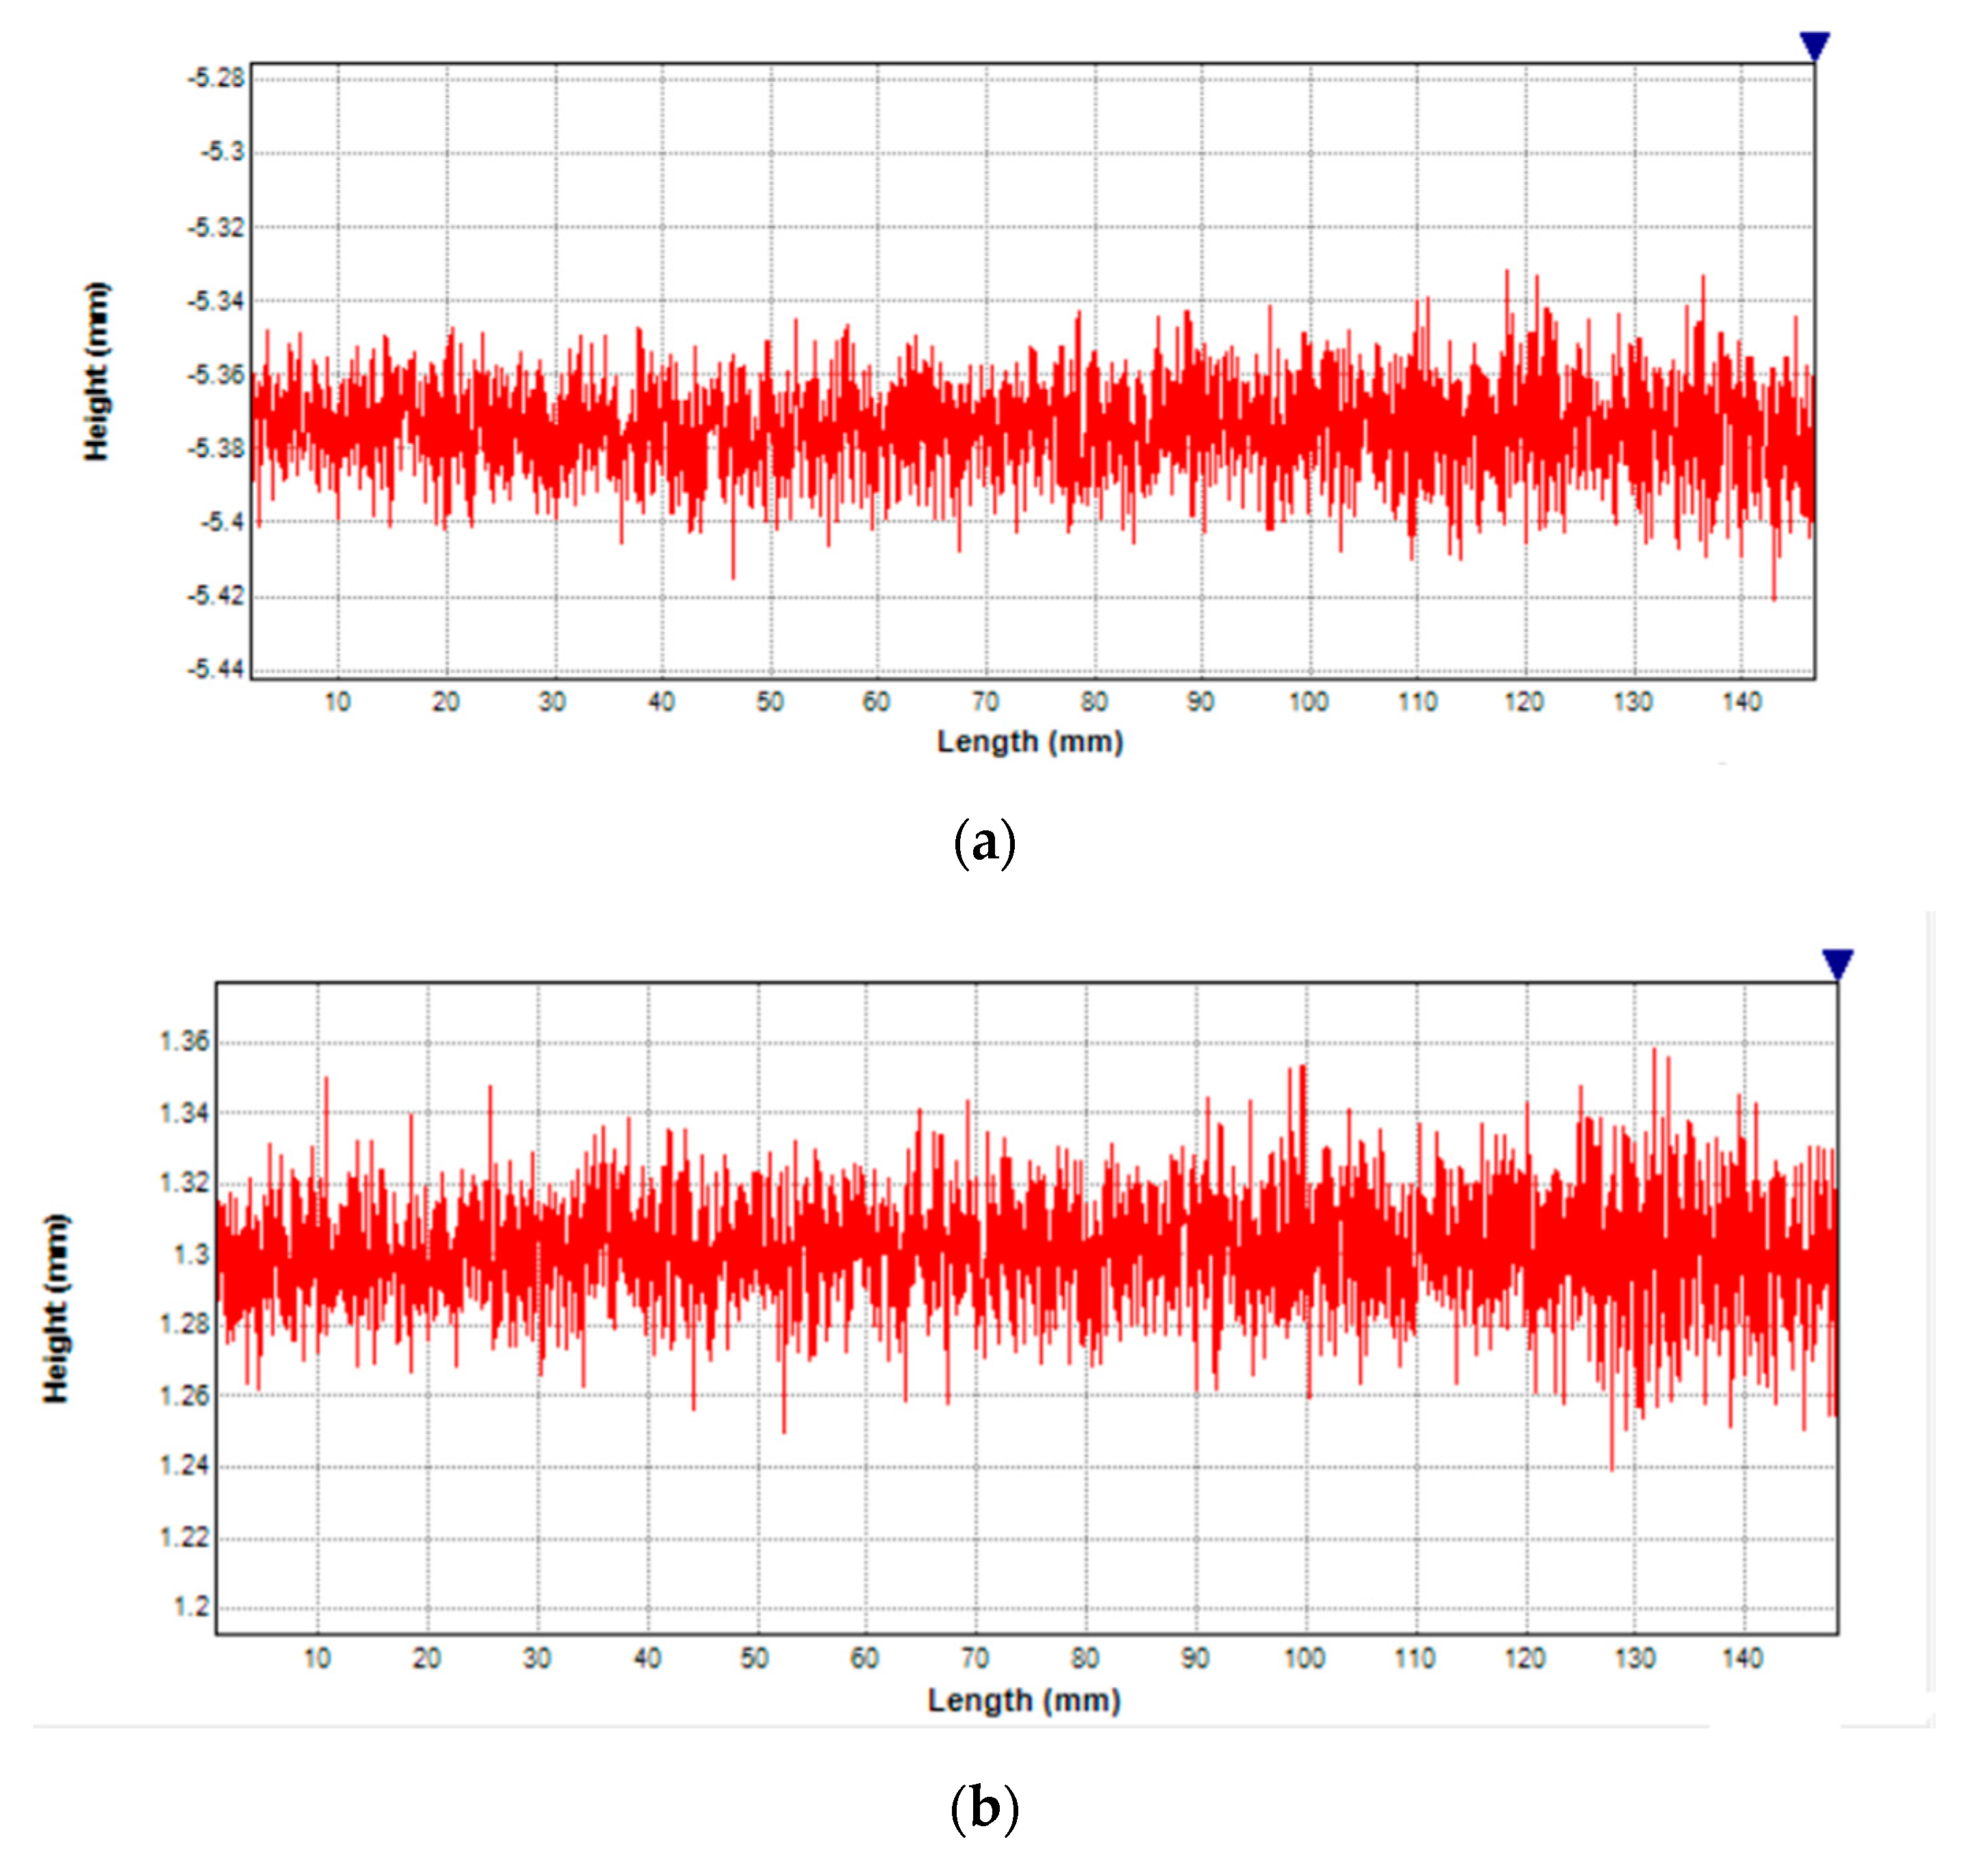
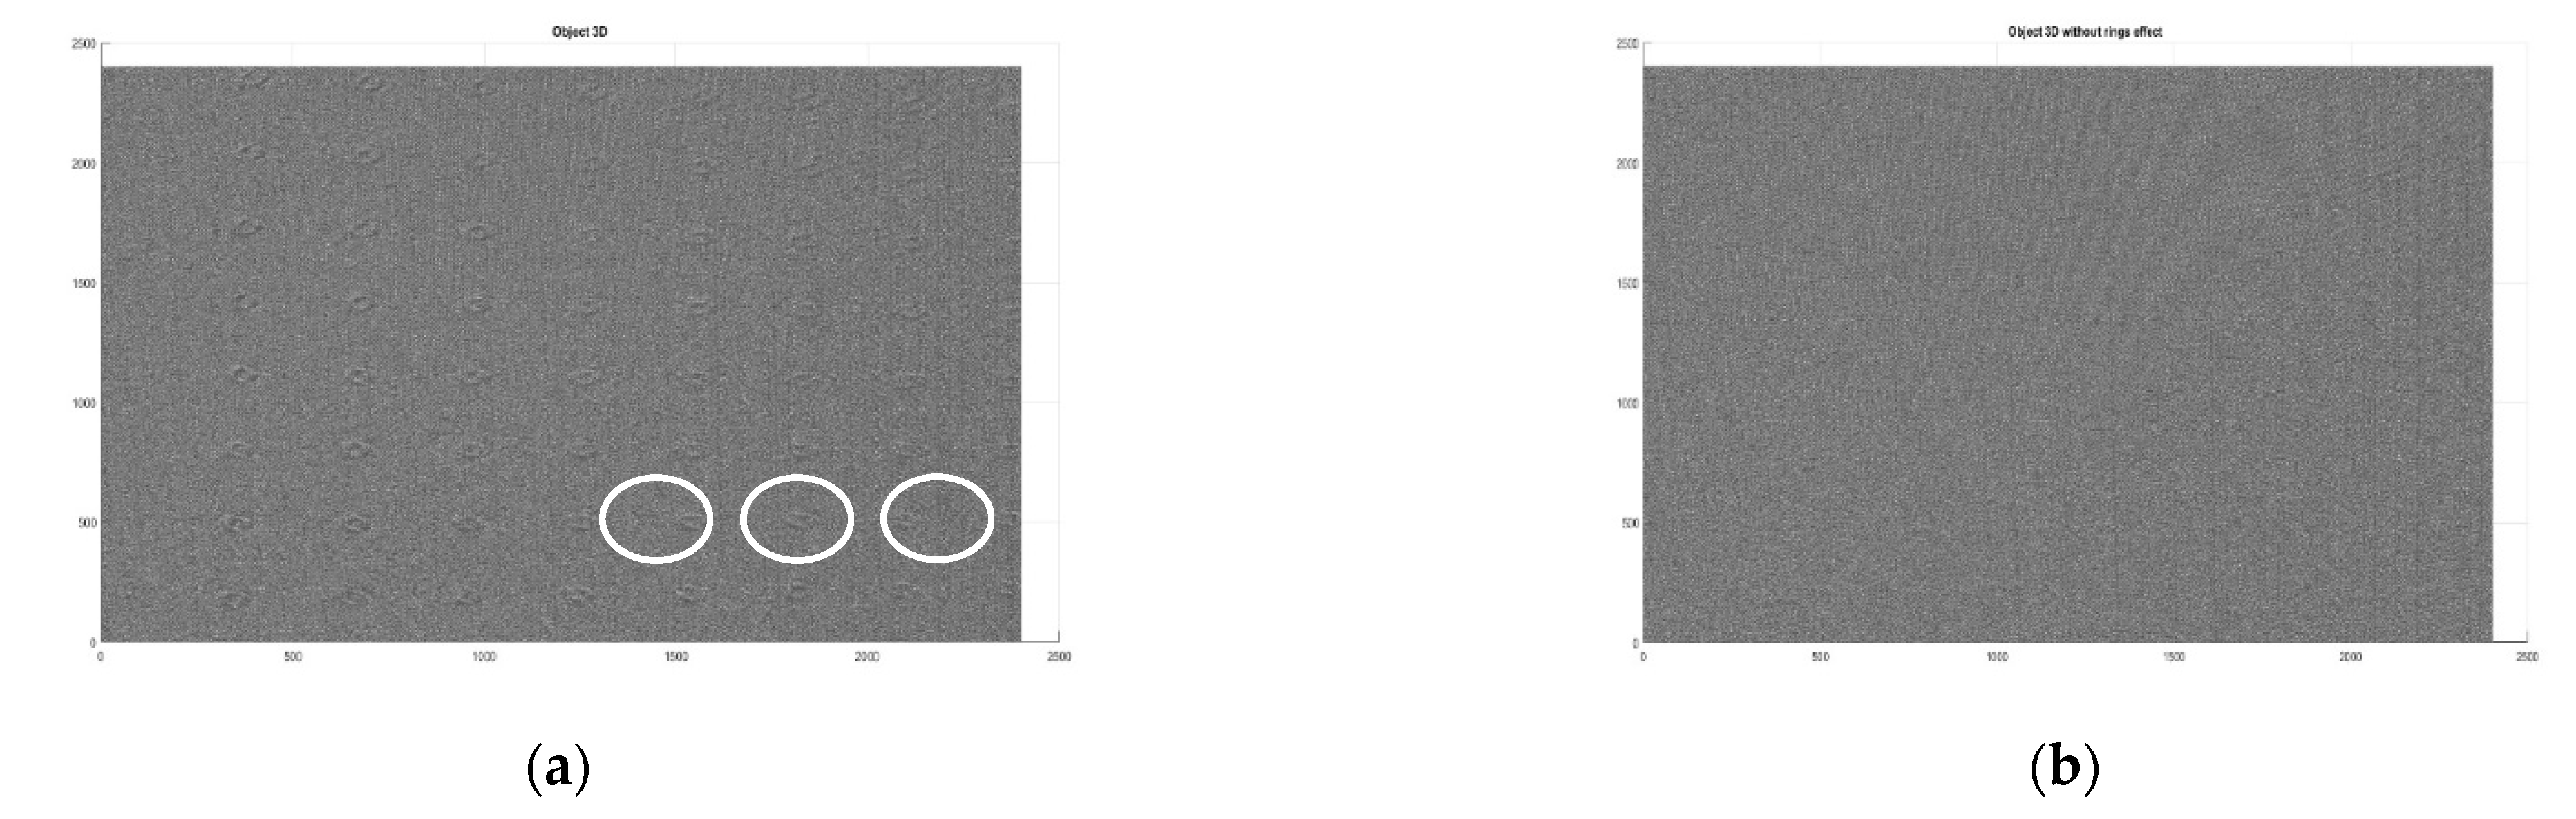
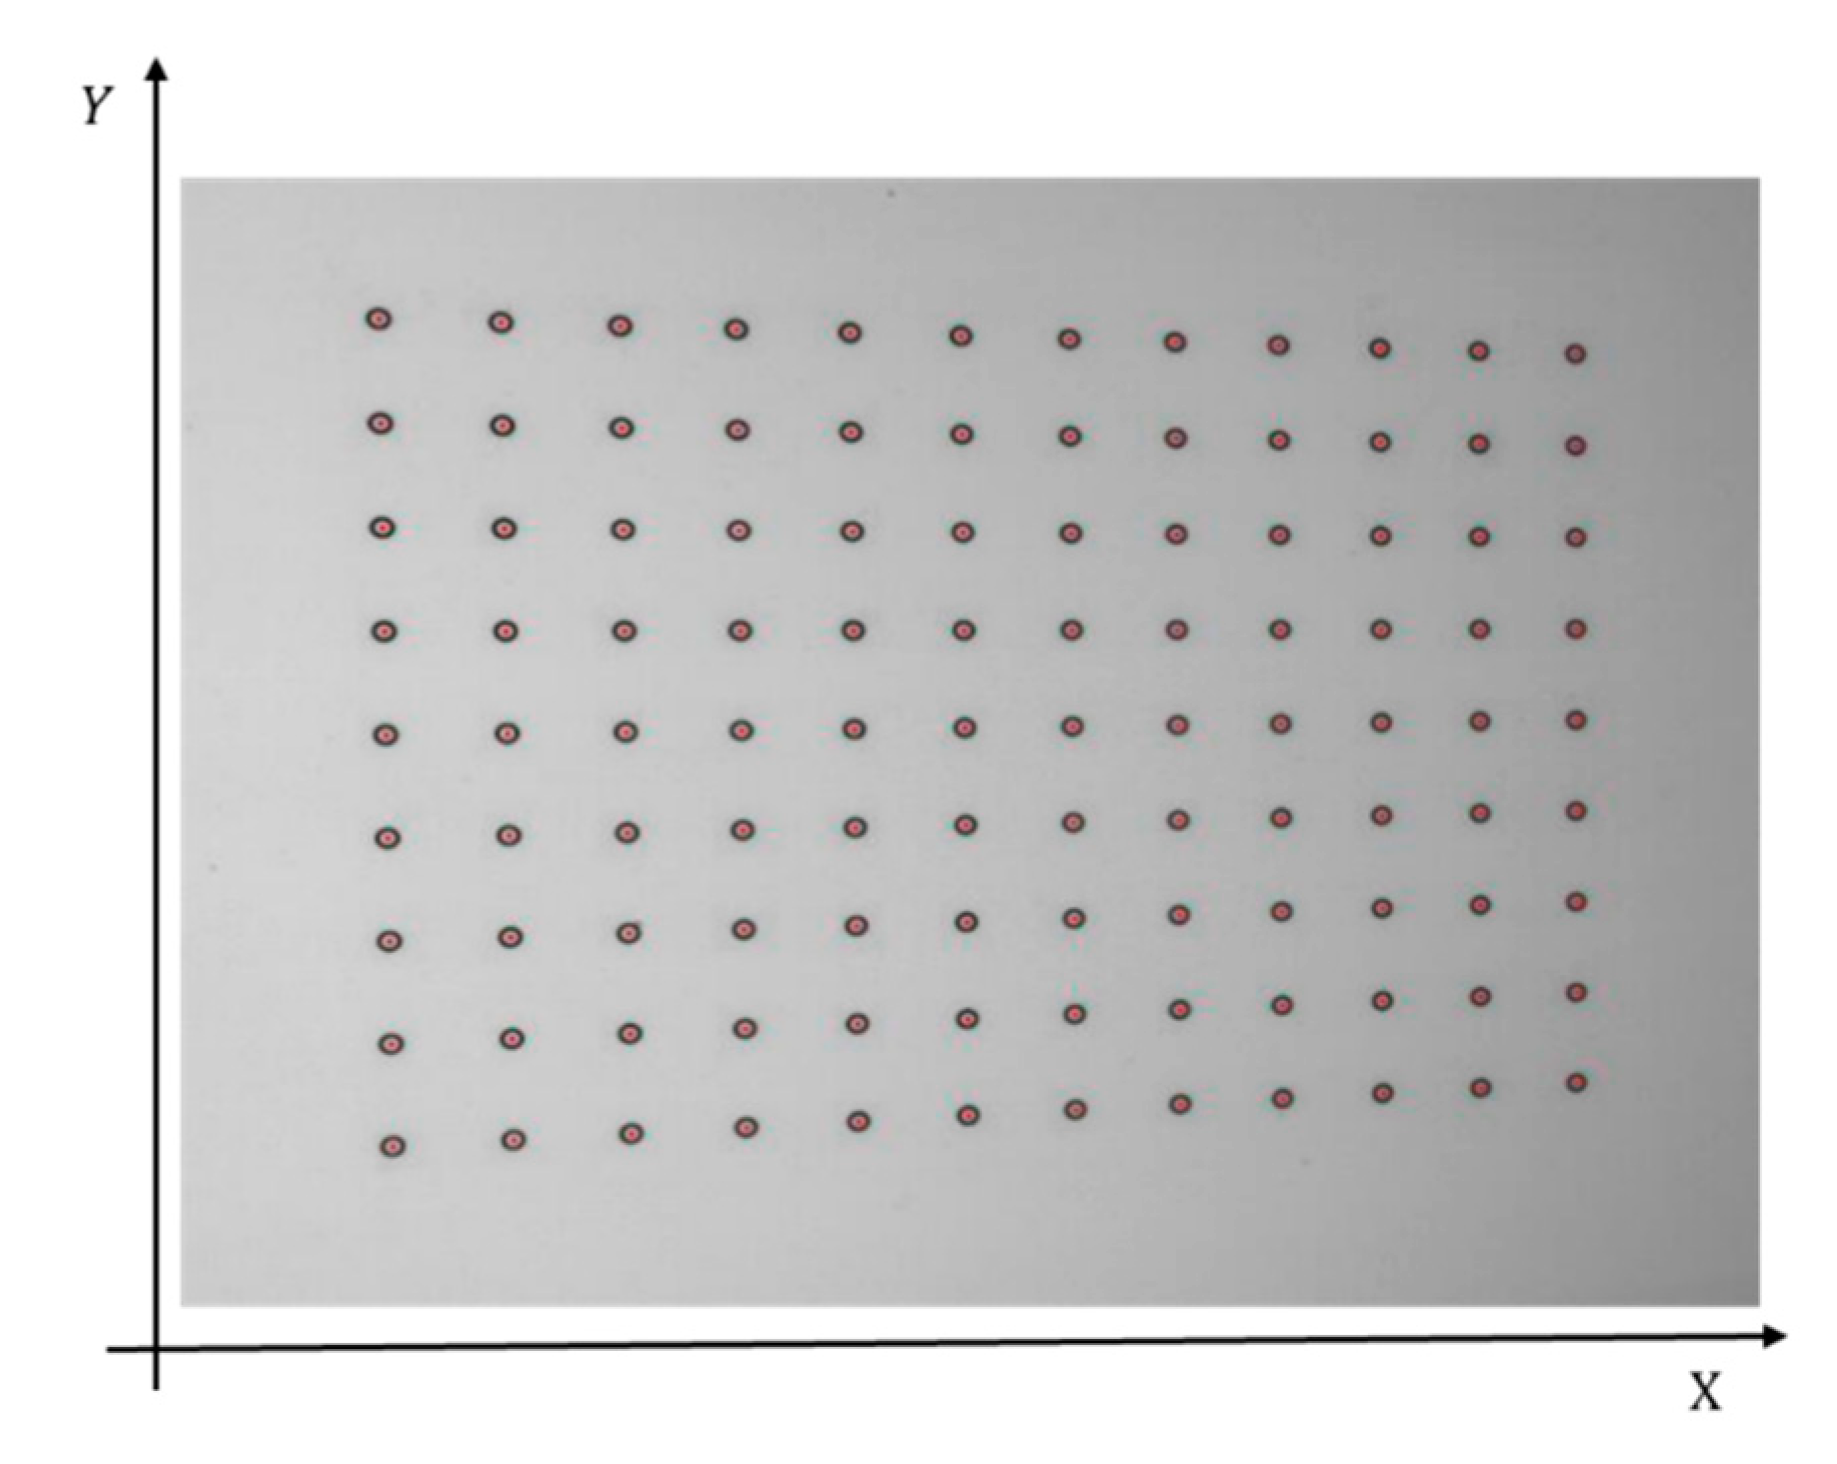
3.2. Calibration Results

To verify the proposed calibration method, a white plate was measured by two methods. The depth data were calculated from the circle ring plate calibration results, as shown in Figure 8a. The depth data were calculated using the proposed calibration results as shown in Figure 8b. It can be seen that the circle rings effect was eliminated by comparing the two calibration results. It can be concluded that the proposed calibration method effectively reduced the marker effect of the ring marks in the calibration process.
In order to verify the measurement accuracy of the system, the verification method was divided into two steps: horizontal direction and vertical direction. For the horizontal direction verification, texture images of four positions were collected within the calibration range, and the centres of the rings were extracted and the distance between the centres calculated as shown in Figure 9. The calculated results were compared with the parameters reported in the calibration plate inspection report. The compared values are shown in Table 1. It can be clearly seen that the mean absolute error in the Y direction is higher than that in the X direction, which is because there is an angle between the optical axis of the camera and the normal line of the calibration plate when the camera is operating. As a result of the angle between the optical axis of the camera and the normal line of the calibration plate, a perfect circle becomes an ellipse in the camera view. The centre of the ellipse extracted in the X direction deviated from the true centre of the circle, while the deviation between the extracted centre of the ellipse and the true centre in the Y direction was small, so the accuracy in the Y direction was higher.
For the vertical direction verification, the calibration board was placed at two known vertical positions. At each position, the board was measured by an independently certified interferometer with a resolution of 1 nm. The plate was positioned at approximately −5.4 mm and 1.3 mm with respect to the testing plane, as measured profile images from the board are shown in Figure 10. The measured distance obtained by the interferometer was taken as the ideal value and was measured 20 times. The measured average distance detected by the inspection system, the absolute error between the measurement results and the ideal value and the standard deviation are listed in Table 2. The maximum absolute error was 25.9 μm. The standard deviation was approximately 17 μm. Compared with the previous reported method [19], the standard deviation from the proposed method is approximately 16.8 μm close to the 15.8 μm in the previous paper. However, the method applied in this paper is four steps of phase shifting, and the previous paper was an eight-phase shifting approach. The proposed method reduced measurement time and improved measurement efficiency without compromising error.

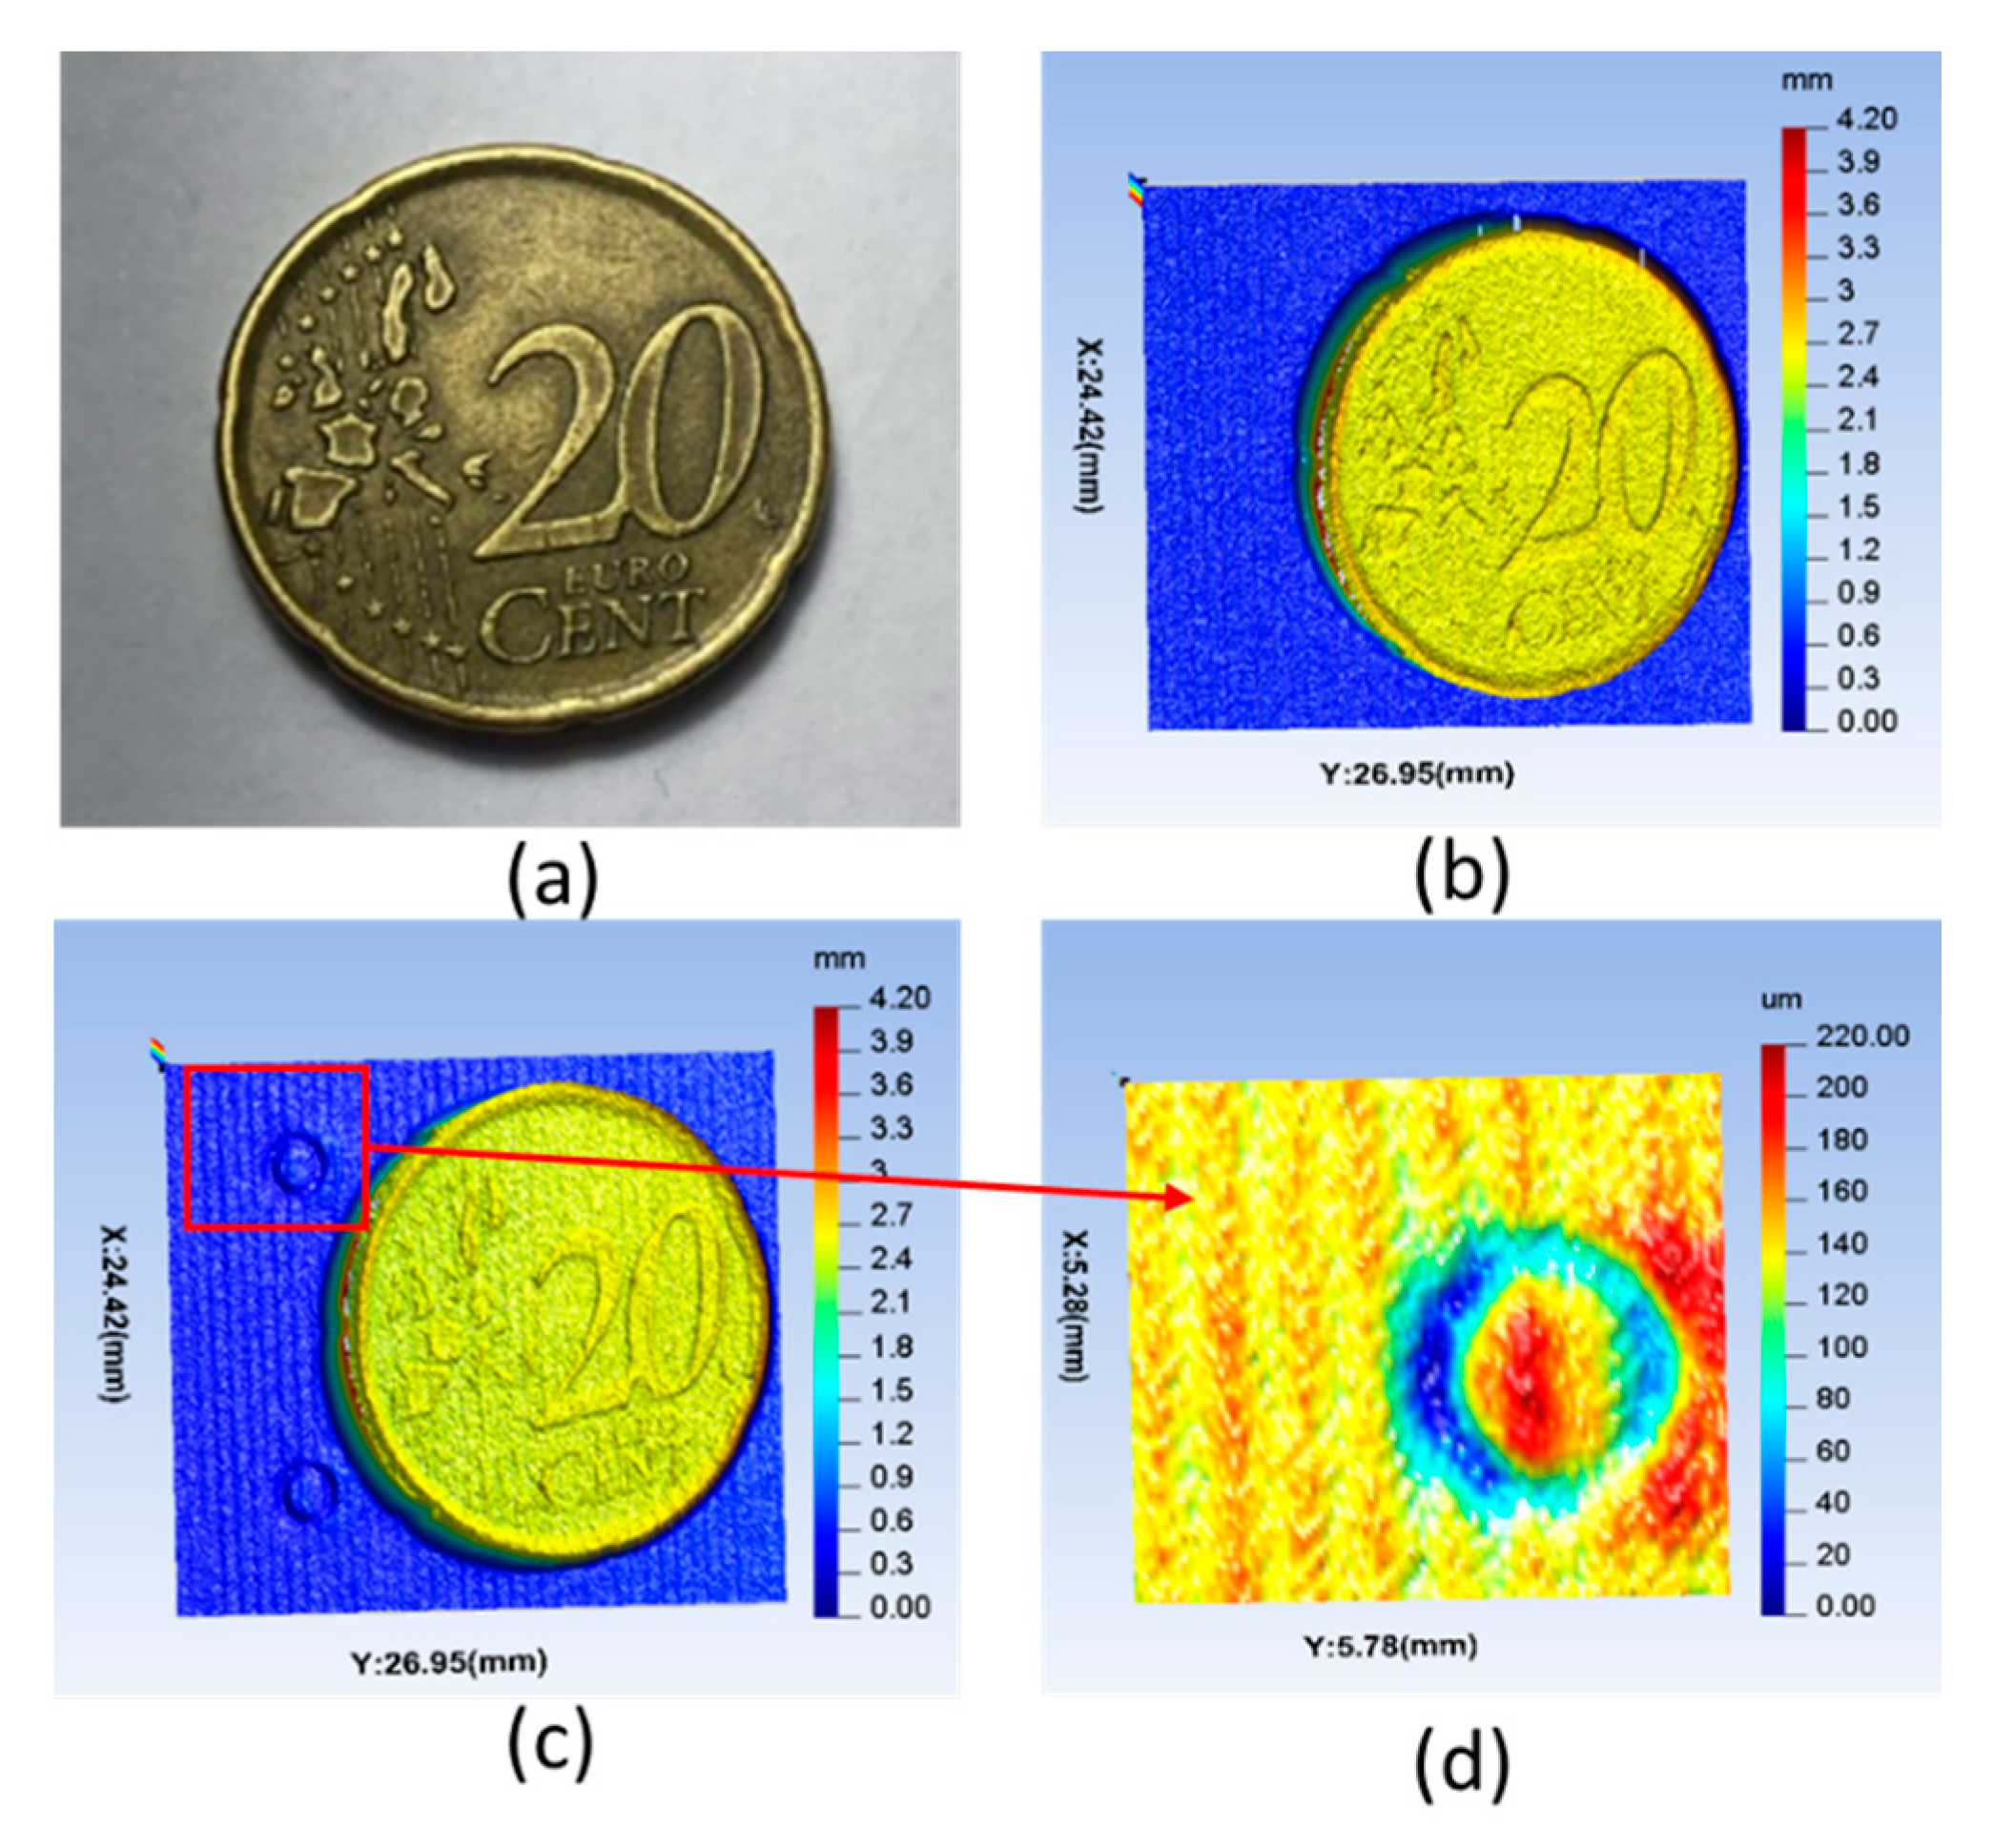
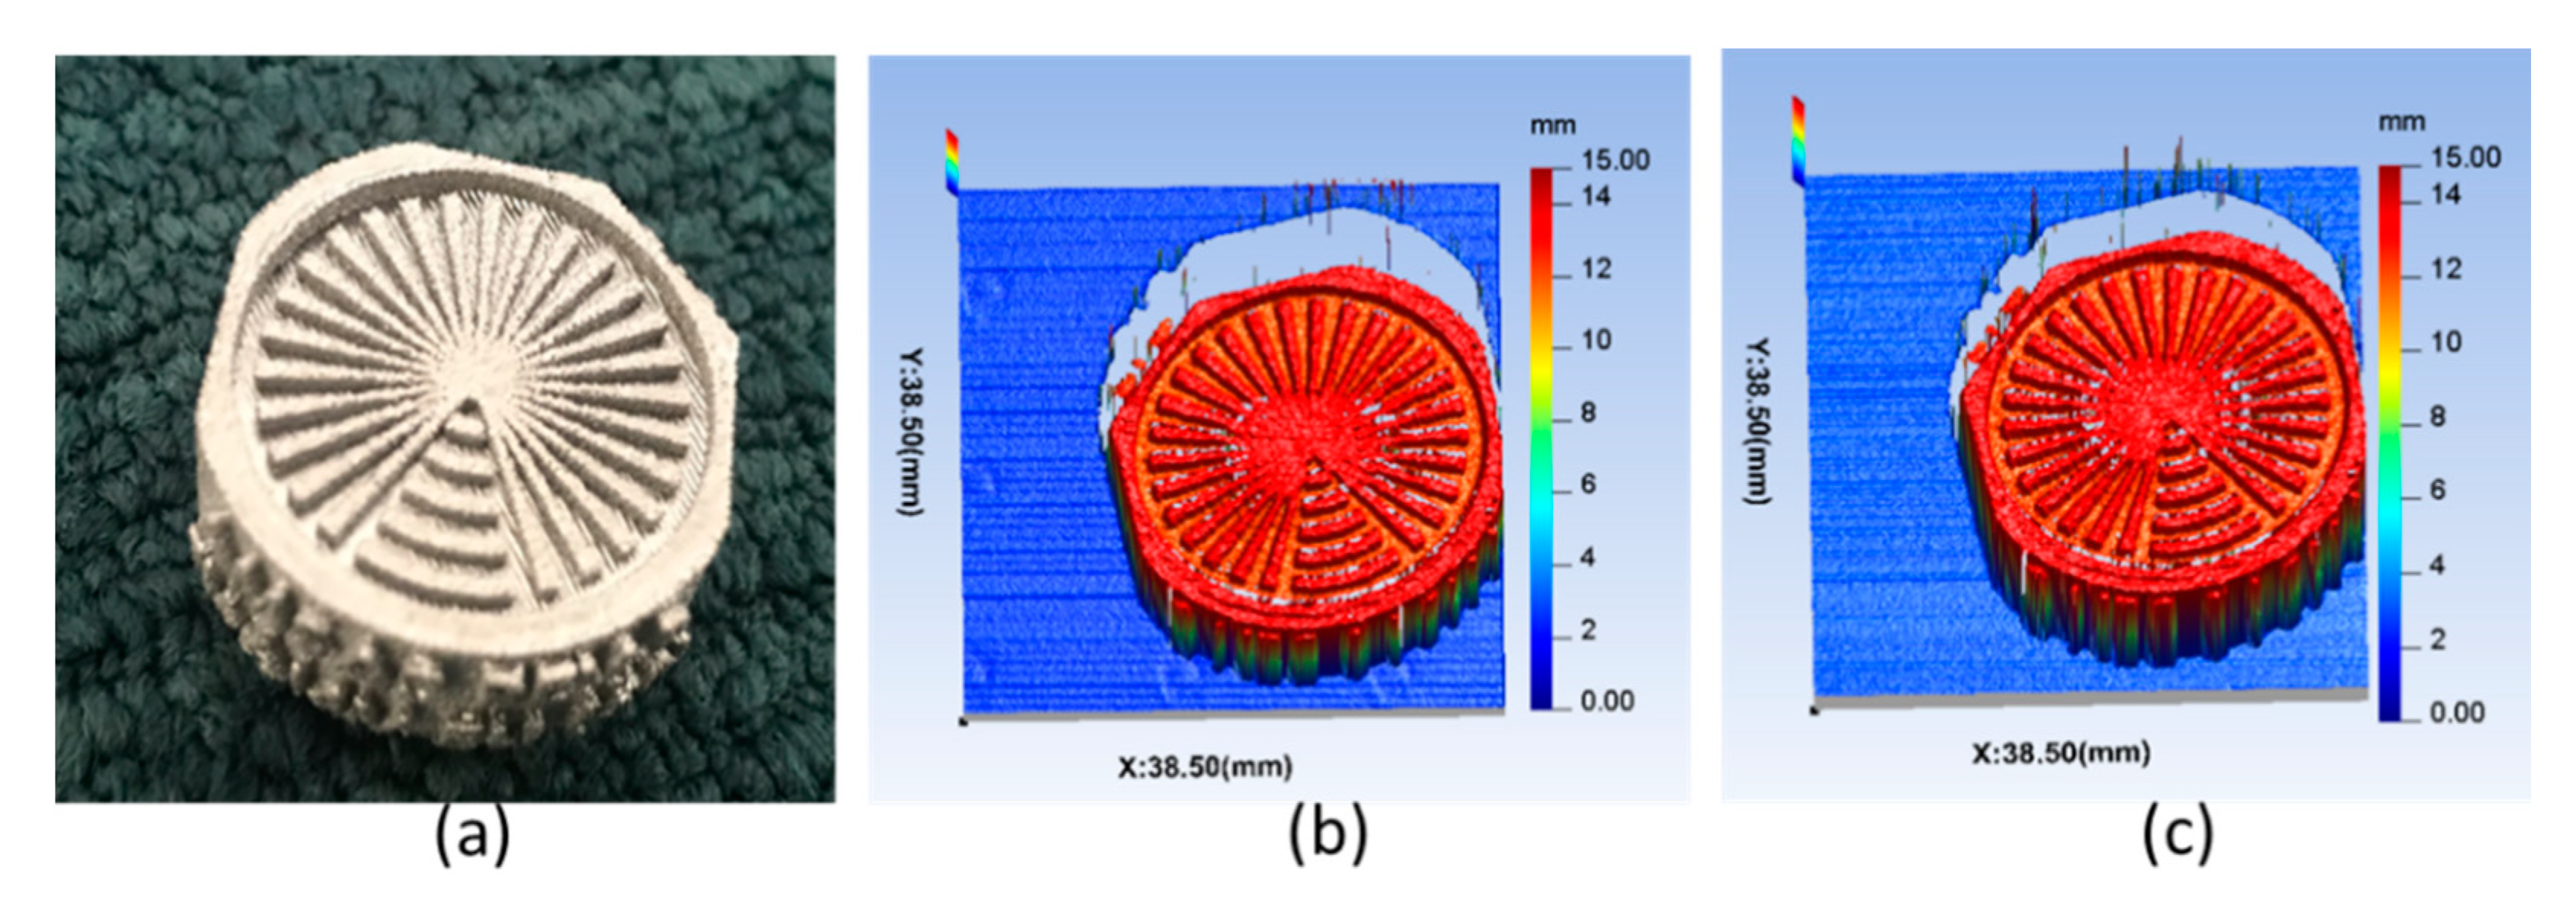
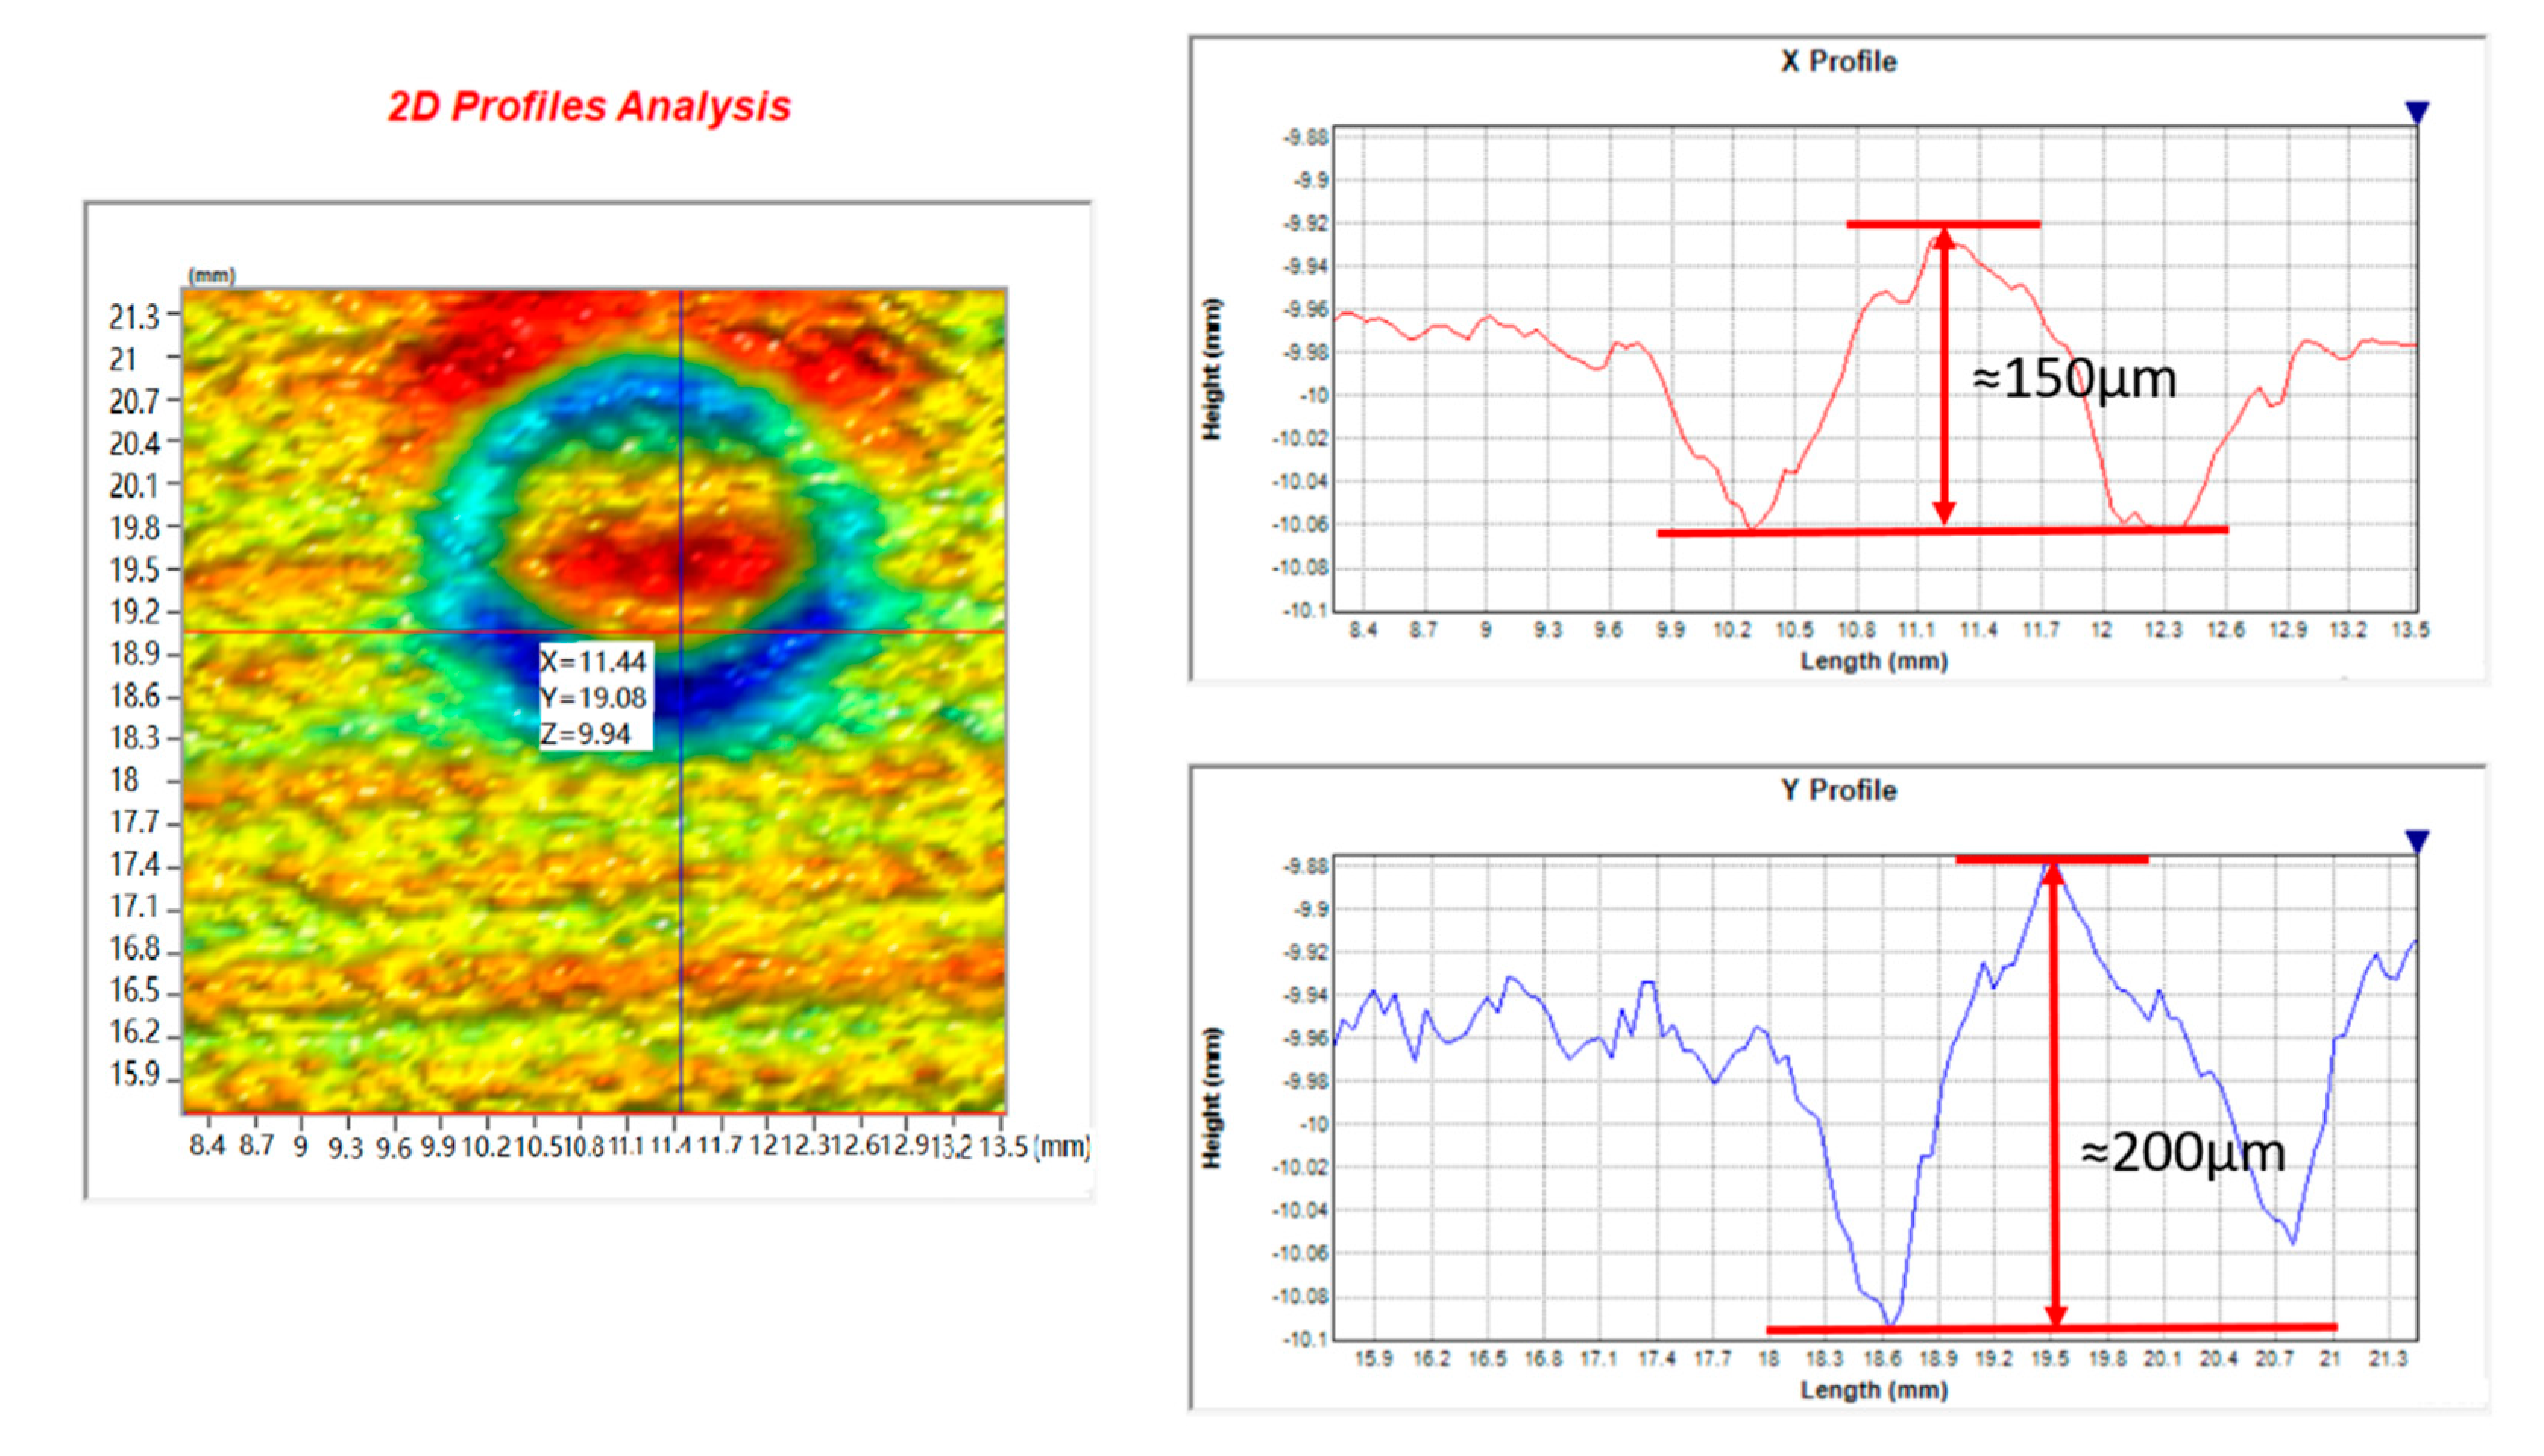
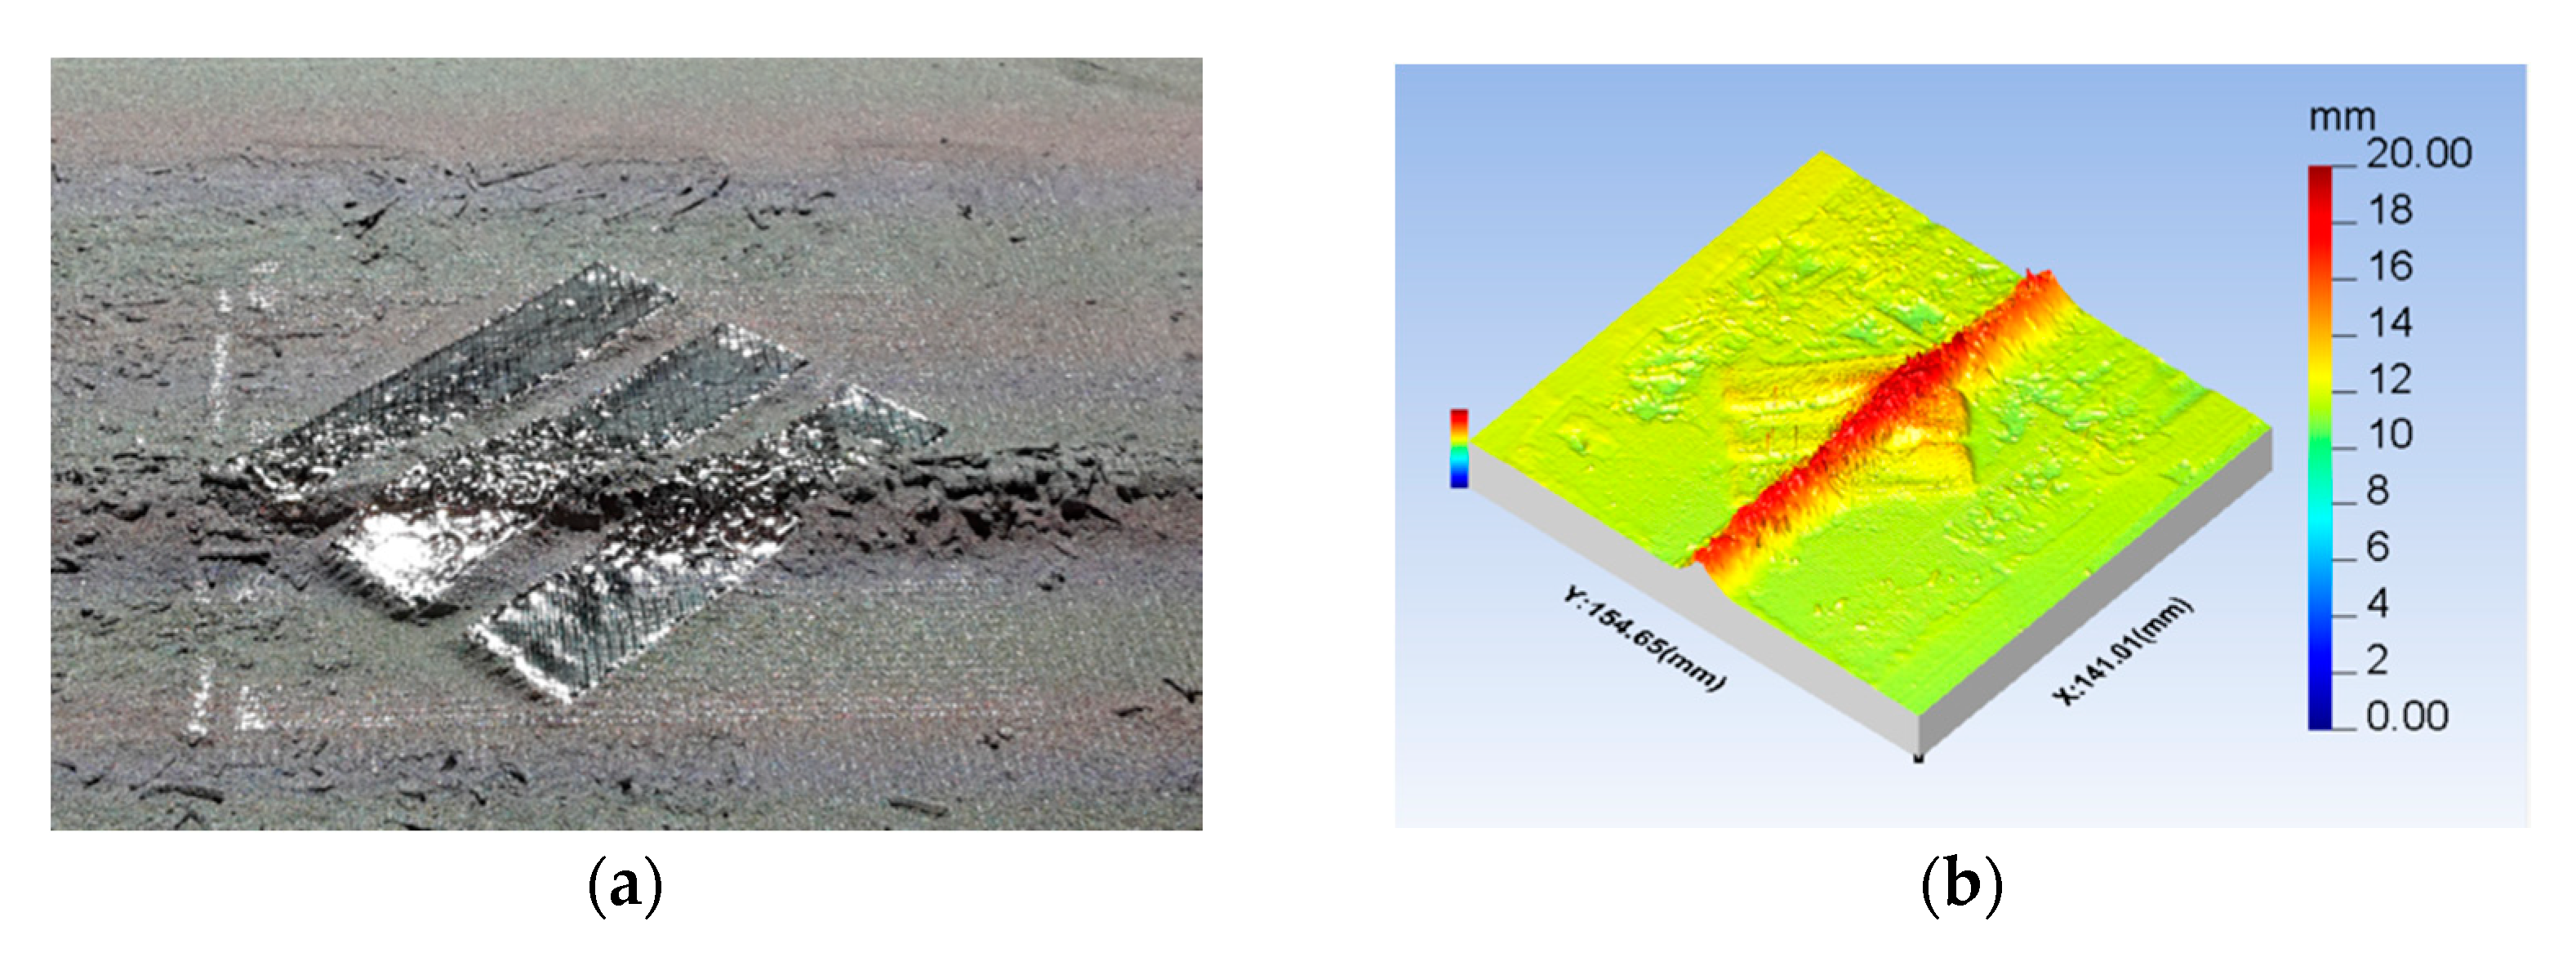
4. Experiments and Implementation

The fringe projection system hardware consisted of a computer, a CCD camera and a projector. The CCD camera is an industrial camera (model evo12040MBGEB) from SVS with a resolution of 3016 × 4016 pixels. It supports external and internal triggers. The projector is an industrial digital projector (Light Crafter model 4500) with a resolution of 912 × 1140 micromirror array. The resolution requirement of the AM inspection system is 50 µm (approximately the AM powder particle size). Figure 11a shows a proof-of-concept experimental setup for the fringe projection system, and Figure 11b shows the fringe projection system embedded into a commercial EBM machine. The calibration process for the experimental system uses an interferometer, and within the EBAM machine, an ultra-precision machine transfer table with an independent positional scale is used for calibration.
3D results of proof-of-concept measurement samples are shown in Figure 12, Figure 13 and Figure 14. Figure 12 was a 3D measurement result of a coin. Figure 12a shows a twenty-cent coin. Figure 12b shows the 3D measurement results of the coin after corrections by the proposed method. Figure 12c shows the 3D measurement results of the coin before corrections. Figure 12d was the zoomed error area of 3D measurement results. The proposed calibration method clearly eliminated the effect of the rings. Figure 13 illustrates the profile of the zoomed error area. It can be seen that the range of the error is from 150 μm to 200 μm in the ring region without correction. If the ring effect were not corrected for, then the ring effect hidden in the calibration coefficient would lead to a measurement error of 200 μm in the ring area.
An Ebeam AM printed metal sample was measured by the fringe projection system, as shown in Figure 14a. The printed metal part with radial grooves and bulges is used for evaluating the manufacturing resolution. The measured results were consistent with the manufacturing resolution. Comparing results with the proposed method and without corrections method shows that the ring effect was eliminated and the measurement error of the rings area has been improved by 150 μm to 200 μm.
Full implementation with corrections is shown in Figure 15. The figure shows the application of the proposed in situ system within the EBAM machine. Three-test parts are seen with evidence of edge swelling at the part edge contouring lines. Additionally, and more critically in terms of machine feedback, an example of excessive powder delivery is shown. This error is due to powder rake damage and is visible. Such excessive powder delivery can be quantified and if this meets a critical threshold then the build will be terminated via the link between the measurement system and the machine control. The time of the whole inspection was less than 2 s. The time for the system calibration process was approximately 30 min. All equipment was mechanically fixed and one to two months recalibration checks are needed to maintain the measurement accuracy.

5. Conclusions

In this paper, based on the phase-depth calibration model, a polynomial method was investigated for measurement system calibration. The proposed fringe projection system was employed in a commercial EBAM machine for processing quality inspection. The 3D shape of the powder bed and part geometry were accurately constructed after the system calibration. The fringe projection system was shown to be able to inspect the powder delivery and metal printed parts during the build process. The inspection improves the process quality and facilitates process control. A simple novel calibration method was developed to facilitate system calibration to improve measurement repeatability and vertical resolution. This method applied a whiteboard for depth calibration and a circle ring board for transverse calibration. The proposed method avoids the phase error caused by using the ring calibration plate in the depth calibration. The form of the powder bed and the printed parts can be measured with higher precision and speed after the implementation of the proposed calibration method. The disadvantage is that the precision of transverse data is not high, because the depth data of transverse calibration are obtained through the proposed system rather than the interferometer, and the depth measurement accuracy of the system is 20 microns, while the depth measurement accuracy of the interferometer is 1 nanometre. This is not considered as too serious as this is less than one powder particle, as used in EBAM. Experimental results show that the fringe projection system has the capabilities to detect the state of powder bed and printed sample. Moreover, this method can be used not only in AM but also in other fields.
There are, however, several future research directions for improving system performance, namely (1) processing speed: reducing the projection images number and investigating fast processing algorithms; (2) intelligent control: employing machine learning algorithms for the recognition and classification defects; and (3) transverse calibration precision: improving the extraction accuracy of the rings and the obtained depth precision during the transverse calibration.

Author Contributions

Conceptualization, Y.L. and L.B.; methodology, Y.L.; software, Y.L.; validation, Y.L. and F.G.; formal analysis, F.G.; data curation, Feng Gao; writing—original draft preparation, Y.L.; writing—review and editing, F.G.; supervision, X.J.; project administration, X.J. and L.B. All authors have read and agreed to the published version of the manuscript.

Funding

This research was funded by the UK’s Engineering and Physical Sciences Research Council (EPSRC) funding of Future Metrology Hub (Grant Ref: EP/P006930/1), the funding of “A Multiscale Digital Twin-Driven Smart Manufacturing System for High Value-Added Products” (EP/T024844/1), and Innovate UK for funding of the RAMP-Up project—Project Ref 59605-453176.

Institutional Review Board Statement

Not applicable.

Informed Consent Statement

Not applicable.

Data Availability Statement

Not applicable.

Acknowledgments

The authors gratefully acknowledge Wayland Additive Ltd. for EBeam machine access.

Conflicts of Interest

The authors declare no conflict of interest.

References

  1. Liu, S.; Shin, Y.C. Additive manufacturing of Ti6Al4V alloy: A review. Mater. Des. 2019, 164, 107552. [Google Scholar] [CrossRef]
  2. Townsend, A.; Senin, N.; Blunt, L.; Leach, R.K.; Taylor, J.S. Surface texture metrology for metal additive manufacturing: A review. Precis. Eng. 2016, 46, 34–47. [Google Scholar] [CrossRef] [Green Version]
  3. Ngo, T.D.; Kashani, A.; Imbalzano, G.; Nguyen, K.T.; Hui, D. Additive manufacturing (3D printing): A review of materials, methods, applications and challenges. Compos. Part B Eng. 2018, 143, 172–196. [Google Scholar] [CrossRef]
  4. Xu, J.; Zhang, S. Status, challenges, and future perspectives of fringe projection profilometry. Optics Lasers Eng. 2020, 135, 106193. [Google Scholar] [CrossRef]
  5. Liu, Y.; Blunt, L.A.; Gao, F.; Jiang, X.J. High-dynamic-range 3D measurement for E-beam fusion additive manufacturing based on SVM intelligent fringe projection system. Surf. Topogr. Metrol. Prop. 2021, 9, 034002. [Google Scholar] [CrossRef]
  6. Feng, S.; Zuo, C.; Zhang, L.; Tao, T.; Hu, Y.; Yin, W.; Qian, J.; Chen, Q. Calibration of fringe projection profilometry: A comparative review. Opt. Lasers Eng. 2021, 143, 106622. [Google Scholar] [CrossRef]
  7. Zhang, Z.; Zhang, D.; Peng, X. Performance analysis of a 3D full-field sensor based on fringe projection. Opt. Lasers Eng. 2004, 42, 341–353. [Google Scholar] [CrossRef]
  8. Jia, P.; Kofman, J.; English, C.E. Comparison of linear and nonlinear calibration methods for phase-measuring profilometry. Opt. Eng. 2007, 46, 043601. [Google Scholar]
  9. Huang, L.; Chua, P.S.; Asundi, A. Least-squares calibration method for fringe projection profilometry considering camera lens distortion. Appl. Opt. 2010, 49, 1539–1548. [Google Scholar] [CrossRef] [PubMed]
  10. Hu, Q.; Huang, P.S.; Fu, Q.; Chiang, F.P. Calibration of a three-dimensional shape measurement system. Opt. Eng. 2003, 42, 487–493. [Google Scholar] [CrossRef]
  11. Zhang, Z.; Ma, H.; Guo, T.; Zhang, S.; Chen, J. Simple, flexible calibration of phase calculation-based three-dimensional imaging system. Opt. Lett. 2011, 36, 1257–1259. [Google Scholar] [CrossRef] [PubMed]
  12. Windecker, R.; Fleischer, M.; Körner, K.; Tiziani, H. Testing micro devices with fringe projection and white-light interferometry. Opt. Lasers Eng. 2001, 36, 141–154. [Google Scholar] [CrossRef]
  13. Sutton, M.; Zhao, W.; McNeill, S.; Schreier, H.; Chao, Y.J. Development and assessment of a single-image fringe projection method for dynamic applications. Exp. Mech. 2001, 41, 205–217. [Google Scholar] [CrossRef]
  14. Huang, P.S.; Hu, Q.; Jin, F.; Chiang, F.P. Color-encoded digital fringe projection technique for high-speed three-dimensional surface contouring. Opt. Eng. 1999, 38, 1065–1071. [Google Scholar] [CrossRef]
  15. Quan, C.; He, X.; Wang, C.F.; Tay, C.; Shang, H. Shape measurement of small objects using LCD fringe projection with phase shifting. Opt. Commun. 2001, 189, 21–29. [Google Scholar] [CrossRef]
  16. Guan, C.; Hassebrook, L.G.; Lau, D.L. Composite structured light pattern for three-dimensional video. Opt. Express 2003, 11, 406–417. [Google Scholar] [CrossRef] [PubMed]
  17. Reich, C.; Ritter, R.; Thesing, J. 3-D shape measurement of complex objects by combining photogrammetry and fringe projection. Opt. Eng. 2000, 39, 224–231. [Google Scholar] [CrossRef] [Green Version]
  18. Bell, T.; Li, B.; Zhang, S. Structured light techniques and applications. In Wiley Encyclopedia of Electrical and Electronics Engineering; Wiley Online Library: Hoboken, NJ, USA, 1999; pp. 1–24. [Google Scholar] [CrossRef]
  19. Liu, Y.; Blunt, L.; Zhang, Z.; Rahman, H.A.; Gao, F.; Jiang, X. In-situ areal inspection of powder bed for electron beam fusion system based on fringe projection profilometry. Addit. Manuf. 2020, 31, 100940. [Google Scholar] [CrossRef]
  20. Xie, Z.; Wang, J.; Zhang, Q. Complete 3D measurement in reverse engineering using a multi-probe system. Int. J. Mach. Tools Manuf. 2005, 45, 1474–1486. [Google Scholar]
  21. Zhang, Z.; Huang, S.; Meng, S.; Gao, F.; Jiang, X. A simple, flexible and automatic 3D calibration method for a phase calculation-based fringe projection imaging system. Opt. Express 2013, 21, 12218–12227. [Google Scholar] [CrossRef]
Figure 1. The principle of the fringe projection technique [18]: (a) illustration of a fringe projection system with one camera and one projector; and (b) schematic diagram of the fringe projection system.
Machines 09 00200 g001
Figure 2. Calibration board with ring marks: (a) photograph of the calibration board with concentric rings (tolerance range of the centre positions within ±0.002 mm); and (b) phase errors from the ring marks.
Machines 09 00200 g002
Figure 3. A conceptual setup of the detection system.
Machines 09 00200 g003
Figure 4. Fringe projection system.
Machines 09 00200 g004
Figure 5. Chess board pattern calibration plate.
Machines 09 00200 g005
Figure 6. The procedure for the depth calibration.
Machines 09 00200 g006
Figure 7. The procedure of transverse calibration.
Machines 09 00200 g007
Figure 8. Measurement results of a flat plate: (a) 3D shape measurement results with impact of black circle ring (typical rings circled); and (b) 3D shape measurement results with the proposed method.
Machines 09 00200 g008
Figure 9. The extracted centre of the calibration rings.
Machines 09 00200 g009
Figure 10. Compared measured distance along one row near the middle of the white plate results, where the X axis represents the width and the vertical axis is the reconstructed depth of the surface: (a) z = −5.4 mm; and (b) z = 1.3 mm.
Machines 09 00200 g010
Figure 11. Experimental setup and AM machine: (a) proof-of-concept experimental system; and (b) EBM machine.
Machines 09 00200 g011
Figure 12. A twenty-cent coin and 3D reconstruction results: (a) photograph of the coin; (b) 3D measurement results of the coin after corrections; (c) 3D measurement results of the coin before corrections; (d) zoom in the error.
Machines 09 00200 g012
Figure 13. The 2D profile of the measurement error because of the ring effect.
Machines 09 00200 g013
Figure 14. Printed metal sample and 3D reconstruction results: (a) photograph of tested printed sample; (b) areal map of tested printed sample before corrections; and (c) areal map of tested printed sample after corrections.
Machines 09 00200 g014
Figure 15. 3D measurement results of printed tensile test parts: (a) optical camera image; (b) measurement of printed layer showing test parts and excess powder delivery due to rake damage.
Machines 09 00200 g015
Table 1. Details of the accuracy and precision along transverse direction.
DirectionsNominal Actual Distance between Each Centre Points
(mm)
Number of Centre-to-Centre MeasurementsMean Measured Distance (mm)Mean Absolute
Errors
(mm)
Standard Deviation
(Precision) (Units: mm)
X15.000732015.02280.02280.0467
Y15.000930814.99710.00290.0382
Table 2. Details of the accuracy and precision along the depth direction.
Position(mm)Mean Measured
Distance
(mm)
Mean
Absolute
Error (mm)
(Accuracy)
Standard
Deviation (mm)
(Precision)
−5.3987−5.37280.02590.0168
1.29821.29540.00280.0126
Publisher’s Note: MDPI stays neutral with regard to jurisdictional claims in published maps and institutional affiliations.

