
Temporal Shape Changes and Future Trends in European Automotive Design

1
Consiglio per la ricerca in agricoltura e l'analisi dell'economia agraria (CREA), Unità di ricerca per l'ingegneria agraria, Via della Pascolare 16, 00015 Monterotondo Scalo (Rome), Italy
2
Instituto de Ciencias del Mar (ICM-CSIC), Passeig Marítim de la Barceloneta 37-49, 08003 Barcelona, Spain
*
Author to whom correspondence should be addressed.
†
These authors contributed equally to this work.
Machines 2015, 3(3), 256-267; https://doi.org/10.3390/machines3030256
Submission received: 13 May 2015
/
Revised: 27 August 2015
/
Accepted: 7 September 2015
/
Published: 17 September 2015
Abstract
:Evolution produces genuine novelty in morphology through the selection of competing designs as phenotypes. When applied to human creativity, the evolutionary paradigm can provide insight into the ways that our technology and its design are modified through time. The shape of European utilitarian cars in the past 60 years was analyzed in order to determine whether changes occur in a gradual fashion or through saltation, clarifying which are the more conserved and more variable parts of the designs. We also attempted to predict the future appearances of the cars within the next decade, discussing all results within the framework of relevant evolutionary-like equivalences. Here, we analyzed the modification in the shape of European utilitarian cars in the past 60 years by three-dimensional geometric morphometrics to test whether these changes occurred in a gradual or more saltatory fashion. The geometric morphometric shape analysis showed that even though car brands have always been preserving distinct shapes, all followed a gradual pattern of evolution which is now converging toward a more similar fusiform and compact asset. This process was described using Darwinian evolution as a metaphor to quantify and interpret changes over time and the societal pressures promoting them.
1. Introduction
In the field of human endeavor, the conceptual framework of natural selection can provide insight into the ways that technology and derived artifacts change through time [1]. Darwin [2] already observed how breeders simulate the evolutionary process by shaping domestic animals and plants to suit artificially imposed utility or fashion criteria. Similarly, there is a parallel between the evolution of species and the temporal modification of humans’ items, particularly when considering a competitive capitalistic economy [3]. Using the evolution metaphor, the market is the field of selection for new technologies, which are produced by competing brands [4]. These brands contend for market share in specific product lines by proposing modifications (either true innovation or simply as modification in design), which are positively or negatively received by the consumers, political decision-makers, and governmental institutions [5]. Alternatively, preliminary market testing of a specific design could be used to test consumer reception. Trading could be compared to fitness in evolution: the proliferation of offspring with certain traits in a competitive environment is similar to the spreading of goods within the market (i.e., increased trade). The comparison is so striking that biologists also often describe evolution using “economic jargon” and the economists do the way-round [6,7]. They frame their analyses within the framework of natural selection and evolution in a metaphorical but still informative manner.
The design of any traded artifact is a complex and iterative process with a strict goal of maximizing sales [8]. Cars may represent a good item for studying the design modifications of highly traded objects within human society through time since they are a practical necessity for people in industrialized and nearly industrialized societies [9]. Automotive displacement represents one of the most important technological advancements of modern societies in the past century [10]. The development of new car models occurs within a brand, often as a result of modifications in the design of a previous type [11], but a full quantification of that process has not yet been done.
Changes in car shape design can be studied by geometric morphometrics, which provides the statistic tools for the quantitative analysis of biological forms and their covariation with genetic and environmental factors [12,13]. Because geometric morphometrics is based on the characterization of shape, it can identify those features that differ between genotypes, forecasting changes in terms of trade-offs between constraints imposed by inherited anatomic assets and selective pressures [14,15,16]. While shape variation studies in cars chiefly focused on socio-anthropologic motivations of trading (e.g., cars’ attributes and buyers’ personalities) [17,18,19], their modifications were comparatively poorly quantified through time. Such an analysis is of interest since its results could be extended to design changes of virtually any other traded technological product. Here, we carried out this analysis within the framework of the Darwinian evolution metaphor. We analyzed the shape evolution of European utilitarian cars over the past 60 years in order to determine whether changes occur in a gradual fashion or through saltation, clarifying which are the more conserved and more variable parts of the designs. We also attempted to predict future appearances through regression shape analysis of the cars within the next decade, discussing all results within the framework of relevant evolutionary-like equivalences.
2. Experimental Section
2.1. Data Sources
We selected main European brands that have existed since 1949. The external shapes of 44 European models belonging to four established brands (Fiat, Ford, Renault, and Volkswagen) were analyzed to test for parts of the overall design, which are more conserved through time and across lines (i.e., shape convergence) (Table 1). The vehicles belonged to two segments: A (mini cars) and B (small cars). Both segments were chosen because their presence within the market is more temporally continuous and less affected by the contraction of consumers (i.e., reduction in family per capita income) than that of luxury cars (see studies of segments E, F, and S (21)). For Fiat segment B, two sub-segments were considered (B1 and B2).

| Brand | Segment | Model | Year | Brand | Segment | Model | Year |
|---|---|---|---|---|---|---|---|
| Fiat | A | Nuova 500 | 1968 | Ford | A | Ka | 1998 |
| 126 | 1973 | B | Fiesta | 1979 | |||
| Panda | 1985 | Fiesta | 1982 | ||||
| Cinquecento | 1995 | Fiesta | 1993 | ||||
| Seicento | 1998 | Fiesta | 2001 | ||||
| Panda | 2003 | Fiesta | 2005 | ||||
| 500 | 2007 | Fusion | 2005 | ||||
| Panda | 2012 | Renault | A | 4cv | 1957 | ||
| B1 | 600 | 1962 | 4 | 1979 | |||
| Uno | 1992 | Twingo Mk1 | 2000 | ||||
| Punto | 1993 | Twingo Mk2 | 2012 | ||||
| 127 | 1995 | B | Dauphine | 1960 | |||
| Punto | 1999 | 6 | 1972 | ||||
| Grande Punto | 2005 | 5 | 1980 | ||||
| Punto Evo | 2010 | Supercinque | 1986 | ||||
| Punto | 2012 | Clio | 1995 | ||||
| B2 | 1100 | 1949 | Clio II | 2004 | |||
| 1100 | 1954 | Clio III | 2006 | ||||
| 128 | 1971 | Modus | 2006 | ||||
| Ritmo | 1978 | Volkswagen | A | Fox | 2006 | ||
| Brava | 1995 | Up | 2011 | ||||
| Stilo | 2005 | B | Polo III | 2006 |
2.2. Shape Analyses
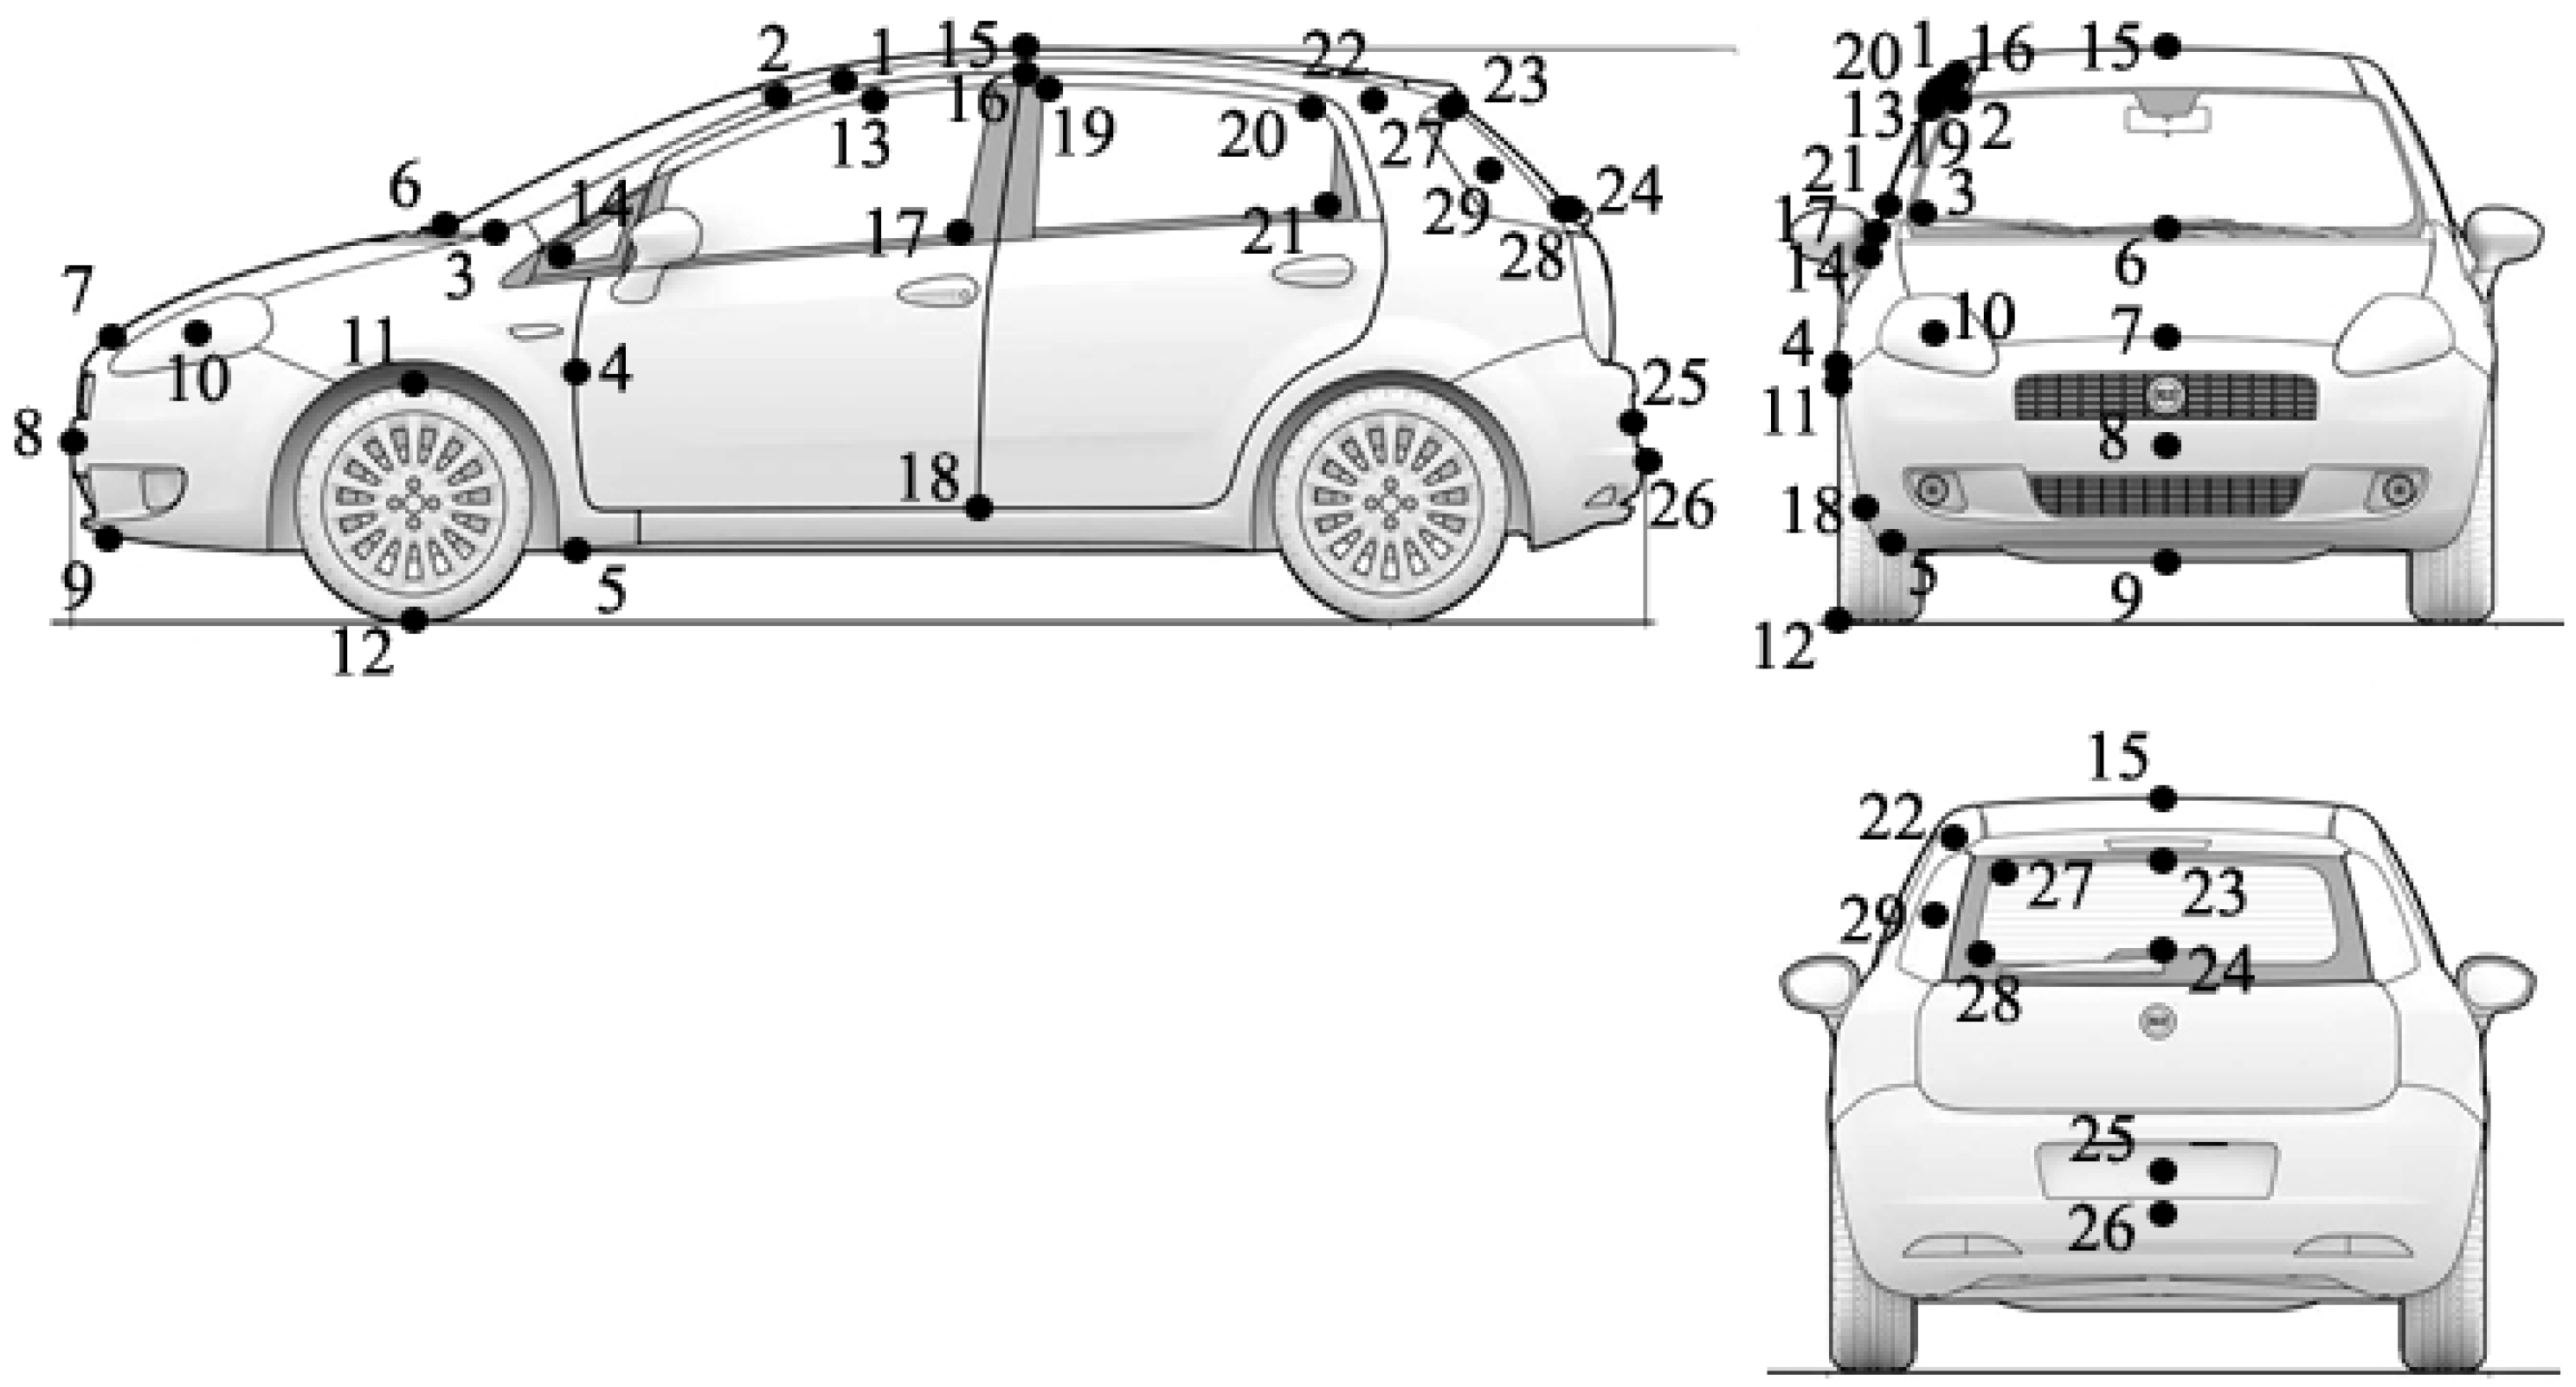
Differences between models were analyzed by means of geometric morphometrics, which allows for the visualization and quantification of morphological differences by representing the differences captured by a set of corresponding points (landmarks) in a coordinate space [15,20,21]. Landmarks are defined as points bearing key information on the geometry of forms [22]. In a scheme representing three orthogonal views (lateral, front, and back) of each model (Figure 1), 29 landmarks were digitized using the software TpsDig [23]. Corresponding two-dimensional (2D) landmarks were then transformed into three-dimensional (3D) coordinates using the x and y coordinates from the lateral view and adding the third dimension (z) as x, which was based on the front or back view.
Figure 1.
Landmarks used to quantify external car shape: (1, 22) anterior and posterior upper-lateral corner of the roof of the car; (2, 3) upper- and lower-lateral corner of the anterior glass; (4) maximum lateral convexity of the car at the level of the anterior part of the front door; (5) the lowest point of the bottom of the car at the level of the anterior part of the front door; (6) central-lower point of the anterior glass; (7) central-anterior point of the anterior hood; (8, 26) central point of the anterior and posterior bumper; (9) the lowest central point of the anterior bottom part; (10, 29) center part of the principal anterior and posterior light; (11, 12) superior and inferior parts of the wheel; (13, 14) upper- and lower-corner of the lateral glass of the anterior door; (15) superior center of the car at the level of the posterior part of the front door; (16–18) upper- and lower-posterior corner of the front door; (17) lower-posterior corner of the lateral anterior window; (19, 20) anterior- and posterior-upper corner of the back lateral glass; (21) posterior-lower corner of the back lateral glass; (23, 24) central-upper and -lower point of the posterior glass; (25) center of the posterior plate; (27, 28) lateral-upper and -lower point of the posterior glass.
The coordinates of the landmarks were aligned by Generalized Procrustes analysis, a procedure consisting of three steps: the translation of point coordinates to a common centroid located at the origin (0, 0); the scaling of each outline with the unitary centroid size; and the rotation of coordinates to minimize the sum of squared distances between corresponding landmarks [13]. Residuals from the fitting were analyzed with the thin-plate spline (TPS) interpolating function [15,22,24]. The name thin plate spline refers to a physical analogy involving the bending of a thin sheet of metal. In the physical setting, the deflection is in the z direction, orthogonal to the plane. In order to apply this idea to the problem of coordinate transformation, one interprets the lifting of the plate as a displacement of the x or y coordinates within the plane. In 2D cases, given a set of K corresponding points, the TPS warp is described by 2(K + 3) parameters, which include six global affine motion parameters and 2K coefficients for correspondences of the control points [24]. These parameters are computed by solving a linear system; in other words, TPS has a closed-form solution.
Shape changes over time were visualized as splines, by regressing the variables of the function (M’) on the production year. The correlation between shape variables and production year was tested with permutation tests (1000 random permutations). To summarize the variations in shape, M’ was used in a relative warp analysis (RWA). RWA is analogous to a Principal Component analysis (PCA) for this type of data [25,26]. The first axis of each RWA was plotted against the production year [13,27]. The use of the TPS function allowed the visualization of the shape changes as splines. Production years and shape changes were then visualized as splines relative to the consensus configuration, and a forecast for shape in 2020 was produced. These analyses were performed for each brand-segment group (with a sample size greater than five) and for the whole dataset.
To distinguish (i.e., classify) between different brands, a canonical variate analysis (CVA) was performed for the whole dataset. CVA is a multiple-group form of discriminant analysis [28] that starts with an initially defined grouping of objects (supervisionate) and determines the extent to which a set of quantitative descriptors can effectively explain the grouping. CVA was performed on the obtained shape coordinates (i.e., the weight matrix W’) to discriminate between brands [13,20,29]. Geometric morphometric statistical analyses were performed using MorphoJ and MATLAB (rel. 7.1).
3. Results and Discussion
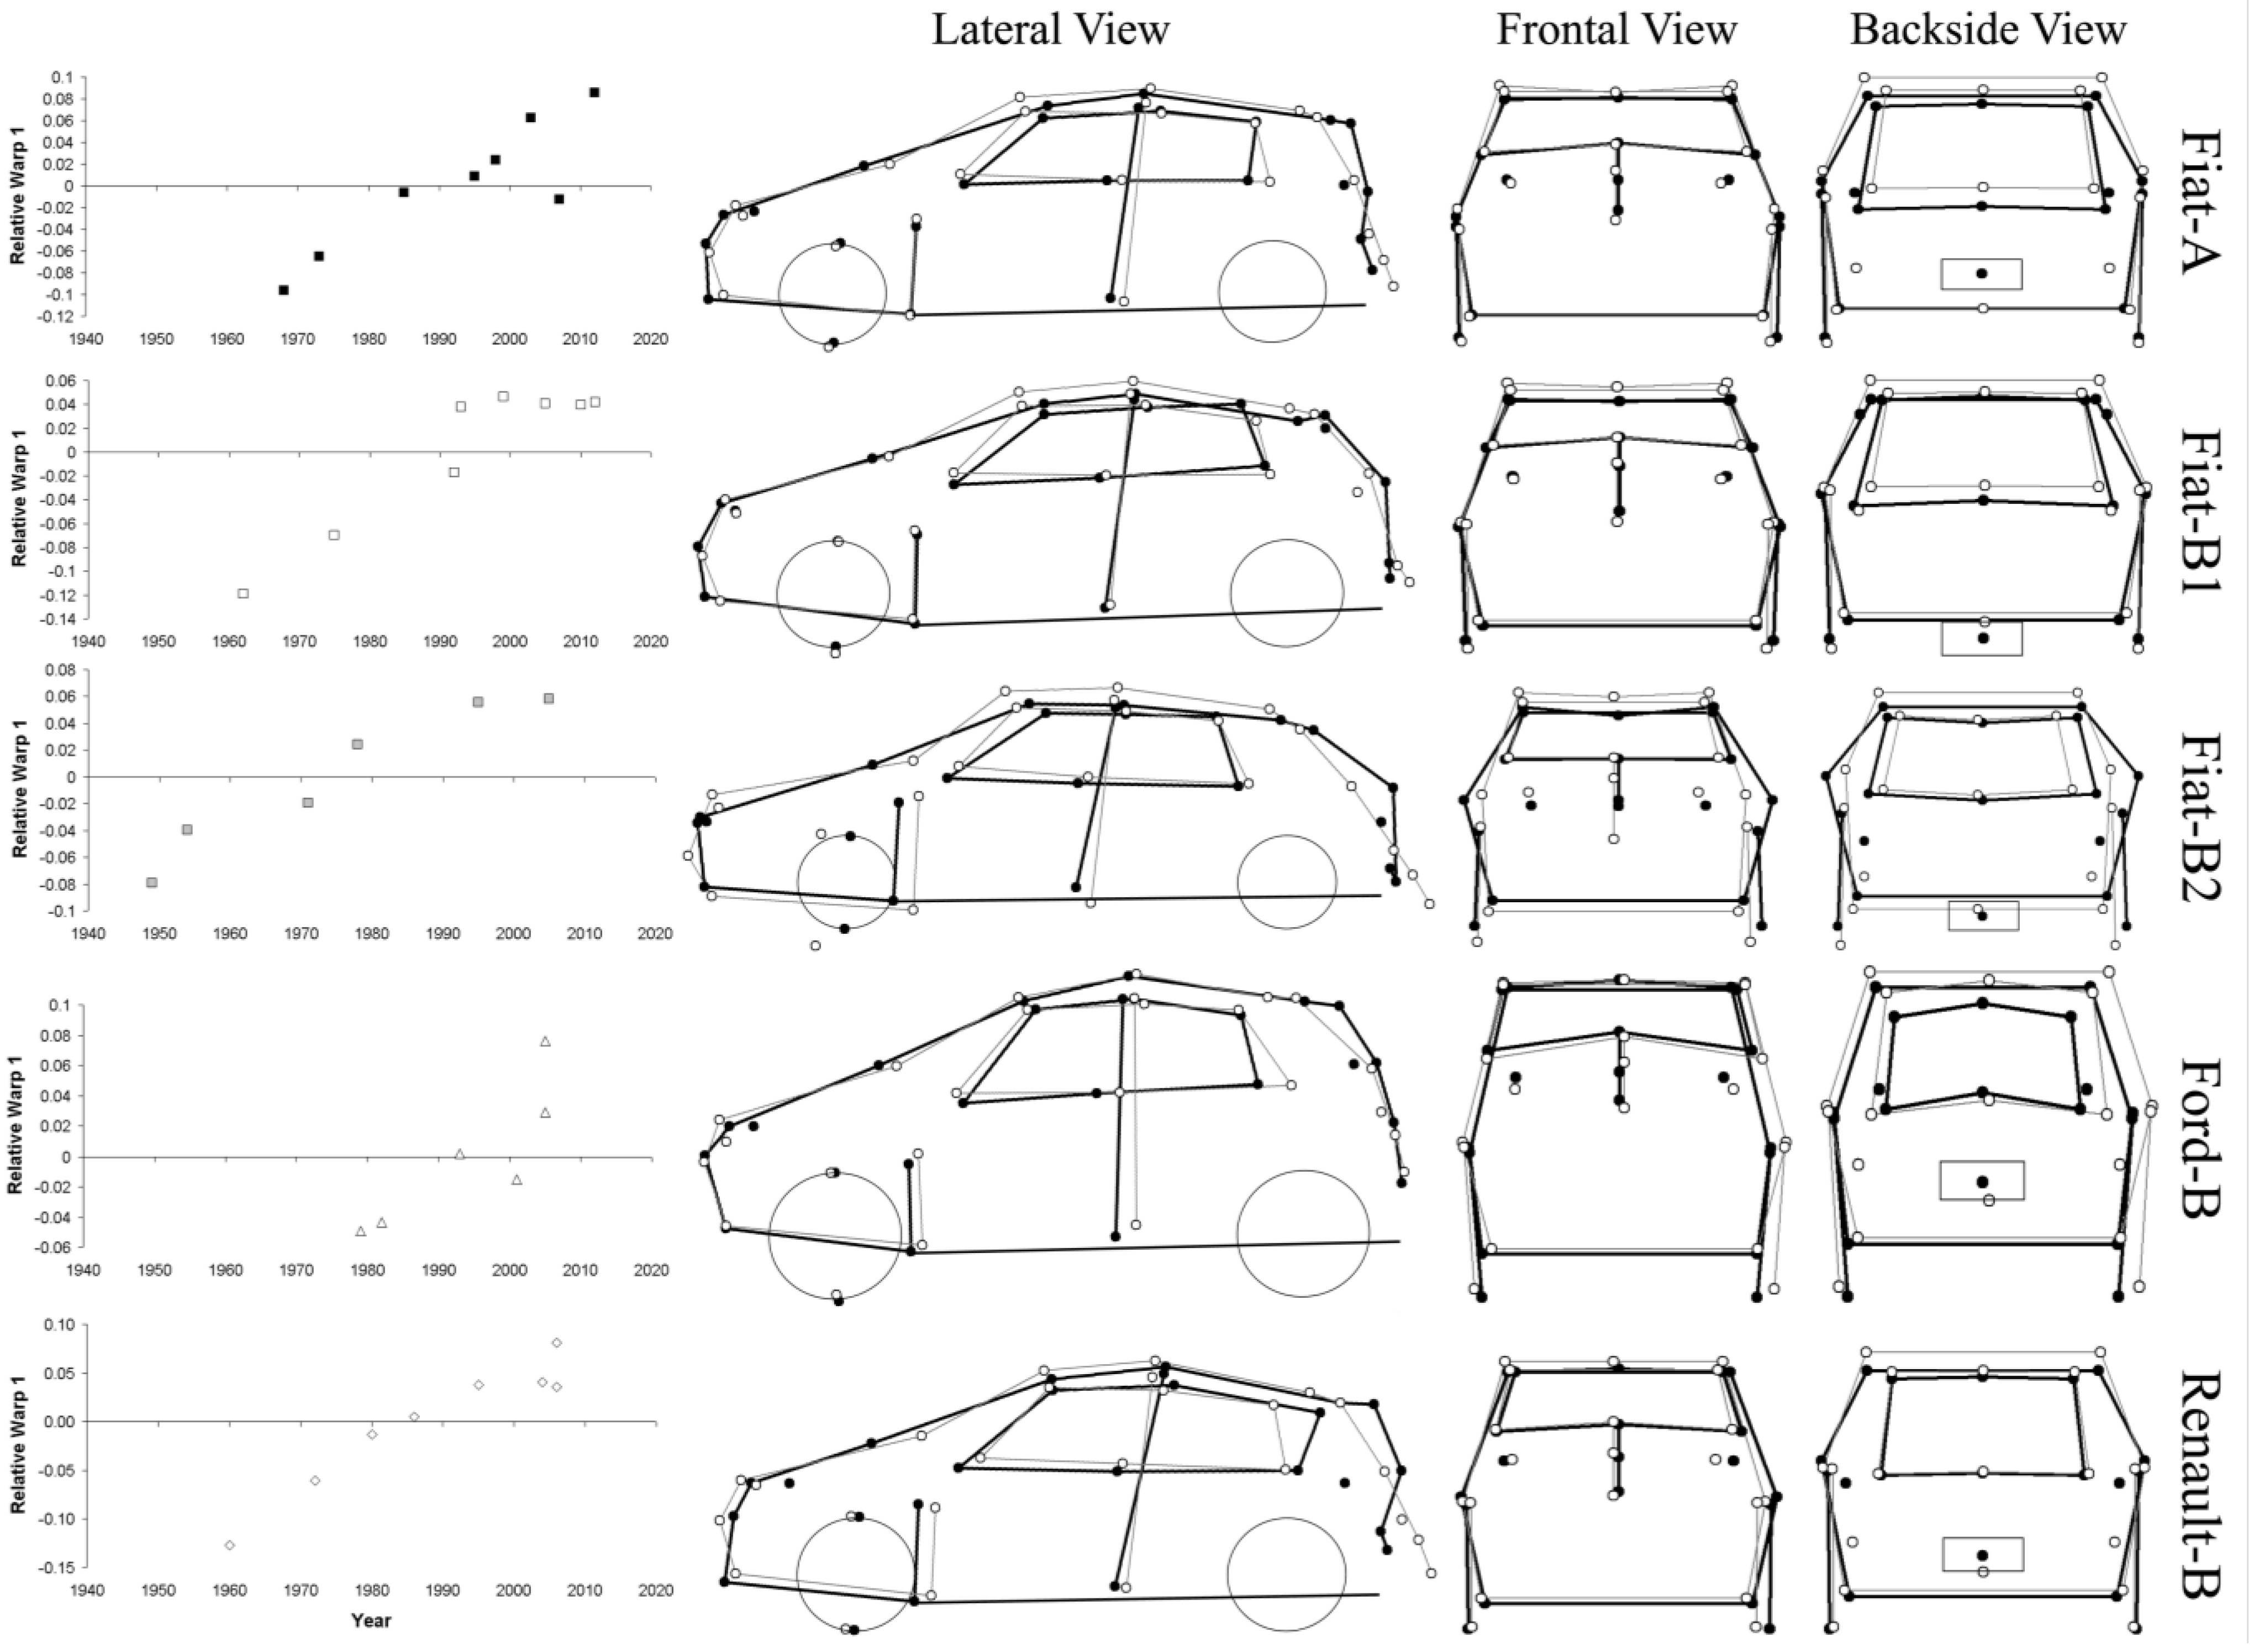
Figure 2 showed, for each car brand within all segments, the regression between the first (i.e., the most informative) relative warp axis and the production year (left side of the figure) in order to observe if a certain trend occurs. On the right part of Figure 2, the splines relative to the different views (lateral, front, and back) of the consensus configuration (thin grey line and white points), together with the forecasted splines for 2020 (thick black line and black points), are also shown. We detected a general and strong relation between shape (expressed as RW1) and production year for all car brands within all segments (Figure 2). This relationship is stronger for Fiat-A, with the exception of the 500 (2007), and for Fiat-B1, with the exception of the Punto (1993 and 1999), for Fiat-B2, for Ford-B, with exception of the Fiesta (2001), and for Renault-B, with the exception of the Clio II (2004) and Clio III (2006). If we examine the shapes (see Figure 2, right side) of the forecasted prototypes for 2020, we observe a general forward protrusion of the car’s lateral profile, which tends to be smoother. We also observed a progressive replacement of the more squared appearance (from the roof to the hood passing through the anterior glass) with a smoother appearance. The opposite trend is observed in the posterior lateral profile, which is becoming more vertically squared. Looking more closely at each specific brand and model, it is possible to observe in Fiat-A (backside view) that there is a rising of the posterior plate and principal light, and an area of reduction of the posterior glass. In Fiat-B1, the same reduction of the posterior glass is shown. Moreover, the horizontal axis of the lateral glass progressively gets inclined toward the front of the car, and its shape appears to sharpen, with the posterior light moving upward. Another general trend is the global reduction in height. Fiat-B2 has a sharp spherical shape. The anterior wheel is smaller and positioned forward, with a lower insertion of the posterior light. Ford-B has a general blocky shape, and the posterior part (from the lateral view) is wider. Additionally, the anterior light is displaced to the front, and the posterior one is placed higher. The same light displacements are observed for Renault-B.
Figure 2.
Regression analysis outputs for the first relative warp axis and the production year for each brand segment as a group, with sample size greater than five (left side of the figure). On the right side of the figure, the splines relative to the different views (lateral, front, and back) of the consensus configuration (thin grey line and white points) are shown. The forecasted splines for 2020 (thick black line and black points) are also shown.

Figure 3 showed the regression between the first (i.e., the most informative) relative warp axis and the production year (left side of the figure) considering the entire dataset altogether. Two different trend lines (one for each segment: r2 segment A = 0.89; r2 segment A = 0.86) were plotted on the right part of Figure 3. The splines relative to the different views (lateral, front, and back) of the consensus configuration (thin grey line and white points), together with the forecasted splines for 2020 (thick black line and black points), are also shown.The trend appears to be the same and is easily distinguishable for all cars in the dataset (Figure 3), with a few exceptions, such as the Fiat 500 (2007) for segment A and the Renault Dauphine (1960) for segment B. The rate of change (i.e., the slope) observed for the trend line of segment A is stronger than the one observed for segment B. The general shape trend observed in Figure 2 could be observed on the right side of Figure 3 with respect to the two segments. In particular, for both segments, a general forward-oriented lateral profile and smoother appearance gradually replace the more squared appearance (from the roof to the hood passing through the anterior glass); the opposite trend is seen in the posterior lateral profile, which is becoming more squared. The posterior light is gradually taking on a higher position.
Figure 3.
Regression between the first relative warp axis and the production year for the entire dataset (left side of the figure); the two lines represent the trend lines for segment A (black) and segment B (grey). On the right side of the figure, the splines relative to the different views (lateral, front, and back) of the consensus configuration (thin grey line and white points) are shown for each segment. The predicted splines for 2020 (thick black line and black points) are also shown for each segment.
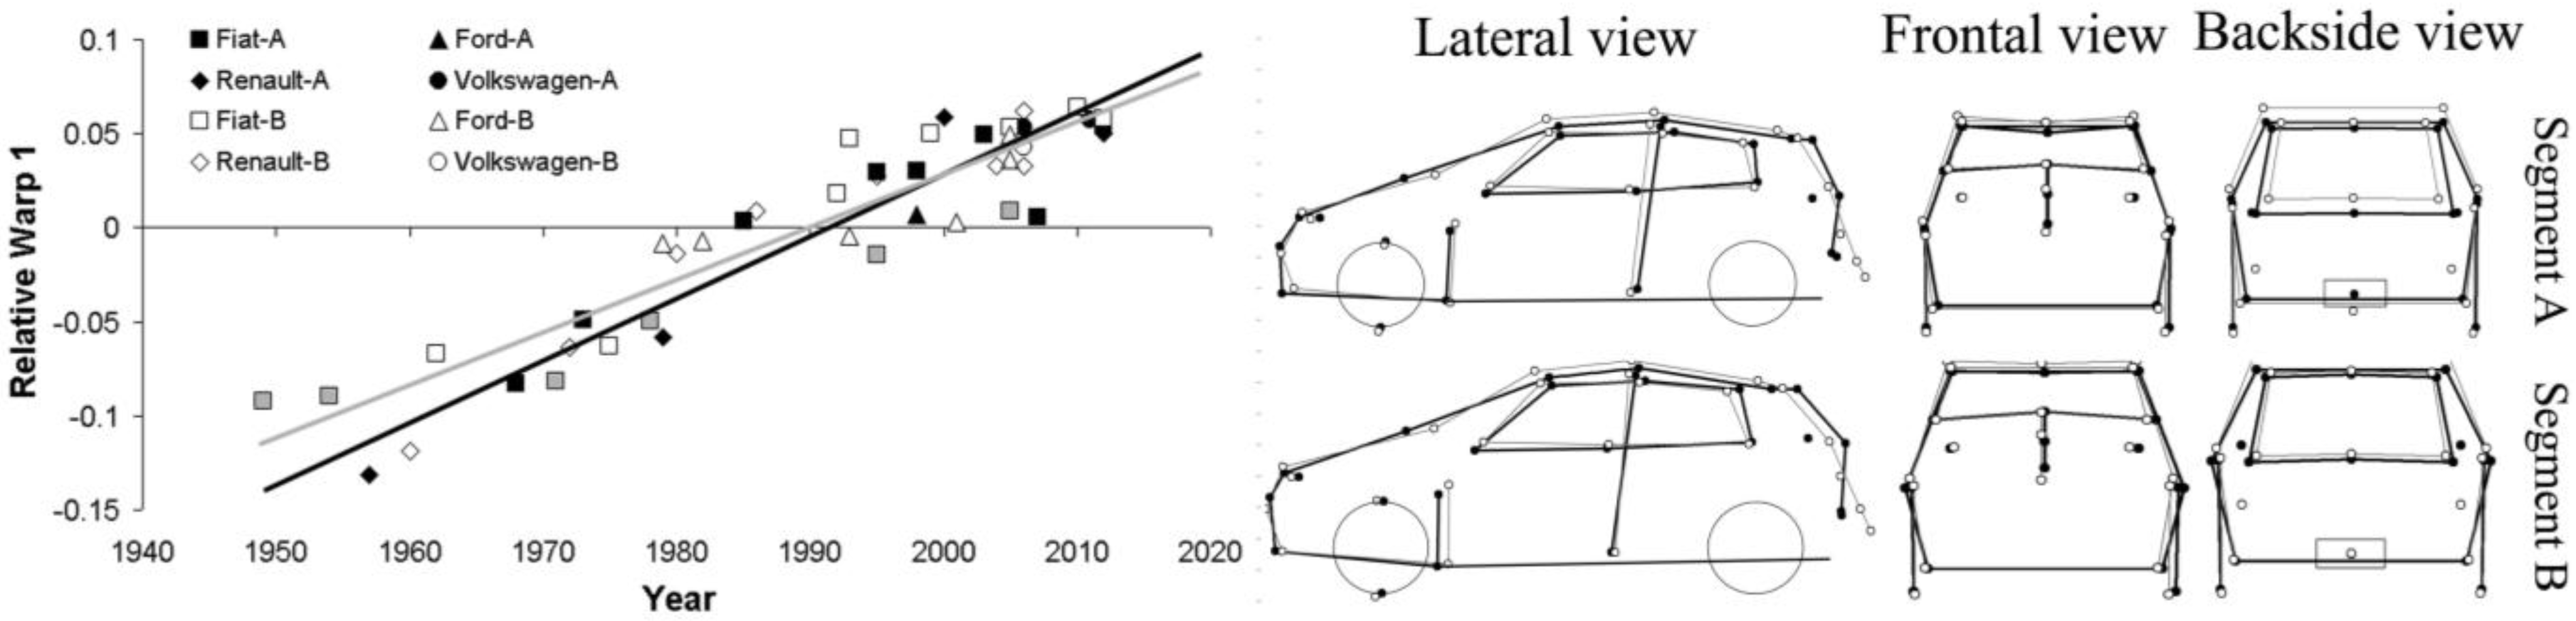
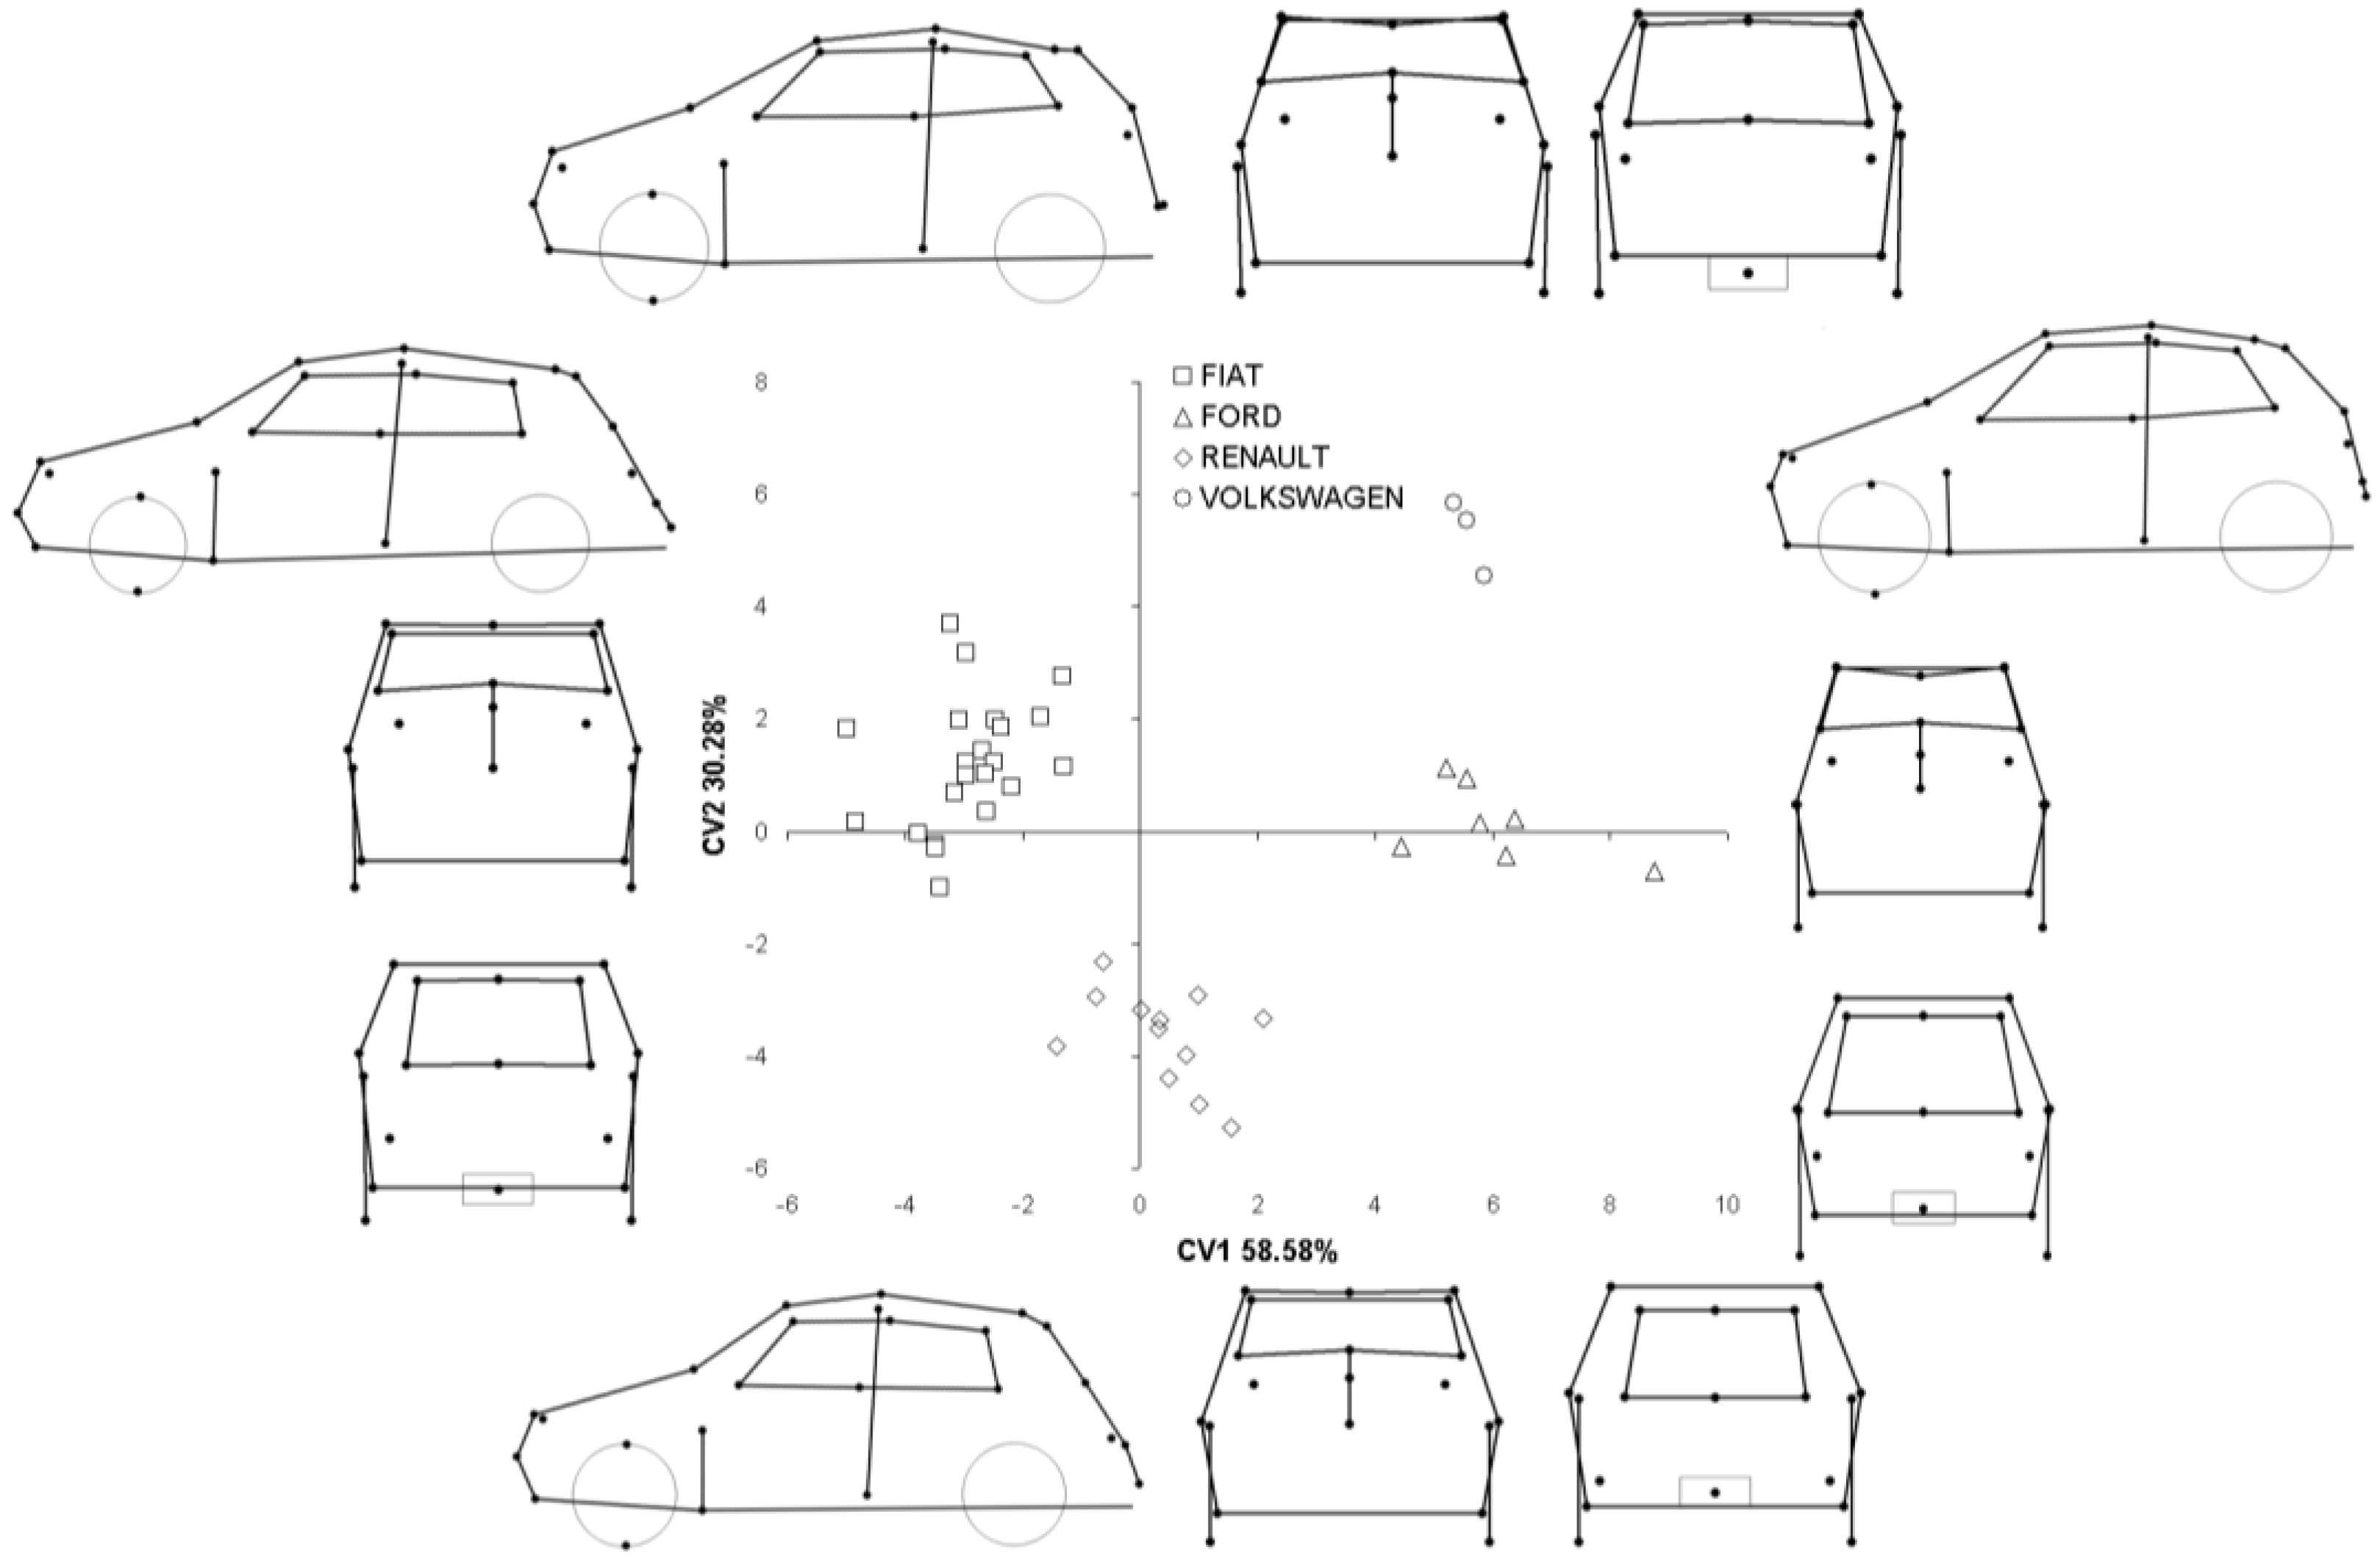
Figure 4.
Canonical Variate Analysis (CVA) output for the four brands. All around the central plot, it is possible to observe the splines (lateral, front, and back views) relative to the extremes of the two CV axes (CV1 left and right; CV2 up and down).
Figure 4.
Canonical Variate Analysis (CVA) output for the four brands. All around the central plot, it is possible to observe the splines (lateral, front, and back views) relative to the extremes of the two CV axes (CV1 left and right; CV2 up and down).

Figure 4 showed the plot of the first two axes of the CVA; all around the central CVA plot, it is possible to observe the splines (lateral, front, and back views) relative to the extremes of the two CV axes. This discriminant analysis shows a strong separation between the four brands on the first two CV axes. In particular, the first axis discriminates between Fiat and Ford/Volkswagen, and the second axis discriminates between Renault and Volkswagen. The splines relative to the extremes of the axes show the extreme shapes characterizing the four brands.
The shape of automotive design of utilitarian cars showed gradual patterns of change through time and no abrupt modifications appeared. Changes in car design seemed to be constrained within each brand due to restrictions imposed by the features of previous models. Interestingly, despite such gradualism, all car lines seem to converge toward more fusiform and compact shapes, as we have shown through our predictive modeling. Although we are aware that any analogy between morphological evolution in organisms and cars is only metaphorical (the former is governed by chance, whereas the latter is teleologically oriented toward the best-selling products) [30], it is possible to set our discussion within the framework of the following equivalences: shape = phenotype and market = natural selection.
We observed a gradual and independent pattern of automotive design changes within different brands, which suggests a type of conditioning established by the features of the previous models within each brand. Organismal evolution occurs by recombination, random mutation, and subsequent selection. According to an inheritance restriction principle [31], morphological change can be described in a line of ancestors ordered according to a common temporal axis. Interestingly, there are organisms that do not entirely follow this rule; gradualism is often replaced by saltation. Unicellular organisms can exchange genetic material in a horizontal fashion, incorporating genes (or partial sequences) from the surrounding environment, not only during their replication but also when fully formed [32,33]. Our results indicate that car design is conservative within each brand and it seems to not be influenced by the horizontal transfer of automotive design ideas. Car models show independent gradual changes within each line, hence behaving more like multicellular than unicellular organisms. Cars, similar to animals, for example, “evolve” independently within each line. Horizontal innovation, when it occurs, more likely refers to internal components (e.g., electronics) [34], and internal components have had only moderate effects on the overall external shape of cars in the past 30 years. Also, we cannot ultimately discharge the occurrence of horizontal (i.e., inter-line) transference, since manufacturers may incorporate new design elements and ideas proceeding from other lines (e.g., when sharing a similar attitude to fashion). In any case, if that process occurs, it seems deeply subjected to constraints imposed by the previous design.
We found that different morphological traits in cars show different rates of change. Three different selecting factors seem to act on car automotive design. First, there is the aerodynamics of the shape, which affect automotive efficiency and promote an overall smooth and forward-projected shape in the lateral profile of the car (from the roof to the hood, passing through the anterior glass). Second, there are traits that appear to be under market selection because they are conserved, being related both to automotive or fashion constraints. This is the case for landmarks located in the back of the car, which are related to utility and comfort requirements (see, for example, the trunk space shape of the Ford Fusion produced in 2005). Third, there is a pool of inter-brand highly variable traits that must be associated with fashion (e.g., light and plate positioning, and the peculiar shapes of the rear lateral profile in the Renault and Fiat-B1 models). Cars shapes are a mixture of conservative and variable traits [35]. As a general rule, car design has to be able to cope with the selective pressures imposed by a trade-off between conservative automotive efficiency (i.e., energetic and aerodynamic/utility requirements) and comfort (increase of backward space). Our data indicate that both factors coexist, although in contradiction. Overall, car shapes have shown consistent changes in the past 30 years, despite the conservation of automotive engineering. Although the mechanical essence of automotive locomotion did not change throughout the century and the early evolution of the market significantly shaped car development [36], this only exerted moderate constraints on car shape variation. Very few exceptions of sudden shape variation due to automotive constraints seem to exist (e.g., the 2007 Fiat 500; see Figure 2). Similarly, in animal evolution, conservation in the general anatomic design does not impede the evolution of other phenotypic characteristics (e.g., spectacular morphological adaptations in secondary sexual characteristics, or mimicry) [37].
We can only speculate about the reasons for the detected future convergence in car shapes among different lines as it appears in our prediction model. This convergence could be based on the adaptation of different car designs to common market selection pressures (e.g., a generalized change in public taste). The motivations that influence car purchases are very complex [28], but widespread shifts in consumer preference may force different brands to mimic each other’s products to increase their sales (i.e., the fitness of their cars). This occurs in a context in which true innovation (saltation) is rare, and the lack of innovation seems to be the result of a more conservative attitude on the part of producers toward the design of cars for utilitarian segments.
The authors are aware about the difficulties in defending assumptions about how a long-duration Darwinian evolution can explain the process of appearance (visual features) modernization and quality improvement of the addressed class of engineered products. Though the Darwinian evolution was successfully modeled in and utilized by various artificial systems (e.g., genetic algorithms and evolutionary game algorithms; e.g., [38]), it often results in discrepancies and even logical flaws when applied to describing engineering developments or market mechanisms [39]. The geometric morphometrics revolution [25] in the 1990s laid the foundation for the algorithmic processing of organism shape for functional morphology [40] and ecomorphology [12,13], as well as other, more applied fields [21]. This highefficiency statistical paradigm for the quantification and modeling of phenotypic characteristics within the evolutionary ecology framework has now been applied to cars, which are subjected to human selection [40].
4. Conclusions
In general, engineering change actions have different guiding rules than that of pure biological reproduction and selection over uncountable generations. What is often forgotten is that while self-organization manifests on a biological level, this mechanism is practically not implemented in typical industrial products. A future comprehensive analysis should take into consideration other tangible parameters, such as vehicle footprint, interior-to-exterior-volume ratio, overall dimensions, wheelbase, etc. Moreover, the new scientific results of engineering research, extended computational possibilities, intense development of new technologies and systems (more precisely, the improvement of computer support of manufacturing technologies and systems), and new materials and their affordances should also be taken into account for the morphological-based analysis of design. These together do have at least as large an influence, or an even larger influence, on the design and development of cars asmarket preferences do.
Acknowledgments
This research was funded by project RITFIM (ref. CTM2010-16274, of the Spanish national RTD program. J. Aguzzi is a postdoctoral Fellow of the Spanish Ramón y Cajal Program (Spanish Ministry of Economy and Competitiveness). We would like to thank V. Radovanovic and A. Cardini (University of Modena and Reggio Emilia) for suggestions and editing advice during the manuscript preparation.
Author Contributions
All the authors wrote the main manuscript text. C.C. conducted the geometric morphometric analyses.
Conflicts of Interest
The authors declare no conflict of interest.
References
- Grimson, W.M.; Murphy, M. An evolutionary perspective on engineering design. In Engineering in Context; Christensen, S., Delahousse, B., Meganck, M., Eds.; Aarhus Academica: San Francisco, CA, USA, 2009; pp. 263–276. [Google Scholar]
- Darwin, C. On the Origin of Species by Means of Natural Selection; John Murray Publisher: London, UK, 1859. [Google Scholar]
- Galor, O.; Moav, O. Natural selection and the origin of economic growth. Q. J. Econ. 2002, 117, 1133–1191. [Google Scholar] [CrossRef]
- Gautschi, D.A.; Sabavala, D.J. The world that changed the machines: A marketing perspective on the early evolution of automobiles and telephony. Technol. Soc. 1995, 17, 55–84. [Google Scholar] [CrossRef]
- Blume, L.E.; Easley, D. Optimality and natural selection in markets. J. Econ. Theory 2002, 107, 95–135. [Google Scholar] [CrossRef]
- Reznick, D.; Nunney, L.; Tessier, A. Big houses, big cars, superfleas and the costs of reproduction. Trends Ecol. Evol. 2000, 15, 421–425. [Google Scholar] [CrossRef]
- Buenstrof, G. How useful is generalized Darwinism as a framework to study competition and industrial evolution? J. Evol. Econ. 2006, 16, 511–527. [Google Scholar] [CrossRef]
- Chandrasegaran, S.K.; Ramani, K.; Sriram, R.D.; Horváth, I.; Bernard, A.; Harik, R.F.; Gao, W. The evolution, challenges, and future of knowledge representation in product design systems. CAD Comput. Aided Des. 2013, 45, 204–228. [Google Scholar] [CrossRef]
- Erk, S.; Manfred, S.; Wunderlich, A.P.; Galley, L.; Henrik, W. Cultural objects modulate reward circuitry. Neuroreport 2002, 13, 2499–2503. [Google Scholar] [CrossRef] [PubMed]
- Hardy, S. A cycle of dependence. Automobiles, accessibility and the evolution of the transportation and retail hierarchies. Berkeley Plan J. 1993, 8, 21–43. [Google Scholar]
- Dijk, M.; Yarime, M. The emergence of hybrid-electric cars: Innovation path creation through co-evolution of supply and demand. Technol. Forecast. Soc. Chang. 2010, 77, 1371–1390. [Google Scholar] [CrossRef]
- Aguzzi, J.; Costa, C.; Antonucci, F.; Company, J.B.; Menesatti, P.; Sardá, F. Influence of rhythmic behaviour in the morphology of Decapod Natantia. Biol. J. Linnenan Soc. 2008, 96, 517–532. [Google Scholar] [CrossRef]
- Antonucci, F.; Costa, C.; Aguzzi, J.; Cataudella, S. Ecomorphology of morpho-functional relationships in the family of Sparidae: A quantitative statistic approach. J. Morphol. 2009, 270, 843–855. [Google Scholar] [CrossRef] [PubMed]
- Klingenberg, C.P. Morphometrics and the role of the phenotype in studies of the evolution of developmental mechanisms. Gene 2002, 287, 3–10. [Google Scholar] [CrossRef]
- Mitteroecker, P.; Gunz, P. Advances in Geometric Morphometrics. Evol. Biol. 2009, 36, 235–247. [Google Scholar] [CrossRef]
- Lawing, A.M.; Polly, P.D. Geometric morphometrics: recent applications to the study of evolution and development. J. Zool. 2010, 280, 1–7. [Google Scholar] [CrossRef]
- Warisawa, S. Study on European market-oriented passenger car design based on quantitative representation of shape characteristics. J. Mach. Eng. 2011, 11, 111–125. [Google Scholar]
- Windhager, S.; Slice, D.E.; Schaefer, K.; Oberzauche, E.; Thorstensen, T.; Grammer, K. Face to face: The perception of automotive designs. Hum. Nat. 2008, 19, 331–346. [Google Scholar] [CrossRef] [PubMed]
- Windhager, S.; Bookstein, F.L.; Grammer, K.; Oberzaucher, E.; Said, H.; Slice, D.E.; Thorstensen, T.; Schaefer, K. “Cars have their own faces”: Cross-Cultural ratings of car shapes in biological (stereotypical) terms. Evol. Hum. Behav. 2012, 33, 109–120. [Google Scholar] [CrossRef]
- Zelditch, M.L.; Swiderki, D.L.; Sheets, H.D.; Fink, W.L. Geometric Morphometrics for Biologists: A Primer; Academic Press: San Diego, CA, USA, 2004. [Google Scholar]
- Costa, C.; Antonucci, F.; Pallottino, F.; Aguzzi, J.; Sun, D.W.; Menesatti, P. Shape analysis of agricultural products: A review of recent research advances and potential application to computer vision. Food Bioprocess Technol. 2011, 4, 673–692. [Google Scholar] [CrossRef]
- Bookstein, F.L. Morphometric Tool for Landmark Data; Cambridge University Press: Cambridge, MA, USA, 1991. [Google Scholar]
- Rohlf, F.J. tpsDig, Digitize Landmarks and Outlines, version 2.05; Department of Ecology and Evolution Stony Brook (State University) Press: New York, NY, USA, 2005. [Google Scholar]
- Menesatti, P.; Angelini, C.; Pallottino, F.; Antonucci, F.; Aguzzi, J.; Costa, C. RGB color calibration for quantitative image analysis: The “3D Thin-Plate Spline” warping approach. Sensors 2012, 12, 7063–7079. [Google Scholar] [CrossRef] [PubMed]
- Rohlf, F.J; Marcus, L.F. A revolution in morphometry. Trends Ecol. Evol. 1993, 8, 129–132. [Google Scholar] [CrossRef]
- Antonucci, F.; Boglione, C.; Cerasari, V.; Caccia, E.; Costa, C. External shape analyses in Atherina boyeri (Risso, 1810) from different environments. Ital. J. Zool. 2012, 79, 60–68. [Google Scholar] [CrossRef] [Green Version]
- Aguzzi, J.; Costa, C.; Ketmaier, V.; Angelini, C.; Antonucci, F.; Menesatti, P.; Company, J.B. Light-dependent genetic and phenotypic differences in the squat lobster Munida tenuimana (Crustacea: Decapoda) along deep continental margin. Progress Oceanogr. 2013, 118, 199–209. [Google Scholar] [CrossRef]
- Seller, M. Automotive emotions: Feeling the car. Theory Cult. Soc 2004, 21, 221–242. [Google Scholar] [CrossRef]
- Marcus, L.F. Traditional morphometrics. In Proceedings of the Michigan Morphometric Workshop; Special Publication No. 2. Rohlf, F.J., Bookstein, F.L., Eds.; The University of Michigan Museum of Zoology: Ann Arbor, MI, USA, 1990; pp. 77–122. [Google Scholar]
- Ziman, J. Marriage of design and selection in the evolution of cultural artefacts. Interdiscip. Sci. Rev. 1999, 24, 139–154. [Google Scholar] [CrossRef]
- Schluter, D.; Clifford, E.A.; Nemethy, M.; McKinnon, L.S. Parallel evolution and inheritance of quantitative traits. Am. Nat. 2004, 163, 808–822. [Google Scholar] [CrossRef] [PubMed]
- Ochman, H.; Lawrence, J.G.; Groisman, E.A. Lateral gene transfer and the nature of bacterial innovation. Nature 2000, 405, 299–304. [Google Scholar] [CrossRef] [PubMed]
- Keeling, P.J.; Palmer, J.D. Horizontal gene transfer in eukaryotic evolution. Nat. Rev. Genet. 2008, 9, 605–618. [Google Scholar] [CrossRef] [PubMed]
- Fisher, M.; Ramdas, K.; Ulrich, K. Component sharing in the management of product variety: A study of automotive braking systems. Manag. Sci. 1999, 45, 297–315. [Google Scholar] [CrossRef]
- French, M. Invention and Evolution: Design in Nature and Engineering, 2nd ed.; Cambridge University Press: Cambridge, MA, USA, 1994. [Google Scholar]
- Geroski, P. The Evolution of New Markets; Oxford University Press: Oxford, MI, USA, 2003. [Google Scholar]
- Grether, G.F.; Losin, N.; Anderson, C.N.; Okamoto, K. The role of interspecific interference competition in character displacement and the evolution of competitor recognition. Biol. Rev. 2009, 84, 617–635. [Google Scholar] [CrossRef] [PubMed]
- Metcalfe, J.S. Evolutionary Economics and Creative Distrution; The Graz Shumpeter Lectures, Reoutledge: Graz, Austria, 1998. [Google Scholar]
- Lo, A.W. The adaptive markets hypothesis: Market efficiency from an evolutionary perspective. J. Portf. Manag. 2004, 30, 15–29. [Google Scholar] [CrossRef]
- O’Higgins, P.; Cobb, S.N.; Fitton, L.C.; Groning, F.; Phillips, R.; Liu, J.; Fagan, M.J. Combining geometric morphometrics and functional simulation: An emerging toolkit for virtual functional analyses. J. Anat. 2010, 218, 3–15. [Google Scholar] [CrossRef] [PubMed]
© 2015 by the authors; licensee MDPI, Basel, Switzerland. This article is an open access article distributed under the terms and conditions of the Creative Commons Attribution license (http://creativecommons.org/licenses/by/4.0/).
Share and Cite
MDPI and ACS Style
Costa, C.; Aguzzi, J. Temporal Shape Changes and Future Trends in European Automotive Design. Machines 2015, 3, 256-267. https://doi.org/10.3390/machines3030256
AMA Style
Costa C, Aguzzi J. Temporal Shape Changes and Future Trends in European Automotive Design. Machines. 2015; 3(3):256-267. https://doi.org/10.3390/machines3030256
Chicago/Turabian StyleCosta, Corrado, and Jacopo Aguzzi. 2015. "Temporal Shape Changes and Future Trends in European Automotive Design" Machines 3, no. 3: 256-267. https://doi.org/10.3390/machines3030256