Methylene Blue Adsorption Study on Microcline Particles in the Function of Particle Size Range and Temperature


1
Szentágothai Research Centre, Environmental Analytical and Geoanalytical Research Group, University of Pécs, Ifjúság u. 20, H-7624 Pécs, Hungary
2
Department of Analytical and Environmental Chemistry, University of Pécs, Ifjúság útja 6., H-7624 Pécs, Hungary
3
Department of Geology and Meteorology, University of Pécs, Ifjúság u. 6, H-7624 Pécs, Hungary
*
Authors to whom correspondence should be addressed.
Minerals 2019, 9(9), 555; https://doi.org/10.3390/min9090555
Submission received: 19 August 2019
/
Revised: 9 September 2019
/
Accepted: 12 September 2019
/
Published: 15 September 2019
(This article belongs to the Special Issue Mineral Sorbents)
Abstract
:In this paper, the adsorption process of methylene blue has been investigated on microcline particles as a function of particle size and temperature. The characterization of microcline in the particle size ranges of 1−71 μm and 71−315 μm gained by sieving was proved using X-ray diffraction (XRD) and scanning electron microscopy combined with energy-dispersive detector (SEM-EDS) in powder form, over laser diffraction measurements in aqueous suspension. The optimum dosage of adsorbent was 13.5 g/L in dye adsorption and the adsorption isotherms on both microcline size fractions were determined at this adsorbent concentration. The maximum adsorption capacities were in the range of 1.5–3.1 mg g−1 on microcline particles with supplementing evaluation of isotherms using the Langmuir model. Considering the problems of linearization of equations, the non-linear least-squares estimation can be strongly recommended for modeling adsorption-equilibrium. The adsorption isotherm determined at elevated temperature of 60−65 °C represents a breakpoint at around 20 mg L−1 of equilibrated dye concentration due to performing of a potential process of dye self-association. According to our experiments, the increase in temperature has an adverse effect on adsorption.
1. Introduction
Many of the articles dealing with the adsorption of methylene blue (MB) dye on various surfaces and with the spectra of adsorbed molecules, analyze in detail the conformational effects of the ions on each other and of the molecules/ions on the surfaces [1,2,3]. These conformational effects depending on the concentration (pH, temperature, etc.) are present on the surfaces and in the solution too. So, the full spectra of the MB+ (dimer or higher aggregates) may also contain peaks and shoulders, which are fingerprints of these effects and not of the solvent effect only [4].
Cenens and Schoonheydt [2] differentiate four MB species on the clays: the monomer (MB+), the protonated monomer (MBH2+), the dimer ((MB+)2), and the trimer ((MB+)3) according to the different band positions. They drew attention to the hardness of measuring the absorption of dye aggregates and recording spectra when the dye concentration is high. These circumstances decreased the concentration of the monomeric species. The authors investigated four different surfaces at various pHs, with different counterions on the surfaces and various concentrations of the suspension and dye solution. They proposed the adsorptive power of the sites of the surfaces which affected the forces of the formation of aggregates. They also queried the use of methylene blue for determination of specific surface area because of the self-association of dye ions [2].
Bergmann and O’Konski [5] reported the metachromatic effects in methylene blue and the related shifts of the absorption peaks in the spectra when the dye concentration has changed. These shifts may be connected to the structure like a sandwich or other parallel or anti-parallel contact of the dye ions (MB+ is the monomer). First of all, they studied the binding of MB to montmorillonite and the probable structure of these cation exchange products and made some effort to determine the monomer-dimer equilibrium of the dye species. This study gives some evidence for the conversion (or decomposition) of the dye to other methylated thionines, which also could complicate the spectral measurements. However, they used for concentration determination the difference between the MB-Na-montmorillonite suspension spectra and MB supernatant spectra, there probably be some differences in the equilibrium when the MB remains only in the cuvette. According to the kinetic study of the adsorption 2 h enough for the equilibrium to state [5].
Spencer and Sutter [6] studied the monomer-dimer equilibrium of MB at five temperatures by utilizing the temperature-jump technique and proposed a possible reaction mechanism as diffusion-controlled interaction of the monomers.
Besides the mechanism above we should have to concern with the face-to-face interactions of the heteroaromatic dye ions in aqueous solutions, which are assigned further absorption tendencies in the measured spectra [7,8,9,10,11]. In most cases, it is very difficult to determine all the associations (multiple equilibria) at various concentrations. Mukerjee and Ghosh [8] evolved a useful method to study the self-association of methylene blue and other complicated association equilibria in the concentration range of 10−6–10−4 M. They have investigated the partition equilibrium of the dye and have maintained its total concentration in the organic phase, but there is no evidence for the salt loaded in the aqueous phase to not affect the association equilibria of the dye molecules in the aqueous phase [7].
Allingham et al. [12] suggests that the type of the MB species in the suspension may also control the adsorption sequence. In this way, the aggregates may be the first which will be adsorbed on the surface depending on the type of the surface.
Bujdák and Komadel [13] used the MB species as indicators of the layer charge density of smectites. By means of visible absorption spectroscopy, they have measured and correlated the contents of MB agglomerates with the layer charge reduction when the formation of the monomers was favored. They also found a connection between the lower negative charge density and distance of the sorbed MB cations [13].
Clays and clay minerals as adsorbent materials are potential candidates for the removal of various pollutants from water [14,15]. Awala and El Jamal [16] studied the adsorption surface of feldspar and the adsorption of dyes on these surfaces. They have found that the adsorption capacity of feldspar was smaller than of clays, however, they supplied detailed information about these adsorption processes on feldspar under several measuring conditions [16].
Murakami [17] focused on the kinetic studies of the dimerization equilibrium under various experimental conditions and the structures of several dyes, which participate in the self-association process. In this work the effect of dye structure, presence of salt, solvent, and a neutral organic substance was examined. In his summary he underlined the influence of the enthalpy–entropy compensation relation on the regulation of the rates of the forward and backward reaction [17]. For methylene blue dimerization, the work of Spencer and Sutter is also cited [6]. The authors assumed that there were dipole–dipole and/or ion–dipole interactions in the diffusion-controlled step.
Besides the aforementioned preconditions of the authors, we also make some further assumptions. If the higher aggregates or micelles of the dye molecules/ions are the same sizes than the particle sizes of the adsorbent in suspension, a possible action of ’adsorbent’ adsorption can be considered in the process. Under such circumstances, there will be a special concentration of the dye, where the adsorption may have more interpretations. However, the preparation of the suspension with uniformity of the particles is probably impossible due to the natural origin against the synthesized activated carbon particles; we could approach an ideal composition of the samples to make optimal measuring conditions, which are useful for defining an interval of the adsorption capacity of the surfaces and estimation of the specific surface area [18]
Various adsorbents such as activated carbon [19], some clays [20,21], and carbon nanotubes [22,23] were successfully used to remove dyes from aqueous solution. The most widely used adsorbents for the adsorption process in industrial wastewater treatment systems is activated carbon due to its large specific area. Owing to the high cost of activated carbon, the use of this adsorbent is limited. Therefore, research has continued for inexpensive alternative adsorbents with reasonable adsorption efficiencies [20].
Accordingly, we gave above several theoretical and experimental information about the self-association processes of methylene blue species based on the literature. In our study we investigate the specific adsorption capacities of the methylene blue species on microcline surfaces containing smaller particles than 71 μm and particles with sizes from 71 μm up to 315 μm, in two particle size ranges, so we had to measure the equilibrium methylene blue concentration in bulk after the dye molecules adsorbed on the feldspar surfaces. On the other hand, the methylene blue adsorption isotherms were determined at room and elevated temperatures, supplemented with structural and elemental analysis of the native and the treated microcline particles.
2. Materials and Methods
2.1. Characterization of Materials
The raw feldspar (microcline) was sampled from the Mórágy Granite Formation [24]. The microcline megacrysts are from monzogranite rocks and their K-feldspar component varies between 89.4 and 94.5 Or% (orthoclase) while the albite component changes from 4 to 11% [24]. The natural microcline was chopped and ground in a mortar to smaller particles. Then the particles were sieved, and were fractionalized into two particle ranges, which are the following: d < 71 µm and 71 < d < 315 µm. All the samples were dried at 105 °C for 24 h to remove moisture or any contaminants before adsorption experiments.
The methylene blue (purity >99%, CAS number: 61-73-4, MW: 319.86 g mol−1) was produced by VWR (Hungary), fabricated by REACTIFS RAL SA (France) used without further purification. The test solutions were prepared by diluting 400 mg L−1 of stock solution to the desired concentrations.
2.2. X-ray Diffraction
The XRD patterns were collected using Cu-Ka radiation (40 kV, 15 mA) with a Rigaku MiniFlex 600 (Rigaku, Tokyo, Japan). Scans were made at room temperature from 10 to 55 with a step of 0.02/s. Quantitative crystal phase analysis was performed by an internal standard method.
2.3. Determination of Particle Size Distributions in Aqueous Suspension
Determination of particle size distributions of microcline particles in aqueous suspensions was performed by using laser diffraction (Mastersizer 3000, Malvern, UK). The particle size distributions were in the following ranges according to sifting: d < 71 μm and 71 < d < 315 μm. Using laser diffraction these microcline fractions’ particle size distributions were determined in aqueous suspensions.
2.4. Methylene Blue Adsorption by Batch Technique
The adsorbed amount of methylene blue was determined as a function of concentration by the batch technique. A known mass of adsorbent (0.135 g) was immersed in solutions (V = 20 mL) of different concentrations for adsorption isotherm determination. The initial concentrations of methylene blue in solutions were in the range of 10−200 mg L−1. Samples were agitated on a shaker at 400 rpm and constant temperature (22.5 ± 2 °C). Samples were taken in 24 h and then centrifuged at 8000 rpm (RCF = 6153) for 15 min. The supernatants were used for the analysis of the residual methylene blue. The amount of methylene blue adsorbed at equilibrium, q (mg g−1), was obtained as follows (Equation (1)):
where, and are the initial and equilibrium liquid phase concentrations (mg L−1), V is the volume of the solution (L) and m is the weight of the dry mineral used (g). All experiments were triplicated and mean values were used for analyses.
The methylene blue adsorption study was also performed for smaller particle size than 71 μm at 60 ± 2 °C elevated temperature using silicone oil bath, in the range of 10–105 mg L−1 methylene blue concentration.
According to Awala and El Jamal [16], investigation of pH effect on methylene blue adsorption on feldspar, the optimal pH range is from 4 to 8. The sorption studies were performed without pH adjustment [14]. At higher pH values in suspension, the adsorption efficiency is slightly increased, but these pH values are rarely present in the environment, with the exception of the specific contaminated area [16,25]. The pHPZC (point of zero charge) value for feldspar was 7.5 [25].
2.5. Effect of Adsorbent Dose on Adsorption
Different dosage of adsorbents (0.05; 0.1; 0.2; 0.3; 0.4; 0.5; 0.6; 0.7; 0.8; 0.9 and 1.0 g) were used in 10 mL volume of solution at constant concentration of methylene blue to study the adsorption efficiency and determine the optimal adsorbate/adsorbent dose for adsorption isotherm. Solutions with 10 mg L−1 initial methylene blue concentration were used under batch condition. The suspensions were ultrasonically treated for 10 min. The methylene blue content of the supernatant was measured by spectrophotometry. The efficiency of the removal was calculated (Equation (2)):
2.6. Analysis of Methylene Blue
Methylene blue concentration in the supernatant was determined by UV-visible spectrophotometry (Genesys 10S UV-VIS, United States) at λ = 664 nm using calibration in 1.0–8.0 mg L−1 of methylene blue concentration range.
2.7. Scanning Electron Microscopy and Elemental Analysis
The surface morphology and elemental composition of the adsorbents were examined using a field-emission scanning electron microscope (FE-SEM) Jeol JSM-IT500HR (Jeol, Tokyo, Japan) equipped with an energy dispersive X-ray analyzer (Jeol, Tokyo, Japan), and set at an accelerating voltage of 7.0 kV and 200–250× magnification.
3. Results
3.1. X-ray Diffraction of Microcline Particles
The microcline reference material data was from the RRUFF database (RRUFF ID: R040154). The XRD patterns of our samples are identical, major diffraction peaks appear at 6.458 Å (20%) and 3.236 Å (100%) as seen in Figure 1.
3.2. The Particle Size Distribution of Microcline Particles in Aqueous Suspensions
The size of microcline particles and their possible aggregates have been determined by laser diffraction in aqueous suspension before and after using ultrasonic treatment in 10 min. The time of treatment was chosen as the adsorption systems were ultrasonically treated in 10 min. In Figure 2A and b the particle size distribution curves measured for smaller particles than 71 μm (d < 71 μm) and those particles in ranged from 71 to 315 μm (71 < d < 315 μm) can be seen in the particle size range of 0.1 and 500 μm.
The particle size distribution curve of smaller particles than 71 μm shows that from 0.594 μm of size, the volume percent of particles increased up to 7.35% (the arithmetic mean particle size is 51.87 μm, see Table 1), then it continuously decreased till 163 μm. The volume percent maximum is reached at 58.9 μm. We can note that the size of most primer and aggregated particles are in the range of 27.4–111 μm for this fraction in aqueous suspension. In Figure 2B the measured size distribution curve of particles ranged from 71 μm to 315 μm shows that from 58.9 μm of size, the volume percent of cells increased up to 14.99% (the arithmetic mean particle size is 155.7 μm, see Table 1), then it decreased till 352 μm. The volume percent maximum is reached at 144 μm.
3.3. Optimum Adsorbate/Adsorbent Dose in Methylene Blue Adsorption on Microcline Particles
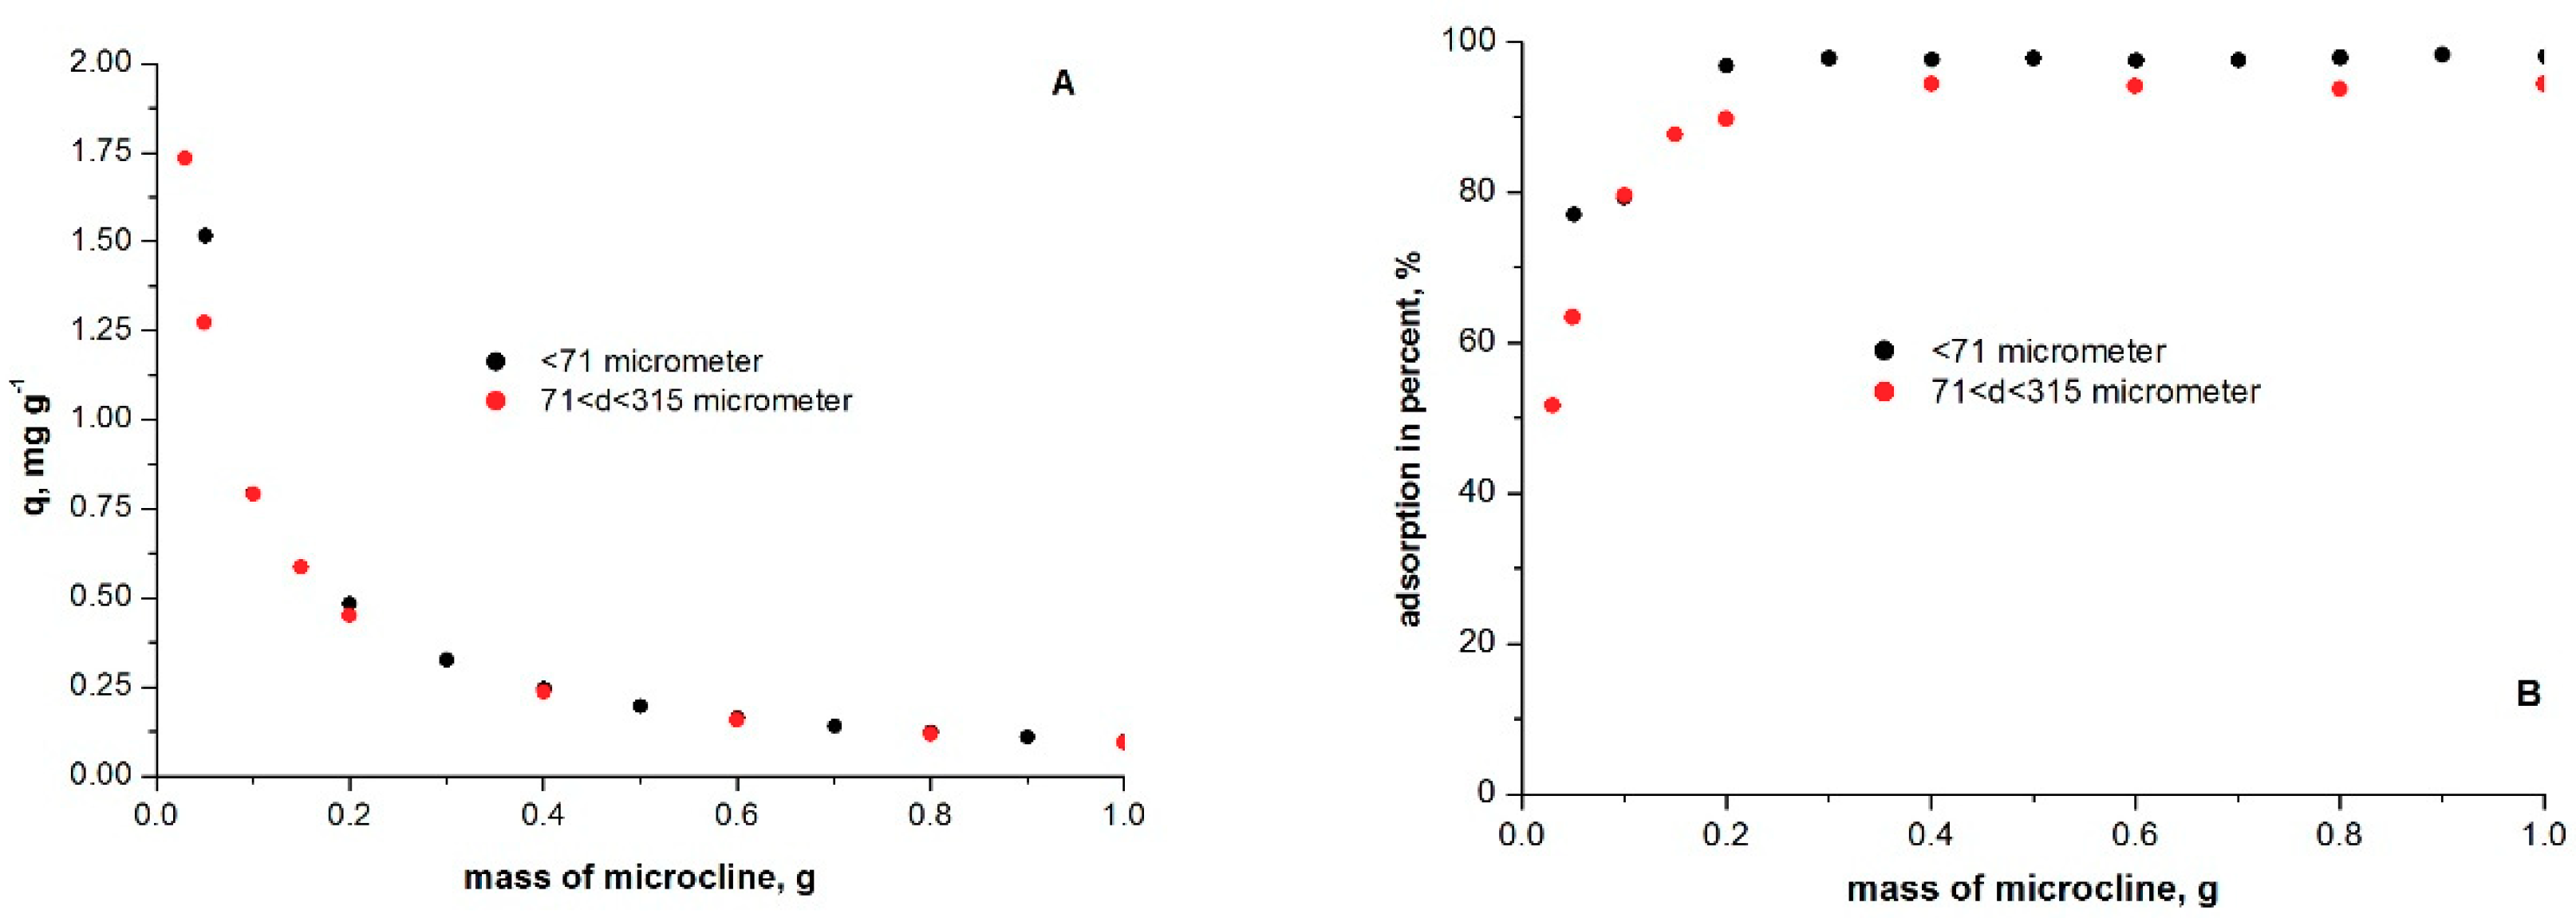
The effect of microcline adsorbent dosage for methylene blue adsorption onto microcline particles is shown in Figure 3A,B. The microcline amount was taken between 0.05–1.0 g in 10 mL solutions and the initial dye concentration was constant as 10 mg L−1. The microcline particle sizes were smaller than 71 μm, and from 71 μm up to 315 μm. Using these two size fractions of microcline particles as adsorbents, reaching methylene blue adsorption equilibrium, the calculated specific adsorbed amounts are presented in the function of mass microcline particles in Figure 3A. The results show that when the adsorbent dosage increased from 0.05 g to 0.4 g, the specific adsorbed amounts exponentially decreased from 1.75 mg g−1 to 0.25 mg g−1 according to the Kroeker’s rule, then the values were slightly varied. In Figure 3B the adsorption efficiency in percentage can be seen in the function of microcline mass. As the adsorbent dosage increased from 0.05 g to 0.25 g, the removal of dye is also increased from about 50% to about 95%, and then reaches a plateau.
3.4. Methylene Blue Adsorption Isotherms on Microcline Particles at Room and Elevated Temperatures
The theoretical and experimentally determined methylene blue adsorption isotherms in aqueous suspensions containing microcline particles smaller than 71 μm (d < 71 μm) and in the size range from 71 μm up to 315 μm (71< d <315 μm) are presented in Figure 4A at room temperature. For particles smaller than 71 μm, the maximum experimental adsorption capacity for dye is 2.9–3.1 mg g−1, while for particles in the range from 71 μm up to 315 μm is 1.5−1.6 mg g−1. In Figure 4B the adsorption results can be seen at an elevated temperature of 60–65 °C using the microcline fraction containing smaller particles than 71 μm. The specific adsorbed amounts of dye and the adsorption in percentages are presented against the dye equilibrium concentration. With increasing equilibrium concentration up to 22 mg L−1, the specific adsorbed amount continuously increased up to 3.96 mg g−1, then it decreased to a value of 0.49 mg g−1 at 98 mg L−1 equilibrium concentration.
3.5. Structural and Elemental Analysis of Native and Methylene Blue Treated Microcline Particles by SEM-EDS
Scanning electron microscopy (SEM) has been a primary way to characterize the morphology of surface and fundamental physical properties of the adsorbent surface. It is useful to determine the porosity, particle shape, and appropriate size distribution of the adsorbent. The morphology of microcline adsorbent was examined using SEM (Figure 5A,B). The SEM image of microcline shows that the microcline structure consists of a K, Na, Si, Al, O, and C elements, which favor the adsorption methylene blue (Figure 5C). The chemical compositions of these cleaned mineral samples are determined by electron microprobe Király [24] which yields the chemical formula of K0.82Na0.18Al0.98Si3.015O8 which has been calculated following the method of Deer et al. [27].
There is a good possibility for the dye to be trapped and adsorbed into these pores and inter-spatial voids. In Figure 6 the elemental composition can be seen after adsorption of dye on microcline particles. Secondary mineral products were identified as calcite (Figure 6). Calcite occurs as a fine coating on microcline surfaces shows some disc-shaped crystals (Figure 6A) ranging from 0.5 to 2 μm in size. Calcite particles stick loosely onto the surface of feldspar and are easily taken off, suggesting both that there is no structural inheritance from feldspar to calcite and that calcite is most likely formed from a dissolution–precipitation process, i.e., feldspar → aqueous components → calcite.
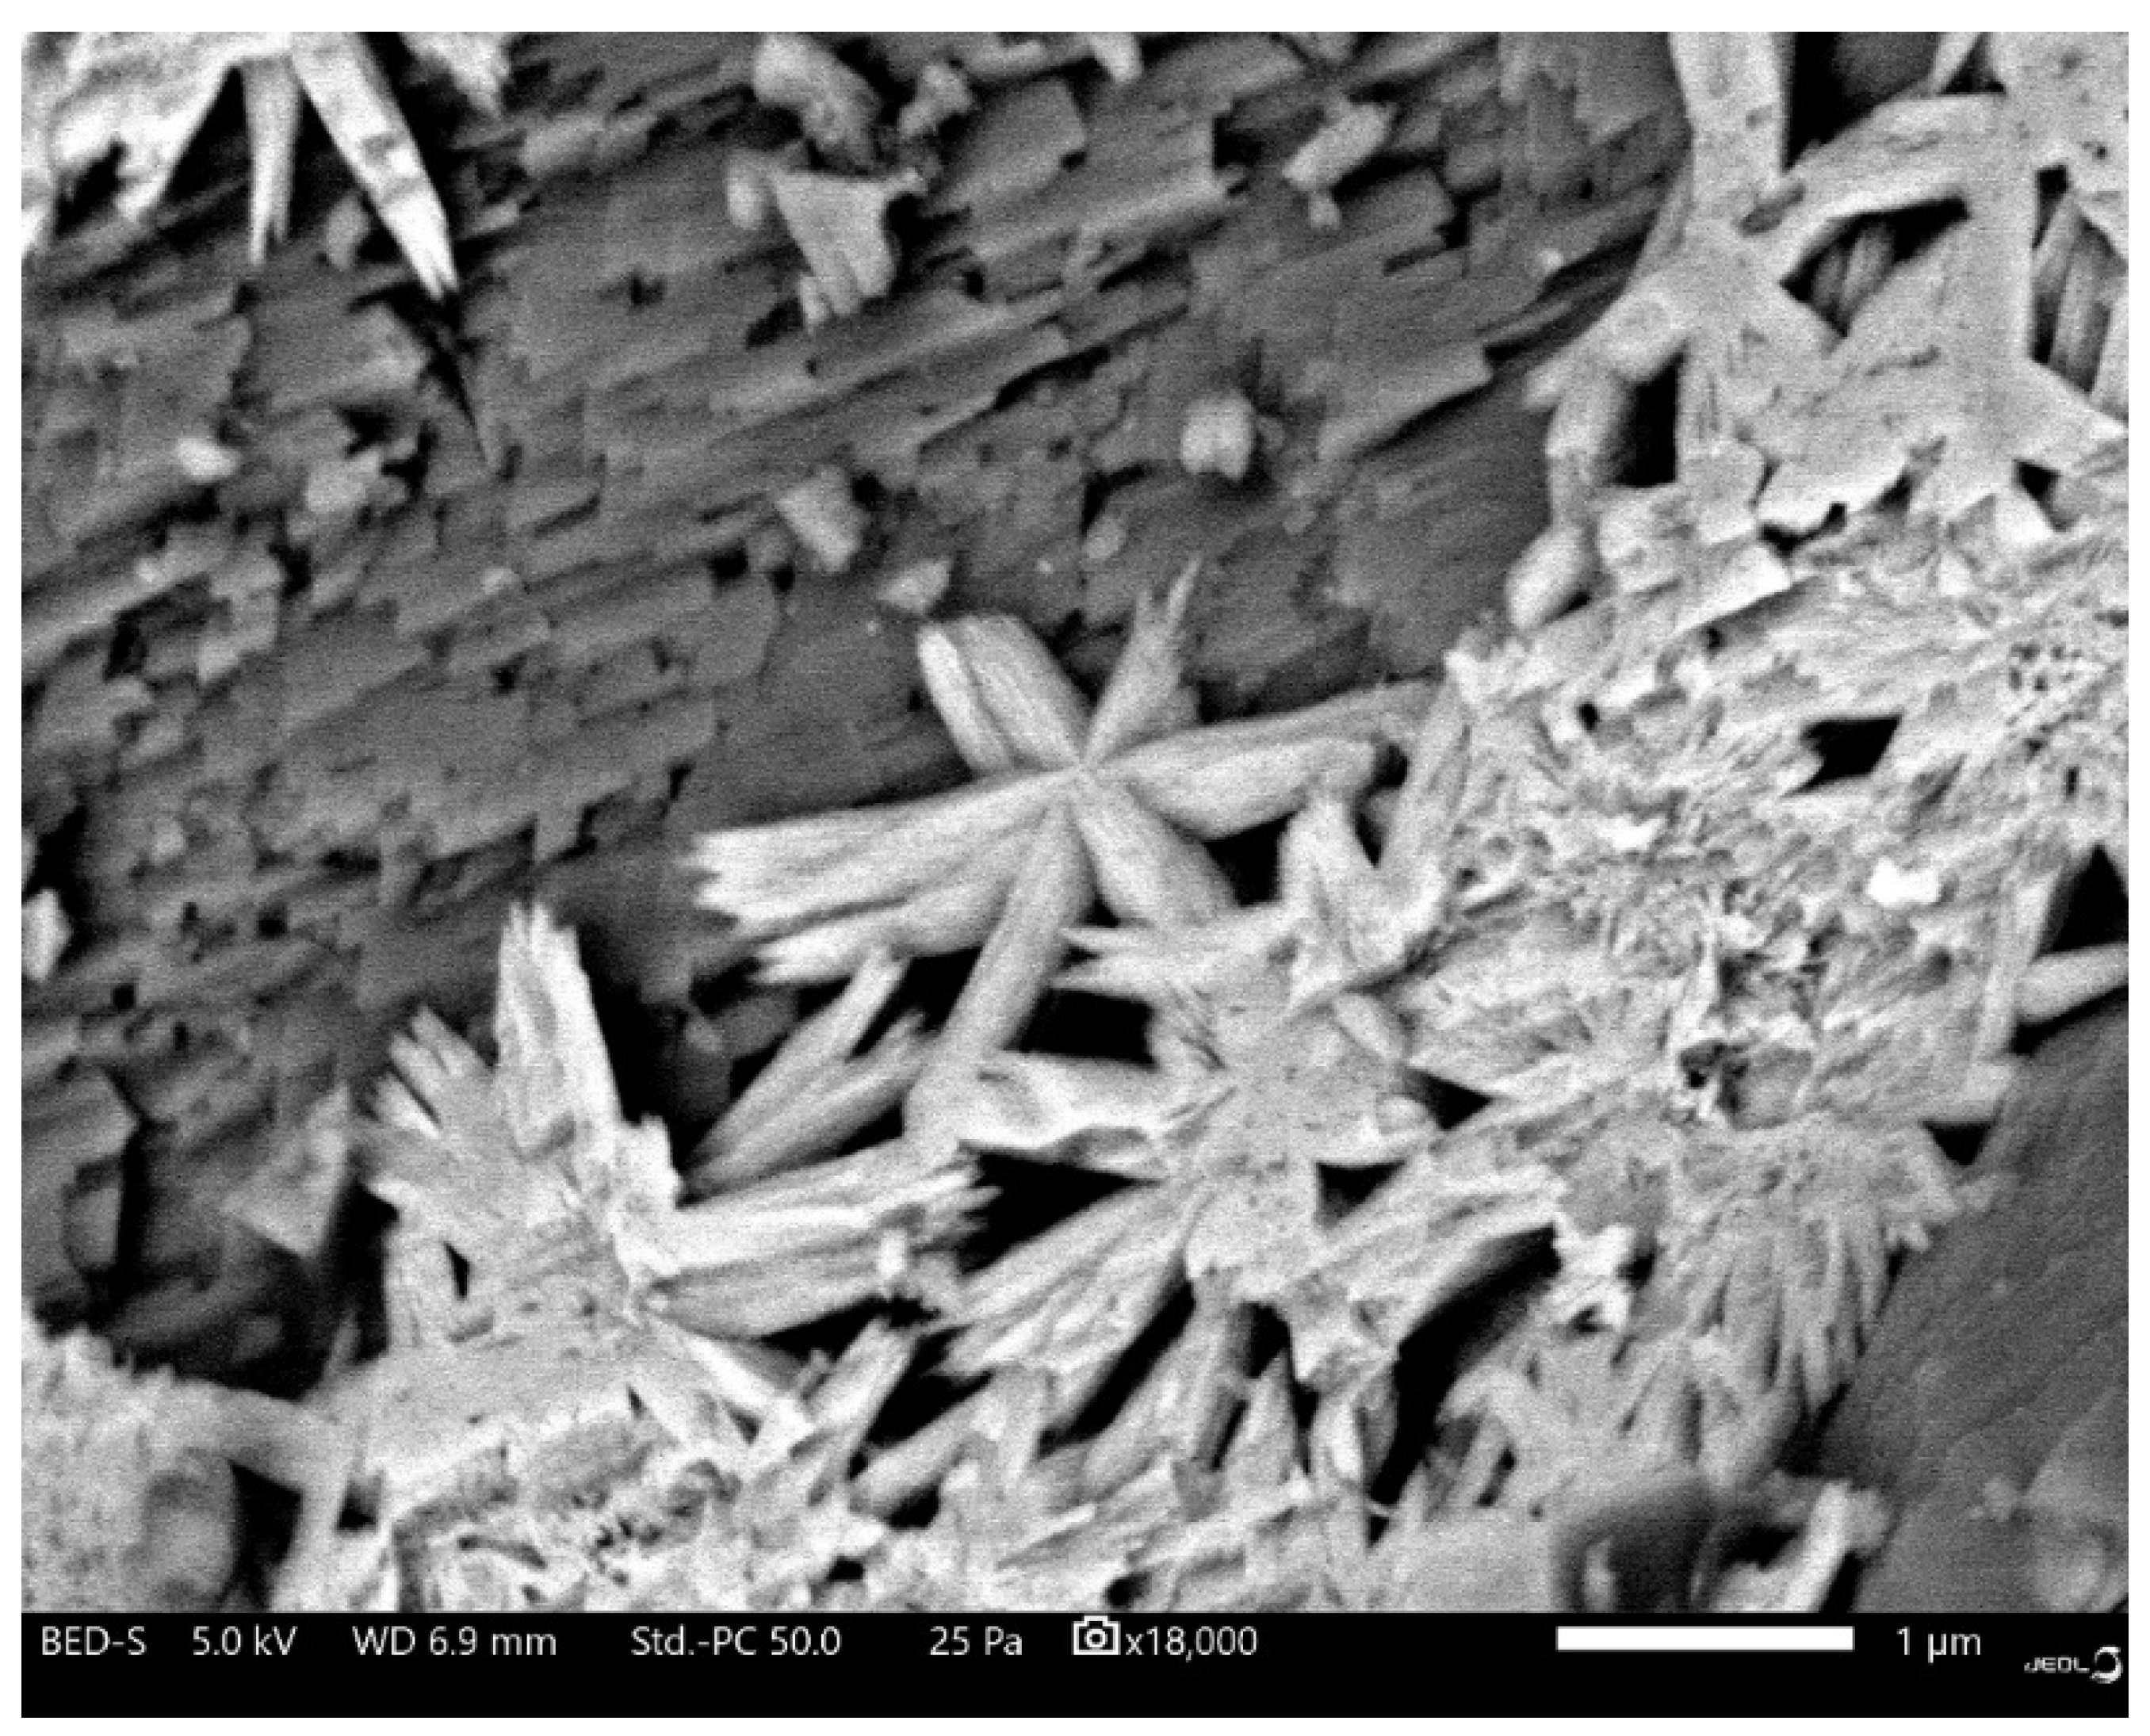
Source of the secondary CaCO3 coating should be some non-pure microcline particle, caused by sampling error (see Figure 7).
4. Discussion
Two microcline fractions gained by sieving were used as possible natural adsorbents in the cationic dye adsorption process. In the microcline fraction containing particles smaller than 71 μm the most primer and aggregated particles have a size in the range of 25–125 μm, while in the fraction containing particles in the range of 71–315 μm they have size from around 98 up to 240 μm in aqueous suspension. We have to emphasize that the 10 min of ultrasonically treatment of aqueous suspensions containing microcline particles with various sizes does not have any effect on the measured particle size distribution.
On the issue of the fraction containing smaller particles than 71 μm the adsorption efficiency is slightly higher in comparison to that of particles in the range of 71–315 μm due to the higher adsorption surface. Awala and El Jamal [16] reported that at 1.15 g adsorbent dosage the maximum adsorption efficiency was 90%, but in 30 mL suspension, it means 38.3 g/L adsorbent concentration. In our study, the maximum adsorption efficiency (95%) is determined at around 20 g/L of adsorbent concentration. The difference can be explained that most of the particles have a diameter of about 100–150 μm in both of our fractions and show more homodispersivity based on laser diffraction measurement. Moreover, we used pure microcline feldspar containing other cations and chemical composition, which have a role in forming a double electrostatic layer around particles. An experimental parameter of shaking speed in our case was higher (400 rpm) than in Awala and El Jamal’s [16] study (250 rpm), which also influences the particle size formation and adsorption process in suspension. According to Awala and El Jamal [16], a raw feldspar material was used as adsorbent with particle size distribution of 2–280 μm. For further experiments an optimum adsorbent concentration of 13.5 g L−1 was chosen on the basis of extrapolation in Figure 3A. Yazdani et al. [25] also observed that the dye increased by increasing the amount of feldspar added, and approximately most of the dye removal was achieved within the amount 2.5 g L−1, but after this point the change of adsorption amount was not considerable.
In accordance with adsorption-equilibrium experiments, the microcline particles smaller than 71 μm can adsorb around the double amount of dye than the particles having sizes in the range of 71–315 μm due to the higher specific surface area and the available surface active sites. The 10 min of ultrasonic treatment of aqueous suspensions containing microcline particles with various sizes does not have any effect on the measured particle size distributions and thus significantly on the adsorption (Figure 2A,B). On the surfaces of both microcline mass, in the equilibrated dye concentration range of 10–200 mg L−1 at the temperature of 22.5 °C, the monolayer is saturated at around 80 mg L−1 equilibrated concentration.
An increase in dye initial concentration causes an increase in the adsorption capacity of dyes in single and binary systems [26]. It indicates that the initial dye concentration plays an important role in dye adsorption capacity [27,28]. However, the percentage removal was higher at a lower concentration, as it has been found by other authors [29,30]. In addition, the initial rate of dye adsorption is greater for higher initial dye concentration because the opposition to the dye uptake reduced as the mass transfer driving force enhanced [29,31]. The initial dye concentration in solution provides an important driving force in overcoming mass transfer resistance between the aqueous and solid phases [31]. In the lower concentrations, all the methylene blue molecules present in the adsorption system are attracted by the unoccupied binding sites, providing higher percentage removal. Increasing the concentration, the occupation of available sites increases, until saturation of particle occurs. In the equilibrium condition, both forward and reverse rates must be the same and the concentration remains constant [31].
The analysis of equilibrium is important for developing a model that can be used for the design of sorption systems and evaluate the equilibrium [32,33]. Two classical adsorption models, Langmuir and Freundlich isotherms, are most frequently employed. With our sorption experimental results, the Langmuir isotherm equation could be applied for analyzing the adsorption equilibrium, as the shape of determined isotherms suggests that. Almeida et al. [31] also found that application of the Freundlich model to the experimental data gave a poor fit, so it is inappropriate for the methylene blue/aluminosilicate waste system [31]. According to Yazdani et al. [25], the adsorption of Basic Red 18 and Basic Blue 41 onto feldspar followed with Langmuir and extended Langmuir isotherms in single and binary systems [28].
The Langmuir isotherm is valid for monolayer adsorption onto a surface with a finite number of identical sites [32,33,34]. It is given as an equation:
Ce and qeq are equilibrium concentrations (mg L−1) in the solution and in the adsorbent at equilibrium (mg g−1), respectively. Q0 and b are Langmuir constants related to the capacity and energy of adsorption, respectively.
Harrison and Katti [35] have recommended a direct non-linear least-squares estimation for the determination of the Langmuir constants due to the hazards of linearization of the Langmuir model. The non-linearly estimated adsorption isotherms of methylene blue obtained using microcline particles in two particle size ranges are shown in Figure 4A with the experimental data. The values of Q0 and b calculated from non-linear least-squares estimation using Origin6.0 are also given in Table 1. The Langmuir constant b is an indicator of the stability of the combination between the adsorbate and adsorbent surface, and a constant related to the free energy or net enthalpy of adsorption. Using non-linear fitting the estimated values of the Langmuir constants are Q0 = 3.00 mg g−1 and b = 0.32 L mg−1 for the particle size smaller than 71 μm, while they are Q0 = 1.66 mg g−1 and b = 0.30 L mg−1 for the particle size range from 71 μm up to 315 μm.
The theoretical maximum adsorption capacity, Q0, calculated from non-linear least-squares estimation shows a good match with their experimental ones determined for both microcline mass with various particle size distribution. The estimated values of b are less than a unit, and about the same (0.30−0.32 L mg−1) for both particle mass. It can be found in the literature that the adsorption equilibrium of cationic dyes—such as methylene blue—follows the Langmuir isotherm [16,18,25,31,34,36]. Similar results were reported for the adsorption isotherms of various pollutants onto different adsorbent types [21,37]. At significantly elevated temperature of 60–65 °C using the microcline fraction containing smaller particles than 71 μm, the methylene blue adsorption closely linearly increased up to the 3.96 mg g−1 specific adsorbed amount at 22 mg L−1 equilibrated concentration, then it linearly decreased up to 98 mg L−1 equilibrated concentration, where the adsorbed amount is 0.49 mg g−1. So, a breakpoint can be stated on the isotherm at 60–65 °C. At the same temperature, the dye adsorption efficiency continuously decreased from 97% to 6%. Presumably, above 22 mg L−1 equilibrated concentration and at significantly elevated temperature of 60–65 °C a potential process of dye self-association can be preferentially performed against dye adsorption process. At 60–65 °C the adsorption efficiency decreased from 97% to 6.3% in 10–100 mg L−1 of equilibrium concentration range, while at room temperature it also decreased from 97% to 21% in 10–200 mg L−1 of equilibrium concentration range. At room temperature, at 108 mg L−1 of equilibrium concentration, the efficiency is 27.4%, it can be concluded, that the increasing temperature has an adverse effect on adsorption.
Awala and El Jamal [16] revealed that methyl red and fluoresceine did not show any adsorption at any pH, however, methylene blue showed low adsorption on feldspar. According to Langmuir isotherm, the maximum adsorption capacity was estimated as 0.37 mg g−1 at room temperature and 0.66 mg g−1 at 40 °C. The value of Langmuir constant b was 0.16–0.21 L mg−1 (Table 2.). The positive enthalpy indicated that the adsorption was endothermic. The negative values of Gibbs energy revealed that the adsorption was spontaneous [16]. The adsorption of Basic red 18 and Basic Blue 41 onto feldspar was also followed with Langmuir and extended Langmuir isotherms in single and binary systems, respectively. Their thermodynamic data showed that dye adsorption was spontaneous, endothermic, and physisorption reaction. For maximum adsorption capacity in a single system, the values of 10.75 and 11.11 mg g−1 were determined with 0.69 and 0.87 L mg−1 of Langmuir constant b [25]. An aluminosilicate waste from coal mining containing kaolinite, minor components, and organic compounds was investigated as an adsorbent for methylene blue dye by Almeida et al. [31]. The isothermal data from batch experiments were fitted to Langmuir and Freundlich equations, with a better fit shown by Langmuir isotherm equation. The thermodynamic parameters were also calculated by them, showing the adsorption to be an endothermic yet spontaneous process, with the activation energy of +37.8 kJ mol−1 [31]. The equilibrium data of toluidine blue and cetyl trimethylammonium bromide in single solute system on clay and sandstone fitted well to the Langmuir and Freundlich adsorption isotherms. Competitive adsorption was observed between dye and surfactant cations. Competition of Na+ ions with dye and surfactant cations was also investigated to provide information about their adsorption behavior in saline water [36]. Among a huge number of recent papers, in Table 3, several methylene blue adsorption capacities are summarized onto various kinds of natural and modified minerals [38,39,40,41,42,43].
As written above, the authors used the linearization of adsorption isotherm equations for estimation of Langmuir constants. Considering the problems of linearization of equations, the non-linear least-squares estimation can be strongly recommended for modeling adsorption-equilibrium [35]. Langmuir model exhibits a good fit to the adsorption data of cationic dye using non-linear least-squares estimation.
5. Conclusions
An overview is given on methylene blue adsorption behavior at microcline/water interfaces at room and significantly elevated temperature using microcline fractions containing particles having various sizes, which can be useful in the prediction of cationic dye contaminant environmental behavior and planning environmental treatment for contamination [44,45]. The methylene blue limiting adsorption is also an accepted method for prediction of specific surface area supplemented with gas adsorption/desorption experiments [18]. One concludes that the feldspar as an eco-friendly and low-cost adsorbent might be a suitable alternative to remove dyes from colored aqueous solutions containing cationic dyes. A breakpoint can be stated on the dye adsorption isotherm at 60–65 °C, which needs further investigations in the direction of dye self-association and determination of critical micellar concentration at this elevated temperature.
Author Contributions
T.P. and R.F. conceived and designed the experiments; T.P., R.F., and J.K. performed the experiments; T.P. and R.F. analyzed the data; T.P., R.F., and J.K. wrote the paper.
Funding
This research was funded by NRDI Fund, grant number 20765-3/2018/FEKUTSTRAT and the APC was funded by the European Union, co-financed by the European Social Fund: EFOP-3.6.1.-16-2016-00004.
Acknowledgments
Special thanks go to Zsófia Busa (Szentágothai Research Centre, Environmental Analytical and Geoanalytical Research Group, University of Pécs) for technical assistance and preparation of the samples.
Conflicts of Interest
The authors declare no conflict of interest. The funders had no role in the design of the study; in the collection, analyses, or interpretation of data; in the writing of the manuscript, or in the decision to publish the results.
References
- Brasswell, E. Evidence for trimerization in aqueous solutions of methylene blue. J. Phys. Chem. 1968, 72, 2477–2483. [Google Scholar] [CrossRef]
- Cenens, J.; Schoonheydt, R.A. Visible spectroscopy of methylene blue on hectorite, laponite B, and barasym in aqueous suspension. Clays Clay Miner. 1988, 36, 214–224. [Google Scholar] [CrossRef]
- Rápó, E.; Szép, R.; Keresztesi, Á.; Suciu, M.; Tonk, S. Adsorptive Removal of Cationic and Anionic Dyes from Aqueous Solutions by Using Eggshell Household Waste as Biosorbent. Acta Chim. Slov. 2018, 65, 709–717. [Google Scholar] [CrossRef]
- Ovchinnikov, O.V.; Evtukhova, A.V.; Kondratenko, T.S.; Smirnov, M.S.; Khokhlov, V.Y.; Erina, O.V. Manifestation of intermolecular interactions in FTIR spectra of methylene blue molecules. Vib. Spectrosc. 2016, 86, 181–189. [Google Scholar] [CrossRef]
- Bergmann, K.; O’Konski, C.T. A Spectroscopic study of Methylene Blue Monomer, Dimer, and Complexes with Montmorillonite. J. Phys. Chem. 1963, 67, 2169–2177. [Google Scholar] [CrossRef]
- Spencer, W.; Sutter, J.R. Kinetics study of the monomer-dimer equilibrium of methylene blue in aqueous solution. J. Phys. Chem. 1979, 83, 1573–1576. [Google Scholar] [CrossRef]
- Mukerjee, P.; Ghosh, A.K. “Isoextraction” method and the study of the self-association of methylene blue in aqueous solutions. J. Am. Chem. Soc. 1970, 92, 6403–6407. [Google Scholar] [CrossRef]
- Ghosh, A.K.; Mukerjee, P. Multiple association equilibria in the self-association of methylene blue and other dyes. J. Am. Chem. Soc. 1970, 92, 6408–6412. [Google Scholar] [CrossRef]
- Ghosh, A.K.; Mukerjee, P. Ionic strength effects on the activity coefficient of methylene blue and its self-association. Study of the self-association of methylene blue from protonation equilibriums. J. Am. Chem. Soc. 1970, 92, 6413–6415. [Google Scholar] [CrossRef]
- Ghosh, A.K. Study of the self-association of methylene blue from protonation equilibriums. J. Am. Chem. Soc. 1970, 92, 6415–6418. [Google Scholar] [CrossRef]
- Mukerjee, P.; Ghosh, A.K. Thermodynamic aspects of the self-association and hydrophobic bonding of methylene blue. Model system for stacking interactions. J. Am. Chem. Soc. 1970, 92, 6419–6424. [Google Scholar] [CrossRef]
- Allingham, M.M.; Cullen, J.M.; Giles, C.H.; Jain, S.K.; Woods, J.S. Adsorption at inorganic surfaces. II. Adsorption of dyes and related compounds by silica. J. Appl. Chem. 1958, 8, 108–116. [Google Scholar] [CrossRef]
- Bujdák, J.; Komadel, P. Interaction of methylene blue with reduced charge montmorillonite. J. Phys. Chem. 1997, 101, 9065–9068. [Google Scholar] [CrossRef]
- Tunç, S.; Duman, O.; Uysal, R. Electrokinetic and rheological behaviors of sepiolite suspensions in the presence of poly(acrylic acid sodium salt)s, polyacrylamides, and poly(ethylene glycol)s of different molecular weights. J. Appl. Polymer Sci. 2008, 109, 1850–1860. [Google Scholar] [CrossRef]
- Tunç, S.; Duman, O. Effects of Electrolytes on the Electrokinetic Properties of Pumice Suspensions. J. Dispers. Sci. Technol. 2009, 30, 548–555. [Google Scholar] [CrossRef]
- Awala, H.A.; El Jamal, M.M. Equilibrium and kinetics study of adsorption of some dyes onto feldspar. J. Univ. Chem. Tech. Metall. 2011, 46, 45–52. [Google Scholar]
- Murakami, K. Thermodynamic and kinetic aspects of self-association of dyes in aqueous solution. Dye. Pigment. 2002, 53, 31–43. [Google Scholar] [CrossRef]
- Chirkst, D.E.; Krasotkin, I.S.; Cheremisina, O.V.; Streletskaya, M.I.; Ivanov, M.V. Determination of the Surface Area of Minerals by Sorption of Methylene Blue and Thermal Desorption of Argon. Russ. J. Appl. Chem. 2003, 76, 663–665. [Google Scholar] [CrossRef]
- Ayranci, E.; Duman, O. In-Situ UV-Visible Spectroscopic Study on the Adsorption of some Dyes onto Activated Carbon Cloth. Sep. Sci. Technol. 2009, 44, 3735–3752. [Google Scholar] [CrossRef]
- Duman, O.; Tunç, S.; Polat, T.G. Adsorptive removal of triarylmethane dye (Basic Red 9) from aqueous solution by sepiolite as effective and low-cost adsorbent. Micropor. Mesopor. Mat. 2015, 210, 176–184. [Google Scholar] [CrossRef]
- Duman, O.; Tunç, S.; Polat, T.G. Determination of adsorptive properties of expanded vermiculite for the removal of C. I. Basic Red 9 from aqueous solution: Kinetic, isotherm and thermodynamic studies. Appl. Clay Sci. 2015, 109–110, 22–32. [Google Scholar] [CrossRef]
- Duman, O.; Tunç, S.; Polat, T.G.; Bozoğlan, B.K. Synthesis of magnetic oxidized multiwalled carbon nanotube-κ-carrageenan-Fe3O4 nanocomposite adsorbent and its application in cationic Methylene Blue dye adsorption. Carbohydr. Polym. 2016, 147, 79–88. [Google Scholar] [CrossRef] [PubMed]
- Duman, O.; Tunç, S.; Polat, T.G.; Bozoğlan, B.K. Removal of triphenilmethane and reactive azo dyes from aqueous solution by nanotube-κ-carrageenan-Fe3O4 nanocomposite. J. Alloys Compd. 2016, 687, 370–383. [Google Scholar] [CrossRef]
- Király, E. Magmatic Evolution of the Mórágy Granite (SE Transdanubia, Hungary). Ann. Rep. Geol. Inst. Hung. 2009, 41–55. [Google Scholar]
- Yazdani, M.; Mahmoodi, N.M.; Arami, M.; Bahrami, H. Isotherm, kinetic and thermodynamic of cationic dye removal from binary system by feldspar. Sep. Sci. Technol. 2012, 47, 1660–1672. [Google Scholar] [CrossRef]
- Friedman, G.M.; Johnson, K.G. Exercises in Sedimentology; Wiley: New York, NY, USA, 1982; pp. 1–222. [Google Scholar]
- Deer, W.A.; Howie, R.A.; Zussman, J. An Introduction to the Rock-Forming Minerals, 2nd ed.; Pearson Education: Harlow, UK, 1992; pp. 1–696. [Google Scholar]
- Tsai, W.-T.; Hsu, H.C.; Su, T.Y.; Lin, K.Y.; Lin, C.M.; Dai, T.H. The adsorption of cationic dye from aqueous solution onto acid-activated andesite. J. Hazard. Mater. 2007, 147, 1056–1062. [Google Scholar] [CrossRef] [PubMed]
- Karagozoglu, B.; Tasdemir, M.; Demirbas, E.; Kobya, M. The adsorption of basic dye (Astrazon Blue FGRL) from aqueous solutions onto sepiolite, fly ash and apricot shell activated carbon: Kinetic and equilibrium studies. J. Hazard. Mater. 2007, 147, 297–306. [Google Scholar] [CrossRef] [PubMed]
- Gupta, V.K.; Mittal, A.; Krishnan, L.; Mittal, J. Adsorption treatment and recovery of the hazardous dye, Brilliant Blue FCF, over bottom ash and de-oiled soya. J. Colloid Interface Sci. 2006, 293, 16–26. [Google Scholar] [CrossRef] [PubMed]
- Almeida, C.A.P.; Zanela, T.M.P.; Machado, C.; Flores, J.A.A.; Scheibe, L.F.; Hankins, N.P.; Debacher, N.A. Removal of methylene blue by adsorption on aluminosilicate waste: Equilibrium, kinetic and thermodynamic parameters. Water Sci. Technol. 2016, 74, 2437–2445. [Google Scholar] [CrossRef]
- Limousin, G.; Gaudet, J.-P.; Charlet, L.; Szenknect, S.; Barthès, V.; Krimissa, M. Sorption isotherms: A review on physical bases, modeling and measurement. Appl. Geochem. 2007, 22, 249–275. [Google Scholar] [CrossRef]
- Tran, H.N.; You, S.-J.; Hosseini-Bandegharaei, A.; Chao, H.-P. Mistakes and inconsistencies regarding adsorption of contaminants from aqueous solutions: A critical review. Water Res. 2017, 120, 88–116. [Google Scholar] [CrossRef] [PubMed]
- Dorkó, Z.; Szakolczai, A.; Tóth, B.; Horvai, G. Relationship between Commonly Used Adsorption Isotherm Equations Impedes Isotherm Selection. Period. Polytech. Chem. Eng. 2017, 61, 10–14. [Google Scholar] [CrossRef]
- Harrison, F.; Katti, S. Hazards of linearization of Langmuir’s model. Chemom. Intell. Lab. Syst. 1990, 9, 249–255. [Google Scholar] [CrossRef]
- Atun, G.; Tunçay, M.; Hisarli, G.; Talman, R.Y.; Hoşgömez, H. Adsorption equilibria between dye and surfactant in single and binary systems onto geological materials. Appl. Clay Sci. 2009, 15, 254–261. [Google Scholar] [CrossRef]
- Duman, O.; Özcan, C.; Polat, T.G.; Tunç, S. Carbon nanotube-based magnetic and non-magnetic adsorbents for the efficiency removal of diquat dibromide herbicide from water OMWCNT, OMWCNT-Fe3O4 and OMWCNT-κ-carrageenan-Fe3O4 nanocomposites. Environ. Pollut. 2019, 244, 723–732. [Google Scholar] [CrossRef]
- Mouzdahir, Y.E.; Elmchaouri, A.; Mahboub, R.; Gil, A.; Korili, S.A. Equilibrium modeling for the adsorption of methylene blue from aqueous solutions on activated clay minerals. Desalination 2010, 250, 335–338. [Google Scholar] [CrossRef]
- He, D.; Huang, H.; Xu, W.; Qin, F.; Liu, S. Adsorption properties and mechanism of purified palygorskite on methylene blue. Arab. J. Geosci. 2018, 11, 658–671. [Google Scholar] [CrossRef]
- Basaleh, A.A.; Al-Malack, M.H.; Saleh, T.A. Methylene blue removal using polyamide–vermiculite nanocomposites: Kinetics, equilibrium and thermodynamic study. J. Environ. Chem. Eng. 2019, 7, 103107–103118. [Google Scholar] [CrossRef]
- Youcef, L.D.; Belaroui, L.S.; López-Galindo, A. Adsorption of a cationic methylene blue dye on an Algerian palygorskite. Appl. Clay Sci. 2019, 179, 105145–105155. [Google Scholar] [CrossRef]
- Mouni, L.; Belkhiri, L.; Bollinger, J.-C.; Bouzaza, A.; Assadi, A.; Tirri, A.; Dahmoune, F.; Madani, K.; Remini, H. Removal of Methylene Blue from aqueous solutions by adsorption on Kaolin: Kinetic and equilibrium studies. Appl. Clay Sci. 2018, 153, 38–45. [Google Scholar] [CrossRef]
- Patra, D.; Gopalan, B.; Ganesan, R. Direct solid-state synthesis of maghemite as a magnetically recoverable adsorbent for the abatement of methylene blue. J. Environ. Chem. Eng. 2019, 7, 103384–103398. [Google Scholar] [CrossRef]
- Szép, R.; Keresztes, R.; Korodi, A.; Tonk, S. Dew Point-indirect Particulate Matter Pollution Indicator in the Ciuc Basin–Harghita, Romania. Rev. Chim. 2016, 67, 1914–1921. [Google Scholar]
- Anghel, A.M.; Marinescu, F.; Ilie, M.; Ghiță, G.; Ionescu, P.; Mărcuș, I.; Tociu, C.; Moncea, A.; Mîțiu, M.; Popescu, I.; et al. Advanced Processing of Environmental Data for Establishing the Ecological Status of the Lower Danube Water in Terms of Nutrients. J. Environ. Prot. Ecol. 2017, 18, 853–861. [Google Scholar]
Figure 1.
X-ray diffraction (XRD) patterns of microcline particles smaller than 71 μm (orange). XRD patterns of microcline particles in the size range from 71 μm up to 315 μm (blue). XRD patterns of reference microcline mineral, RRUFF ID: R040154 (red).
Figure 1.
X-ray diffraction (XRD) patterns of microcline particles smaller than 71 μm (orange). XRD patterns of microcline particles in the size range from 71 μm up to 315 μm (blue). XRD patterns of reference microcline mineral, RRUFF ID: R040154 (red).
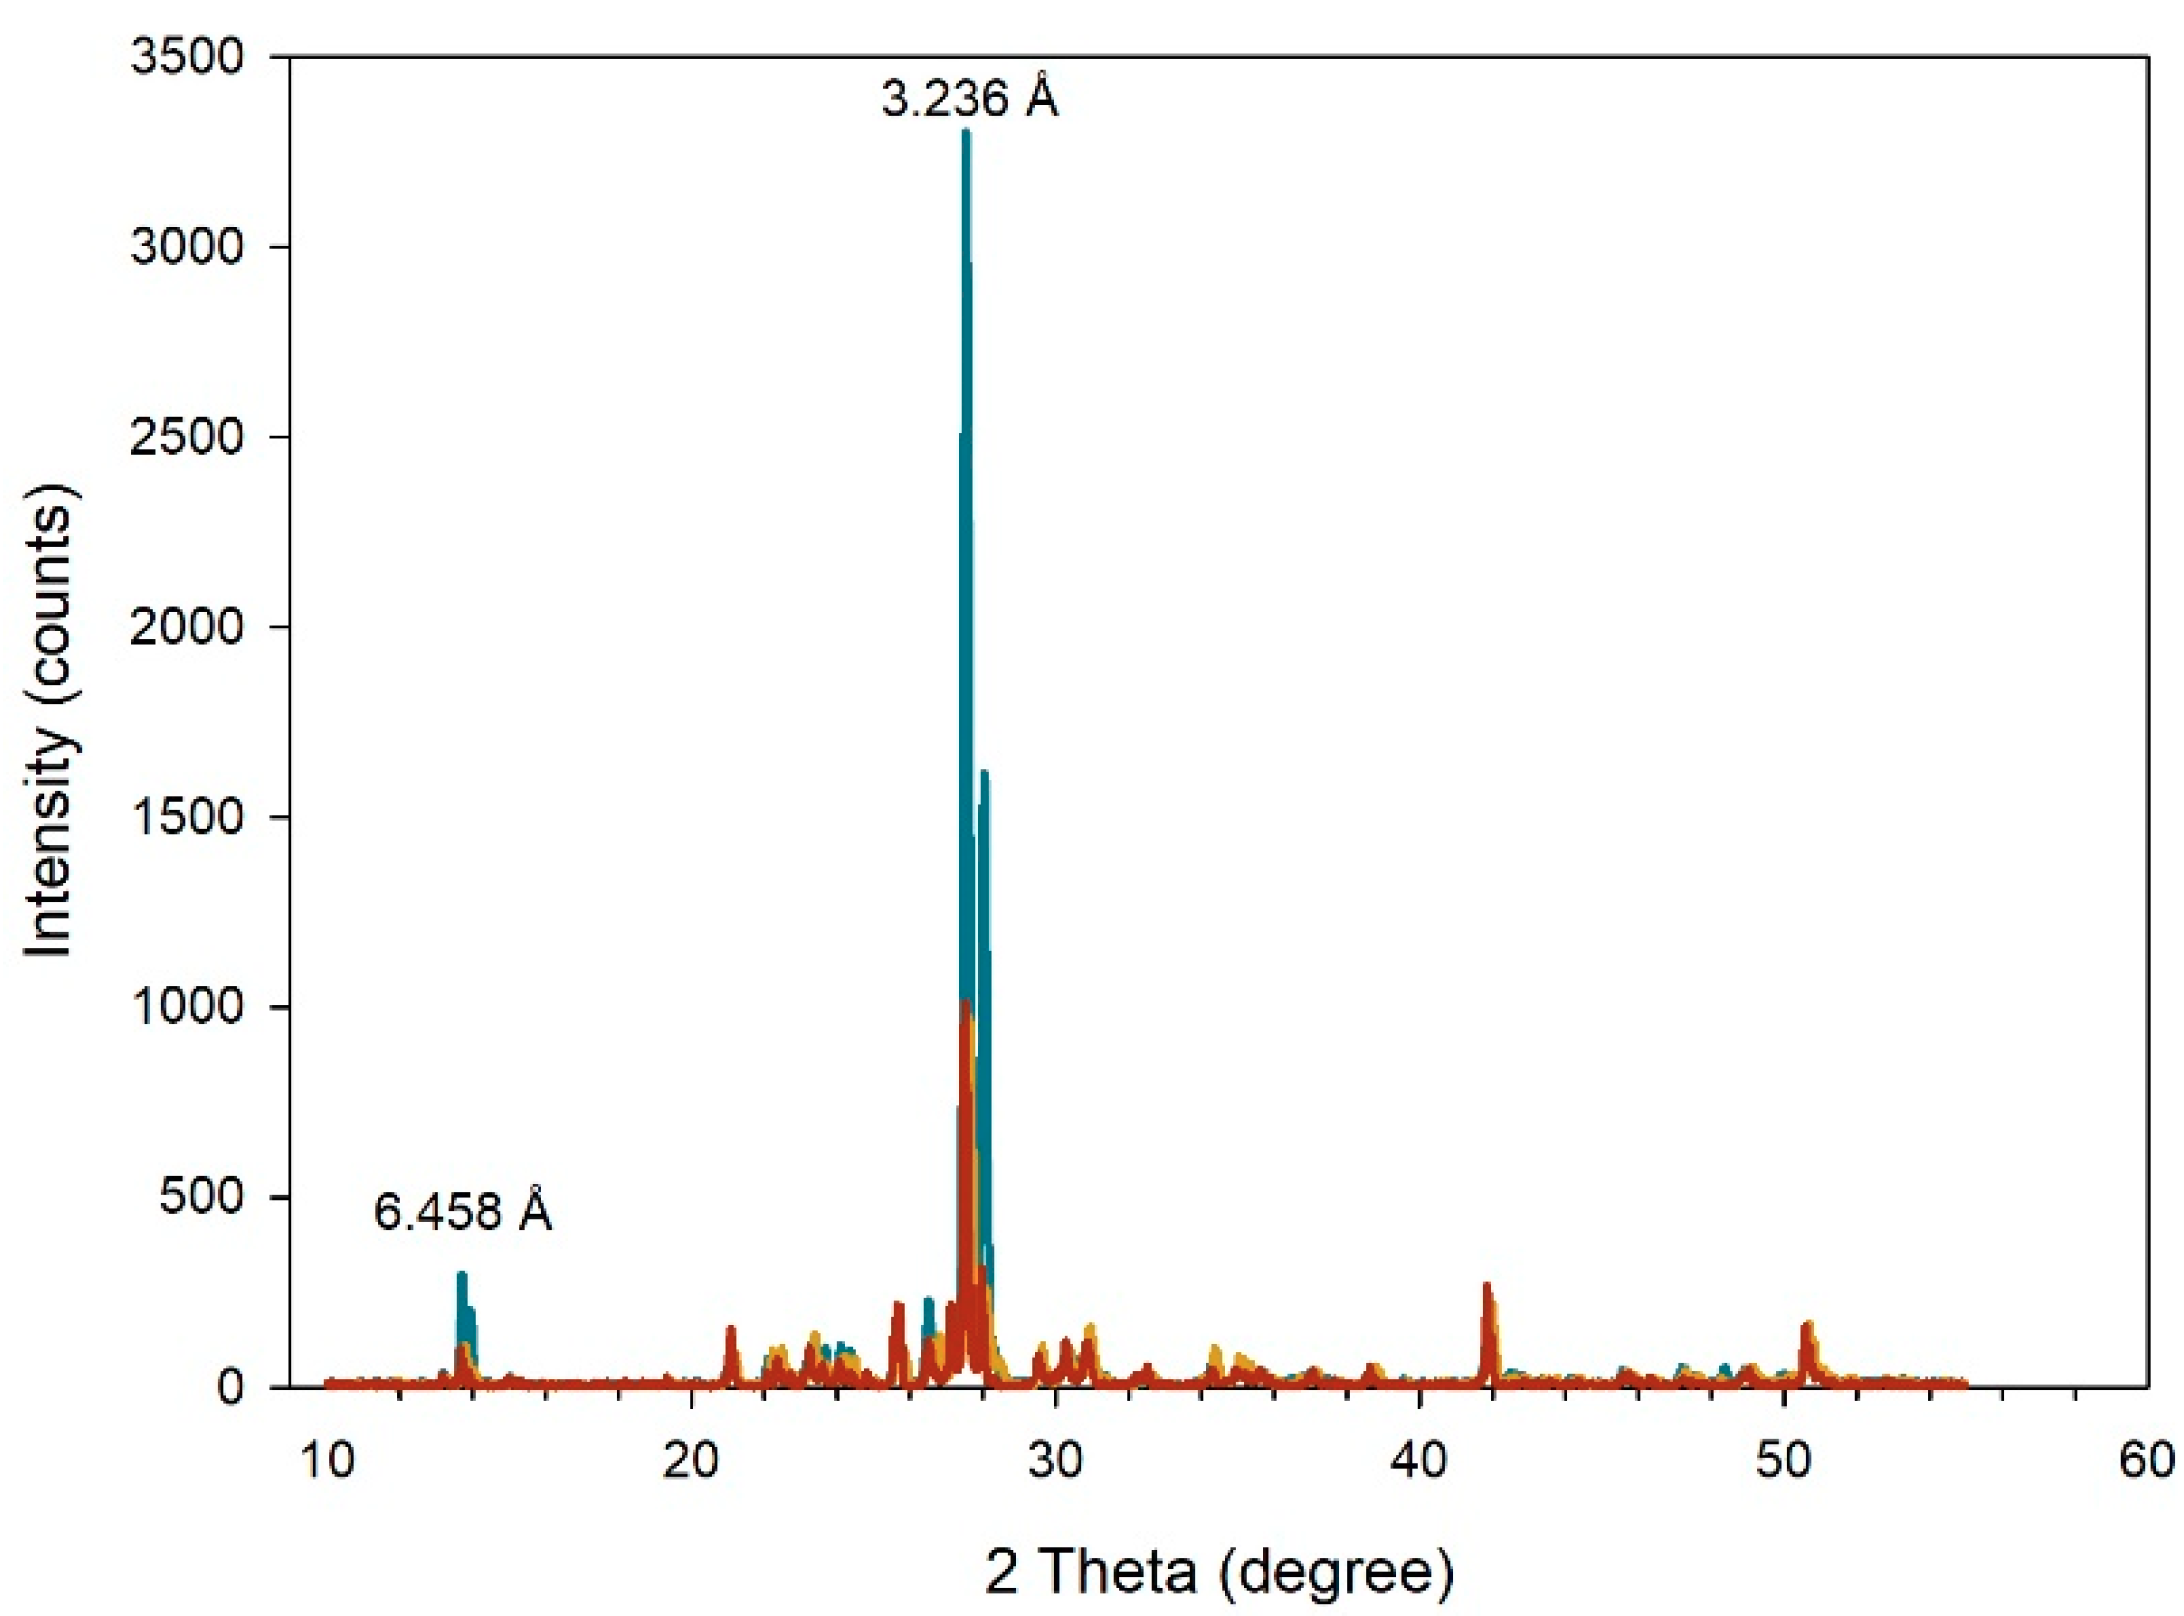
Figure 2.
(A) The measured particle size distribution curve by laser diffraction in an aqueous suspension containing smaller than 71 μm of microcline particles (d < 71 μm). (B) The measured particle size distribution curve by laser diffraction in an aqueous suspension containing microcline particles in the range from 71 μm up to 315 μm (71 μm < d < 3 15 μm).
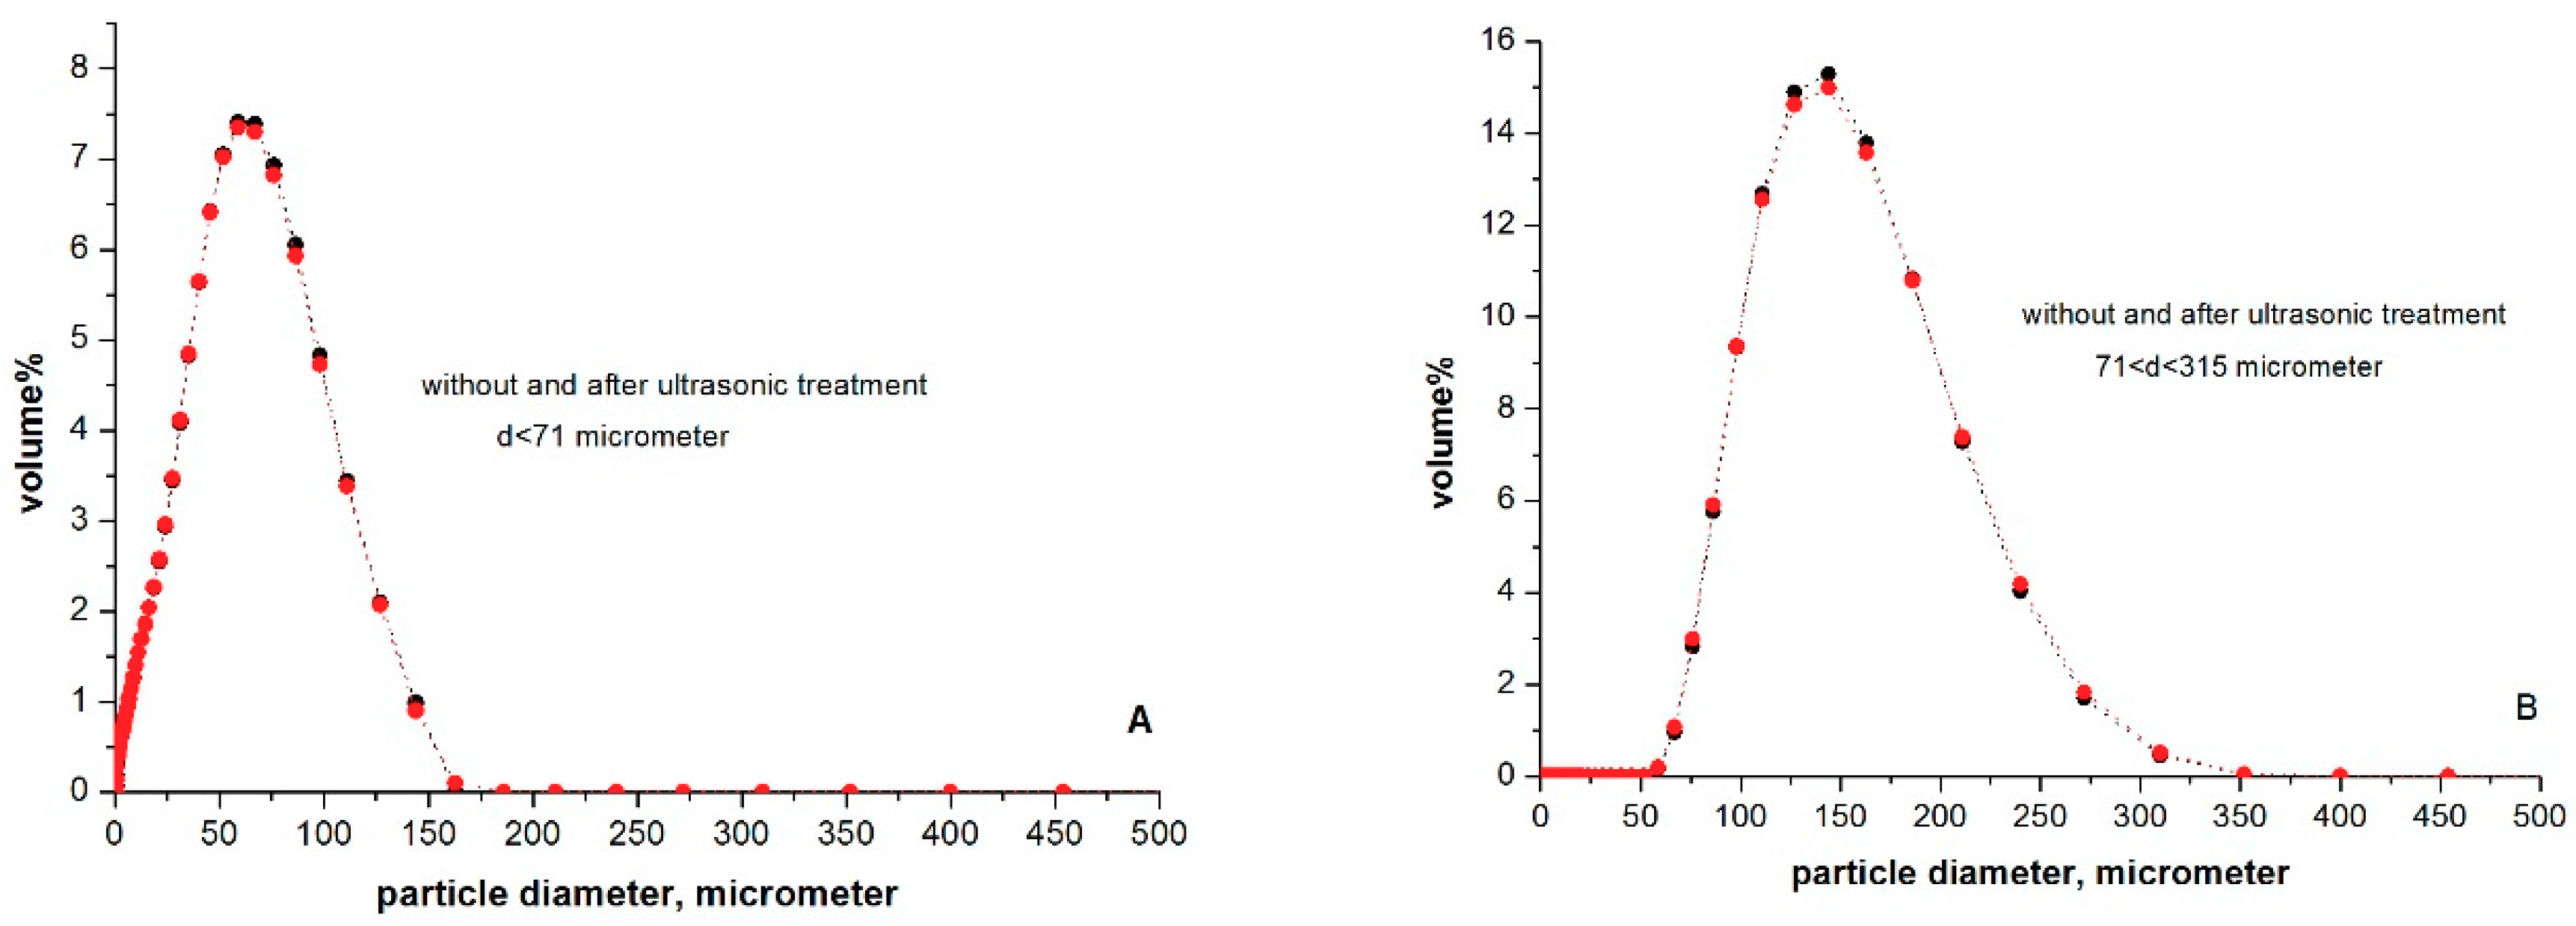
Figure 3.
Effect of adsorbent dosage on methylene blue adsorption. (A) The dye adsorption capacity on microcline particles and (B) dye adsorption in percent are presented in the function of microcline mass-containing particles smaller than 71 μm (d < 71 μm) and particles in the range from 71 μm up to 315 μm (71 μm < d <315 μm) in aqueous suspensions. (10 mg L−1 dye concentration, at room temperature, in 10 mL of suspension).

Figure 4.
(A) The non-linearly fitted by using Langmuir equation and experimental adsorption isotherms of methylene blue on microcline containing particles smaller than 71 μm (d < 71 μm) and in the range from 71 μm up to 315 μm (71 μm < d <315 μm) in aqueous suspensions in the initial dye concentration range of 10–200 mg L−1 at room temperature. (B) The adsorption isotherm of dye and the adsorption in percent determined in the initial dye concentration range of 10–105 mg L−1 at the temperature of 60–65 °C is presented against dye equilibrium concentration.
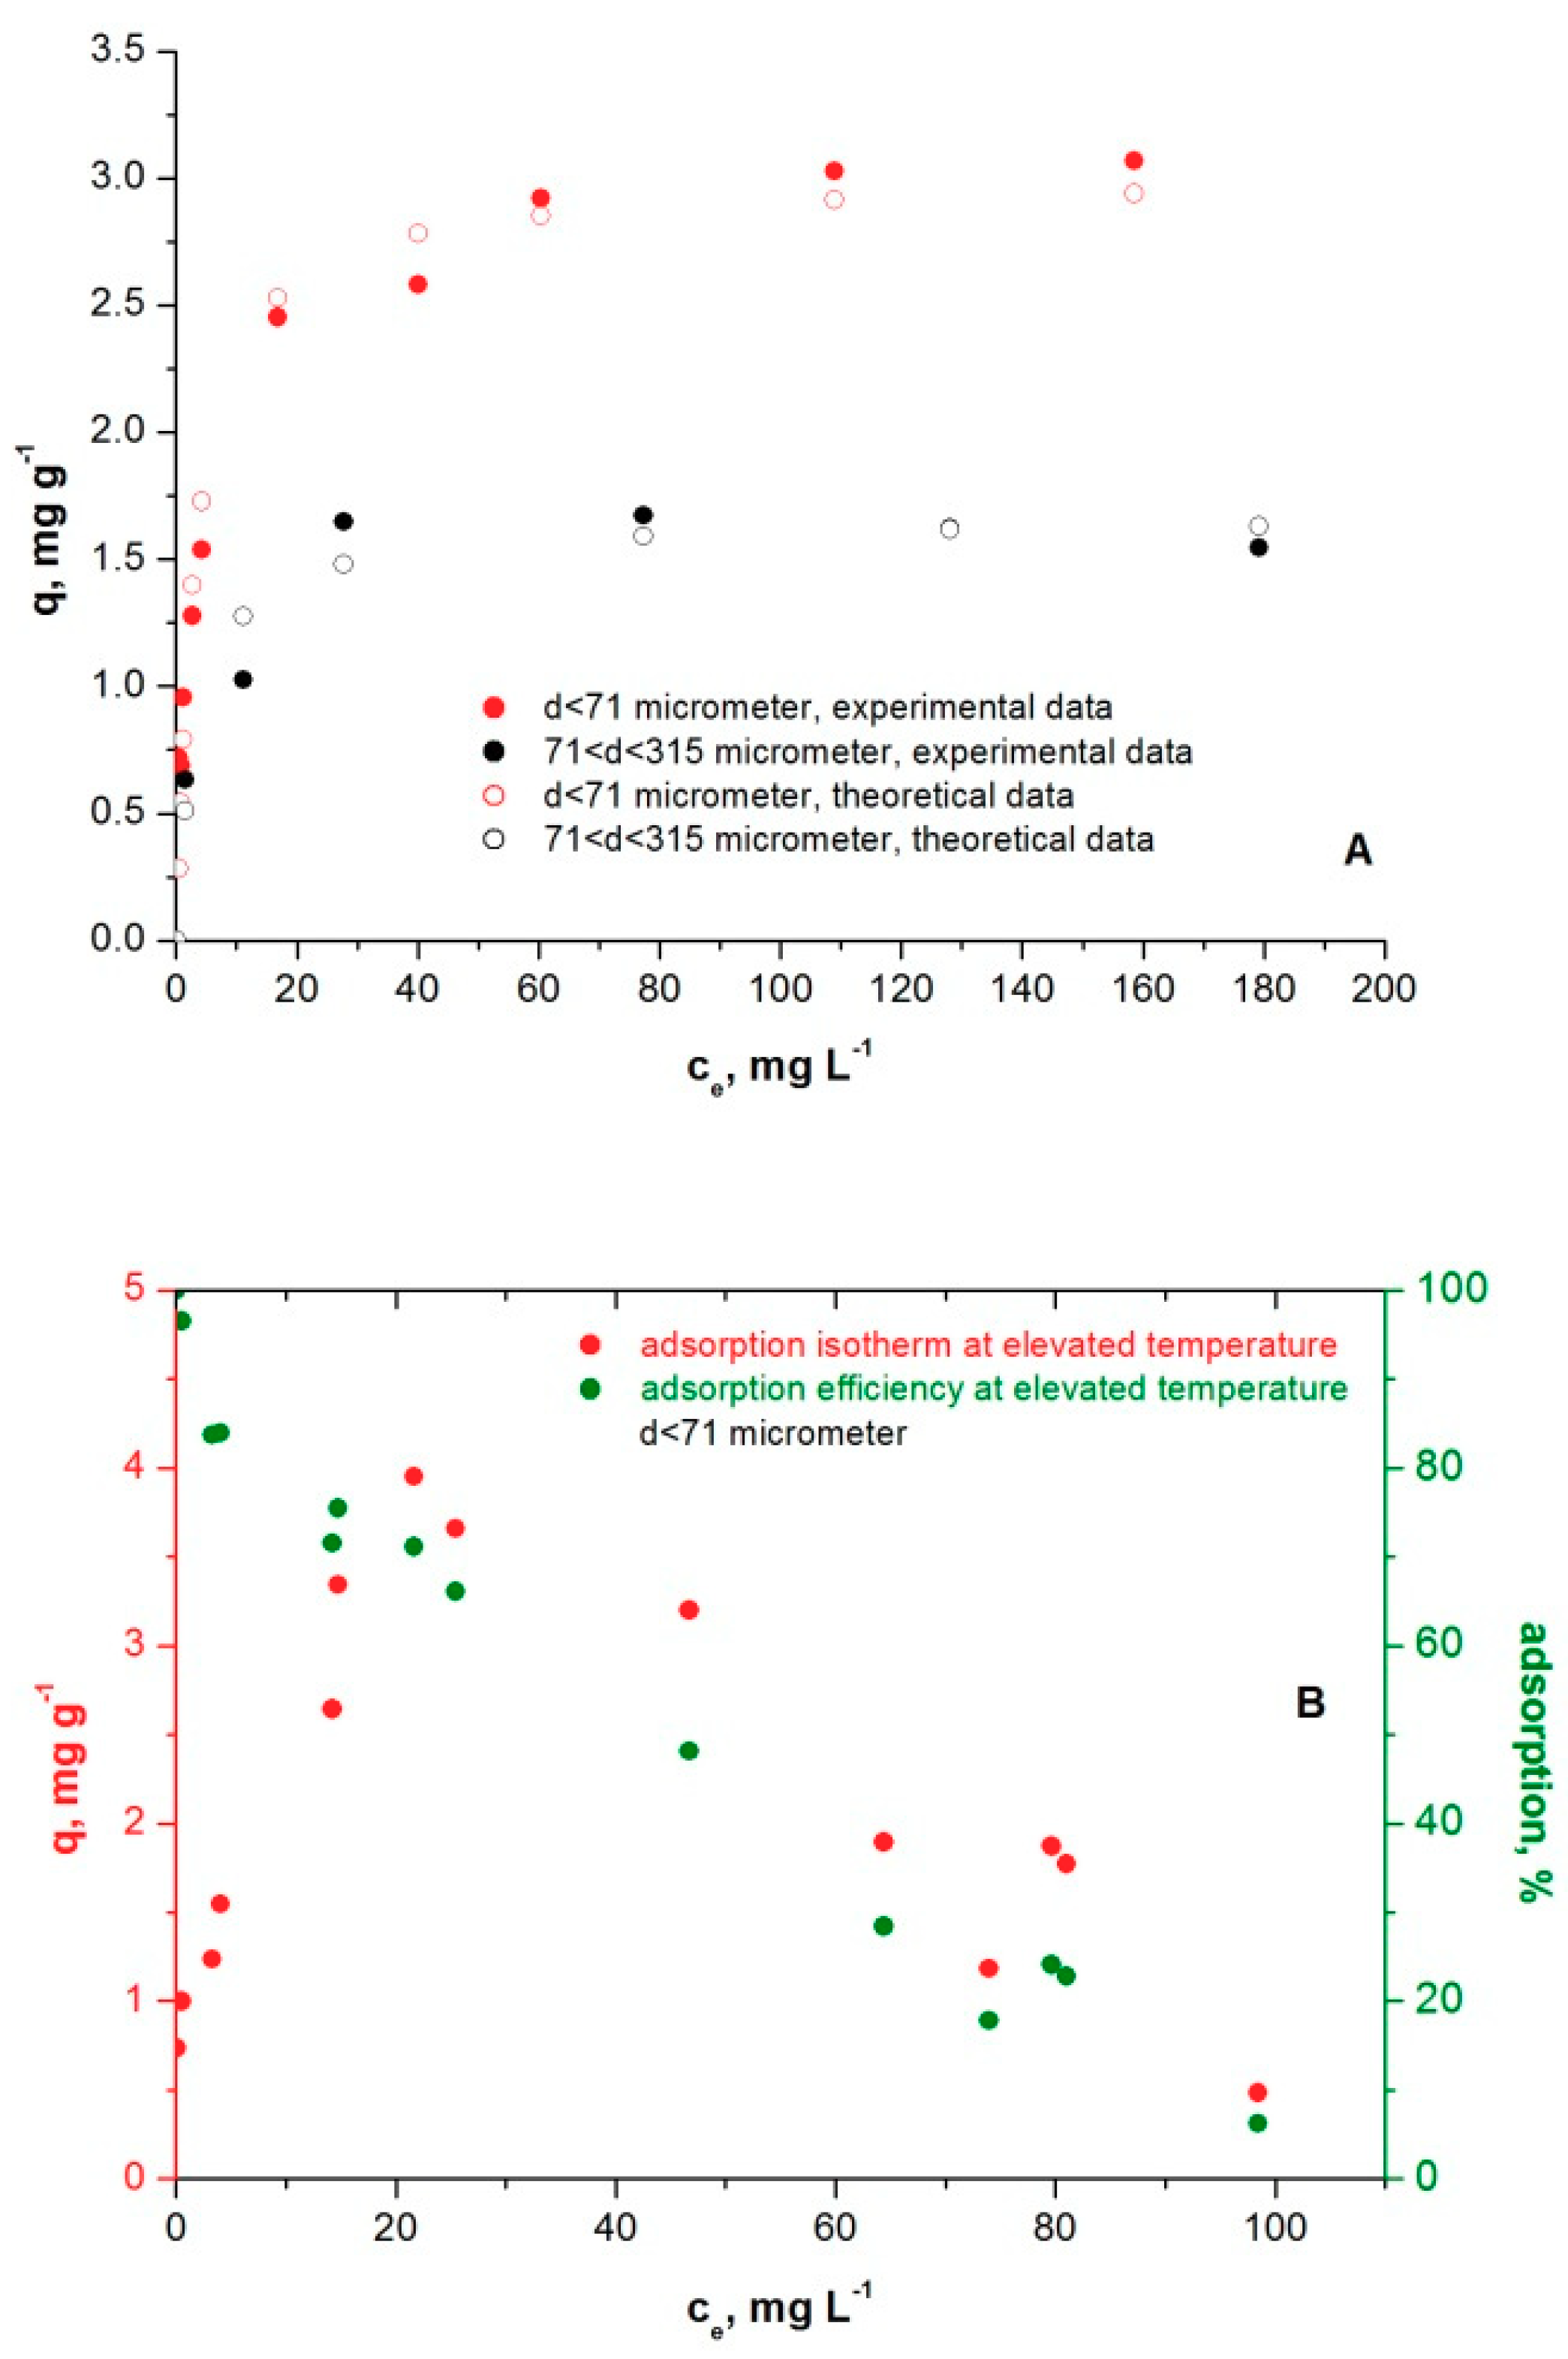
Figure 5.
(A) Microcline particles smaller than 71 μm, (B) Microcline particles in the range from 71 μm up to 315 μm, (C) Chemical composition of microcline particles determined by EDS.
Figure 5.
(A) Microcline particles smaller than 71 μm, (B) Microcline particles in the range from 71 μm up to 315 μm, (C) Chemical composition of microcline particles determined by EDS.
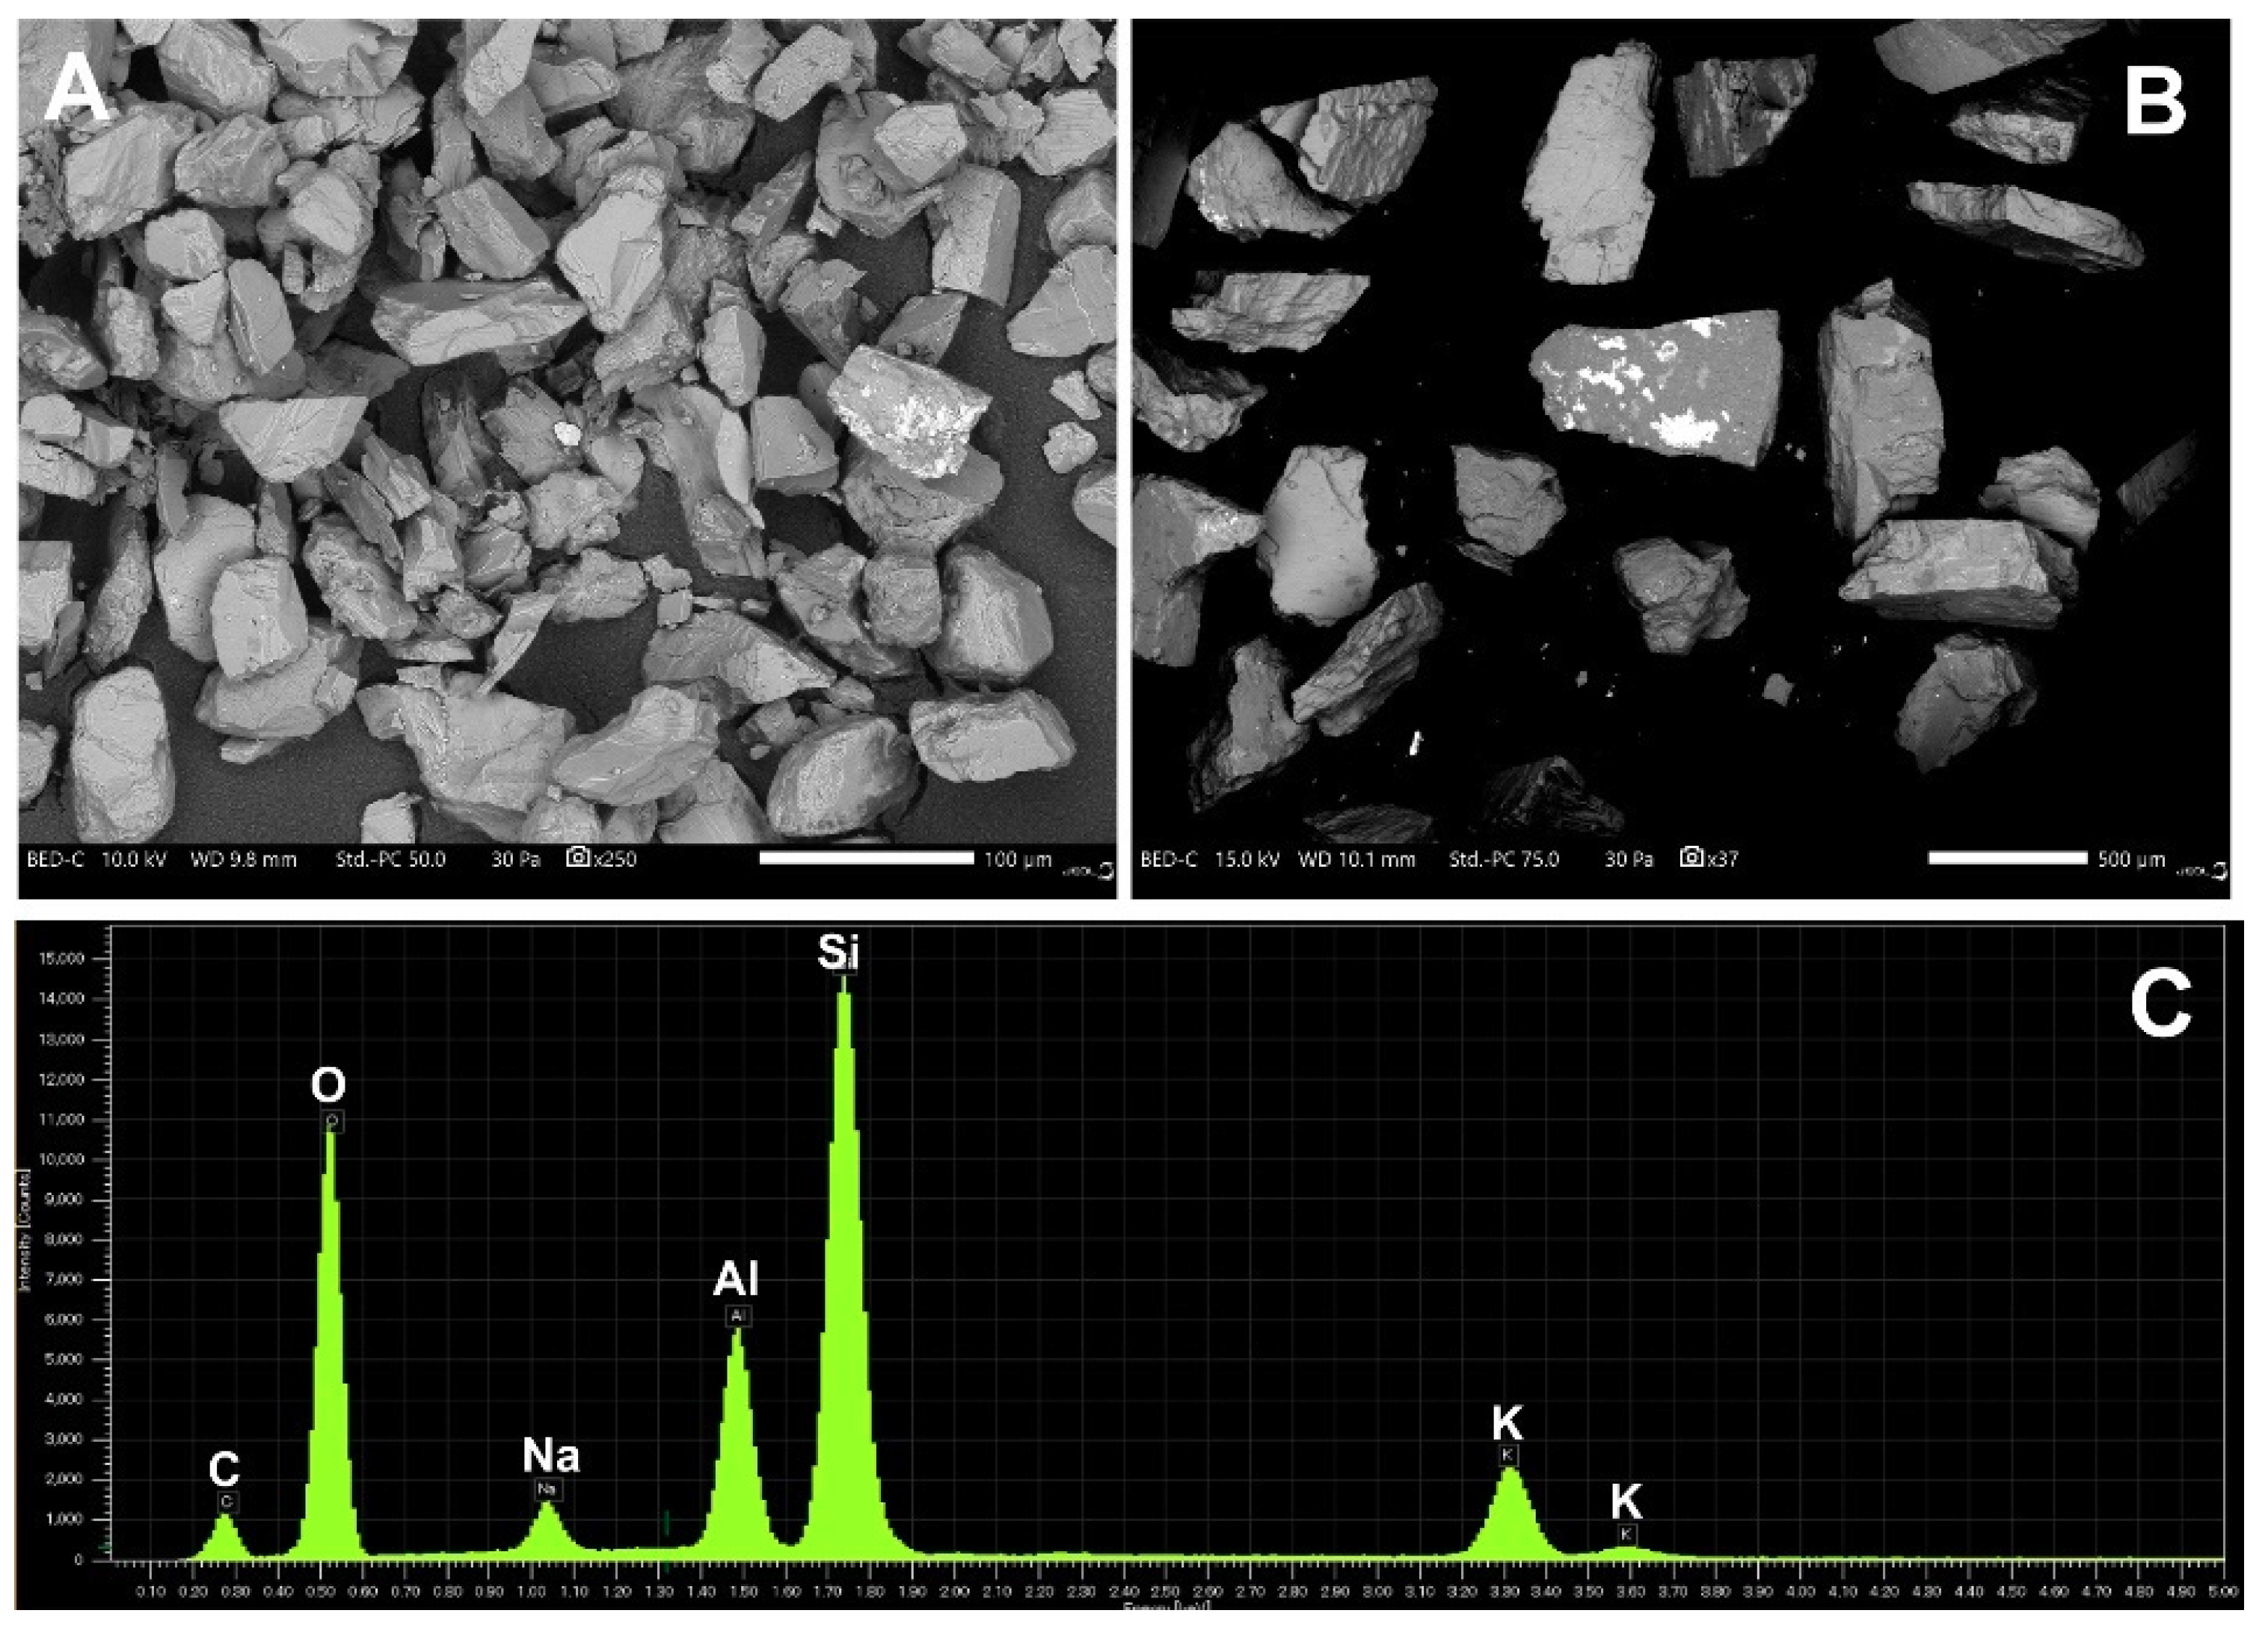
Figure 6.
(A) Disk-shaped calcite crystals on the microcline surface, (B) Chemical composition of “A” surface area determined by EDS, (C) Element mapping of the “A” surface area.
Figure 6.
(A) Disk-shaped calcite crystals on the microcline surface, (B) Chemical composition of “A” surface area determined by EDS, (C) Element mapping of the “A” surface area.
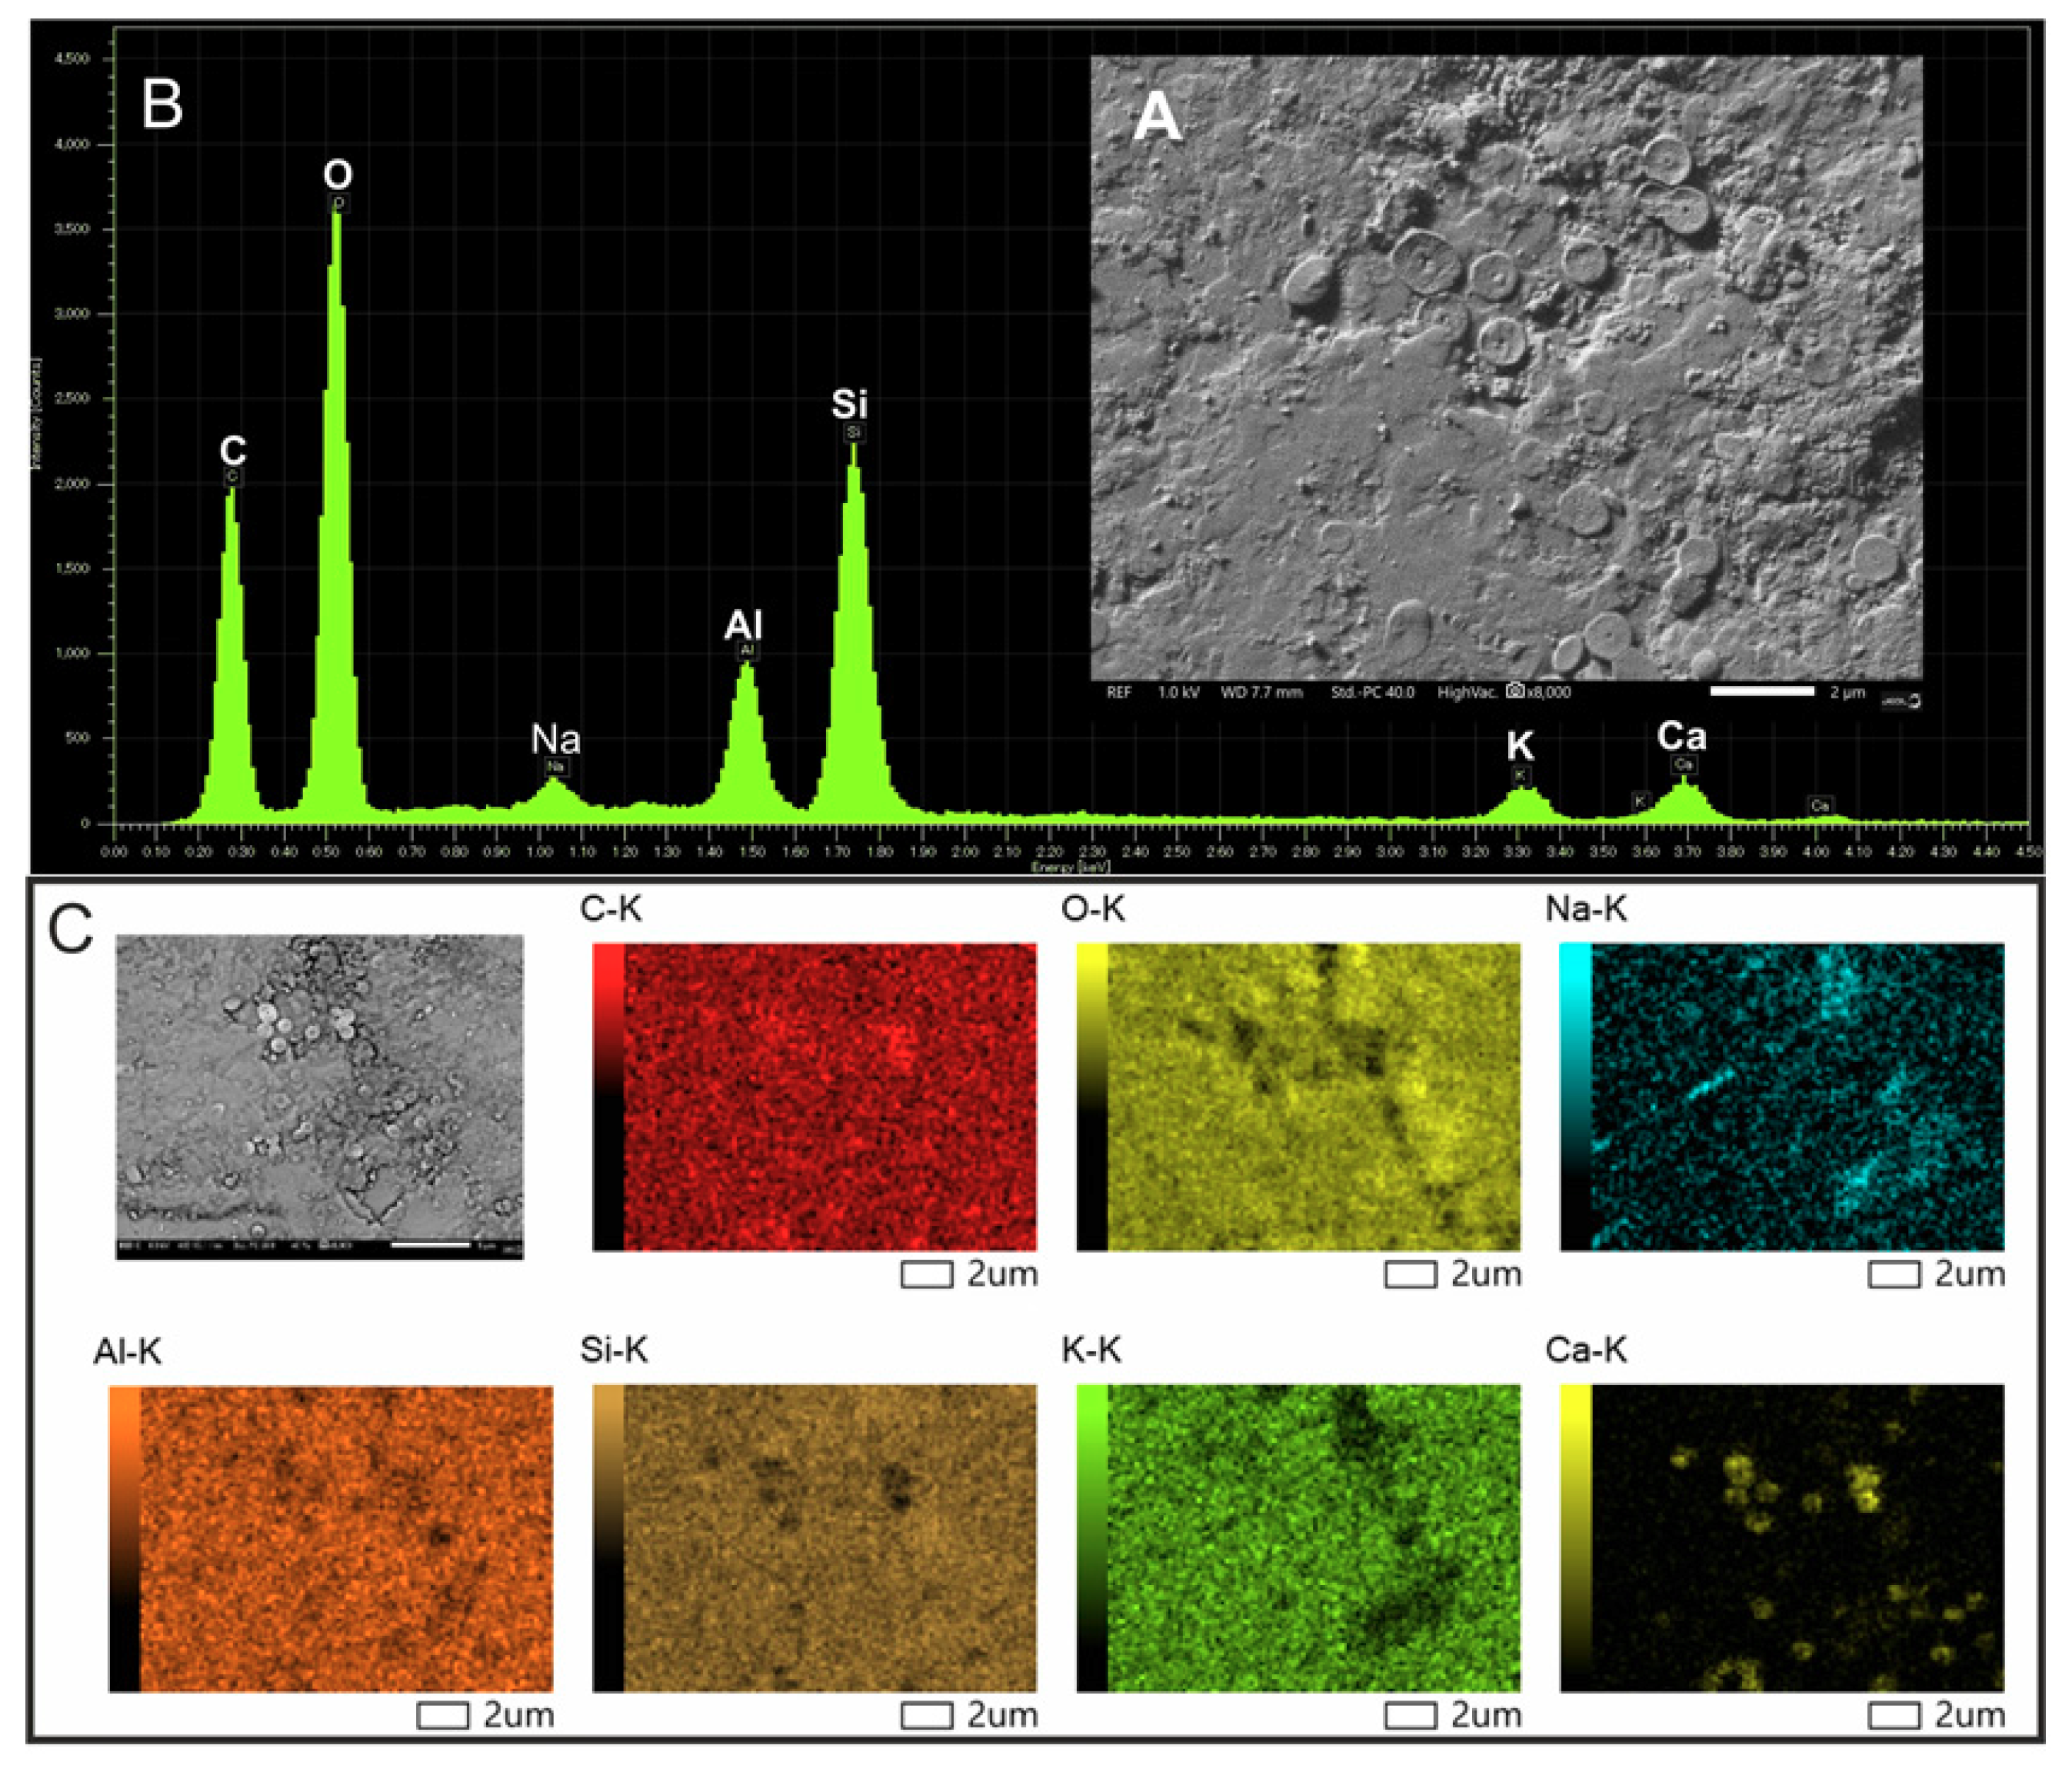
Figure 7.
Calcite crystals on the microcline surface.


Table 1.
Statistical parameters of the studied microcline particles (The mathematical “method of moments” was calculated following Friedman and Johnson’s [26] functions).
Table 1.
Statistical parameters of the studied microcline particles (The mathematical “method of moments” was calculated following Friedman and Johnson’s [26] functions).
| Methods: | Statistics | d < 71 μm | 71 < d < 315 μm |
|---|---|---|---|
| Method of Moments Arithmetic (µm) | Mean | 51.870 | 155.7 |
| Sorting | 35.540 | 49.220 | |
| Skewness (Ska) | 0.559 | 0.769 | |
| Kurtosis (Ka) | 2.694 | 3.468 | |
| Method of Moments Geometric (µm) | Mean | 34.950 | 148.100 |
| Sorting | 3.003 | 1.366 | |
| Skewness (Skg) | −1.360 | 0.013 | |
| Kurtosis (Kg) | 4.537 | 2.581 |
Table 2.
The Langmuir isotherm constants of methylene blue on microcline mass containing particles smaller than 71 μm (d < 71 μm) and in the range from 71 μm up to 315 μm (71 μm < d < 315 μm) in aqueous suspensions in the initial dye concentration range of 10−200 mg L−1. The temperature was 22.5 °C, the microcline mass concentration was 13.5 g L−1.
| Microcline Particle Size Fraction | Q0, mg g−1 | b, L mg−1 | R2 |
|---|---|---|---|
| d < 71 µm | 3.00 | 0.32 | 0.97 |
| 71< d <315 µm | 1.66 | 0.30 | 0.95 |
© 2019 by the authors. Licensee MDPI, Basel, Switzerland. This article is an open access article distributed under the terms and conditions of the Creative Commons Attribution (CC BY) license (http://creativecommons.org/licenses/by/4.0/).
Share and Cite
MDPI and ACS Style
Pernyeszi, T.; Farkas, R.; Kovács, J. Methylene Blue Adsorption Study on Microcline Particles in the Function of Particle Size Range and Temperature. Minerals 2019, 9, 555. https://doi.org/10.3390/min9090555
AMA Style
Pernyeszi T, Farkas R, Kovács J. Methylene Blue Adsorption Study on Microcline Particles in the Function of Particle Size Range and Temperature. Minerals. 2019; 9(9):555. https://doi.org/10.3390/min9090555
Chicago/Turabian StylePernyeszi, Tímea, Roland Farkas, and János Kovács. 2019. "Methylene Blue Adsorption Study on Microcline Particles in the Function of Particle Size Range and Temperature" Minerals 9, no. 9: 555. https://doi.org/10.3390/min9090555
Note that from the first issue of 2016, this journal uses article numbers instead of page numbers. See further details here.