Role of Collectors and Depressants in Mineral Flotation: A Theoretical Analysis Based on Extended DLVO Theory

1
School of Chemical Engineering and Technology, China University of Mining and Technology, Xuzhou 221116, China
2
Max Planck Institute for Polymer Research, Ackermannweg 10, 55128 Mainz, Germany
3
Chinese National Engineering Research Center of Coal Preparation and Purification, China University of Mining and Technology, Xuzhou 221116, China
4
Mineral Processing Engineering Department, Istanbul Technical University, 34469 Maslak, Istanbul, Turkey
*
Authors to whom correspondence should be addressed.
Minerals 2017, 7(11), 223; https://doi.org/10.3390/min7110223
Submission received: 23 October 2017
/
Revised: 12 November 2017
/
Accepted: 13 November 2017
/
Published: 16 November 2017
Abstract
:A theoretical analysis was conducted to study the role of collectors and depressants in flotation, based on the extended Derjaguin–Landau–Verwey–Overbeek (DLVO) theory, where the hydrophobic force is considered. The collector-coated hydrophilic particle and the depressant-coated hydrophobic particle are simplified to a sphere uniformly covered with respectively hydrophobic and hydrophilic nanometer-sized hemispherical asperities of identical radius. Results show that the role of a collector in bubble–particle attachment is to create an attractive hydrophobic force and thus overcome the repulsive van der Waals and electrostatic forces. Moreover, increasing the length of the hydrophobic part of the collector molecule is a more effective way to enhance flotation recovery, compared to increasing the collector concentration. For a depressant, however, its function mechanism is to create a strong electrostatic double-layer force, while the suppression of the hydrophobic force plays a secondary role in decreasing the bubble–particle attachment barrier. The depressant molecule length is also a dominant parameter in designing a powerful depressant.
1. Introduction
Flotation is a type of interfacial separation technique that is based on the difference in the surface hydrophobicity of different components [1,2]. In a traditional flotation cell, high-speed impeller agitation is required to keep the mineral particles in suspension. Air is introduced or sometimes forced into the cell near the impeller to form fine bubbles under the cutting effect of the impeller [3]. The rising air bubbles carry hydrophobic particles to form a froth layer, which is then conveyed to the launders, while the hydrophilic particles sink to the bottom of the cell to the reject [4,5]. Among all the factors that influence the flotation performance, bubble–particle attachment is the key for successful flotation [6,7].
In general, the difference between the surface hydrophobicity of the targeted particle and the undesirable gangue particle is not high enough to achieve selective attachment to the bubble surface. Thus, so-called collectors and depressants are used to regulate and control the water contact angle of mineral particles. Low-molecular-weight surfactants, i.e., collectors, such as xanthate salt-related sulfur-based ligands and nonpolar oils (diesel and kerosene), are usually used to render the valuable minerals hydrophobic, while high-molecular-weight polymers, called depressants, are sometimes used to render the undesired particles hydrophilic [8,9,10,11]. Recently, Yang et al. [12,13,14] proposed a new concept using hydrophobic polystyrene nanoparticles as the collector for the floatation of hydrophilic glass beads. The electrostatic double-layer force was responsible for the attachment of cationic nanoparticles to the glass surface. It was found that only a small coverage (5%) of nanoparticle collector yielded high flotation recovery. Currently, flotation researchers usually use water contact angle and induction time to explain the roles of collectors and depressants in bubble–particle interaction [15,16]. This approach has two drawbacks: (1) the measurement results are affected by surface heterogeneity, since collectors and depressants do not always adsorb on the real mineral surfaces in a uniform pattern; and (2) information on surface forces and film drainage between the bubble and particle cannot be obtained using contact angle and induction time measurements. For attachment, the surface forces play a major role by controlling the thinning and rupture of the thin liquid film between the bubble and the particle [6]. According to the Derjaguin–Landau–Verwey–Overbeek (DLVO) theory, bubble–particle interaction is controlled by two components [17,18], i.e., van der Waals dispersion force and electrostatic double-layer force. In most cases, both the van der Waals and double-layer forces between the bubble and solid particle are repulsive [19]. The wetting film between the bubble and the hydrophilic or hydrophobic particle should be in a stable state. Laskowski and Kitchener [20] first found that the water films present on methylated silica surfaces were unstable and the film ruptured spontaneously. Their experiment indicates that in addition to the traditional DLVO forces, an attractive force also acts between the bubbles and the hydrophobic solid particles. Three years later, Blake and Kitchener [21] experimentally measured the thickness of the water film when a small gas bubble was slowly advanced towards a polished silica plate with different hydrophobicity. They showed that the film rupture thickness on methylated silica ranged from 60 nm to 220 nm. In this case, the thin water film on the methylated silica surface was unstable, likely due to long-range attractive forces. The first direct evidence that the hydrophobic force between hydrophobic solid surfaces is stronger than van der Waals attraction was provided by Pashley and Israelachvili using the Surface Force Apparatus (SFA) [22], where a single exponential function gave the best fit with the obtained experimental data. Since their report, hydrophobic force has received growing attention, and numerous experimental techniques such as atomic force microscopy (AFM), colloid probe AFM, and thin film balance have been developed to investigate this topic [6,7,8,9]. To date, an attractive hydrophobic force has been widely accepted as the reason for bubble–particle attachment, although its origin remains under debate [23,24]. So far, the effects of collectors and depressants on the surface forces between the bubble and particle are less understood and require a further study.
Pan and Yoon [9] used a modified thin film pressure balance technique to measure the film drainage kinetics between a bubble and a gold surface before and after xanthate hydrophobization. The surface force information was obtained from Reynolds lubrication theory under a no-slip boundary condition. It was found that the role of the xanthate collector is to introduce a negative disjoining pressure to overcome the repulsive disjoining pressure in the thin liquid film. By contrast, Xie et al. [11] used atomic force microscopy (AFM) bubble probe technique to directly measure the force between an air bubble and a molybdenite surface before and after guar gum (depressant) adsorption. The hydrophobic force between the bubble and molybdenite decreased as the guar gum concentration increased, which was consistent with the contact angle and flotation results. However, it should be noted that the dimension of the collector or depressant was not taken into consideration during surface force calculation in the above reports; i.e., the surface was regarded as being heterogeneous. The extended molecular length of the collector or depressant is usually in the range of nanometer scale. The formation of semi-micelles or polymer aggregates further increases the height of the collector or depressor domains on mineral surfaces. These nanometer-sized asperities greatly affect the surface forces [25]. From this point of view, the role of the collector or depressant molecule length in bubble–particle interaction needs to be identified.
In this work, a theoretical analysis was conducted to reveal the role of collectors and depressants in flotation based on an extended DLVO theory. The collector-coated hydrophilic particle and the depressant-coated hydrophobic particle in a real flotation system were simplified to a sphere uniformly covered with respectively hydrophobic and hydrophilic nanometer sized hemispherical asperities of identical radius. Then, the effects of asperity radius and distribution density (the number per area) on the potential between the bubble and particle were evaluated. The outcome of the present study provides a fundamental understanding of the effect of collectors and depressants on the surface force in flotation science.
2. Theoretical Model
The theoretical model used in this work was derived based on the model proposed by Suresh and Walz [26,27], who considered the effect of roughness on the interaction energy between a rough sphere and a flat plate. The van der Waals potential was calculated using a pairwise additivity approach, while the electrostatic double-layer potential was assumed equal to the sum of the asperity-flat plate and sphere-flat plate potentials. Since the electrostatic double-layer is a kind of interface interaction, the molecules in the macroscopic bulk do not need to be considered. Recently, Drelich and Bowen [25] added a hydrophobic interaction component into the total energy to explore the effect of surface roughness on the potential between a hydrophobic sphere and a hydrophobic flat surface. Here, we further considered two new cases: a hydrophilic sphere covered with hydrophobic nanometer-sized hemispherical asperities and a hydrophobic sphere covered with hydrophilic asperities.
Since the typical size range of mineral particles is in micrometer scale and that of the bubble is in millimeter scale in flotation, bubble–particle interaction can be regarded as a particle interacting with a flat bubble surface. Further, the collector-coated hydrophilic particle and the depressant-coated hydrophobic particle in a real flotation system are simplified to a sphere covered with respectively hydrophobic and hydrophilic nanometer sized hemispherical asperities of identical radius, as shown in Figure 1. Here, the two important parameters are: the radius of hemispherical asperity, r, and the number distribution density of asperity (i.e., the number of asperity in per unit area), n. Then, the surface coverage fraction, , of the hemispherical asperities per unit area can be described as:
A silica sphere was selected as the particle, based on the available parameters in literature for calculating the total potential energy. It should also be noted that we assumed the asperities coated on the silica sphere to be composed of silica for simplification. Therefore, the total van der Waals energy between the hemispherical-asperity-coated silica sphere and air bubble surface is given as [26]:
where A is the Hamaker constant for the silica sphere and the bubble interacting across water. The retardation effect is not taken into consideration in Equation (2). The value of was reported to be −1.2 × 10⁻²⁰ J for a bubble–silica system [28] and R was chosen as 200 μm in this work.
For electrostatic interaction, a linear approximation of the Poisson–Boltzmann equation was used, and the hemispherical-asperity–bubble-plane interaction was approximated as a sphere interacting with a bubble plane [26]. Thus, the double-layer potential energy per unit area, , between the hemispherical-asperity-coated silica sphere and air bubble surface can be expressed as:
where and are the double-layer potential energy per unit area between the silica sphere and the bubble, and the double-layer potential energy between asperity and the bubble, respectively.
Using Derjaguin approximation, the total double-layer energy, , between the hemispherical-asperity-coated silica sphere and air bubble surface becomes [26]:
where ε and ε0 are the dielectric constants of water and vacuum, respectively (78.36 and 8.85 × 10⁻¹² m2·kg·s−2·K−1); k and T are the Boltzmann constant and absolute temperature (1.38 × 10⁻¹² C2·J−1·m−1 and 298.15 K), respectively; e is the proton charge (1.6 × 10⁻¹⁹ C); ψ1, ψ2 are the surface potentials of the air bubble and silica sphere in water, respectively; and κ−1 is the Debye length. Here, ψ1, ψ2 and κ−1 in 5 × 10⁻³ M NaCl solution was selected as −35 mV, −35 mV, and 4.3 nm, respectively, based on the data in the literature [29,30,31,32,33]. It should be noted that Equation (4) works best when the closest distance (i.e., h − r) is greater than several Debye lengths due to the linear approximation treatment [26].
For hydrophobic force, up to now, despite significant research over the last 30 years, a deep and quantitative description of the hydrophobic force remains abstruse [7,23,24]. The specific preparation methods of the hydrophobic surfaces and the measurement techniques seem to have an important influence on the results. Several mechanisms for hydrophobic attraction have been proposed, including entropic effects due to molecular re-arrangement of water near hydrophobic surfaces, electrostatic effects, correlated charge fluctuations or correlated dipole interactions, bridging by nanobubbles, and separation-induced cavitation due to the metastability of the intervening film [6]. Summarizing the existing literature, the experimental data relating to the hydrophobic force can usually be described quantitatively using two formulae, namely an exponential decay law (single exponential and double exponential) and a power decay law [7]. Note that most of the studies adopt the exponential decay law. However, it should be noted these mathematical formulae do not have any physical meaning. For the difference between single exponential and double exponential law, the force in a double exponential law was categorized as a short-ranged with 0–2 nm decay length and a long-ranged force with tens of nanometer decay length. Recently, researchers [4,5] suggested that long-ranged hydrophobic force is not the intrinsic hydrophobic force, arising from the disruptions of water structure, and should be separated from further investigation on hydrophobic force. Therefore, a single exponential model is used to describe the true hydrophobic force between hydrophobic surfaces in this study [22,34]:
where is the potential energy per unit area due to hydrophobic force, C is the hydrophobic force constant, and D is the decay length.
In general, the approach adopted for the total hydrophobic energy, , between the hemispherical-asperity-coated silica sphere and air bubble surface (both the asperities and silica sphere are hydrophobic) was the same as that adopted for calculating the double-layer energy:
where is the hydrophobic potential energy per unit area between the hemispherical-asperity-coated silica sphere and air bubble surface; is the hydrophobic potential energy per unit area between the silica sphere and the bubble (equal to in Equation (5)); and is the hydrophobic potential energy between the asperity and the bubble.
Therefore, for the collector-coated hydrophilic sphere, the first term at the right side of Equation (6) becomes zero. By contrast, for the depressant-coated hydrophobic sphere, the second term at the right side of Equation (6) becomes zero. Finally, we obtained:
for the collector-coated hydrophilic sphere case; and
for the depressant-coated hydrophobic sphere case.
In this work, the water contact angle of both the hydrophobic sphere and hemispherical asperity were set at 90°, while the contact angle of both the hydrophilic sphere and hemispherical asperity were set as 0°. The hydrophobic force constant, C, is equal to the change in free energy per unit area as an air bubble attaches to the solid–liquid interface [34]. Combining with Dupre’s equation, C was determined as 72 mN/m, corresponding to the 90° contact angle. Now, the only unknown parameter for hydrophobic potential calculation is the decay length. Recent studies have shown that D is system-dependent [8,34,35]. Donaldson et al. [36] reviewed the current hydrophobic force experimental results and found that a decay length of 0.3–2 nm in a general exponential decay law is able to describe all the intrinsic hydrophobic forces. Based on this, 1.5 nm decay length was used to render the results more universal in the following calculations.
3. Results and Discussion
3.1. Role of Collector in Bubble–Particle Attachment
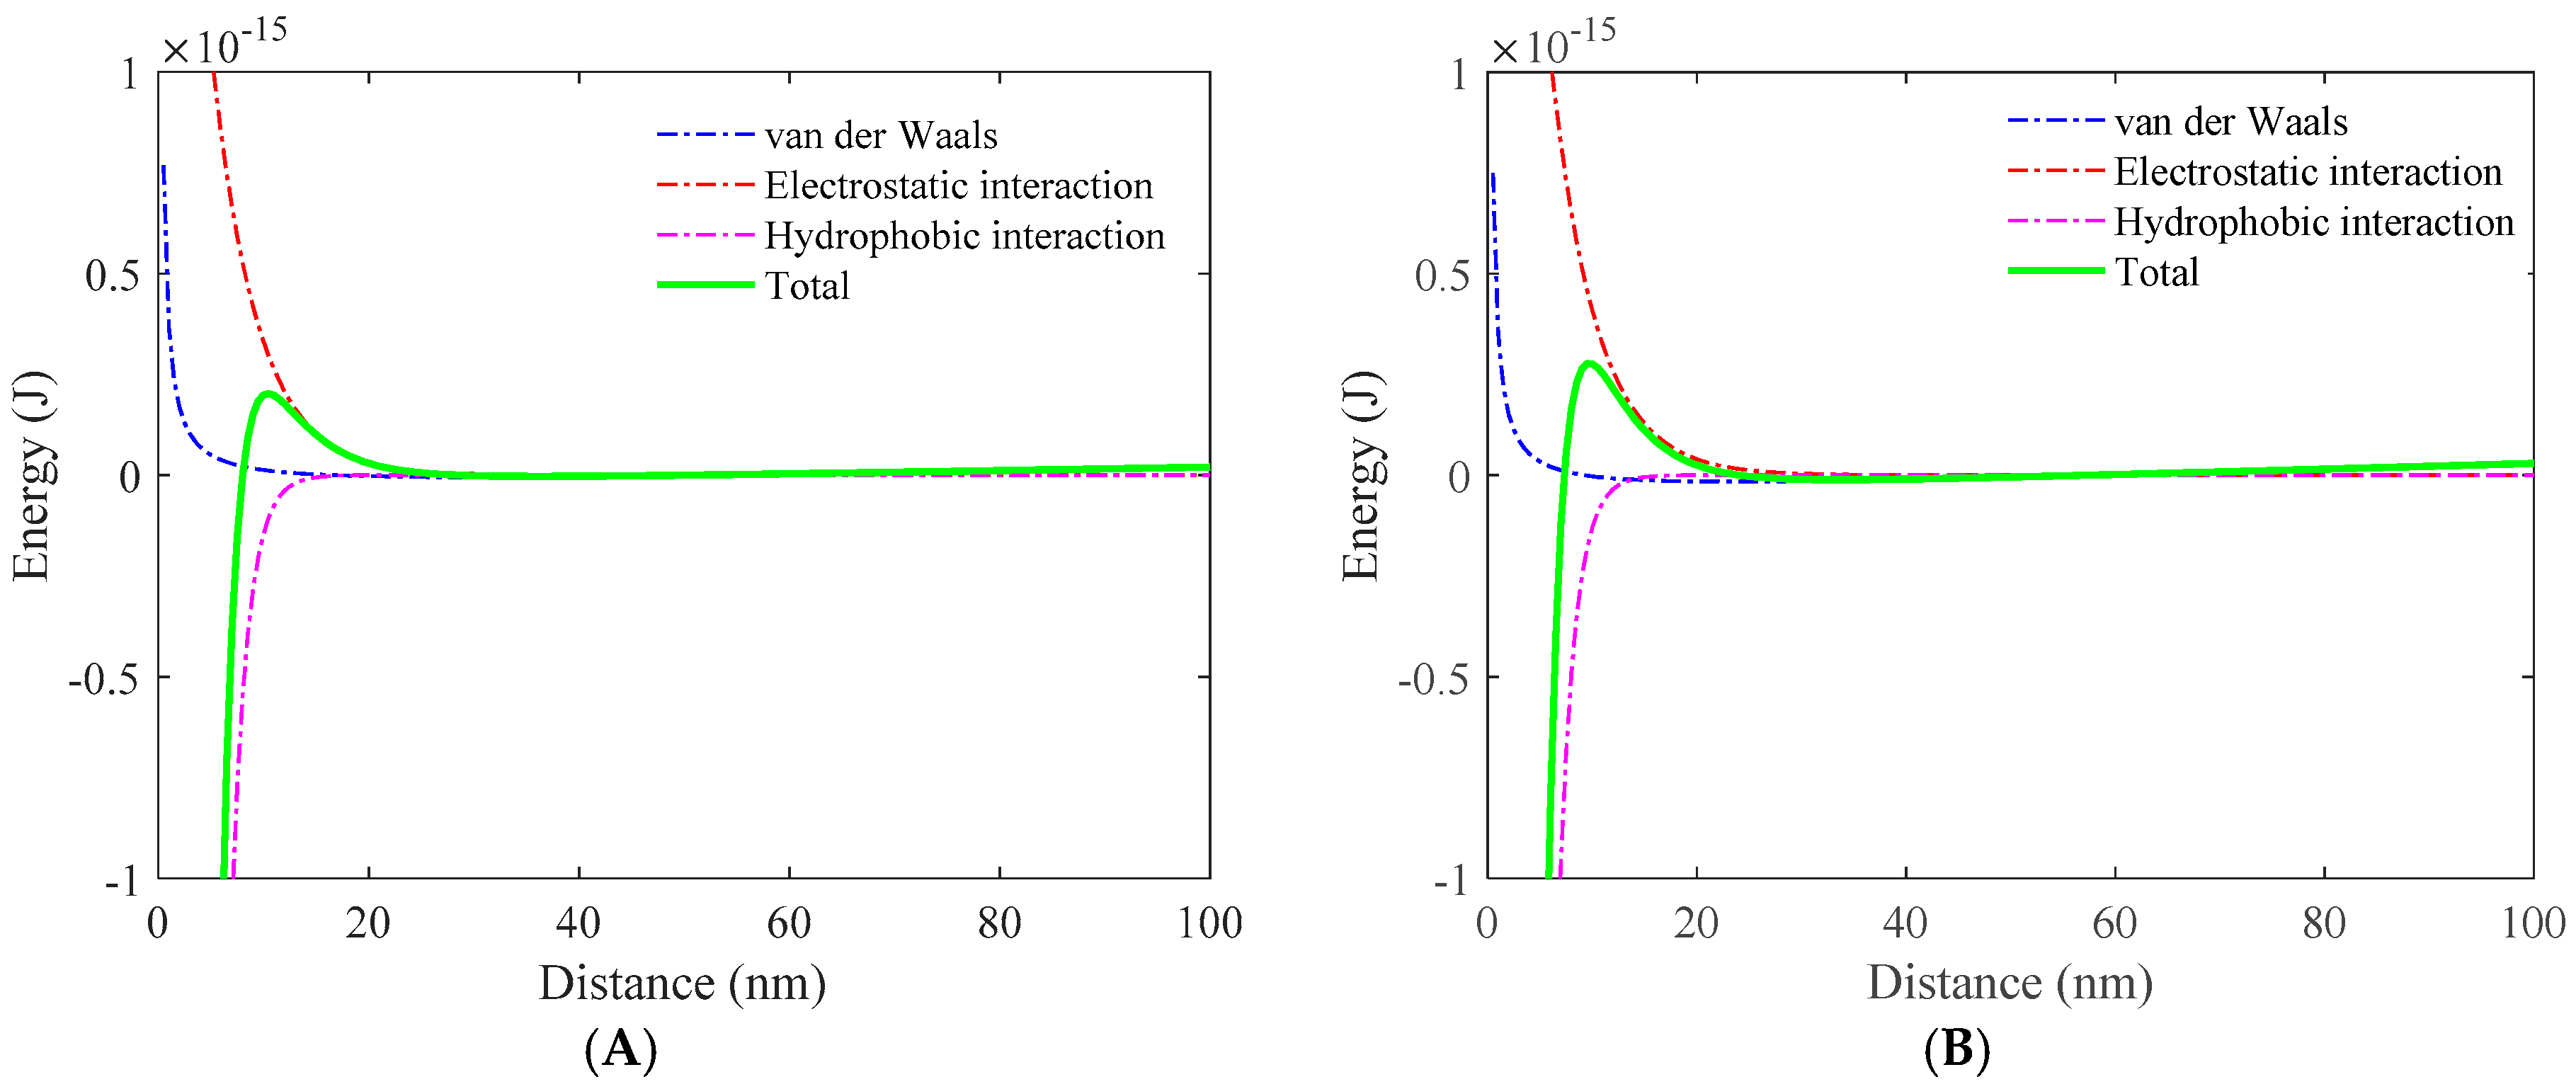
The potential curves between a smooth 200-μm-radius hydrophilic (0°) or hydrophobic (90°) silica particle and an air bubble in 5 × 10⁻³ M NaCl solution were first plotted (Figure 2) for subsequent comparative analysis. It was found that for smooth hydrophilic silica, both the van der Waals and double-layer forces are repulsive, and there is no driving force for bubble–particle attachment. When the water contact angle of silica becomes 90°, i.e., the hydrophobic force is taken into consideration, only a small energy barrier is observed in the total potential curve, and the bubble–silica attachment becomes possible. The above results are consistent with the practical flotation results: the hydrophobic particles are captured by air bubble, while the hydrophilic particles remain in the pulp.
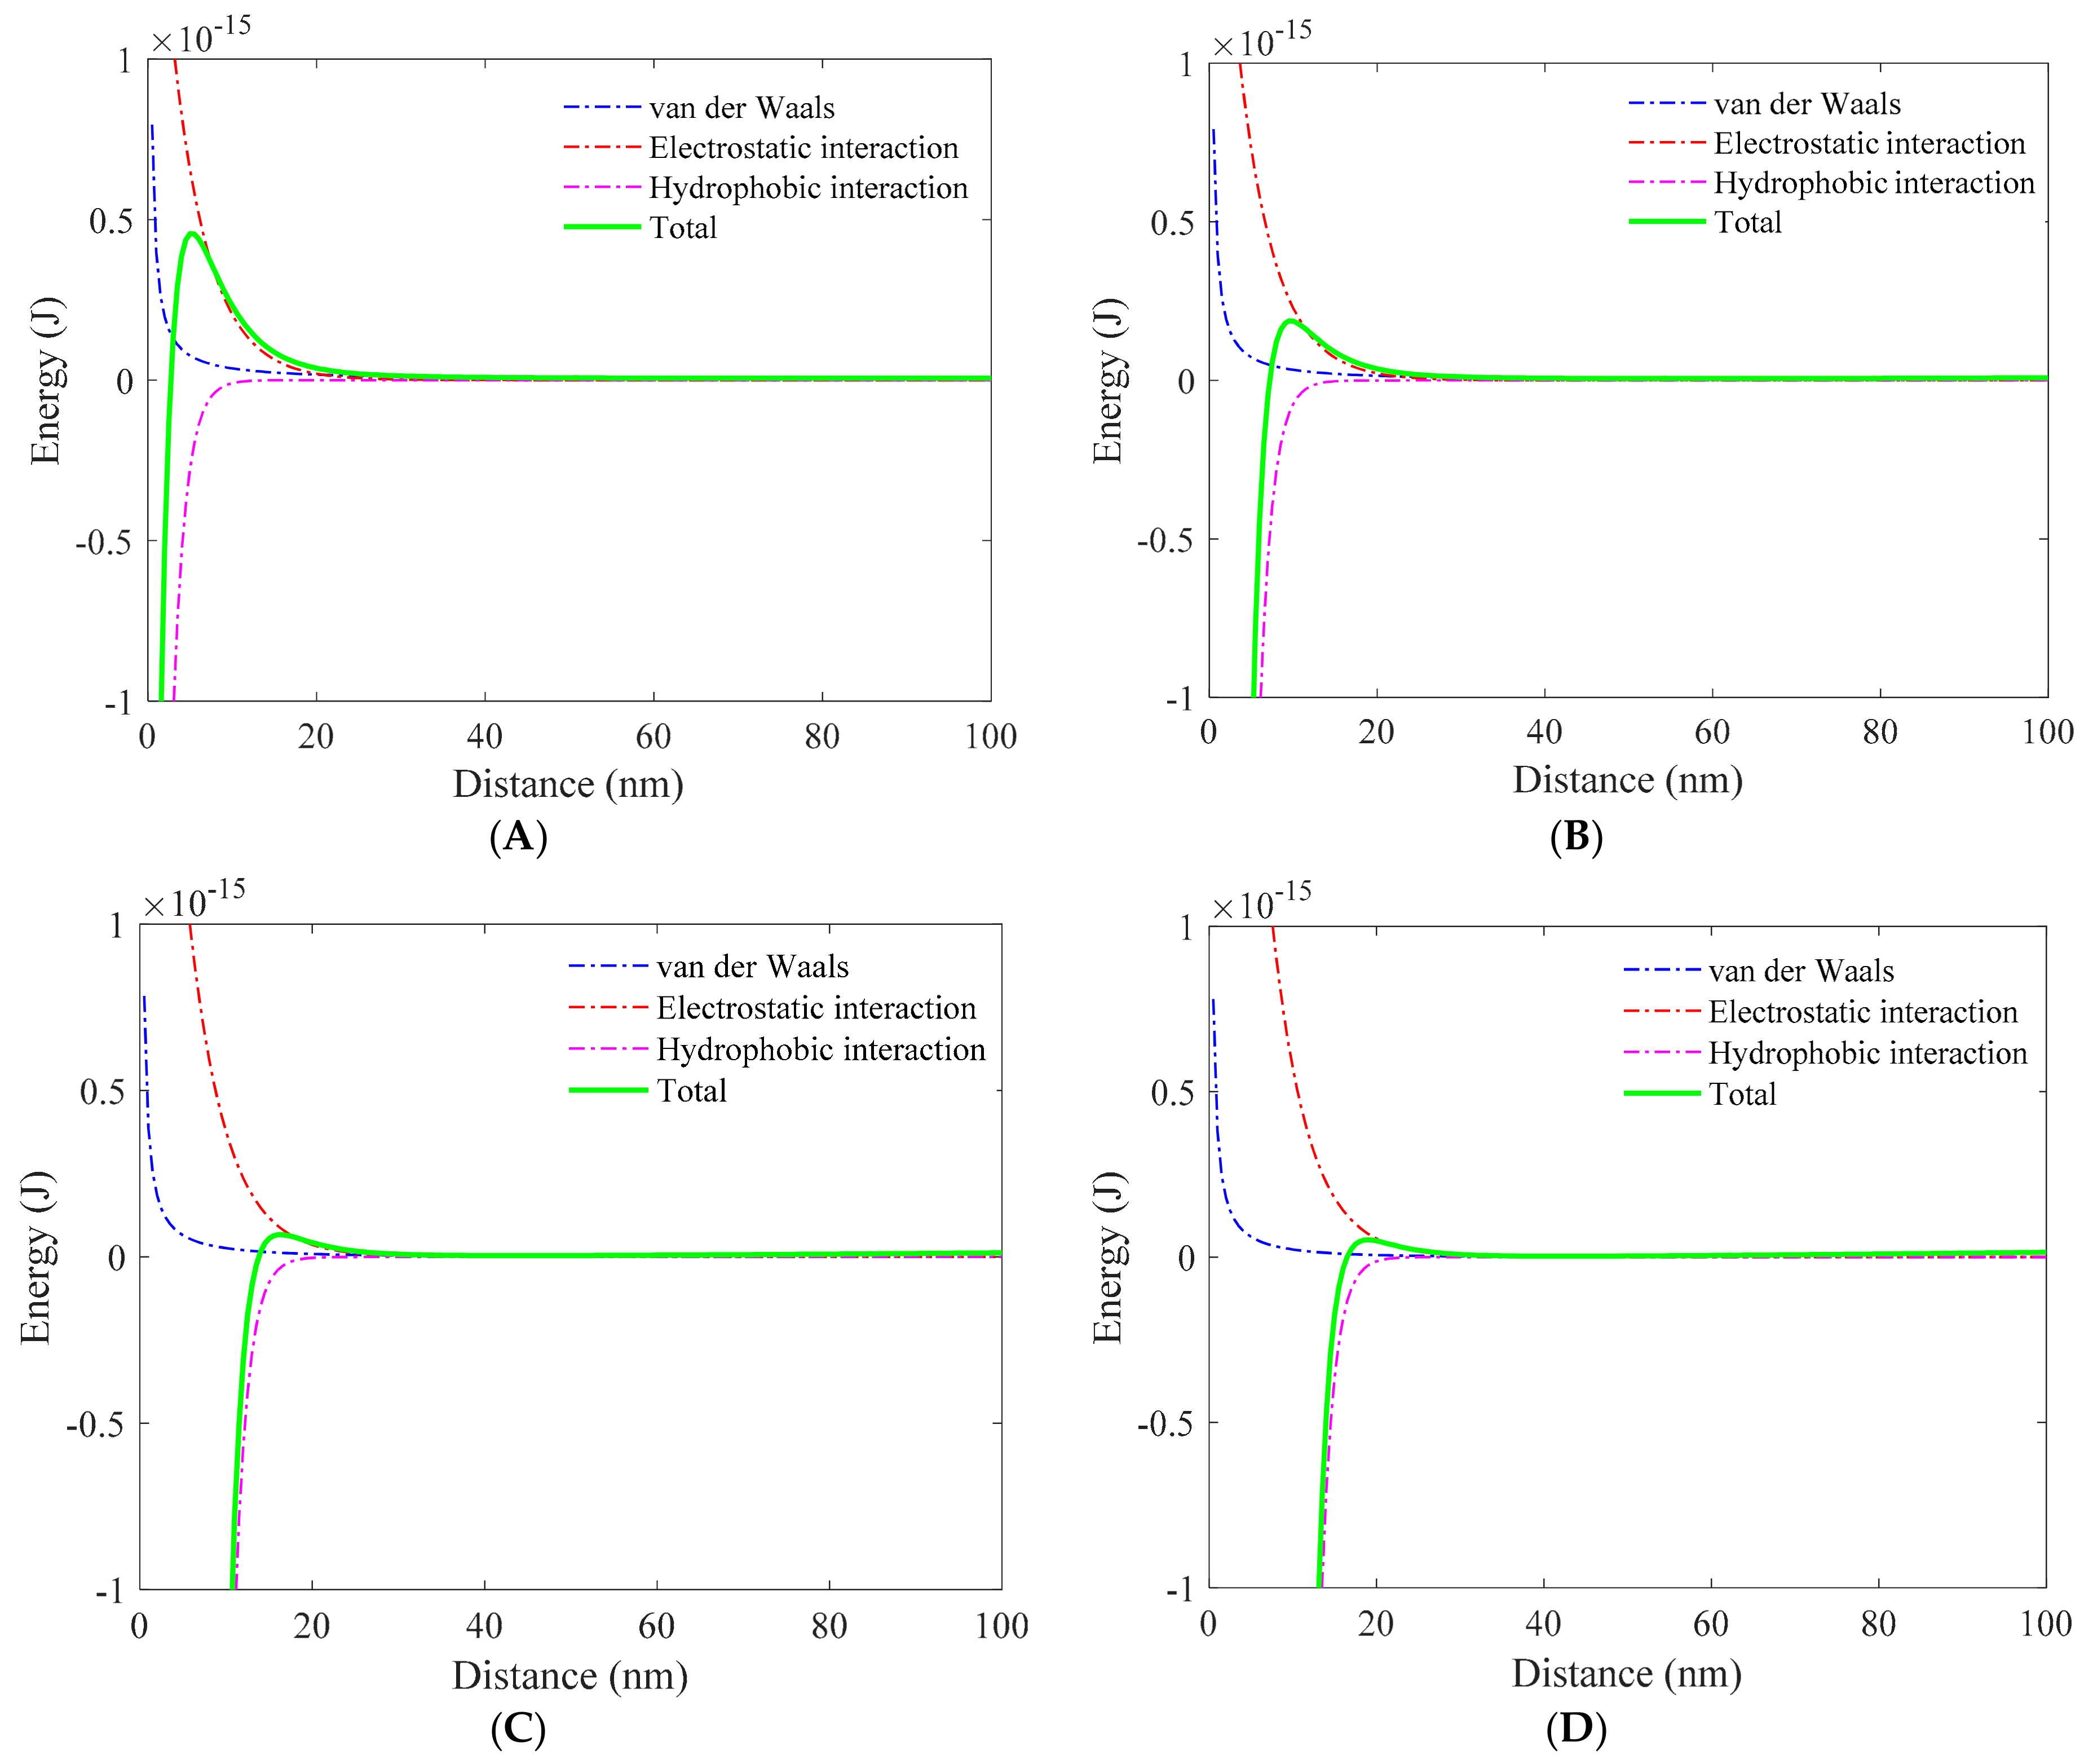
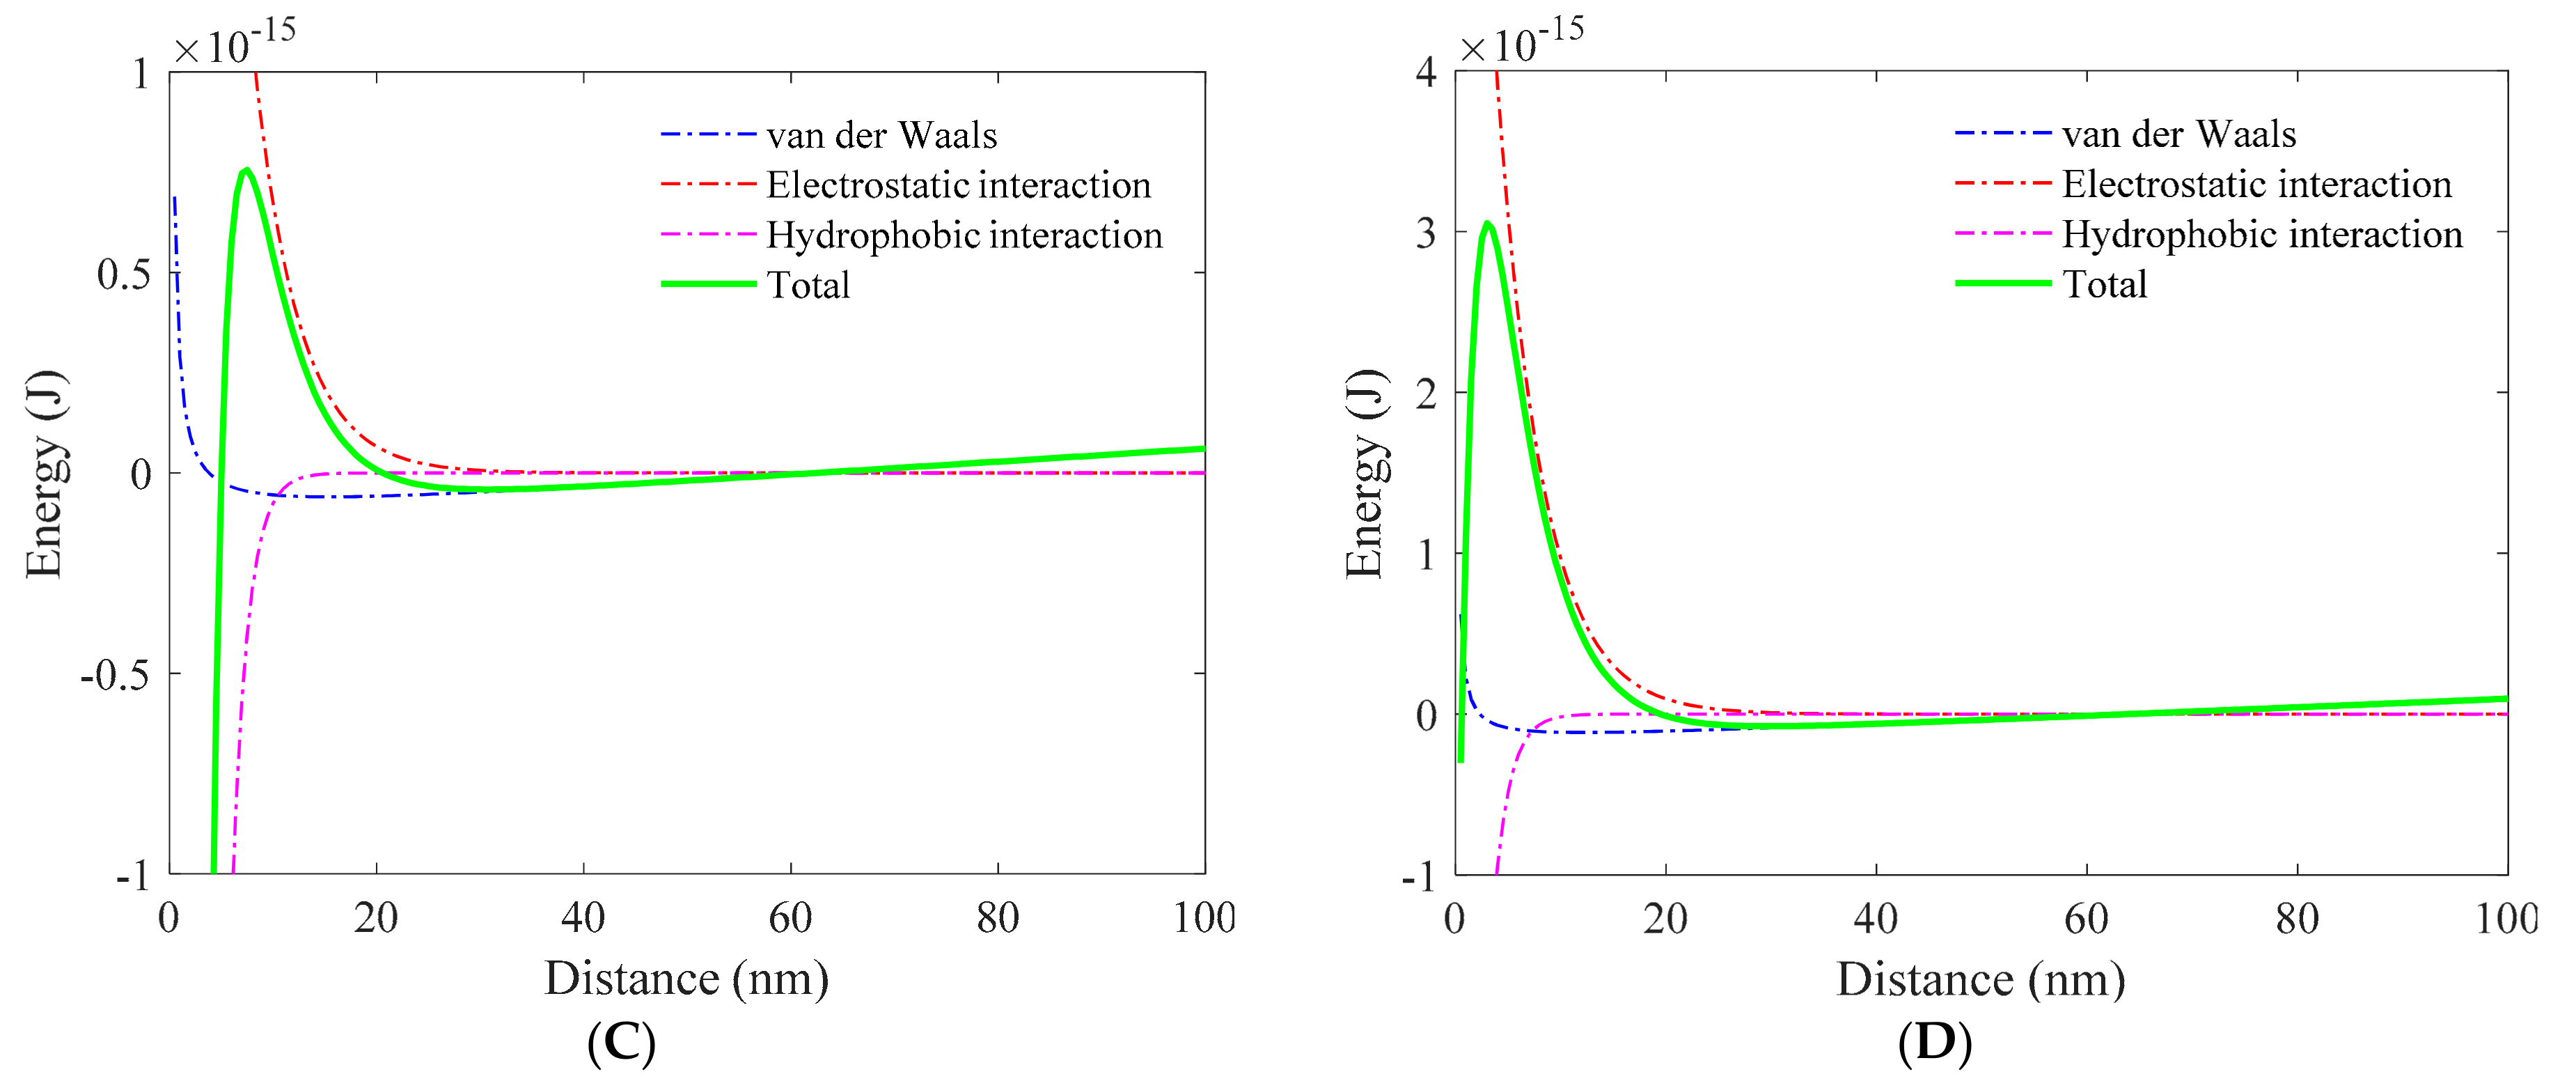
There are two ways to increase the asperity coverage fraction from Equation (1): increasing the radius and increasing the number distribution density. For a hydrophilic silica sphere covered with hydrophobic hemispherical asperities with a fixed number distribution density (7.96 × 10¹⁴ m−2), the effect of asperity radius on the potential curve between the bubble and particle is shown in Figure S1 (see Supplementary Materials) and Figure 3. As the asperity radius increased, the total repulsive energy converted into attractive energy, and thus, the energy barrier decreased significantly. This is because the increase in asperity coverage fraction results in increased water contact angle, and thus, enhanced hydrophobic force. It should be noted that both the repulsive van der Waals and double-layer forces also increased slightly with increasing asperity radius. Interestingly, when the asperity radius was 8 nm, the energy barrier was even lower than that between the 90° hydrophobic silica and the bubble. In this case, the coverage fraction of hydrophobic asperity was only 16%. It is unnecessary to cover the entire hydrophilic particle surface by adding a large amount of the collector in flotation practice, since the dimension of the collector also plays a critical role in decreasing the bubble–particle potential barrier. These hydrophobic domains can trigger the rupture of thin water film in the local area. There is a synergistic effect between the asperity radius and asperity surface coverage on the hydrophobic force, and thus, the total potential curve.
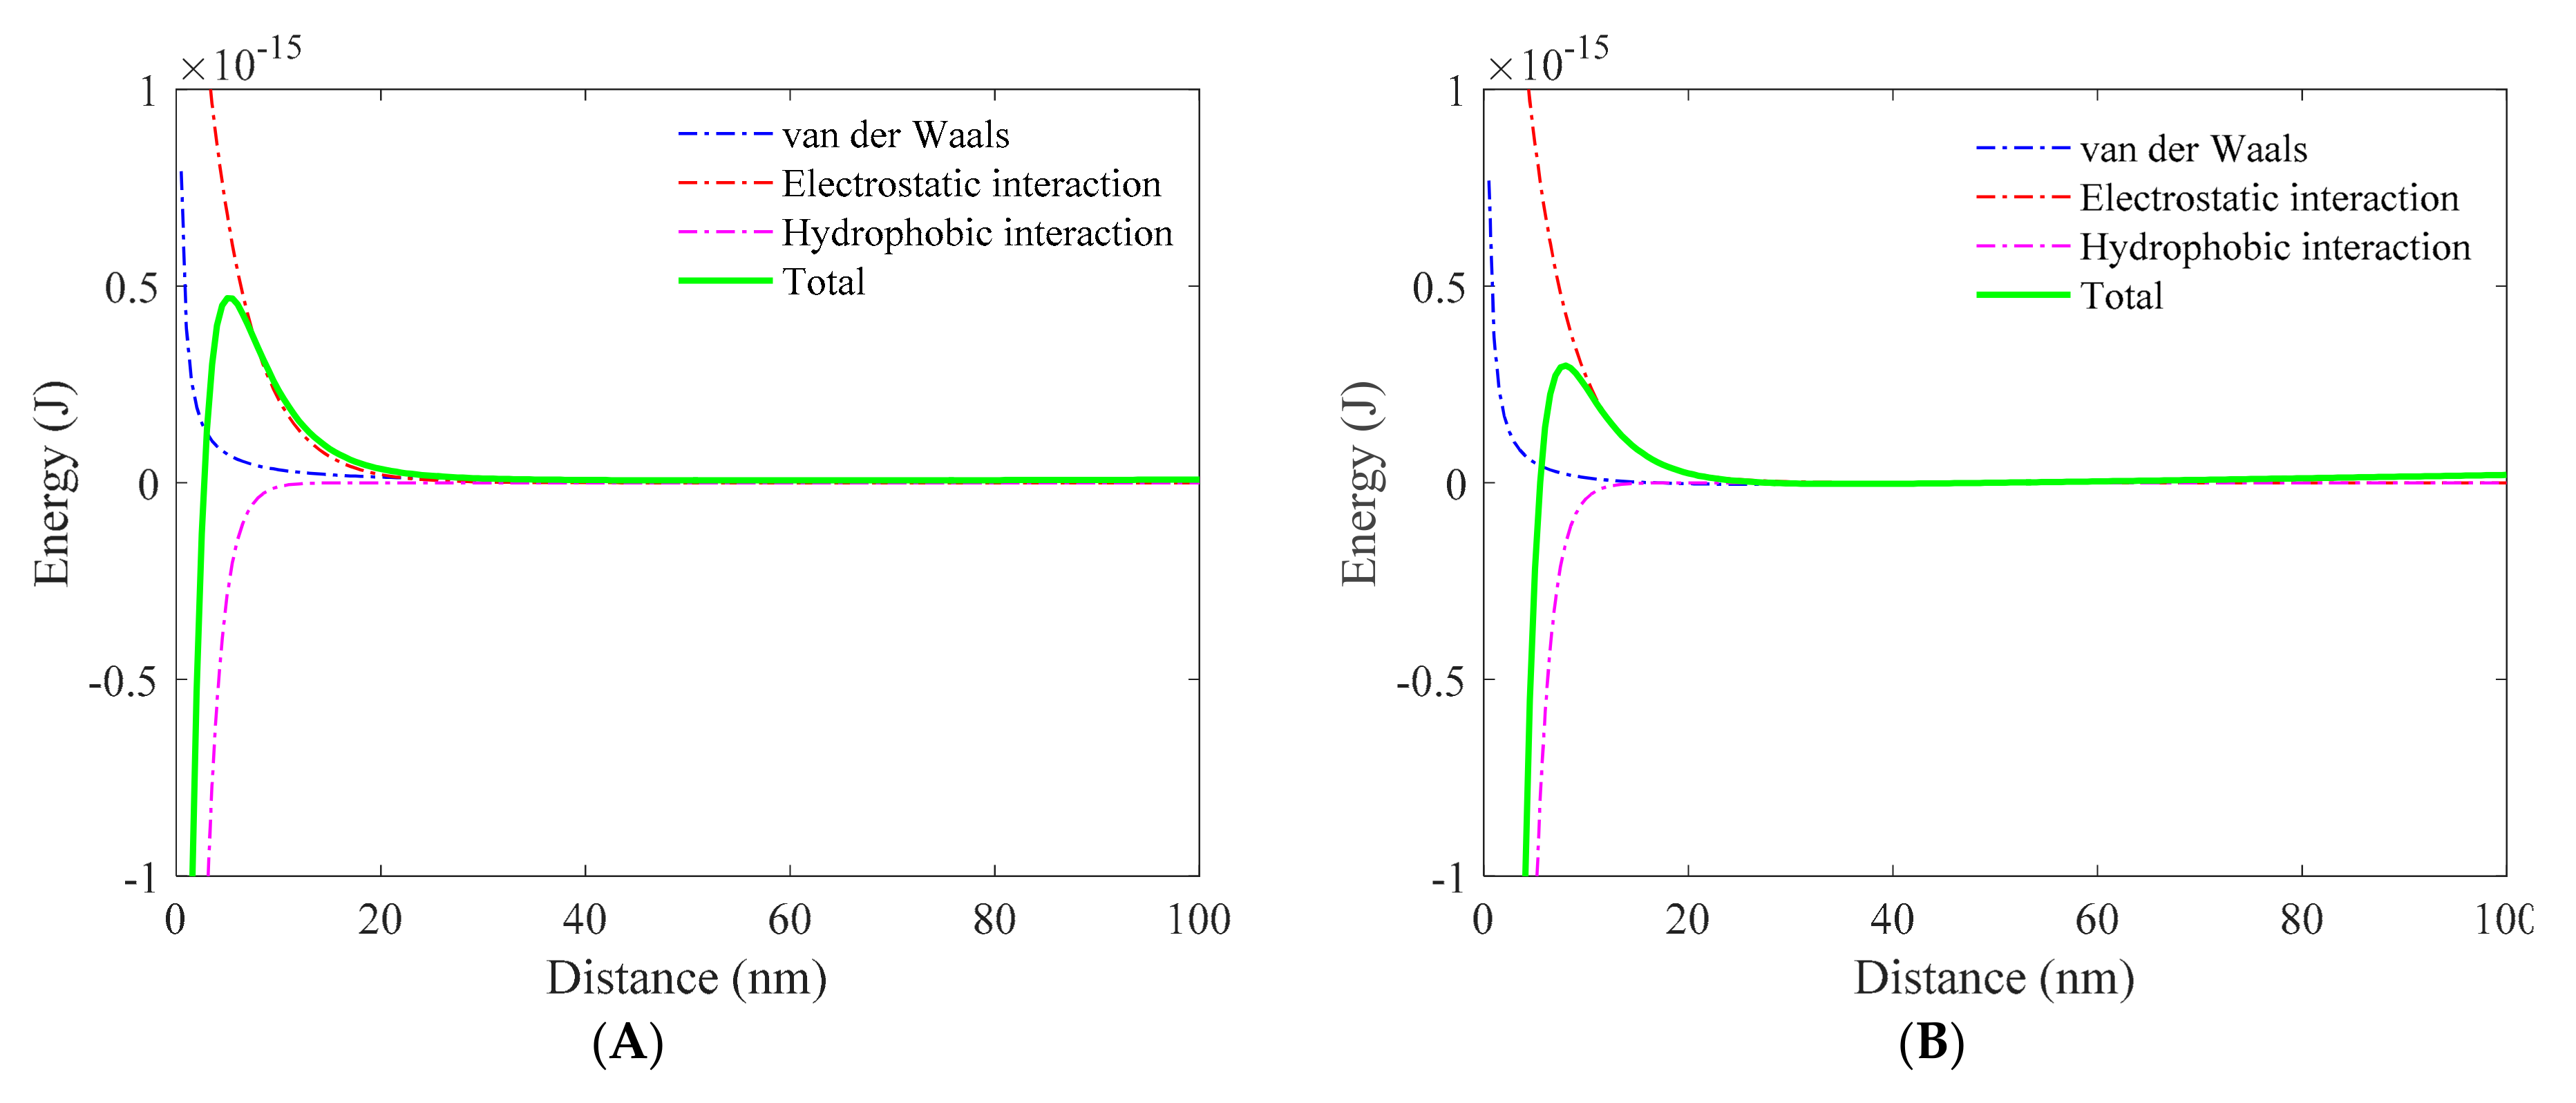
Another situation is the increase in asperity number distribution density while the radius is fixed. The potential curves between a 200-μm-radius hydrophilic silica sphere covered with different number distribution densities of hydrophobic hemispherical asperities and an air bubble in 5 × 10⁻³ M NaCl solution are shown in Figure S2 and Figure 4. The radius of asperity is fixed at 1 nm. For comparison, the asperity coverage fraction was kept the same as in the case of increase in asperity radius. With increasing number distribution density, the energy barrier between the silica and the bubble decreased at first and then remained nearly constant when the number distribution was larger than 1.27 × 10¹⁶ m−2. It should be noted that the energy barrier is always higher than in the case of increase in asperity radius under the same asperity coverage fraction. The mode of increasing the asperity coverage fraction has an important effect on the potential curves between the hydrophilic silica and the bubble. Although both van der Waals and electrostatic forces increased with increasing surface coverage, hydrophobic forces increased much more remarkably and thus, total interaction forces became more attractive. Moreover, the hydrophobic force begins to affect the bubble–particle attachment only by the partial coating of hydrophobic asperity.
According to Cassie–Baxter equation [37], the apparent contact angle on a composite surface can be expressed as:
where is the Cassie apparent contact angle, and and are the surface area fraction with contact angles and , respectively. Here, the water contact angle of both hydrophobic sphere and hemispherical asperity were set at 90° (), while the contact angle of both hydrophilic sphere and hemispherical asperity were set as 0° ().
Using Equation (9), the apparent contact angle of silica covered with nanometer-sized hemispherical asperities can be approximately calculated neglecting the surface roughness effect [11]. Thus, the apparent contact angle will be the same as long as the asperity coverage fraction is identical. The energy barrier between a 200-μm-radius hydrophilic silica sphere covered with hydrophobic hemispherical asperities and an air bubble in 5 × 10⁻³ M NaCl solution is plotted as a function of apparent contact angle in Figure 5. These data were collected from Figure 3 and Figure 4. The total bubble–particle attachment barrier decreased greatly as the apparent contact angle increased, mainly due to the increase in hydrophobic force. By comparison, the radius of asperity had a much greater effect on the attachment barrier. From flotation point of view, the hydrophobic asperity radius can be considered as the length of hydrophobic part in collector molecule, while the number density represents the adsorption density. Therefore, increasing the hydrophobic part length in the collector molecule is a more effective way to enhance the flotation recovery compared to increasing the collector concentration. Indeed, hydrocarbon oils with long carbon chains are usually used as a powerful collector, resulting in an enhanced recovery. The role of the collector in bubble–particle attachment is to create attractive hydrophobic forces to overcome the repulsive van der Waals and electrostatic forces.
3.2. Role of Depressant in Bubble–Particle Attachment
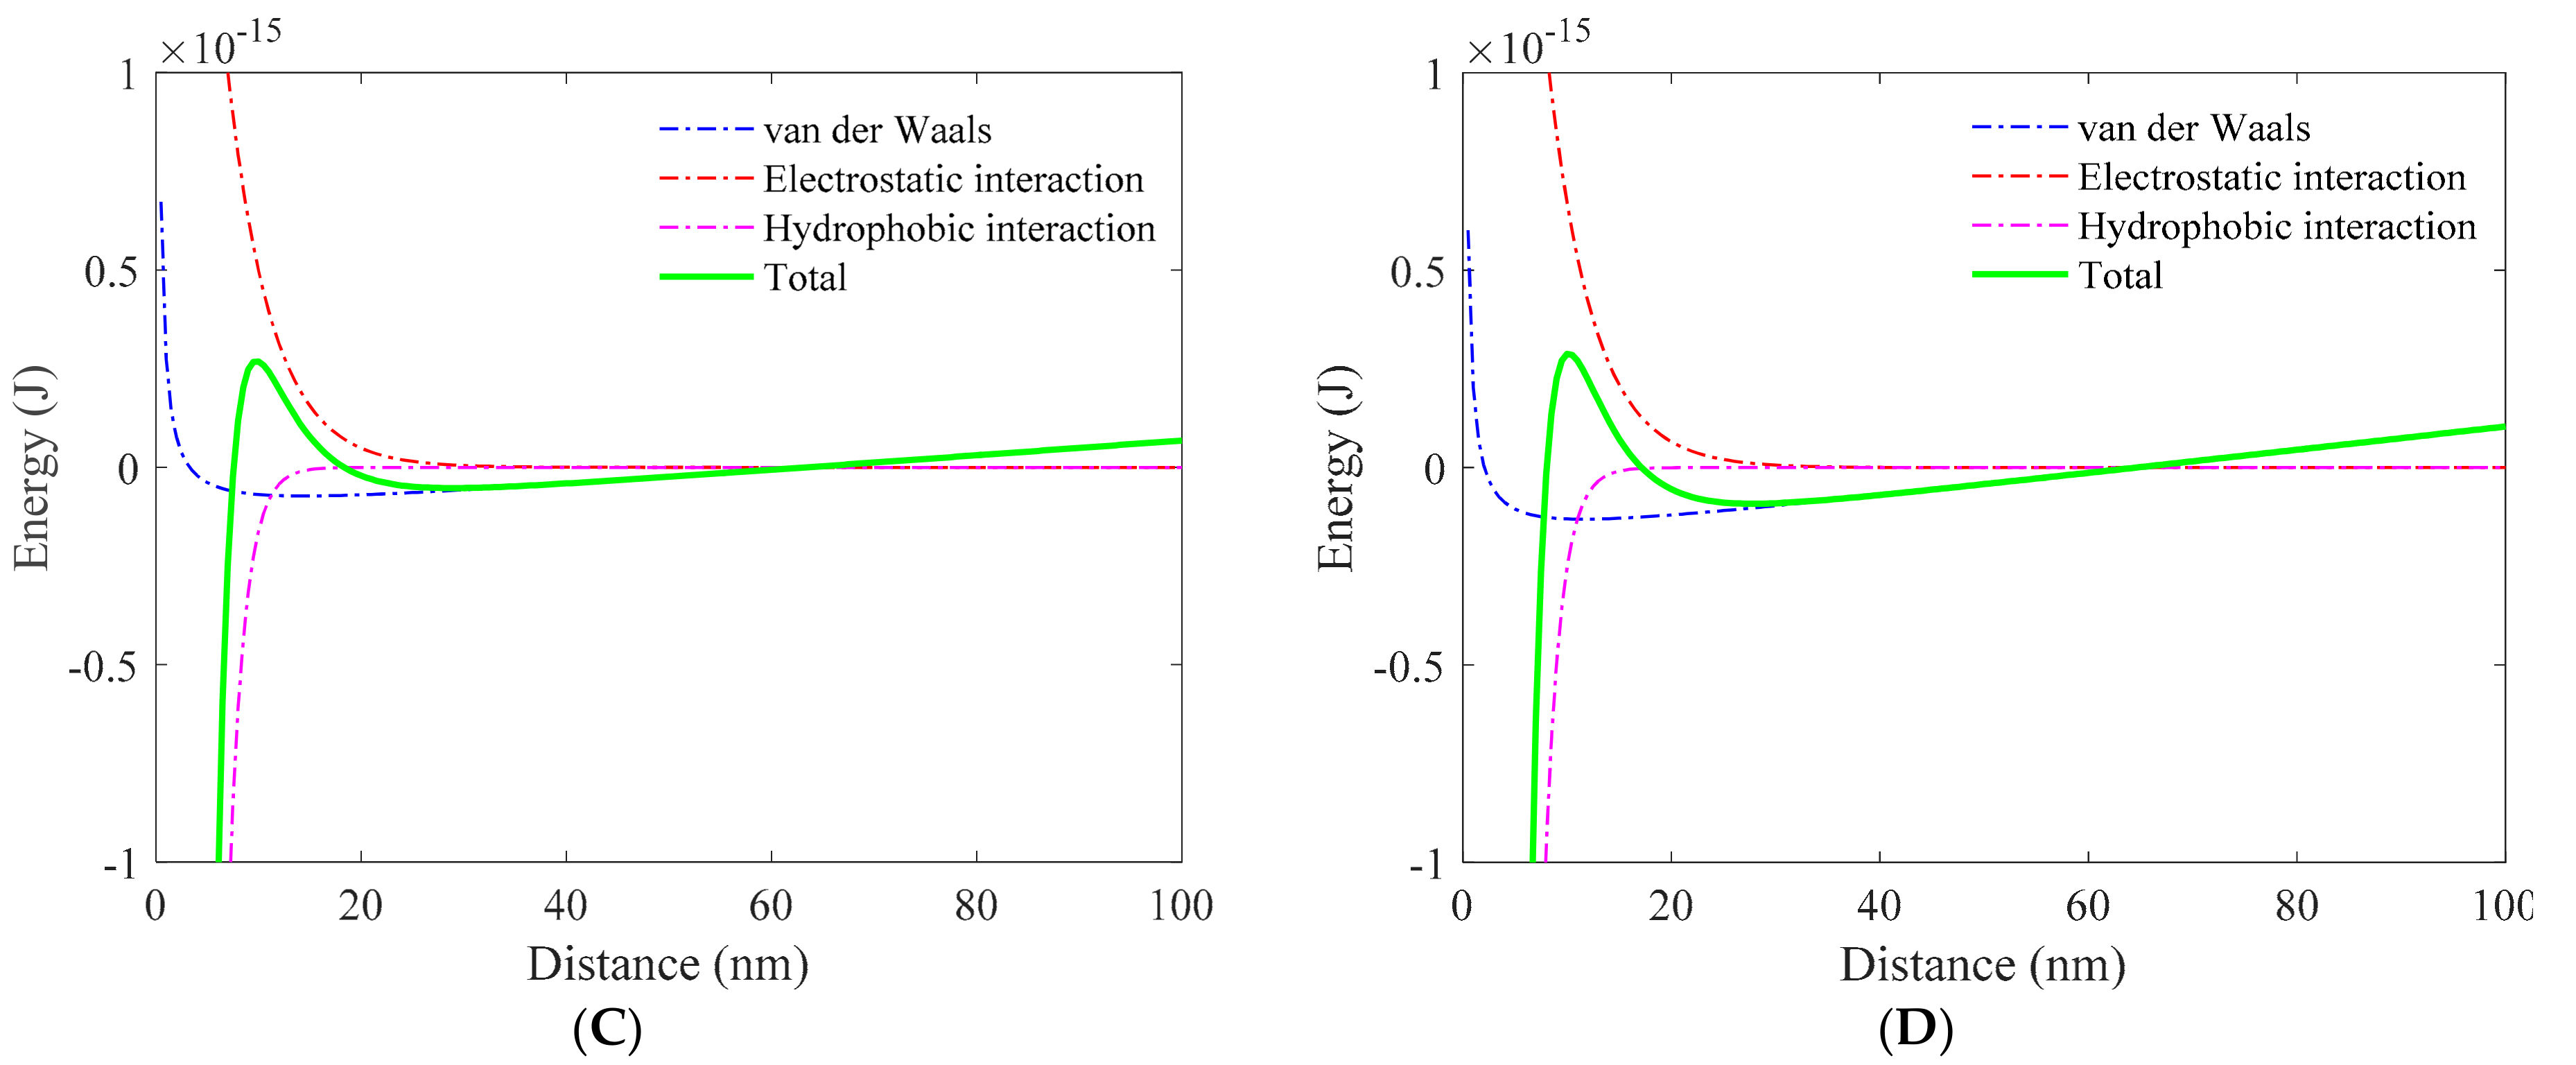
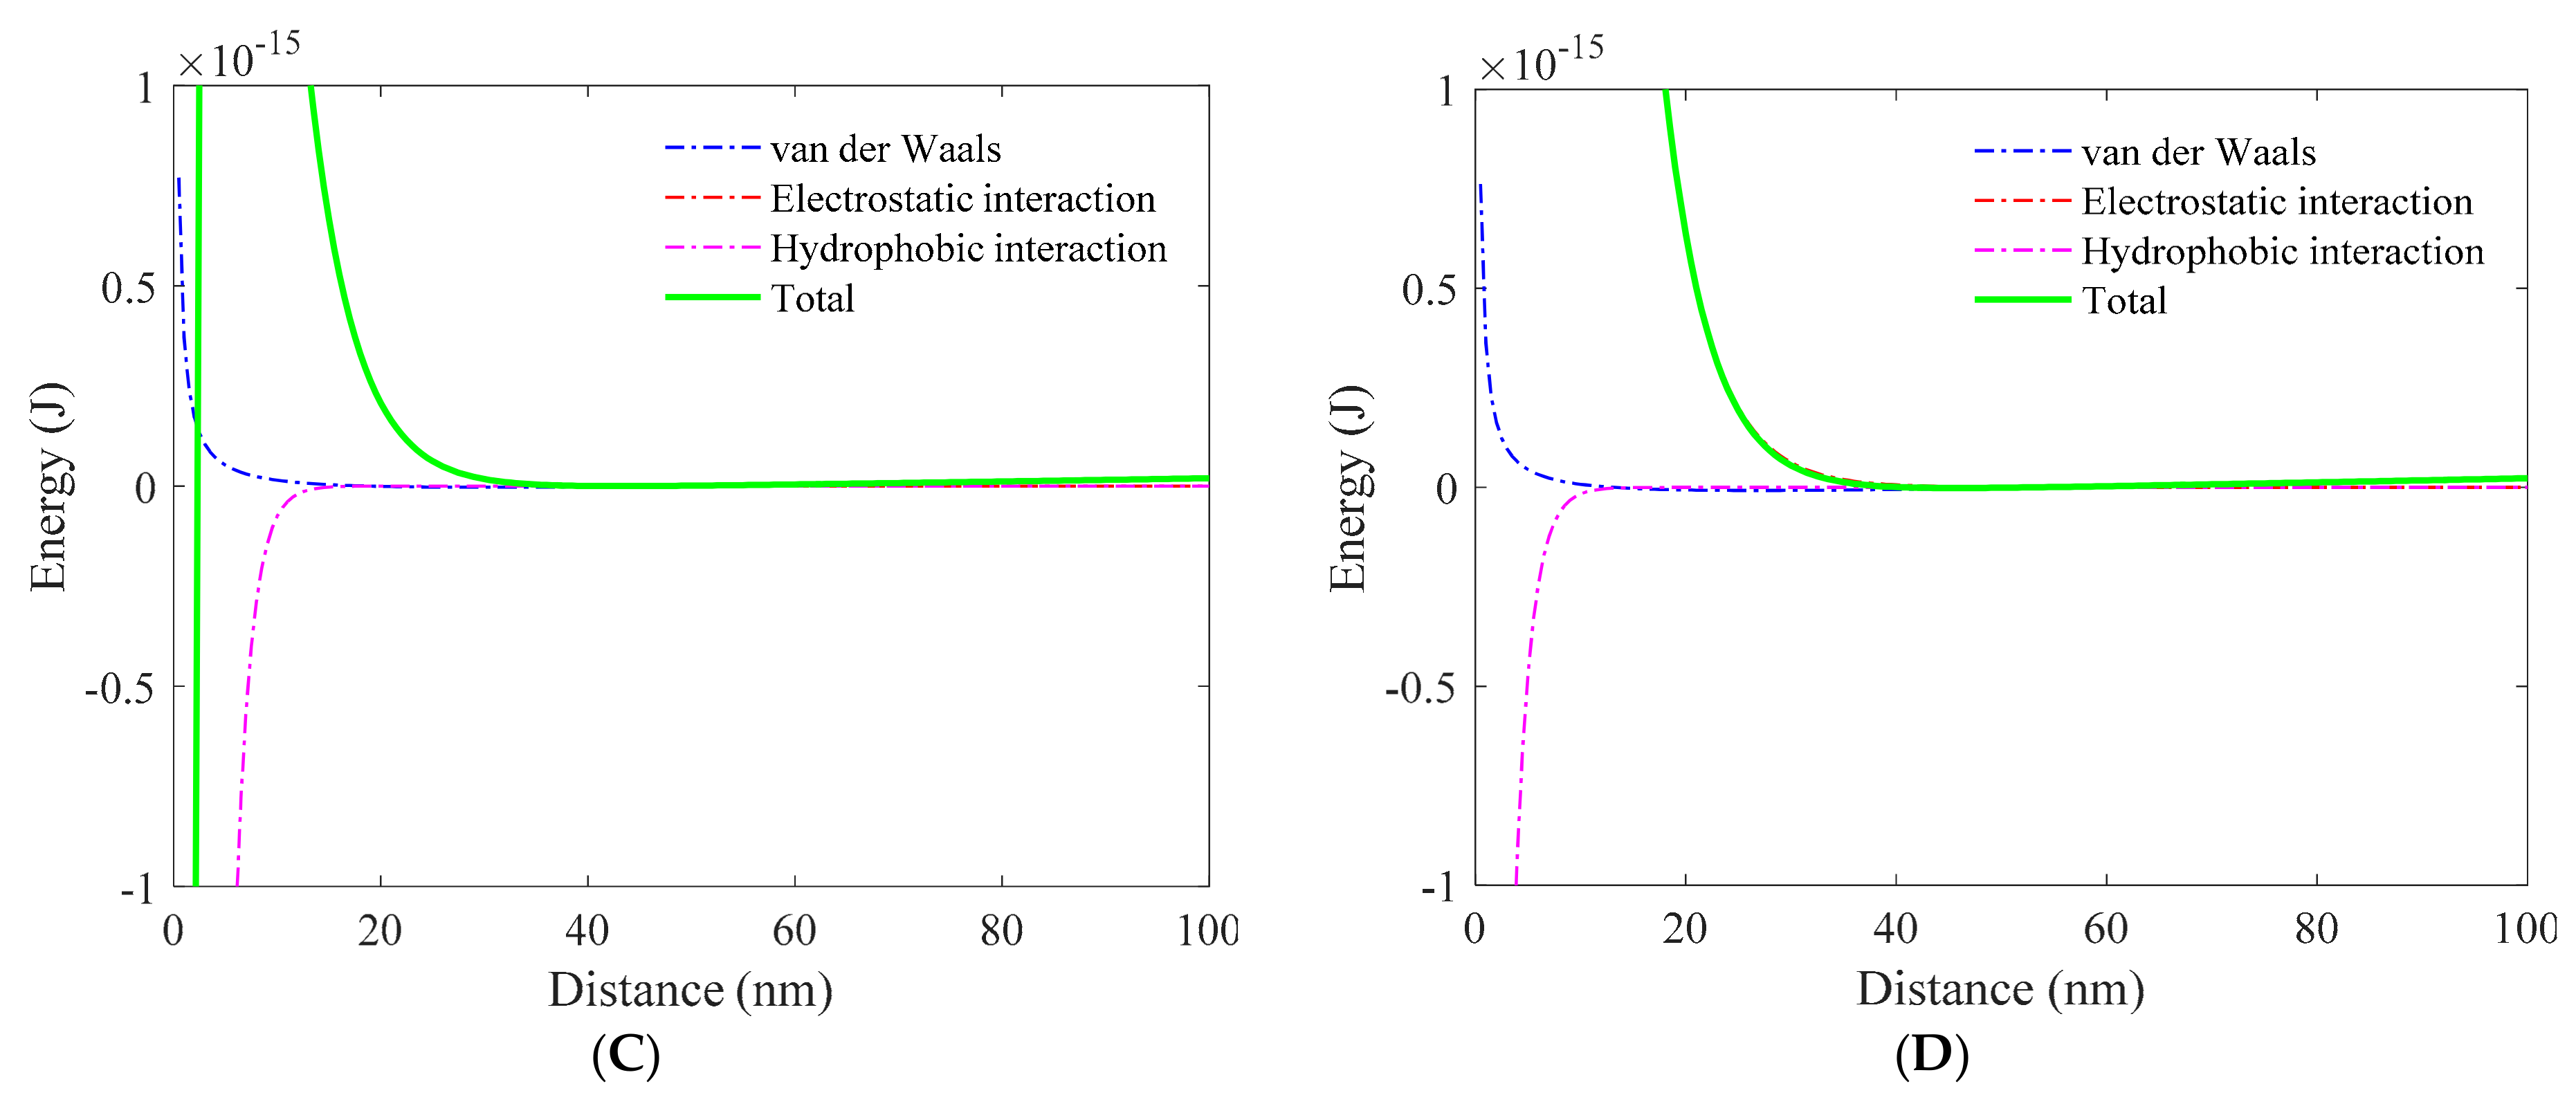
Here, the depressant was considered hydrophilic nanometer-sized hemispherical asperity, and its role in bubble–particle attachment was studied in a similar way as was the collector. The potential curves between a 200-μm-radius hydrophobic silica sphere covered with hydrophilic hemispherical asperities with different radii and an air bubble in 5 × 10⁻³ M NaCl solution are shown in Figure S3 and Figure 6. Clearly, the attachment energy barrier increased as the asperity radius increased. It should be noted that for the asperity radius lower than 8 nm, the barrier slightly increased. Interestingly, the increase in barrier is more likely due to the increase in electrostatic double-layer force than the decrease in hydrophobic force. This is because the range of hydrophobic force is longer than that of the double-layer force; thus, although some fractions of hydrophobic silica were coated with hydrophilic asperity, the hydrophobic force between the rest of the hydrophobic part and the bubble can still affect the total potential curve. It is difficult to suppress the hydrophobic force completely, unless the hydrophilic asperity fully covers the hydrophobic silica.
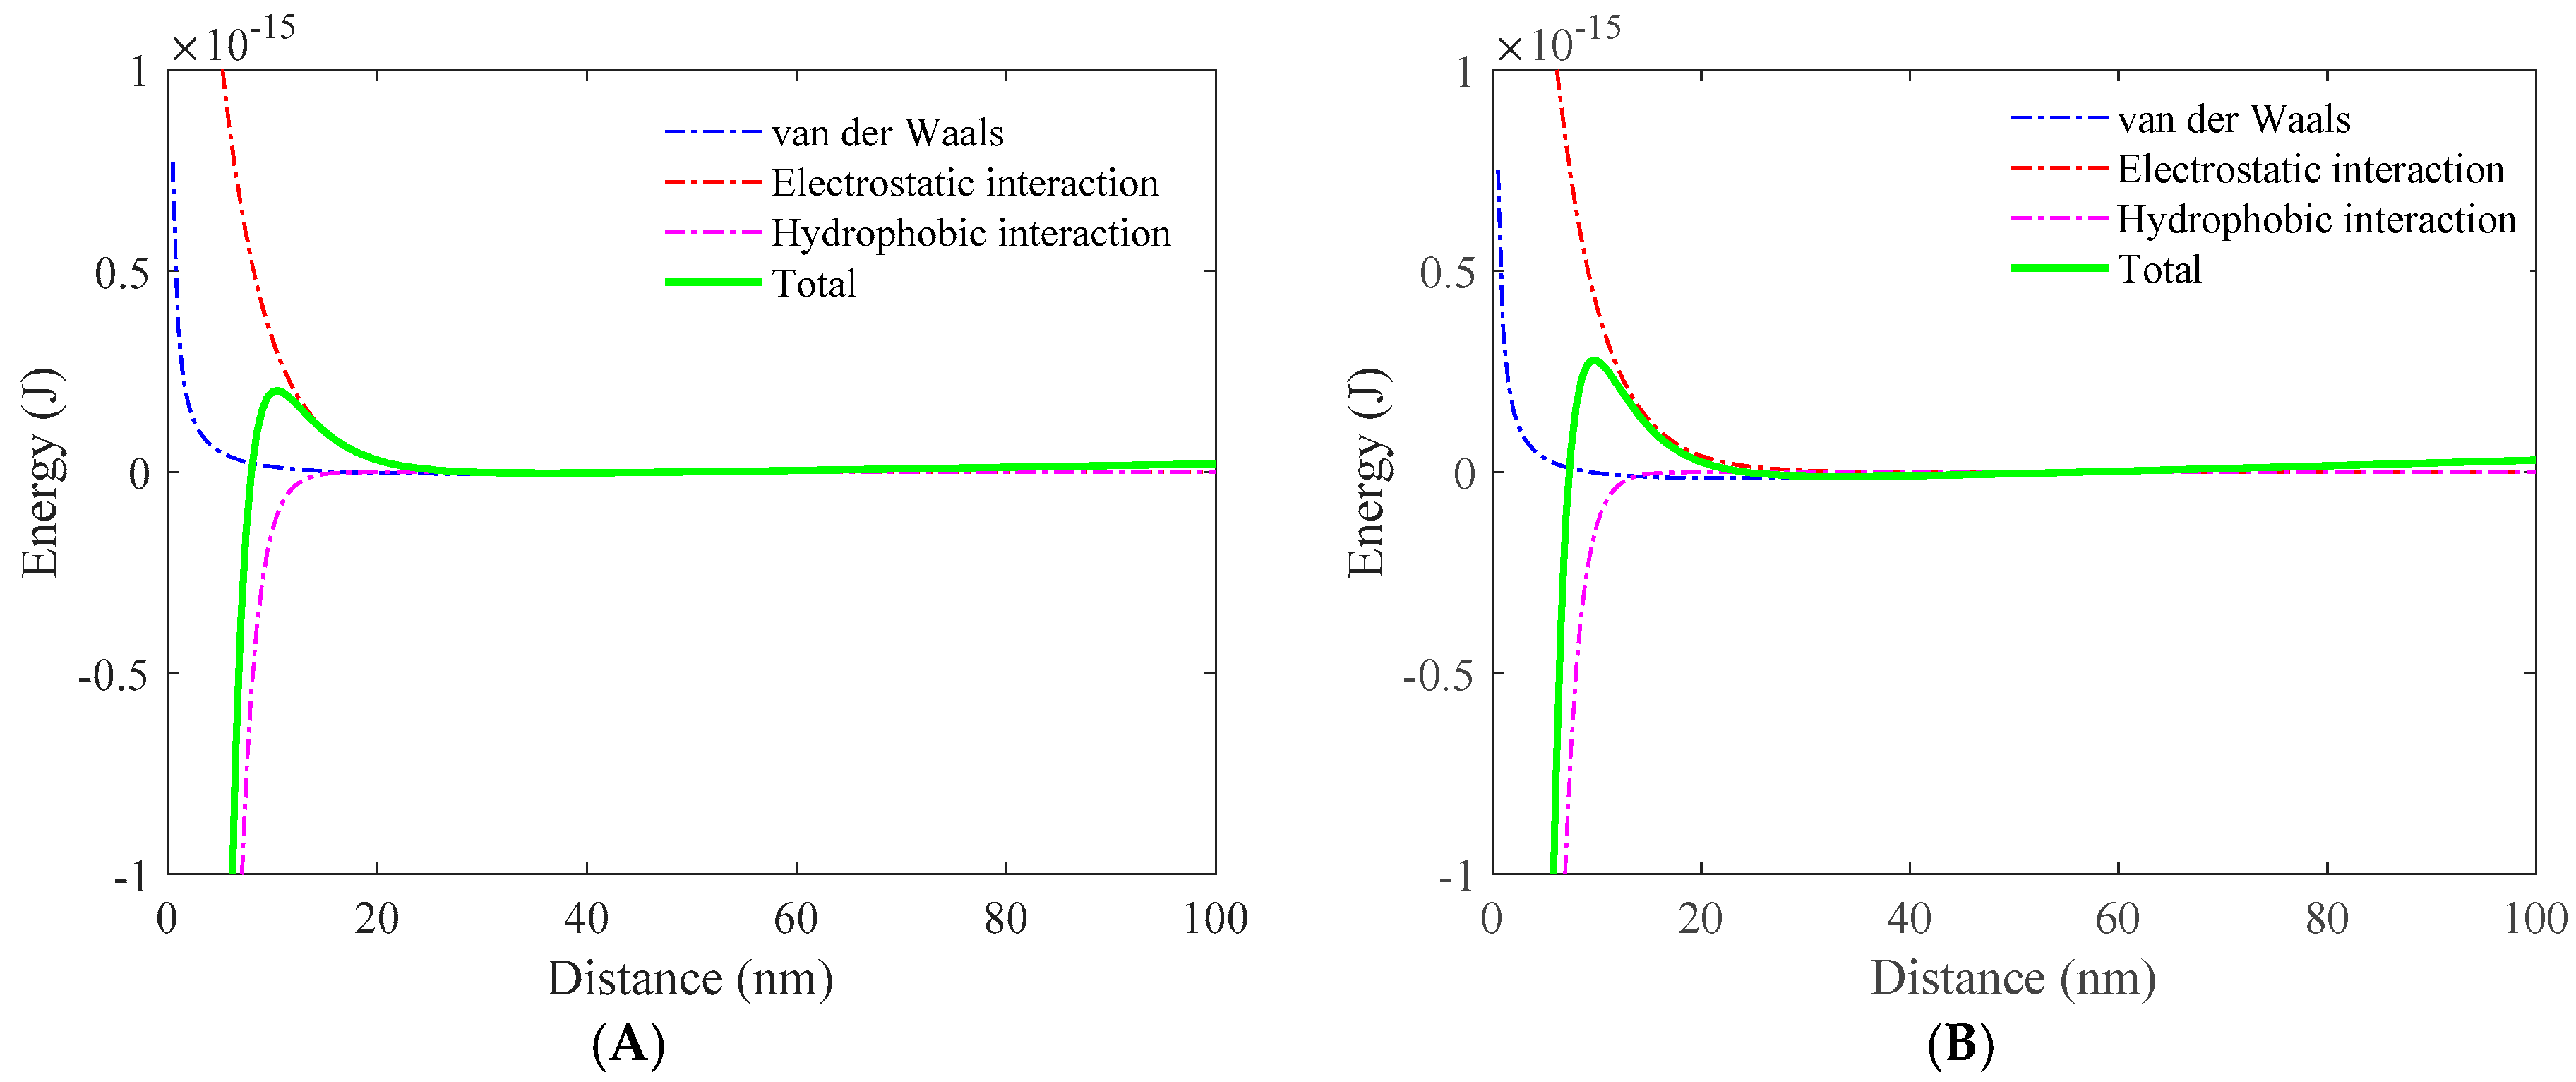
The potential curves between a 200-μm-radius hydrophobic silica sphere covered with different number distribution densities of hydrophilic hemispherical asperities and an air bubble in 5 × 10⁻³ M NaCl solution are shown in Figure S4 and Figure 7. The energy barrier increased as the asperity number distribution density increased. However, the increase in energy barrier is due to both the enhanced double-layer force and the suppressive hydrophobic force. Since the radius of the hydrophilic asperity was fixed at 4 nm, the increase in asperity number density only affected the action area of the double-layer force and hydrophobic force. In addition, the energy barrier is always lower than the energy barrier for the increased asperity radius case under the same asperity coverage fraction. Moreover, the mode of increasing the hydrophilic asperity coverage fraction has an important effect on the potential curves between the hydrophobic silica and the bubble.
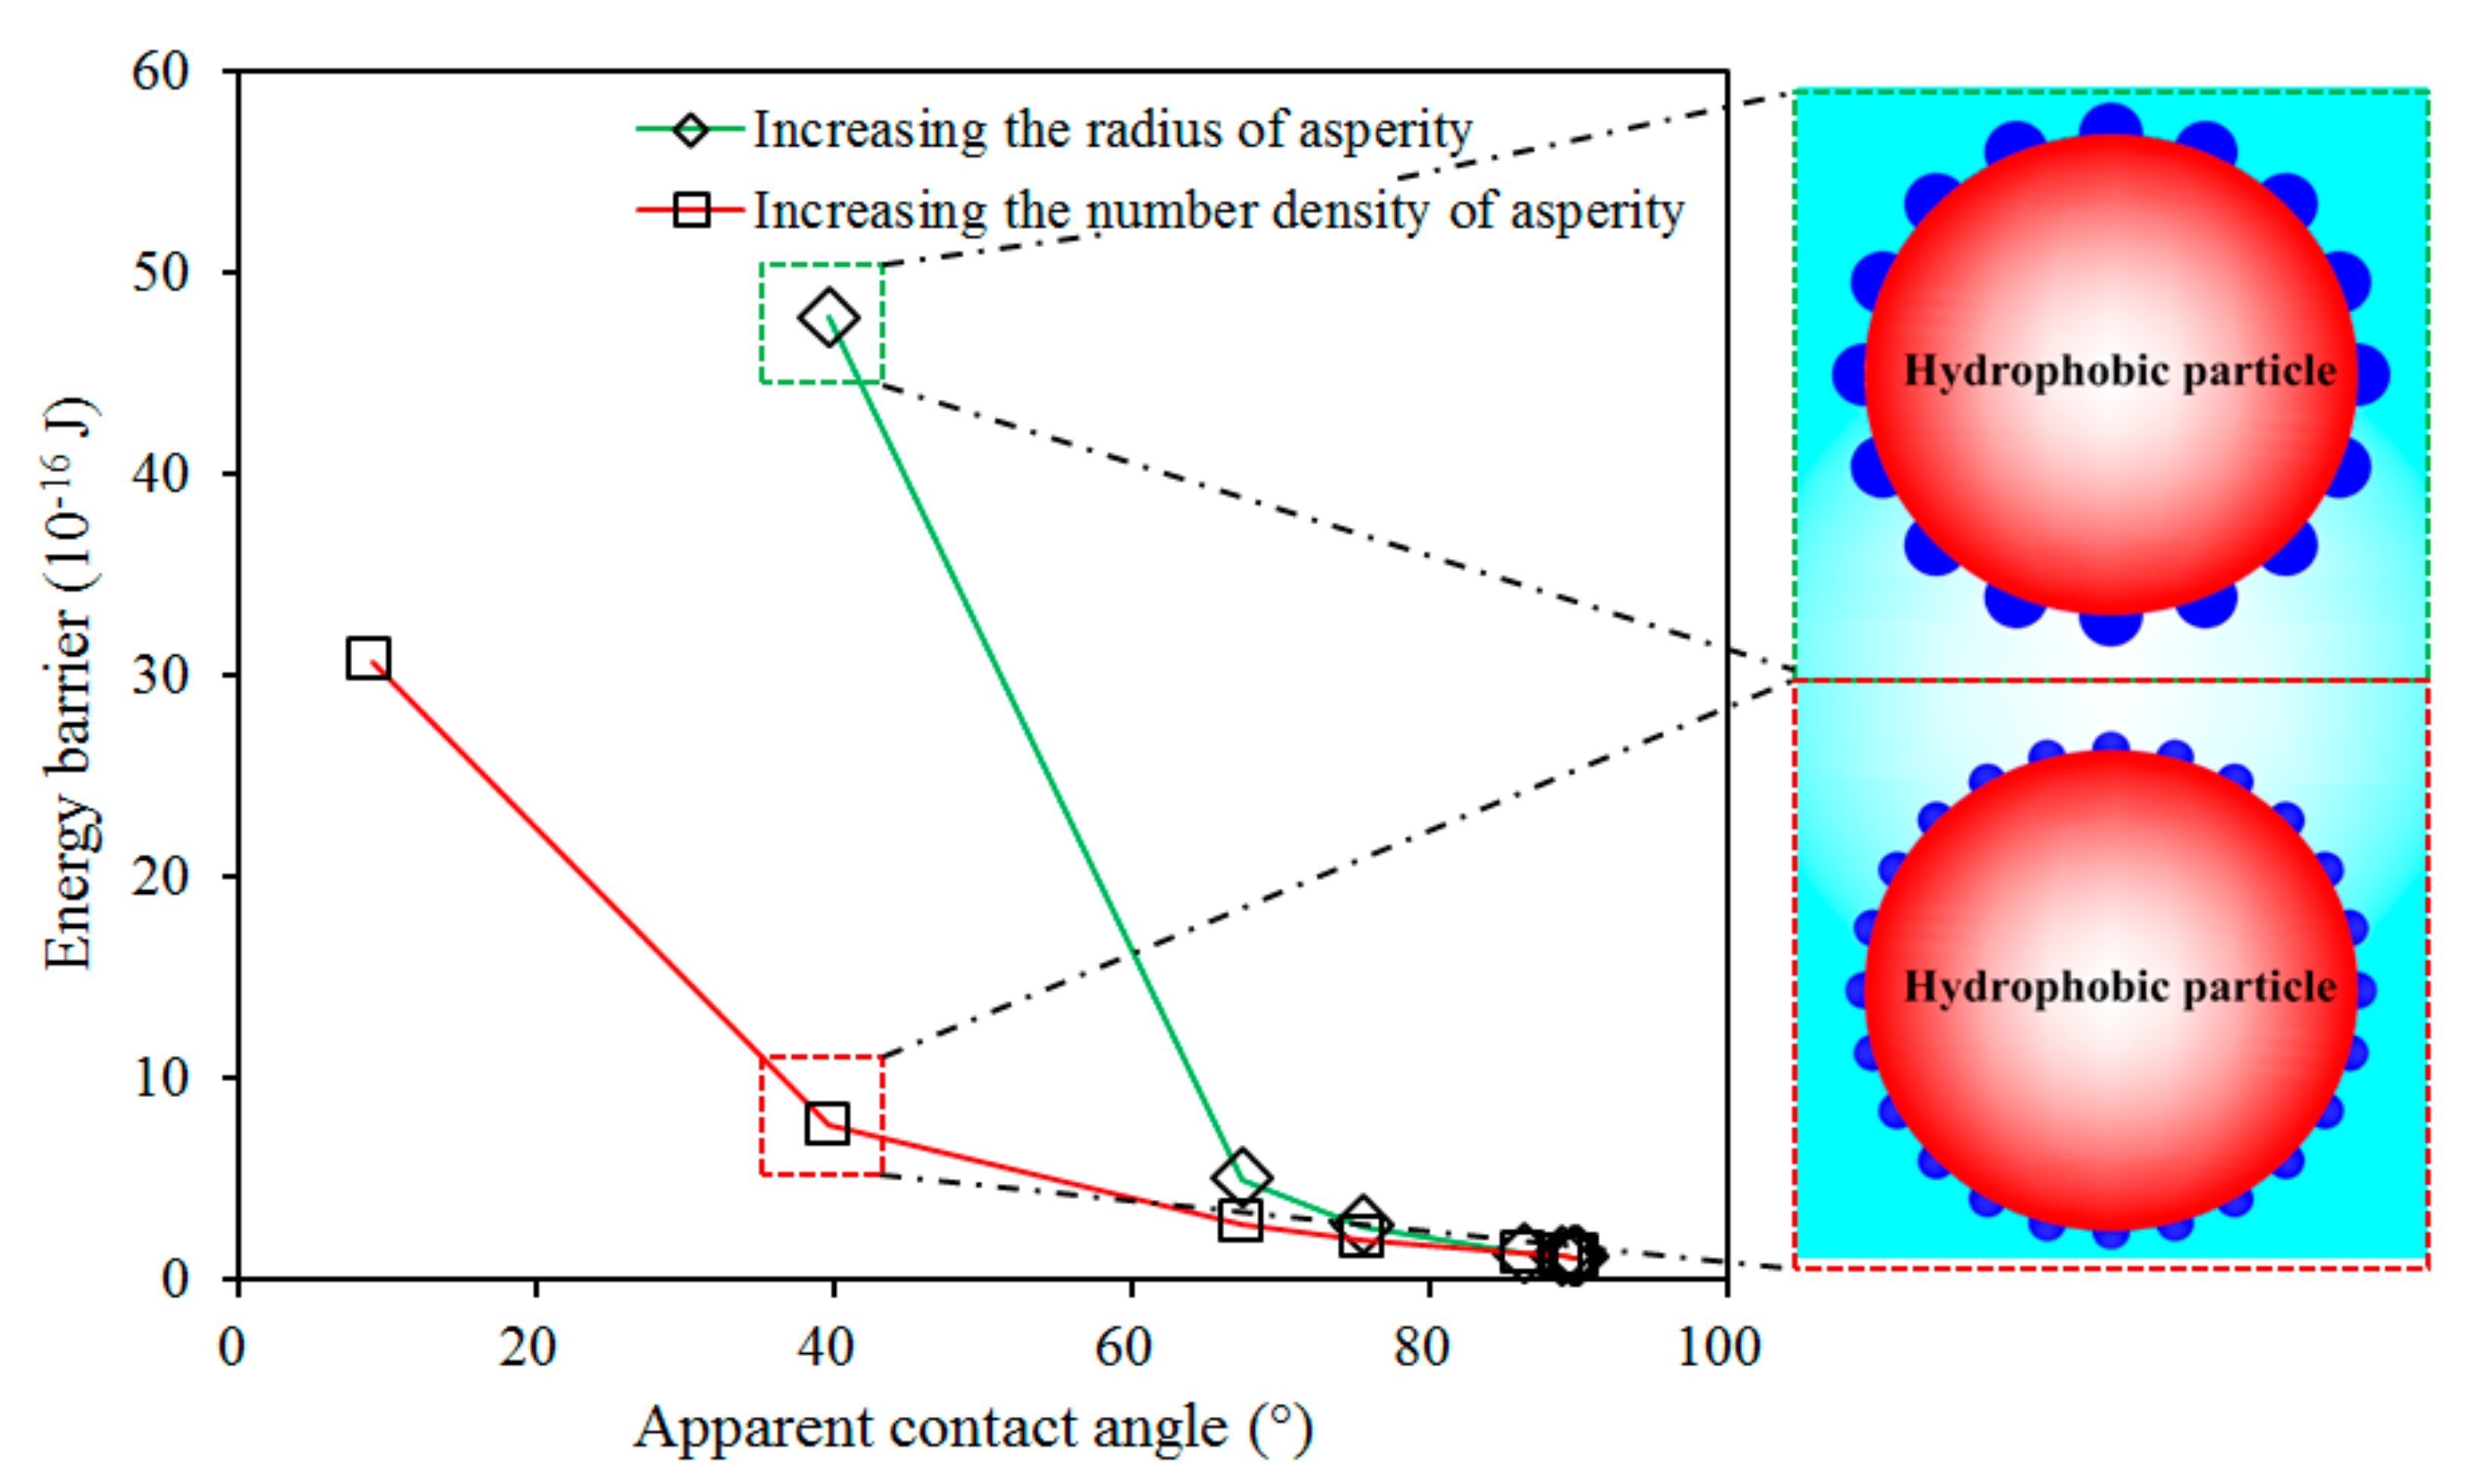
The energy barrier between a 200-μm-radius hydrophobic silica sphere covered with hydrophilic hemispherical asperities and an air bubble in 5 × 10⁻³ M NaCl solution is plotted as a function of apparent contact angle in Figure 8. It was found that the asperity radius significantly affected the attachment barrier. Thus, the depressant molecule length is the dominant parameter in designing a powerful depressant. However, the function mechanism of a depressant with a long molecule length is to create a strong electrostatic double-layer force. Further, the suppression of hydrophobic force is the second important factor in decreasing the bubble–particle attachment barrier.
4. Conclusions
In this work, the effect of a collector and a depressant on the bubble–particle attachment energy barrier was studied based on the extended DLVO theory. The collector-coated hydrophilic particle and the depressant-coated hydrophobic particle in a real flotation system were simplified to a sphere uniformly covered with respectively hydrophobic and hydrophilic nanometer-sized hemispherical asperities of identical radius. For the collector, the attachment barrier for a high hydrophobic asperity number density is always higher than that for the large asperity radius case under the same asperity coverage fraction. Increasing the hydrophobic part length in the collector molecule is a more effective way to enhance the flotation recovery compared to increasing the collector concentration. The role of the collector in bubble–particle attachment is to create an attractive hydrophobic force and thus overcome the repulsive van der Waals and electrostatic forces. For the depressant, the energy barrier for a high hydrophilic asperity number density is always lower than that for a large asperity radius case. The depressant molecule length is also a dominant parameter in designing a powerful depressant. However, the function mechanism of a depressant with a long molecule length is to create a strong electrostatic double-layer force. The suppression of the hydrophobic force plays a second role in decreasing the bubble–particle attachment barrier. The outcome of the present study not only provides a fundamental understanding of the effect of collectors and depressants on the surface forces between bubble and particle, but also provides guidance for the design of highly efficient flotation reagents.
Supplementary Materials
The following are available online at www.mdpi.com/2075-163X/7/11/223/s1, Figure S1: Potential curves between a 200-μm-radius hydrophilic silica sphere covered with hydrophobic hemispherical asperities with different radii and an air bubble in 5 × 10⁻³ M NaCl solution: (a) 0.5 nm; (b) 1 nm, Figure S2: Potential curves between a 200-μm-radius hydrophilic silica sphere covered with different number distribution densities of hydrophobic hemispherical asperities and an air bubble in 5 × 10⁻³ M NaCl solution: (a) 1.99 × 10¹⁴ m−2; (b) 7.96 × 10¹⁴ m−2, Figure S3: Potential curves between a 200-μm-radius hydrophobic silica sphere covered with hydrophilic hemispherical asperities with different radii and an air bubble in 5 × 10⁻³ M NaCl solution: (a) 0.5 nm; (b) 1 nm; (c) 2 nm; (d) 4 nm, Figure S4: Potential curves between a 200-μm-radius hydrophobic silica sphere covered with different number distribution densities of hydrophilic hemispherical asperities and an air bubble in 5 × 10⁻³ M NaCl solution: (a) 1.24 × 10¹³ m−2; (b) 4.98 × 10¹³ m−2; (c) 1.99 × 10¹⁴ m−2; (d) 7.96 × 10¹⁴ m−2.
Acknowledgments
This research was supported by the National Nature Science Foundation of China (grant Nos. 51774286, 51574236), a project funded by the China Postdoctoral Science Foundation (2015T80606, 2014M550317), for which the authors express their appreciation. Yaowen Xing also appreciates the China Scholarship Council for the financial support for his research stay at Max Planck Institute for Polymer Research.
Author Contributions
Y.X. and G.X. conceived and designed the experiments; Y.X., Y.C., and F.K. analyzed the data; Y.X. wrote the paper.
Conflicts of Interest
The authors declare no conflict of interest.
References
- Nguyen, A.V.; Schulze, H.J. Colloidal Science of Flotation; Marcel Dekker Inc.: New York, NY, USA, 2004. [Google Scholar]
- Fuerstenau, M.C.; Jameson, G.J.; Yoon, R.H. Froth Flotation: A Century of Innovation; SME: Dearborn, MI, USA, 2007. [Google Scholar]
- Nguyen, A.V. Froth Flotation. In Reference Module in Chemistry, Molecular Sciences and Chemical Engineering; Elsevier: Amsterdam, The Netherlands, 2013; pp. 1–26. [Google Scholar]
- Yoon, R.H. The role of hydrodynamic and surface forces in bubble-particle interaction. Int. J. Miner. Process. 2000, 58, 129–143. [Google Scholar] [CrossRef]
- Fan, X.; Zhang, Z.; Li, G.; Rowson, N.A. Attachment of solid particles to air bubbles in surfactant-free aqueous solutions. Chem. Eng. Sci. 2004, 59, 2639–2645. [Google Scholar] [CrossRef]
- Xing, Y.; Gui, X.; Pan, L.; Pinchasik, B.E.; Cao, Y.; Liu, J.; Kappl, M.; Butt, H.J. Recent experimental advances for understanding bubble-particle attachment in flotation. Adv. Colloid Interface Sci. 2017, 246, 105–132. [Google Scholar] [CrossRef] [PubMed]
- Xing, Y.; Gui, X.; Cao, Y. The hydrophobic force for bubble-particle attachment in flotation-a brief review. Phys. Chem. Chem. Phys. 2017. [Google Scholar] [CrossRef] [PubMed]
- Pan, L.; Jung, S.; Yoon, R.H. Effect of hydrophobicity on the stability of the wetting films of water formed on gold surfaces. J. Colloid Interface Sci. 2011, 361, 321–330. [Google Scholar] [CrossRef] [PubMed]
- Pan, L.; Jung, S.; Yoon, R.H. A fundamental study on the role of collector in the kinetics of bubble-particle interaction. Int. J. Miner. Process. 2012, 106, 37–41. [Google Scholar] [CrossRef]
- Kor, M.; Korczyk, P.M.; Addai-Mensah, J.; Krasowska, M.; Beattie, D.A. Carboxymethylcellulose adsorption on molybdenite: The effect of electrolyte composition on adsorption, bubble–surface collisions, and flotation. Langmuir 2014, 30, 11975–11984. [Google Scholar] [CrossRef] [PubMed]
- Xie, L.; Wang, J.; Yuan, D.; Shi, C.; Cui, X.; Zhang, H.; Liu, Q.; Zeng, H. Interaction mechanisms between air bubble and molybdenite surface: Impact of solution salinity and polymer adsorption. Langmuir 2017, 33, 2353–2361. [Google Scholar] [CrossRef] [PubMed]
- Yang, S.; Pelton, R.; Raegen, A.; Montgomery, M.; Dalnoki-Veress, K. Nanoparticle flotation collectors: Mechanisms behind a new technology. Langmuir 2011, 27, 10438–10446. [Google Scholar] [CrossRef] [PubMed]
- Yang, S.; Pelton, R. Nanoparticle flotation collectors II: The role of nanoparticle hydrophobicity. Langmuir 2011, 27, 11409–11415. [Google Scholar] [CrossRef] [PubMed]
- Yang, S.; Pelton, R.; Montgomery, M.; Cui, Y. Nanoparticle flotation collectors III: The role of nanoparticle diameter. ACS Appl. Mater. Interfaces 2012, 4, 4882–4890. [Google Scholar] [CrossRef] [PubMed]
- Albijanic, B.; Ozdemir, O.; Nguyen, A.V.; Bradshaw, D. A review of induction and attachment times of wetting thin films between air bubbles and particles and its relevance in the separation of particles by flotation. Adv. Colloid Interface Sci. 2010, 159, 1–21. [Google Scholar] [CrossRef] [PubMed]
- Chau, T.; Bruckard, W.; Koh, P.; Nguyen, A. A review of factors that affect contact angle and implications for flotation practice. Adv. Colloid Interface Sci. 2009, 150, 106–115. [Google Scholar] [CrossRef] [PubMed]
- Israelachvili, J.N. Intermolecular and Surface Forces, 3rd ed.; Elsevier Pte Ltd.: Atlanta, GA, USA, 2012. [Google Scholar]
- Butt, H.J.; Kappl, M. Surface and Interfacial Forces; WILEY-VCH: Weinheim, Germany, 2010. [Google Scholar]
- Ralston, J.; Dukhin, S. The interaction between particles and bubbles. Colloids Surf. A 1999, 151, 3–14. [Google Scholar] [CrossRef]
- Laskowski, J.K.; Kitchener, J.A. The hydrophilic-hydrophobic transition on silica. J. Colloid Interface Sci. 1969, 29, 670–679. [Google Scholar] [CrossRef]
- Blake, T.D.; Kitchener, J.A. Stability of aqueous films on hydrophobic methylated silica. J. Chem. Soc. Faraday Trans. 1 1972, 68, 1435–1442. [Google Scholar] [CrossRef]
- Israelachvili, J.; Pashley, R. The hydrophobic interaction is long range, decaying exponentially with distance. Nature 1982, 300, 341–342. [Google Scholar] [CrossRef] [PubMed]
- Claesson, P.M.; Ederth, T.; Bergeron, V.; Rutland, M.W. Techniques for measuring surface forces. Adv. Colloid Interface Sci. 1996, 67, 119–183. [Google Scholar] [CrossRef]
- Meyer, E.E.; Rosenberg, K.J.; Israelachvili, J. Recent progress in understanding hydrophobic interactions. Proc. Natl. Acad. Sci. USA 2006, 103, 15739–15746. [Google Scholar] [CrossRef] [PubMed]
- Drelich, J.W.; Bowen, P.K. Hydrophobic nano-asperities in control of energy barrier during particle–surface interactions. Surf. Innov. 2015, 3, 164–171. [Google Scholar] [CrossRef]
- Suresh, L.; Walz, J.Y. Effect of surface roughness on the interaction energy between a colloidal sphere and a flat plate. J. Colloid Interface Sci. 1996, 183, 199–213. [Google Scholar] [CrossRef]
- Walz, J.Y. The effect of surface heterogeneities on colloidal forces. Adv. Colloid Interface Sci. 1998, 74, 119–168. [Google Scholar] [CrossRef]
- Tabor, R.F.; Manica, R.; Chan, D.Y.; Grieser, F.; Dagastine, R.R. Repulsive van der Waals forces in soft matter: Why bubbles do not stick to walls. Phys. Rev. Lett. 2011, 106, 064501. [Google Scholar] [CrossRef] [PubMed]
- Takahashi, M. ζ potential of microbubbles in aqueous solutions: Electrical properties of the gas−water interface. J. Phys. Chem. B 2005, 109, 21858–21864. [Google Scholar] [CrossRef] [PubMed]
- Elmahdy, A.; Mirnezami, M.; Finch, J. Zeta potential of air bubbles in presence of frothers. Int. J. Miner. Process. 2008, 89, 40–43. [Google Scholar] [CrossRef]
- Yang, C.; Dabros, T.; Li, D.; Czarnecki, J.; Masliyah, J.H. Measurement of the zeta potential of gas bubbles in aqueous solutions by microelectrophoresis method. J. Colloid Interface Sci. 2001, 243, 128–135. [Google Scholar] [CrossRef]
- Ducker, W.A.; Senden, T.J.; Pashley, R.M. Measurement of forces in liquids using a force microscope. Langmuir 1992, 8, 1831–1836. [Google Scholar] [CrossRef]
- Gu, Y.; Li, D. The ζ-potential of glass surface in contact with aqueous solutions. J. Colloid Interface Sci. 2000, 226, 328–339. [Google Scholar] [CrossRef]
- Shi, C.; Cui, X.; Xie, L.; Liu, Q.X.; Chan, D.Y.C.; Israelachvili, J.N.; Zeng, H.B. Measuring forces and spatiotemporal evolution of thin water films between an air bubble and solid surfaces of different hydrophobicity. ACS Nano 2015, 9, 95–104. [Google Scholar] [CrossRef] [PubMed]
- Cui, X.; Shi, C.; Xie, L.; Liu, J.; Zeng, H. Probing interactions between air bubble and hydrophobic polymer surface: Impact of solution salinity and interfacial nanobubbles. Langmuir 2016, 32, 11236–11244. [Google Scholar] [CrossRef] [PubMed]
- Donaldson, S.H.; Royne, A.; Kristiansen, K.; Rapp, M.V.; Das, S.; Gebbie, M.A.; Lee, D.W.; Stock, P.; Valtiner, M.; Israelachvili, J. Developing a general interaction potential for hydrophobic and hydrophilic interactions. Langmuir 2015, 31, 2051–2064. [Google Scholar] [CrossRef] [PubMed]
- Cassie, A.; Baxter, S. Wettability of porous surfaces. Trans. Faraday Soc. 1944, 40, 546–551. [Google Scholar] [CrossRef]
Figure 1.
Schematic of the simplification of collector-coated-hydrophilic-sphere–bubble interaction and depressant-coated-hydrophobic-sphere–bubble interaction. The red hemispherical asperities and blue hemispherical asperities represent hydrophobic and hydrophilic, respectively. R is the radius of the hydrophilic or hydrophobic particle, r is the radius of hemispherical asperity, and h is the distance between hydrophilic or hydrophobic particle and air bubble surface.
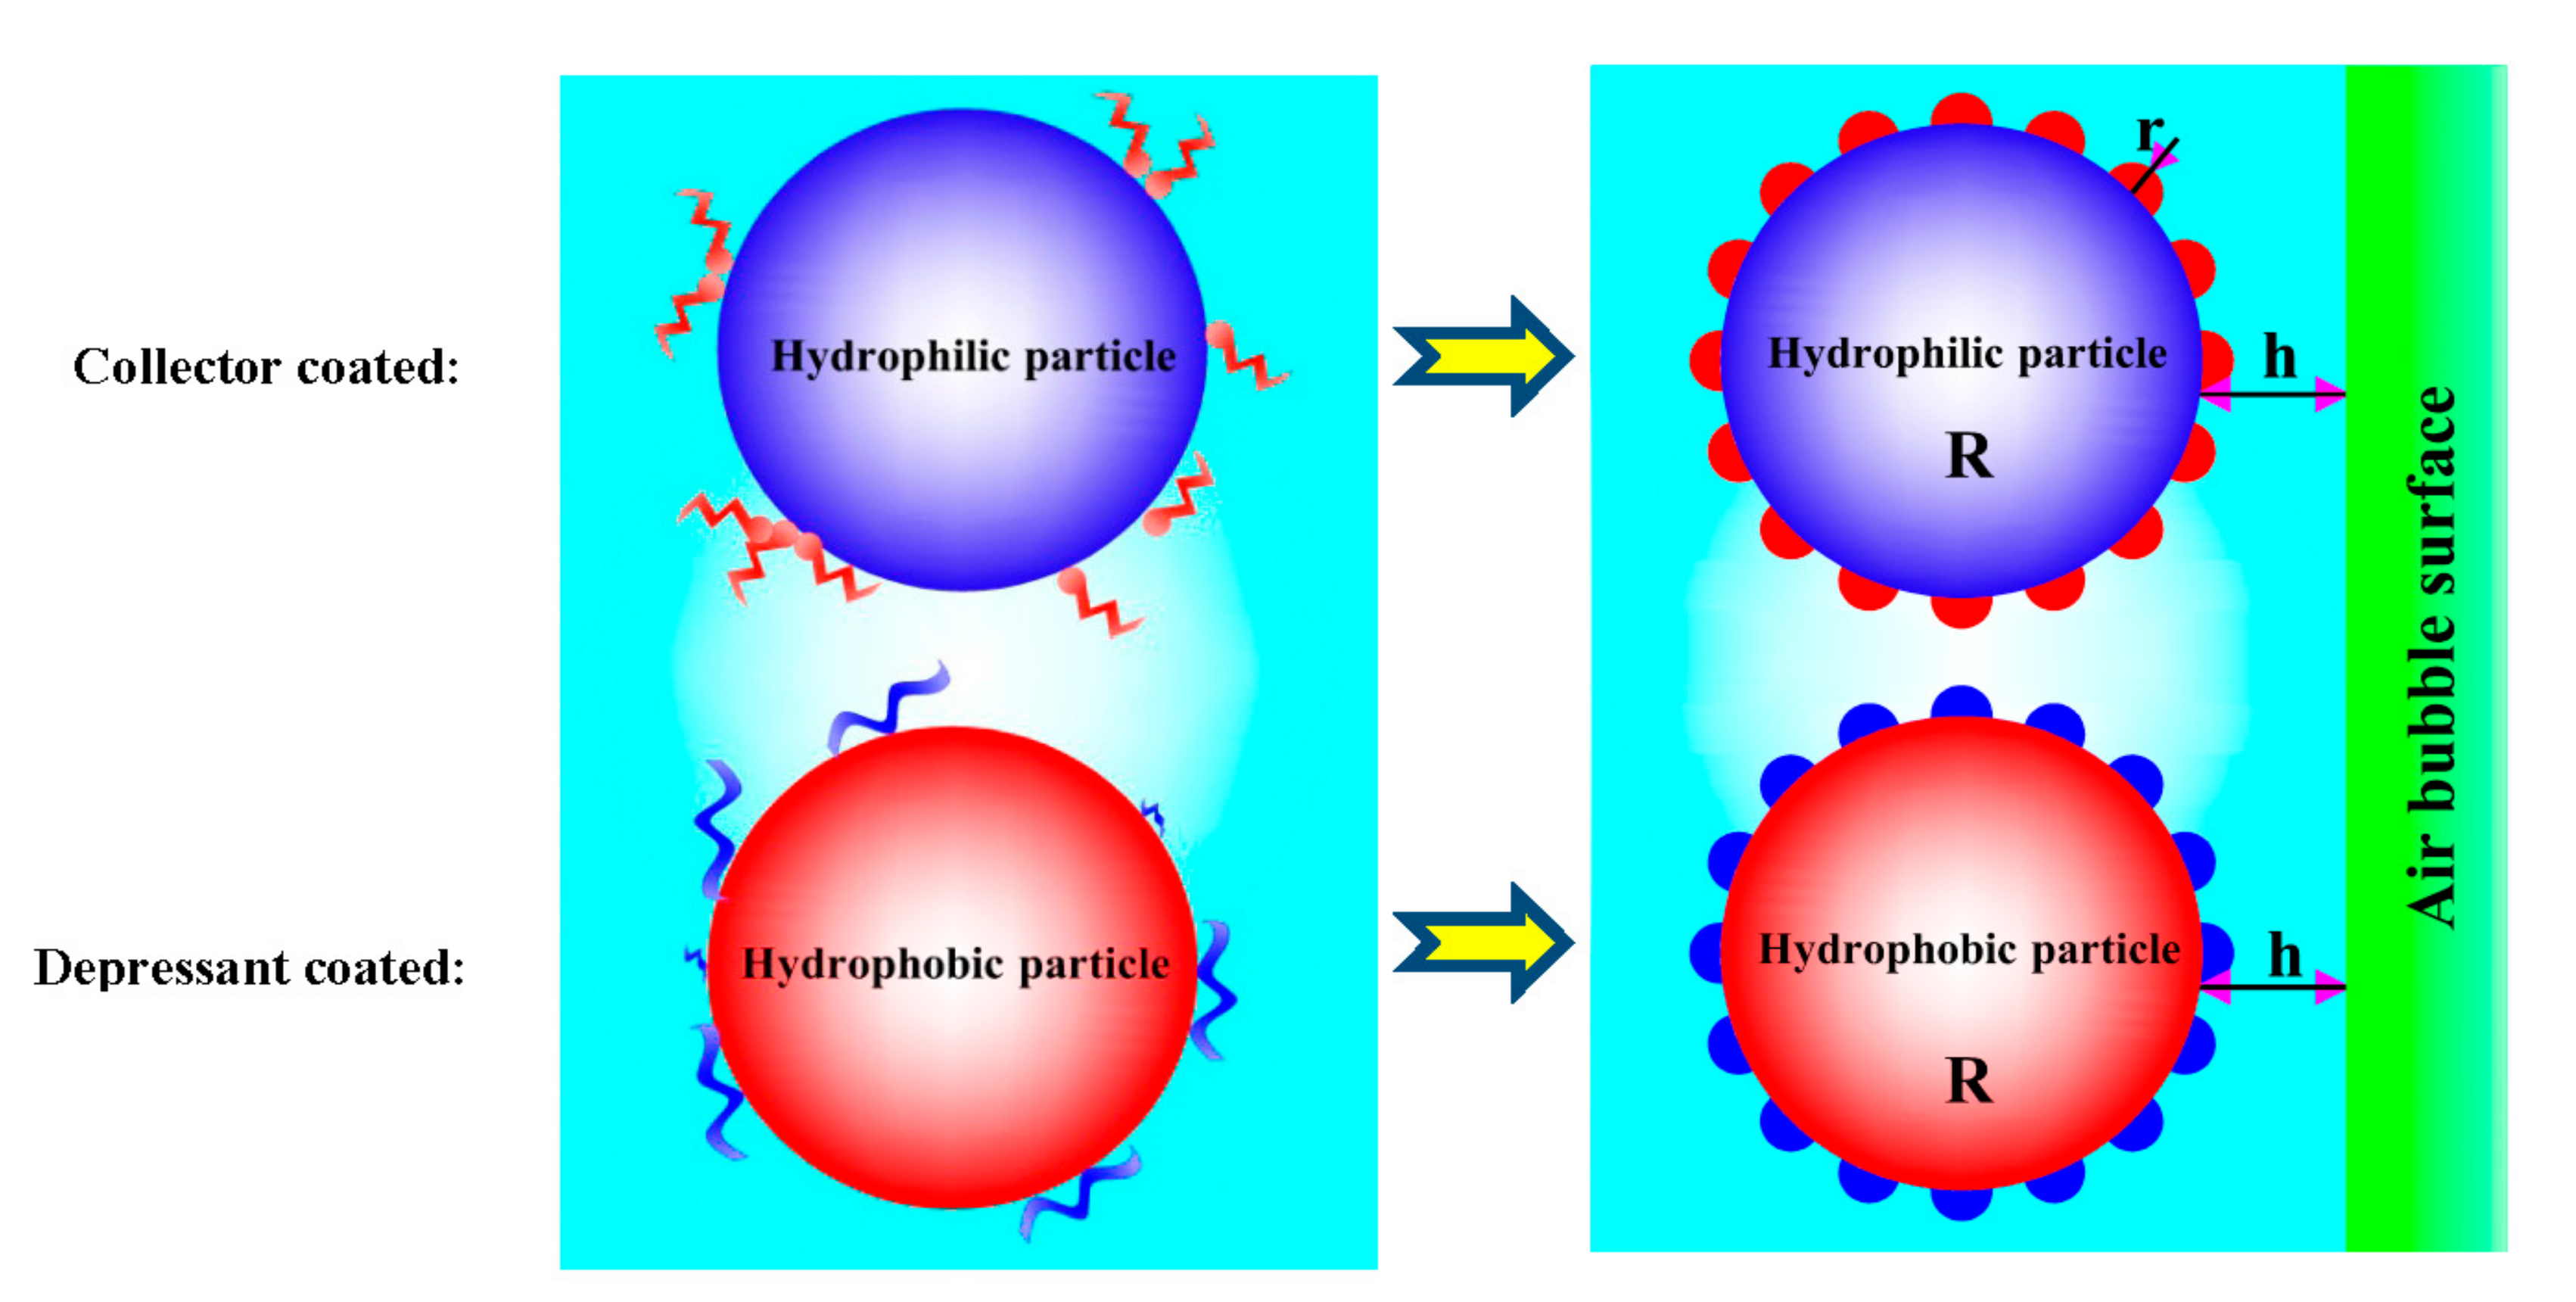
Figure 2.
Potential curves between a smooth 200-μm-radius silica sphere and an air bubble in 5 × 10⁻³ M NaCl solution: (A) Hydrophilic silica (0°); (B) Hydrophobic silica (90°). Surface potentials of the air bubble and silica are −35 mV. The decay length of hydrophobic force is 1.5 nm.
Figure 2.
Potential curves between a smooth 200-μm-radius silica sphere and an air bubble in 5 × 10⁻³ M NaCl solution: (A) Hydrophilic silica (0°); (B) Hydrophobic silica (90°). Surface potentials of the air bubble and silica are −35 mV. The decay length of hydrophobic force is 1.5 nm.
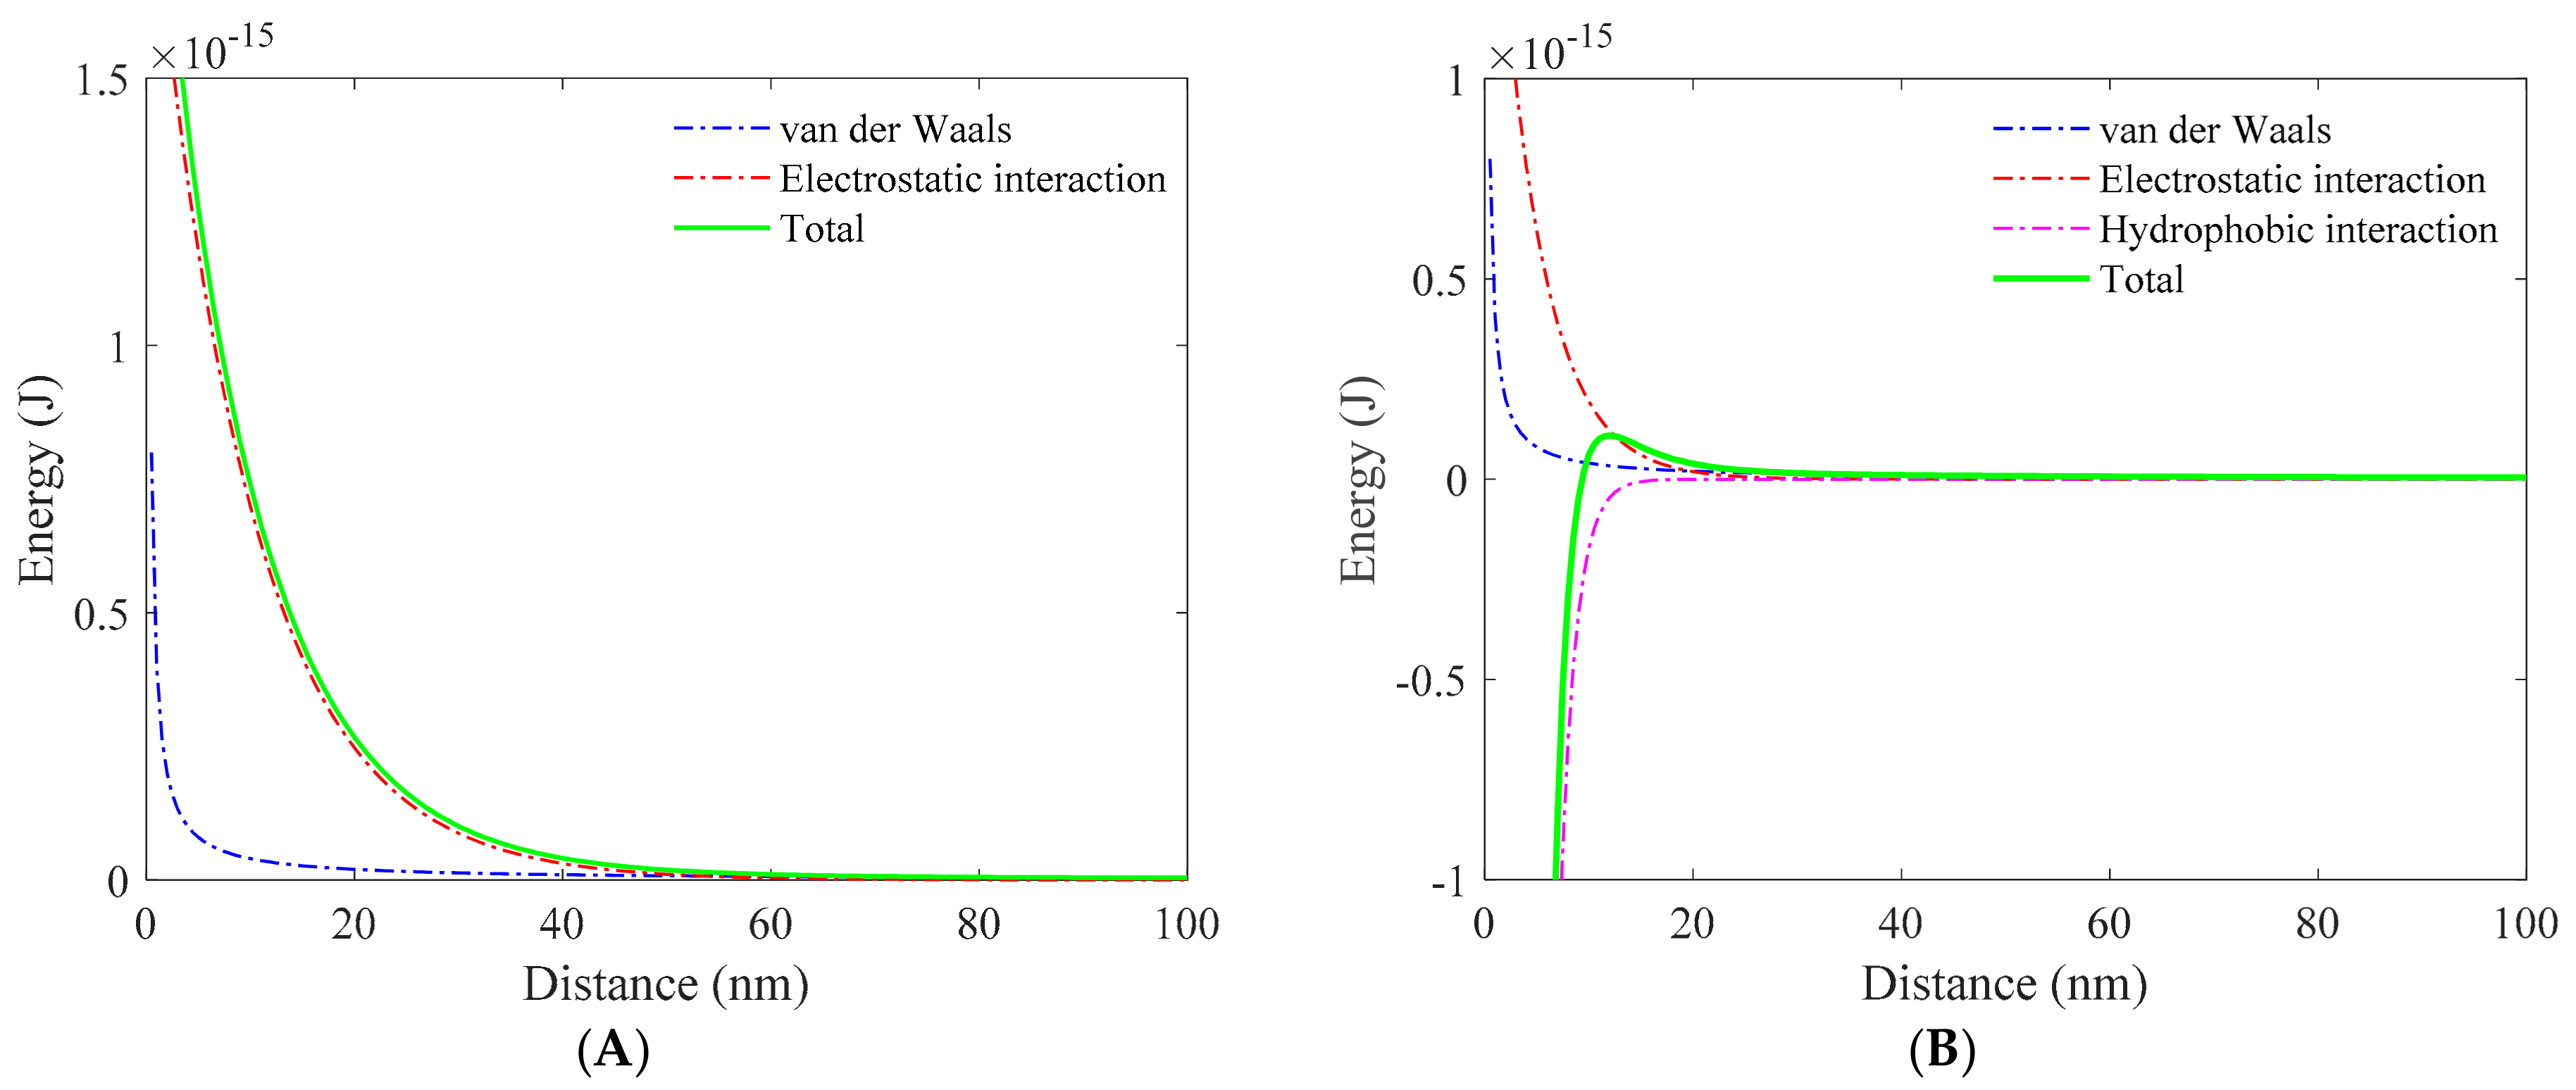
Figure 3.
Potential curves between a 200-μm-radius hydrophilic silica sphere covered with hydrophobic hemispherical asperities with different radii and an air bubble in 5 × 10⁻³ M NaCl solution: (A) 2 nm; (B) 4 nm; (C) 8 nm; (D) 10 nm. The corresponding surface coverage fractions, , are 1%, 4%, 16%, and 25%, respectively. The number distribution density of asperity, n, is fixed at 7.96 × 10¹⁴ m−2. Surface potentials of the air bubble and silica are −35 mV. The decay length of hydrophobic force is 1.5 nm.

Figure 4.
Potential curves between a 200-μm-radius hydrophilic silica sphere covered with different number distribution densities of hydrophobic hemispherical asperities and an air bubble in 5 × 10⁻³ M NaCl solution: (A) 3.18 × 10¹⁵ m−2; (B) 1.27 × 10¹⁶ m−2; (C) 5.09 × 10¹⁶ m−2; (D) 7.96 × 10¹⁶ m−2. The corresponding surface coverage fractions, , are 1%, 4%, 16%, and 25%, respectively. The radius of asperity, r, is fixed at 1 nm. Surface potentials of the air bubble and silica are −35 mV. The decay length of hydrophobic force is 1.5 nm.


Figure 5.
Plot of energy barrier between a 200-μm-radius hydrophilic silica sphere covered with hydrophobic hemispherical asperities and an air bubble in 5 × 10⁻³ M NaCl solution as a function of apparent contact angle. The number distribution density of asperity, n, is fixed at 7.96 × 10¹⁴ m−2 when increasing the radius of asperity. The radius of asperity, r, is fixed at 1 nm when increasing the number density. The insets show the asperity distribution states at the point framed by dashed boxes. Surface potentials of the air bubble and silica are −35 mV. The decay length of hydrophobic force is 1.5 nm.
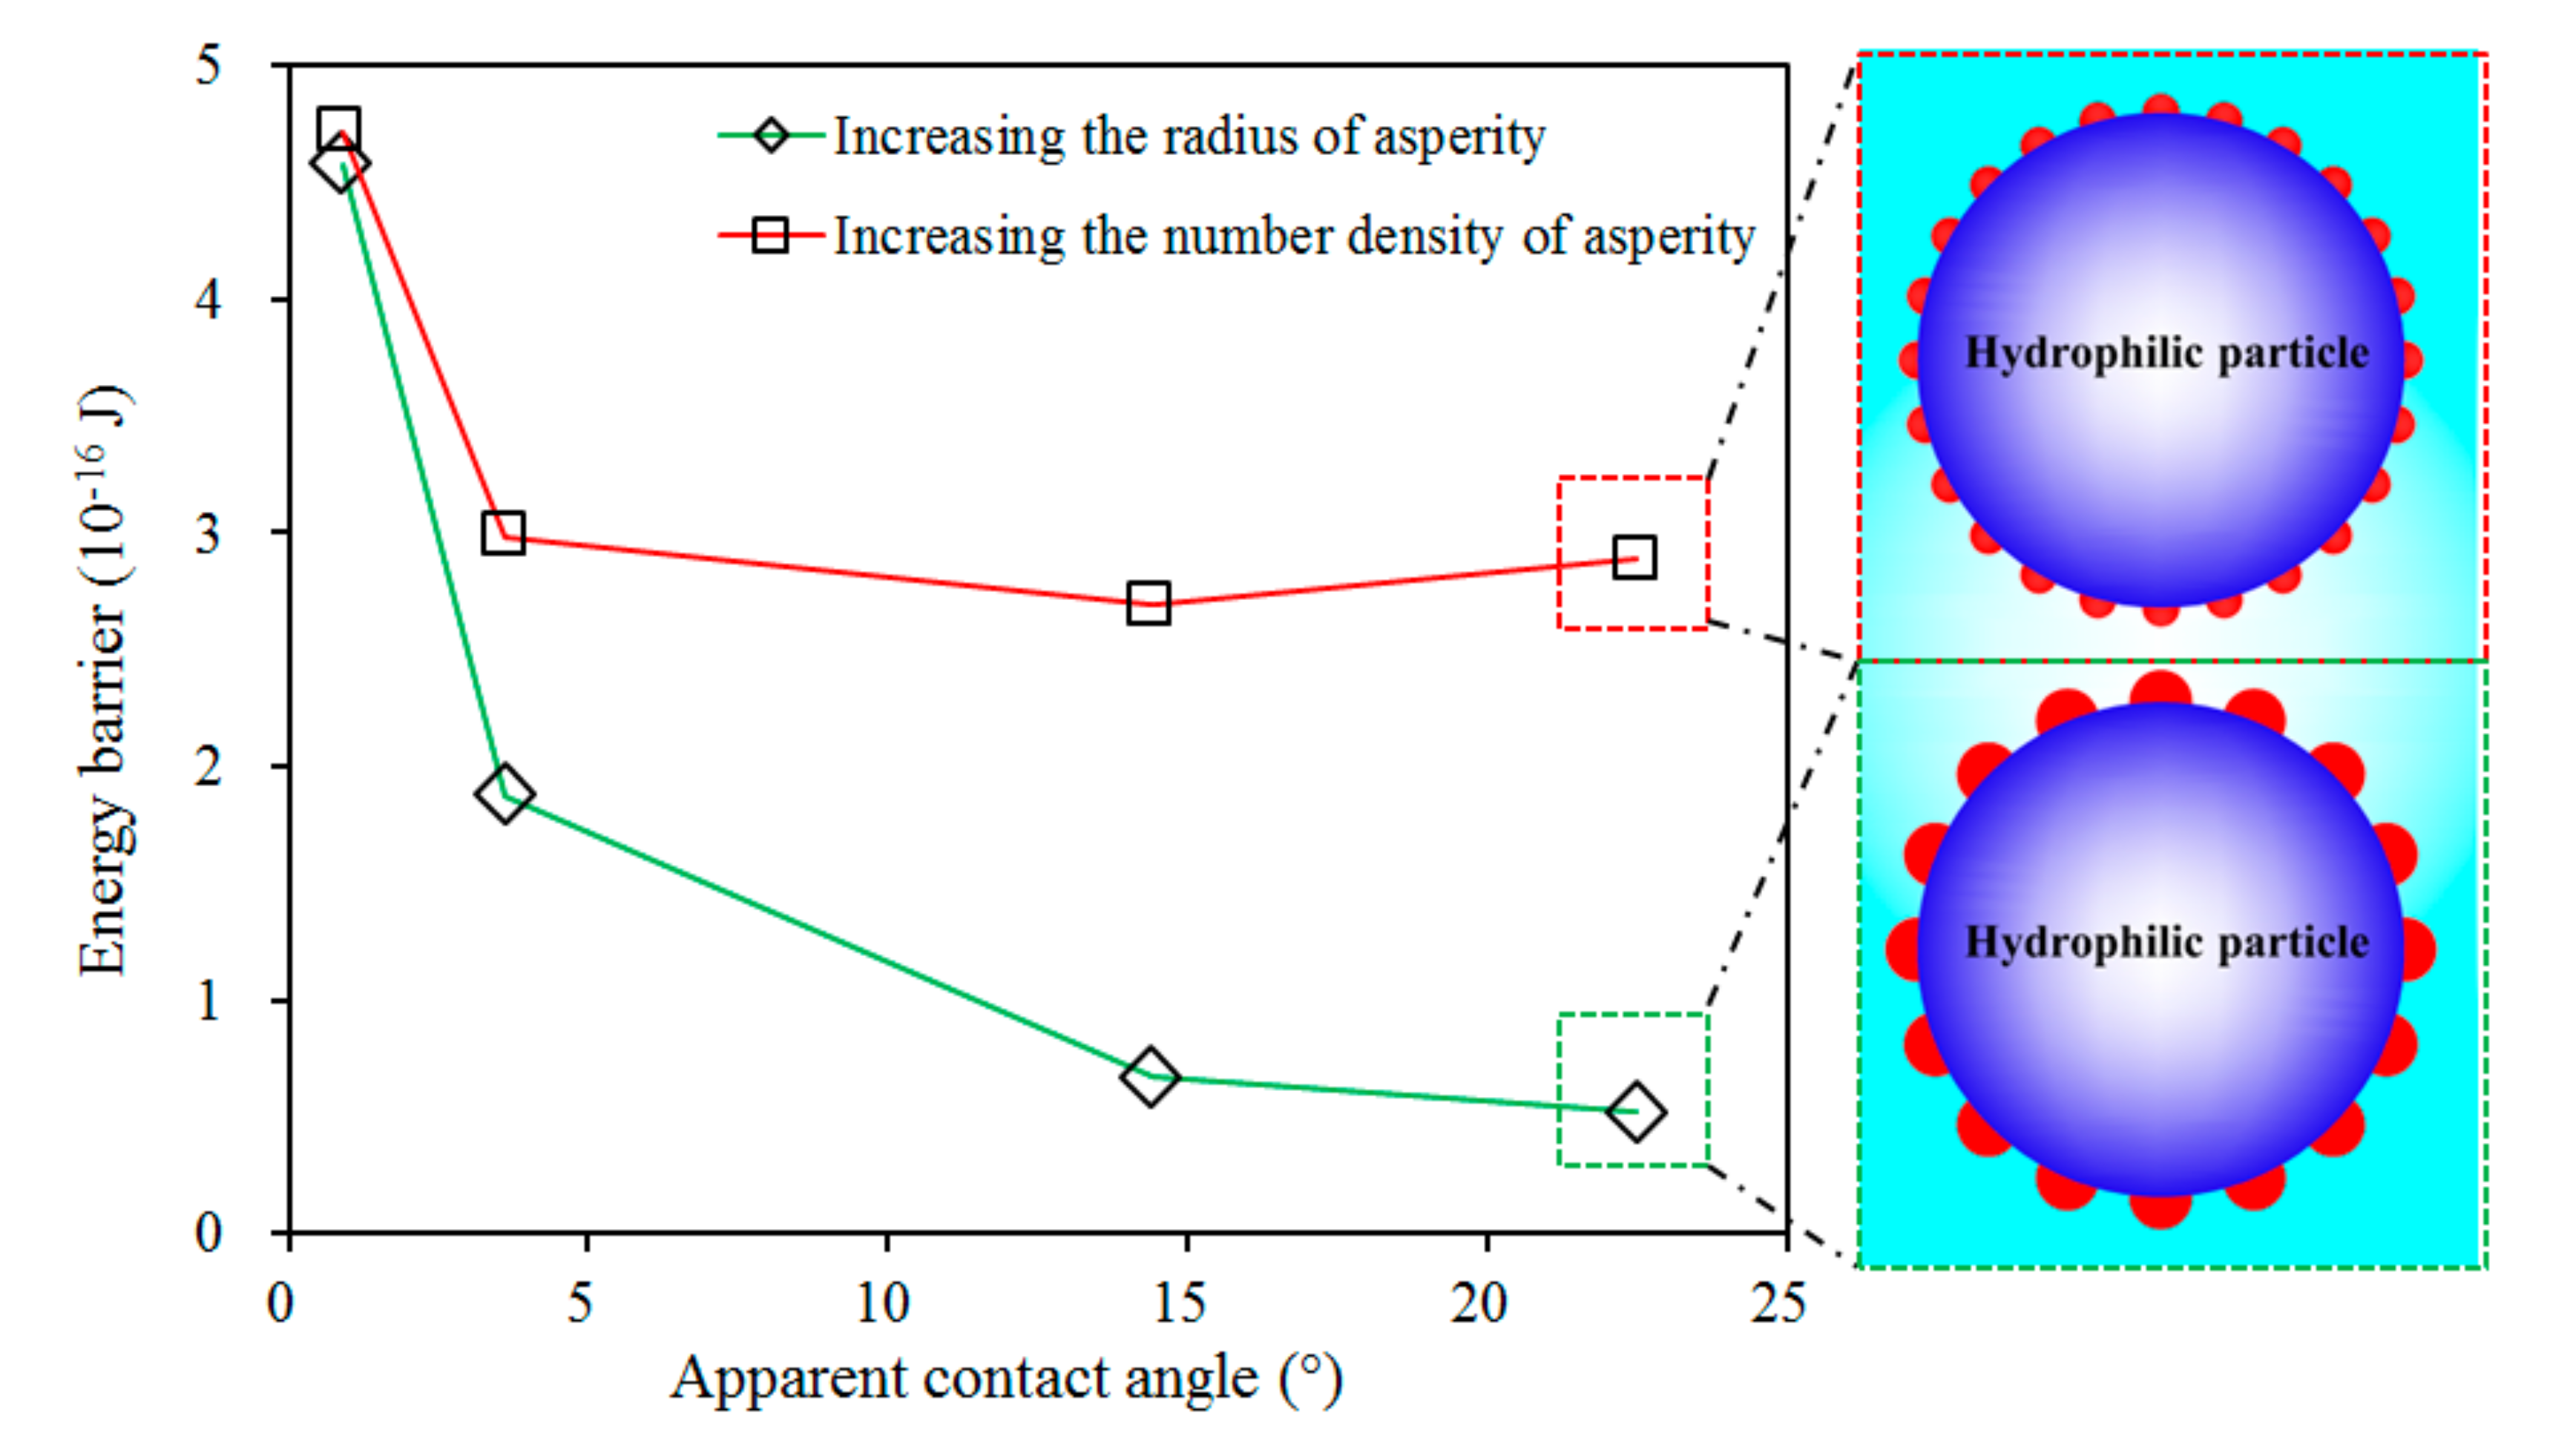
Figure 6.
Potential curves between a 200-μm-radius hydrophobic silica sphere covered with hydrophilic hemispherical asperities with different radii and an air bubble in 5 × 10⁻³ M NaCl solution: (A) 8 nm; (B) 10 nm; (C) 15 nm; (D) 19 nm. The corresponding surface coverage fractions, , are 16%, 25%, 56%, and 90%, respectively. The number distribution density of asperity, n, is fixed at 7.96 × 10¹⁴ m−2. Surface potentials of the air bubble and silica are −35 mV. The decay length of hydrophobic force is 1.5 nm.


Figure 7.
Potential curves between a 200-μm-radius hydrophobic silica sphere covered with different number distribution densities of hydrophilic hemispherical asperities and an air bubble in 5 × 10⁻³ M NaCl solution: (A) 3.18 × 10¹⁵ m−2; (B) 4.98 × 10¹⁵ m−2; (C) 1.11 × 10¹⁶ m−2; (D) 1.79 × 10¹⁶ m−2. The corresponding surface coverage fractions, , are 16%, 25%, 56%, and 90%, respectively. The radius of asperity, r, is fixed at 4 nm. Surface potentials of the air bubble and silica are −35 mV. The decay length of hydrophobic force is 1.5 nm.


Figure 8.
Plot of energy barrier between a 200-μm-radius hydrophobic silica sphere covered with hydrophilic hemispherical asperities and an air bubble in 5 × 10⁻³ M NaCl solution as a function of apparent contact angle. The number distribution density of asperity, n, is fixed at 7.96 × 10¹⁴ m−2 when increasing the radius of asperity. The radius of asperity, r, is fixed at 4 nm when increasing the number density. The insets show the asperity distribution states at the point indicated by the dashed boxes. Surface potentials of the air bubble and silica are −35 mV. The decay length of hydrophobic force is 1.5 nm.
© 2017 by the authors. Licensee MDPI, Basel, Switzerland. This article is an open access article distributed under the terms and conditions of the Creative Commons Attribution (CC BY) license (http://creativecommons.org/licenses/by/4.0/).
Share and Cite
MDPI and ACS Style
Xing, Y.; Gui, X.; Karakas, F.; Cao, Y. Role of Collectors and Depressants in Mineral Flotation: A Theoretical Analysis Based on Extended DLVO Theory. Minerals 2017, 7, 223. https://doi.org/10.3390/min7110223
AMA Style
Xing Y, Gui X, Karakas F, Cao Y. Role of Collectors and Depressants in Mineral Flotation: A Theoretical Analysis Based on Extended DLVO Theory. Minerals. 2017; 7(11):223. https://doi.org/10.3390/min7110223
Chicago/Turabian StyleXing, Yaowen, Xiahui Gui, Fırat Karakas, and Yijun Cao. 2017. "Role of Collectors and Depressants in Mineral Flotation: A Theoretical Analysis Based on Extended DLVO Theory" Minerals 7, no. 11: 223. https://doi.org/10.3390/min7110223
Note that from the first issue of 2016, this journal uses article numbers instead of page numbers. See further details here.