Article

Cost-Factor Recognition and Recommendation in Open-Pit Coal Mining via BERT-BiLSTM-CRF and Knowledge Graphs

1
School of Geology and Mining Engineering, Xinjiang University, Urumqi 830047, China
2
Hongda Blasting Engineering Group Co., Ltd., Changsha 410011, China
3
School of Management, Hunan University of Information Technology, Changsha 110819, China
4
Xinjiang Green Blasting Engineering Technology Research Center, Changji 831100, China
*
Authors to whom correspondence should be addressed.
Symmetry 2025, 17(11), 1834; https://doi.org/10.3390/sym17111834 (registering DOI)
Submission received: 9 October 2025 / Revised: 26 October 2025 / Accepted: 29 October 2025 / Published: 2 November 2025
(This article belongs to the Section Computer)

Abstract

Complex associations among production cost factors, multi-source cost information silos, and opaque transmission mechanisms of hidden costs in open-pit coal mining were addressed. The production process—including drilling, blasting, excavation, transportation, and dumping—was taken as the application context. A corpus of 103 open-pit coal mining standards and related research documents was constructed. Eleven entity types and twelve relationship types were defined. Dynamic word vectors were obtained through transformer (BERT) pre-training. The optimal entity tag sequence was labeled using a bidirectional long short-term memory–conditional random field (BiLSTM–CRF) 9 model. A total of 3995 entities and 6035 relationships were identified, forming a symmetry-aware knowledge graph for open-pit coal mining costs based on the BERT–BiLSTM–CRF model. The results showed that, among nine entity types, including Parameters, the F1-scores all exceeded 60%, indicating more accurate entity recognition compared to conventional methods. Knowledge embedding was performed using the TransH inference algorithm, which outperformed traditional models in all reasoning metrics, with a Hits@10 of 0.636. This verifies its strong capability in capturing complex causal paths among cost factors, making it suitable for practical cost optimization. On this basis, a symmetry-aware BERT–BiLSTM–CRF knowledge graph of open-pit coal mining costs was constructed. Knowledge embedding was then performed with the TransH inference algorithm, and latent relationships among cost factors were mined. Finally, a knowledge-graph-based cost factor identification system was developed. The system lists, for each cost item, the influencing factors and their importance ranking, analyzes variations in relevant factors, and provides decision support.

1. Introduction

In recent years, with the advancement of intelligent technologies in open-pit coal mining, the range and complexity of cost-influencing factors have continually increased [1]. Production costs now account for a substantial portion of overall enterprise operating expenses [2]. Traditional cost identification methods often rely on a coarse classification of labor, materials, and equipment, which limits the granularity of cost elements and reduces the effectiveness of control measures [3]. As research has progressed, scholars have introduced various analytical methods to identify implicit influencing factors. These include factor analysis, clustering analysis for the automatic classification of cost items, and the analytic hierarchy process (AHP) for establishing factor prioritization [4,5,6]. However, these methods face high computational costs and lack clarity in inter-factor relationships. The complexity of the knowledge system further limits accurate cost decisions in open-pit coal mining.
The purpose of the knowledge graph [7] is to identify inherent entities from unstructured text. Collins et al. [8] relied on manual rules to improve entity classification efficiency, but their static features struggle to adapt to dynamic contexts. It was not until the breakthrough of Pre-Trained Language Models (PTMs) [9]. In particular, BERT is employed, where masked language modeling (MLM) and the bidirectional Transformer attention mechanism are used to produce dynamic semantic representations. With these advances, named entity recognition entered a new “pre-training + fine-tuning” paradigm [10]. Santoso et al. [11] validated the applicability of BiLSTM for the low-resource language, Indonesian. Baidu [12] combined CRF for labeling and analyzing sequence data, constructing BiLSTM-CRF to significantly reduce the dependence on word vectors. Latest research studies have extended NER to coal-related materials and construction safety using semi-supervised learning and BiLSTM-based deep models, yet their lack of graph-based inference limits cost factor reasoning in structured mining scenarios [13,14].
The pre-training–fine-tuning paradigm of pretrained models (PTMs) has demonstrated strong adaptability across multiple scenarios—equipment maintenance, disaster prevention, and safety management—within the coal-mining domain. Jin J [15] combined the CNN-LSTM model to infer fault patterns from sensor data of mining machines, hydraulic supports, and other equipment. Pan Lihu [16] constructed an ontology-driven knowledge graph to support device–personnel relationship queries. Liu et al. [17] integrated knowledge graphs with the DQN algorithm to dynamically generate rescue paths and resource scheduling plans for incidents such as collapses and fires. Xu et al. [18] were the first to apply BERT-BiLSTM-CRF to construct a coal mine safety knowledge graph, integrating scattered expertise and improving risk prevention intelligence through pre-training methods. However, existing research focuses on the equipment and safety dimensions, and there is still a lack of a structured knowledge system in the open-pit coal mining cost field.
In practical applications, merely summarizing comprehensive cost influencing factors is still insufficient for making precise decisions on specific cost factors that need to be controlled. Zhai Sheping et al. [19] used a Bayesian inference-based method to calculate and complete the spatial relationships of relevant nodes and predict latent relationships of entities, but it is only applicable to small-scale static knowledge graphs. Bordes et al. [20,21] proposed the TransE model, which laid the foundation for translation-based models, followed by improvements in spatial projection mechanisms with TransH [22] and TransD [23]. Xing Lining et al. [24] used a collaborative filtering-based TransH improvement algorithm for intelligent book recommendations. Cao Luran [25] extended this to criminal law offense prediction. Although these technologies have been validated in various fields for their ability to mine latent patterns, they have not been applied to the analysis of cost transmission mechanisms in open-pit coal mining.
In traditional open-pit coal mining cost analysis, methods such as differential analysis, factor analysis, principal component analysis, and gray correlation analysis are commonly used [26,27,28,29] to summarize patterns in various cost factor data to identify the main cost control factors. However, these methods each have limitations, including the influence of subjective factors, reliance on experiential judgment, inability to adapt to dynamic changes, and lack of theoretical support. With the advancement of intelligent algorithms, Hu Yonghui et al. [30] used BP neural networks to accurately optimize the blasting parameters among the mining cost influencing factors. Peng Yifan [31] proposed a multi-objective differential evolution algorithm to optimize transportation costs by identifying factors such as truck scheduling and bucket-to-shovel ratio. Zhang Naifan [32] used grounded theory combined with the DEMETAL-ISM model to construct a production cost factor system for open-pit metal mining. These methods break through the static limitations of traditional analysis and utilize machine learning to achieve dynamic analysis of multi-factor coupling relationships. However, current research on open-pit coal mining cost factor identification has yet to establish a knowledge graph integrating spatiotemporal attributes, and is unable to achieve visual inference of optimized transmission paths or dynamic binding of lifecycle costs with real-time working conditions.
This study constructs a cost knowledge graph for open-pit coal mining, integrating entity relations—such as geological conditions and process parameters—with quantitative attributes, including sensitivity coefficients and impact thresholds. In doing so, it establishes an extensible cost—decision inference mechanism that maintains the effectiveness of optimization strategies as production conditions evolve. For example, the framework can infer how increased blast lumpiness leads to lower truck bucket rates and higher diesel consumption, enabling targeted adjustment of upstream parameters. The innovations are as follows:
  • A high-precision entity recognition method based on BERT-BiLSTM-CRF for named entity recognition in the cost domain of open-pit coal mining was proposed.
  • A knowledge graph-driven cost factor identification framework was established, which analyzes multi-level cascading influences through entity relationship path mining.
  • The foundation of cascading relationship inference for cost factors is clarified through an attention weight network, and the relationship weight matrix is used to enhance the interpretability of cost fluctuation attribution.

2. Methodology

2.1. Research Process

Standard specifications and research literature were used as data sources for knowledge extraction. Entity recognition was performed for different data types by leveraging the characteristics of each operation stage in the production process. Structured and semi-structured data—such as blasting design—were handled with rule-based methods and traditional machine learning techniques. For unstructured text in in-process specifications, a BERT-based pre-trained model was introduced and trained to extract entities from the corpus. On this basis, knowledge in the graph was inferred using the TransH algorithm, and factors were ranked and filtered by their weights to identify key cost-influencing factors. Finally, a question-and-answer system was implemented to present knowledge efficiently through query and retrieval. The research workflow is shown in Figure 1.

2.2. BERT-BiLSTM-CRF Model

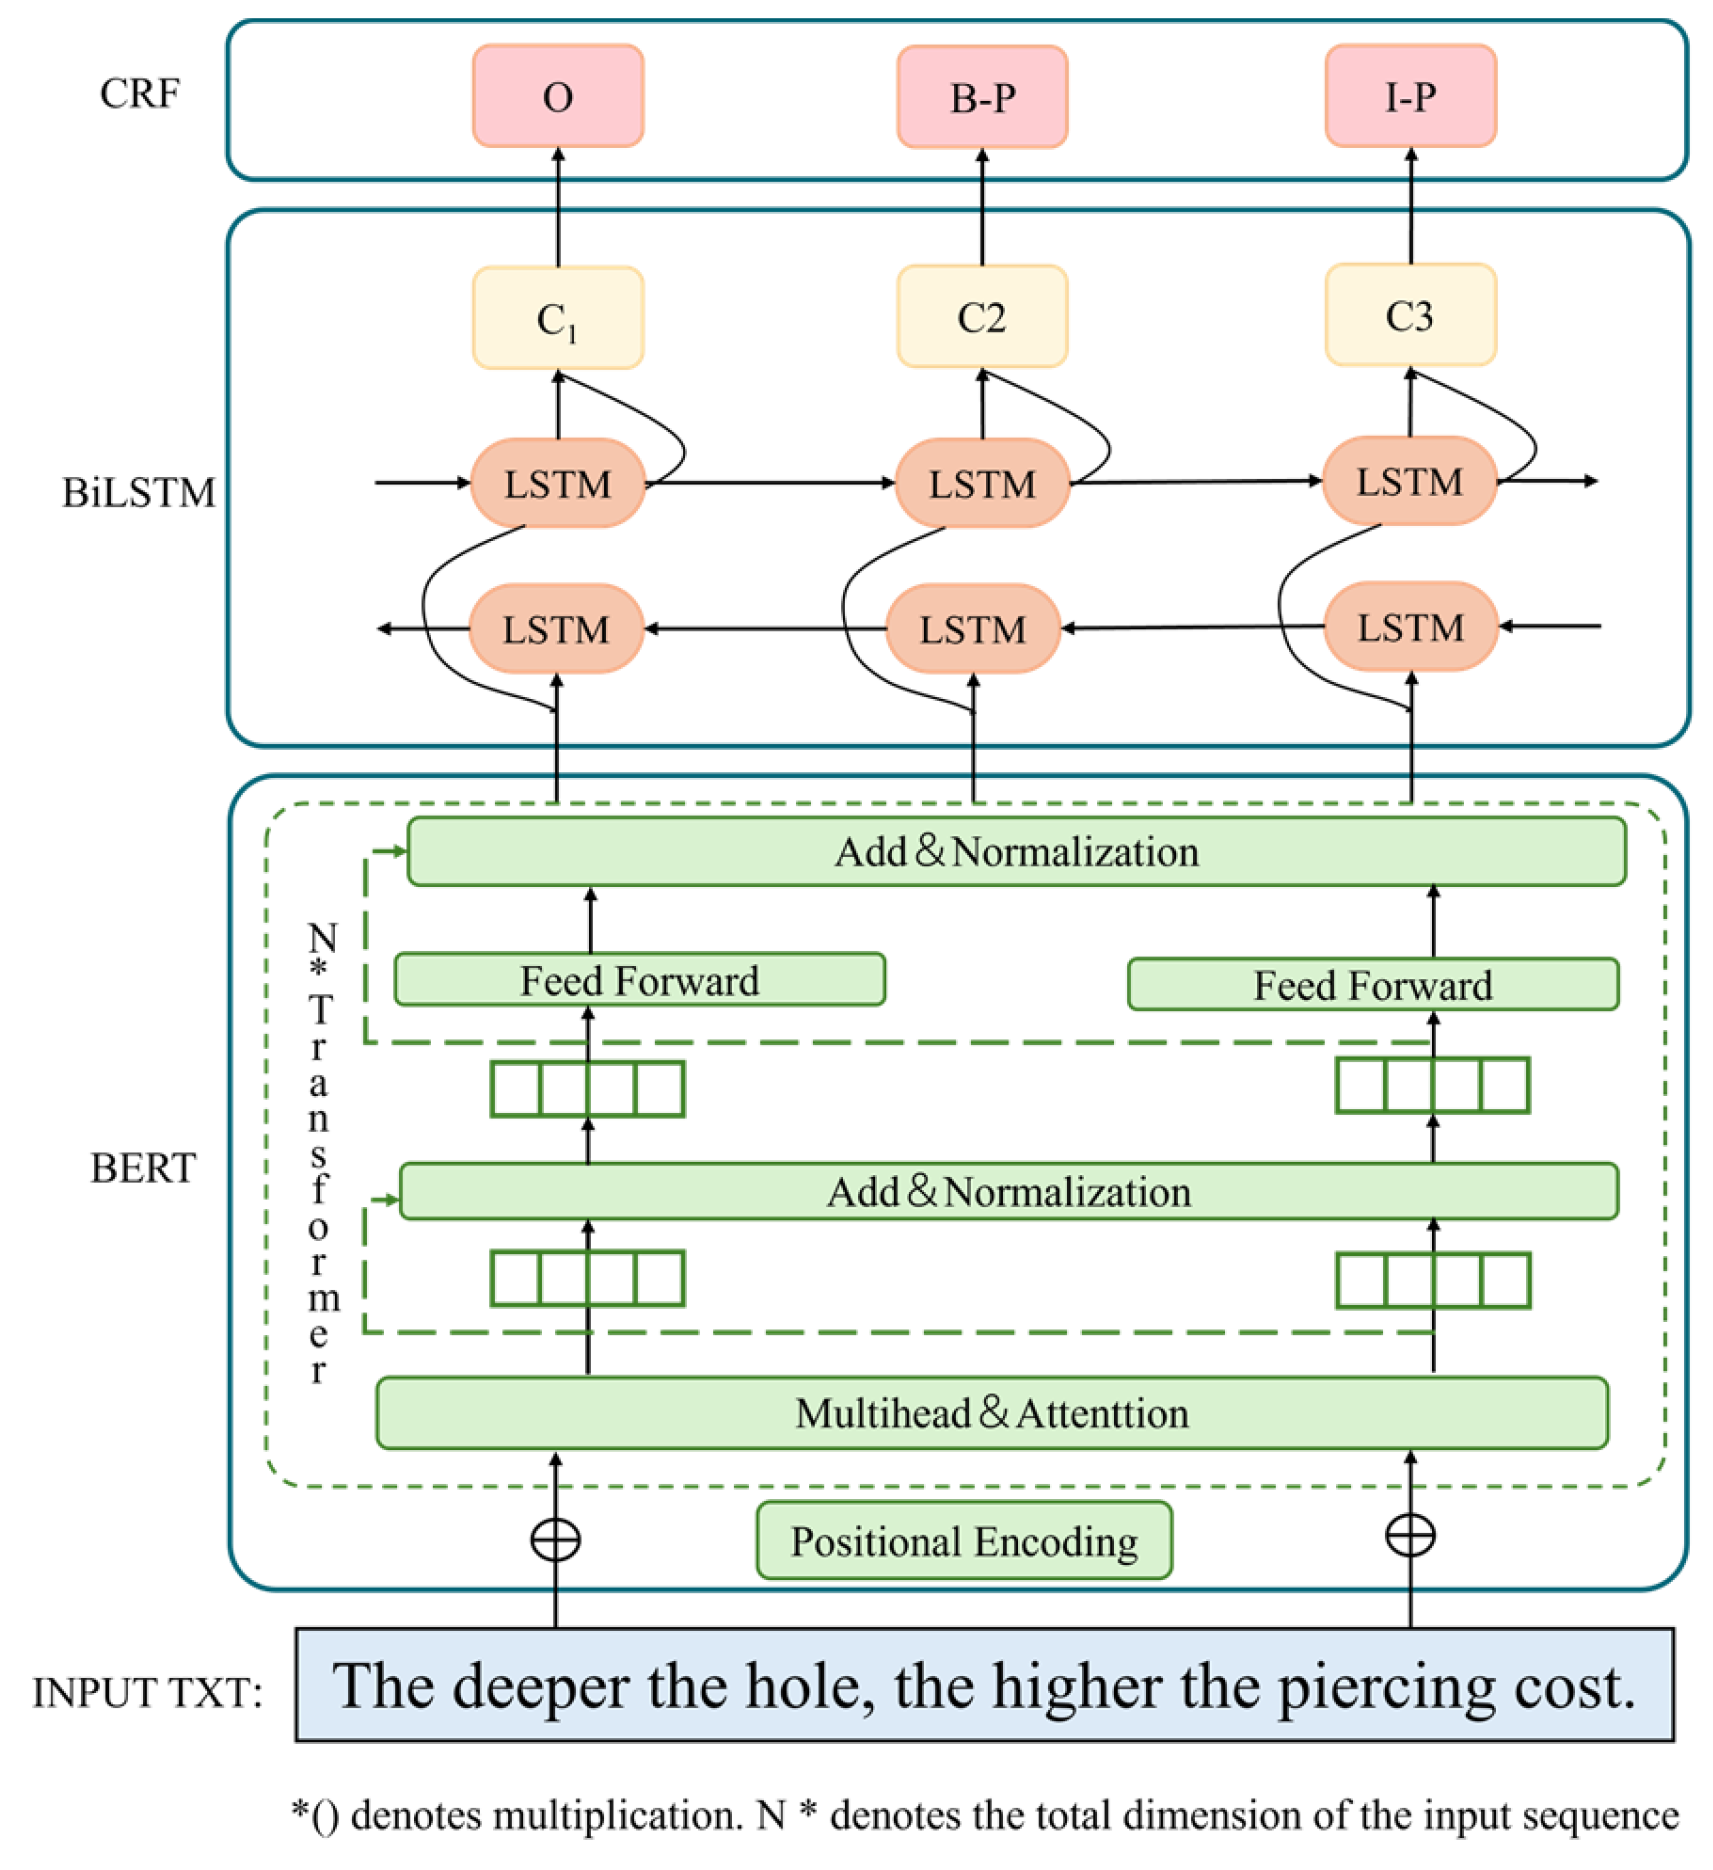
The structure of the BERT-BiLSTM-CRF model constructed in this paper is shown in Figure 2. The model consists of three main components: the BERT layer, the BiLSTM layer, and the CRF decoding layer. The BERT layer is used to vectorize the characters in the sentence, the BiLSTM layer is used to capture the contextual semantic features of the vectors, and the CRF decoding layer is used to output the globally optimal label sequence.

2.2.1. BERT Model

As an unsupervised pre-trained language model based on Transformer, the BERT model is centered around the self-attention mechanism, which achieves context-aware semantic representation. As shown in Figure 3, the model input consists of three components: token embedding (character semantics), position embedding (sequence order), and segment embedding (sentence boundaries). As shown in Equation (1), the self-attention calculation dynamically captures inter-word relationships.
A t t e n t i o n Q ,   K , V = s o f t m a x Q K T d k V
where Q , K , and V are the word vector matrices, d k is the embedding dimension, and the scaling d k avoids excessively large dot product values in high-dimensional space that could lead to gradient vanishing. The Softmax function normalizes the weight coefficient matrix to highlight the key features.
In the open-pit coal mining cost knowledge entity recognition scenario, the phenomenon of entity concentration is quite common due to the numerous cost factors. This issue requires dynamic semantic modeling to resolve the problem of polysemy. For example, in the following sentence: “Blasting vibration in blasting results must be controlled below 5 cm/s”, there are 20 characters containing two entities. First, the input sequence E10{E1, E2, …, En}, where Ei (i ∈ n), is encoded by BERT. Each word vector Ei integrates its contextual features, and the [SEP] token separates multi-sentence inputs. The [CLS] token aggregates global features for downstream task fine-tuning. The input principle is shown in Figure 3.
Furthermore, Chinese word segmentation often suffers from ambiguity, particularly when processing compound technical terms common in mining domains. BERT mitigates this issue by performing character-level encoding combined with self-attention, allowing the model to dynamically capture contextual dependencies without relying on predefined token boundaries. For instance, given a four-character compound term referring to “blasting vibration,” BERT encodes each character individually. The attention weights between adjacent characters—especially those corresponding to “vibration”—are significantly higher than with unrelated characters, indicating that the model has effectively recognized the semantic integrity of the compound term. This approach helps prevent incorrect splitting of multi-character domain-specific entities, a common limitation of traditional segmentation tools in Chinese NLP.

2.2.2. BiLSTM Model

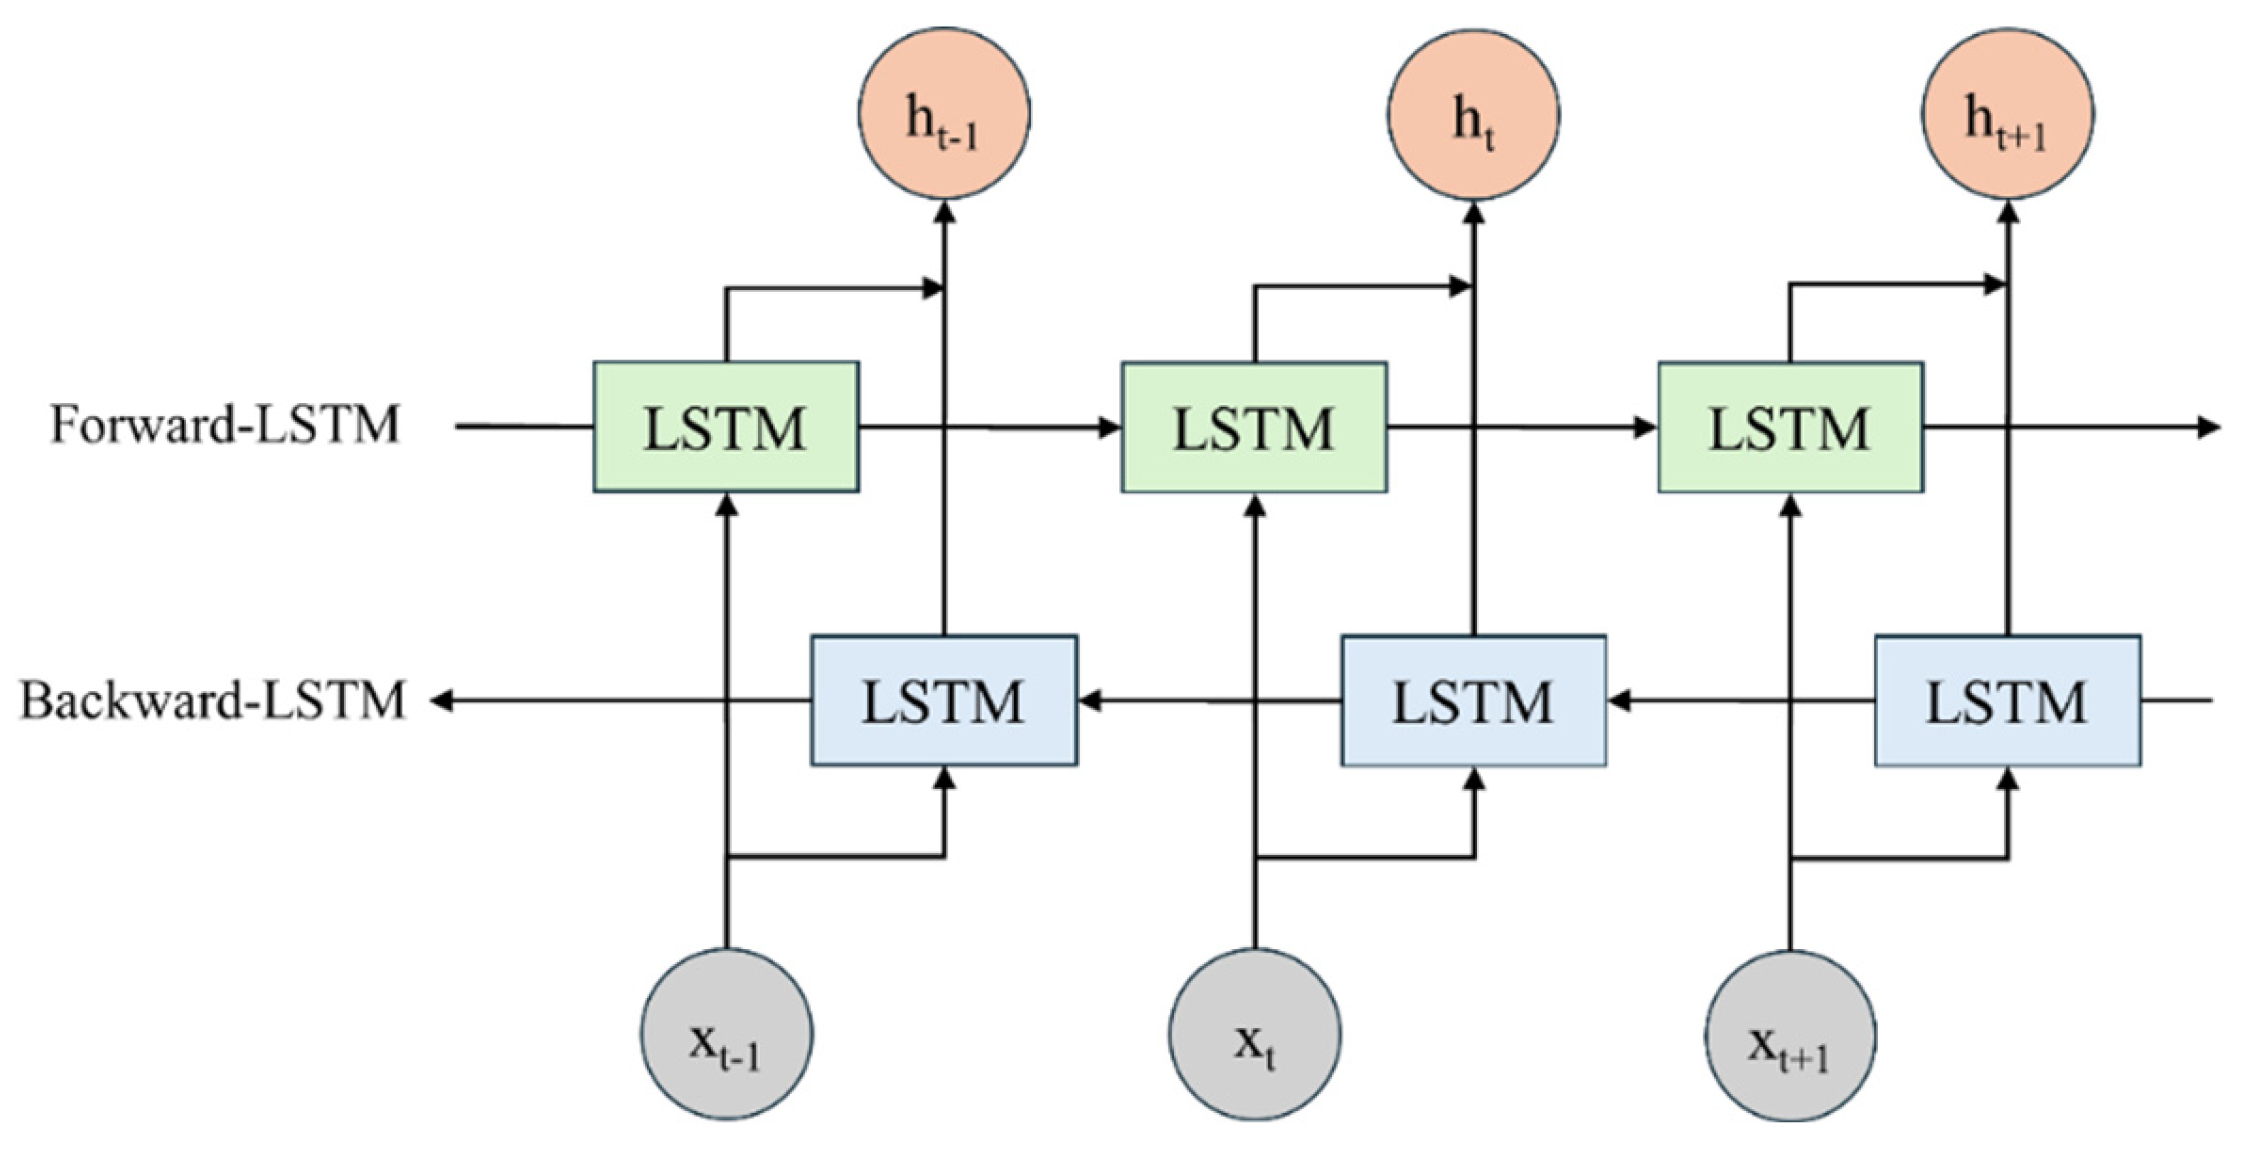
LSTM (Long-Short Term Memory), as an improved architecture of Recurrent Neural Networks (RNN), addresses the gradient problem through a gating mechanism. Its core consists of three types of gate functions: forget gate, input gate, and output gate. The combination of the input gate and the forget gate allows for the filtering and removing of unnecessary information, passing helpful information to the next time step. The output of the entire system is mainly the memory cell output multiplied by the output of the output gate. The calculation formulas are shown in Equations (2)–(7).
f t = σ ( W f h t 1 , x t + b f )
i t = σ ( W f h t 1 , x t + b i )
c ~ t = t a n h ( W c h t 1 , x t + b c )
c t = f t c t 1 + i t c ~ t
o t = σ ( W 0 h t 1 , x t + b 0 )
h t = o t t a n h ( c t )
BiLSTM introduces bidirectional sequential processing on top of LSTM, enabling the model to analyze contextual semantics simultaneously, significantly improving the accuracy of entity boundary recognition. The polysemy of terms such as “bench” can be effectively distinguished in open-pit coal mining cost texts in different process stages. The structure of the BiLSTM model is shown in Figure 4.

2.2.3. CRF Model

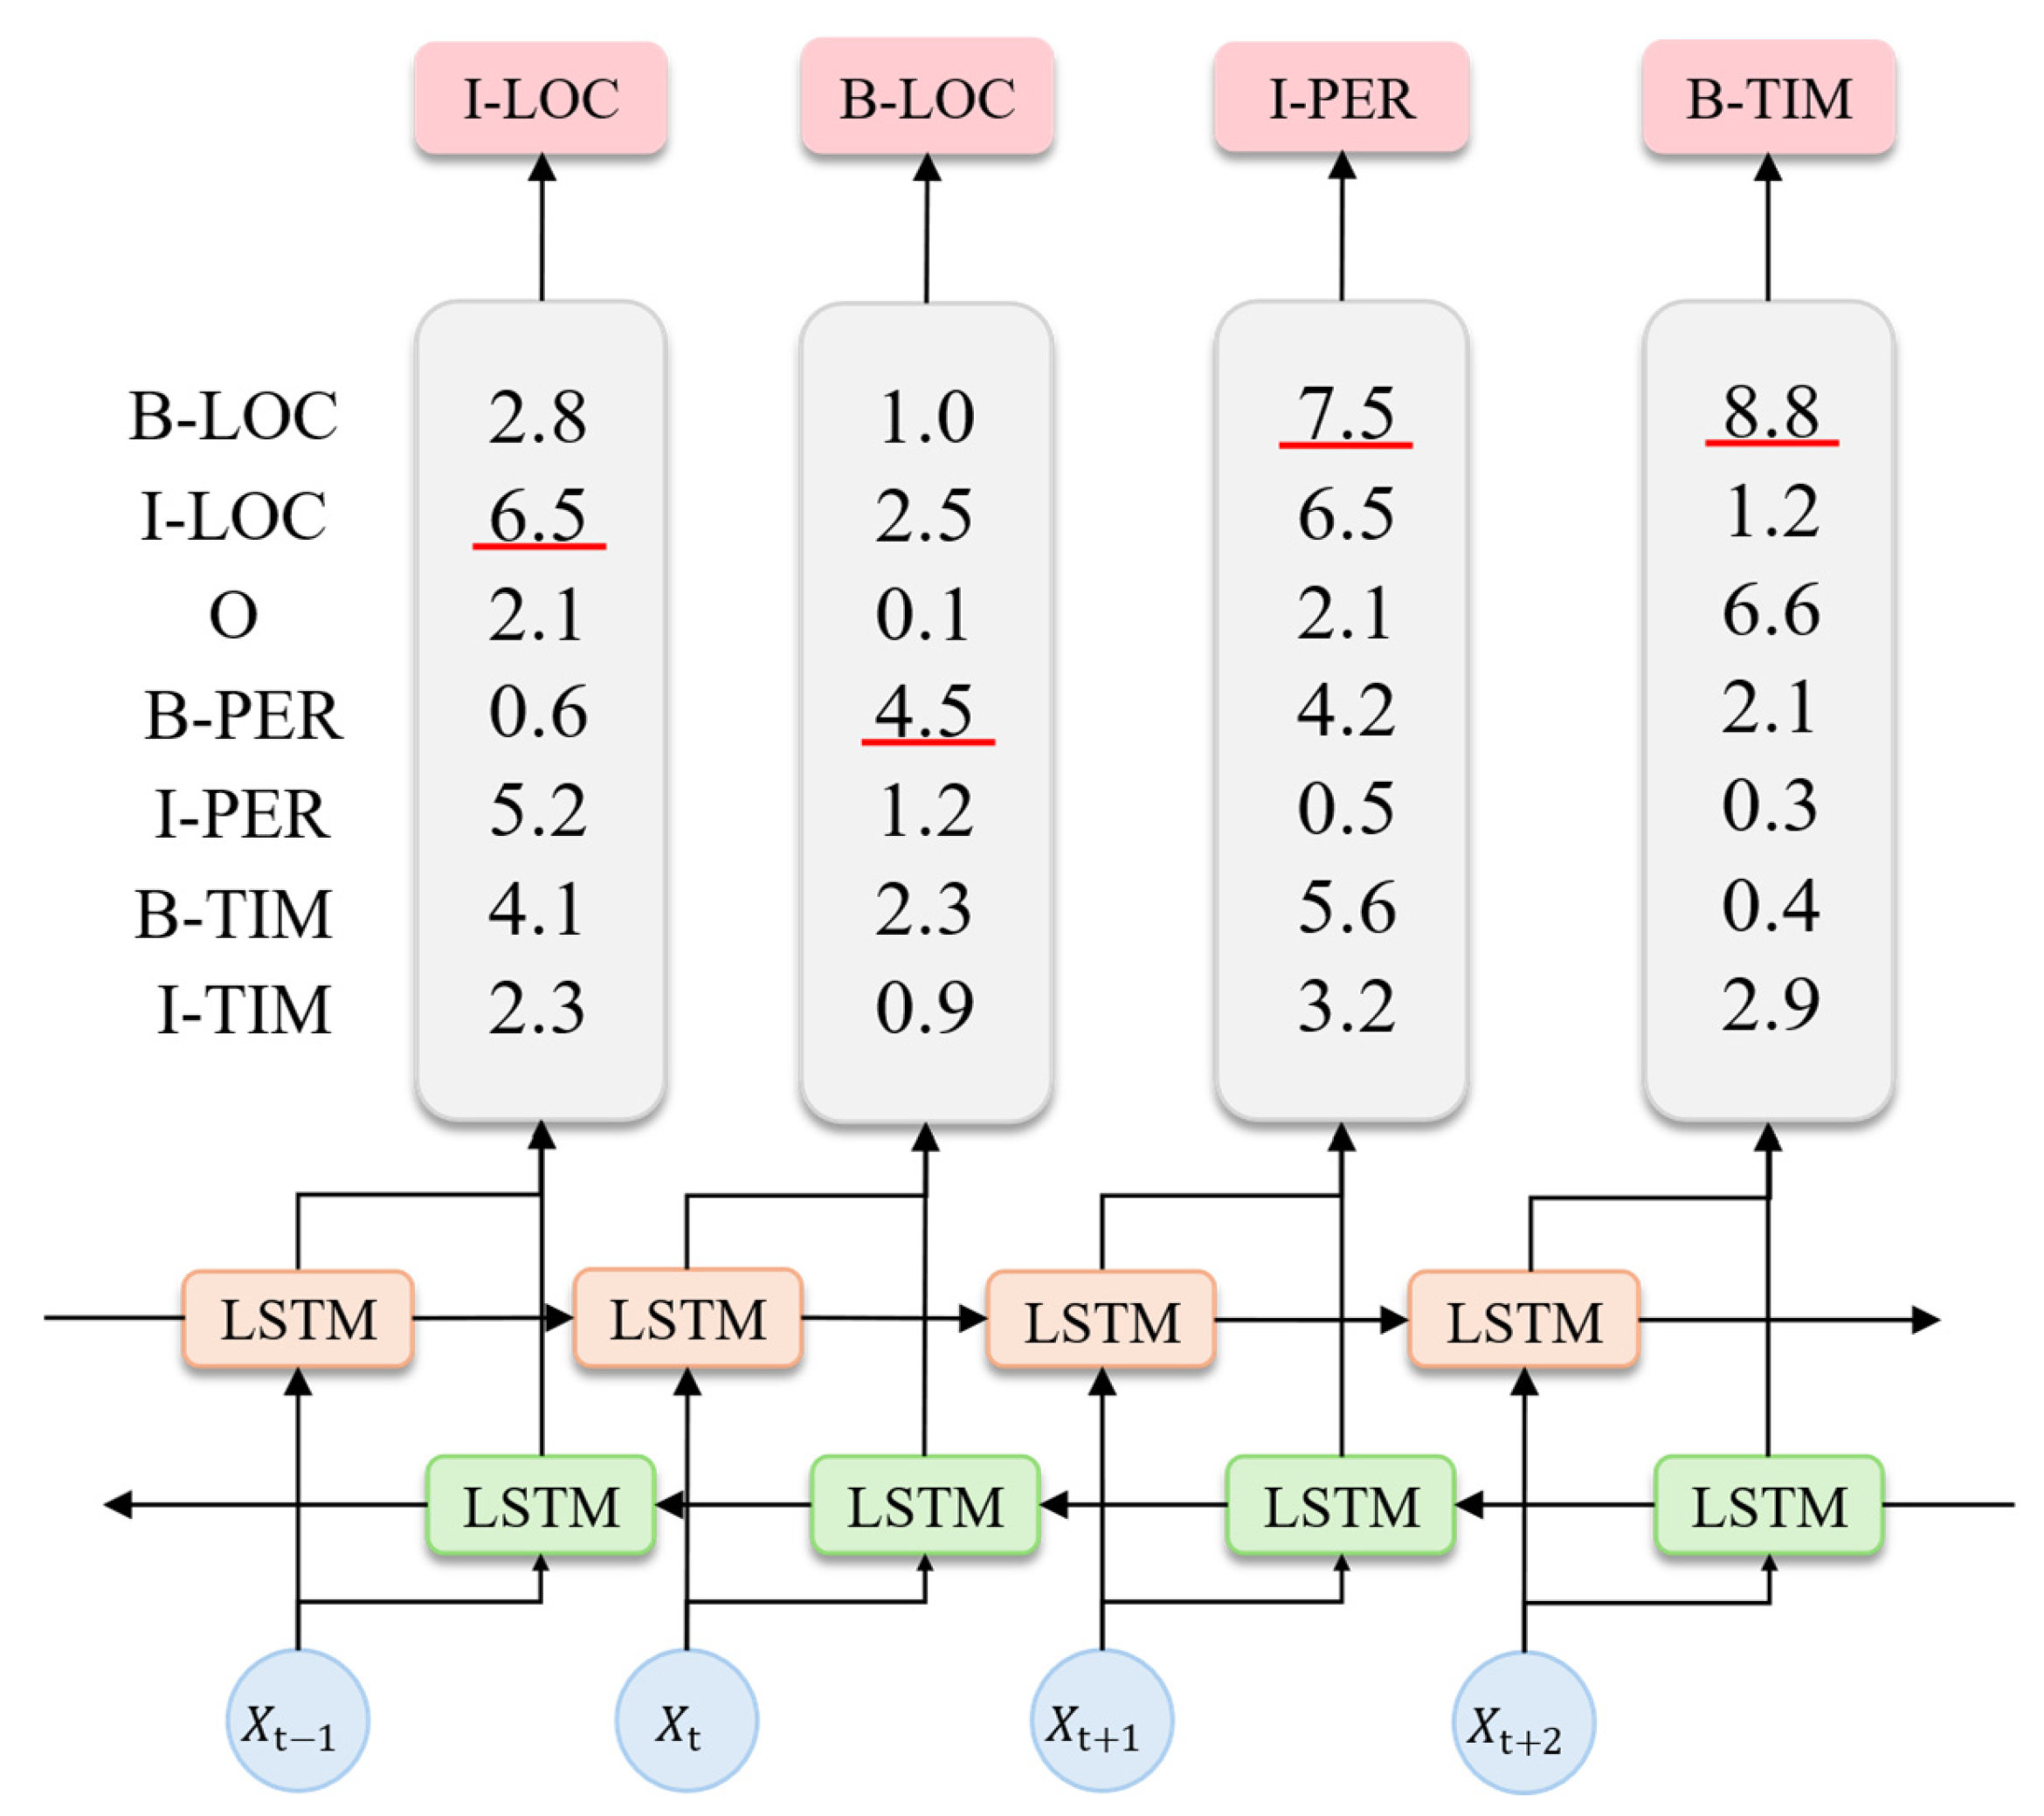
In the named entity recognition (NER) task, CRF optimizes the sequence labeling results by modeling transition constraints between labels [33]. Its core lies in jointly solving the optimal label sequence using the A-label transition matrix and the BiLSTM output P-probability matrix. The specific implementation is divided into three stages:
First, feature modeling is performed, where the BiLSTM outputs the label emission probability P x i y i for each character, and the CRF layer defines the label transition rules through the transition matrix A y i y i + 1 . Next, during model training, the log loss function is optimized for each sequence Y, adjusting the values of matrix A. The transition probability values are defined using the S o f t m a x function, as shown in Equation (8).
p X Y = e s ( X , Y ) Y ~ Y X s ( X , Y ~ )
where Y X is the set of all label sequences, and Y ~ is the true label sequence. Therefore, it is sufficient to maximize the likelihood probability p X Y , using the log-likelihood function as shown in Equation (9).
ln ( p X Y ) = ln ( e s ( X , Y ) Y ~ Y X s ( X , Y ~ ) ) s ( X | Y )
When the model makes predictions, the best path is found using the method shown in Equation (10).
y = a r g max Y ~ Y X s ( X , Y ~ )
where y represents the sequence in the set that maximizes the s ( X , Y ~ ) function.
In handling named entity recognition tasks, it is common to combine neural network models with traditional statistical mathematical models. BiLSTM-CRF is the most representative model structure, and its specific named entity recognition process is shown in Figure 5.

2.3. Evaluation Metrics

The definitions and formulas of the NER evaluation metrics used in this study are as follows. Precision, Recall, and F 1 score are adopted as comprehensive evaluation indicators. T P denotes the number of correctly recognized entities, FP represents the number of incorrectly recognized entities, and F N refers to the number of entities that were not correctly identified in the reference literature.
Precision refers to the ratio of correctly recognized entities to the total number of correctly recognized entities. The formula for calculating P is shown in Equation (11).
P = T P T P + F P × 100 %
Recall refers to the ratio of the number of correctly recognized entities to the total number of entities that should be recognized (all entities). The formula for R is shown in Equation (12).
R = T P T P + F N × 100 %
The model is evaluated using Precision, Recall, and the comprehensive F 1 score. The formula for F 1 is shown in Equation (13).
F 1 = 2 × P r e c i s i o n × R e c a l l P r e c i s i o n + R e c a l l × 100 %

2.4. TransH Inference Model

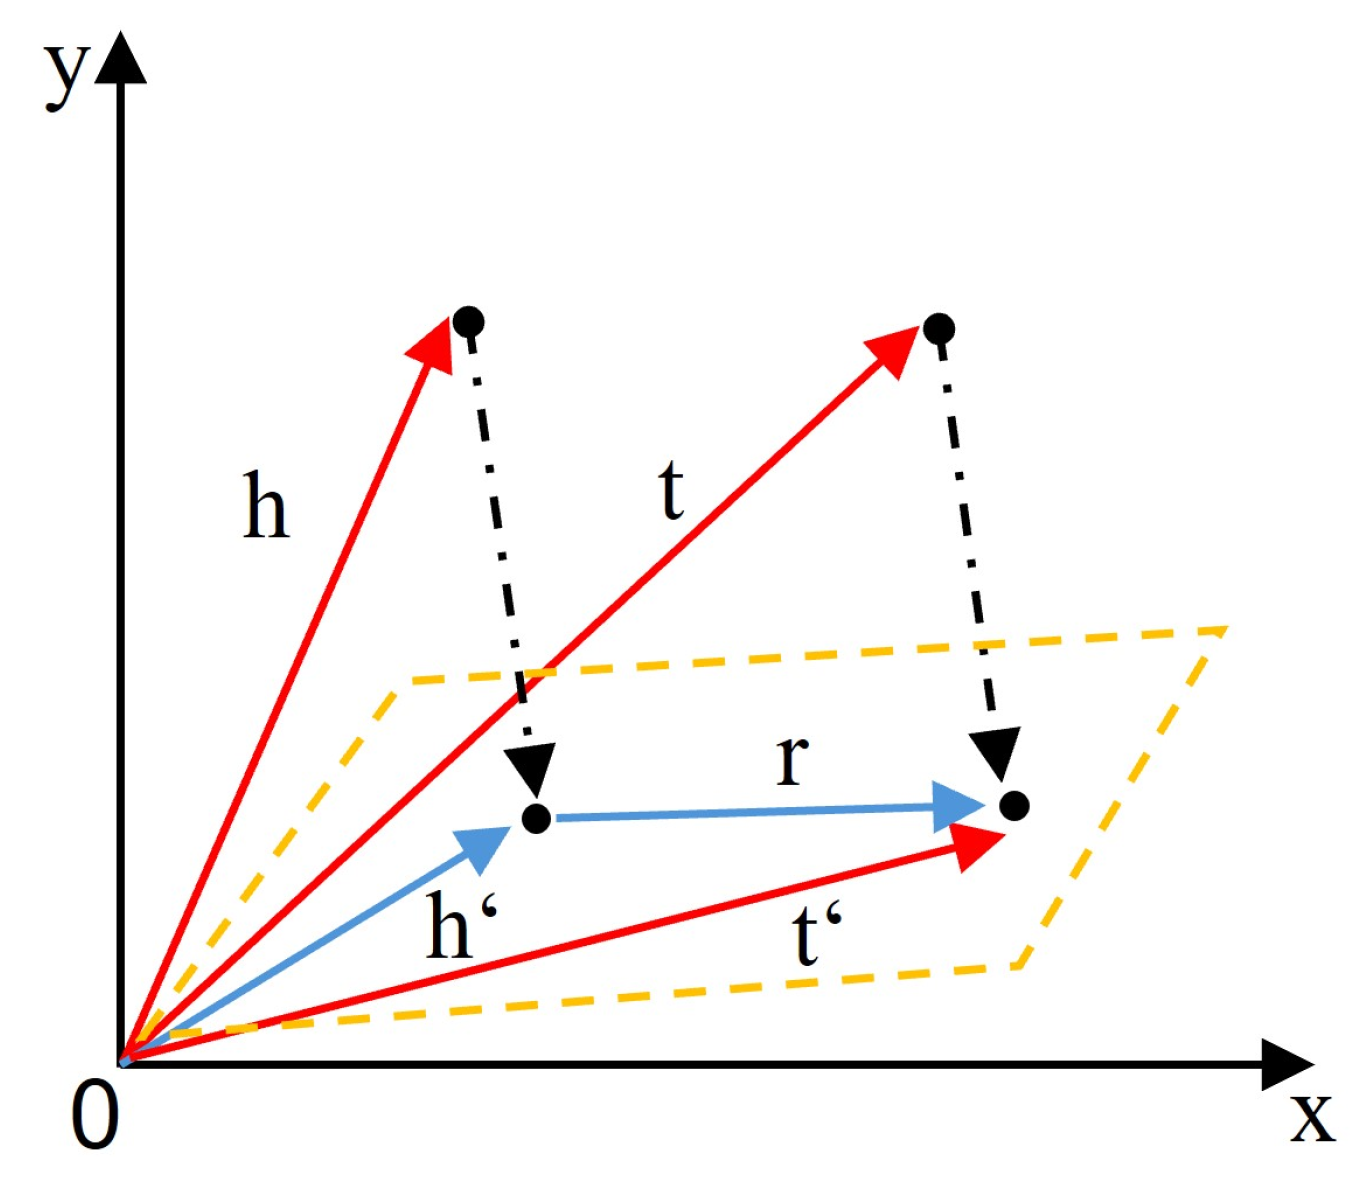
The TransH model improves upon TransE by projecting through relation-specific hyperplanes, addressing the problem of semantic ambiguity in multi-relational data [34]. The core idea is as follows: Given a true triple (h, r, t), the head entity vector h and the tail entity vector t are projected onto the hyperplane along the normal vector w, and translation is performed on the hyperplane. The vector space embedding preserves the geometric symmetry between entities and relations, ensuring that inverse relationships maintain a mirrored distribution in the latent space, as Figure 6 illustrates.
The scoring function is shown in Equation (14).
f r h , t = | h w r t h w r + r t w r t t w r | l 1 / l 2
To optimize the training process, TransH uses the Bernoulli dynamic negative sampling method: First, the average number of tail entities N t for the head entity and the average number of head entities N h for the tail entity are calculated. Then, a Bernoulli distribution with a sampling parameter is defined, as shown in Equation (15).
P X = 0 = 1 P X = 1 = 1 N t N t + N h
With probability P(X = 1), the head entity is replaced to construct a negative triple; with probability P(X = 0), the tail entity is replaced, ultimately constructing a negative triple.
The model performance is usually evaluated using the hits@n [35] and MeanRank [36] metrics to assess the overall capability of Trans series algorithms.
m r r = 1 S i = 1 S 1 r a n k i
where S is the set of triples, S is the number of triples, and r a n k i is the ranking of the i-th triple in link prediction. The higher the metric, the better.
The hits@n metric refers to the average proportion of triples ranked less than n in link prediction. The calculation formula is shown in Equation (17).
h i t s @ n = 1 S i = 1 S I I ( r a n k i n )
where II ( ) is the indicator function, which returns one if the condition is true and zero otherwise. The higher the metric, the better.

3. Case Analysis

3.1. Dataset Source and Entity Classification

This paper uses national standards, industry standards, and research literature on production cost factors from the CNKI database related to open-pit coal mining as the data sources to construct the original corpus based on production technical specifications and cost-influencing factors. First, 23 standards and specification texts related to open-pit coal mining production costs were retrieved from the China National Standard Service Network and the Coal Industry Standard website. In the CNKI database, 45 articles were retrieved using “open-pit coal mining” and “cost” as keywords and 38 articles were retrieved using “drilling,” “blasting,” “transportation,” “dumping,” and “cost” as keywords, and four articles were retrieved using “full bucket rate” and “open-pit coal mining” as themes. Files that could not be converted to text format were excluded, and ultimately, 103 standard and specification texts in PDF and text formats were selected as the raw data.
The safety technical standard system for open-pit coal mining mainly focuses on various safety production standards for open-pit coal mines, including China National Standards (GB), Coal Industry Standards (MT), and Coal Mine Safety Standards (AQ). Among them, the safety management standards, production process standards, operational behavior standards, and cost accounting standards for open-pit coal mines are the main contents. The research literature on cost factors mainly includes five types of heterogeneous data: the correlation, sensitivity, hierarchy, process parameters, and historical data of different factors and costs under each production process. The content of the corpus literature (partially) and the data source requirements are shown in Table 1 and Table 2.
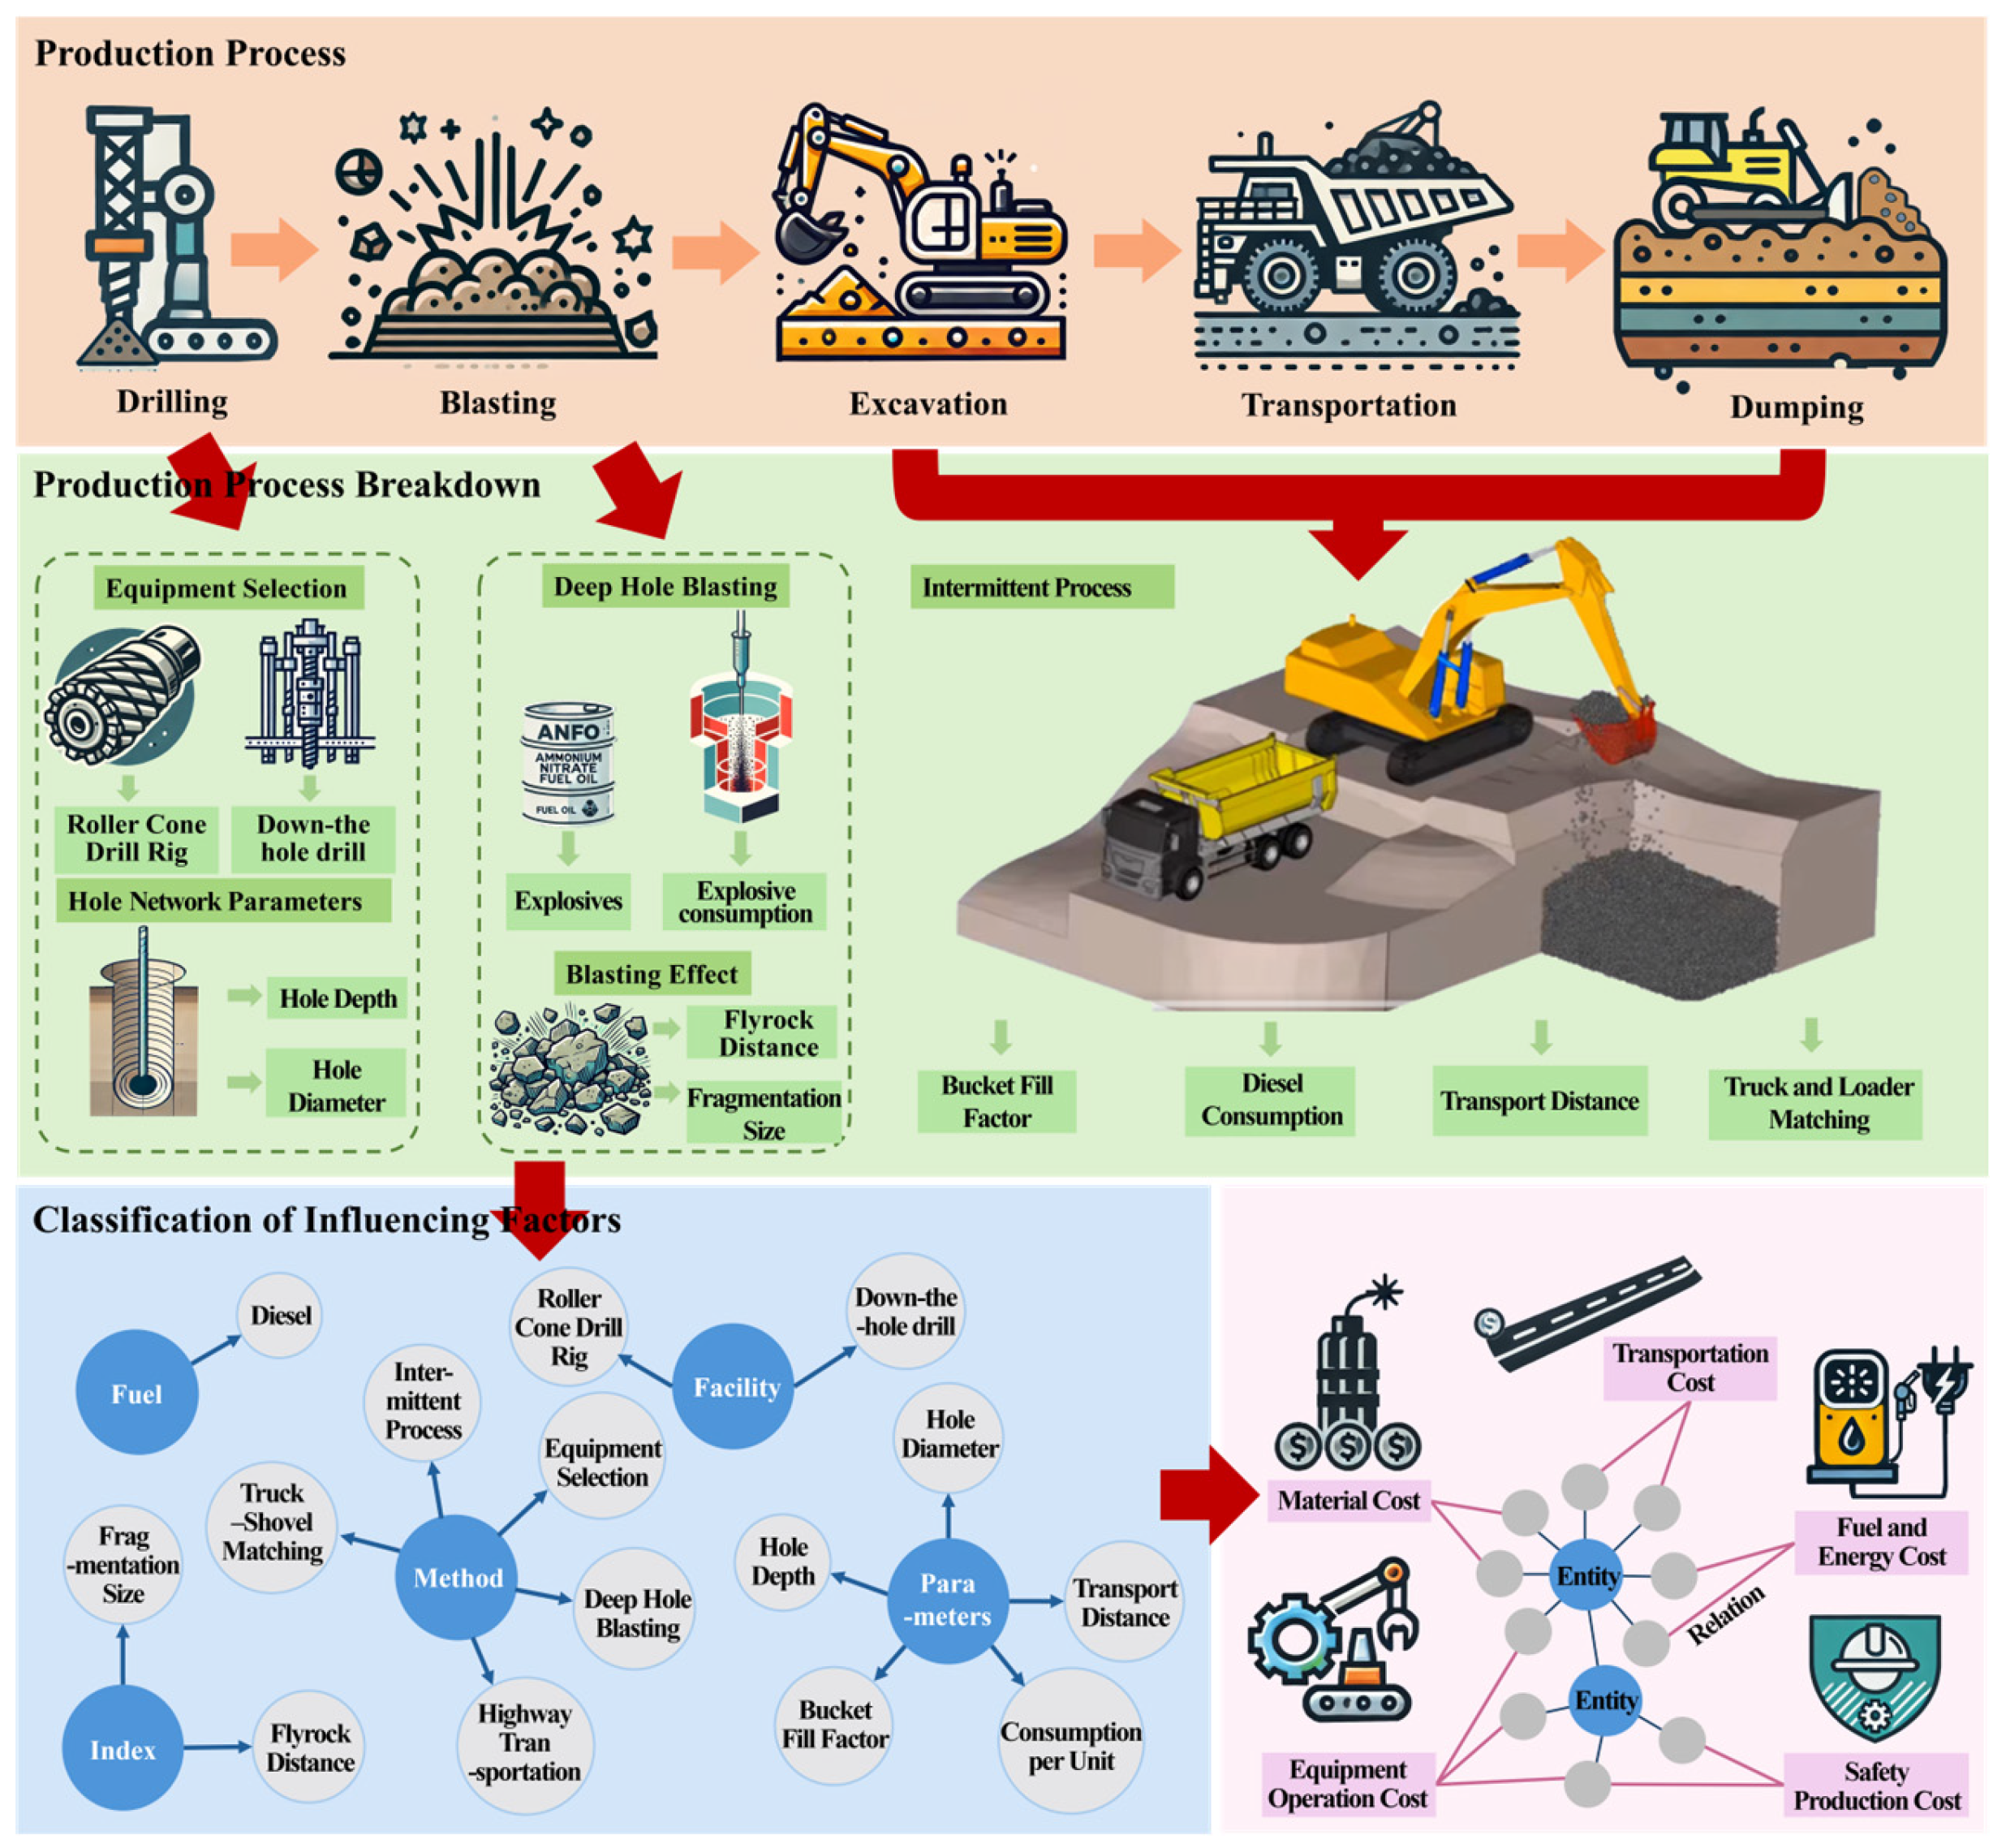
The entity type classification of the knowledge graph in this paper follows the typical production process flow. First, based on the five operational stages of “drilling–blasting–loading and hauling–transportation–dumping,” each stage is subdivided into specific process elements, such as equipment selection, hole network parameters, deep-hole blasting, and intermittent processes, according to the standards and specifications. These process elements are then further refined into specific parameter factors such as hole depth, hole spacing, explosive consumption per unit, flyrock distance, block size, transport distance, and full bucket rate, forming a structured process knowledge decomposition system. Finally, based on the cost impact dimensions, these specific factors are classified into entity types for cost items, including material costs, equipment operation and maintenance costs, transportation costs, and fuel and power costs, to construct a clear and scalable cost knowledge system. The decomposition process is shown in Figure 7.
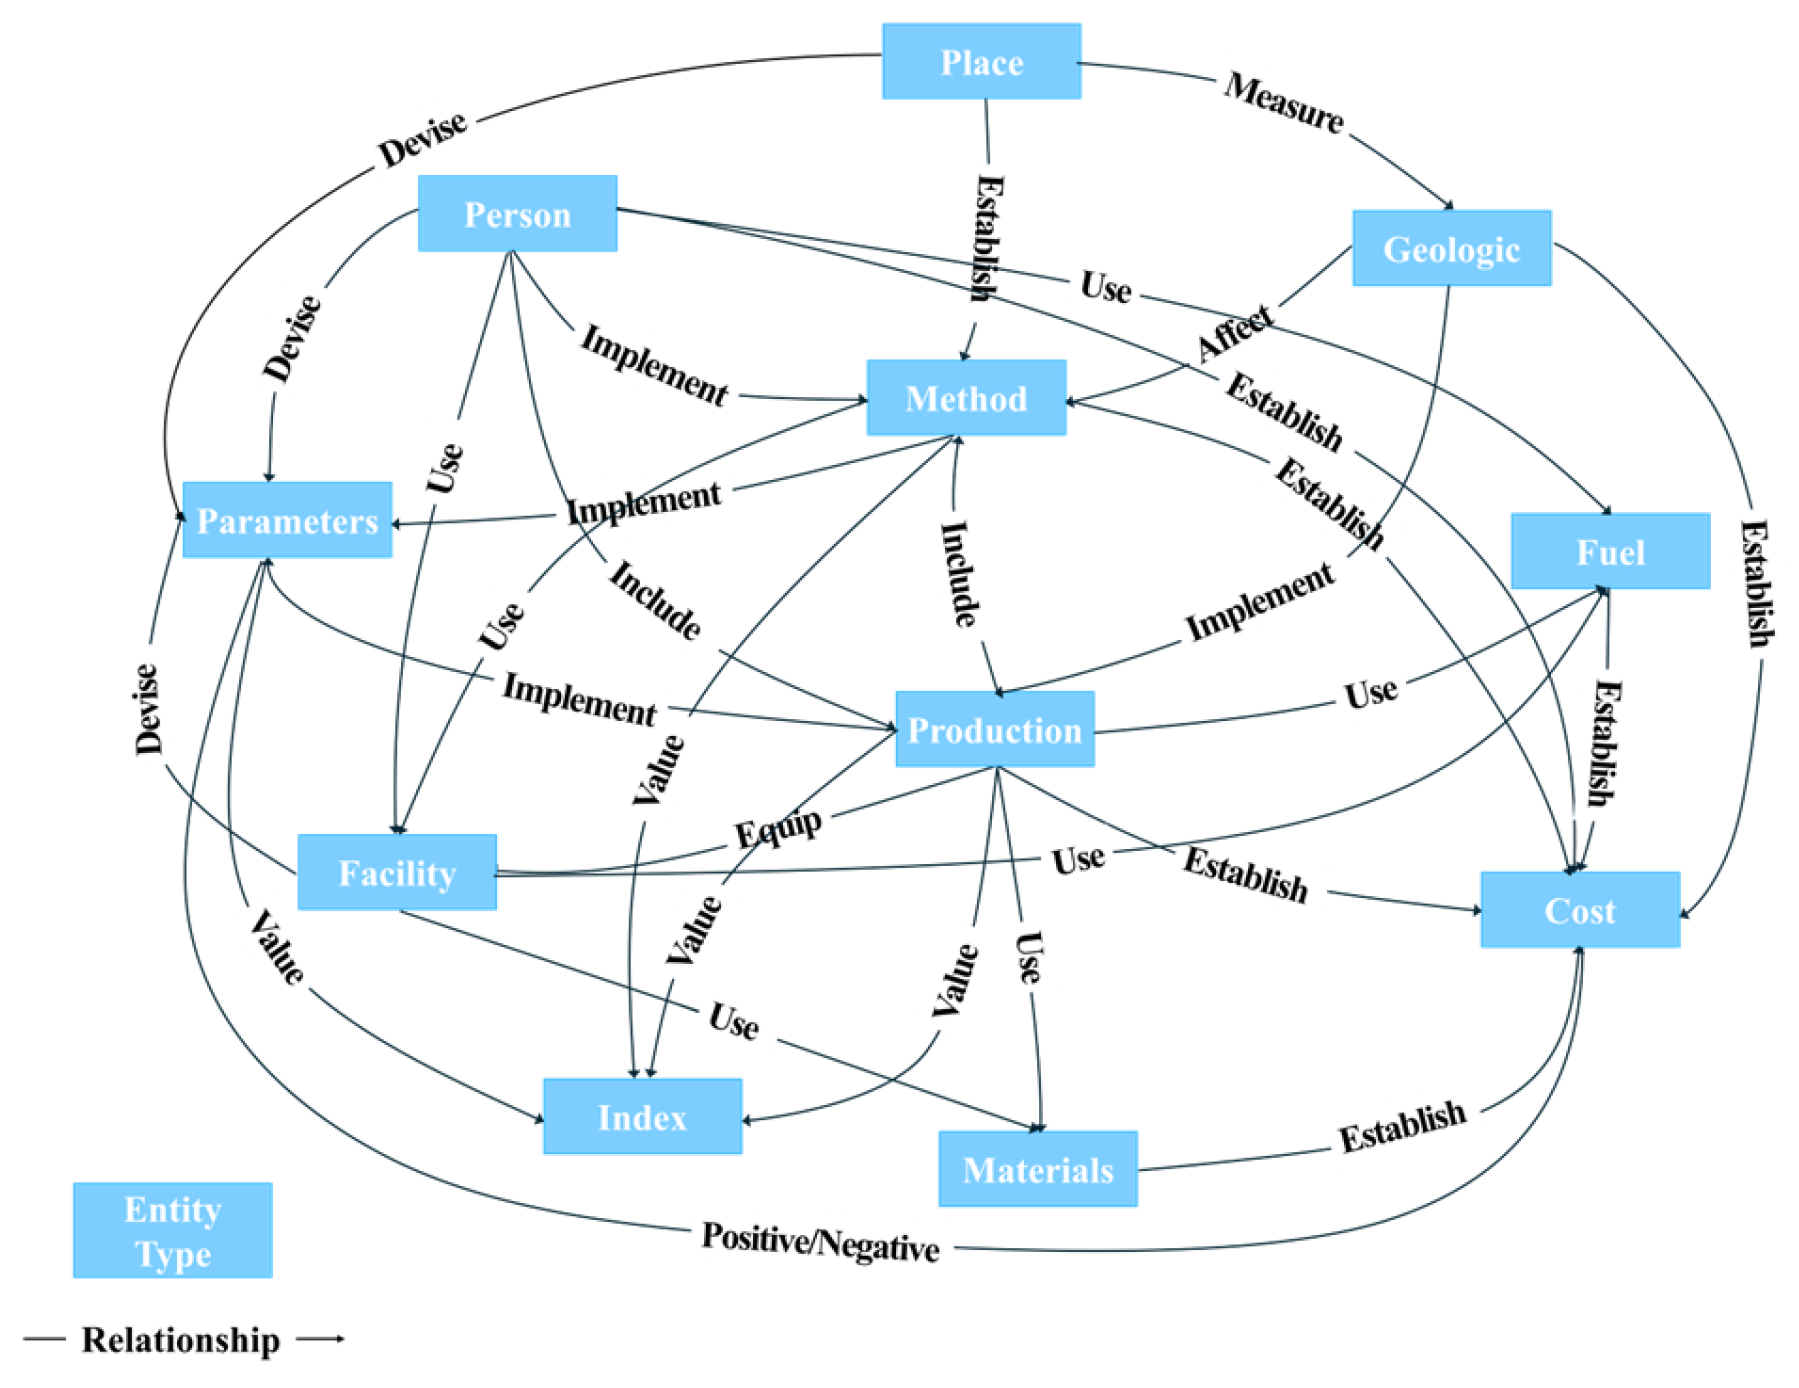
Figure 7 illustrates the symmetric structure of cost–process relationships in open-pit mining. Based on the above principles, the entity types are classified into 11 categories: Person, Method, Facility, Geologic, Parameters, Place, Production, Fuel, Cost, Materials, and Index. For the newly added entity types (Place, Materials, Fuel, and Index), since a standardized classification system has not yet been formed, a bottom-up construction approach is adopted. These entity types are connected by 12 types of entity relationships: Establish, Devise, Equip, Distance, Use, Measure, Include, Affect, Value, Implement, Positive and Negative—the last two relationship types represent a symmetric duality in the knowledge system. The concepts of entity relationships are shown in Table 3.
Considering the complexity of the open-pit coal mining production process, a top-down decomposition method combining the composition of open-pit coal mining cost factors with the knowledge system was adopted. The mature ontology construction model developed by Stanford University—the Seven-Step Method—was selected. This method not only improves the rationality of entity type classification at the conceptual level but also ensures the accuracy and comprehensiveness of standard specification data. Based on the analysis of the above corpus text, the knowledge structure pattern between the open-pit coal mining production cost knowledge domain standards is shown in Figure 8. The rectangular boxes represent entity types, the text arrows represent relationship types, and the arrows between entities indicate the direction of relationships, thus forming the knowledge structure pattern of the open-pit coal mining production cost knowledge domain described in this paper.

3.2. Knowledge Graph Construction

3.2.1. Platform Entity Labeling

This paper uses the free open-source annotation platform Doccano to perform sequence labeling on 15 standard specification documents from the corpus, constructing a sample set for entities and relationships. The Doccano platform provides functions for text classification, sequence labeling, and sequence-to-sequence labeling, creating annotated data for tasks such as sentiment analysis, named entity recognition, and text summarization. The platform supports four formats: Textfile, Textline, JSONL, and CoNLL. After annotation, the sequence labeling data is exported and converted into BIO format. This study imports the data in Textline format.
The entity content is determined based on the structured content in the standards and specifications. For example, according to the “Enterprise Product Cost Accounting System—Coal Industry” and the “Mineral Economic Evaluation Guidelines,” the tables and clauses in these documents clearly define cost dimensions. The entity types for cost expenses can be directly converted into 19 categories of entities, including raw materials and major material costs, auxiliary material costs, fuel and power costs, labor costs, depreciation costs, wear and tear and amortization, safety production costs, maintenance and repair costs, transportation costs, machinery and material consumption, sewage discharge fees, etc. The standards and specifications clearly display concepts such as process methods, geological environment, machinery and equipment, spatial location, construction effects, and geological environment in the form of tables or entries. Therefore, these can be imported into Doccano for manual annotation of entity boundaries and related entity content types in the original text, as shown in Table 4.
Due to the convenience of sequence labeling in Doccano, entity labels can be created using the “Labels” function. Manual annotation marks the boundaries of specialized terms in the text. An example of the annotation is shown in Figure 9, where the colored horizontal lines represent the corresponding entity labels. Different label colors can be set to facilitate the intuitive distinction of different label types during the annotation process.
Based on the standard “Coal Mine Technical Terms GB/T 15663” [47] and 18 specification documents, the above analysis resulted in 4365 entity contents and terms related to open-pit coal mining cost factors. The annotated text contains 357,241 characters and a total of 1477 data entries. The Doccano annotated data is shown in Figure 10 below.
Unlike English words, the annotated original data is in Chinese, with no delimiters between characters. Therefore, the Jieba segmentation toolkit obtains words based on word frequency and segmentation probability. Manual checks are performed again to ensure the validity. Jieba is an open-source segmentation tool widely used in Python 3.7.12 and has good segmentation performance. The tool’s defined dictionary segmentation module is applied to segment the organized standard specification dataset. To ensure that all domain-specific terms are recognized first, the weight of each word in the dictionary is set to the maximum value of −2000. The constructed dictionary is shown in the table below. The part-of-speech settings are based on the Jieba segmentation part-of-speech table: vn (noun–verb) is used to mark examples of entity types such as Method, Parameters, and Index; nw (title) is used to mark examples of entity types such as Cost and Production; s (place noun) is used to represent instances of Place and Geologic; nz (other proper names) is used to label instances of entity types such as Facility, Person, Materials, and Fuel. A total of 2321 domain-specific entity terms were collected. The constructed domain terminology dictionary is shown in Table 5.

3.2.2. Named Entity Recognition

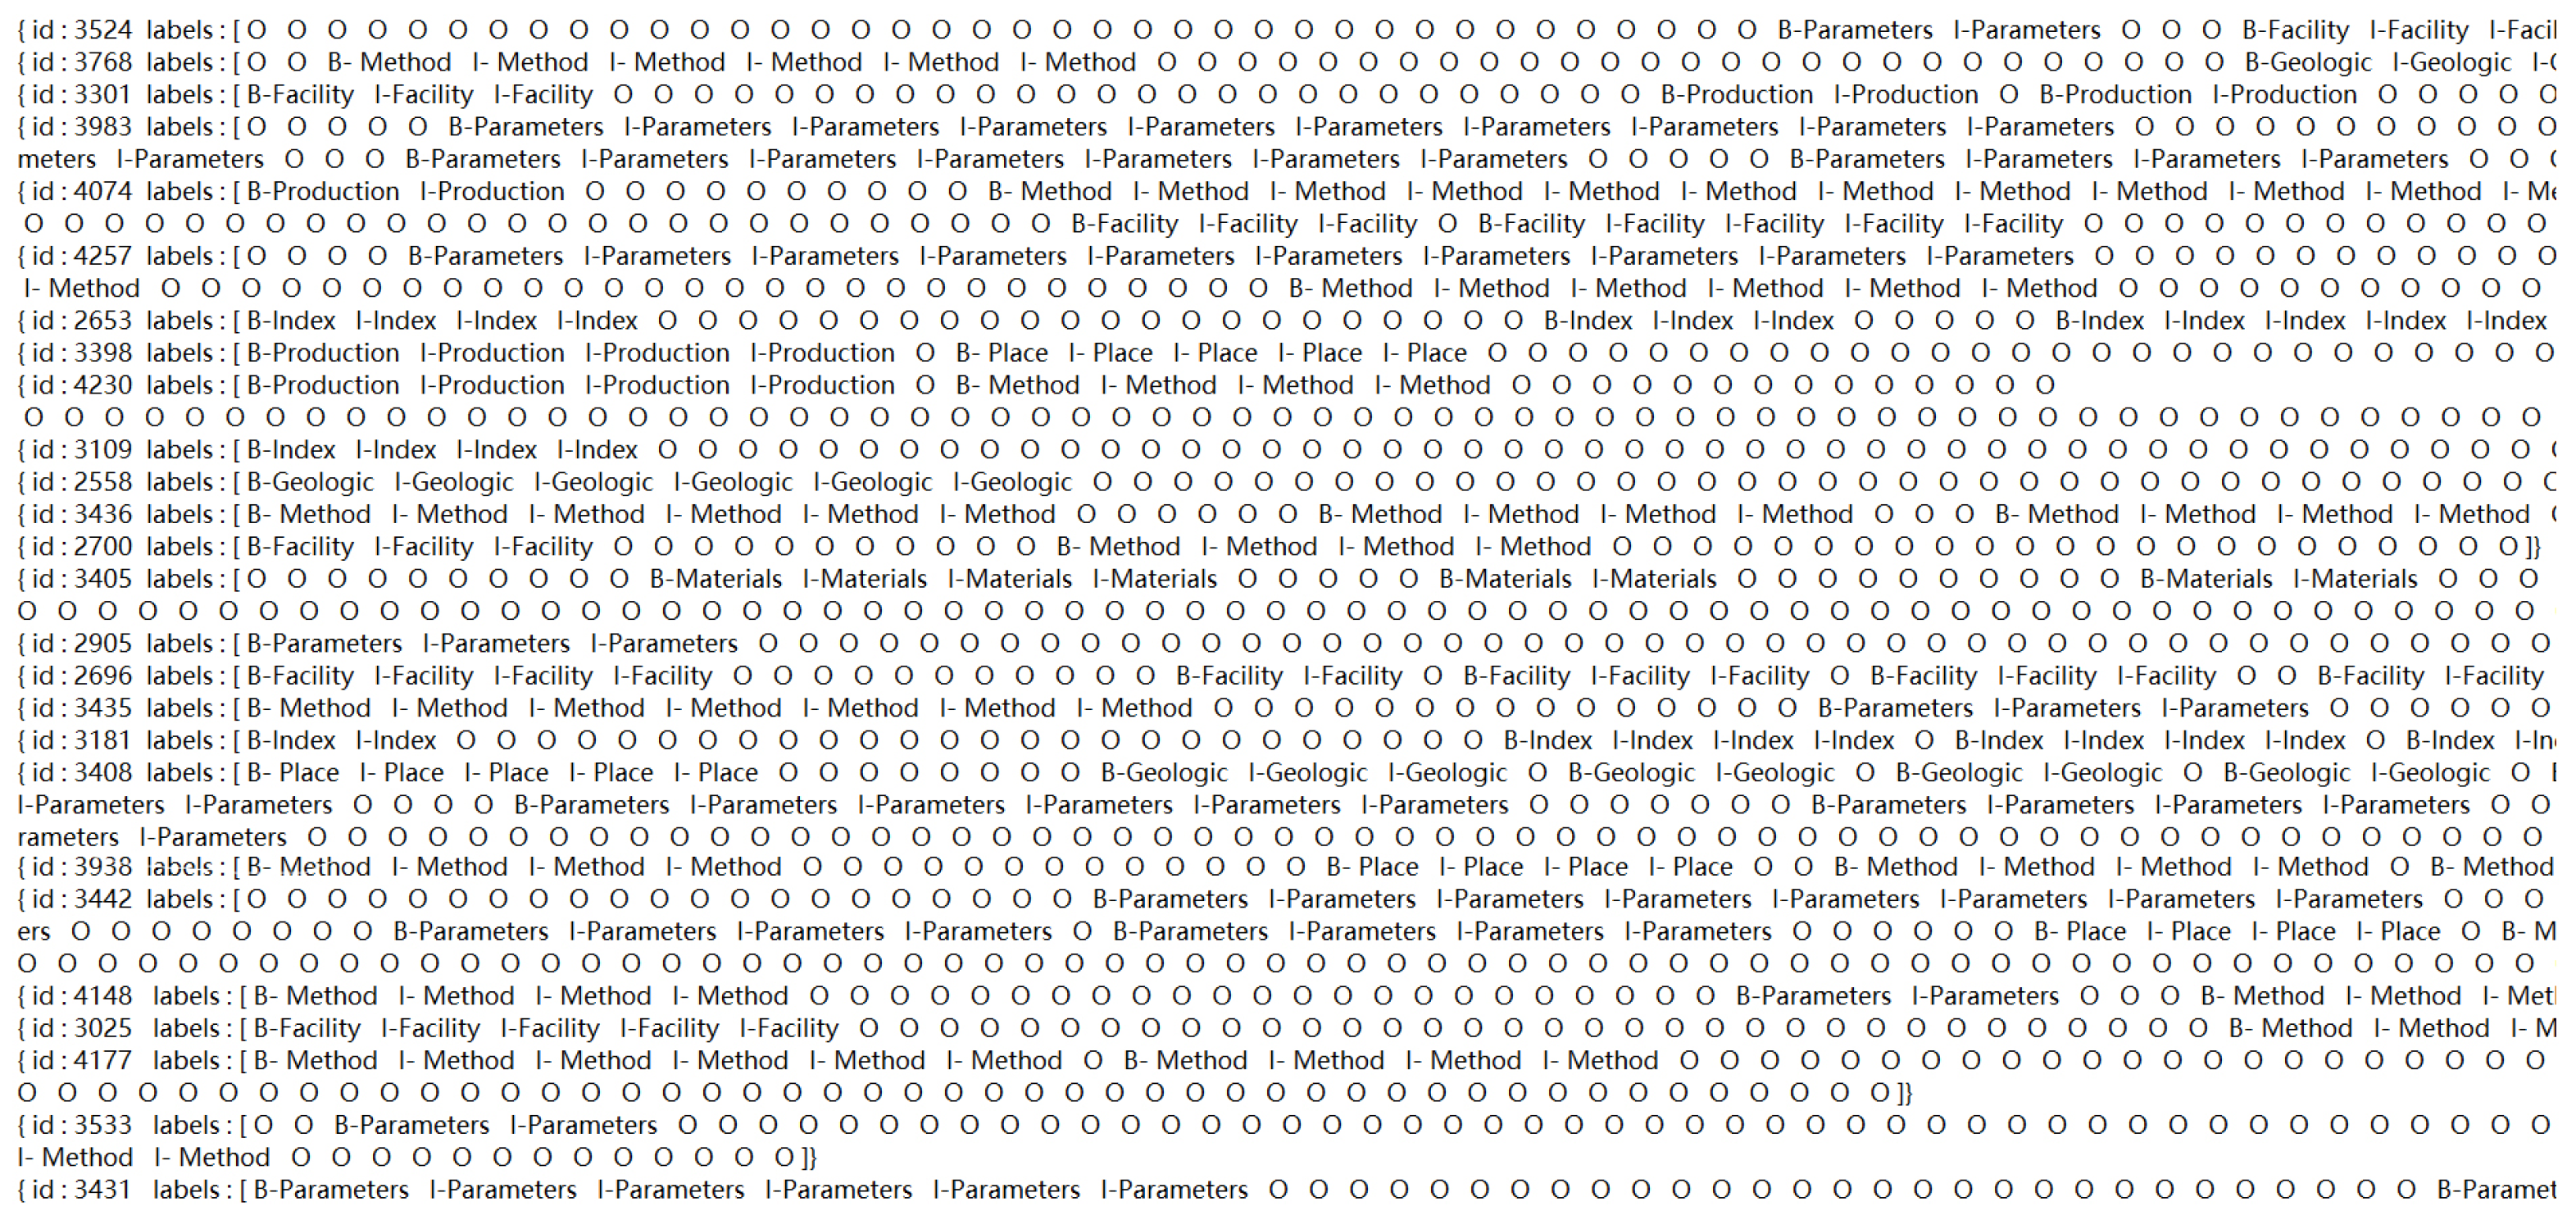
For named entity recognition in the Chinese domain, the BIO annotation strategy is commonly used [48]. Specifically: B—Beginning, indicating the start of the labeled entity; I—Inside, representing the remaining part of the entity except for the beginning; O—Other, representing irrelevant information. Based on the sequence labeling task data after the Jieba segmentation model, a total of 103,523 characters were identified, with the label categories shown in Table 6.
The cleaned dataset in this study contains a total of 526,047 characters, with 357,241 characters in the training set and 168,806 characters in the testing set. It involves 3995 categories of cost composition factors, covering core production stages such as drilling and blasting parameters, transportation, and loading and hauling. Given the dense technical parameters and lengthy technical terms in open-pit coal mining production texts, a method combining segmentation and manual semantic calibration is adopted. While maintaining the integrity of equipment parameters and the logical coherence of processes, the original text is divided into segments that do not exceed the 512-character limit of the BERT model. This ensures the complete retention of key numerical information such as cost data and production design parameters. Figure 11 shows the Chinese characters in the sentence, and the corresponding labels.
The model is built in a TensorFlow environment, and the specific training environment parameters are shown in Table 7.
The BERT training parameters are shown in Table 8.
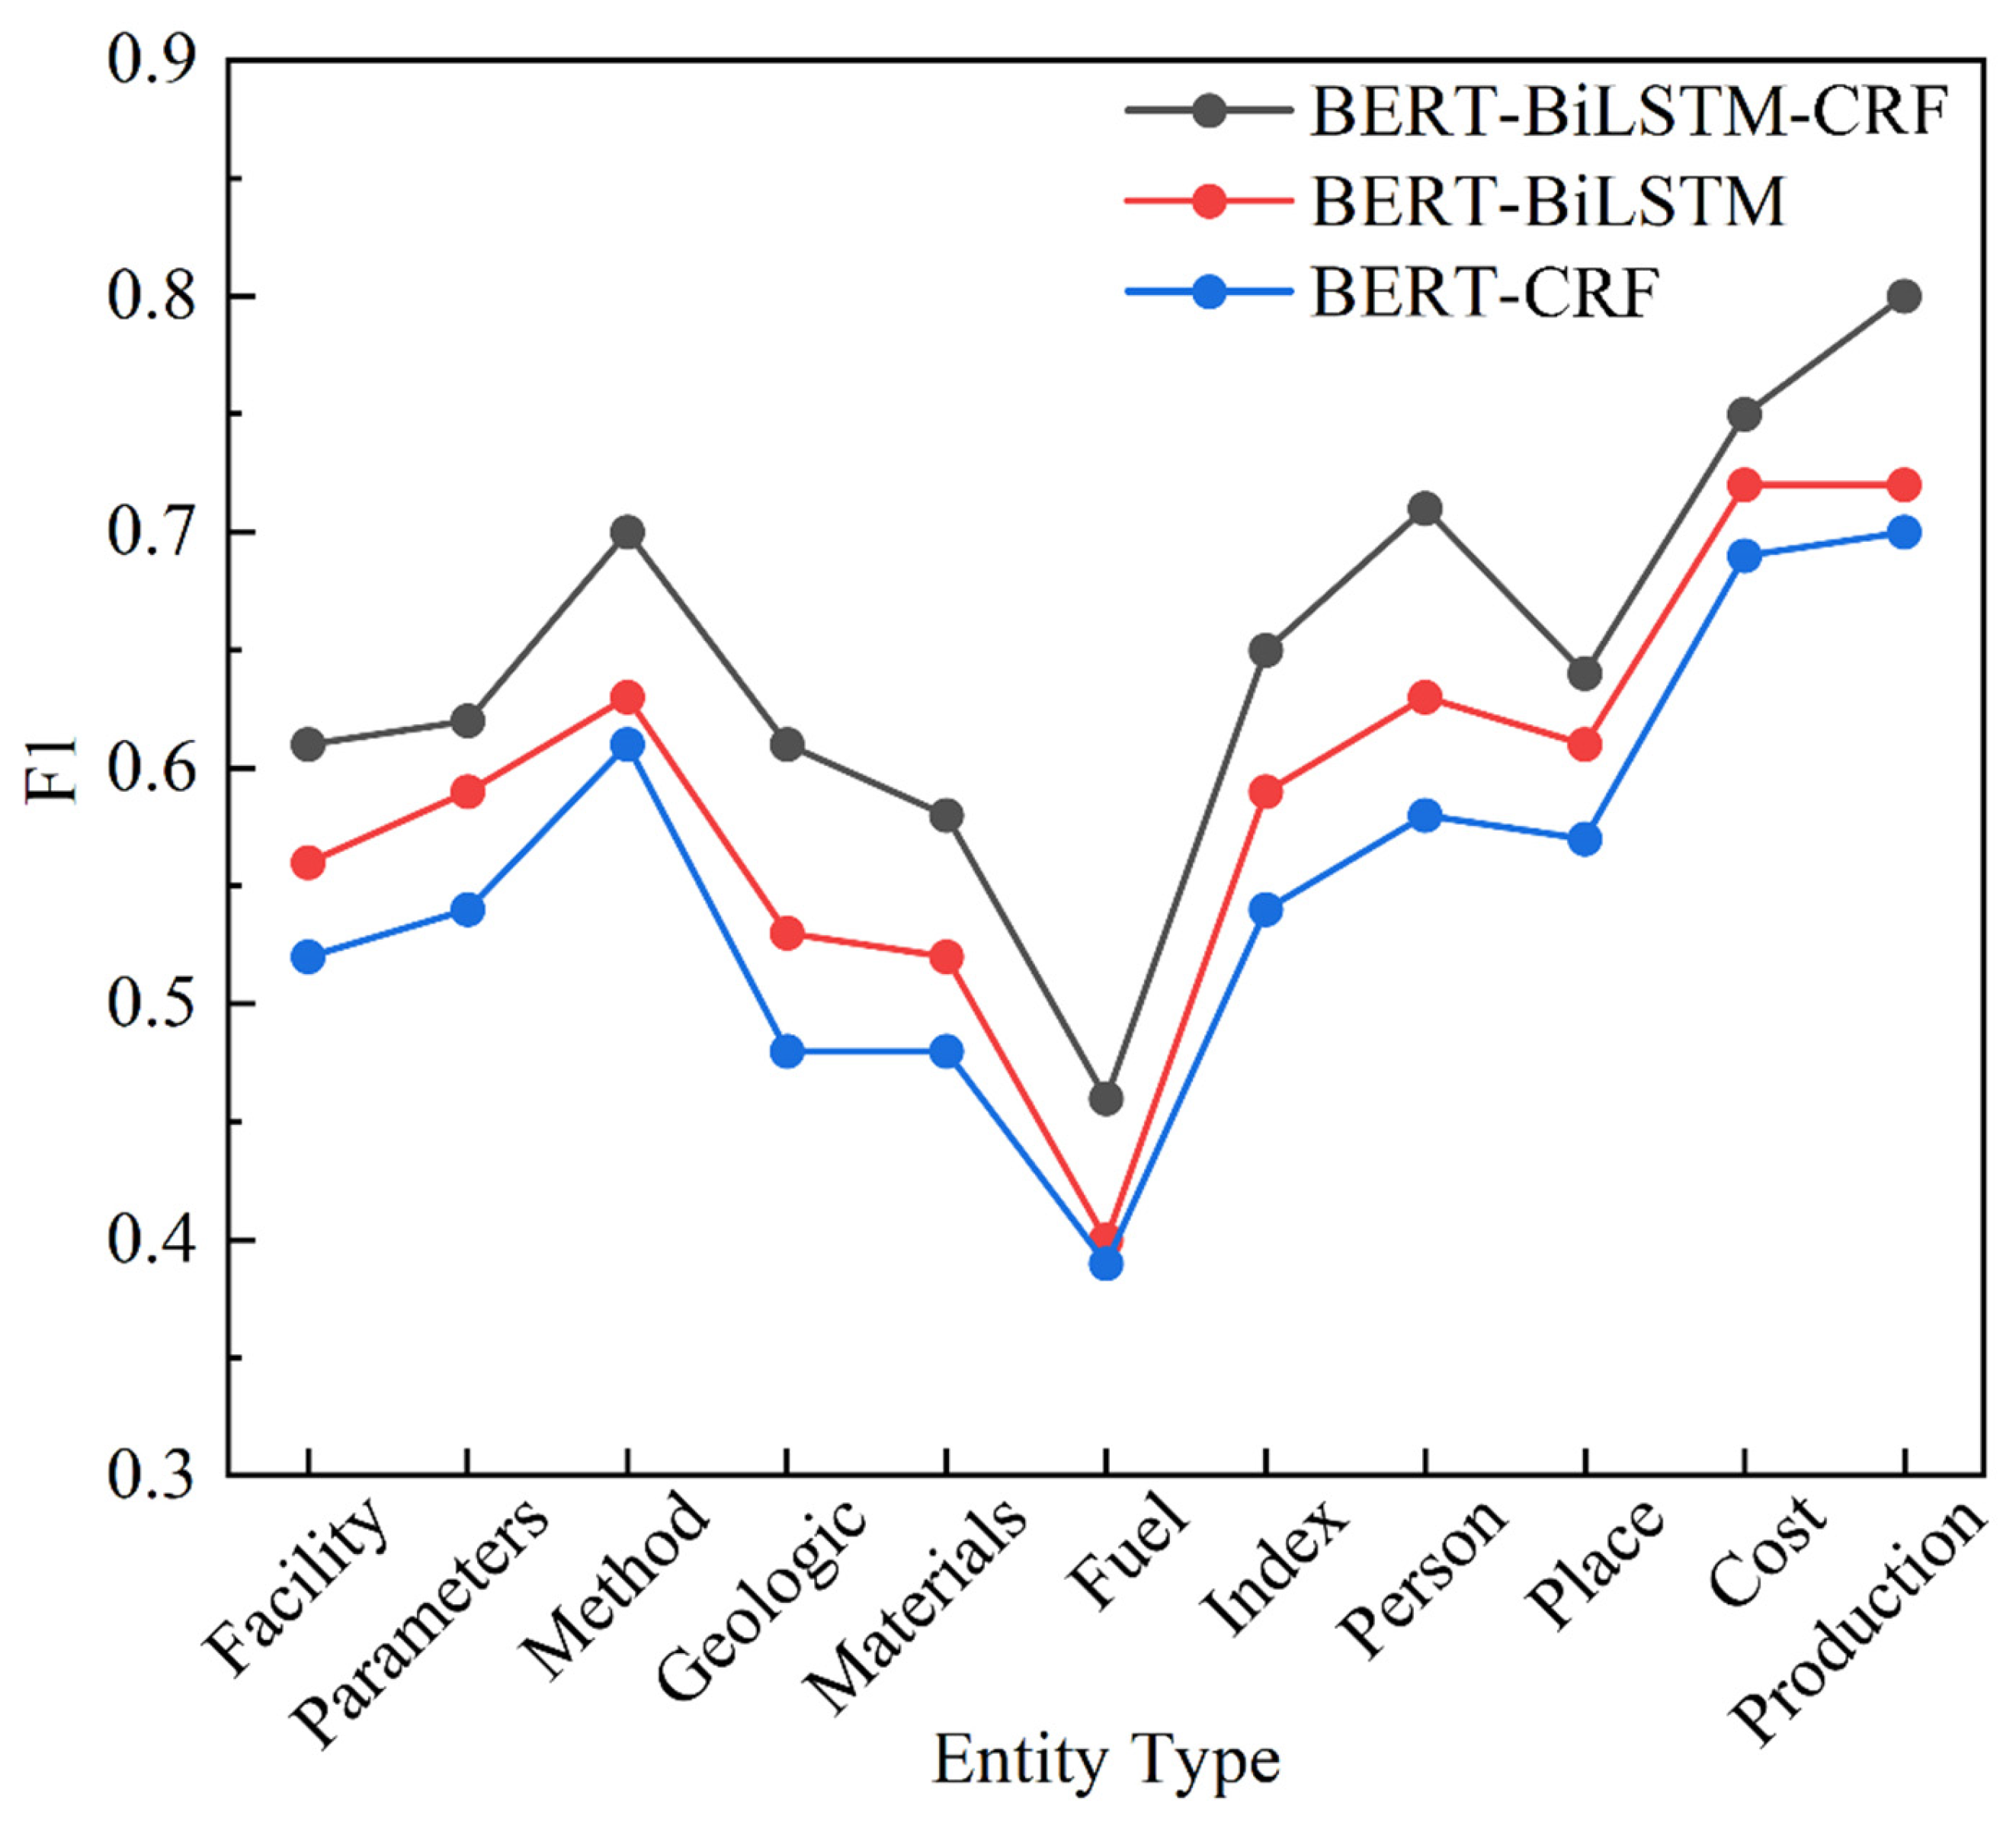
This paper uses the F1-Score to evaluate the annotation performance of the BERT-BiLSTM-CRF named entity recognition model. A higher F1 value indicates better annotation accuracy. The final results for each model, reported as mean ± standard deviation under 5-fold cross-validation (k = 5), are as follows in Table 9 and Figure 12.
As shown above, the BERT-BiLSTM model, due to the lack of CRF’s global decoding optimization for entity label sequences, shows a 9% decrease in average F1 score and significant variation across different entity types, verifying the effectiveness of label transition rules in refining entity boundaries. The BiLSTM-CRF model, constrained by static word embeddings and the absence of contextual dynamics, exhibits a 15.8% drop in F1-score, indicating that the pre-trained model significantly enhances domain-specific semantic understanding. The BERT-BiLSTM-CRF model outperforms the other models in F1-score across all entity types, demonstrating its remarkable superiority. The BERT-BiLSTM-CRF named entity recognition model exhibits hierarchical differences in performance across different entity labels. The F1 score for the production label reaches as high as 0.8. For cost, person, and method labels, the F1 score is greater than 0.7, as the training data is densely distributed with clear semantic boundaries, allowing the model to effectively capture contextual correlations. Except for “Materials” and “Fuel,” all other labels have F1-scores above 0.60. Although below 0.70, the model shows good performance on key cost entities with F1-scores over 0.70, covering core variable cost elements in open-pit coal mine management. These entities have clear features in engineering texts, contributing to better recognition. The lower F1-scores of “Materials” and “Fuel” are due to limited and repetitive content. However, as they belong to stable fixed costs, the impact on overall practical use is minimal.

3.2.3. Entity Relationship Extraction

The open-pit coal mining cost factor knowledge extraction process achieves the automatic extraction of core parameters through structured text parsing. The open function is used to read the Txt file containing open-pit coal mining production cost factors line by line, with each line corresponding to an entry. Entity relationship extraction is completed through hierarchical parsing and semantic segmentation. The specific implementation process is as follows.
First, the hierarchical numbering at the beginning of the specification text is parsed, and a mapping table for Chinese numerals and units (such as “Chapter,” “Section,” and “Article”) is created. Weighted calculations are performed to determine the attribution of entries. When parameters related to the working face are detected in the “Blasting Design” unit, the text is defined as Parameters. If an “Article” unit is detected, it is recognized as a detailed cost influencing factor, and the cost influencing factor attribute value is set based on the context. This process can accurately distinguish between the macro cost framework and micro cost factors.
Next, for the detailed cost item text, such as “In the equipment operation and maintenance costs, the equipment model is 1250LCK, the diesel consumption is 0.8 L/ton of coal, and the transportation cost increases by 18% when the bench height exceeds 10 m,” the clauses are first split using a semicolon, and the find function is used to locate key descriptors. The core influencing factors are extracted from the text segment before the “equipment model” to the quantified parameter. At the same time, quantified parameters such as “diesel consumption of 0.8 L/ton of coal” are identified as relationship attributes and stored accordingly. For descriptions containing dynamic conditions, such as “bench height greater than 10 m,” these are converted into relationship weight parameters, and a triple “bench height → Positive correlation → transportation cost” is established. Finally, text segments that do not match the corresponding node relationships, such as purely descriptive clauses like “significant impact on economic benefits,” will be output to the pending entries txt file for manual mapping supplementation.

3.2.4. Knowledge Inference

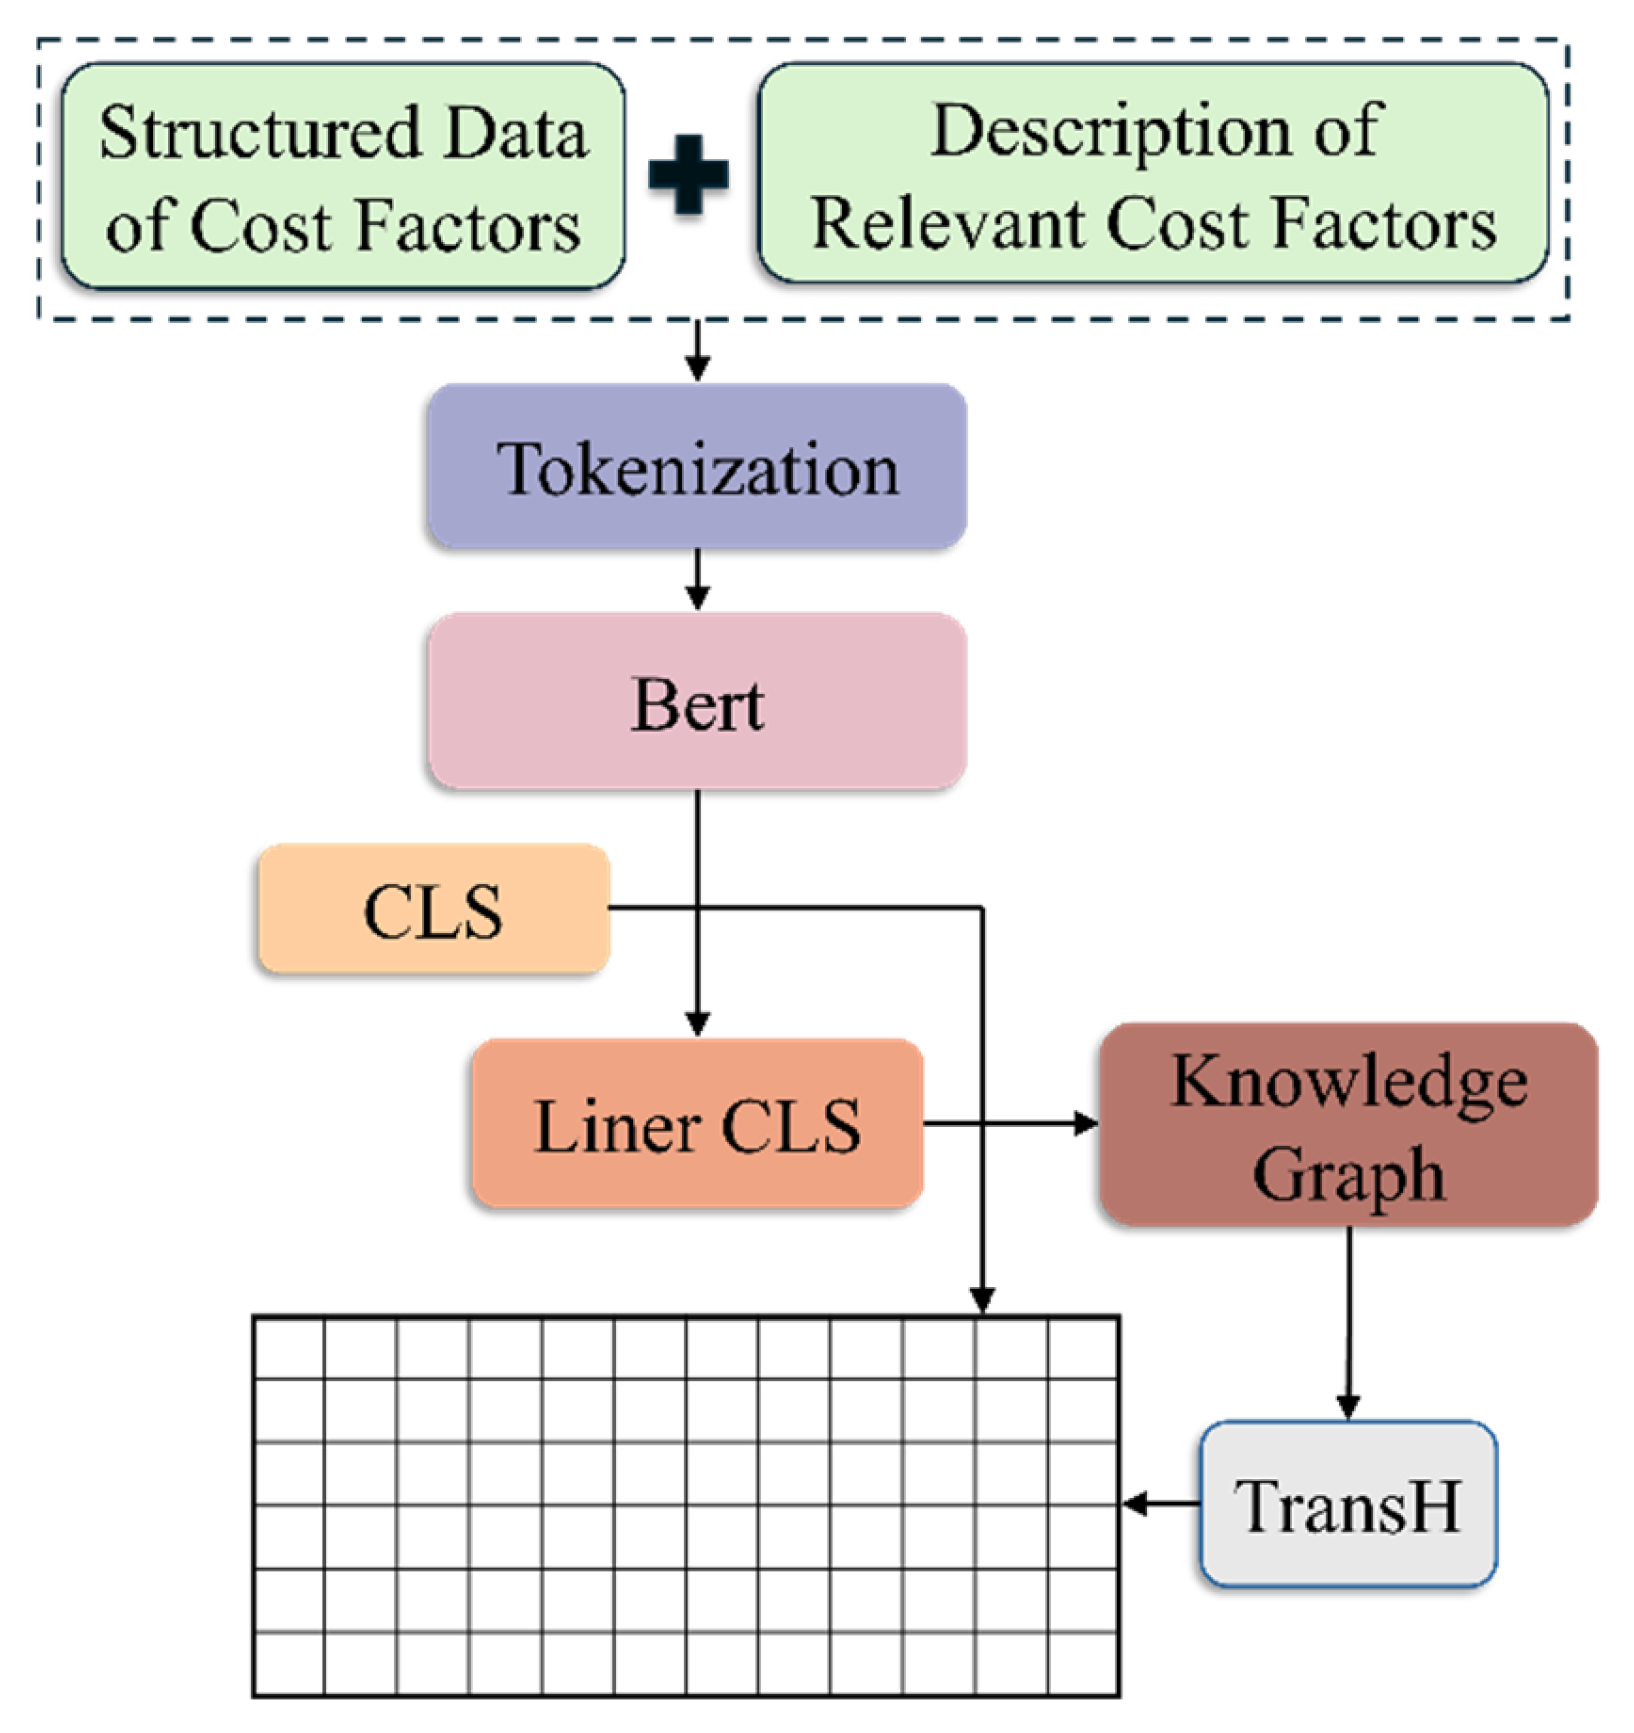
Based on the knowledge graph containing “cost item-driving relationship-specific factor” triples, this paper uses the TransH algorithm to perform embedding representation of structured cost data. Addressing the limitations of traditional cost analysis models, which lack domain knowledge support based on production relationships, the embedding results of the structured cost factor data and their relationship descriptions are concatenated. The concatenated neural network input incorporates knowledge graph prior knowledge, thereby improving factor recognition accuracy.
When performing the embedding concatenation, the nodes, and relationships related to cost factors in the knowledge graph are selected, and their embeddings are concatenated as input to the next level of the neural network. The concatenation process is shown in Figure 13.
In the feature fusion phase, the production-related content in the text is first encoded by BERT and then input to the Softmax classifier to generate operational labels such as “bench height change.” Next, based on the topology of the knowledge graph, the associated entities within the two-hop range of the label node are retrieved, such as “bench height greater than 10 m → diesel consumption increases → equipment operation cost increases,” and the TransH embedding vector is concatenated with the original features. This mechanism enables the recommendation model to simultaneously capture both the explicit features described in the text and the implicit association rules in the knowledge base. When the input text mentions “the rise in the rock mass Poisson’s ratio f,” it automatically associates with structured knowledge such as “explosive consumption adjustment → blasting cost increase.” To balance computational efficiency and representation capability, the TransH embedding dimension is optimized to 128 dimensions, reducing the training time by 62% compared to the full-size 768-dimensional scheme, while the attention weight allocation mechanism ensures the integrity of key feature information.
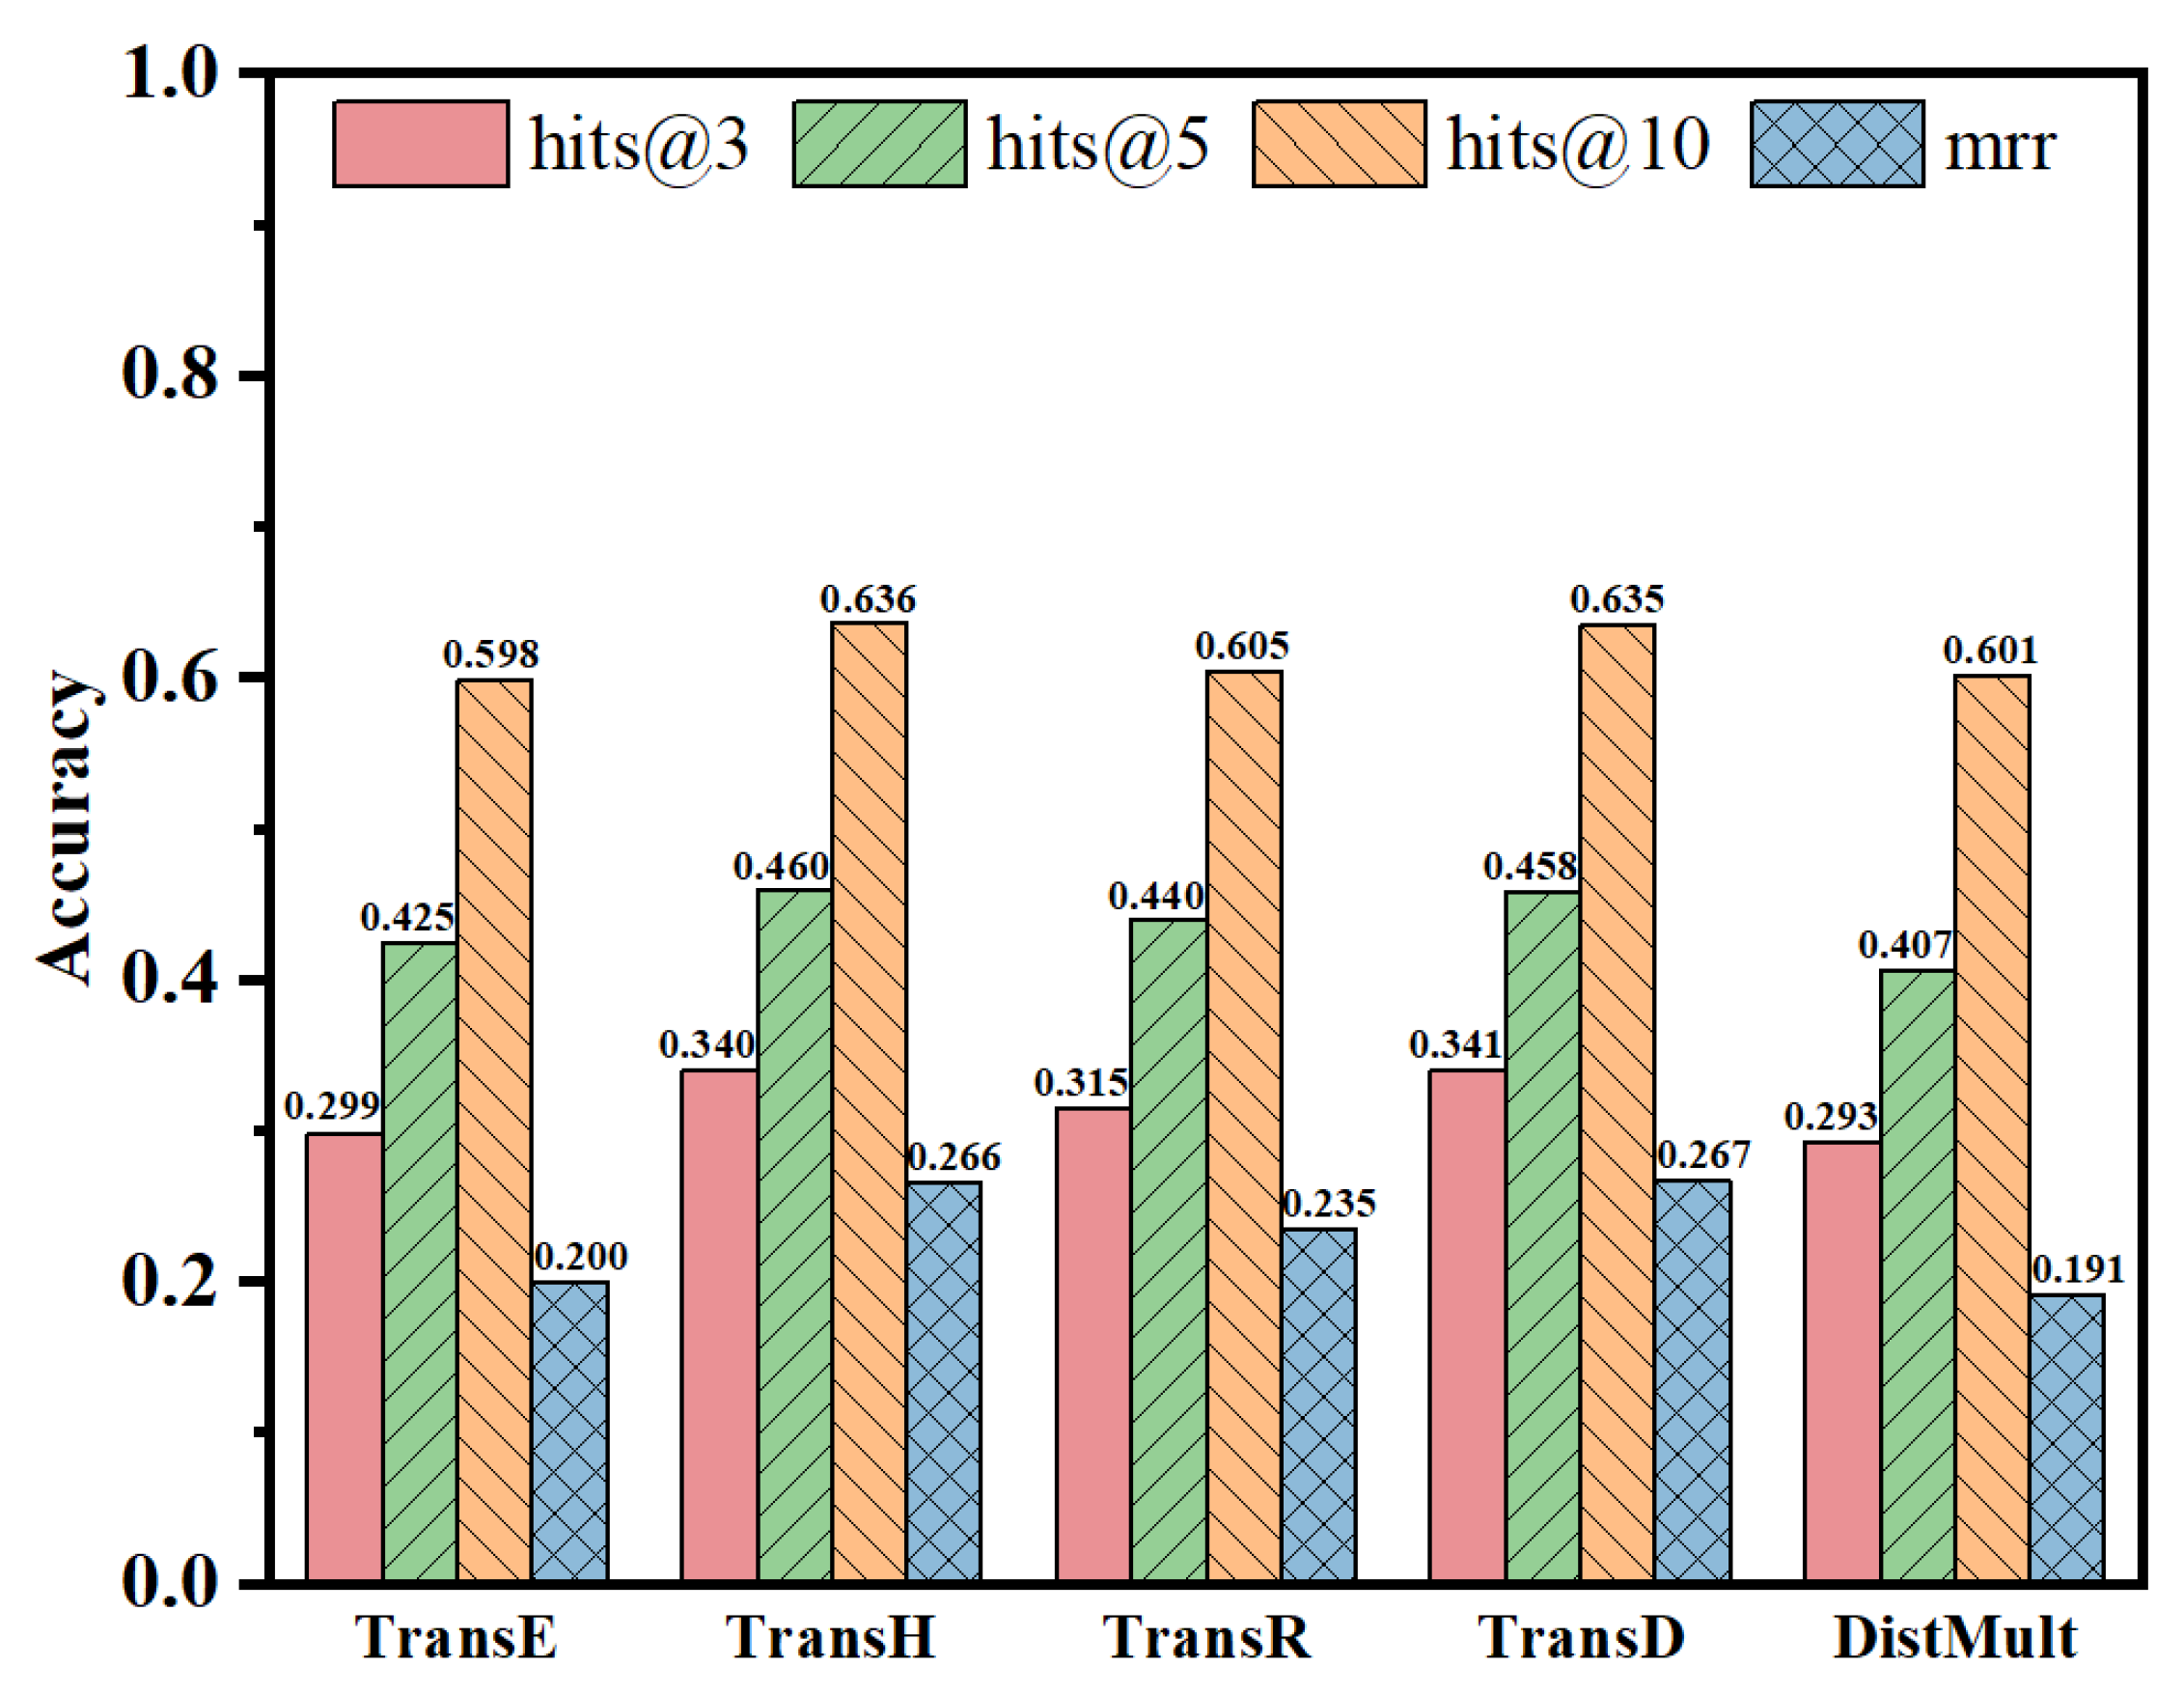
The dataset is divided into three parts: a validation set of 500, a training set of 2055, and a test set of 500. To validate the experimental results, a series of algorithms, including the TransE model, TransH model, TransR model, and TransD model, are used for the cost factor recommendation experiment. The results are shown in Table 10 and Figure 14.
As can be seen from the above, the evaluation metrics of TransH are significantly better than those of TransE and TransR, and are roughly on par with TransD. However, TransH outperforms in hits@5 and hits@10, indicating a stronger ability to capture the correct answers within a larger retrieval range. This makes it more suitable for comprehensive analysis of cost items influenced by numerous cost factors. Additionally, the convergence time of TransH is approximately 15% shorter than that of TransD [48]. Therefore, it can be concluded that the application of TransH in the open-pit coal mining cost knowledge graph is more effective.
The experimental results indicate that TransH consistently outperforms TransE, TransR, and DistMult across all evaluation metrics. Specifically, the MRR of TransH exceeds that of TransE, TransR, and DistMult by 33%, 13.2%, and 29.8%, respectively. Performance is generally comparable to TransD, with both models representing the best results on the dataset. Although TransD achieves a marginally higher hits@3 by only 0.001, TransH yields better hits@5 and hits@10 values—reaching 0.460 and 0.636, respectively—demonstrating stronger capability in retrieving correct candidates over a broader search range. This characteristic makes TransH more suitable for analyzing cost items affected by multiple interacting factors.
Moreover, the convergence time of TransH is approximately 15% shorter than that of TransD [49]. Compared to the bilinear model DistMult, TransH achieves higher values on all key metrics, with improvements of 16%, 13%, and 7% in hits@3, hits@5, and hits@10, respectively. This demonstrates that hyperplane-based models more effectively capture the symmetric and antisymmetric relationships embedded in cost propagation paths. In contrast, DistMult assumes symmetric interactions, limiting its capacity to model cascading effects between cost factors. TransH is therefore more suitable for domain-specific reasoning tasks in open-pit mining.
In conclusion, while TransD shows a slight advantage in hits@3 and MRR, TransH outperforms in hits@5 and hits@10—metrics more relevant for wide-range retrieval analysis. Combined with its shorter convergence time, TransH achieves a better balance between performance and efficiency, making it the preferred choice for constructing knowledge graphs that support complex cost association analysis in open-pit coal mining.
It reveals the relationship weights of cost factors with different features through inference. The local weights centered around blasting lumpiness are shown in Figure 15, which demonstrates the weight transmission principle of cost cascade inference, thereby improving the interpretability of the model.

3.3. Knowledge Storage and Representation

3.3.1. Knowledge Storage Based on Neo4j

The Neo4j graph database is used to organize, index, and store node relationships with key–value properties. Full transaction management is supported, together with high availability and scalability. The database is well suited to association-intensive data. Accordingly, Neo4j is adopted in this study to store open-pit coal mining cost factors, which include large volumes of unstructured data.
The specific code for generating node relationships is as follows: MATCH (e: Equip{name: “Excavator”}), (c: Cost{name: “Equipment Maintenance Cost”}) CREATE (e)-[r4: Affect]->(c) RETURN r4; MATCH (p: Parameter {name: “Transport Distance”}, (c: Cost {name: “Diesel”}) CREATE (p)-[r5: Positive]->(c) RETURN r5.

3.3.2. Knowledge Graph Visualization

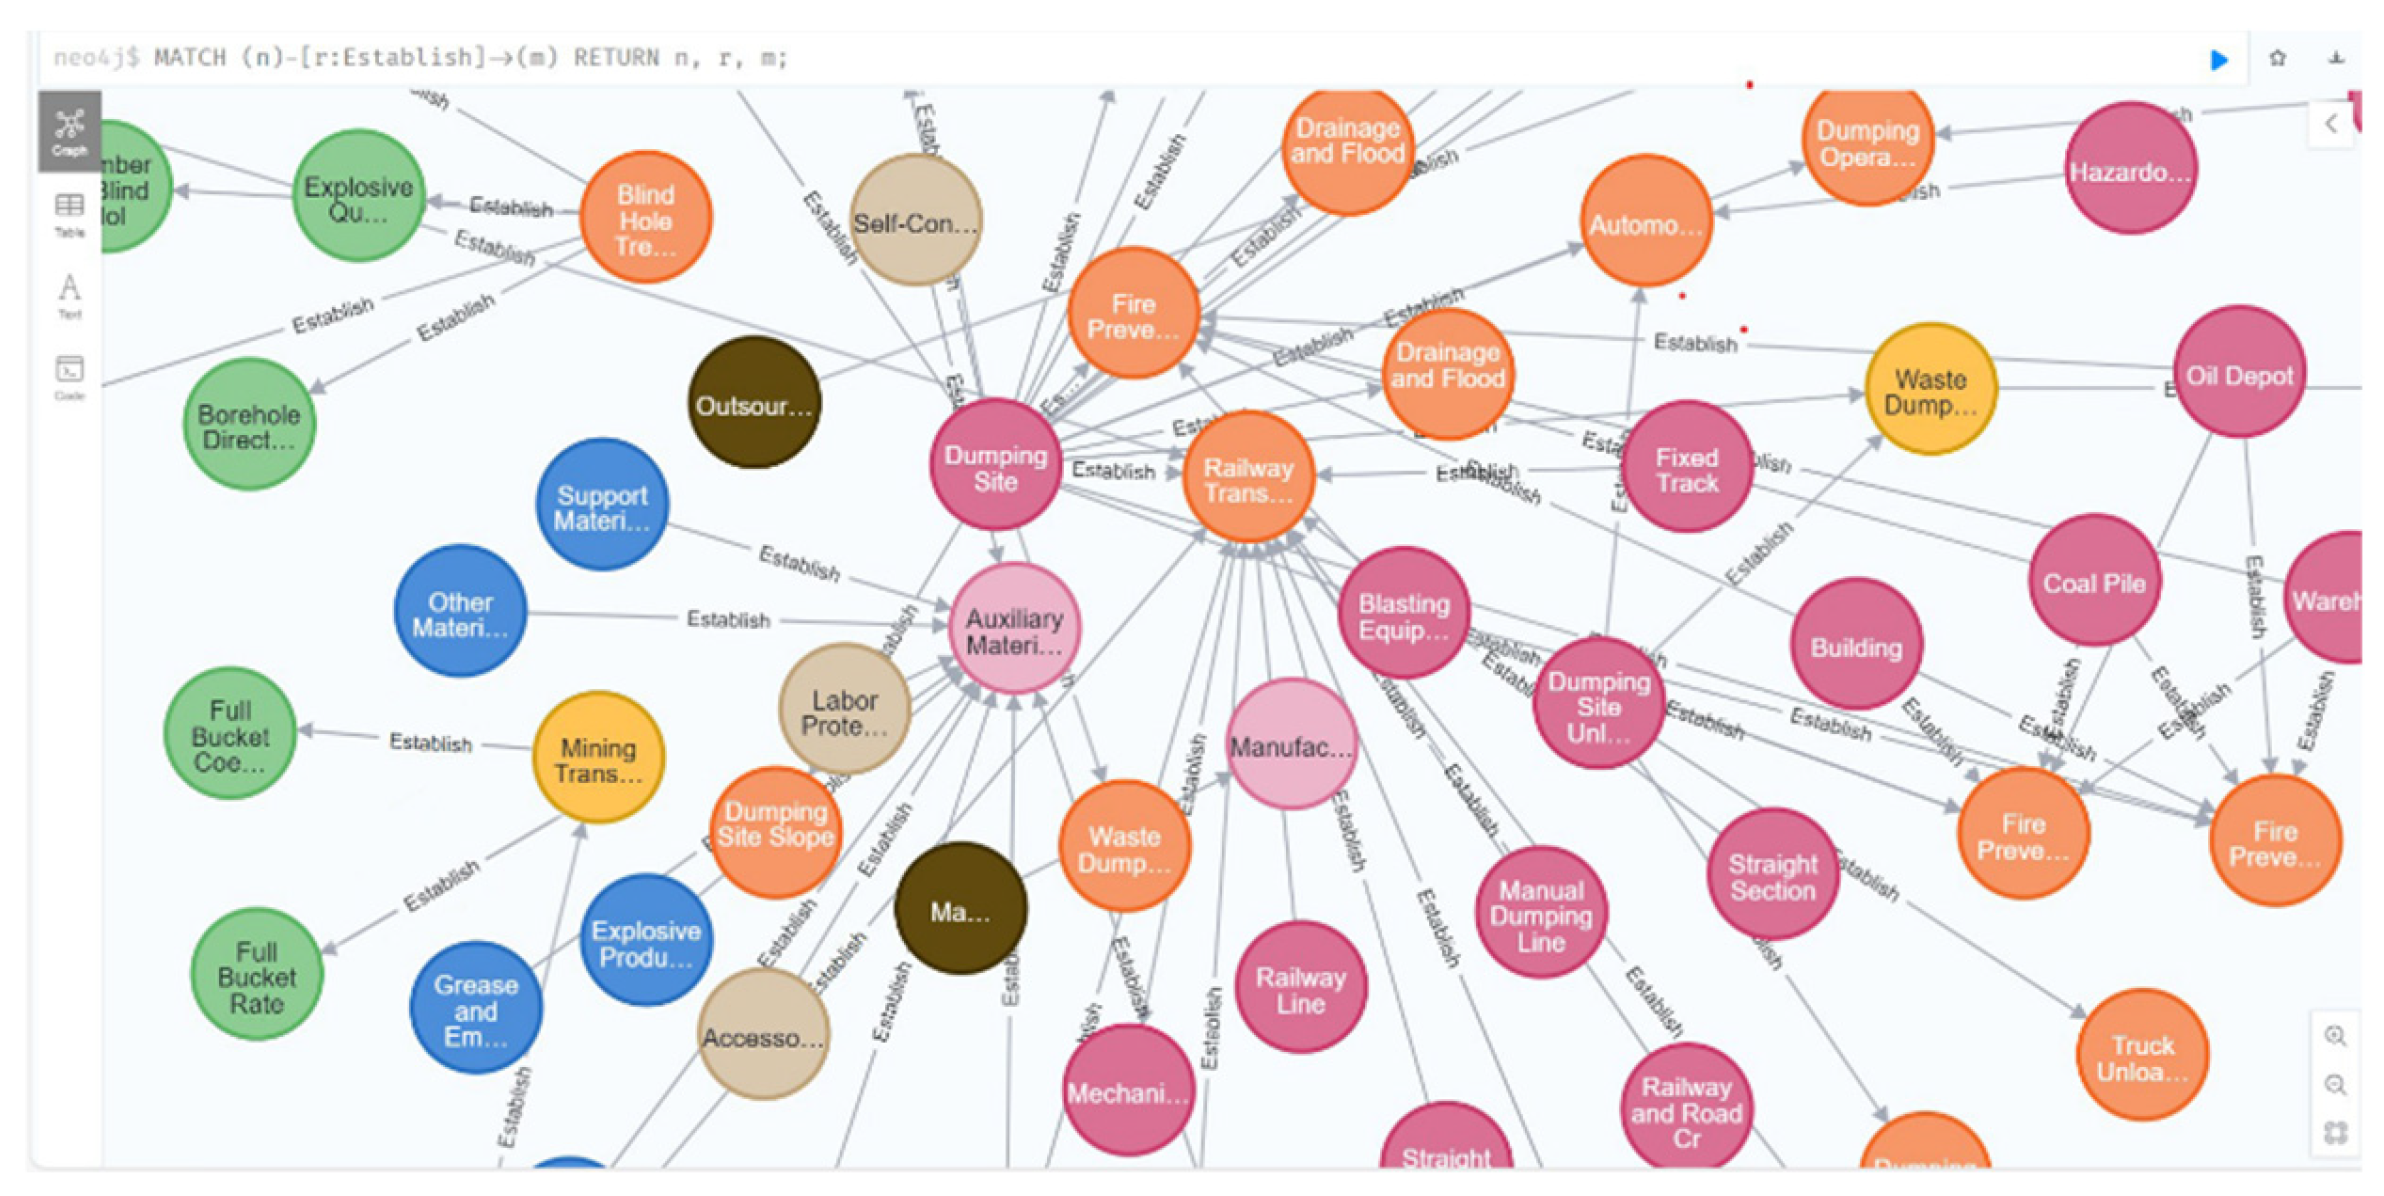
The constructed knowledge graph is shown below. Entities are represented by circles, and relationships are represented by arrowed lines. The rounded rectangles on the right side of the knowledge graph represent all entity types included in the graph.
Based on the previous knowledge extraction and knowledge import work, a total of 3995 entities and 6035 relationships were obtained, which displays the data import interface for Neo4j. The data is stored for efficient querying.

3.4. Knowledge Query

The visualization interface of the knowledge graph weaves specific entities and their relationships into a complete cost factor network. By querying entity information, one can understand which types of entity cost factor fluctuations impact the overall cost. When querying “transportation cost,” the system can expand to associate multiple dimensions of related entity types, such as blasting lumpiness, transport distance, and bucket-to-shovel matching.
In addition, through entity disambiguation and association mapping, the traditional cost analysis issue of ambiguous factor influence relationships has been successfully addressed. By using relationship queries, cost factors for multiple explanatory dimensions, such as transportation costs and dumping costs, can be obtained, enabling the rapid identification of cost factors that need to be precisely controlled and processes that need improvement. For example, distinguishing between the “full bucket rate” of excavators in the loading and hauling stage and the “full bucket rate” of trucks in production transportation clarifies the specific references of similar terms. This cost factor matching mechanism allows cost managers to accurately pinpoint the source of cost changes, effectively supporting decision-making. Overall, this structured knowledge representation breaks down the data silos in traditional cost management, integrating discrete factors such as process parameters, equipment operation, and production design into a dynamic relational network, providing a decision-support framework with causal reasoning capabilities. As shown in Figure 16.
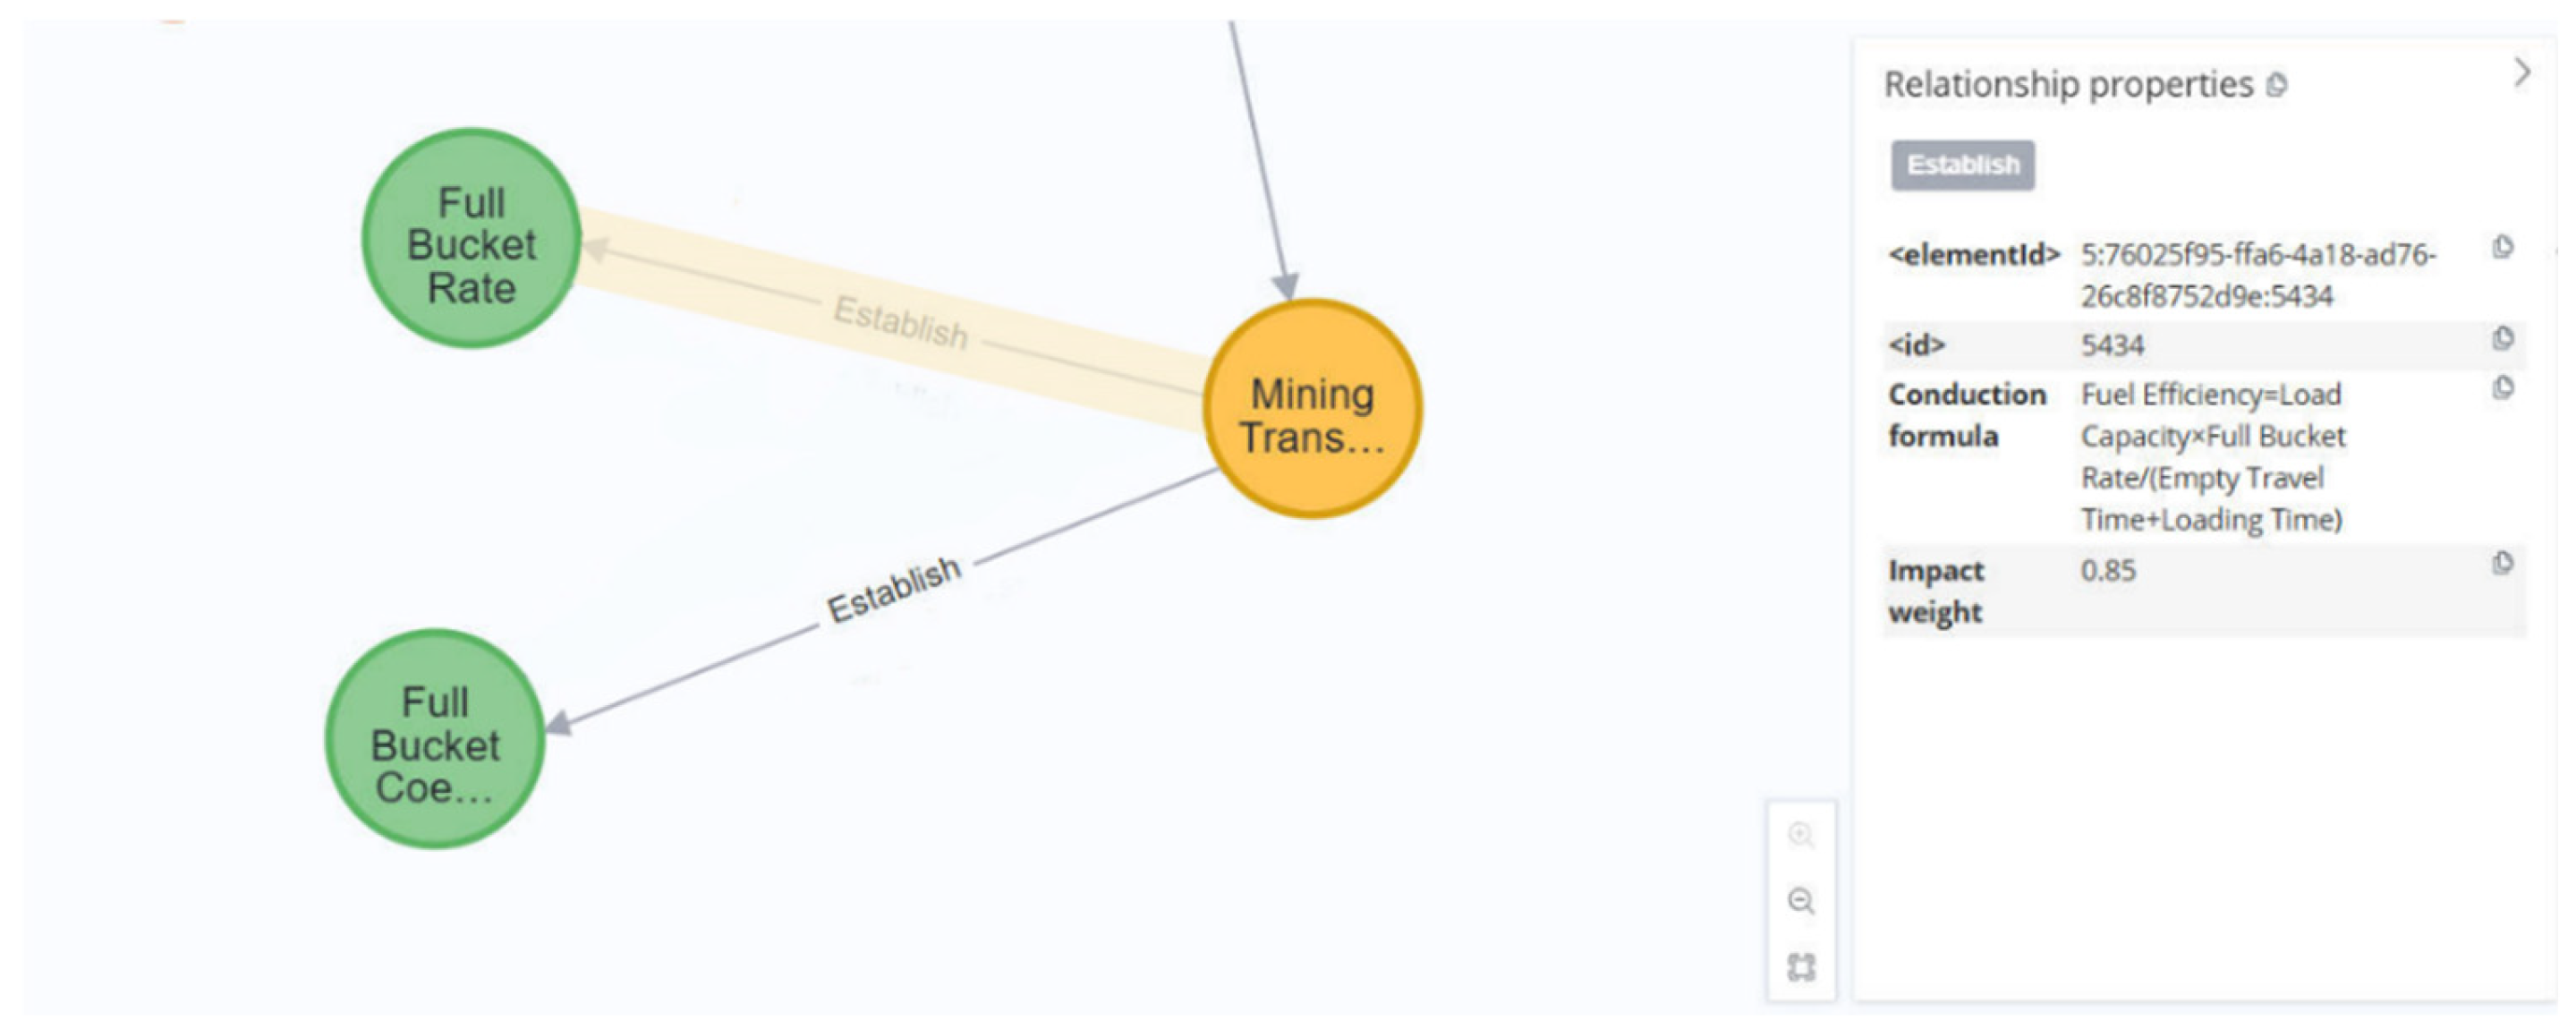
The content circled in Figure 17, which illustrates the transmission formula and influence weights for the “full bucket rate” on the “mining transportation” attribute definition. This can reflect the transmission relationship between cost-influencing factors and the degree of impact, providing data support for factor recognition.

3.5. Validation of Priority Ranking Accuracy for Cost Factors

Accuracy Validation

To verify the accuracy of the factor prioritization in knowledge recommendation, 15 experts in the field of open-pit coal mine cost management were invited to evaluate the correlations among the 8 cost influencing factors listed using a five-point Likert scale. A summary table of factor weights was obtained using the traditional entropy weight method. The original decision matrix results are shown in Table 11.
After applying min-max normalization to perform linear transformation, the results are scaled into the [0, 1] interval, resulting in the standardized matrix of cost influencing factors. Subsequently, the information entropy of each indicator and the corresponding weights are calculated using Equations (18) and (19), respectively.
E j = 1 ln n i = 1 N P i j ln P i j
where P i j = x i j i = 1 n x i j .
W j = 1 E j m E j ( 0 j m )
The entropy weighted and sequential Ranking of cost-influencing factors obtained through the entropy weighting method are shown in Table 12.
As shown in Table 12, the ranking differences of eight influencing factors are zero, indicating that the order of these factors based on node attribute values is completely consistent with that obtained by the entropy weight method. This consistency verifies the reliability and accuracy of the deep learning approach in identifying the importance of key factors. Compared with the traditional cost management process, the node attribute ranking in the deep learning framework requires no additional indicator normalization, weight calculation, or consistency testing, nor does it rely on repeated expert scoring or rule maintenance. It significantly reduces manual computation and communication time, enabling faster screening during cost management.

3.6. Cost Influencing Factor Identification and Decision Support System

System: Display

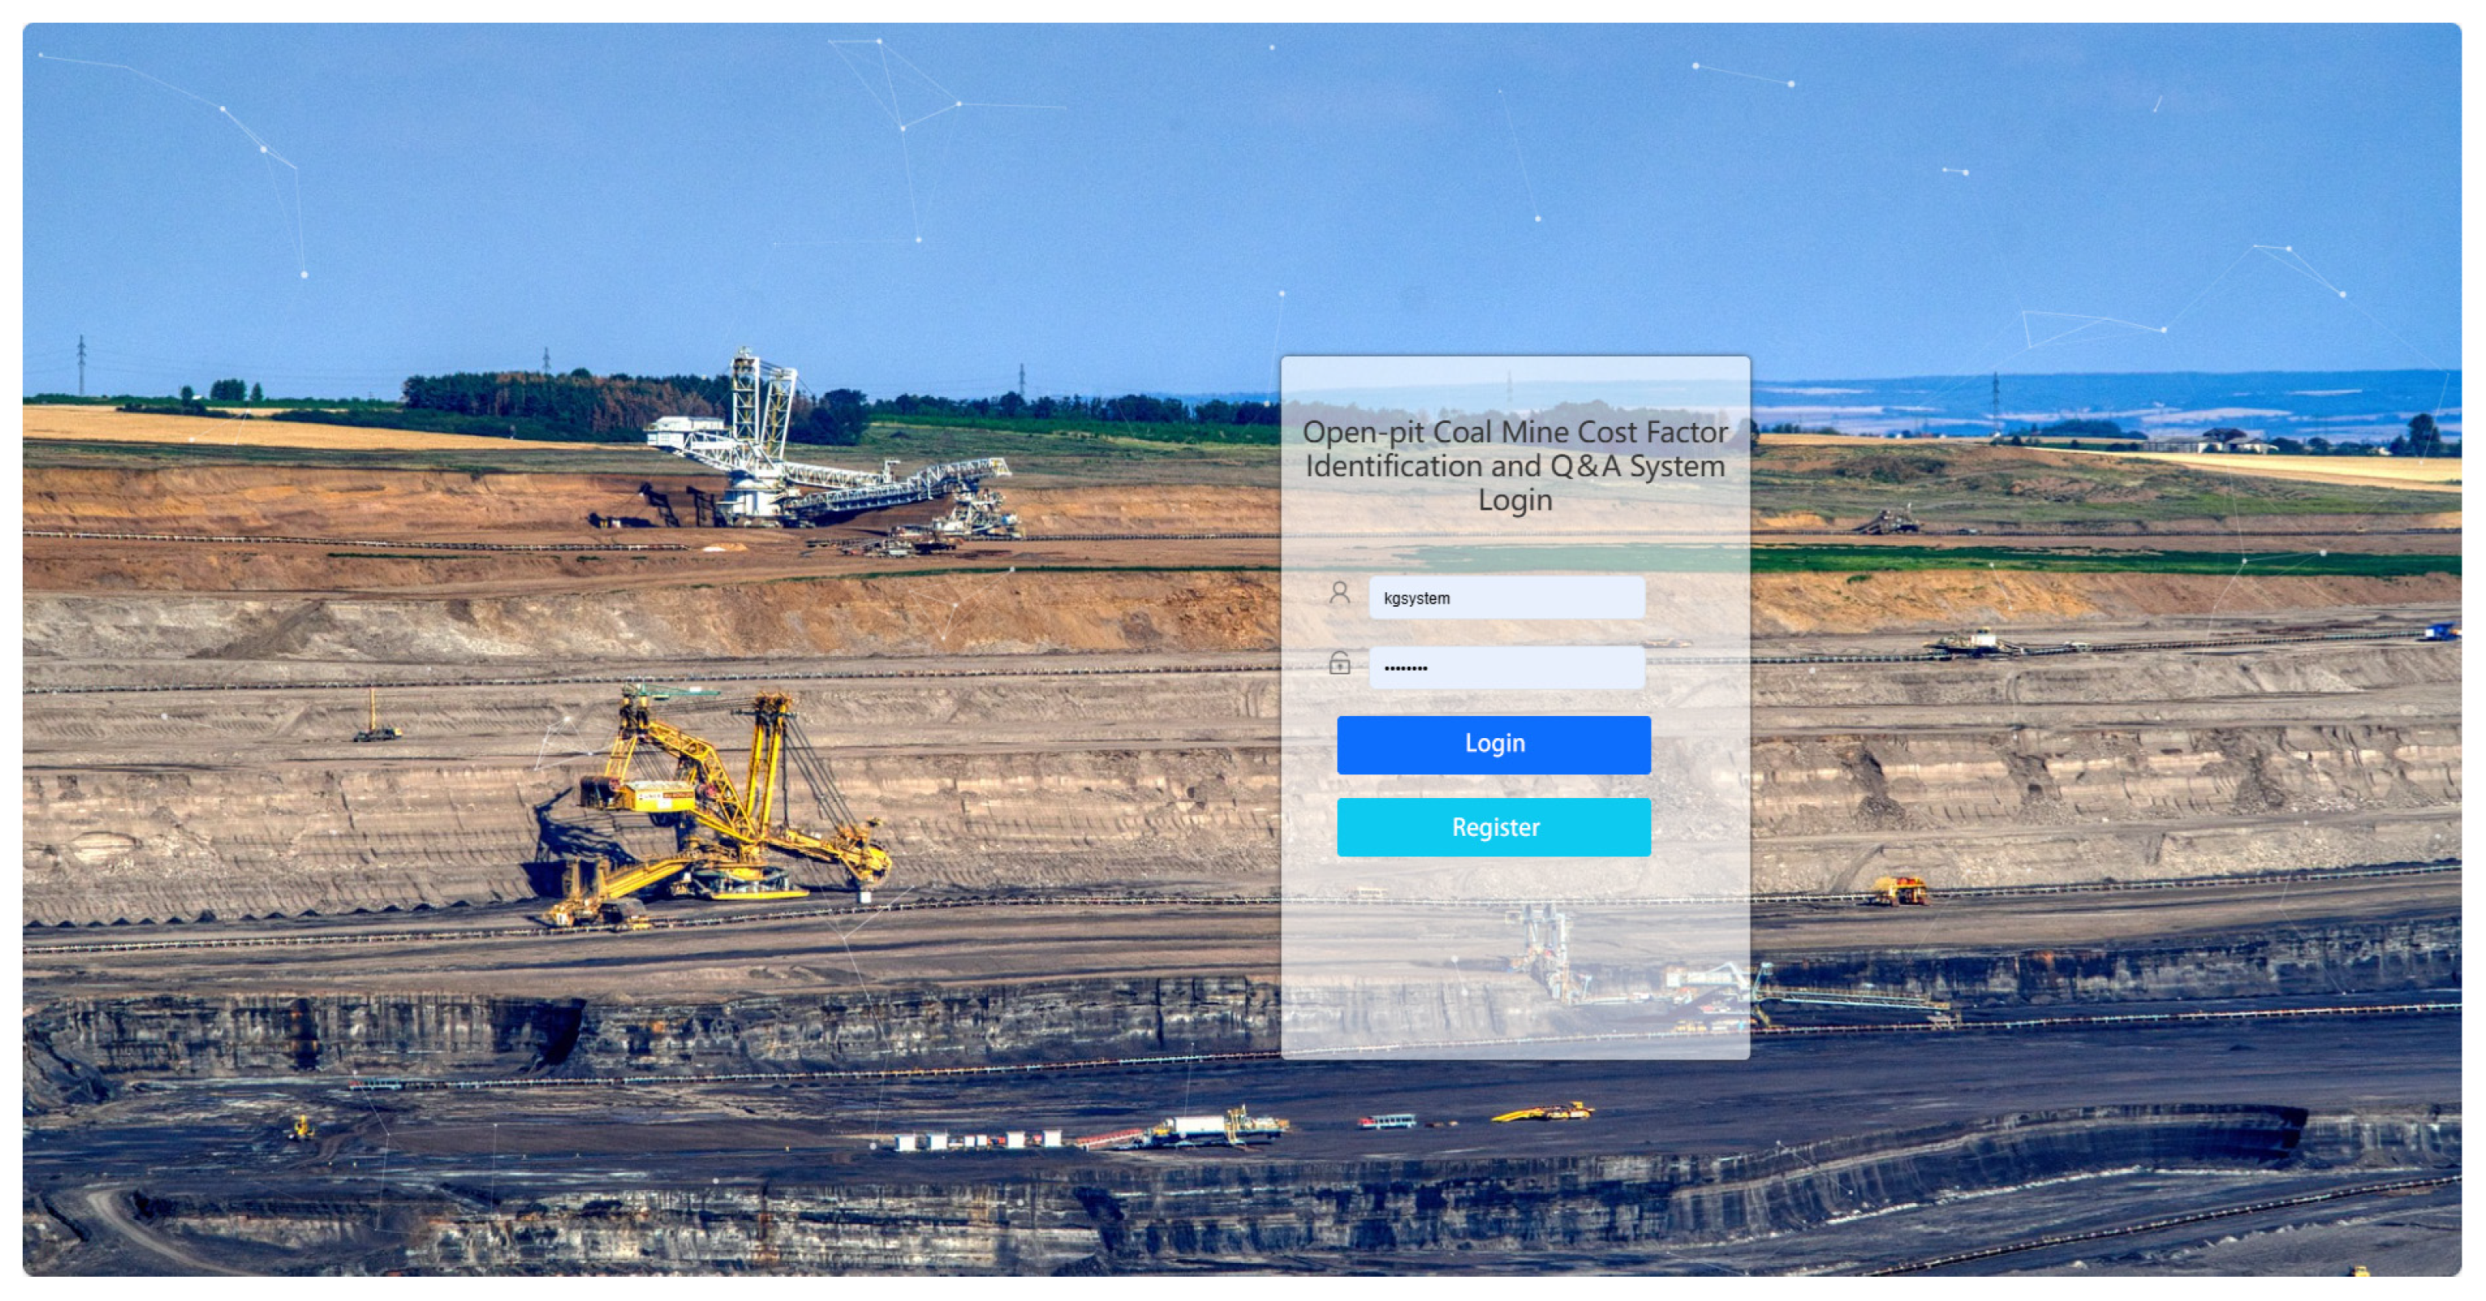
This section presents the developed open-pit mine cost factor identification and knowledge recommendation system, implemented through a web-based interface with interactive features. Figure 18 illustrates the main interface of the knowledge graph-based recommendation system.
The system’s main interface comprises two sections: a left-hand function list and a right-hand Q&A panel. When using the Q&A feature, users enter their queries in the input box, for example: “What is the proportion of transportation costs within open-pit coal mining production costs? Please list the top five specific cost factors for this category and rank them by importance.” Figure 19 illustrates the interface state during query submission and answer generation.

4. Conclusions

The open-pit coal mining cost knowledge graph constructed in this study effectively addresses the problem of fragmented cost data and provides a symmetry-based perspective for understanding the bidirectional causality among cost factors, thereby contributing to more interpretable and balanced decision-making in mining operations. The knowledge Q&A system provides new methodological support for production decision optimization. However, the system has limitations, particularly due to the limited data sources, and it cannot provide effective answers when queries fall outside the scope of knowledge. The specific conclusions are shown below.
1. A cost knowledge graph covering the entire production cycle was constructed by integrating 23 standard specification documents and 80 cost research papers. The BERT-BiLSTM-CRF model was employed to automatically extract information from unstructured text, and the accuracy issues in compound entity recognition observed in traditional methods were alleviated. The resulting knowledge network contains 3995 cost-factor entities and 6035 associated relationships, forming a “cost item-driving relationship-specific parameter” knowledge schema. The BERT-BiLSTM-CRF model demonstrated strong recognition capabilities with F1-scores above 0.7 for key entities such as production, cost, and personnel, supporting the automatic extraction of cost factors in open-pit coal mining. A hybrid human–machine knowledge extraction workflow was introduced to provide a foundation for domain knowledge integration.
2. The TransH graph-embedding algorithm was applied to model cost-transmission relationships. Transmission paths and inter-factor weight associations were analyzed using self-attention weights and node-level attribute values, which outperformed traditional baselines in inference metrics, with a Hits@10 of 0.636, reflecting its stronger reasoning capacity in capturing complex cost dependencies, making it suitable for real-world cost optimization tasks. Cascading cost inference was thereby enabled.
3. Interactive graph querying is supported on the Neo4j visualization platform and combined with semantic retrieval to form a dual-channel intelligent recognition system, thereby improving the efficiency of cost knowledge querying and analysis. Nevertheless, a 10–15% recognition error persists in low-sample entity labeling scenarios, and the quality of annotations requires further optimization via an active learning mechanism.
In future research, when dealing with large-scale and heterogeneous mining data, further optimization of model architecture and training strategies may be required. The incorporation of more advanced pre-trained language models and self-supervised learning techniques could further enhance performance, especially under low-resource scenarios. To improve generalization and field applicability, the current framework can be extended by integrating multimodal information such as environmental sensors, drone imagery, or process telemetry. In terms of practical deployment, the Neo4j-based cost knowledge graph can be connected to enterprise-level mine management systems, to enable real-time cost warning and path-based reasoning. Moreover, the question-and-answer interface can be modularized as a service API, supporting intelligent interaction across departments such as blasting design, equipment dispatch, and cost control. These enhancements will significantly expand the system’s openness and extensibility, paving the way for full-scale adoption in intelligent mining scenarios.

Author Contributions

J.S.: Writing—original draft, Visualization, Software, Methodology, Conceptualization. P.L.: Writing—review and editing. W.G.: Writing—review and editing, Visualization. X.C.: Writing—review and editing. H.W.: Writing—review and editing. S.X.: Writing—review and editing. All authors have read and agreed to the published version of the manuscript.

Funding

The Xinjiang Autonomous Region Major Science and Technology Project: Precision and Green Blasting Technology for Strategic Metal Mining in Ultra-High Altitude Areas with the funding account number of 2024A03001-2; Xinjiang Uygur Autonomous Region Science and Technology Plan Project—Major Science and Technology Special Project, 2024A01002-1; This research was funded by the Science and Technology Plan Project of Kekedala City, the Fourth Division of the Xinjiang Production and Construction Corps, grant number 2025ZR005; Xinjiang Uygur Autonomous Region “Tianshan Talents” Scientific Research Project—Young Top Talents, 2023TSYCCX0081.

Data Availability Statement

The original contributions presented in this study are included in the article. Further inquiries can be directed to the corresponding authors.

Conflicts of Interest

Authors Pingfeng Li and Shoudong Xie were employed by the company Hongda Blasting Engineering Group Co., Ltd., Changsha 410011, China. The remaining authors declare that the research was conducted in the absence of any commercial or financial relationships that could be construed as a potential conflict of interest.

References

  1. Tan, Z.; Chen, X. Discussion on situation and development countermeasures of coal enterprise informatization construction. J. Mine Autom. 2016, 42, 63–66. [Google Scholar]
  2. Shim, H.-J.; Ryu, D.-W.; Chung, S.-K.; Synn, J.-H.; Song, J.-J. Optimized blasting Design for Large-scale Quarrying based on a 3-D Spatial Distribution of Rock Factor. Int. J. Rock Mech. Min. Sci. 2009, 46, 326–332. [Google Scholar] [CrossRef]
  3. Badakhshan, N.; Shahriar, K.; Afraei, S.; Bakhtavar, E. Determining the environmental costs of mining projects: A comprehensive quantitative assessment. Resour. Policy 2023, 82, 103561. [Google Scholar] [CrossRef]
  4. Akintoye, A. Analysis of factors influencing project cost estimating practice. Constr. Manag. Econ. 2000, 18, 77–89. [Google Scholar] [CrossRef]
  5. Russell, L.B.; Bhanot, G.; Kim, S.-Y.; Sinha, A. Using cluster analysis to group countries for cost-effectiveness analysis: An application to sub-saharan africa. Med. Decis. Mak. 2018, 38, 139–149. [Google Scholar] [CrossRef]
  6. Thengane, S.K.; Hoadley, A.; Bhattacharya, S.; Mitra, S.; Bandyopadhyay, S. Cost-benefit analysis of different hydrogen production technologies using AHP and Fuzzy AHP. Int. J. Hydrogen Energy 2014, 39, 15293–15306. [Google Scholar] [CrossRef]
  7. Nadeau, D.; Sekine, S. A survey of named entity recognition and classification. Lingvisticae Investig. 2007, 30, 3–26. [Google Scholar] [CrossRef]
  8. Collins, M.; Singer, Y. Unsupervised models for named entity classification. In Proceedings of the 1999 Joint SIGDAT Conference on Empirical Methods in Natural Language Processing and very Large Corpora, College Park, MD, USA, 21–22 June 1999; Springer: Berlin/Heidelberg, Germany, 1999. [Google Scholar]
  9. Liu, P.; Yuan, W.; Fu, J. Pre-train, prompt, and predict: A systematic survey of prompting methods in natural language processing. ACM Comput. Surv. 2023, 55, 1–35. [Google Scholar] [CrossRef]
  10. Jahan, M.S.; Khan, H.U.; Akbar, S.; Farooq, M.U.; Gul, S.; Amjad, A. Bidirectional Language Modeling: A Systematic Literature Review. Sci. Program. 2021, 2021, 6641832. [Google Scholar] [CrossRef]
  11. Santoso, J.; Setiawan, E.I.; Purwanto, C.N.; Yuniarno, E.M.; Hariadi, M.; Purnomo, M.H. Named entity recognition for extracting concept in ontology building on Indonesian language using end-to-end bidirectional long short term memory. Expert Syst. Appl. 2021, 176, 114856. [Google Scholar] [CrossRef]
  12. Huang, Z.; Xu, W.; Yu, k. Bidirectional LSTM-CRF models for sequence tagging. arXiv 2015, arXiv:1508.01991. [Google Scholar] [CrossRef]
  13. Li, P.; Lin, W.; Wang, Y.; Xu, N.; Zhu, W.; Liu, W. Semi-supervised named entity recognition in low-resource domains: A case study of rare earth elements in coal. Ore Geol. Rev. 2025, 185, 106796. [Google Scholar] [CrossRef]
  14. Zhou, Z.; Wei, L.; Luan, H. Deep learning for named entity recognition in extracting critical information from struck-by accidents in construction. Autom. Constr. 2025, 173, 106106. [Google Scholar] [CrossRef]
  15. Jin, J. Fault diagnosis of coal mine equipment based on improved ga optimized BP neural network. Int. J. Smart Home 2016, 10, 275–284. [Google Scholar] [CrossRef]
  16. Pan, L.; Zhang, J.; Zhang, Y. Construction of knowledge graph in coal mine domain. Comput. Appl. Softw. 2019, 36, 47–64. [Google Scholar]
  17. Liu, Y.; Wang, H. Fire and coupling disaster emergency management based on mapping knowledge domain. Saf. Coal Mines 2022, 53, 144–150. [Google Scholar]
  18. Xu, N.; Liang, Y.; Guo, C.; Meng, B.; Zhou, X.; Hu, Y.; Zhang, B. Entity recognition in the field of coal mine construction safety based on a pre-training language model. Eng. Constr. Archit. Manag. 2025, 32, 2590–2613. [Google Scholar] [CrossRef]
  19. Zhai, S.; Guo, L.; Gao, S.; Meng, B.; Zhou, X.; Hu, Y.; Zhang, B. Method for Knowledge Graph Completion Based on Bayesian Reasoning. J. Chin. Comput. Syst. 2018, 39, 133–137. [Google Scholar]
  20. Bordes, A.; Usunier, N.; Garcia-Duran, A.; Weston, J.; Yakhnenko, O. Translating embeddings for modeling multi-relational data. In Proceedings of the 27th International Conference on Neural Information Processing Systems, Lake Tahoe, NV, USA, 5–10 December 2013; pp. 2787–2795. [Google Scholar]
  21. Nickel, M.; Tresp, V.; Kriegel, H.P. A Three-Way Model for Collective Learning on Multi-Relational Data. In Proceedings of the 28th International Conference on International Conference on Machine Learning, Bellevue, WA, USA, 28 June–2 July 2011; Volume 11, pp. 809–816. [Google Scholar]
  22. Ji, G.; He, S.; Xu, L.; Liu, K.; Zhao, J. Knowledge graph embedding via dynamic mapping matrix. In Proceedings of the 53rd Annual Meeting of the Association for Computational Linguistics and the 7th International Joint Conference on Natural Language Processing, Beijing, China, 26–31 July 2015; pp. 687–696. [Google Scholar]
  23. Wang, Z.; Zhang, J.; Feng, J.; Chen, Z. Knowledge graph and text jointly embedding. In Proceedings of the 2014 Conference on Empirical Methods in Natural Language Processing (EMNLP), Doha, Qatar, 25–29 October 2014; pp. 1591–1601. [Google Scholar]
  24. Xing, L. Book intelligent recommendation algorithm based on collaborative filtering and TransH improvement. J. Shenzhen Inst. Inf. Technol. 2024, 22, 1–6. [Google Scholar]
  25. Cao, L. Design and Implementation of Intelligent Legal Consulting Platform Based on Knowledge Graph. Master’s Thesis, Beijing University of Posts and Telecommunications, Beijing, China, 2024. [Google Scholar]
  26. Hristos, D. A regiona analysis of technica change in Australian manufacturing. Tech. Changes Aust. Manuf. 2000, 6, 184–199. [Google Scholar]
  27. McNown, R. Cointegration modeling of fertility in the United States. Math. Popul. Stud. 2003, 10, 99–126. [Google Scholar] [CrossRef]
  28. Teixeira, A.A.C.; Foruna, N. Human capital, innovation capability and economic growth in Portuga. Port. Econ. J. 2004, 3, 205–225. [Google Scholar] [CrossRef]
  29. Zhang, J.; Li, H.; Yue, W. Improvement and refinement of comparative and ratio analysis methods. Friends Account. 2012, 20–23. [Google Scholar] [CrossRef]
  30. Hu, Y. The prediction and control model of blasting mining cost that based on BP neural network in sedimentary type of mine. China Min. Mag. 2013, 22, 75–79. [Google Scholar]
  31. Peng, Y. Research on feedforward Neural Network based on time series. Electron. Des. Eng. 2021, 29, 102–106+111. [Google Scholar] [CrossRef]
  32. Zhang, N. Research on Production Cost Prediction and Control of Large Metal Open Pit Mine. Master’s Thesis, Xi’an University of Architecture and Technology, Xi’an, China, 2023. [Google Scholar]
  33. Meng, F.; Yang, S.; Wang, J.; Xia, L.; Liu, H. Creating knowledge graph of electric power equipment faults based on BERT-BiLSTM-CRF model. J. Electr. Eng. Technol. 2022, 17, 2507–2516. [Google Scholar] [CrossRef]
  34. Wang, X. Comparing TransE and TransH Algorithms in Spatial Address Representation Learning: A Case Study of Tianhe District, Guangzhou City. J. Nanjing Univ. Posts Telecommun. (Nat. Sci. Ed.) 2020, 52, 86–94. [Google Scholar]
  35. Ning, Y. A Representation Learning Method of Knowledge Graph Integrating Relation Path and Entity Description Information. J. Comput. Res. Dev. 2022, 59, 1966–1979. [Google Scholar]
  36. Jiao, K.; Li, X. Survey of Chinese Named Entity Recognition Research. Comput. Eng. Appl. 2021, 57, 1–15. [Google Scholar]
  37. GB6722-2014; Safety Regulations for Blasting. Standards Press of China: Beijing, China, 2014.
  38. GB50197-2015; Code for Design of Open Pit Mine of Coal Industry. Standards Press of China: Beijing, China, 2015.
  39. GB51289-2018; Standard for Design of Slope Engineering of Open Pit Mine of Coal Industry. Standards Press of China: Beijing, China, 2018.
  40. MT/T1183-2020; The Slope Stability Analysis and Displacement Monit Oring Method of Open-Pit Mine. Standards Press of China: Beijing, China, 2020.
  41. MT/T1184-2020; Open-Pit Coal Mine Stripping and mining safety Technology Standard. Standards Press of China: Beijing, China, 2020.
  42. MT/T1185-2020; Technology Standard of Open-Pit Coal Mine Dump. Standards Press of China: Beijing, China, 2020.
  43. MT/T1186-2020; Open-Pit Coal Mine Transportation Safety Technology Standard. Standards Press of China: Beijing, China, 2020.
  44. MT 872-2000; General Technical Condition of Protective Devices of Belt Conveyor For Coal Mining. Standards Press of China: Beijing, China, 2000.
  45. AQ1055-2018; Specifications of Design Inspection and Completion Acceptance for Safety Devices in Coal Mine Construction Project. Standards Press of China: Beijing, China, 2018.
  46. AQ1083-2011; Safety Code for Coal Mine Construction. Standards Press of China: Beijing, China, 2011.
  47. GB/T 15663; Terms Relating to Coal Mining. Standards Press of China: Beijing, China, 2008.
  48. Rossi, A.; Barbosa, D.; Firmani, D.; Matinata, A.; Merialdo, P. Knowledge graph embedding for link prediction: A comparative analysis. ACM Trans. Knowl. Discov. Data (TKDD) 2021, 15, 1–49. [Google Scholar] [CrossRef]
  49. Gao, B. BioTrHMM: Named entity recognition algorithm based on transfer learning in biomedical texts. Appl. Res. Comput. 2019, 36, 45–48. [Google Scholar]
Figure 1. Research Roadmap.
Symmetry 17 01834 g001
Figure 2. Principle of BERT-BiLSTM-CRF modeling.
Symmetry 17 01834 g002
Figure 3. The input of BERT.
Symmetry 17 01834 g003
Figure 4. BiLSTM model structure diagram.
Symmetry 17 01834 g004
Figure 5. BiLSTM-CRF recognition process.
Symmetry 17 01834 g005
Figure 6. TransH core idea model.
Symmetry 17 01834 g006
Figure 7. Process Flow Decomposition Diagram of Cost Factors in Open-pit Coal Mining.
Symmetry 17 01834 g007
Figure 8. A model of knowledge structure in the knowledge domain of production costs in open pit mines.
Symmetry 17 01834 g008
Figure 9. Example of doccano labeling.
Symmetry 17 01834 g009
Figure 10. Doccano Statistics Interface.
Symmetry 17 01834 g010
Figure 11. Example of training set labeling.
Symmetry 17 01834 g011
Figure 12. Distribution of evaluation metrics for named entity recognition model.
Symmetry 17 01834 g012
Figure 13. Embedded Splicing.
Symmetry 17 01834 g013
Figure 14. Evaluation of the distribution of indicators.
Symmetry 17 01834 g014
Figure 15. Schematic Diagram of Local Cost Factor Weight Network.
Symmetry 17 01834 g015
Figure 16. Demonstration of knowledge nodes based on production relations.
Symmetry 17 01834 g016
Figure 17. Entity Relationship Transmission Formula and Impact Weights.
Symmetry 17 01834 g017
Figure 18. Q&A system login screen.
Symmetry 17 01834 g018
Figure 19. Main Interface for Q&A.
Symmetry 17 01834 g019
Table 1. Examples of production technology and cost specification systems for open pit coal mines (partially).
Standard Specification ExamplesCategorized by Issuing Agency and Action ScopeDivided According to Its
Content
Coal Law of the People’s Republic of ChinaLawSafety behavior standards
Mine Safety Law of the People’s Republic of ChinaLawSafety management
standards for coal mines
Coal Mine Construction Safety RegulationsAdministrative regulationsSafety behavior standards
Safety regulations for blastingAdministrative regulationsSafety behavior standards
Safety regulations for blasting GB6722-2014 [37]National standard (GB)Safety behavior standards
Code for design of open pit mine of coal industry GB50197-2015 [38]National standard (GB)Coal mine production technical code standards
Standard for design of slope engineering of open pit mine of coal industry GB51289-2018 [39]National standard (GB)Coal mine production technical code standards
The slope stability analysis and displacement monit oring method of open-pit mine MT/T1183-2020 [40]Industry standard (MT)Coal mine production technical code standards
Open-pit coal mine stripping and mining safety technology standard MT/T1184-2020 [41]Industry standard (MT)Coal mine production technical code standards
Technology standard of open-pit coal mine dump MT/T1185-2020 [42]Industry standard (MT)Coal mine production technical code standards
Open-pit coal mine transportation safety technology standard MT/T1186-2020 [43]Industry standard (MT)Coal mine production technical code standards
General technical condition of protective devices of belt conveyor for coal mining MT 872-2000 [44]Industry standard (MT)Coal mine production technical code standards
Specifications of design inspection and completion acceptance for safety devices in coal mine construction project AQ1055-2018 [45]Safety Standard for Coal
Mines (AQ)
Coal mine safety management standards
Enterprise Product Cost Accounting System—Coal IndustrySignificant cost specificationCoal mine costing standards
Guidelines for Mining Right EvaluationSignificant cost specificationsCoal mine costing standards
Table 2. Cost Factor Data Source Specifications.
Data SourceExplanationDetailed Requirements
Correlation DegreeDescribe the strength of the relationship between different factors and costs.Quantify the correlation between different factors and costs through statistical analysis or regression models, helping to understand which factors have a greater impact on costs.
SensitivityReflect the sensitivity of cost changes to different factors.Identify the factors most sensitive to cost changes through sensitivity analysis, providing important decision-making insights.
HierarchyStructurally display the hierarchical relationship between various factors and costs.Establish a hierarchy based on production processes under different operating conditions, in compliance with the requirements of standard specification documents, to serve as the hierarchical basis for cost influencing factors.
Process ParametersReflect the impact of key process parameters on costs during production.In compliance with standard specification documents, including process parameters such as drilling depth and blasting effects, quantify the impact of each parameter on the overall cost.
Historical DataProvide the relationship between costs and factors in actual operations through historical data analysis.Based on historical operational data, verify the relationships between factors and costs, supporting the construction and inference analysis of the knowledge graph.
Table 3. Conceptualization of entity relationships.
Relation NameRelation Concept
EstablishFactor A facilitates the existence or formation of Factor B through specific processes or conditions.
DeviseFactor A generates the logical relationship of Factor B through systematic planning or design.
EquipFactor A forms the compositional structure of the more complex Factor B through combination or integration.
DistanceThe spatial or logical separation between Factor A and Factor B has a quantifiable impact on cost.
UseFactor A utilizes or consumes Factor B in the process of achieving a specific objective.
MeasureFactor A acquires quantitative information about Factor B through technical methods or approaches.
IncludeFactor B is a component or an attribute subset within the hierarchical structure of Factor A.
AffectFactor A exerts a direct or indirect causal effect on Factor B.
ValueFactor A assigns a specific numerical value or attribute-based quantitative definition to Factor B.
ImplementFactor A achieves the objectives or outcomes of Factor B through actions or operations.
PositiveFactor A and Factor B exhibit a statistically significant positive correlation, changing in the same direction.
NegativeFactor A and Factor B exhibit a statistically significant negative correlation, changing in opposite directions.
Table 4. Standard Specification Structured Entities.
Entity TypeSpecific EntitySource of Entity Content
FacilityExcavator, Drilling machine, Loader, Explosive material transport vehicle, On-site mixed explosive vehicle, Dozer, Conveyor, Automobile, Truck, Water truck, BulldozerSafety regulations for blasting
AQ1083-2011 [46]
ParametersMining height, Mining depth, Bench height, Borehole depth, Hole depth, Ramp bench borehole, Borehole diameter
Sub-drilling depth, Minimum burden, Minimum resistance line, Basal burden, Bench face angle, Borehole spacing, Burden spacing, Stemming length, Borehole density coefficient, Specific charge, Total charge amount, Maximum charge per delay
Code for design of open pit mine of coal industry
GB50197-2015 [38]
MethodRailway transportation, Road transportation, Inverted pile mining technique, Non-inverted pile mining technique, Pre-splitting blasting, Throw blasting, Deep hole blasting, Shallow hole blasting, Secondary blasting, Intermittent process, Continuous process, Semi-continuous process, Internal spoil disposalSpecifications of design inspection and completion acceptance for safety devices in coal mine construction project
AQ1055-2018 [45]
GeologicDegree of rock weathering, Rock mass structure, Rock mass fabric, Weak interlayer, Occurrence conditions, Lithology, Engineering geological conditions, Hydrogeological conditionsClassification of environmental geology of mine
MaterialsDetonator, Blasting cap, Emulsion explosive, Ammonium nitrate-fuel oil explosive (ANFO), Porous granular explosive, Nitroglycerin-based explosive,Regulations of safety managment for the manufacturing and marketing enterprise of civil explosive materials
IndexVibration velocity, Bottom, Perforation, Flyrock distance, Back pull, Boulder yield, Lumpiness, Bucket rate, Measured value, Slope stability factorSpecifications of design inspection and completion acceptance for safety devices in coal mine construction project
AQ1083-2011 [46]
PlaceExternal waste dump, Internal waste dump, Mining-stripping face, Road transportation planning, Road classification, Railway alignment, General layout plan, Pit boundary, Working faceCode for design of open pit mine of coal industry
GB50197-2015 [38]
CostRaw material and primary material cost, Auxiliary material cost, Fuel and power cost, Labor cost, Depreciation cost, Amortization and depletion cost, Safety production cost, Maintenance and repair cost, Transportation cost, Property insurance cost, Outsourced service cost, Amortization of low-value consumablesEnterprise Product Cost Accounting System—Coal Industry
ProductionDrilling engineering, Blasting engineering, Stripping engineering, Transportation operations, Waste dumping engineeringCode for design of open pit mine of coal industry
GB50197-2015 [38]
Table 5. Dictionary of Cost Factors for Surface Coal Mines (Partial).
Term NamePart of Speech
Single bucket-truck operationvn
Hole spacingvn
Blasting vibrationvn
Labor costnw
Stripping engineeringnw
Working faces
Rock structures
Excavatornz
Blasting workernz
Fuzenz
Dieselnz
Table 6. Entity labeling categories.
Label CategoryLabel NameLabel CategoryLabel Name
B-ParDesign parameters category initialsB-GeoGeological environment category initials
I-ParInside and end of design parameters categoryI-GeoInside and end of geological environment category
B-MetMining method category initialsB-PlaSpatial location category initials
I-MetInside and end of mining method categoryI-PlaInside and end of Spatial location category
B-IndExcavation efficiency category initialsB-MatMaterial category initials
I-IndInside and end of Excavation efficiency categoryI-MatInside and end of material category
B-PerPersonnel organization category initialsB-FueFuel consumption category initials
I-PerInside and end of personnel organization categoryI-FueInside and end of fuel consumption category
B-FacMachine equipment category initialsB-ProProduction category initials
I-FacInside and end of machine equipment
category
I-ProInside and end of production category
B-CostCost category initialsONon-entity symbol
I-CostInside and end of cost category
Table 7. Training environment configuration parameters.
Project NameEnvironment Name
Operating SystemWindows10
CPUIntel Core i9-14900Hx 5.80GHz
GPUNVIDIA GeForce RTX 3090Ti
python3.7.12
Pytorch1.12.0
Tensorflow1.15
Table 8. Bert model training hyperparameters.
Parameter NameParameter Value
Max_seq_length512
Train_epochs33
Train_batch_size32
Learning rate3 × 10−5
Dropout_rate0.3
Clip5
Table 9. Named Entity Recognition 5-fold Cross-Validation (k = 5) Accuracy Results.
Entity TypeBERT-BiLSTM-CRFBERT-BiLSTMBiLSTM-CRF
PrecisionF1RecallPrecisionF1RecallPrecisionF1Recall
Facility0.595 ± 0.0130.600 ± 0.0150.627 ± 0.0100.563 ± 0.0130.558 ± 0.0090.548 ± 0.0180.530 ± 0.0220.525 ± 0.0130.516 ± 0.018
Parameters0.577 ± 0.0180.618 ± 0.0130.671 ± 0.0210.529 ± 0.0100.595 ± 0.0080.665 ± 0.0080.483 ± 0.0080.529 ± 0.0100.621 ± 0.014
Method0.680 ± 0.0140.701 ± 0.0110.720 ± 0.0160.629 ± 0.0090.624 ± 0.0110.636 ± 0.0200.583 ± 0.0080.608 ± 0.0150.628 ± 0.008
Geologic0.615 ± 0.0110.616 ± 0.0080.619 ± 0.0100.482 ± 0.0140.521 ± 0.0220.581 ± 0.0100.465 ± 0.0110.480 ± 0.0140.490 ± 0.014
Materials0.417 ± 0.0210.566 ± 0.0300.836 ± 0.0140.398 ± 0.0350.533 ± 0.0180.768 ± 0.0310.374 ± 0.0460.464 ± 0.0250.646 ± 0.030
Fuel0.418 ± 0.0410.480 ± 0.0370.534 ± 0.0270.344 ± 0.0480.387 ± 0.0490.448 ± 0.0300.348 ± 0.0370.383 ± 0.0450.447 ± 0.030
Index0.637 ± 0.0130.650 ± 0.0200.656 ± 0.0080.589 ± 0.0080.599 ± 0.0080.600 ± 0.0150.500 ± 0.0080.547 ± 0.0080.511 ± 0.018
Person0.625 ± 0.0130.715 ± 0.0120.812 ± 0.0120.601 ± 0.0170.636 ± 0.0130.676 ± 0.0100.535 ± 0.0080.585 ± 0.0180.621 ± 0.008
Place0.647 ± 0.0140.642 ± 0.0120.646 ± 0.0160.612 ± 0.0140.606 ± 0.0130.597 ± 0.0190.574 ± 0.0100.568 ± 0.0140.574 ± 0.012
Cost0.704 ± 0.0160.748 ± 0.0130.818 ± 0.0130.650 ± 0.0130.722 ± 0.0100.800 ± 0.0080.627 ± 0.0140.687 ± 0.0130.781 ± 0.009
Production0.804 ± 0.0080.812 ± 0.0080.778 ± 0.0140.718 ± 0.0170.734 ± 0.0140.727 ± 0.0150.794 ± 0.0130.702 ± 0.0130.705 ± 0.016
Table 10. Comparison table of model experiments.
Model Namehits@3hits@5hits@10mrr
TransE0.2990.4250.5980.200
TransH0.3400.4600.6360.266
TransR0.3150.4400.6050.235
TransD0.3410.4580.6350.267
DistMult0.2930.4070.5930.205
Table 11. Original decision matrix of cost influencing factors.
Expert IDInfluencing Factors
F1F2F3F4F5F6F7F8
141444423
253454543
323453424
434455534
554454343
635535534
744233333
835453542
955244442
1024243553
1134353444
1233443343
1354544433
1433255544
1545342342
Table 12. Accuracy Comparison Table for Cost Factor Priority Ranking.
NO.Influencing FactorEntropy WeightSequential RankingNode Attribute ValueSequential RankingIndicator Ranking
F1Hole depth0.08950.05650
F2Burden0.13330.08830
F3Lumpiness0.17820.17720
F4Specific charge0.20010.35410
F5Hole diameter0.06760.05160
F6Blasting vibration0.11140.07140
F7Bulk density0.02280.03880
F8Step height0.04470.04470
Disclaimer/Publisher’s Note: The statements, opinions and data contained in all publications are solely those of the individual author(s) and contributor(s) and not of MDPI and/or the editor(s). MDPI and/or the editor(s) disclaim responsibility for any injury to people or property resulting from any ideas, methods, instructions or products referred to in the content.