Exploring Forest Change Spatial Patterns in Papua New Guinea: A Pilot Study in the Bumbu River Basin
by
 ,
,
Willie Doaemo
1,2,* ,
,
Midhun Mohan
3,4, 
Esmaeel Adrah
4,
Shruthi Srinivasan
5 and 
Ana Paula Dalla Corte
6 1
Department of Civil Engineering, Papua New Guinea University of Technology, Lae 00411, Papua New Guinea
2
Morobe Development Foundation, Doyle Street, Trish Avenue-Eriku, Lae 00411, Papua New Guinea
3
Department of Geography, University of California, Berkeley, CA 94720, USA
4
UN Volunteering Program, Morobe Development Foundation, Lae 00411, Papua New Guinea
5
Department of Forest Analytics, Texas A&M Forest Service, Dallas, TX 75252, USA
6
Department of Forest Engineering, Federal University of Paraná—UFPR, Curitiba, PR 80.210-170, Brazil
*
Author to whom correspondence should be addressed.
Land 2020, 9(9), 282; https://doi.org/10.3390/land9090282
Submission received: 3 August 2020
/
Revised: 15 August 2020
/
Accepted: 19 August 2020
/
Published: 20 August 2020
(This article belongs to the Special Issue Monitoring Land Cover Change: Towards Sustainability)
Abstract
:Papua New Guinea is a country in Oceania that hosts unique rain forests and forest ecosystems which are crucial for sequestering atmospheric carbon, conserving biodiversity, supporting the livelihood of indigenous people, and underpinning the timber market of the country. As a result of urban sprawl, agricultural expansion, and illegal logging, there has been a tremendous increase in land-use land cover (LULC) change happening in the country in the past few decades and this has triggered massive deforestation and forest degradation. However, only a few studies have ventured into quantifying the long-term trends and their associated spatial patterns—and have often presented contrasting responses. Herein, we intended to assess the extent of deforestation and the rate of urbanization that happened in the past 33 years (1987–2020) in the Bumbu river basin in Papua New Guinea using satellite imagery—for the years 1987, 2002, 2010, and 2020—and Geographic Information System (GIS) tools. On performing image classification, land use maps were developed and later compared with Google Earth’s high-resolution satellite images for accuracy assessment purposes. For probing into the spatial aspects of the land-use change issues, the study area was divided into four urban zones and four forest zones according to the four main cardinal directions centered in the urban and forest area centers of the 1987 image; subsequently, the rate of urban area expansion in each urban zone was separately calculated. From our preliminary analysis and literature survey, we observed several hurdles regarding the classification of regenerative forests and mixed pixels and gaps in LULC studies that have happened in Papua New Guinea to date. Through this communication paper, we aim to disseminate our preliminary results, which highlight a rapid increase in urban extent from 14.39 km2 in 1987 to 23.06 km2 in 2020 accompanied by a considerable decrease in forest extent from 76.29 km2 in 1987 to 59.43 km2 in 2020; this observation favors the presumption that urban and agricultural land expansion is happening at the cost of forest cover. Moreover, strategies for addressing technical issues and for integrating land-use change with various socioeconomic and environmental variables are presented soliciting feedback.

1. Introduction
Land-use land cover (LULC) change is a very well-known and one of the most significant research topics in domains of climate change, urban planning, and forestry [1,2]. Herein, land-use denotes how people use a particular piece of land, and land cover is indicative of the physical land type such as forest or barren land. Having an in-depth understanding of land-use planning is vital as it opens up new opportunities to mitigate the detrimental effects of adopted land-use practices and thereby contributes towards sustainable use of resources at our disposal [3,4,5]. Nevertheless, the issue of deforestation, especially due to urbanization, has been a major concern globally due to its multi-spatial and multi-dimensional facets affecting copious amounts of ecosystem services from region-level species richness to landscape-level precipitation anomalies [6,7,8,9]. Moreover, the consequent decrease in the carbon sequestration capacity of forests and associated greenhouse gas emissions—which account for approximately 20% of all annual global emissions—stimulate prolonged distress worldwide given their role in mitigating global climate change [10,11].
Papua New Guinea is a country in Oceania that hosts unique rain forests and forest ecosystems which are crucial for sequestering atmospheric carbon, conserving biodiversity, supporting the livelihood of indigenous people, managing catchment, and underpinning the timber market of the country. However, as a result of urban sprawl, agricultural expansion, and illegal logging, there has been a tremendous increase in land-use change happening in the country in the past few decades and this has triggered massive deforestation and forest degradation [12,13]. Although the United Nations Framework Convention on Climate Change (UNFCCC) has attempted to implement strategies to reduce emissions from deforestation and degradation (REDD) in developing countries, only a few studies have ventured into quantifying the long-term land-use trends, their spatial patterns, and associated carbon emissions in Papua New Guinea. This paucity of validations can be primarily attributed to limited data availability and concurrent socioeconomic constraints. Also, the existing literature presents contrasting opinions, with one faction portraying alarming rates of deforestation occurring due to urbanization and another stating the former compilations to be an overestimation of reality [14,15]. In this regard, remote sensing techniques—especially satellite imagery—in association with Geographic Information System (GIS) analysis tools, can be used to obtain detailed, frequent, and up-to-date information of LULC patterns; the advancements in these technologies have revolutionized the LULC studies.
Since many tropical forests are in the frontier stage undergoing land-use transformations due to logging and agricultural expansion, several recent remote sensing studies—not only satellite-based endeavors, but also initiatives from drones and LiDAR (Light Detection and Ranging) spheres—have focused on these aspects in addition to analyzing the impacts of deforestation from the perspective of increased carbon emissions [16,17,18,19,20,21]. By identifying inherent trends, it was found possible to further investigate the rate of land-use change happening over the years and the motives behind these land-use transformations. Pratihast et al. [22] explored the integration of satellite data and community-based observations for forest monitoring and highlighted the importance of involving local communities in enhancing implementation of the REDD framework in regional areas. By contrast, Popkin [23] emphasized the large-scale significance of satellite imagery for enabling alert-systems to detect illegal logging in near-real time and sending warnings to environmental managers when a forested area is endangered. Among the satellite imagery used, the open-source Landsat imagery series, which provides data on changing landscapes from the year 1972, is one of the most commonly used spatial databases [24]. Banskota et al. [25] offer a review of recent advancements in forest monitoring achieved using Landsat Time Series Data and applaud the steady levels of development that have occurred in terms of science and application capacity. Studies assessing the consequence of land-use change on agricultural productivity, climate anomalies, and biodiversity are also commonplace in the satellite remote sensing realm [26,27,28,29].
In this study, we assessed the extent of deforestation and the rate of urbanization that has happened in the past 33 years (1987–2020) in the Bumbu river basin that runs through Lae, the capital of Morobe Province. Previous GIS analyses of land-use change in this area have provided brief snapshots of a growing metropolitan area and of the impact of this growth on the surrounding forested region [12,30], yet there are no extensive studies to approximate the extent of forest degradation and spatial variability happening in this area. Herein, for analysis purposes, we chose Landsat data, since the repository includes images that are consistent with data from previous missions, thus allowing for long-term change detection at various scales [31].
Through this communication paper, we aim to disseminate our preliminary results, which highlight a rapid increase in urban extent, accompanied by a loss of forest cover, in the past 33 years. In addition, we look forward to receiving feedback on our presented interpretations regarding the land-use land cover change patterns, proposed strategies for improving adopted classification approaches, and plans for integrating land-use change with various socioeconomic and environmental variables.
2. Materials and Methods
2.1. Study Area
The study focuses on the Bumbu river basin in Papua New Guinea (see Figure 1), located between the Markham river basin to the west, and the Busu river basin to the east, cutting through the city of Lae, the capital of Morobe Province in the South. Lae is an industrial city, and the second largest in Papua New Guinea, located at Lat/Long: −6.66942, 146.97911. The Bumbu river is considered narrow with a flow of medium speed. However, the river flows and erodes at a much higher rate during the flood season [32], as it crosses a basin consisting mainly of sandy loam [30]. Such floods can be detrimental to the floodplain of the affected stream, which for the Bumbu main channel includes the industrial city of Lae. Uplift along the Markham valley within Lae from tectonic plate convergence [33] provides the area with a unique confluence of three major rivers with interspersed plains across which the Lae urban district is now spread.
2.2. Data Collection/Preprocessing
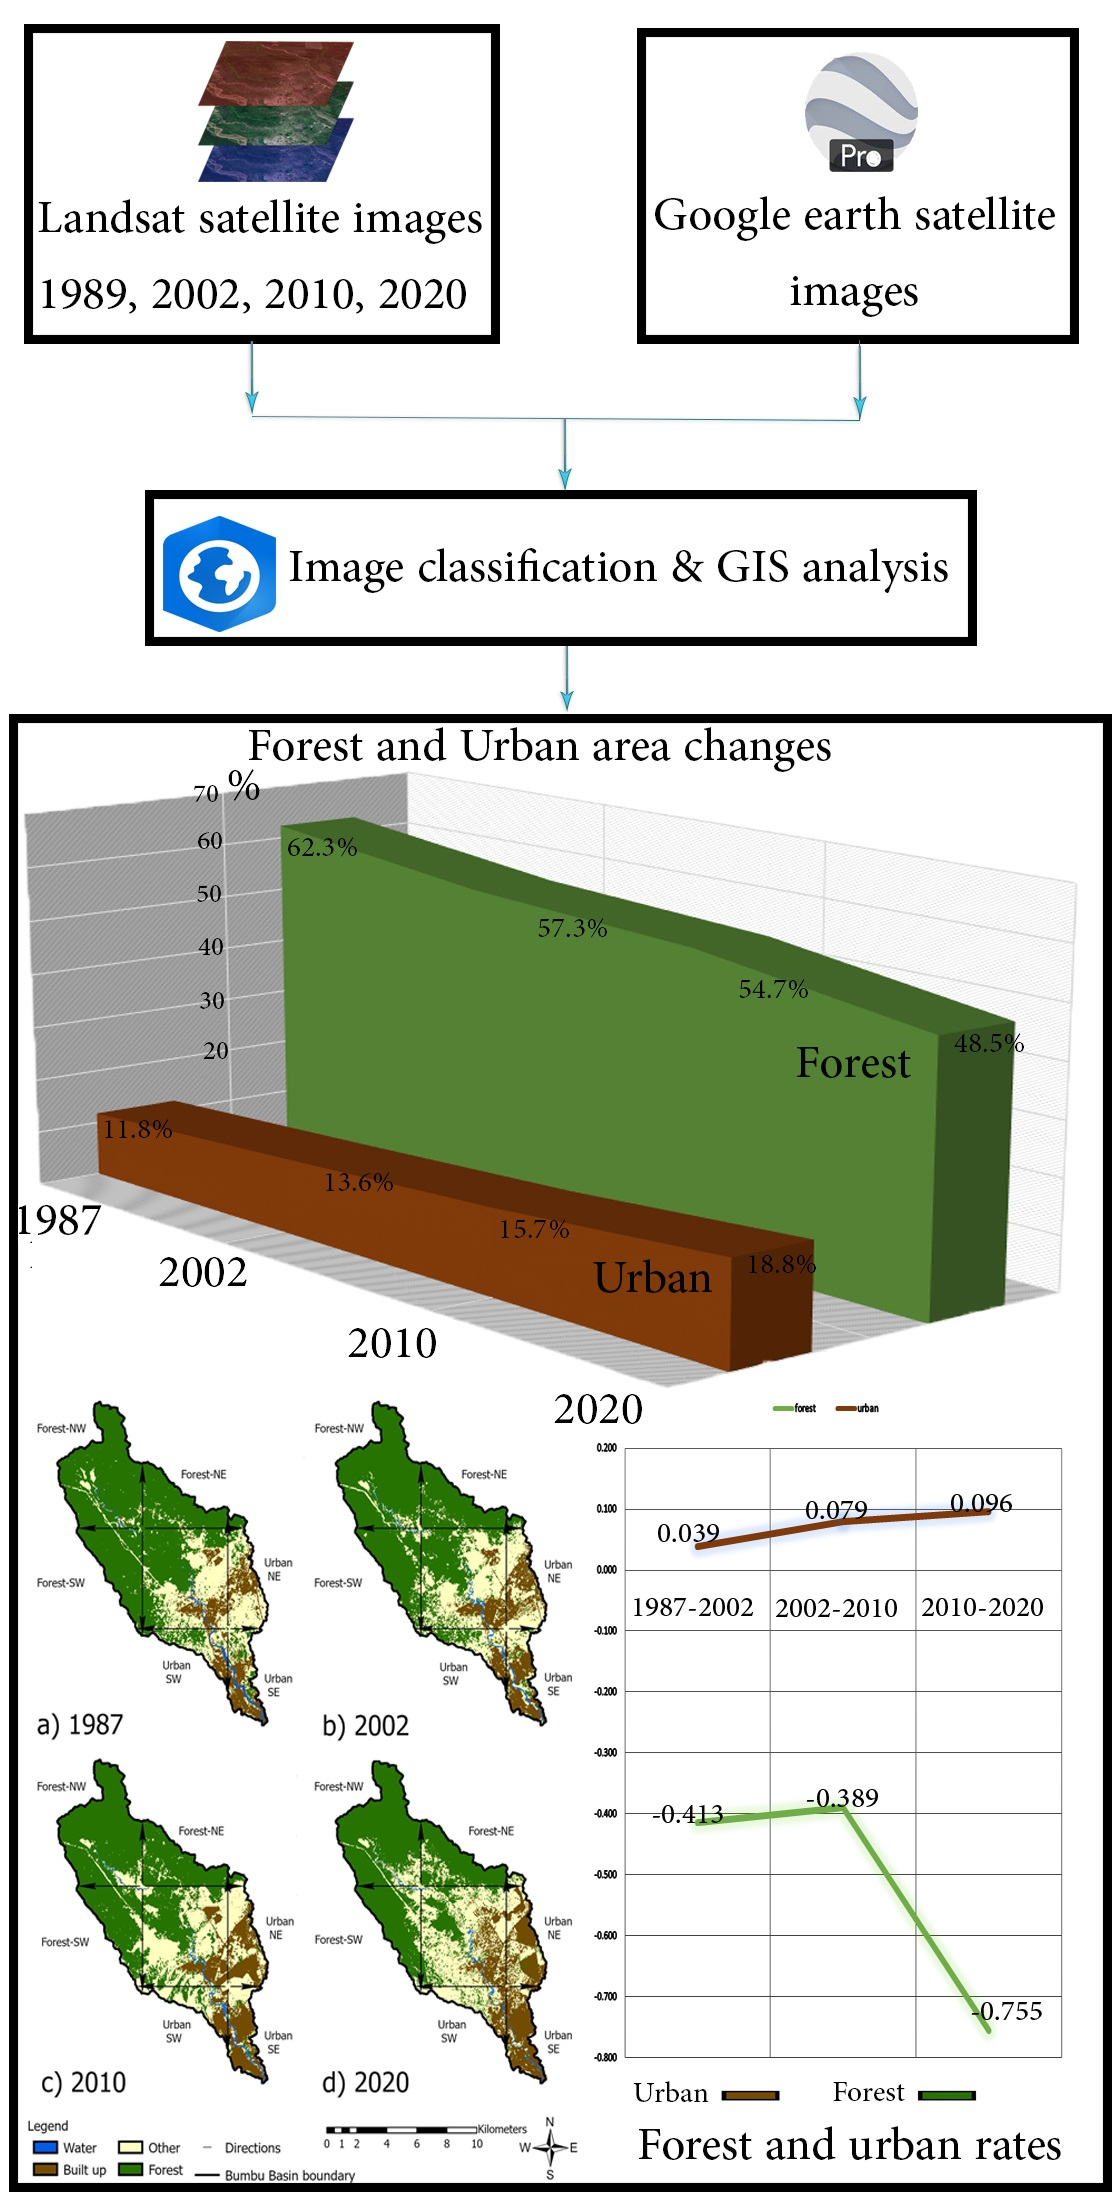
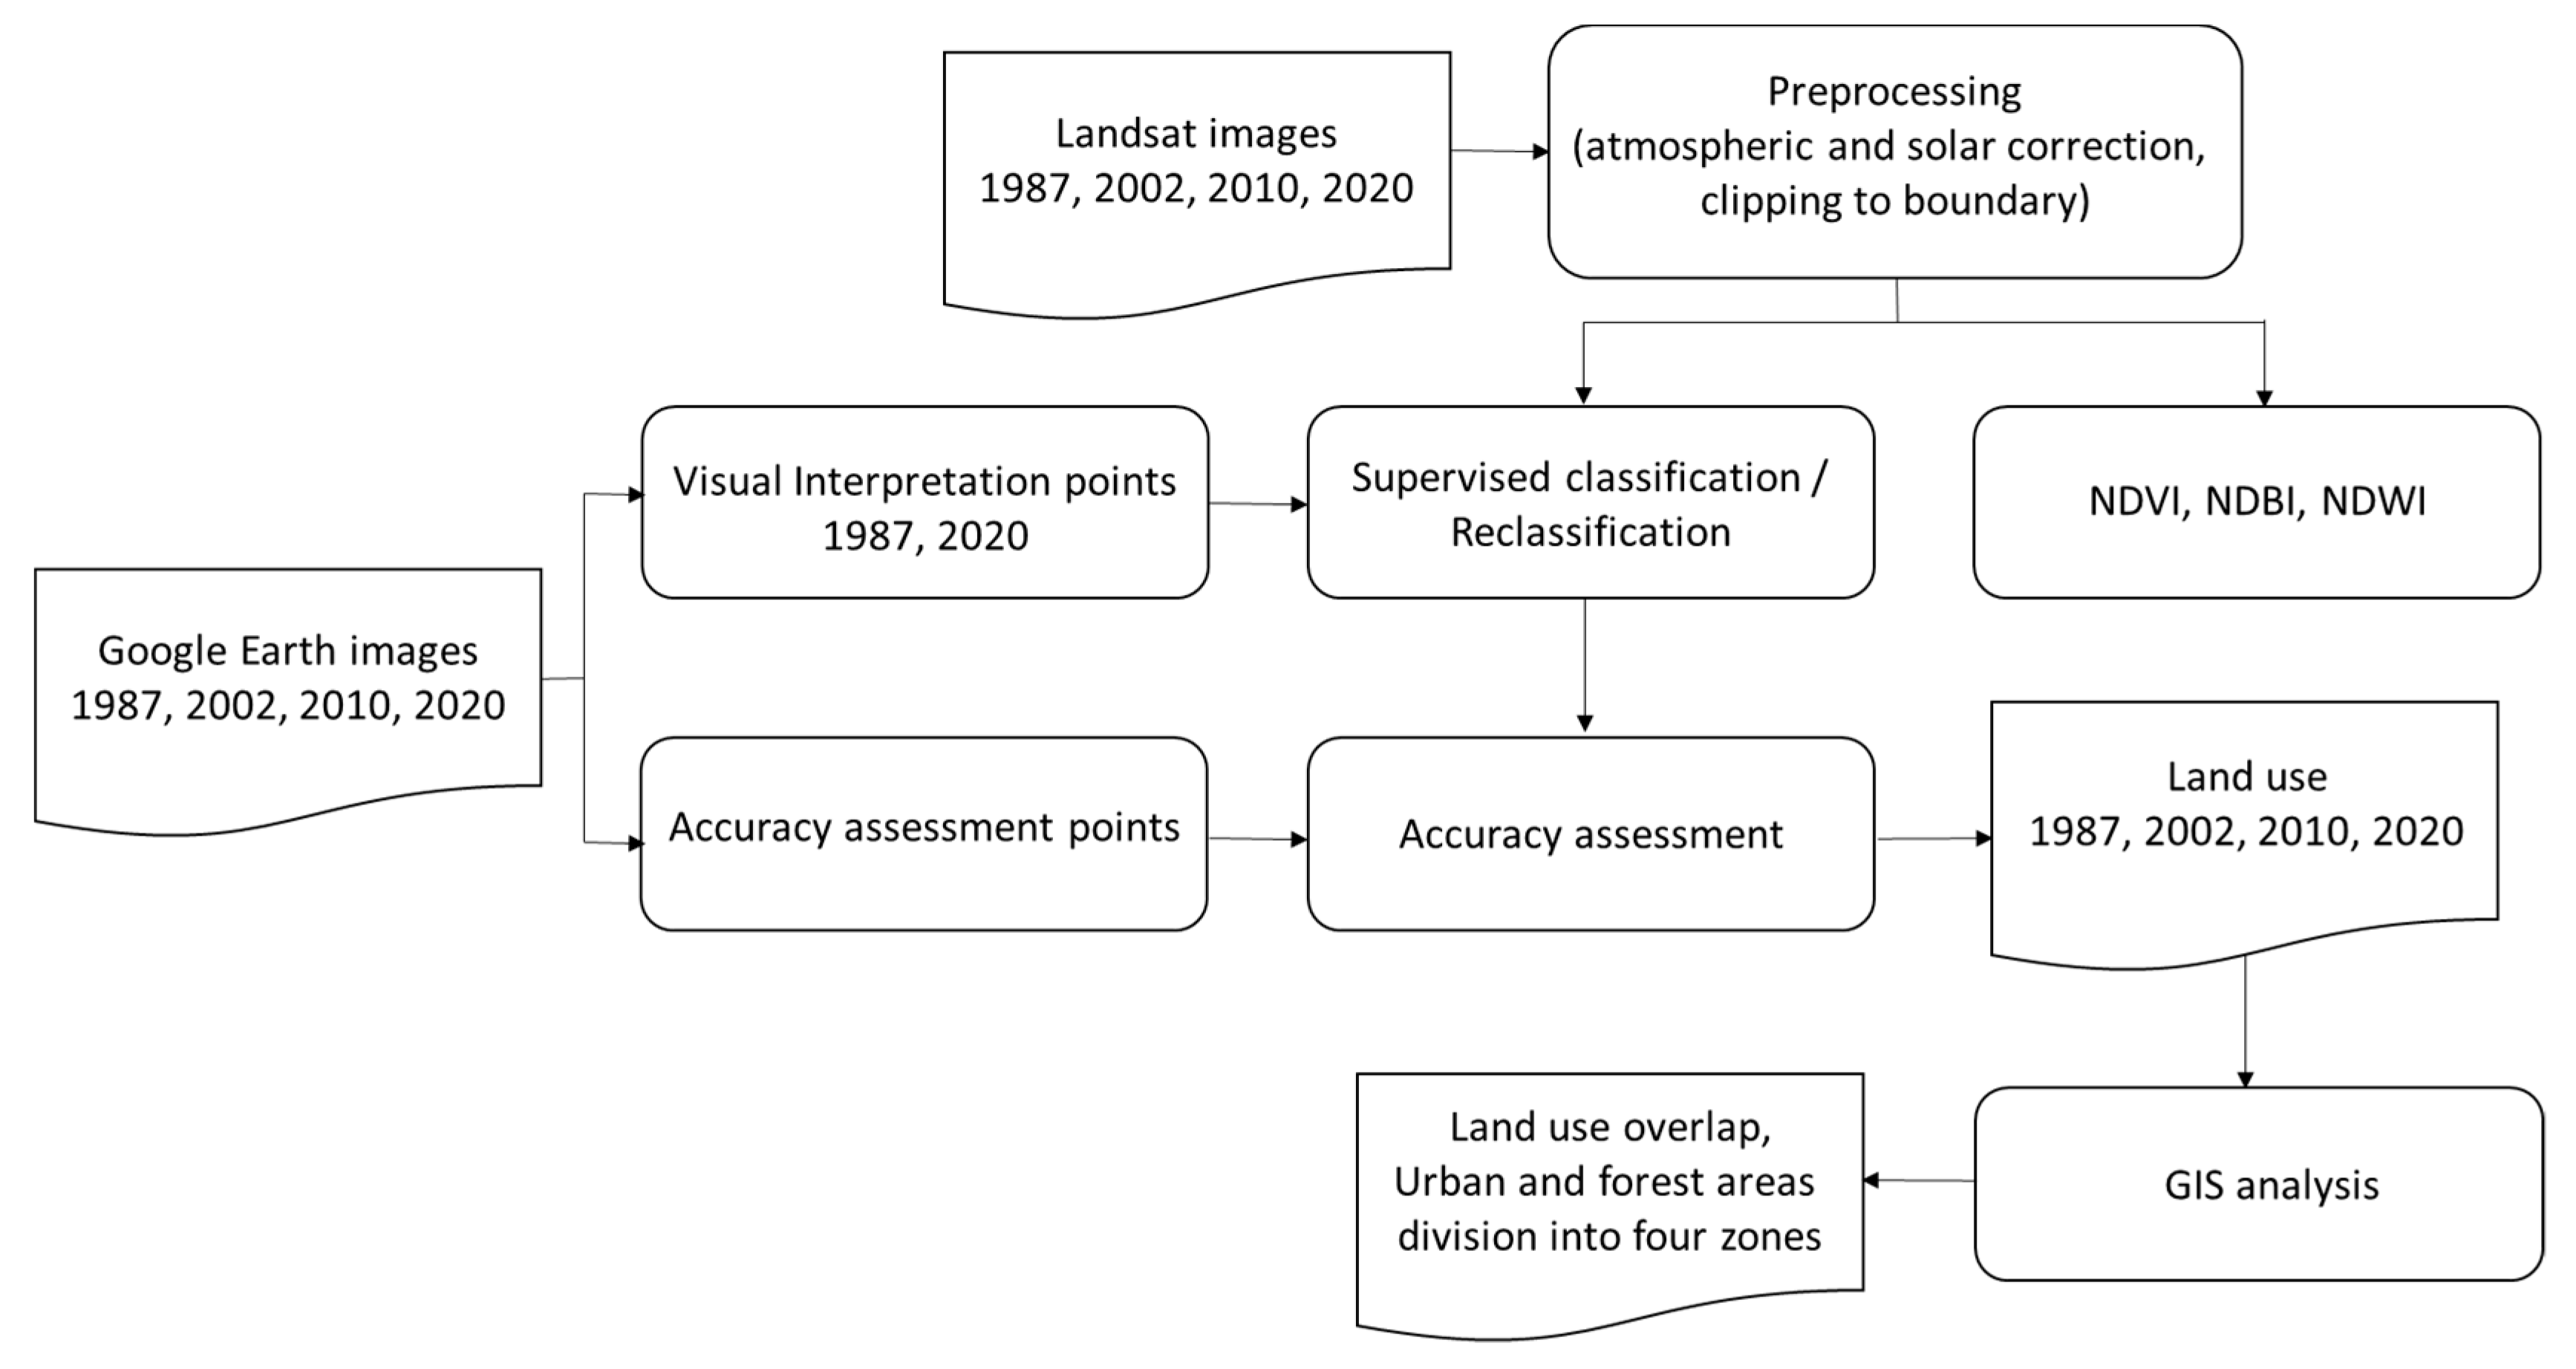
The primary data used in this study were derived from a series of Landsat satellite images, path 096/row 065, for the years (a) 1987 from Landsat 5 Thematic Mapper ™, (b) 2002 from Landsat 7 Enhanced Thematic Mapper Plus (ETM+), (c) 2010 from Landsat 5 TM, and (d) 2020 from Landsat 8 Operational Land Imager (OLI). All images were downloaded from USGS (United States Geological Survey)-Earth Explorer with 30 m spatial resolution and chosen to avoid, as much as possible, densely cloud-covered scenes for better surface views for estimation of the physical extent of built-up and forested areas. Google Earth images were used for accuracy assessment and to aid in choosing the training samples; watershed mapping was used to delineate the study area boundary. The Bumbu river main channel was digitized based on ESRI (Environmental Systems Research Institute) imagery for the year 2020 and used at a later stage for illustration. The images were subjected to atmospheric correction by conversion to Top of Atmosphere (ToA) reflectance, and solar correction was accounted for according to Young et al. [34], and USGS [35,36]. Images were subsequently clipped to the watershed boundary. Geometric correction and calibration were deemed unnecessary for the purposes of this study as the Landsat images were geometrically corrected by NASA (National Aeronautics and Space Administration) [34]. The overall workflow is presented below (Figure 2).
2.3. Spatial Analysis
2.3.1. Pre-Classification
The images were duplicated to visualize the true colors and the false colors using three spectral indices, i.e., Normalized Difference Vegetation Index (NDVI) (which helps in discriminating vegetation), Normalized Difference Built-up Index (NDBI) (to assist in identifying urban area presence in imagery), and Normalized Difference Water Index (NDWI) (to enhance open water appearance in remotely sensed imagery) [37]. These indices were derived for each image to simplify mapping of forest, urban area, and open water classes, respectively [37]. The images were later used to aid manual interpretation during the reclassification process.
2.3.2. Supervised Classification
A supervised classification using the Maximum Likelihood Classification (MLC) algorithm was performed for image classification purposes [38,39]. The MLC method is known for its strong theoretical foundation, and for its ability to accommodate varying data. This method was applied in our study using ArcGIS Pro 2.5 [40]. The four main classes of the classification scheme and their descriptions are provided in Table 1. The forest class included two subclasses, namely, dense forest and forest, which were merged after running the MLC. Thirty training sample polygons were created and evaluated in each class/subclass for each image. The training sites were selected using visual interpretation of Google Earth’s high-resolution satellite images and the NDVI, NDBI, and NDWI images to compare with Landsat images.
2.3.3. Re-Classification
Manual interpretation was used to enhance the accuracy of the resulting classified images, using the re-classifier tool provided in ArcGIS Pro, with the assistance from Google Earth high-resolution images and the aforementioned three spectral indices. In addition, 100 random sampling points (50 forest and 50 non-forest) were evaluated using Google Earth and subsequently used to enhance the reclassification process of the 1987 and 2020 images, and to assist in the assessment of the extent of forest gain versus forest loss.
2.3.4. Accuracy Assessment
To characterize image classification accuracy, a confusion matrix, which is a table that depicts the correlation of ground truth points and the result of the classification, was used to calculate and compare the overall percent accuracies, the user’s accuracies, and producer’s accuracies [38,39,40,41]. Herein, the user’s accuracy portrays the accuracy levels from the point of view of a map user and is a complement of the commission error; producer’s accuracy reflects the map accuracy from the point of view of a map maker and is a complement of the omission error; and the kappa coefficient gives a measure of the overall accuracy of a classification. For each classified image, 200 random points were generated using ArcGIS Pro (50 points in each class), and the pixel values were extracted from the classified images to the points. Google Earth’s high-resolution satellite images and Google Earth Pro software were used to examine the ground truth status of reference points and to assign the ground status to the matrix. After developing the matrix, the kappa coefficient (which is a statistical multivariate technique used widely in accuracy assessment) was calculated for each classified image; respective omission errors and commission errors were also determined.
Additionally, a GIS-based analysis using ArcGIS Pro 2.5 was conducted on the classified images to better describe and quantify the change of the built-up area and forest area over the study period. The LULC change maps were overlapped, and the center of urban area in 1987 was located and used to divide the urban area into four zones; Urban NE (northeastern), Urban NW (northwestern), Urban SW (southwestern), and Urban SE (southeastern). Following the same approach, the center of the forest area in 1987 was calculated using GIS and was used to conduct in-depth change analysis of the four forest zones (NE, NW, SW, SE).
3. Results
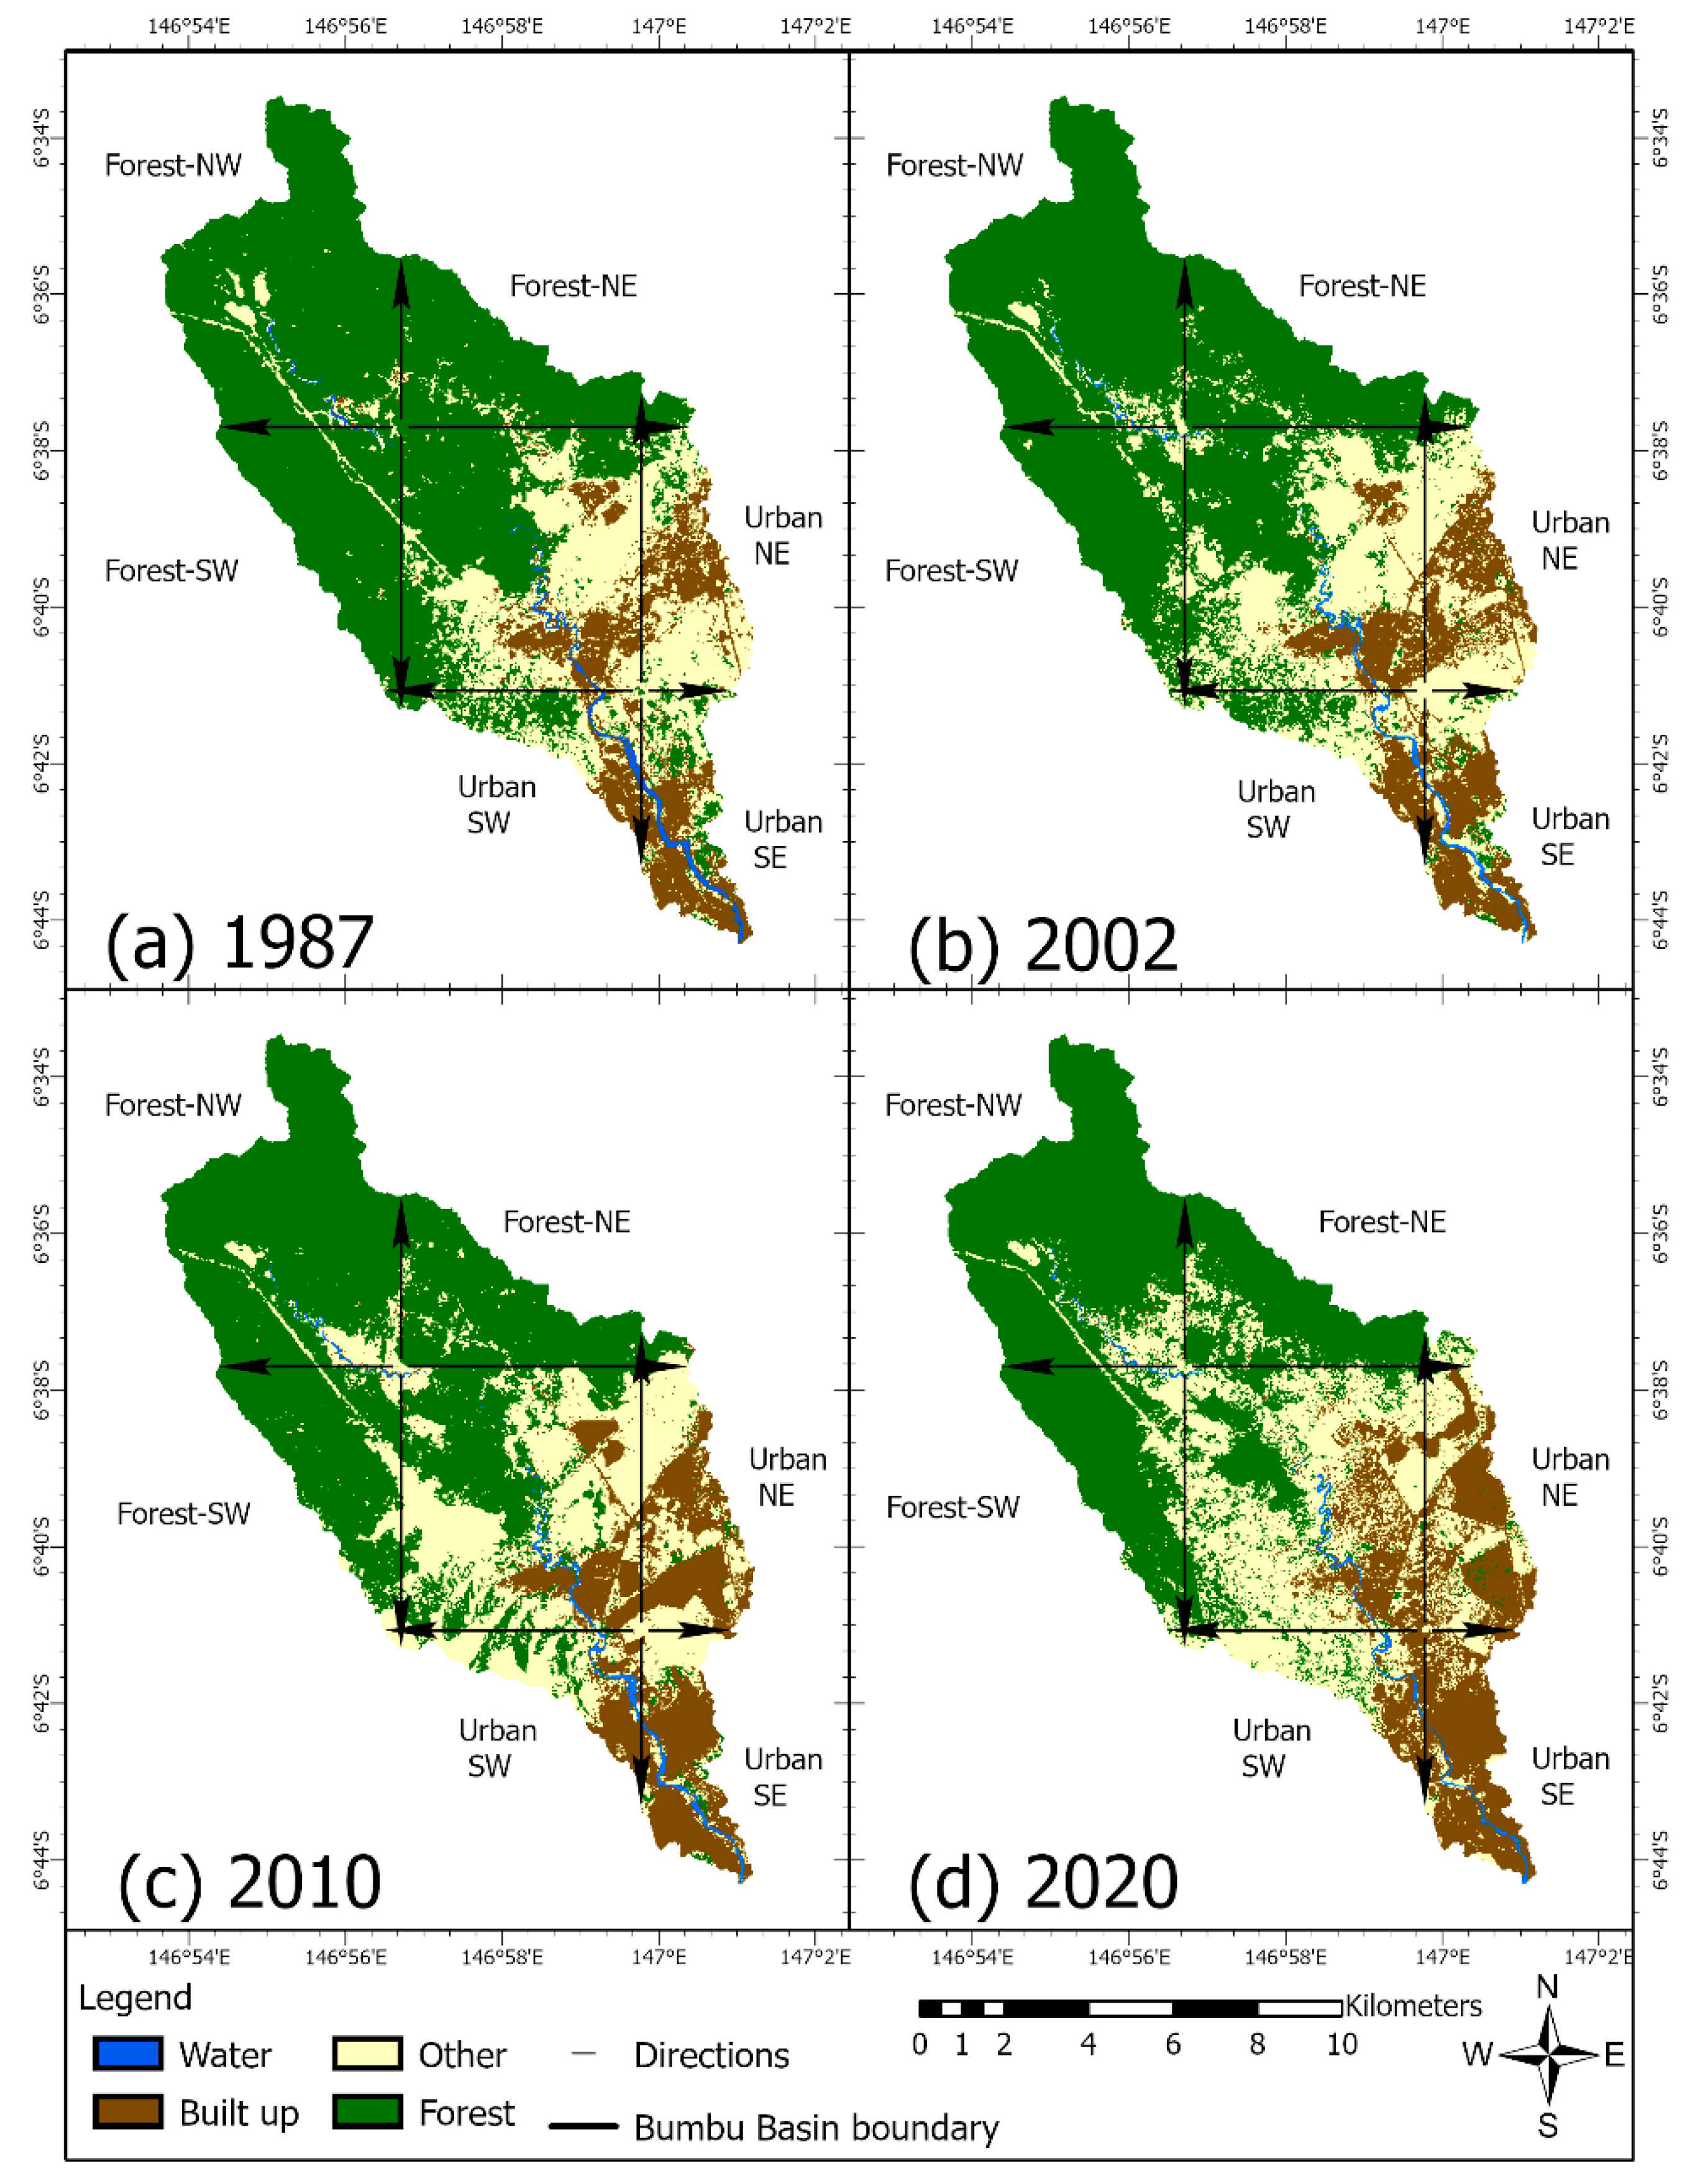
The overall classification accuracies for the 1987, 2002, 2010, and 2020 maps were 90.5%, 87%, 93%, and 90.5%, respectively, while the associated kappa coefficients were 0.87, 0.83, 0.91, and 0.87. Table 2 shows the accuracy assessment results along with the error matrix and the producer’s and user’s accuracy for each classified image. The resulting classified images showing the pattern of land-use/land cover in the study area over time are represented in Figure 3, while the spatial distribution of each class can be observed in Table 3. The results show a progressive decrease in the forest area over the studied period as it dropped from 62.33% in 1987 to 57.26% in 2002 to 54.72% in 2010 and then to 48.55% in 2020. On the other hand, rapid increases in the “Built-up” class and the “Other” class occurred over the same period, indicating the expansion of urban areas and other land type classes at the expense of a reduction in forested areas. The built-up area increased from 11.76% in 1987 to 18.84% in 2020, passing 13.65% in 2002 and 15.71% in 2010, while the other types of land use including agricultural land expanded significantly over the study period, from 24.81% of the study area in 1987 to 31.86% in 2020. This change coincides with overall trends of land-use change in Morobe Province between 1975 and 2000 as found by Ningal et al. [12], and as confirmed by Samanta and Paul [42], who studied LULC change in Lae district between 1992 and 2013.
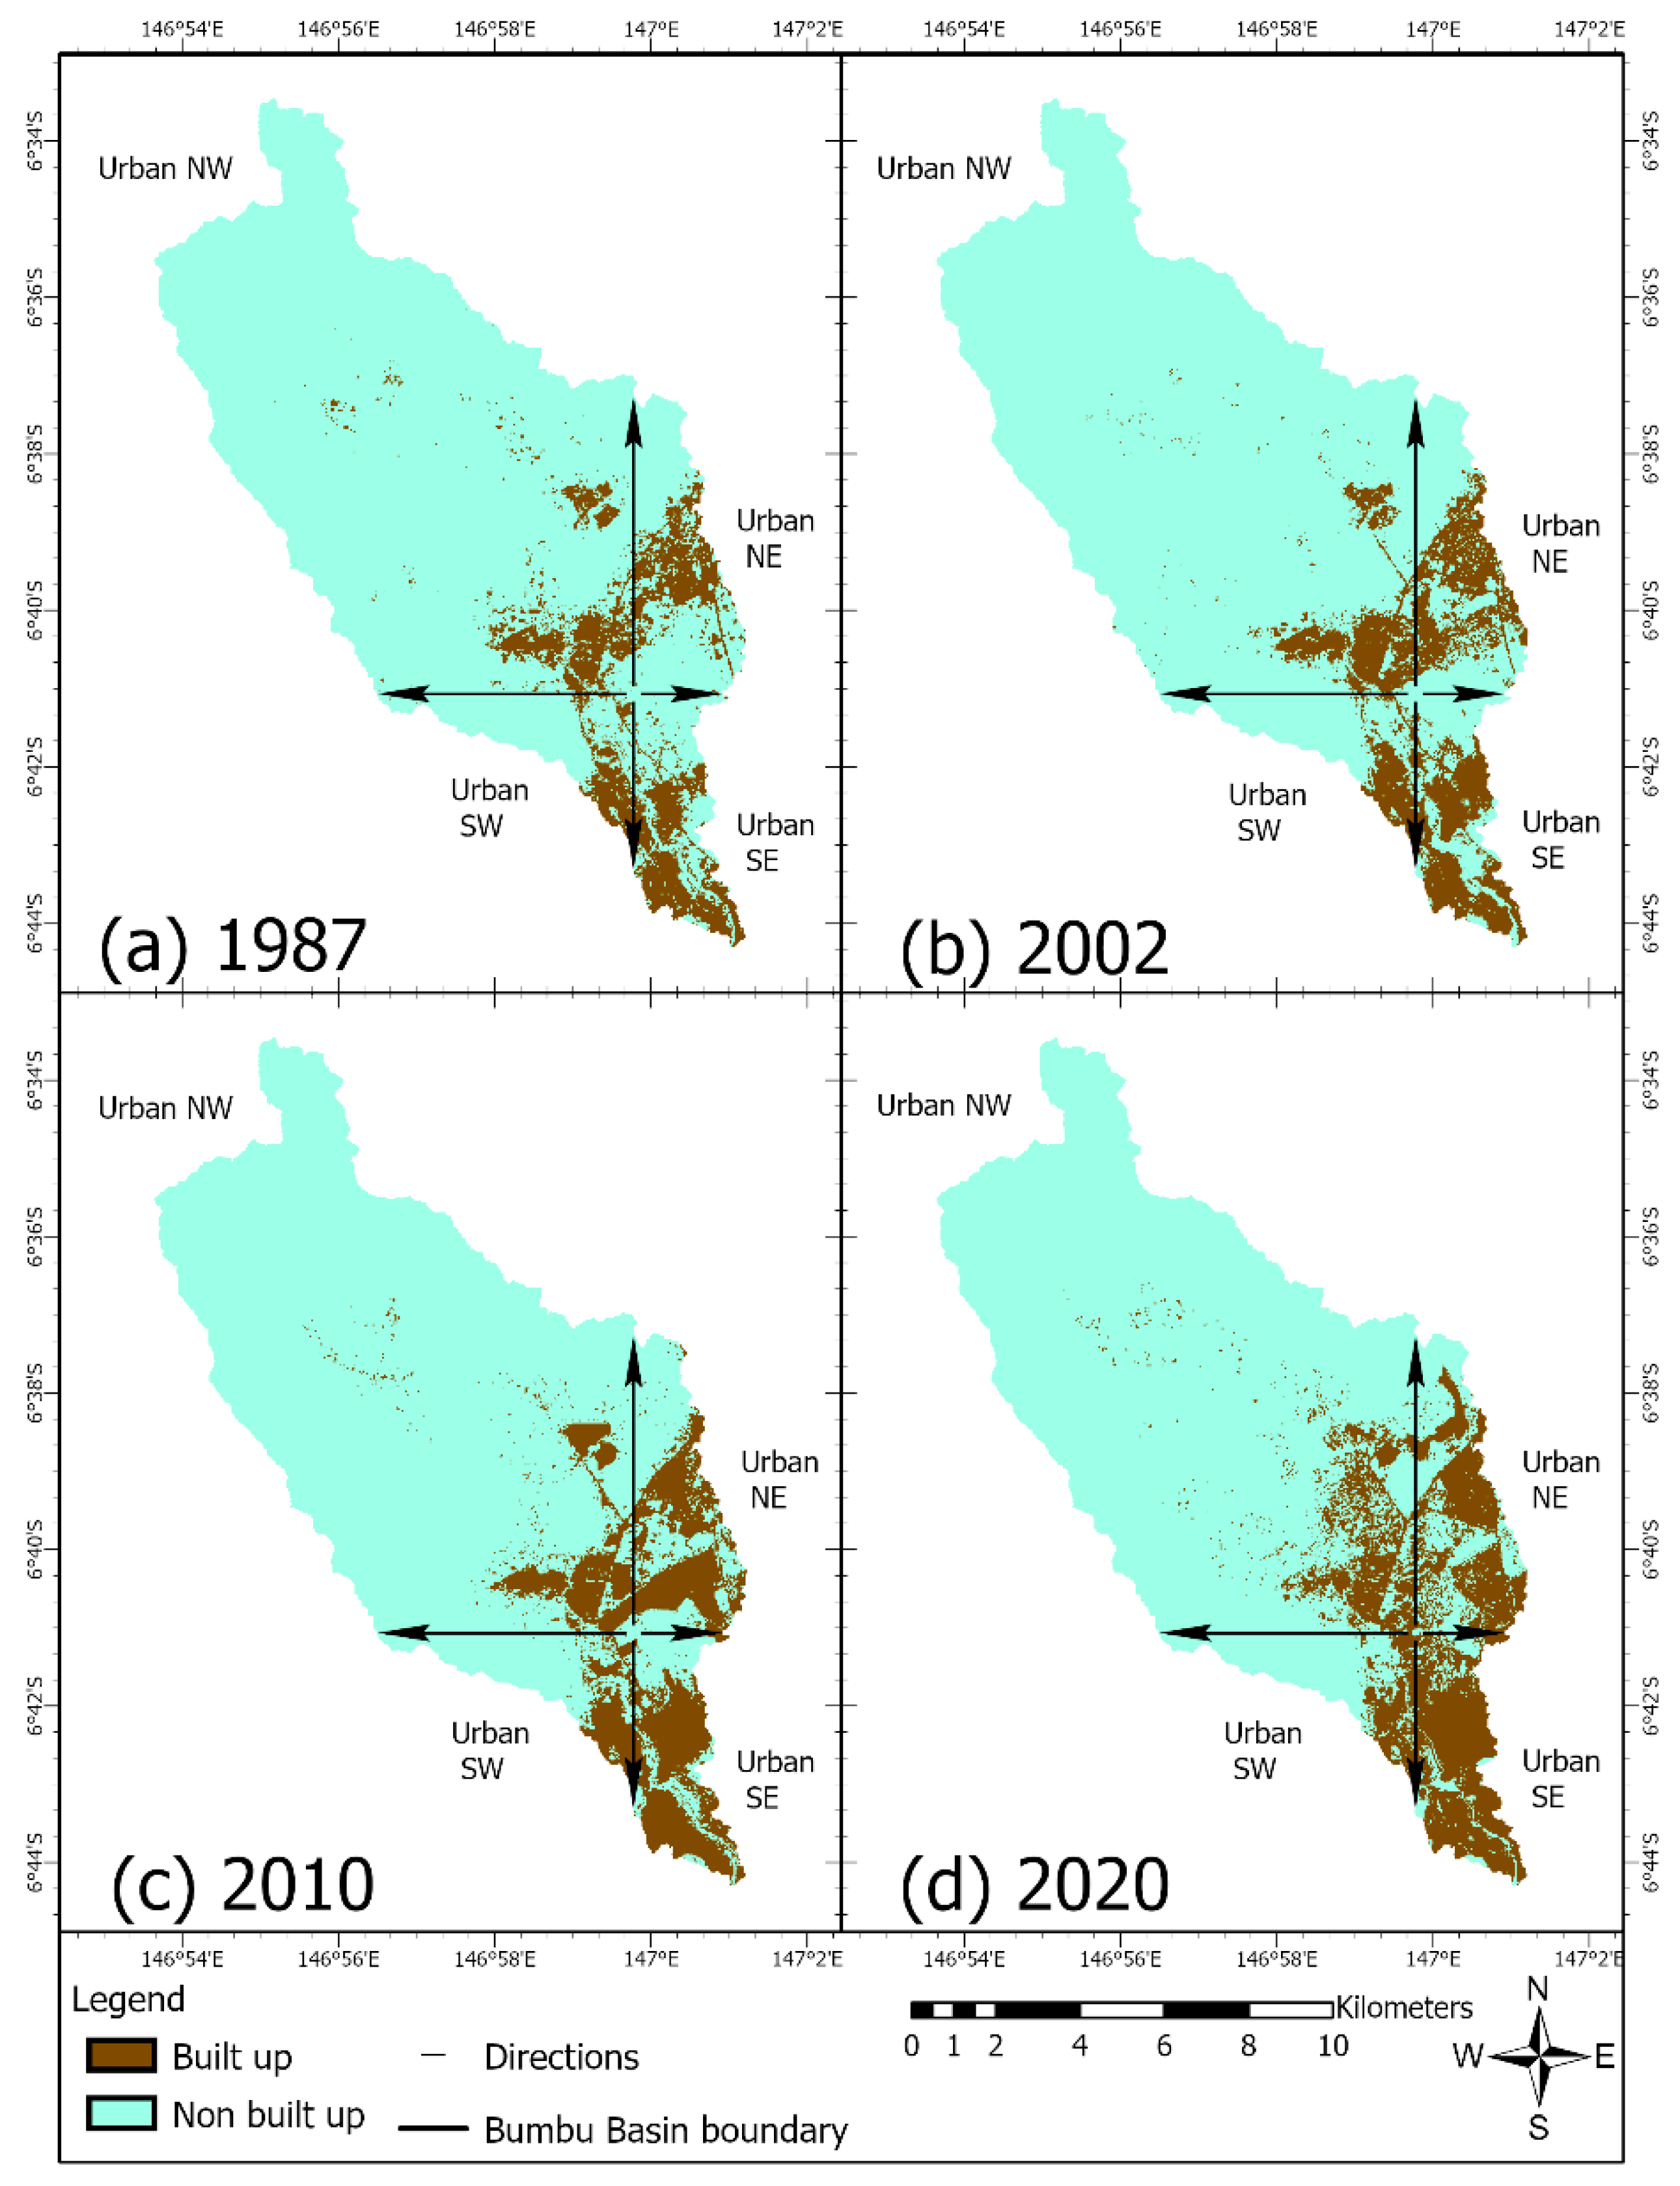
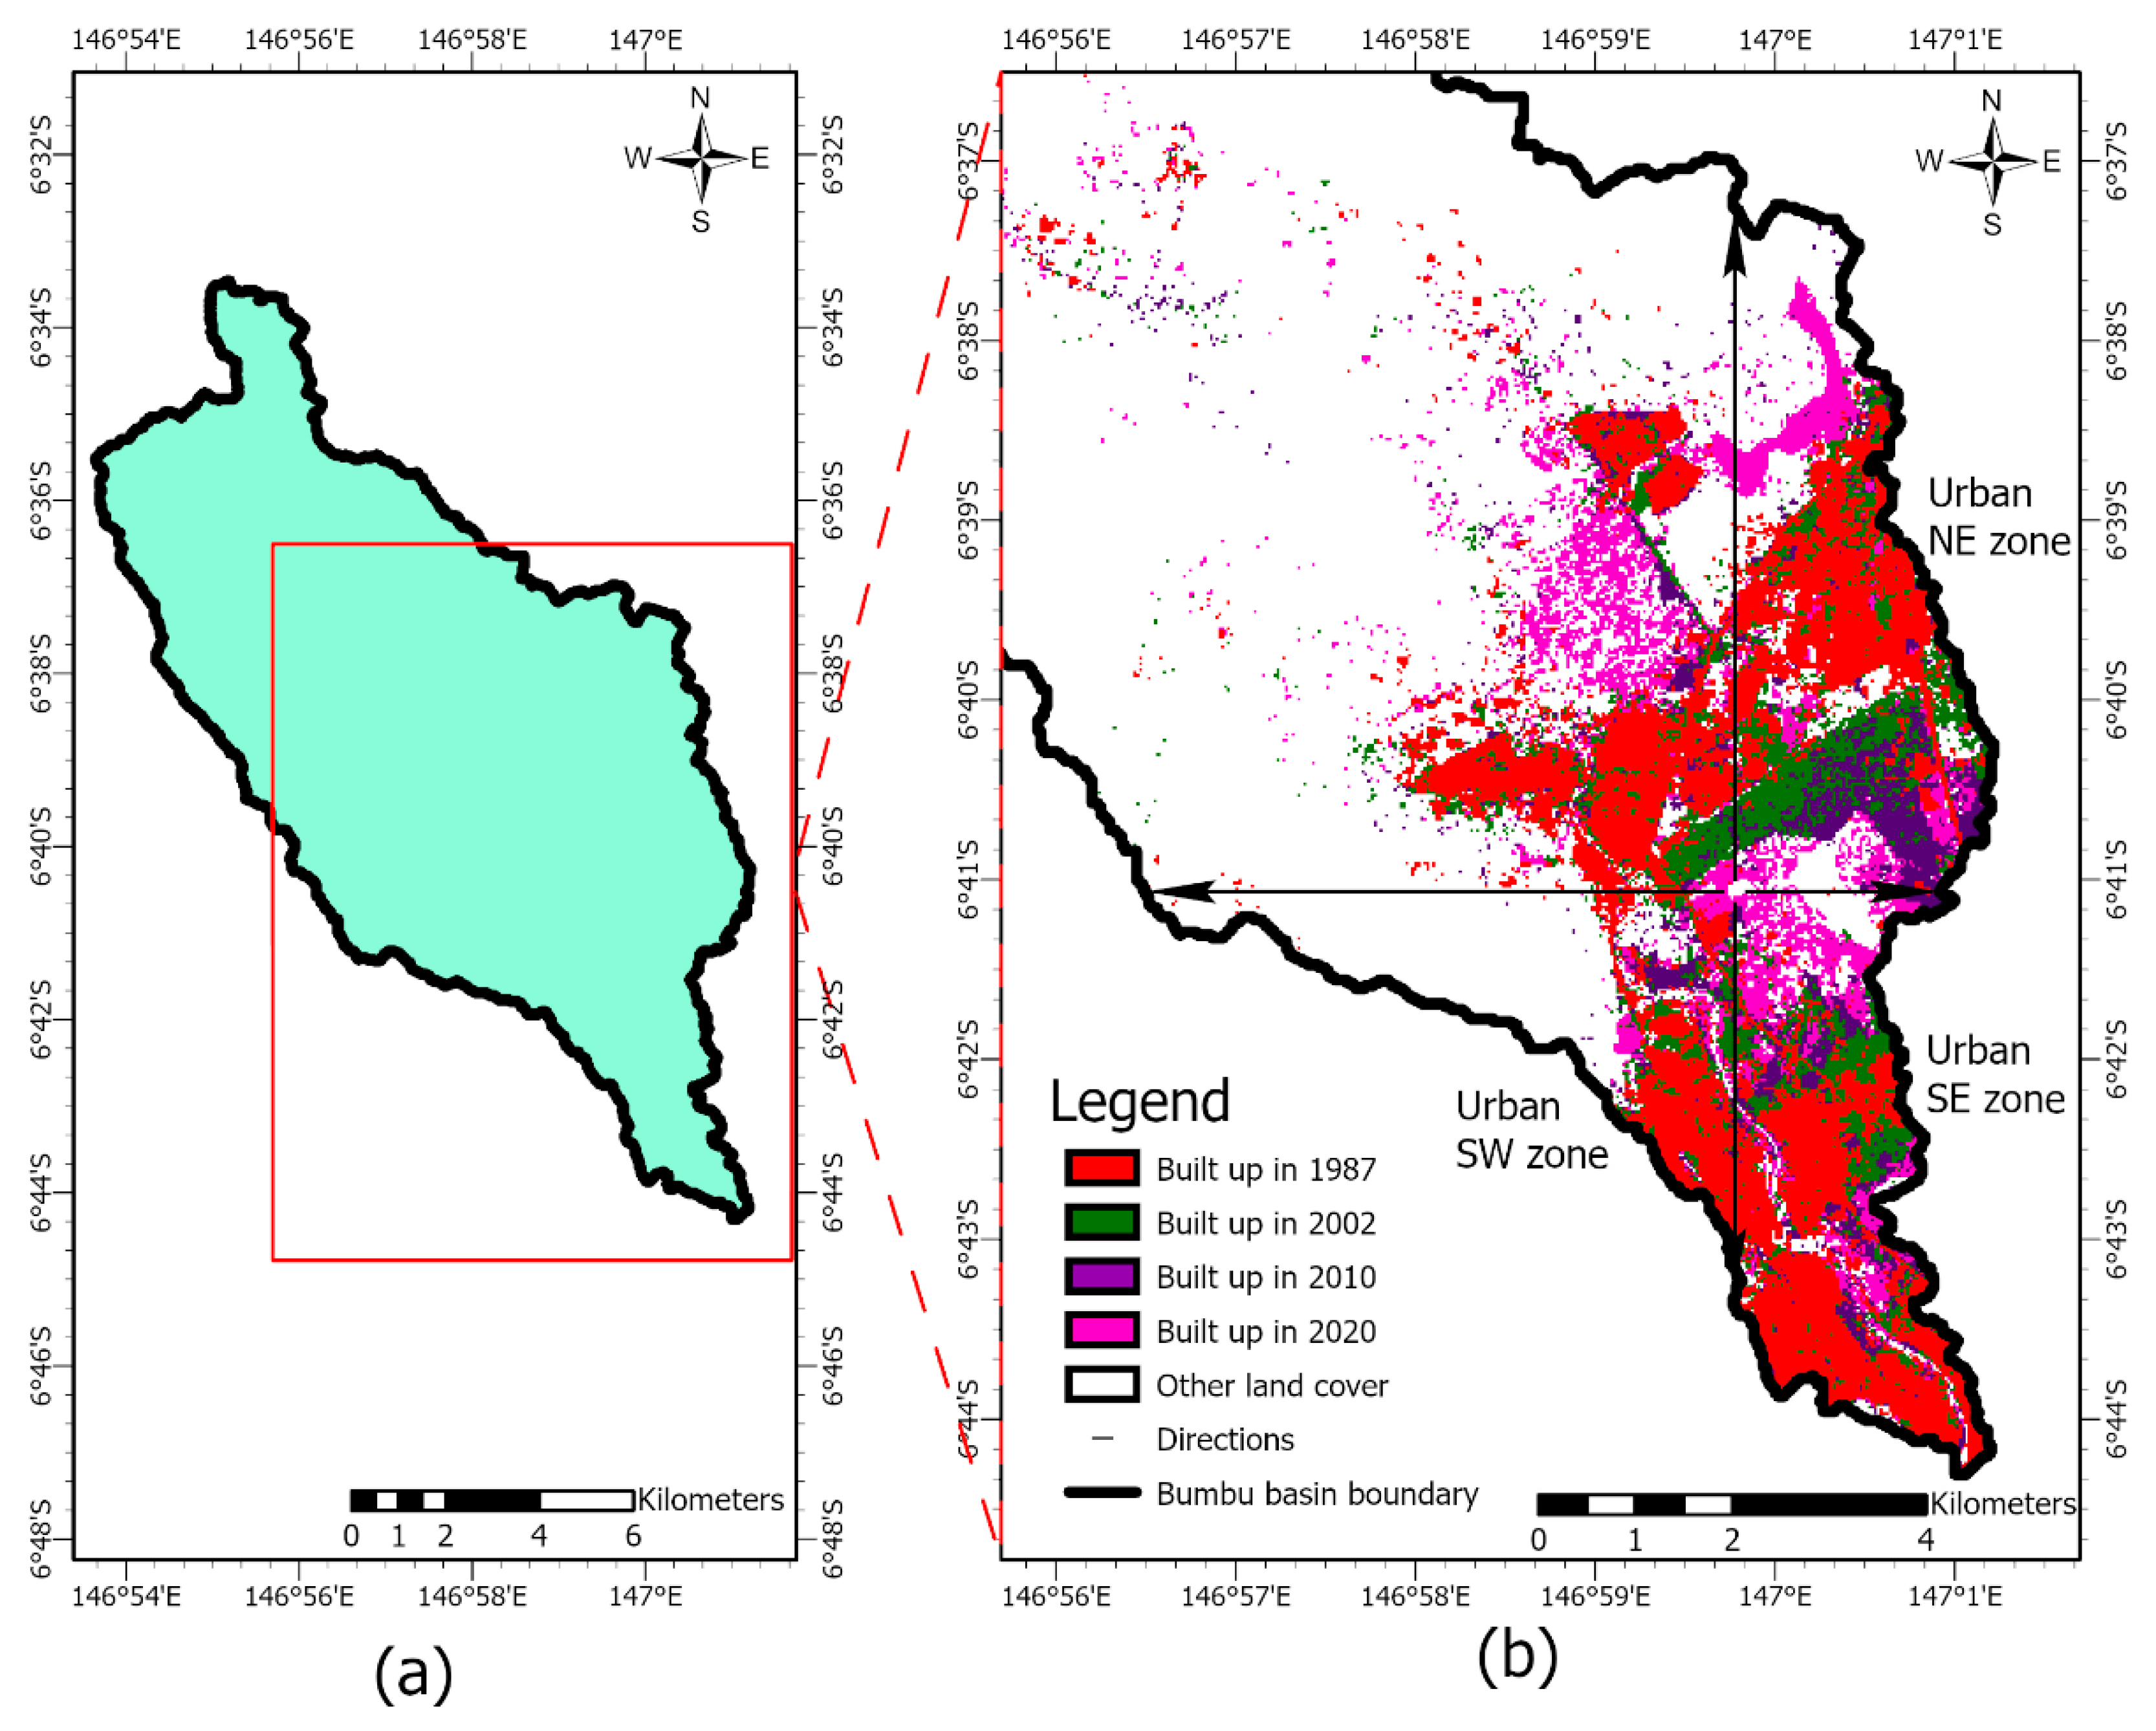
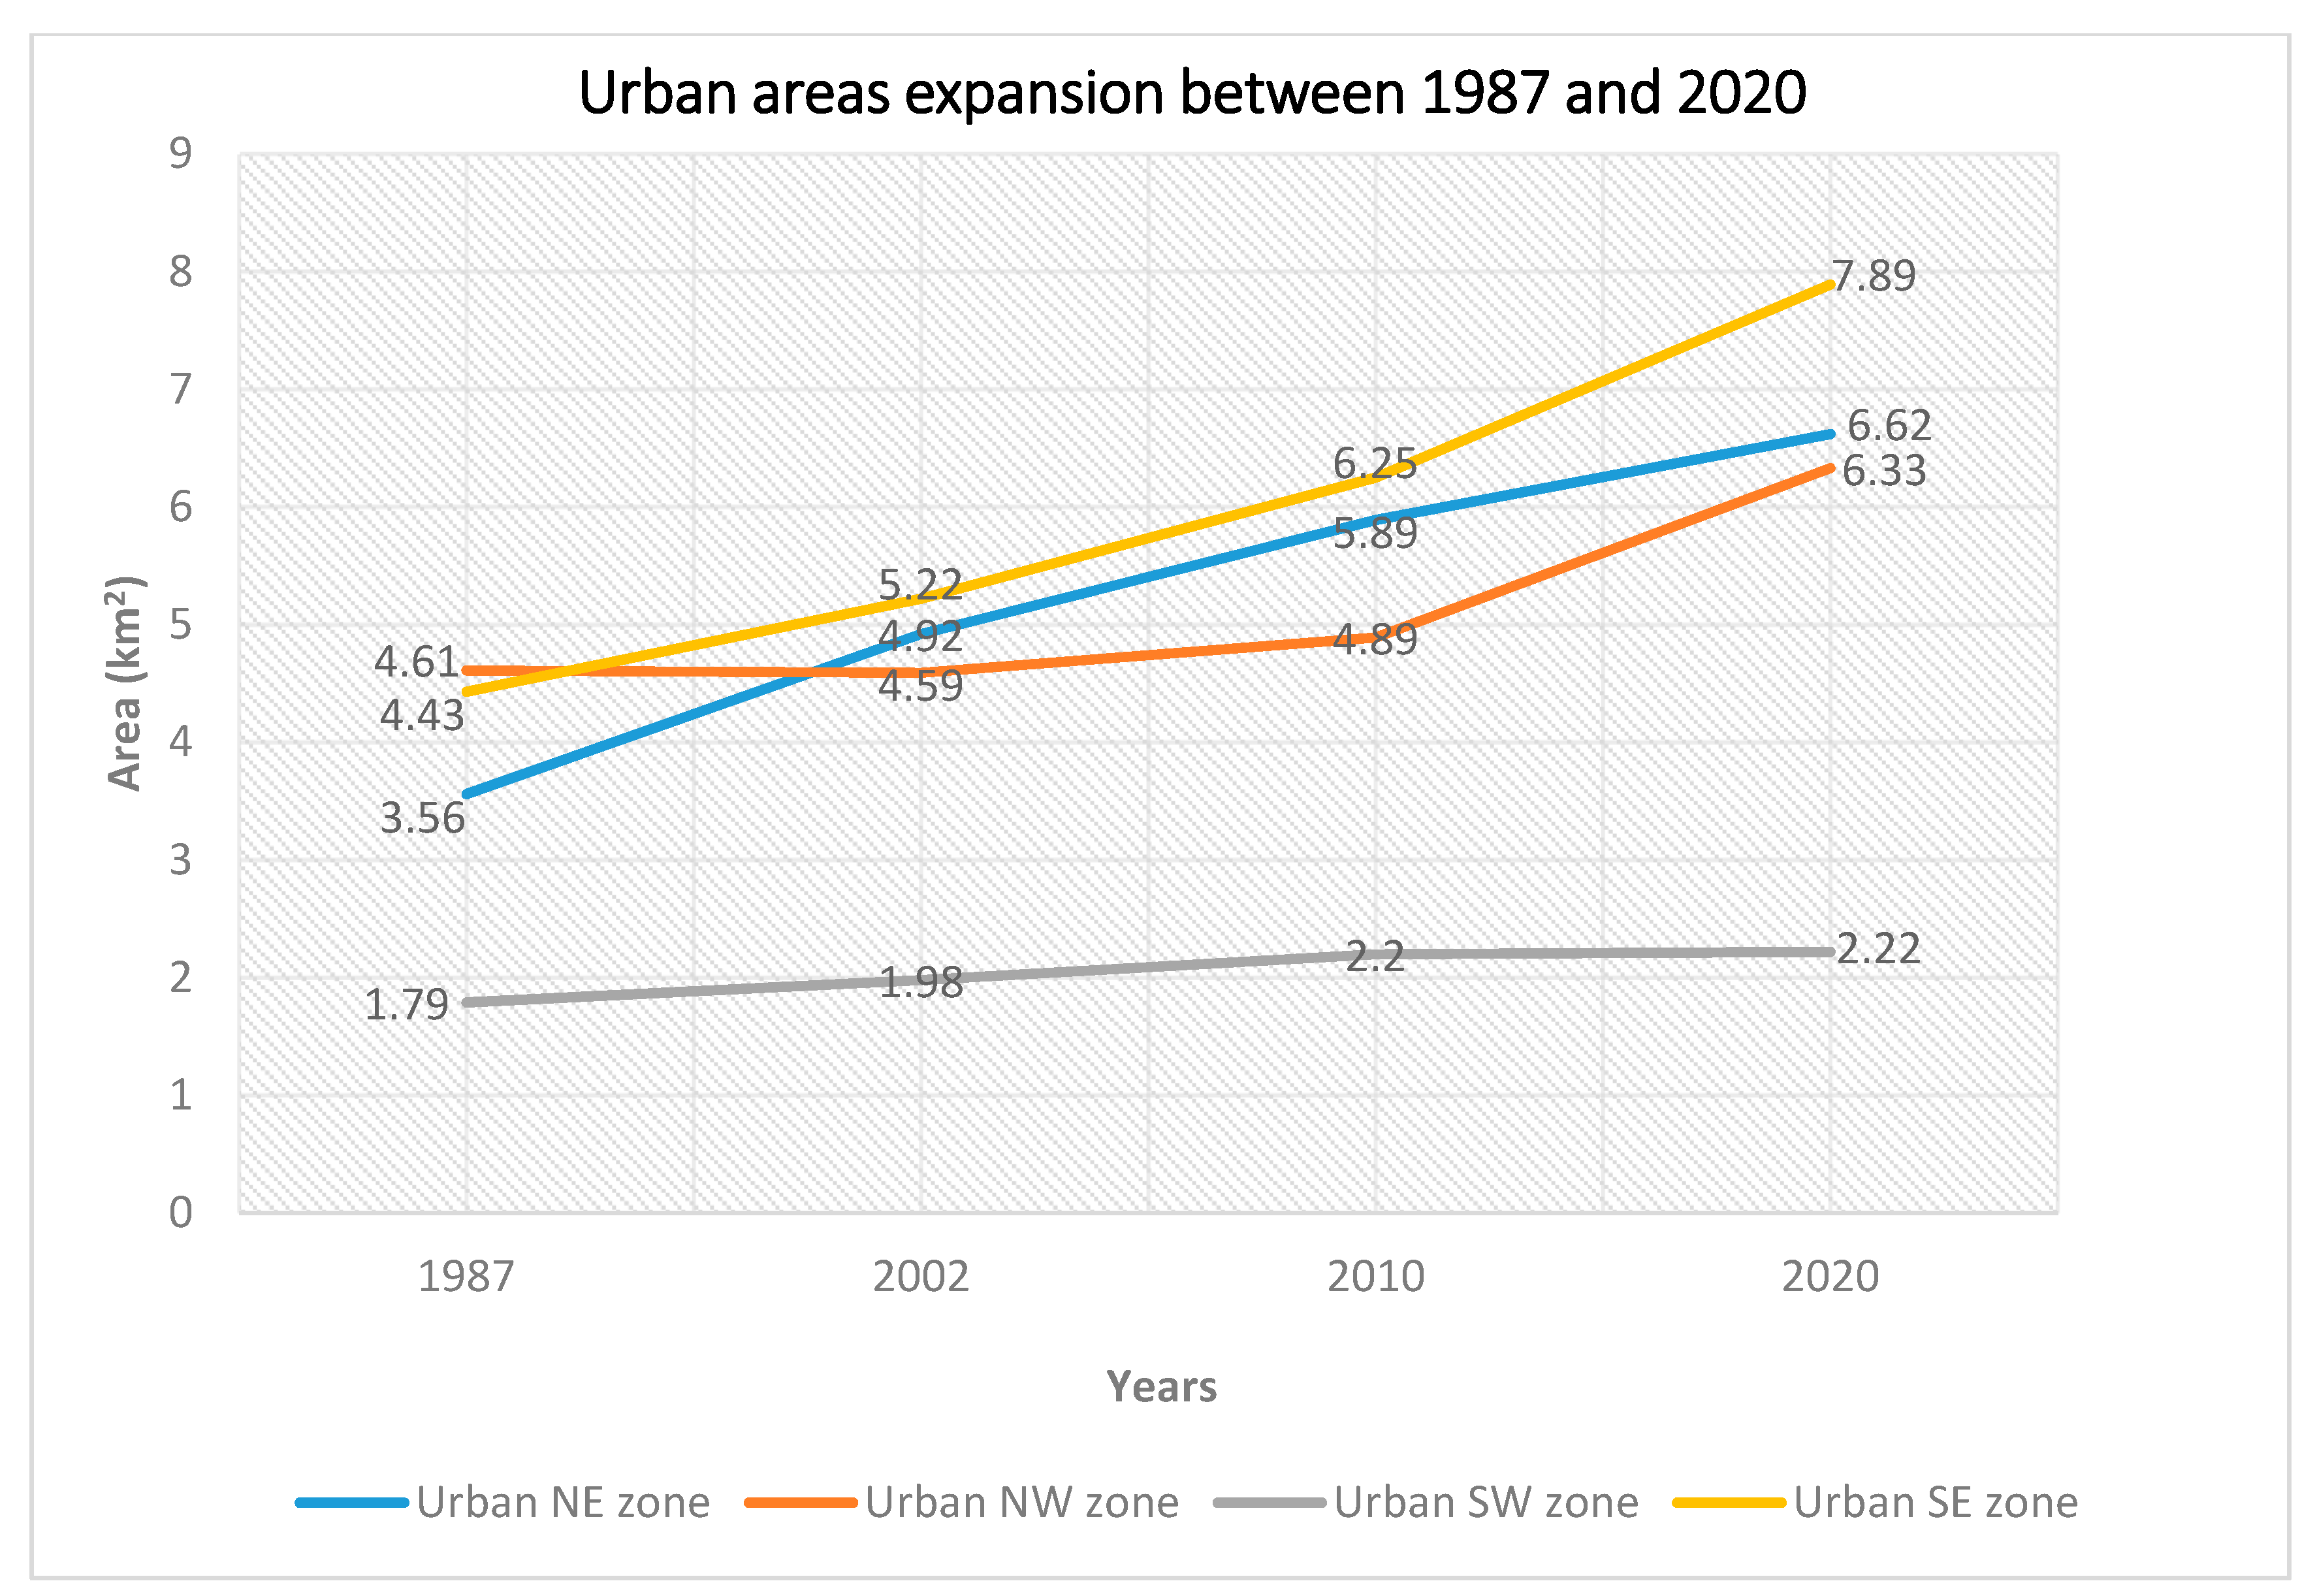
GIS-based urban analysis revealed an expansion and more dispersed distribution of urban areas in all four zones. The areal extent of expansion and the rate of change per year in each zone are reported in Table 4. The southeastern zone (SE) and the northeastern zone (NE) experienced the largest share of the expansion in built-up areas over the period 1987 to 2020, while the expansion in the northwestern zone (NW) was significant in the overall studied period, and the second sharpest increase, after the southeastern zone (SE), in urban classifications occurred in the last ten years (as shown in Figure 4, Figure 5 and Figure 6). These significant sprawls in the northern zones of urban areas, where the forest cover is dense, along with the overall observed expansion of other land type class encouraged us to substantiate the contention that the forest losses are most likely due to urban and agriculture expansion. Moreover, the overall aerial extent of urbanization increased rapidly and peaked in the period from 2010 to 2020. The lowest rate of expansion was experienced by the southwestern (SW) zone, which was already densely urban in its southern part prior to 1987. The analysis indicates expanding the urban area to the north puts the lands in these northern zones under stress due to this urban expansion (Figure 5).
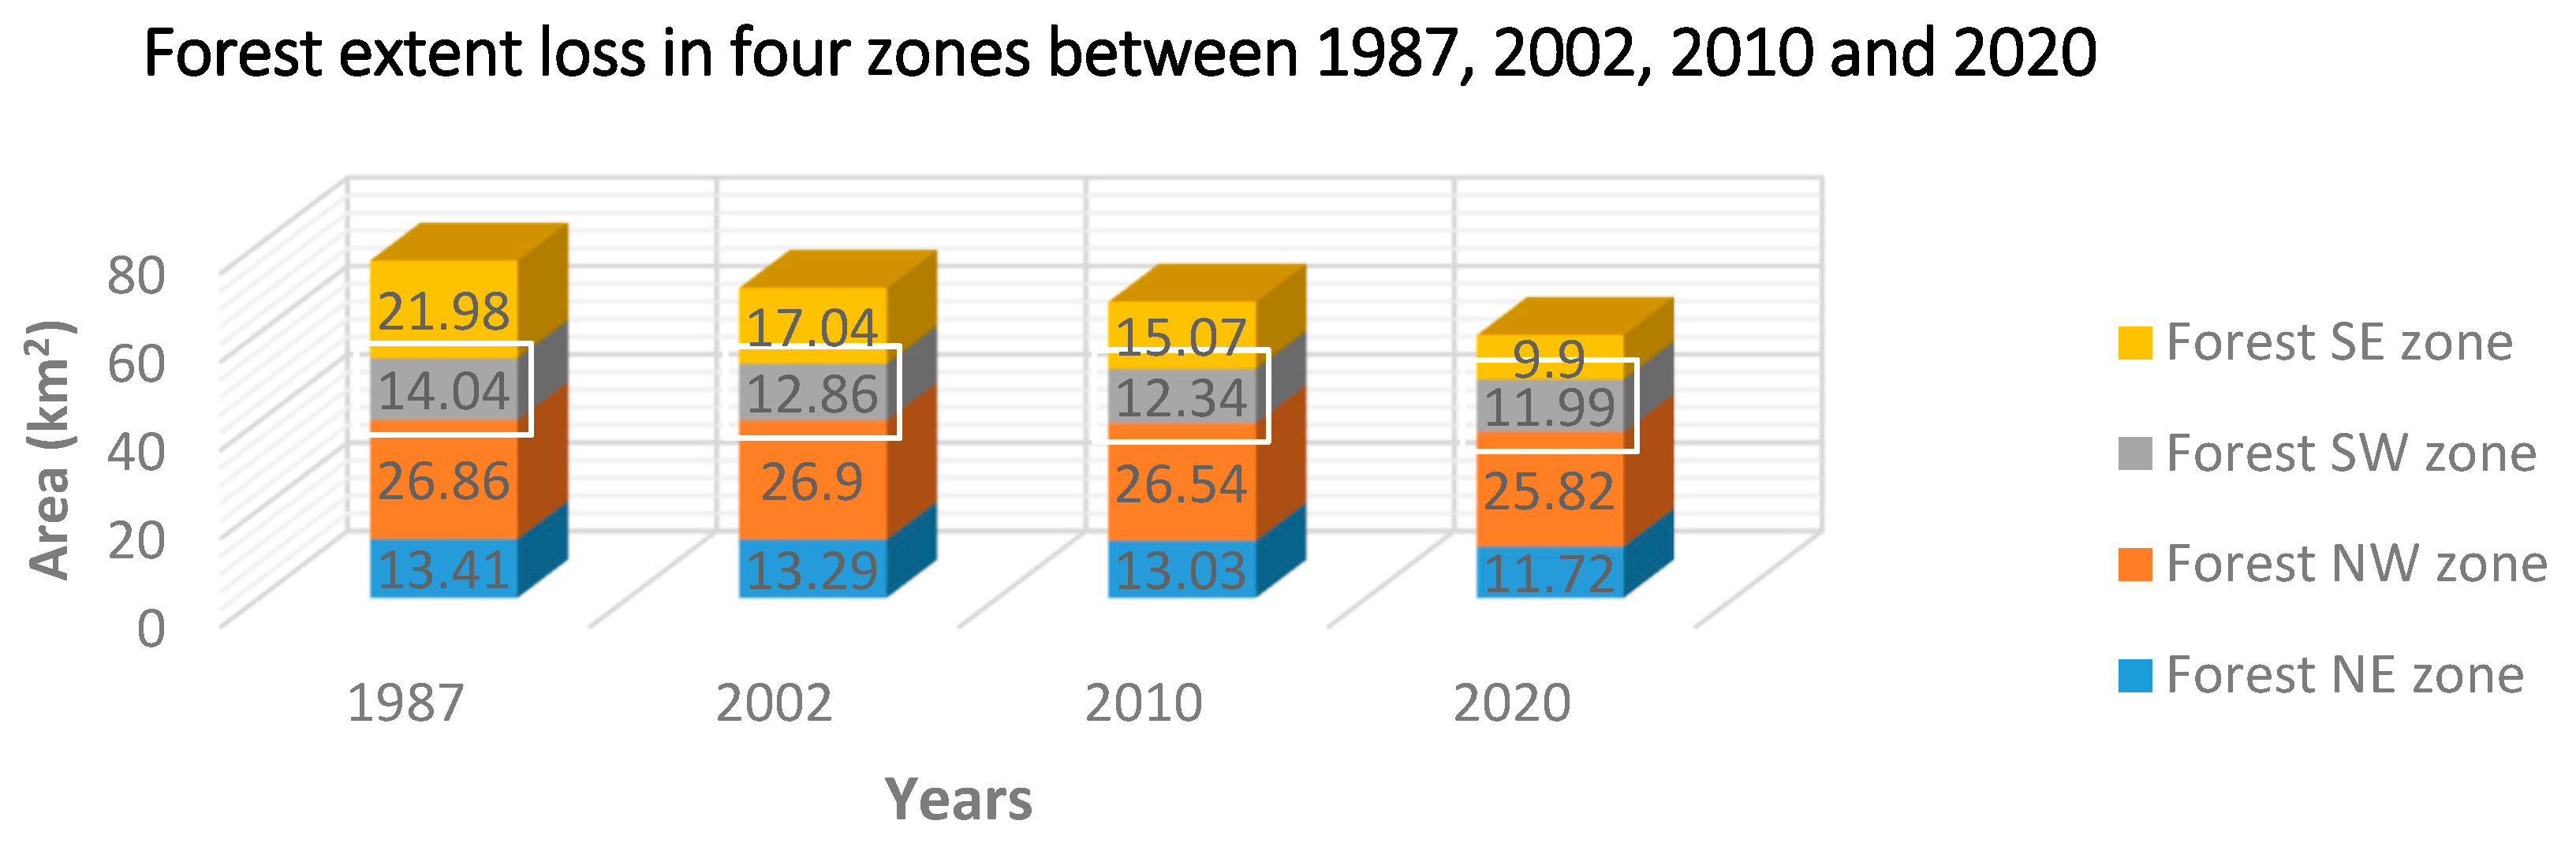
The in-depth analysis of forest area changes shows an overall rapid loss in forest extent in all zones over all the time intervals. The forest extent in the southeastern forest zone decreased significantly, especially in the last ten years. This decrease could be attributed to the expansion of built-up areas and to the increase in the extent of other types of land cover. Forest loss in the northeastern and northwestern forested zones is relatively lower in comparison to the southern zones; however, both northern zones have experienced forest loss. Figure 7 shows the spatial pattern of forest loss in all the studied time intervals. Zonal and total changes in the extent of forested areas along with the yearly rate of change for three time intervals within the study period 1987–2020 are presented in Table 5.
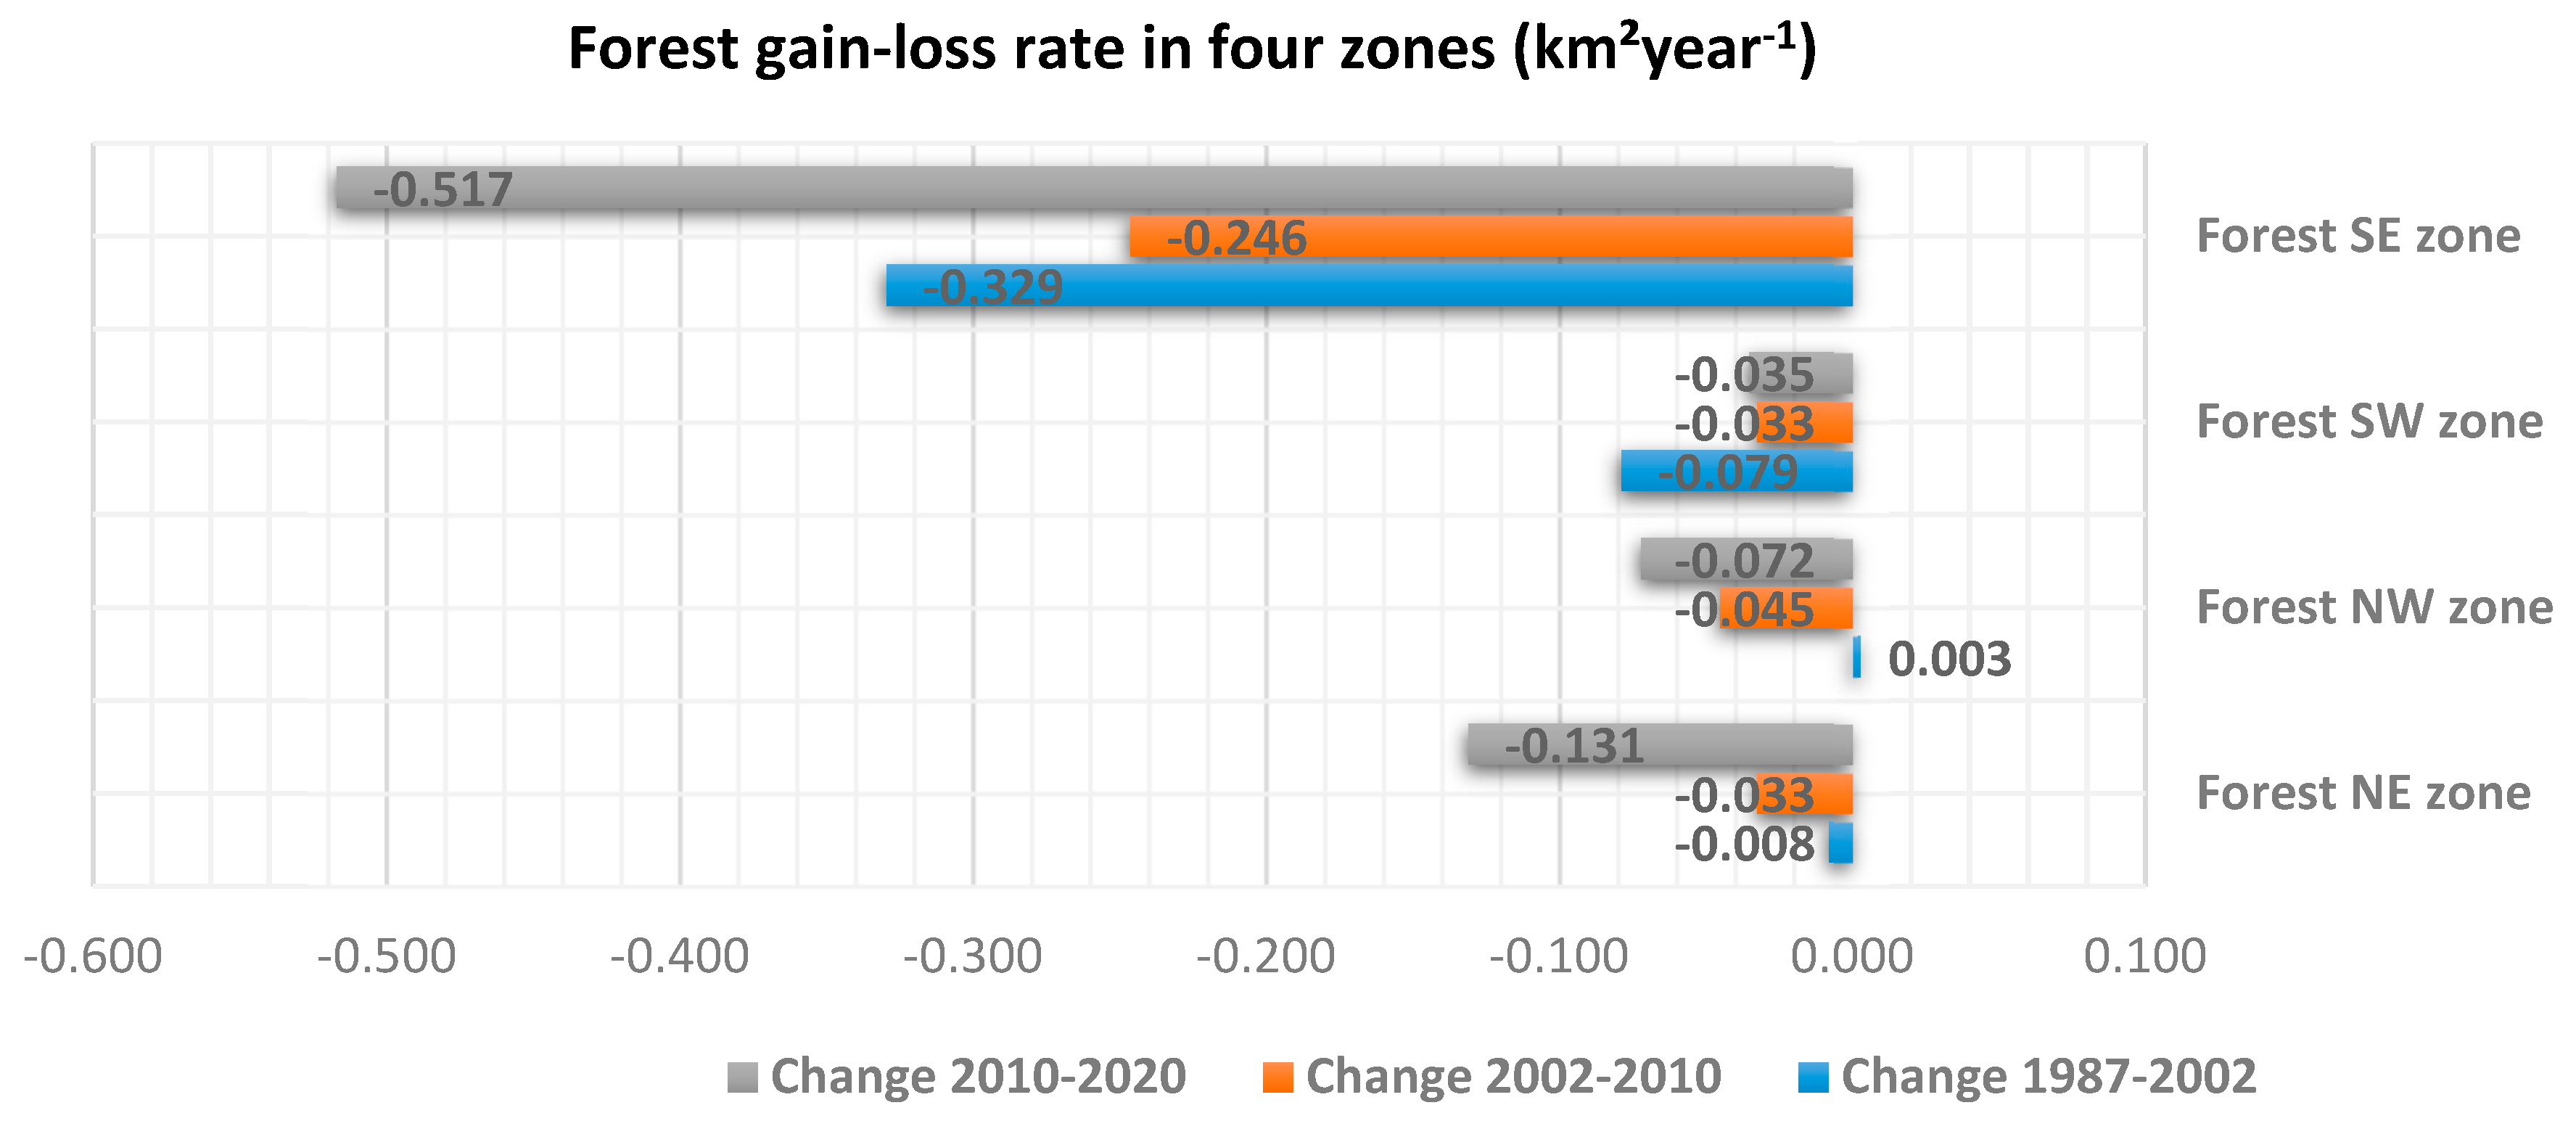
The rates of forest loss in the period between 2010 and 2020 in all zones were significantly higher (−0.517, −0.035, −0.072, −0.131 km2 year−1 for the zones SW, SW, NW, NE, respectively) in comparison with other periods, with the highest rate of loss occurring in the southeastern forest zone. It should be noted that the northwestern zone experienced a modest gain in forest extent from 1987–2002. On the other hand, there was no gain in the forest extent in any other zone in any other time period; nevertheless, it should be borne in mind that the absence of forest gain in the total area may not account for the marginal forest gain that appear in the maps and charts (Figure 7, Figure 8, Figure 9 and Figure 10) as the lost area was larger than the gained one; the total change in Table 5 appears only as a loss. Figure 9 shows the gain–loss rate in all zones and it can be noticed that the southeastern zone has witnessed the highest rate of loss and the largest loss of forested area during the study period.
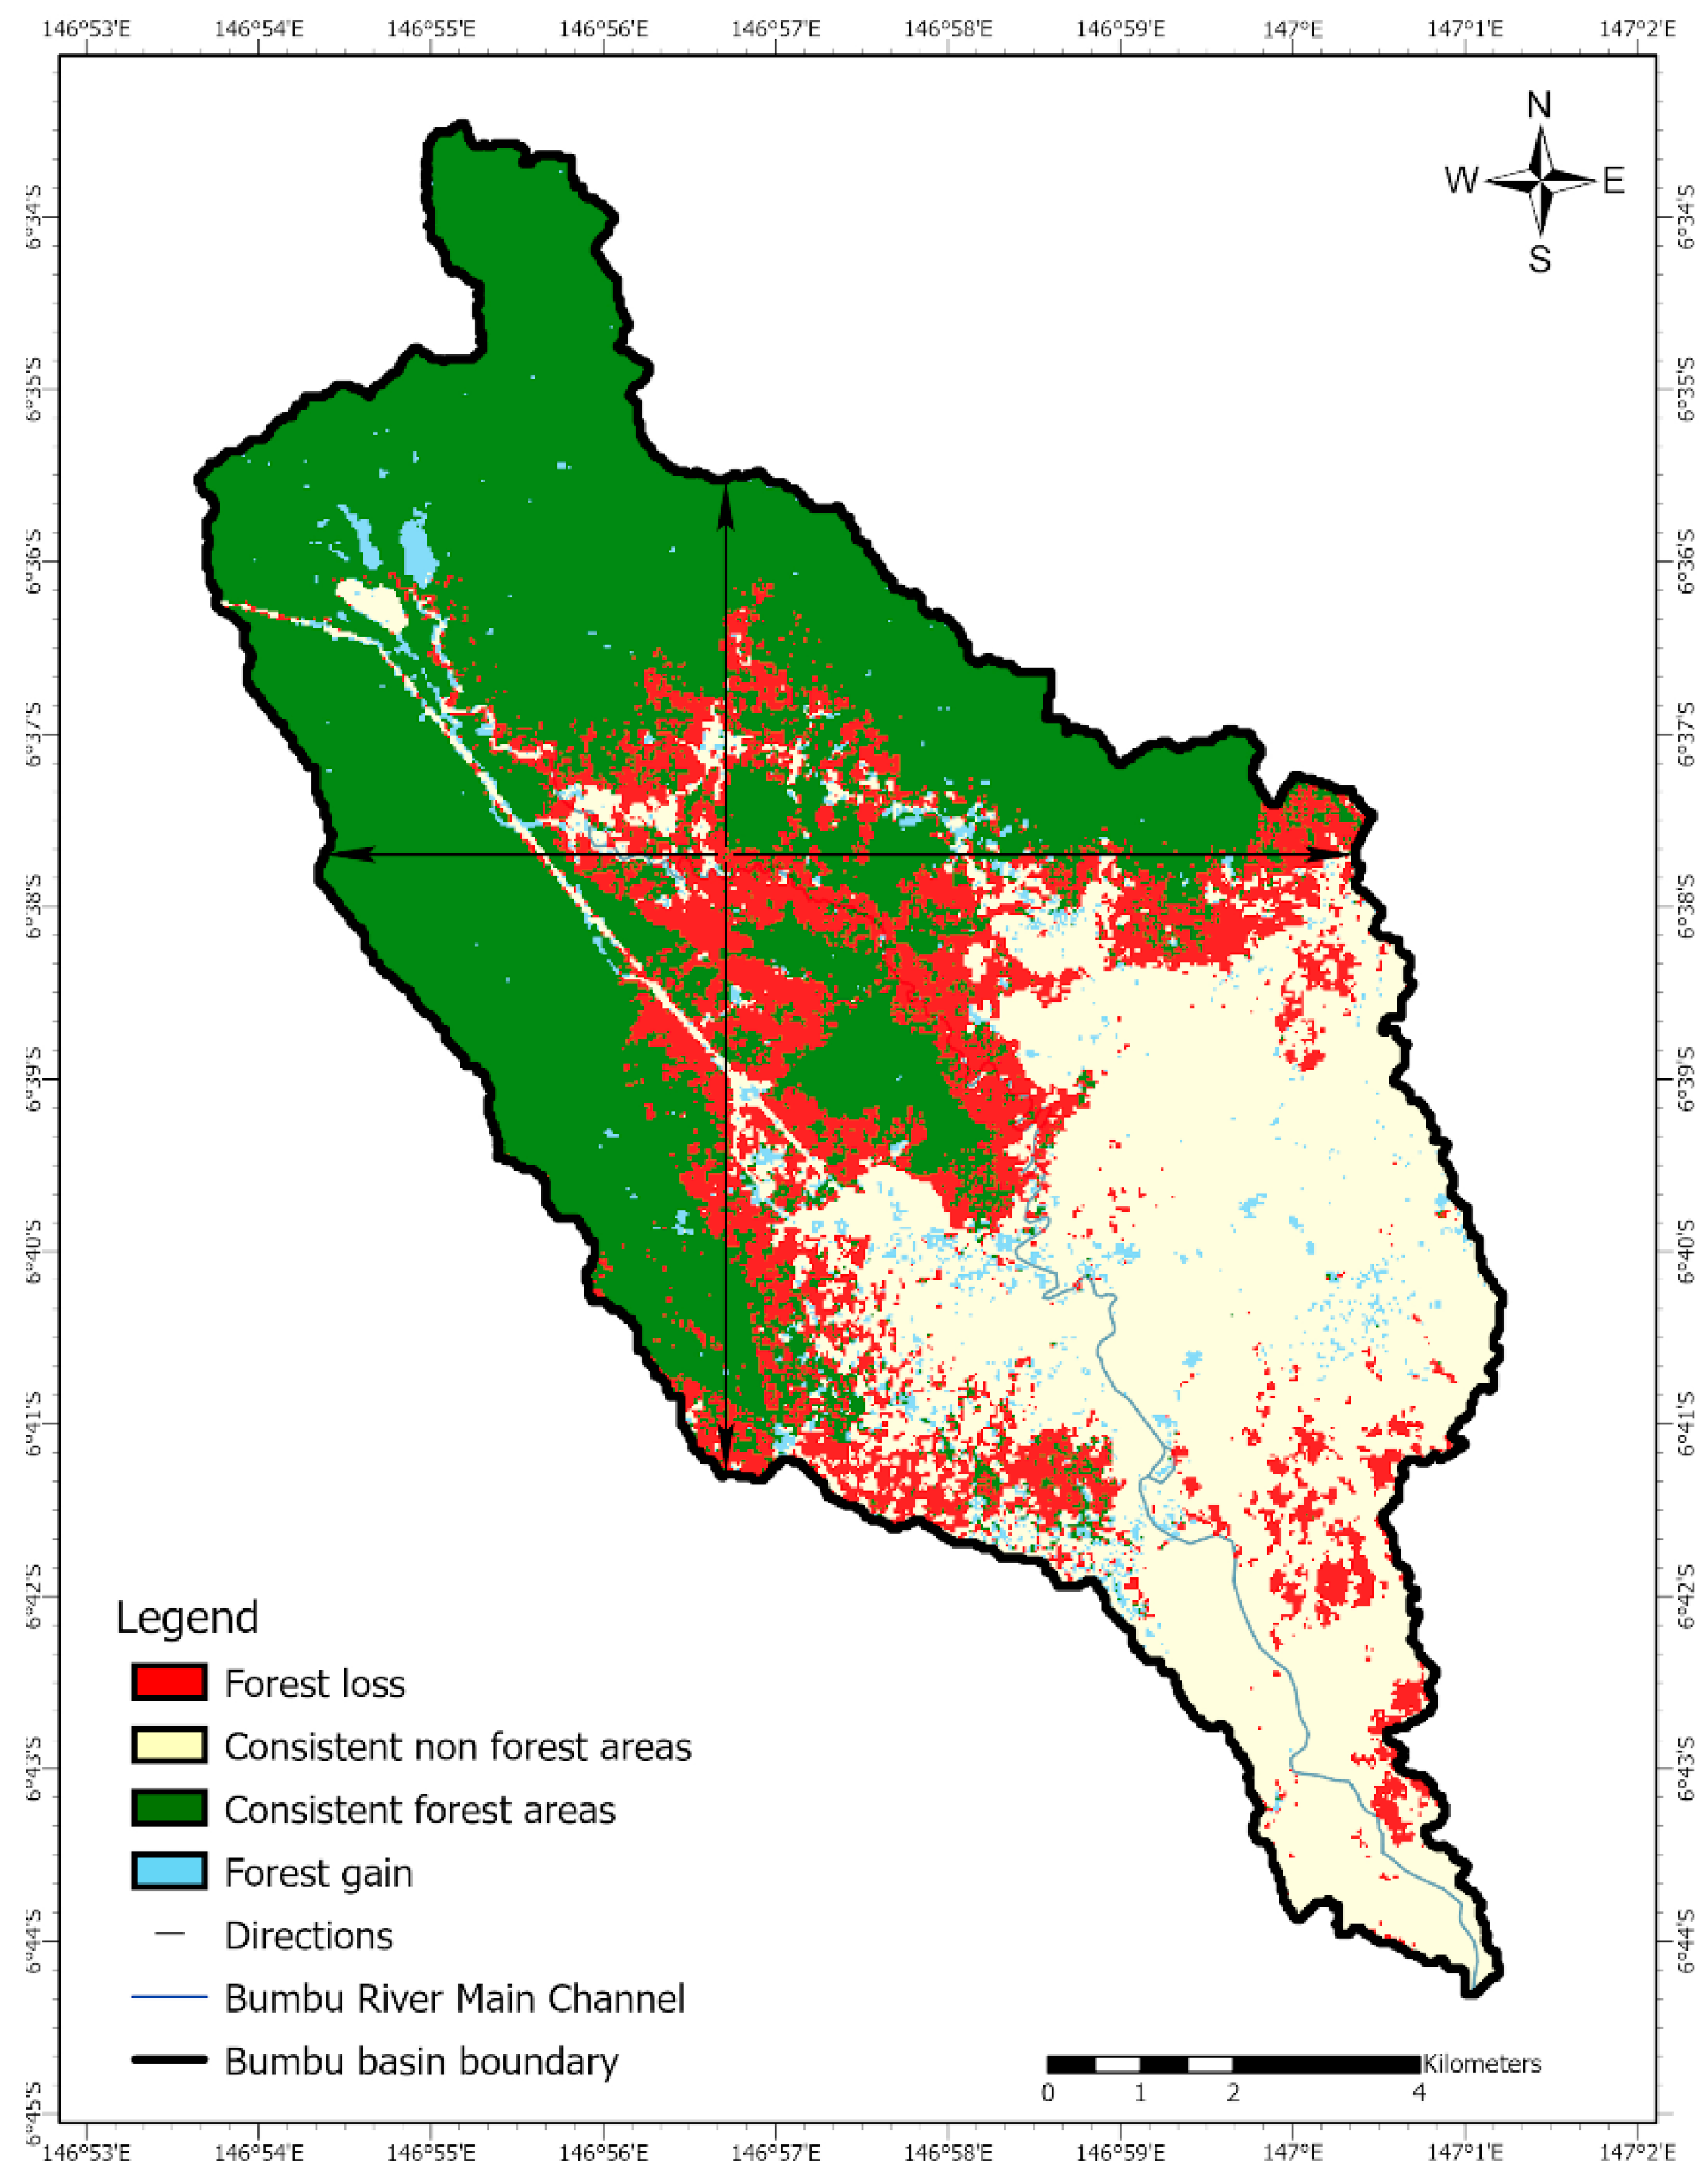
A graphical portrayal of the spatial distribution of gains and losses of forested areas across the watershed from 1987 to 2020 is presented in Figure 10. This map was derived from the classified images of 1987 and 2020 by applying pixel-to-pixel comparison with subsequent reclassification of the result into four different classes showing (a) forest loss, (b) forest gain, (c) consistent forest extent, and (d) unchanged other land types (Figure 10). Moreover, the areas were calculated and the results are presented in Table 6.
4. Discussion
On conducting LULC analysis, we observed a progressive decrease in the forest area in the Bumbu river basin for all the time intervals considered, with the maximum change happening between 2010 and 2020. These findings are crucial as there have been very few studies that track the change in deforestation patterns in Papua New Guinea in the past decade, even though around 63.4% of the country consisted of forested areas as of 2010; and endeavors exploring spatial patterns of forest loss within particular study areas are even more scarce. In our case, the study area had 62.33% forest cover in 1987 which dwindled down to 57.26% in 2002 and then to 54.72% in 2010 and afterwards to 48.55% in 2020. Therefore, there exists a need to evaluate if a similar pattern occurs at a national scale. Our results are also in tandem with the trend observed in a previous study by Ningal et al. [12], who reported a decline in forest area in Morobe Province, from 9.8 ha/person in 1975 to 4.4 ha/person in 2000. However, two major differences we have in our study are i) our study states urbanization as one of the core reasons for the reduced forest cover in addition to agricultural land expansion, whereas in the former case, subsistence agriculture was listed as the primary cause and ii) instead of solely depending on satellite imagery for performing LULC analysis, possibly due to the lack of available data, in the former case, the authors relied on topographic maps for the year 1975. Notwithstanding the minor distinctions, the primary underlying reasons in both cases were attributed to the rise in the population. Another study by Samanta and Pal [42] derived a change detection matrix of 1992–2013/14 from Landsat-based observations and reported the occurrence of extensive urban sprawl in Lae, the capital of Morobe Province, which was followed by a decline in natural forests by around 6977.25 hectares within a span of 20 years. Given that our study area is a watershed region, concerns with respect to a change in the course of Busu river in Lae city and concomitant destruction of extant land cover patterns, as expressed in Sekac and Jana [32], should also be taken into consideration, and we will be weighing this factor while executing the task mentioned in Section 6.3.
A few of the major issues we came across during our pilot study were related to the cloud cover. For the years of interest it was not possible to acquire cloud-free satellite imagery for similar time periods of the year. In the current study, for the years 1987, 2002, 2010, and 2020, the months of October, November, February, and May were considered, respectively. This mismatch in time periods might have placed constraints on inter-annual comparisons as the vegetation zones with a net phenological cycle can be distorted in this case. Consequently, the “Other” class, which includes cultivated lands, could have also been prone to underestimations due to the aforementioned reason; for instance, the cases where post-harvested crop areas might be tagged as bare soil; similarly this might result in some built areas having no real link with urbanization. Therefore, for our upcoming comprehensive study, we intend to adopt a standard LULC classification system with the following classes: forest land, barren, wetland, water, agriculture, rangeland, and built-up areas. In this way, we expect to be capable of teasing out small vegetation areas, isolated small buildings, and similar areas and to be a better judge of LULC activities happening in the study area. Also, for combating loopholes arising from the low resolution of Landsat sensors, Sentinel-1 and Sentinel-2 data—or a fusion of Sentinel and Landsat data—are considered as an alternative. The 10 m resolution open-source images offered at a high revisit time by Sentinel sensors would be able to help in selecting cloud-free images and to identify the best periods to observe different vegetation covers in the years post 2014 [43,44,45]. Additionally, employing semi-automatic approaches in land transformation analyses—which would allow the construction of models based on predefined classification—can be deemed beneficial for performing land-use change monitoring tasks more effectively; these paradigms can be extrapolated to include other formats of data as well, as listed in Wang et al. [46], where the authors presented a framework to analyze path-dependent regional industrial land transition processes using multi-year vector data and underscored opportunities for reducing data collection efforts while monitoring land-use transitions and their impacts on the surroundings. Few other drawbacks regarding this pilot study and potential workarounds are mentioned in Section 6.
For tracking deforestation and urban sprawl in real-time, venturing into the field of drone analytics has proved to be beneficial [17,47,48,49,50]. With the advancement in image processing techniques and availability of state-of-the-art machine learning algorithms, it is now possible to perform drone-based forest monitoring operations more frequently and at semi-automated levels. Similarly, LiDAR (Light Detection and Ranging) technology also offers multiple benefits along this line; being an active sensor, it is capable of extracting high-definition information of vertical forest structures—unlike satellite- and drone-based remote sensing techniques—and hence plays a crucial role in studies focused on estimating biomass levels and forest structures in dense canopy areas. Nevertheless, the primary constraint while employing LiDAR is the associated cost, which limits its applicability for larger areas, and for experiments needing recurring data [51,52,53,54]. Additionally, combinations of drones and LiDAR are also gaining momentum [55,56]. However, for large-scale studies, satellite imagery can be considered to be the optimal choice.
Based on our results, we hope to attract more international attention, public participation, and local government and NGO involvement for addressing exigent requirements of a sustainable community. This will allow Papua New Guinea to track its domestic emissions of greenhouse gases in a more effective way for supporting REDD+ initiatives and to keep a check on the growing demand for biofuels, which poses a serious threat to existing forested landscapes of the country [57]. Currently, due to a lack of human resources and financial aid, there is a lag in the implementation of state-of-the-art forest monitoring techniques, and most of the existing forest distribution maps are out of date [58]. Therefore, by highlighting the urgency with respect to curbing deforestation and mitigating climate change, we champion the need for revamping the existing forest management paradigms and associated policies. Future directions of this project are described in Section 6.
5. Conclusions
On examining forest loss and gain, and urban area changes, in the Bumbu river watershed between 1987 and 2020 using GIS and remote sensing, our preliminary results indicated a progressive decrease in the total forested area during the study period, with the rate of decrease peaking in the last ten years between 2010 and 2020. The loss of forested land was most intense in the area to the northwest of Lae. Simultaneously, a rapid increase in the urban extent and other land types was observed across the study area at the expense of a decrease in forested areas. However, given the coarse resolution of Landsat imagery, we had issues with consistent representation of land areas. For subsequent studies, we intend to collaborate with Pacific—Australia Climate Change Science and Adaptation Planning (PACCSAP) and acquire LiDAR data for our study area as these approaches will help us gather more information about the tree populations in various stages of development and will be a valuable complement to the optical data from satellites for LULC studies. Additionally, applications of data from higher resolution imagery acquired using Unmanned Aerial Vehicles (UAVs) in a timely manner is perceived as an alternative from an economic point of view. Regardless of the data acquisition method, we can unanimously agree that up-to-date and site-specific, yet scalable approaches are a must for developing and implementing good management practice for assessing LULC given the transient changes happening in response to global climate change.
6. Future Tasks
6.1. Annual Land-Use Land Cover (LULC) Change Analysis
In future analyses, as a part of this task, we will be utilizing annual time series satellite data—as opposed to imagery of the four time periods used in this preliminary study—to analyze land-use land change patterns. Moreover, two images with slightly different time periods will be considered for each year to minimize cloud disturbance. Adding to that, we look forward to evaluating how fusion of Sentinel data with Landsat imagery helps increase our chances of obtaining cloud-free imagery for the years post 2014 to overcome the presence of phenological uncertainties. From the preliminary analysis, we noticed a considerable decrease in forest extent at fluctuating rates among zones and over the studied period. Nevertheless, several changes and a sequence of multiple consecutive events can happen very rapidly and might be untraceable in 5+ year intervals; for instance, excessive tree mortality due to sudden drought or hurricane followed by the transition of that land into industrial structures. We also noticed that there were modest increases in forested landscapes in some areas, though it is still unclear whether this was due to misclassification of pixels or a real phenomenon. Nonetheless, with annual Landsat data we might be able to detect the exact changes happening year by year and have more options to overcome cloudy imagery issues; this could also reduce the error rate through better interpretation capability. Also, the study area itself gives significance to this work as the previous studies were done at a much larger scale. Identifying the urban sprawl directions and forest loss directions at this scale would give essential information to decision-makers and hopefully support implementation of preventative measures in regards to forest loss. For accurate quantification of forest regeneration, the annual information would be critical and it would be able to provide unique perspectives; the literature review reveals very few studies focusing on this subject, and moreover, some have expected continuous loss of forest without accounting for regenerating forests [12].
We also noticed increasing rates of urban expansion to be acute in the past ten years, especially in the northeastern and southeastern zones of the urban area. Annual data will allow us to evaluate if the urban expansion was spread out evenly or if there were critical extreme events that led to the varying rates at which expansion took place. Also, we plan to further investigate anomalies such as the negative rates of change of urban classifications in the urban northwestern zone between 1987 and 2002 which indicates a marginal disappearance of built-up areas; we expect this to be a result of misclassified pixels as reported in the error matrix, rather than a result of demolished urban areas. This will also help us explore issues with classifying transitions in forest lands within the Bumbu watershed—for instance, inference on how much of the dense forests transitioned into regenerative forest and vice versa—and shed more light on where Papua New Guinea should concentrate efforts to preserve forested land.
6.2. Improved Classification of Regenerated Forests
Given the relatively moderate resolution of Landsat satellite images, and given the small scale of the study area, one of the major challenges faced in this study was how to distinguish regenerating forested land from sparsely vegetated urban land. Despite the use of NDVI images, the attempts did not prove useful to delineate these differences. To overcome this issue and to likewise not mix the clustered trees in urban areas with forest, a generalization approach was developed during the manual reclassification process. Herein, the focus was to delineate the extent of the forest area and the extent of urban area rather than the footprint of the buildings. Given this focus, we have currently limited classification to the four classes chosen. However, in follow-up studies, we look forward to re-classifying imagery to include additional zones and to providing more detailed mixed pixel classification information by assigning thresholds or extra masks—as well as by adopting the use of improved spectral indices. In this way, it may be possible to evaluate whether harvested areas are lost forever or are in a state of regrowth that will eventually regenerate into mature forest; in the current study, such nuances are subsumed by the “other” category. For comparison purposes, neural networks will also be applied to analyze LULC change trends within the Bumbu river basin. As mentioned in the previous section, understanding whether new forests are generating or not is crucial as this helps answer many questions on forest degradation and assists in developing forest management policies and improved classification techniques.
6.3. Integration with Water Quality Data
In future tasks, we plan to integrate the results from the aforementioned annual LULC analysis into a parallel study focusing on the development of an analytic protocol for estimating the relative importance of socio-economic and environmental variables on water quality and their spatial and temporal variation within the Bumbu watershed. The protocol utilizes a 1 arc-second Digital Elevation Model (DEM) to extract the catchment area and the stream drainage pattern within the Bumbu watershed, thereby facilitating estimation of the runoff accumulation of precipitation, natural geologic and geochemical inputs, and human-generated detritus and pollutants in Bumbu waters. In this regard, having LULC data will be valuable for identifying emerging pollution zones—which can be attributed to the newly urbanized areas—and through ANOVA (analysis of variance) between LULC and water quality data, we will be assessing the possible impacts of deforested and built-up areas on deteriorating water quality.
Author Contributions
Conceptualization, W.D.; methodology, W.D., M.M. and E.A.; writing—original draft preparation, W.D.; Formal Analysis, E.A.; writing—review and editing, W.D., M.M., E.A., S.S. and A.P.D.C.; investigation, W.D., M.M. and E.A.; project administration, W.D. All authors have read and agreed to the published version of the manuscript.
Funding
There was no external funding.
Acknowledgments
The authors are grateful to the UN Volunteering program (https://www.onlinevolunteering.org/en/opportunities) as well as to the following people for their contribution with reviewing and editing the draft versions of the manuscript: Lawrence Wuest (UN Volunteer P.O. Box 363 Stanley NB E6B 2K5 Canada), Wan Shafrina Wan Mohd Jaafar (Institute of Climate Change, Universiti Kebangsaan Malaysia), Roshan Paudel (Lecturer, Acme Engineering College, Purbanchal University, Nepal), and Carlos Alberto Silva (University of Florida). We would also like to take this opportunity to thank three anonymous reviewers who were kind enough to help us improve the quality and impact of our manuscript significantly.
Conflicts of Interest
The authors declare no conflict of interest.
References
- Watson, R.T.; Noble, I.R.; Bolin, B.; Ravindranath, N.H.; Verardo, D.J.; Dokken, D.J. Land Use, Land-Use Change and Forestry: A Special Report of the Intergovernmental Panel on Climate Change; Cambridge University Press: Cambridge, UK, 2000. [Google Scholar]
- Turner, B.; Meyer, W.B.; Skole, D.L. Global land-use/land-cover change: Towards an integrated study. Ambio. Stockh. 1994, 23, 91–95. [Google Scholar]
- Turner, B.L. The sustainability principle in global agendas: Implications for understanding land-use/cover change. Geogr. J. 1997, 163, 133–140. [Google Scholar]
- Braimoh, A.K.; Osaki, M. Land-use change and environmental sustainability. Sustain. Sci. 2009, 5, 5–7. [Google Scholar] [CrossRef] [Green Version]
- Sahoo, S.; Sil, I.; Dhar, A.; Debsarkar, A.; Das, P.; Kar, A. Future scenarios of land-use suitability modeling for agricultural sustainability in a river basin. J. Clean. Prod. 2018, 205, 313–328. [Google Scholar] [CrossRef]
- Hansen, A.J.; DeFries, R.S.; Turner, W. Land use change and biodiversity. In Land Change Science; Springer: Dordrecht, The Netherlands, 2012; pp. 277–299. [Google Scholar]
- Jaafar, W.S.W.M.; Maulud, K.N.A.; Kamarulzaman, A.M.M.; Raihan, A.; Sah, S.M.; Ahmad, A.; Saad, S.N.M.; Azmi, A.T.M.; Syukri, N.K.A.J.; Khan, W.R. The Influence of Deforestation on Land Surface Temperature—A Case Study of Perak and Kedah, Malaysia. Forests 2020, 11, 670. [Google Scholar] [CrossRef]
- Nelson, G.C.; Geoghegan, J. Deforestation and land use change: Sparse data environments. Agric. Econ. 2002, 27, 201–216. [Google Scholar] [CrossRef]
- Vadjunec, J.M.; Gomes, C.V.A.; Ludewigs, T. Land-use/land-cover change among rubber tappers in the Chico Mendes Extractive Reserve, Acre, Brazil. J. Land Use Sci. 2009, 4, 249–274. [Google Scholar] [CrossRef]
- Clark, S.; Bolt, K.; Campbell, A. Protected Areas: An Effective Tool to Reduce Emissions from Deforestation and Forest Degradation in Developing Countries; UNEP-WCMC: Cambridge, UK, 2008. [Google Scholar]
- Houghton, R.A. Tropical deforestation as a source of greenhouse gas emissions. Trop. Deforestation Clim. Chang. 2005, 13. [Google Scholar]
- Ningal, T.F.; Hartemink, A.E.; Bregt, A.K. Land use change and population growth in the Morobe Province of Papua New Guinea between 1975 and 2000. J. Environ. Manag. 2008, 87, 117–124. [Google Scholar] [CrossRef]
- Shearman, P.L.; Ash, J.; Mackey, B.; Bryan, J.E.; Lokes, B. Forest conversion and degradation in Papua New Guinea 1972–2002. Biotropica 2009, 41, 379–390. [Google Scholar] [CrossRef] [Green Version]
- Filer, C.; Keenan, R.J.; Allen, B.J.; McAlpine, J.R. Deforestation and forest degradation in Papua New Guinea. Ann. For. Sci. 2009, 66, 813. [Google Scholar] [CrossRef] [Green Version]
- Shearman, P.L.; Bryan, J.; Ash, J.; Mackey, B.; Lokes, B. Deforestation and degradation in Papua New Guinea: A response to Filer and colleagues, 2009. Ann. For. Sci. 2010, 67, 300. [Google Scholar] [CrossRef]
- Sasaki, N. Carbon emissions due to land-use change and logging in Cambodia: A modeling approach. J. For. Res. 2006, 11, 397–403. [Google Scholar] [CrossRef]
- Tang, L.; Shao, G. Drone remote sensing for forestry research and practices. J. For. Res. 2015, 26, 791–797. [Google Scholar] [CrossRef]
- Rex, F.E.; Silva, C.A.; Corte, A.P.D.; Klauberg, C.; Mohan, M.; Cardil, A.; Da Silva, V.S.; De Almeida, D.R.A.; Garcia, M.; Broadbent, E.N.; et al. Comparison of Statistical Modelling Approaches for Estimating Tropical Forest Aboveground Biomass Stock and Reporting Their Changes in Low-Intensity Logging Areas Using Multi-Temporal LiDAR Data. Remote. Sens. 2020, 12, 1498. [Google Scholar] [CrossRef]
- Hansen, M.C.; Potapov, P.V.; Moore, R.; Hancher, M.; Turubanova, S.A.; Tyukavina, A.; Kommareddy, A. High-resolution global maps of 21st-century forest cover change. Science 2013, 342, 850–853. [Google Scholar] [CrossRef] [Green Version]
- Hansen, A.J.; Neilson, R.P.; Dale, V.H.; Flather, C.H.; Iverson, L.R.; Currie, D.J.; Shafer, S.; Cook, R.; Bartlein, P.J. Global Change in Forests: Responses of Species, Communities, and Biomes. BioScience 2001, 51, 765–779. [Google Scholar] [CrossRef]
- Song, X.-P.; Hansen, M.; Stehman, S.V.; Potapov, P.V.; Tyukavina, A.; Vermote, E.F.; Townshend, J.R. Global land change from 1982 to 2016. Nature 2018, 560, 639–643. [Google Scholar] [CrossRef]
- Pratihast, A.K.; Devries, B.; Avitabile, V.; De Bruin, S.; Kooistra, L.; Tekle, M.; Herold, M. Combining Satellite Data and Community-Based Observations for Forest Monitoring. Forests 2014, 5, 2464–2489. [Google Scholar] [CrossRef] [Green Version]
- Popkin, G. Satellite alerts track deforestation in real time. Nature 2016, 530, 392–393. [Google Scholar] [CrossRef] [Green Version]
- Williams, D.L.; Goward, S.; Arvidson, T. Landsat. Photogramm. Eng. Remote. Sens. 2006, 72, 1171–1178. [Google Scholar] [CrossRef]
- Banskota, A.; Kayastha, N.; Falkowski, M.J.; Wulder, M.A.; Froese, R.E.; White, J.C. Forest Monitoring Using Landsat Time Series Data: A Review. Can. J. Remote Sens. 2014, 40, 362–384. [Google Scholar] [CrossRef]
- Yan, H.; Liu, J.; Huang, H.Q.; Tao, B.; Cao, M. Assessing the consequence of land use change on agricultural productivity in China. Glob. Planet. Chang. 2009, 67, 13–19. [Google Scholar] [CrossRef]
- Tomar, V.; Kumar, P.; Rani, M.; Gupta, G.; Singh, J. A satellite-based biodiversity dynamics capability in tropical forest. Electron. J. Geotech. Eng. 2013, 18, 1171–1180. [Google Scholar]
- Pettorelli, N.; Safi, K.; Turner, W. Satellite remote sensing, biodiversity research and conservation of the future. Philos. Trans. R. Soc. B Boil. Sci. 2014, 369, 20130190. [Google Scholar] [CrossRef] [PubMed]
- Kalnay, E.; Cai, M. Impact of urbanization and land-use change on climate. Nature 2003, 423, 528–531. [Google Scholar] [CrossRef]
- Sekac, T.; Jana, S.K. Change detection of Busu river course in Papua New Guinea-impact on local settlements using remote sensing and GIS technology. Int. J. Sci. Eng. Res. 2013, 5, 891–899. [Google Scholar]
- Irons, J.R.; Dwyer, J.; Barsi, J.A. The next Landsat satellite: The Landsat Data Continuity Mission. Remote Sens. Environ. 2012, 122, 11–21. [Google Scholar] [CrossRef] [Green Version]
- Jana, S.K.; Sekac, T.; Pal, D.K. Study of Changing River Courses and Estimation of Reduction of Available Land Reserved for Development in Lae City of Papua New Guinea using GIS and Remote Sensing Technology; International Journal of Advance Research, IJOAR: Singapore, 2014; p. 5. [Google Scholar]
- Crook, K.A. Quaternary uplift rates at a plate boundary, Lae urban area, Papua New Guinea. Tectonophysics 1989, 163, 105–118. [Google Scholar] [CrossRef]
- Young, N.E.; Anderson, R.; Chignell, S.M.; Vorster, A.G.; Lawrence, R.; Evangelista, P.H. A survival guide to Landsat preprocessing. Ecology 2017, 98, 920–932. [Google Scholar] [CrossRef] [Green Version]
- U.S. Geological Survey: Landsat 7 (L7) Data Users Handbook LSDS-1927; version 2.0; U.S. Geological Survey: Reston, VA, USA, 2019.
- U.S. Geological Survey: Landsat 8 (L8) Data Users Handbook LSDS-1574; version 5.0; U.S. Geological Survey: Reston, VA, USA, 2019.
- Zha, Y.; Gao, J.; Ni, S. Use of normalized difference built-up index in automatically mapping urban areas from TM imagery. Int. J. Remote Sens. 2003, 24, 583–594. [Google Scholar] [CrossRef]
- Hamad, R. A remote sensing and GIS-based analysis of urban sprawl in Soran District, Iraqi Kurdistan. SN Appl. Sci. 2019, 2, 24. [Google Scholar] [CrossRef] [Green Version]
- Hamad, R.; Kolo, K.; Balzter, H. Post-War Land Cover Changes and Fragmentation in Halgurd Sakran National Park (HSNP), Kurdistan Region of Iraq. Land 2018, 7, 38. [Google Scholar] [CrossRef] [Green Version]
- ESRI. ArcMap 10.2; ESRI: Redlands, CA, USA, 2014. [Google Scholar]
- Hsiao, L.-H.; Cheng, K.-S. Assessing Uncertainty in LULC Classification Accuracy by Using Bootstrap Resampling. Remote Sens. 2016, 8, 705. [Google Scholar] [CrossRef] [Green Version]
- Samanta, S.; Pal, D.K. Change Detection of Land Use and Land Cover over a Period of 20 Years in Papua New Guinea. Nat. Sci. 2016, 8, 138–151. [Google Scholar] [CrossRef] [Green Version]
- Wang, Q.; Blackburn, G.A.; Onojeghuo, A.O.; Dash, J.; Zhou, L.; Zhang, Y.; Atkinson, P. Fusion of Landsat 8 OLI and Sentinel-2 MSI Data. IEEE Trans. Geosci. Remote Sens. 2017, 55, 3885–3899. [Google Scholar] [CrossRef] [Green Version]
- Clerici, N.; Calderón, C.A.V.; Posada, J.M. Fusion of Sentinel-1A and Sentinel-2A data for land cover mapping: A case study in the lower Magdalena region, Colombia. J. Maps 2017, 13, 718–726. [Google Scholar] [CrossRef] [Green Version]
- Reiche, J.; Hamunyela, E.; Verbesselt, J.; Hoekman, D.; Herold, M. Improving near-real time deforestation monitoring in tropical dry forests by combining dense Sentinel-1 time series with Landsat and ALOS-2 PALSAR-2. Remote Sens. Environ. 2018, 204, 147–161. [Google Scholar] [CrossRef]
- Wang, T.; Kazak, J.K.; Han, Q.; De Vries, B. A framework for path-dependent industrial land transition analysis using vector data. Eur. Plan. Stud. 2019, 27, 1391–1412. [Google Scholar] [CrossRef]
- Mohan, M.; Silva, C.A.; Klauberg, C.; Jat, P.; Catts, G.; Cardil, A.; Hudak, A.T.; Dia, M. Individual Tree Detection from Unmanned Aerial Vehicle (UAV) Derived Canopy Height Model in an Open Canopy Mixed Conifer Forest. Forests 2017, 8, 340. [Google Scholar] [CrossRef] [Green Version]
- Zhang, J.; Hu, J.; Lian, J.; Fan, Z.; Ouyang, X.; Ye, W. Seeing the forest from drones: Testing the potential of lightweight drones as a tool for long-term forest monitoring. Boil. Conserv. 2016, 198, 60–69. [Google Scholar] [CrossRef]
- Noor, N.M.; Abdullah, A.A.A.; Abdullah, A.; Ibrahim, I.; Sabeek, S. 3D city modeling using MULTIROTOR drone for city heritage conservation. Plan. Malays. J. 2019, 17. [Google Scholar] [CrossRef] [Green Version]
- Cureton, P. Drone Futures: UAS in Landscape and Urban Design; Routledge: Abingdon, Oxfordshire, UK, 2020. [Google Scholar]
- Silva, C.A.; Valbuena, R.; Pinagé, E.; Mohan, M.; Almeida, D.R.A.; Broadbent, E.N.; Jaafar, W.S.W.M.; Papa, D.D.A.; Cardil, A.; Klauberg, C.; et al. F orest G ap R: An r Package for forest gap analysis from canopy height models. Methods Ecol. Evol. 2019, 10, 1347–1356. [Google Scholar] [CrossRef] [Green Version]
- Jaafar, W.S.W.M.; Woodhouse, I.H.; Silva, C.A.; Omar, H.; Maulud, K.N.A.; Hudak, A.T.; Klauberg, C.; Cardil, A.; Mohan, M. Improving Individual Tree Crown Delineation and Attributes Estimation of Tropical Forests Using Airborne LiDAR Data. Forests 2018, 9, 759. [Google Scholar] [CrossRef] [Green Version]
- Srinivasan, S.; Popescu, S.; Eriksson, M.; Sheridan, R.D.; Ku, N.-W. Multi-temporal terrestrial laser scanning for modeling tree biomass change. For. Ecol. Manag. 2014, 318, 304–317. [Google Scholar] [CrossRef]
- Srinivasan, S.; Popescu, S.; Eriksson, M.; Sheridan, R.D.; Ku, N.-W. Terrestrial Laser Scanning as an Effective Tool to Retrieve Tree Level Height, Crown Width, and Stem Diameter. Remote Sens. 2015, 7, 1877–1896. [Google Scholar] [CrossRef] [Green Version]
- Corte, A.P.D.; Rex, F.E.; De Almeida, D.R.A.; Sanquetta, C.R.; Silva, C.A.; Moura, M.M.; Wilkinson, B.; Zambrano, A.M.A.; Neto, E.M.D.C.; Veras, H.F.P.; et al. Measuring Individual Tree Diameter and Height Using GatorEye High-Density UAV-Lidar in an Integrated Crop-Livestock-Forest System. Remote Sens. 2020, 12, 863. [Google Scholar] [CrossRef] [Green Version]
- De Almeida, D.R.A.; Broadbent, E.; Zambrano, A.M.A.; Wilkinson, B.; Ferreira, M.; Chazdon, R.L.; Meli, P.; Gorgens, E.; Silva, C.A.; Stark, S.; et al. Monitoring the structure of forest restoration plantations with a drone-lidar system. Int. J. Appl. Earth Obs. Geoinf. 2019, 79, 192–198. [Google Scholar] [CrossRef]
- Brown, C. Asia-Pacific Forestry Sector Outlook Study; Working Papers Series; FAO: Rome, Italy, 1997. [Google Scholar]
- Ministry of Foreign Affairs of Japan. Protecting the Forests of Papua New Guinea. 2016. Available online: https://www.mofa.go.jp/files/000286363.pdf (accessed on 13 August 2020).
Figure 1.
The study area: (a) Papua New Guinea, (b) Morobe Province, (c) Bumbu river basin.
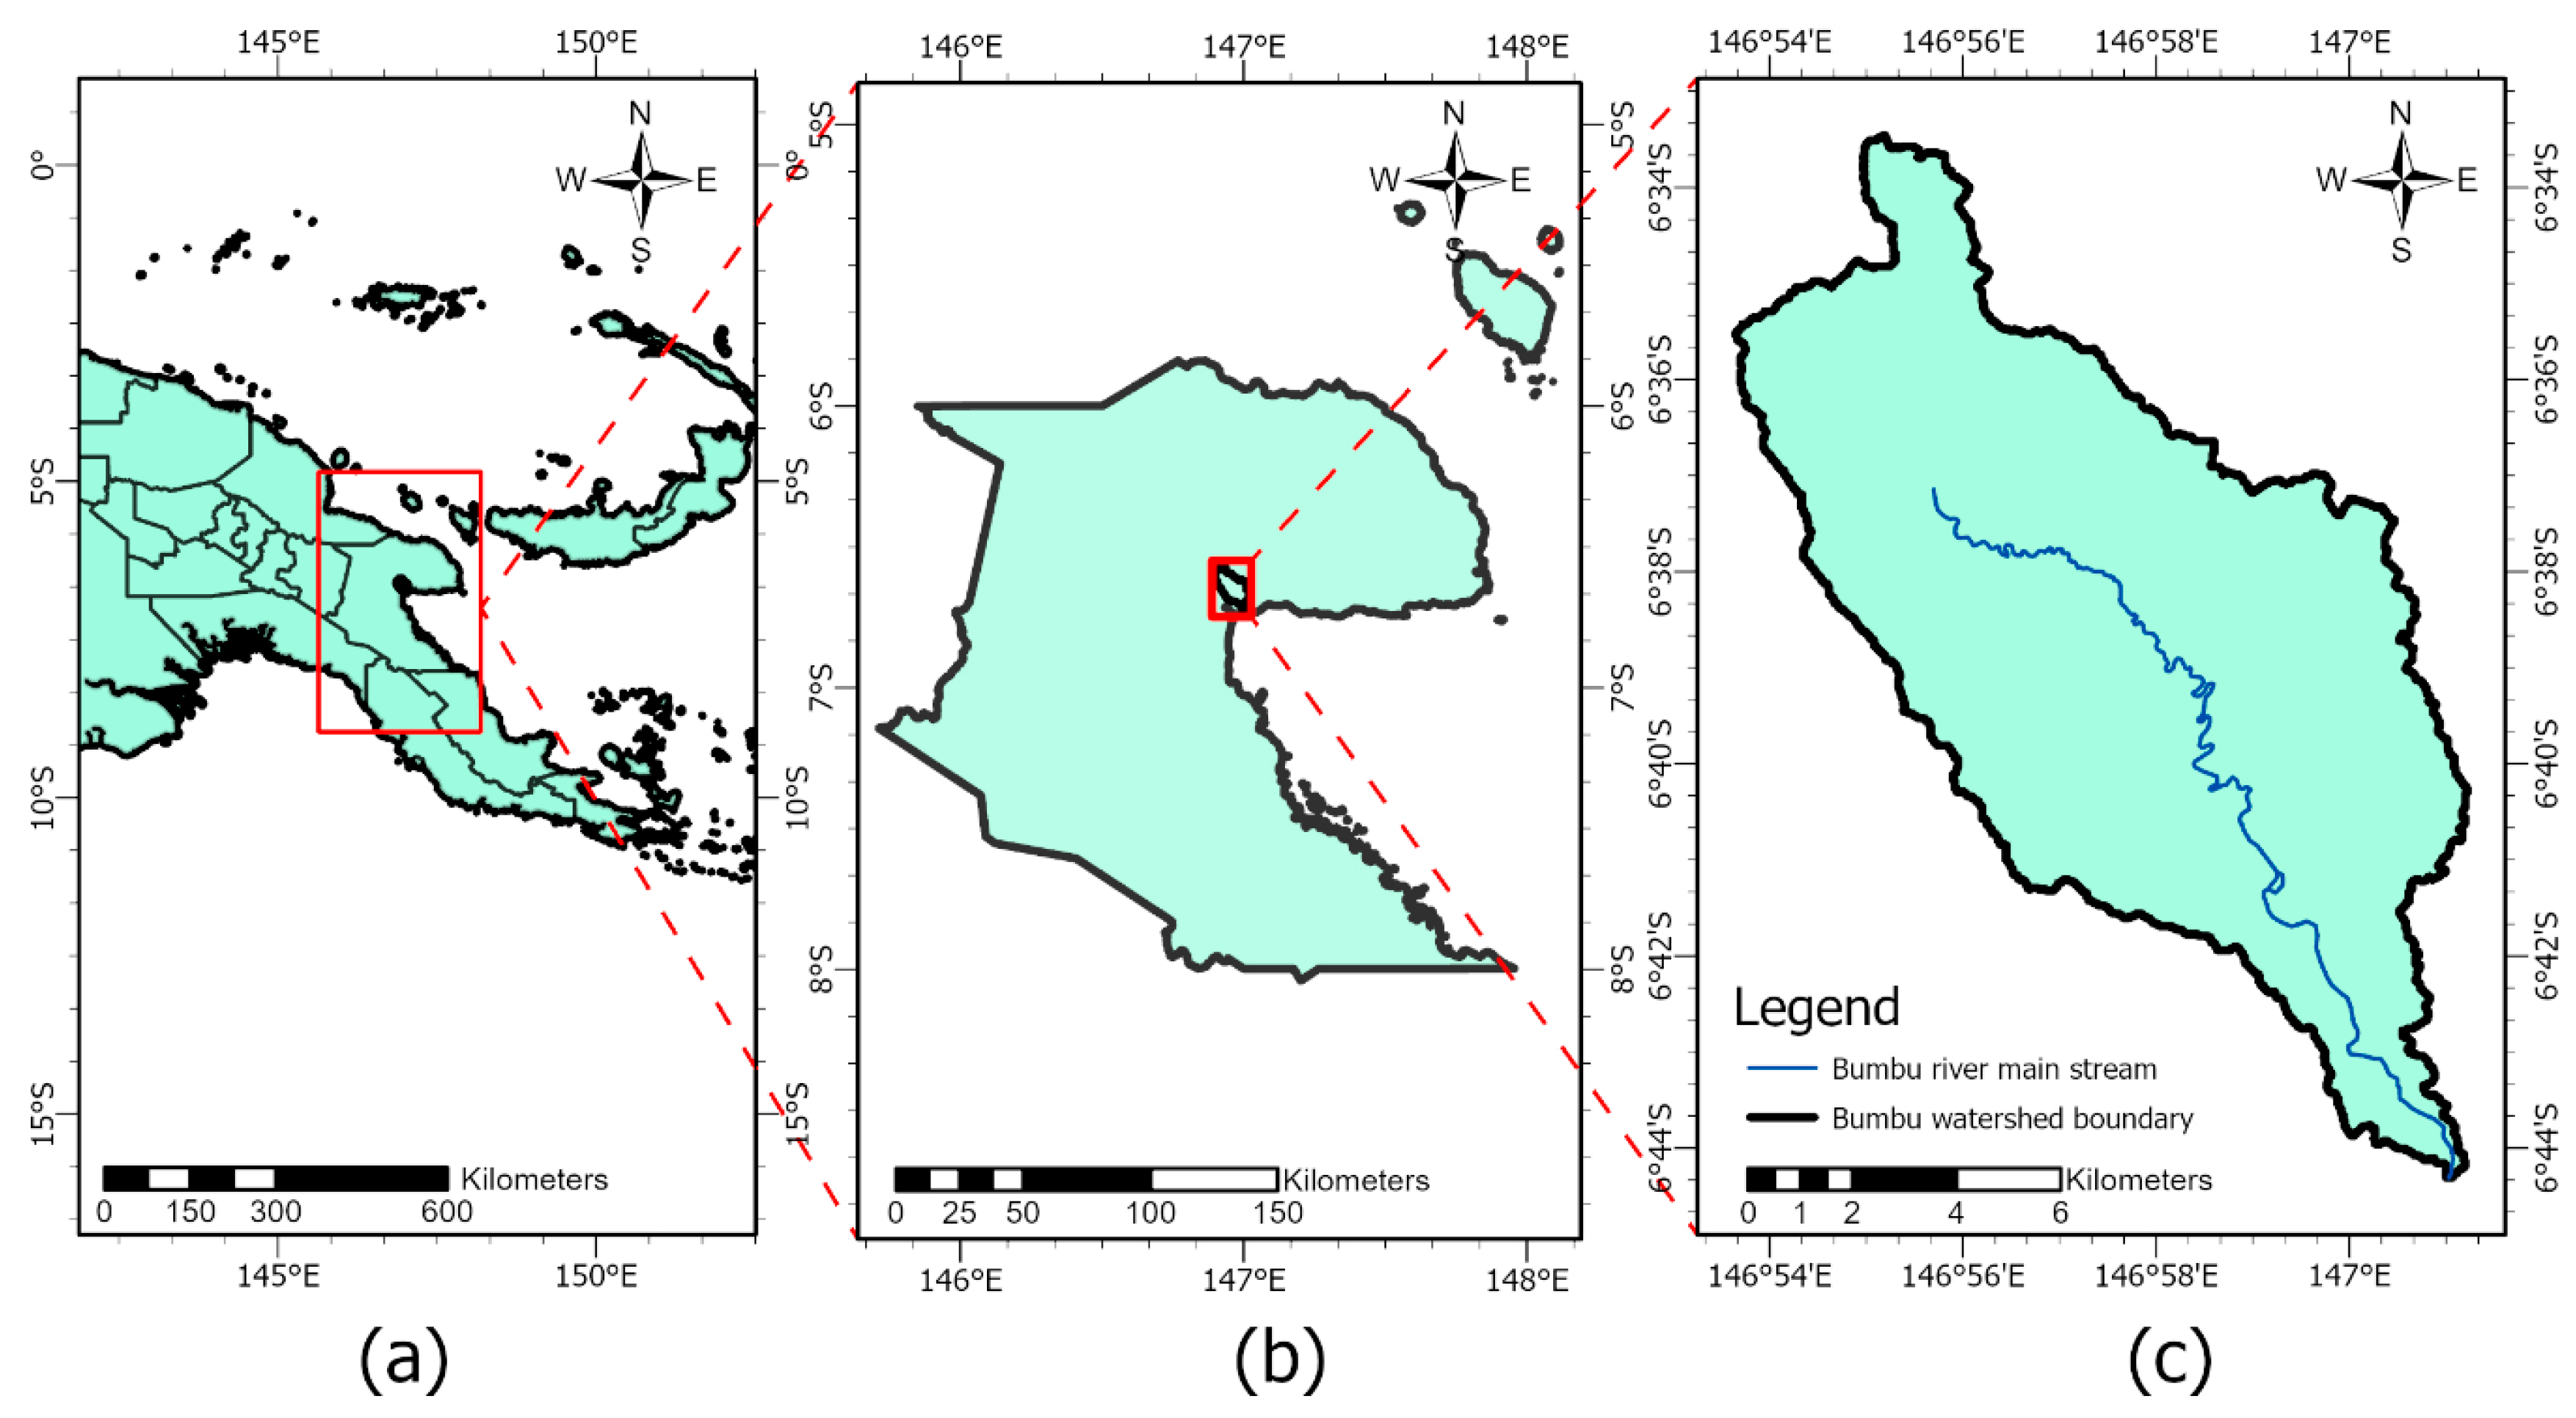
Figure 2.
Workflow diagram; GIS: Geographic Information System; NDVI: Normalized Difference Vegetation Index; NDBI: Normal Difference Built-up Index; NDWI: Normal Difference Water Index
Figure 2.
Workflow diagram; GIS: Geographic Information System; NDVI: Normalized Difference Vegetation Index; NDBI: Normal Difference Built-up Index; NDWI: Normal Difference Water Index

Figure 3.
LULC distribution of Bumbu river basin for the years (a) 1987, (b) 2002, (c) 2010, and (d) 2020.
Figure 3.
LULC distribution of Bumbu river basin for the years (a) 1987, (b) 2002, (c) 2010, and (d) 2020.

Figure 4.
The spatial extent of the urban area in Bumbu basin in the years (a) 1987, (b) 2002, (c) 2010, and (d) 2020.
Figure 4.
The spatial extent of the urban area in Bumbu basin in the years (a) 1987, (b) 2002, (c) 2010, and (d) 2020.

Figure 5.
(a) Bumbu river basin, (b) The spatial change of the urban extent of Bumbu basin in the years 1987, 2002, 2010, and 2020.
Figure 5.
(a) Bumbu river basin, (b) The spatial change of the urban extent of Bumbu basin in the years 1987, 2002, 2010, and 2020.

Figure 6.
Urban area expansion in all zones between 1987 and 2020.

Figure 7.
The spatial change of forest extent in Bumbu basin in the years (a) 1987, (b) 2002, (c) 2010, and (d) 2020.
Figure 7.
The spatial change of forest extent in Bumbu basin in the years (a) 1987, (b) 2002, (c) 2010, and (d) 2020.
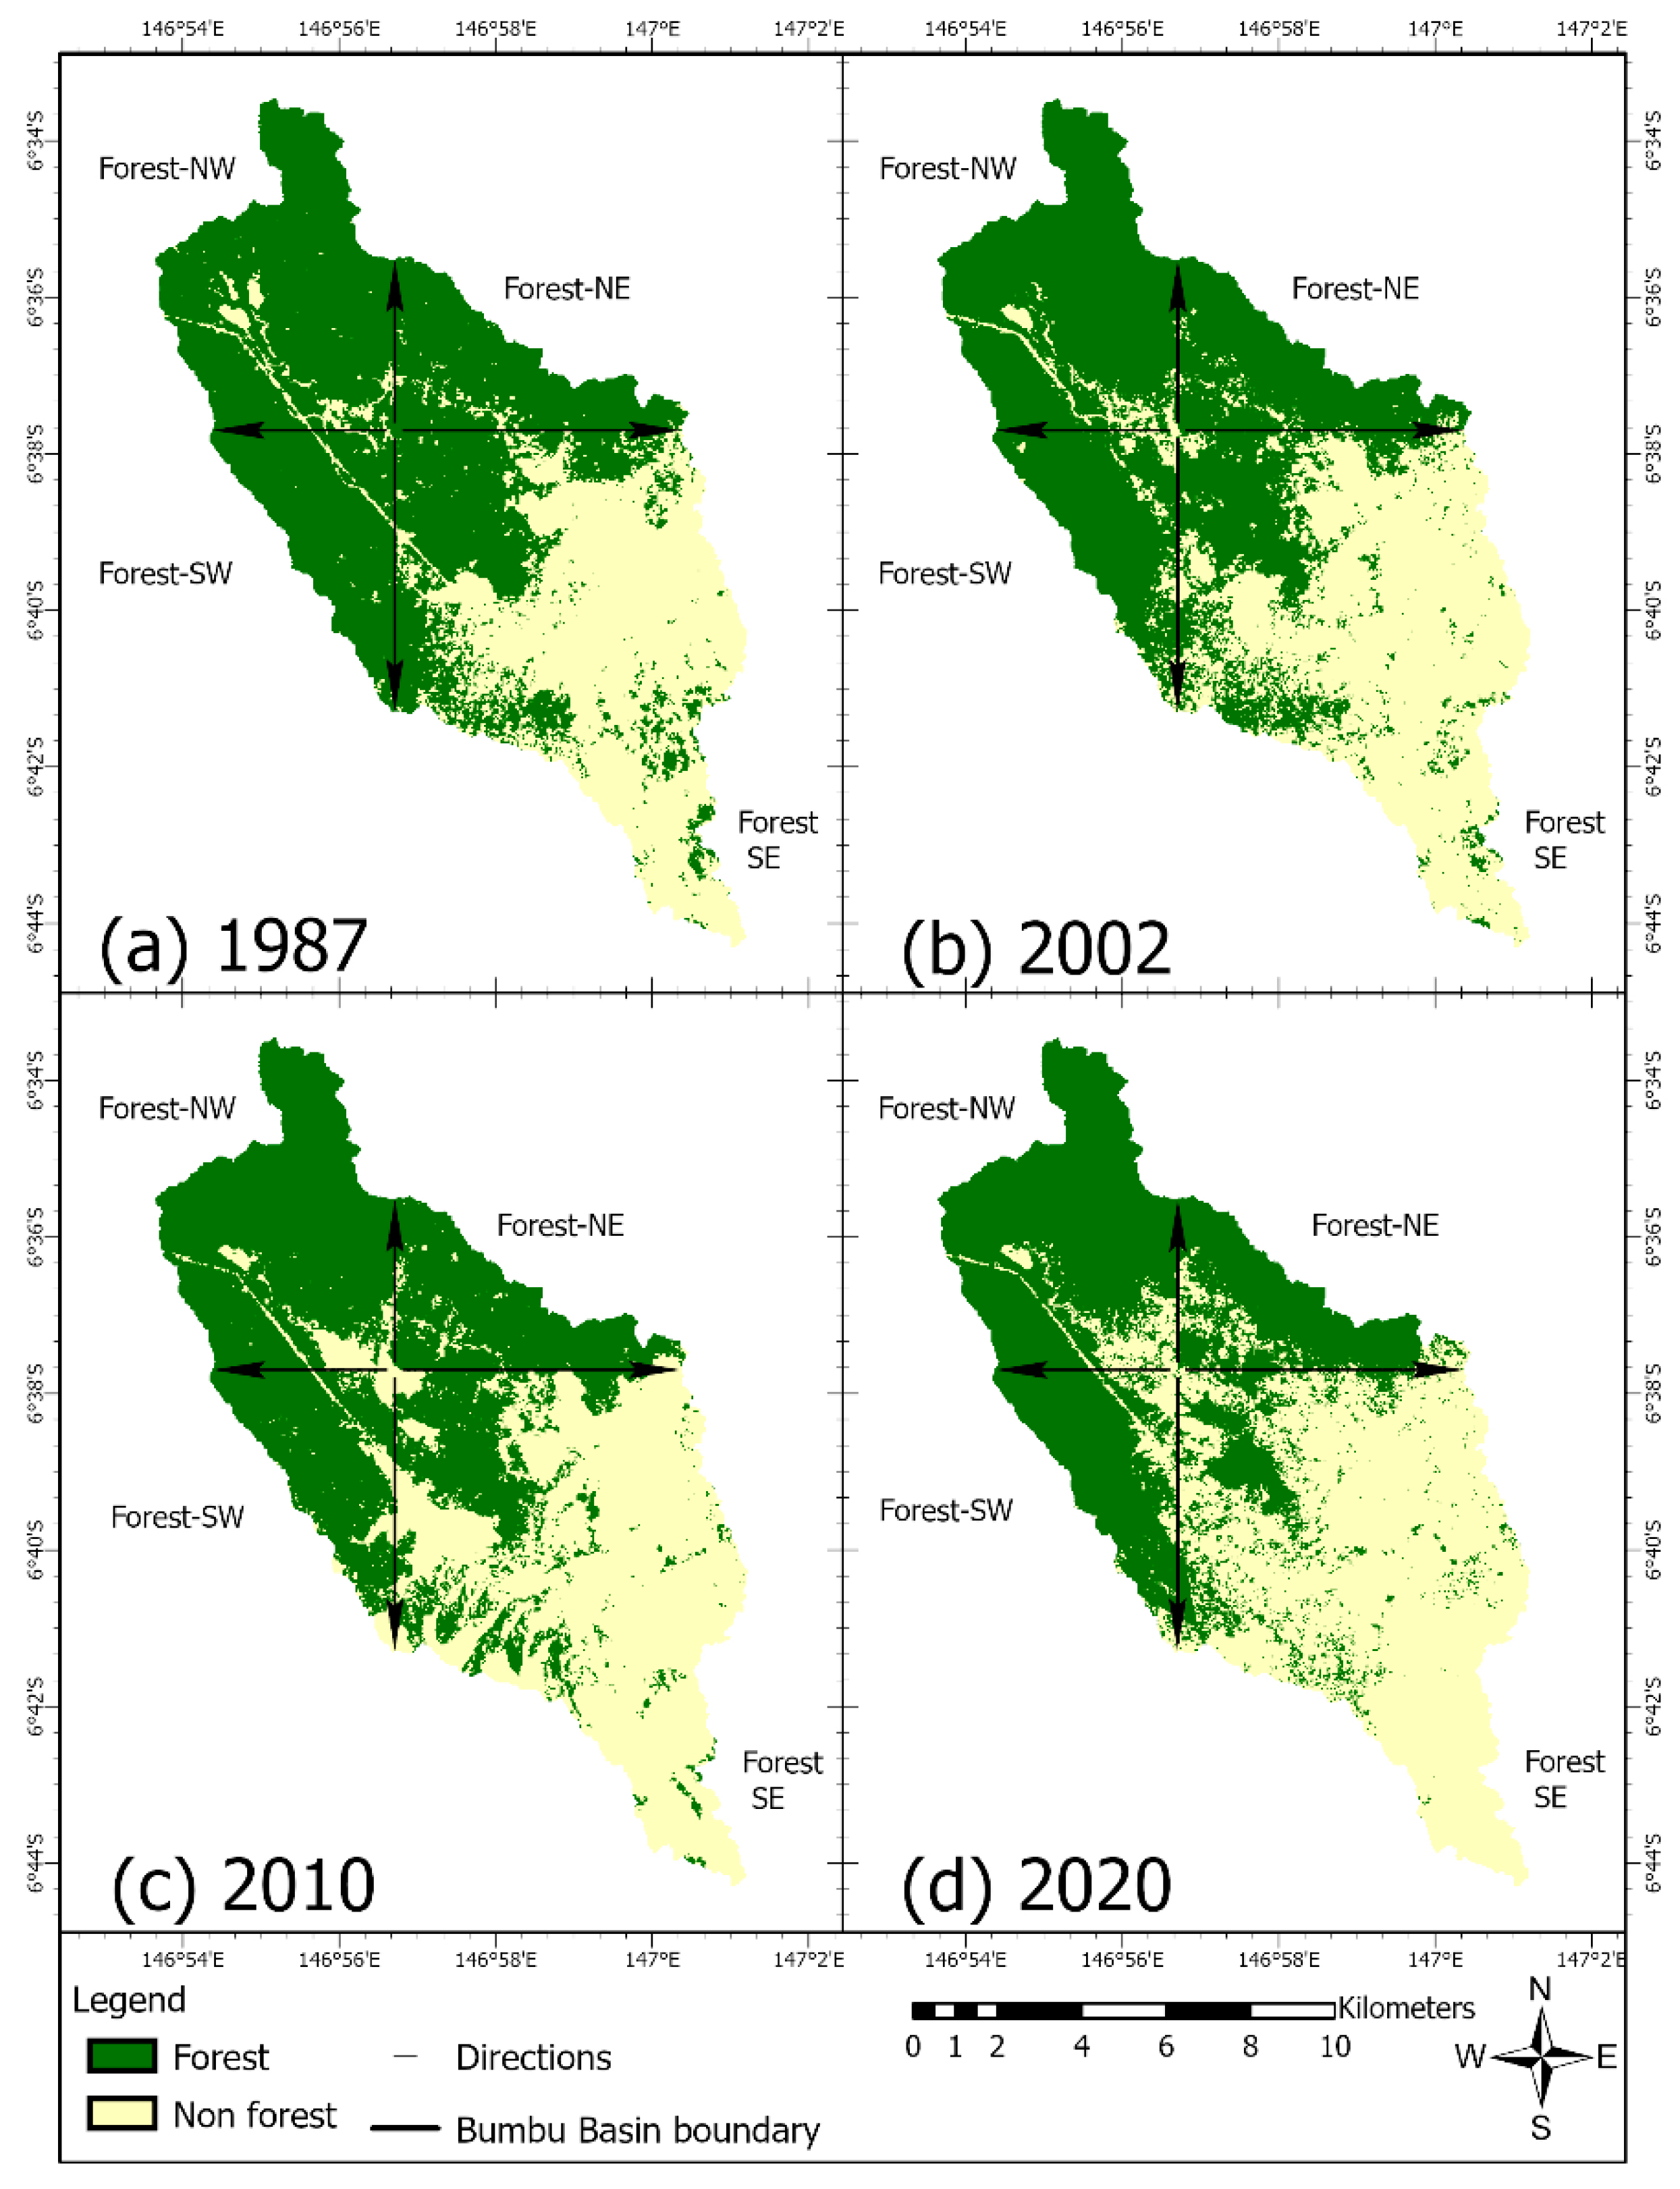
Figure 8.
Extent of forest loss in all four zones between 1987, 2002, 2010, and 2020.

Figure 9.
The forest gain–loss rate in four zones in the studied periods.

Figure 10.
Overall forest gain–loss between 1987 and 2020.


Table 1.
Land-use/Land cover classes.
| Class | Description |
|---|---|
| 1-Water | Water bodies and wet river banks |
| 2-Urban/Built-up area | Residential, industrial, buildings occupied spaces, and transportation |
| 3-Other | Barren land, logging, slight vegetation, and agricultural land |
| 4-Forest | Forest and dense forest |
Table 2.
Error matrices of the LULC with commission and omission errors, overall accuracy, producer’s accuracy, user’s accuracy, and kappa coefficient (bold values) for the years 1987, 2002, 2010, and 2020.
Table 2.
Error matrices of the LULC with commission and omission errors, overall accuracy, producer’s accuracy, user’s accuracy, and kappa coefficient (bold values) for the years 1987, 2002, 2010, and 2020.
| Class | Water | Built-Up | Other | Forest | Total | User’s Accuracy (%) | Commission Error (%) | |
|---|---|---|---|---|---|---|---|---|
| Error Matrix 1987 | 1-Water | 43 | 0 | 0 | 0 | 43 | 100 | 0 |
| 2-Built-up | 0 | 43 | 1 | 3 | 47 | 91.5 | 8.5 | |
| 3-Other | 7 | 7 | 48 | 0 | 62 | 77.4 | 22.6 | |
| 4-Forest | 0 | 0 | 1 | 47 | 48 | 97.9 | 2.1 | |
| Total | 50 | 50 | 50 | 50 | 200 | |||
| Omission Error (%) | 14 | 14 | 4 | 6 | ||||
| Producer’s accuracy (%) | 86 | 86 | 96 | 94 | ||||
| Overall accuracy | 90.5% | |||||||
| Kappa | 0.87 | |||||||
| Error Matrix 2002 | 1-Water | 38 | 1 | 0 | 0 | 39 | 97.4 | 2.6 |
| 2-Built-up | 1 | 41 | 1 | 0 | 43 | 95.3 | 4.6 | |
| 3-Other | 10 | 8 | 48 | 3 | 69 | 69.6 | 30.4 | |
| 4-Forest | 1 | 0 | 1 | 47 | 49 | 95.9 | 4.1 | |
| Total | 50 | 50 | 50 | 50 | 200 | |||
| Omission Error (%) | 24 | 18 | 4 | 6 | ||||
| Producer’s accuracy (%) | 76 | 82 | 96 | 94 | ||||
| Overall accuracy | 87% | |||||||
| Kappa | 0.83 | |||||||
| Error Matrix 2010 | 1-Water | 44 | 0 | 0 | 0 | 44 | 100 | 0 |
| 2-Built-up | 2 | 46 | 0 | 0 | 48 | 95.8 | 4.2 | |
| 3-Other | 4 | 3 | 48 | 2 | 57 | 84.2 | 15.8 | |
| 4-Forest | 0 | 1 | 2 | 48 | 51 | 94.1 | 5.9 | |
| Total | 50 | 50 | 50 | 50 | 200 | |||
| Omission Error (%) | 12 | 8 | 4 | 4 | ||||
| Producer’s accuracy (%) | 88 | 92 | 96 | 96 | ||||
| Overall accuracy | 93% | |||||||
| Kappa | 0.91 | |||||||
| Error Matrix 2020 | 1-Water | 47 | 0 | 0 | 0 | 47 | 100 | 0 |
| 2-Built-up | 1 | 44 | 1 | 0 | 46 | 95.6 | 4.3 | |
| 3-Other | 1 | 4 | 42 | 2 | 49 | 85.7 | 14.3 | |
| 4-Forest | 1 | 2 | 7 | 48 | 58 | 82.8 | 17.2 | |
| Total | 50 | 50 | 50 | 50 | 200 | |||
| Omission Error (%) | 6 | 12 | 16 | 4 | ||||
| Producer’s accuracy (%) | 94 | 88 | 84 | 96 | ||||
| Overall accuracy | 90.5% | |||||||
| Kappa | 0.87 | |||||||
Table 3.
Results of land-use/land cover classification statistics.
| Class Name | 1987 | 2002 | 2010 | 2020 | ||||
|---|---|---|---|---|---|---|---|---|
| km2 | % | km2 | % | km2 | % | km2 | % | |
| Water | 1.35 | 1.10 | 1.18 | 0.96 | 1.16 | 0.95 | 0.91 | 0.74 |
| Built-up | 14.39 | 11.76 | 16.71 | 13.65 | 19.23 | 15.71 | 23.06 | 18.84 |
| Other | 30.37 | 24.81 | 34.42 | 28.12 | 35.03 | 28.62 | 39 | 31.86 |
| Forest | 76.29 | 62.33 | 70.09 | 57.26 | 66.98 | 54.72 | 59.43 | 48.55 |
| Total | 122.4 | 100 | 122.4 | 100 | 122.4 | 100 | 122.4 | 100 |
Table 4.
Urban area changes and the change rate in all zones.
| Zone/Period | 1987–2002 | 2002–2010 | 2010–2020 | Total (1987–2020) | ||||
|---|---|---|---|---|---|---|---|---|
| Area (km2) | Rate (km2 year−1) | Area (km2) | Rate (km2 year−1) | Area (km2) | Rate (km2 year−1) | Area (km2) | Rate (km2 year−1) | |
| Urban NE | 1.36 | 0.091 | 0.97 | 0.121 | 0.73 | 0.073 | 3.06 | 0.093 |
| Urban NW | −0.02 | −0.001 | 0.3 | 0.038 | 1.44 | 0.144 | 1.72 | 0.052 |
| Urban SW | 0.19 | 0.013 | 0.22 | 0.028 | 0.02 | 0.002 | 0.43 | 0.013 |
| Urban SE | 0.79 | 0.053 | 1.03 | 0.129 | 1.64 | 0.164 | 3.46 | 0.105 |
| Total Area | 2.32 | 2.52 | 3.83 | 8.67 | ||||
Table 5.
Observed forest area gain and loss and the gain–loss rate in four forest zones.
| Zone/Period | 1987–2002 | 2002–2010 | 2010–2020 | Total (1987–2020) | ||||
|---|---|---|---|---|---|---|---|---|
| Area (km2) | Rate (km2 year−1) | Area (km2) | Rate (km2 year−1) | Area (km2) | Rate (km2 year−1) | Area (km2) | Rate (km2 year−1) | |
| Forest NE | −0.12 | −0.008 | −0.26 | −0.033 | −1.31 | −0.131 | −1.69 | −0.051 |
| Forest NW | 0.04 | 0.003 | −0.36 | −0.045 | −0.72 | −0.072 | −1.04 | −0.032 |
| Forest SW | −1.18 | −0.079 | −0.52 | −0.033 | −0.35 | −0.035 | −2.05 | −0.062 |
| Forest SE | −4.94 | −0.329 | −1.97 | −0.246 | −5.17 | −0.517 | −12.08 | −0.366 |
| Total area | −6.2 | −3.11 | −7.55 | −16.86 | ||||
Table 6.
Overall forest loss/gain in km2 from 1987 to 2020.
| Period | 1987–2020 Area Change (km2) |
|---|---|
| Consistent forest area | 56.29 |
| Consistent non-forest area | 42.98 |
| Forest gain | 3.15 |
| Forest loss | 20.01 |
© 2020 by the authors. Licensee MDPI, Basel, Switzerland. This article is an open access article distributed under the terms and conditions of the Creative Commons Attribution (CC BY) license (http://creativecommons.org/licenses/by/4.0/).
Share and Cite
MDPI and ACS Style
Doaemo, W.; Mohan, M.; Adrah, E.; Srinivasan, S.; Dalla Corte, A.P. Exploring Forest Change Spatial Patterns in Papua New Guinea: A Pilot Study in the Bumbu River Basin. Land 2020, 9, 282. https://doi.org/10.3390/land9090282
AMA Style
Doaemo W, Mohan M, Adrah E, Srinivasan S, Dalla Corte AP. Exploring Forest Change Spatial Patterns in Papua New Guinea: A Pilot Study in the Bumbu River Basin. Land. 2020; 9(9):282. https://doi.org/10.3390/land9090282
Chicago/Turabian StyleDoaemo, Willie, Midhun Mohan, Esmaeel Adrah, Shruthi Srinivasan, and Ana Paula Dalla Corte. 2020. "Exploring Forest Change Spatial Patterns in Papua New Guinea: A Pilot Study in the Bumbu River Basin" Land 9, no. 9: 282. https://doi.org/10.3390/land9090282
Note that from the first issue of 2016, this journal uses article numbers instead of page numbers. See further details here.