Assessing Nature-Based Recreation to Support Urban Green Infrastructure Planning in Trento (Italy)


1
Department of Civil, Environmental and Mechanical Engineering, University of Trento, 38123 Trento, Italy
2
European Commission—Joint Research Centre, 21027 Ispra, Italy
*
Author to whom correspondence should be addressed.
Land 2018, 7(4), 112; https://doi.org/10.3390/land7040112
Submission received: 31 July 2018
/
Revised: 10 September 2018
/
Accepted: 21 September 2018
/
Published: 27 September 2018
(This article belongs to the Special Issue Towards the Sustainable Management of Ecosystem Services in Social-Ecological Systems)
Abstract
:Nature-based recreation is among the most relevant ecosystem services supplied by urban green infrastructure, affecting citizens’ physical and mental wellbeing. Providing adequate green spaces for nature-based recreation is among the main goals of urban planning, but commonly-used indicators offer a partial view on the issue. Innovative methods and approaches, such as the ESTIMAP-recreation model, appear as promising ways to increase the quality of information available for decision-makers by considering both the range of green spaces that provide the service and the locally-specific demand. The article presents an application of the ESTIMAP-recreation model to the city of Trento (Italy), aimed at testing its adaptation to the local context and the potential improvements brought to urban planning. The comparison of the results with traditional indicators based on the availability and accessibility to urban parks shows significant differences in terms of priority of intervention across the city, with implications on planning decisions. The application demonstrates that innovative methods can enhance the understanding of nature-based recreation in cities beyond the focus on urban parks, revealing a wide portfolio of actions that planners can put in place to promote nature-based recreation through a multifunctional green infrastructure.
1. Introduction
Nature-based recreation, i.e., recreational activities involving physical and experiential interactions with natural environment [1], is among the most relevant ecosystem services provided by green infrastructure, especially in urban contexts [2,3]. It includes multiple open-air activities of different physical intensity, from walking the dog or strolling in a park, to hiking, running, and cycling in natural environments. The benefits of nature-based recreation on human health and wellbeing are manifold. Nature experience has a restorative effect, improves mental wellbeing, and reduces the risk of depression and mental illnesses [4,5,6,7]. Scientific studies also provide evidence of increased cognitive abilities after enjoying nature [8,9], and positive effects on the cognitive development of children [10]. Opportunities for nature-based recreation encourage physical activity and active lifestyles, thus potentially reducing health risk factors such as obesity and cardiovascular disease [11,12]. Furthermore, nature-based recreational activities can facilitate social interactions, foster empowerment, and promote social cohesion and support [13,14,15].
In cities, urban parks are purposely created to offer day-to-day nature-based recreational opportunities to the population [16]. Nonetheless, beyond urban parks, other typologies of green infrastructure in and around the city, including urban and peri-urban forests [17], tree-lined streets [18], peri-urban agriculture [19], and even brownfields [20] and abandoned areas [21], support the variety of activities and experiences that are collectively referred to as nature-based recreation [22]. On the other hand, the demand for nature-based recreation is also various, being affected by cultural and psychological factors at both societal and individual levels, which determine what types of activities are preferred and, ultimately, what makes a green space a suitable place for nature-based recreation [23,24]. Accounting for the whole range of green spaces that support nature-based recreation and for the variety of demands expressed by the population is therefore essential to inform green infrastructure planning and management.
Providing adequate publicly-accessible green spaces for day-to-day recreational activities is, traditionally, among the main goals of urban plans [25,26,27]. In this context, two types of indicators are commonly adopted to steer decisions: (i) per capita green area; and (ii) maximum distance—or accessibility—to a green space of defined dimension [28]. Per capita green area is often adopted to express quantitative targets for urban green infrastructure. Examples include local policies such as in Berlin (6 m2) and Leipzig (10 m2), as well as national laws such as in Romania (26 m2) [29,30]. This simple indicator allows an easy benchmarking and comparison between cities (e.g., [31]), but overlooks the spatial distribution of green spaces, which may determine mismatches between supply and demand [32] and inequality amongst different neighborhoods and social groups [33]. Accessibility indicators and targets related to a minimum green area to be provided to each citizen at a certain distance from home overcome these shortcomings and promote a spatially-explicit assessment focused on the individual perspective [34]. An overview of green space standards and guidelines based on accessibility metrics promoted by national and international institutions has been recently compiled by Stessens and colleagues [35].
Despite their usability, the discussed indicators show clear limitations when adopted to inform urban planning about nature-based recreation. First, they usually focus on urban parks or—at best—on few types of public green spaces, failing to capture the specific contribution of different green space typologies in supporting different nature-based recreational activities. Second, they provide a quantitative assessment limited to the ecological dimension, where factors related to people’s perceptions and desires, hence to the demand for nature-based recreation that pertains to the socio-economic dimension, are overlooked. To overcome these limitations, innovative approaches and methods analyzing nature-based recreation from an ecosystem service perspective have been recently developed and applied in a variety of contexts [36,37,38], including urban areas [32,39,40,41]. These methods assess nature-based recreation considering both the supply, which depends on the potential of different green spaces based on their typology and conditions, and the demand for the service, which depends on the context-specific preferences of the local population [42,43]. Despite their growing popularity, the improvements potentially brought to urban planning decisions with respect to other, more common approaches and indicators, are yet to be measured.
This article presents a case study where the ESTIMAP-recreation model [44] was applied to assess the potential and opportunities for nature-based recreation in the city of Trento (Italy), and then compared with traditional indicators based on the availability and accessibility to urban parks. The aim was to test how the model can be adapted to the local context and to what extent it can improve how nature-based recreation is currently addressed by urban planning. The case study, the adapted version of the ESTIMAP-recreation model, and the application process are described in Section 2. The findings are presented in Section 3 and discussed in Section 4. Finally, Section 5 draws some key conclusions.
2. Materials and Methods
2.1. Introducing the Case Study
Trento, provincial capital of Trentino, is a city of around 117,000 inhabitants located in the eastern Italian Alps. The administrative area of the city extends over 158 km2, half of which is covered by forests. The main settlement lies in the valley floor along the River Adige, at around 200 m a.s.l., whilst the surroundings reach an elevation of 2180 m. The valley floor hosts around 70% of the population, as well as most industrial and commercial areas and infrastructures. The few unurbanized patches in the valley floor and the sunny hillsides are used for agriculture, mostly vineyards and apple orchards. The rest of the population lives in several villages spread across the hills, to the east, and on the slopes of Monte Bondone, to the west. The city is divided into 16 districts corresponding to the main residential settlements (Figure 1). The districts are the smallest administrative units, commonly used for statistical purposes.
Thanks to its location close to mountains, the varied topography, and the peculiar urban form, Trento offers its citizens a diversified portfolio of opportunities for day-to-day nature-based recreation. Citizens benefit from the proximity to different typologies of green infrastructure where they conduct a wide range of nature-based recreational activities. In addition to typical “urban” activities commonly carried out in urban parks (e.g., playing with children, walking, and meeting with friends), popular day-to-day recreational activities in Trento include hiking, mountain-biking, skyrunning, and climbing in nearby forests and mountain areas. Providing all citizens with equal opportunities for nature-based recreation is currently among the main planning objectives of the city administration. However, measuring progresses towards such objective is complex and requires overcoming indicators of availability and accessibility to urban parks in favor of a more comprehensive assessment, able to account for multiple typologies of green infrastructure, recreational activities, and users. Therefore, the study area covers the whole territory of the city and considers the entire urban green infrastructure as potential space for nature-based recreation.
2.2. Adapting the ESTIMAP-Recreation Model to the Local Context
To assess nature-based recreation in Trento, we adopted a locally-adapted version of the ESTIMAP-recreation model. ESTIMAP-recreation is part of a suite of models for the spatially-explicit assessment of ecosystem services [46,47], originally developed for EU-wide applications, but increasingly applied to assess potential and opportunities for nature-based recreation across a range of different scales and contexts, from cities to protected areas [36,39,44,48,49,50]. Amongst the strengths of the model are the simple conceptual structure, the possibility of accounting for multiple types of activities, and the flexibility that makes it adaptable to the inclusion of locally-relevant information. The model is based on an “Advanced multiple-layer Look-Up Tables” approach [44], where the final value of the indicators is obtained from a cross tabulation and spatial composition of different thematic maps. The model is structured into three successive sections. In each section, different components (i.e., thematic sets of input maps) are combined according to scores assigned by the user, based either on the literature or on expert opinion [44].
- The first section assesses the Recreation Potential (RP), i.e., the capacity of green infrastructure to support nature-based recreational activities based on their intrinsic characteristics, independently from their actual or potential use. The components included in the original version are water, natural protected areas, and degree of naturalness. The RP is described by a raster map with relative values ranging from 0 (no recreation potential) to 1 (maximum recreation potential in the analyzed area).
- The second section assesses the Recreation Opportunity Spectrum (ROS) by combining the RP with information about proximity (i.e., in the original version, distance from roads and urban areas), thus providing an assessment of the opportunities for recreational activities offered to the citizens. The ROS is described by a raster map classified into nine categories resulting from the cross-tabulation of high/medium/low values of RP and high/medium/low values of proximity.
- The third section includes an assessment of the use or demand for recreation obtained from an analysis of the spatial distribution of potential users and corresponding levels of accessibility.
Within this general structure, adjustments can be undertaken to adapt the model to specific contexts and related policy questions. With this aim, building on the application in eight case studies across Europe, Zulian and colleagues [44] defined a protocol based on the two successive steps of conceptual adaptation and structural adaptation. Conceptual adaptation requires framing the application of the model with respect to the specific policy question at hand, including issues related to the types of users and uses, the scale of analysis, and the stakeholders that should be involved in the assessment. In Trento, the conceptual adaptation of the model was aimed at reflecting the local conditions in terms of different types of recreational activities and related natural settings, at linking the results to practical information about what types of planning or management interventions are needed more, and at setting the scoring phase in a way that it allows for a meaningful participation of experts from different fields (i.e., by maximizing the similarity of the elements within the same component of the model, thus allowing for an easier comparison).
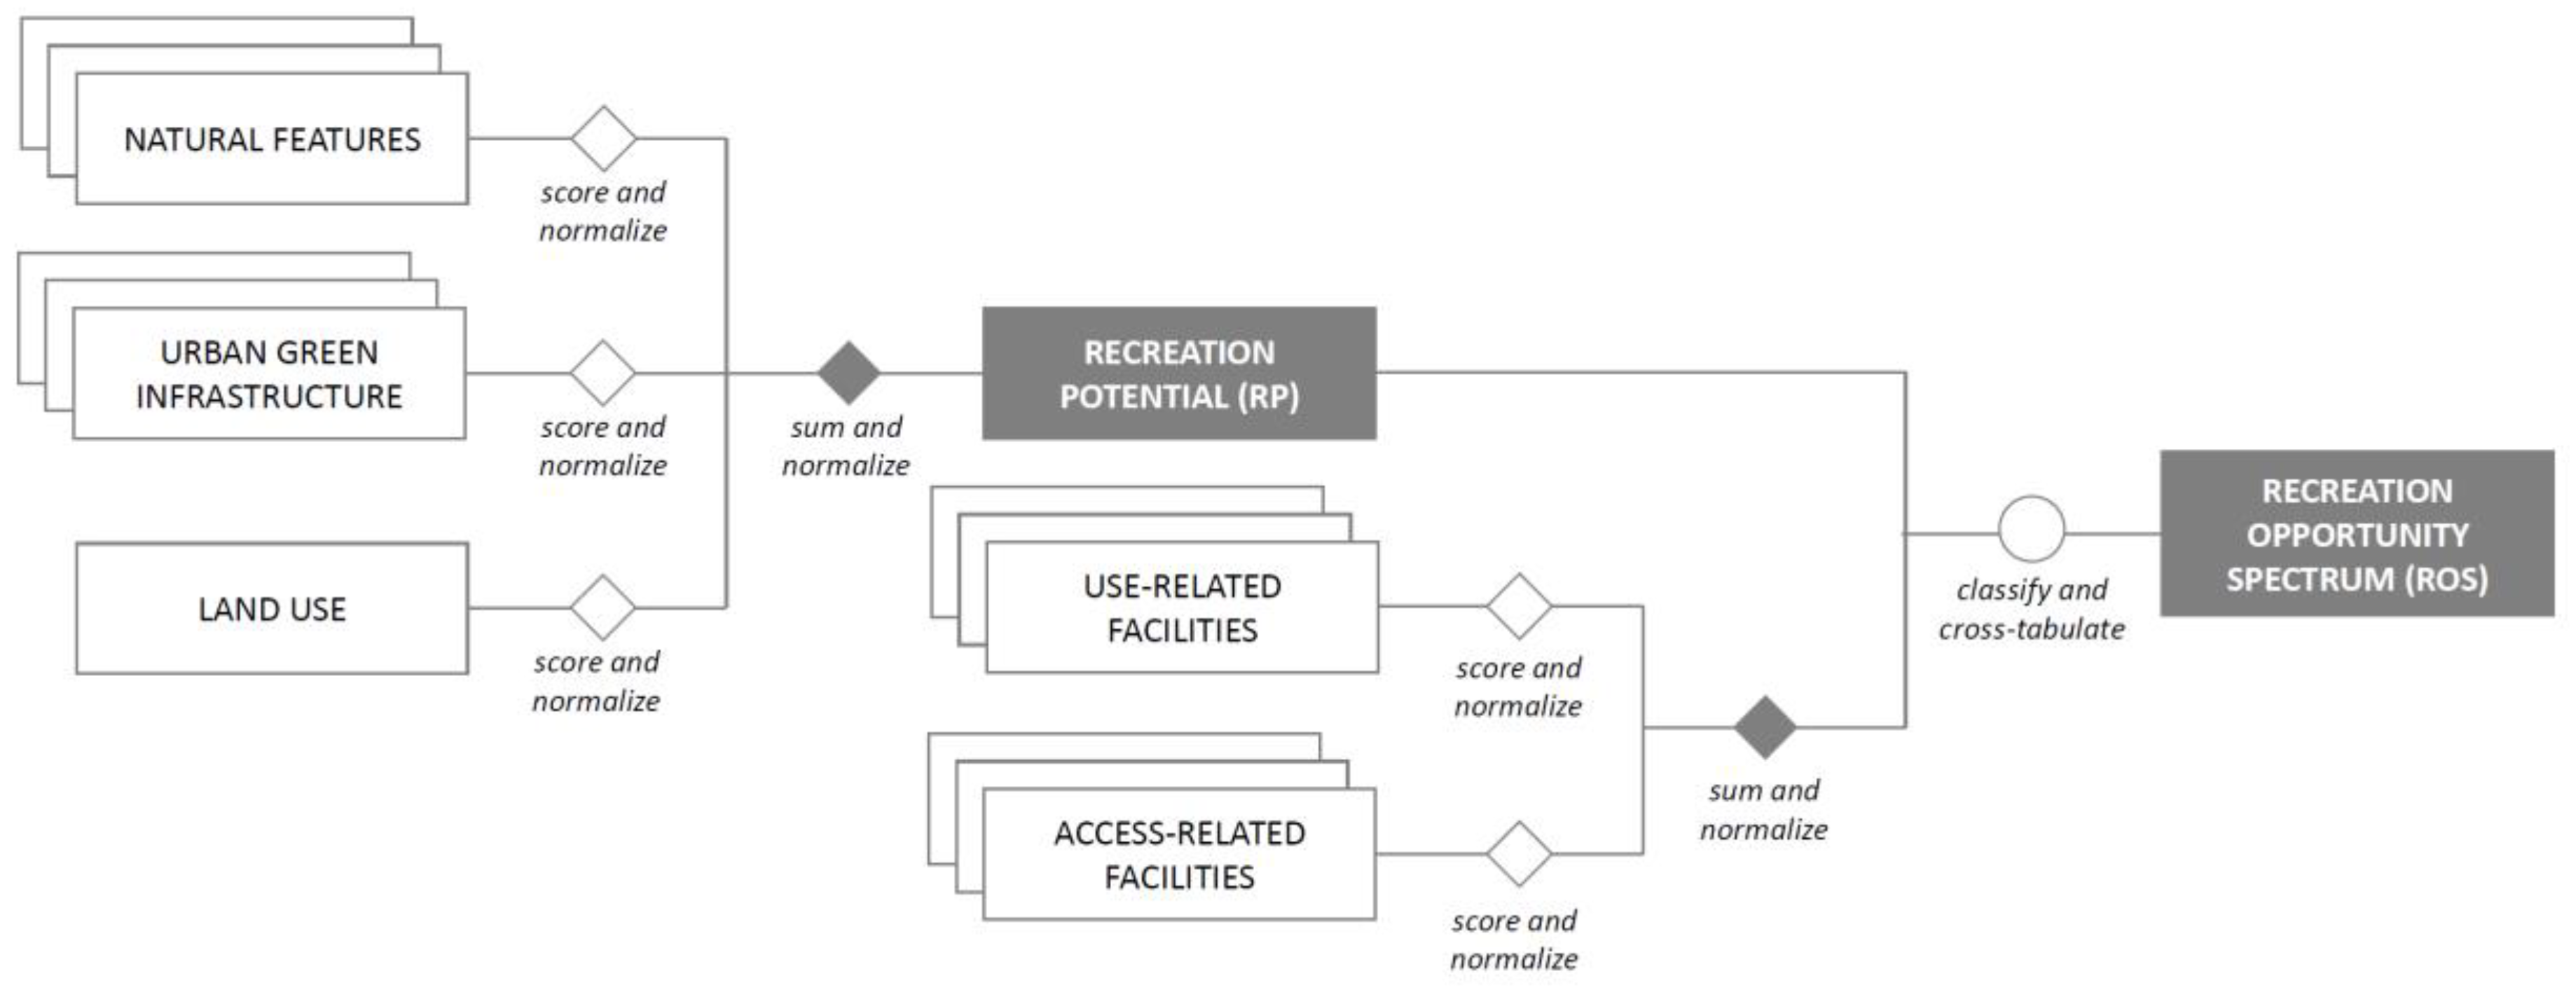
Structural adaptation refers to changes in the original model made to respond to the needs identified in the conceptual adaptation. It includes: (i) adapting the conceptual scheme in terms of number of components, combination of input data, scoring system, and weighting parameters; (ii) identifying and retrieving locally-relevant data, including the elicitation of scores from experts or stakeholders; and (iii) running the model and sharing results to get feedback, possibly generating a further refinement of the conceptual scheme [44]. Following the principles expressed in the conceptual adaptation, some adjustments were made on the components of the three sections. In the version adopted for this study, the RP includes three components, namely natural features, urban green infrastructure, and land use, thus distinguishing urban and peri-urban green areas from predominantly natural and semi-natural areas outside the most urbanized part of the city. Furthermore, “proximity” is defined as the availability of facilities and infrastructures that allow access and use of green infrastructure for nature-based recreational activities. Therefore, the ROS module includes two distinct components for access-related and use-related facilities. Finally, population distribution is used to quantify the actual beneficiaries, based on the number of citizens living within a defined distance from areas classified in the highest class of ROS. Figure 2 illustrates the adapted version of the ESTIMAP-recreation model applied to the case study of Trento.
2.3. Assessing Nature-Based Recreation in Trento
The analysis was carried out within the framework of the European project EnRoute (https://oppla.eu/enroute) by the Trento city-lab, composed of researchers from the University of Trento and municipal officers from the local administration, in collaboration with project leaders from the European Commission Joint research Centre. EnRoute stands for “Enhancing Resilience of urban ecosystems through green infrastructure” and is a project of the European Commission in the framework of the EU Biodiversity Strategy and the Green Infrastructure Strategy. It provides scientific knowledge of how the assessment of urban ecosystems and their services can support urban planning at different stages of policy and for various spatial scales, ultimately supporting policy-making for sustainable cities [52]. The Trento city-lab decided to focus on nature-based recreation due to the interest of the local administration on the topic. First, the city lab discussed the requirements of the analysis, agreed on the adjustments to be made to the original version of the ESTIMAP-recreation model, and retrieved data and maps of the elements to be included in the different components of the model from existing municipal and provincial databases, and from OpenStreet Map [53]. Then, to check the type of results and their overall coherence with local conditions, a testing application of the model was carried out using scores assigned by the members of the city lab.
Once the final structure of the model was defined, an on-line questionnaire was prepared to elicit the weights from a pool of local experts. The questionnaire was sent to 19 experts who had previously agreed to collaborate with the project, and 17 valid responses were collected within the deadline (December 2017). Respondents include personnel of different provincial (3) and municipal (7) departments with an interest in recreational areas and activities, including green space management, environment, planning, common goods, social services, sport, protected areas, and landscape; local practitioners (1); and academics from the University of Trento (3) and other research centers (3) working on topics related to ecosystem services, urban green infrastructure, and urban planning. The experts were asked to weight each element by assigning a score from 0 to 5 (direct assessment) according to its relevance in supporting or promoting nature-based recreation. The scores were then averaged, excluding the highest and the lowest score, and converted to a 0–1 scale.
Following the on-line consultation, the model was run for the second time with the elicited weights, and the experts were invited to discuss the resulting maps of RP and ROS in a focus group (March 2018). Twelve out of the 17 experts that completed the questionnaire participated in the discussion and contributed in defining the final list of elements of the components of the model, and the respective scores.
To estimate the number of people with adequate close-to-home recreational opportunities, we used a simple accessibility model based on the Euclidean distance from households. Areas in the highest class of ROS (i.e., high recreation potential and high proximity) were considered as destinations, while a map of residential buildings was used to identify the origins. To be as accurate as possible in the spatial analysis, we retrieved the number of residents in each census tract and considered them as homogeneously distributed on the surface covered by the footprint of residential buildings. The maximum distance was set at 300 m [30,35,54], to take into account the difference between Euclidean and road distance [55] and of the presence of topographic changes that may act as barriers to long-distance pedestrian movement. The indicator was computed at the district level setting all areas in the highest class of ROS as destinations, and then compared with the results of the same analysis when destinations are limited to urban parks.
3. Results
3.1. Recreation Potential (RP) and Recreation Opportunity Spectrum (ROS) in the City of Trento
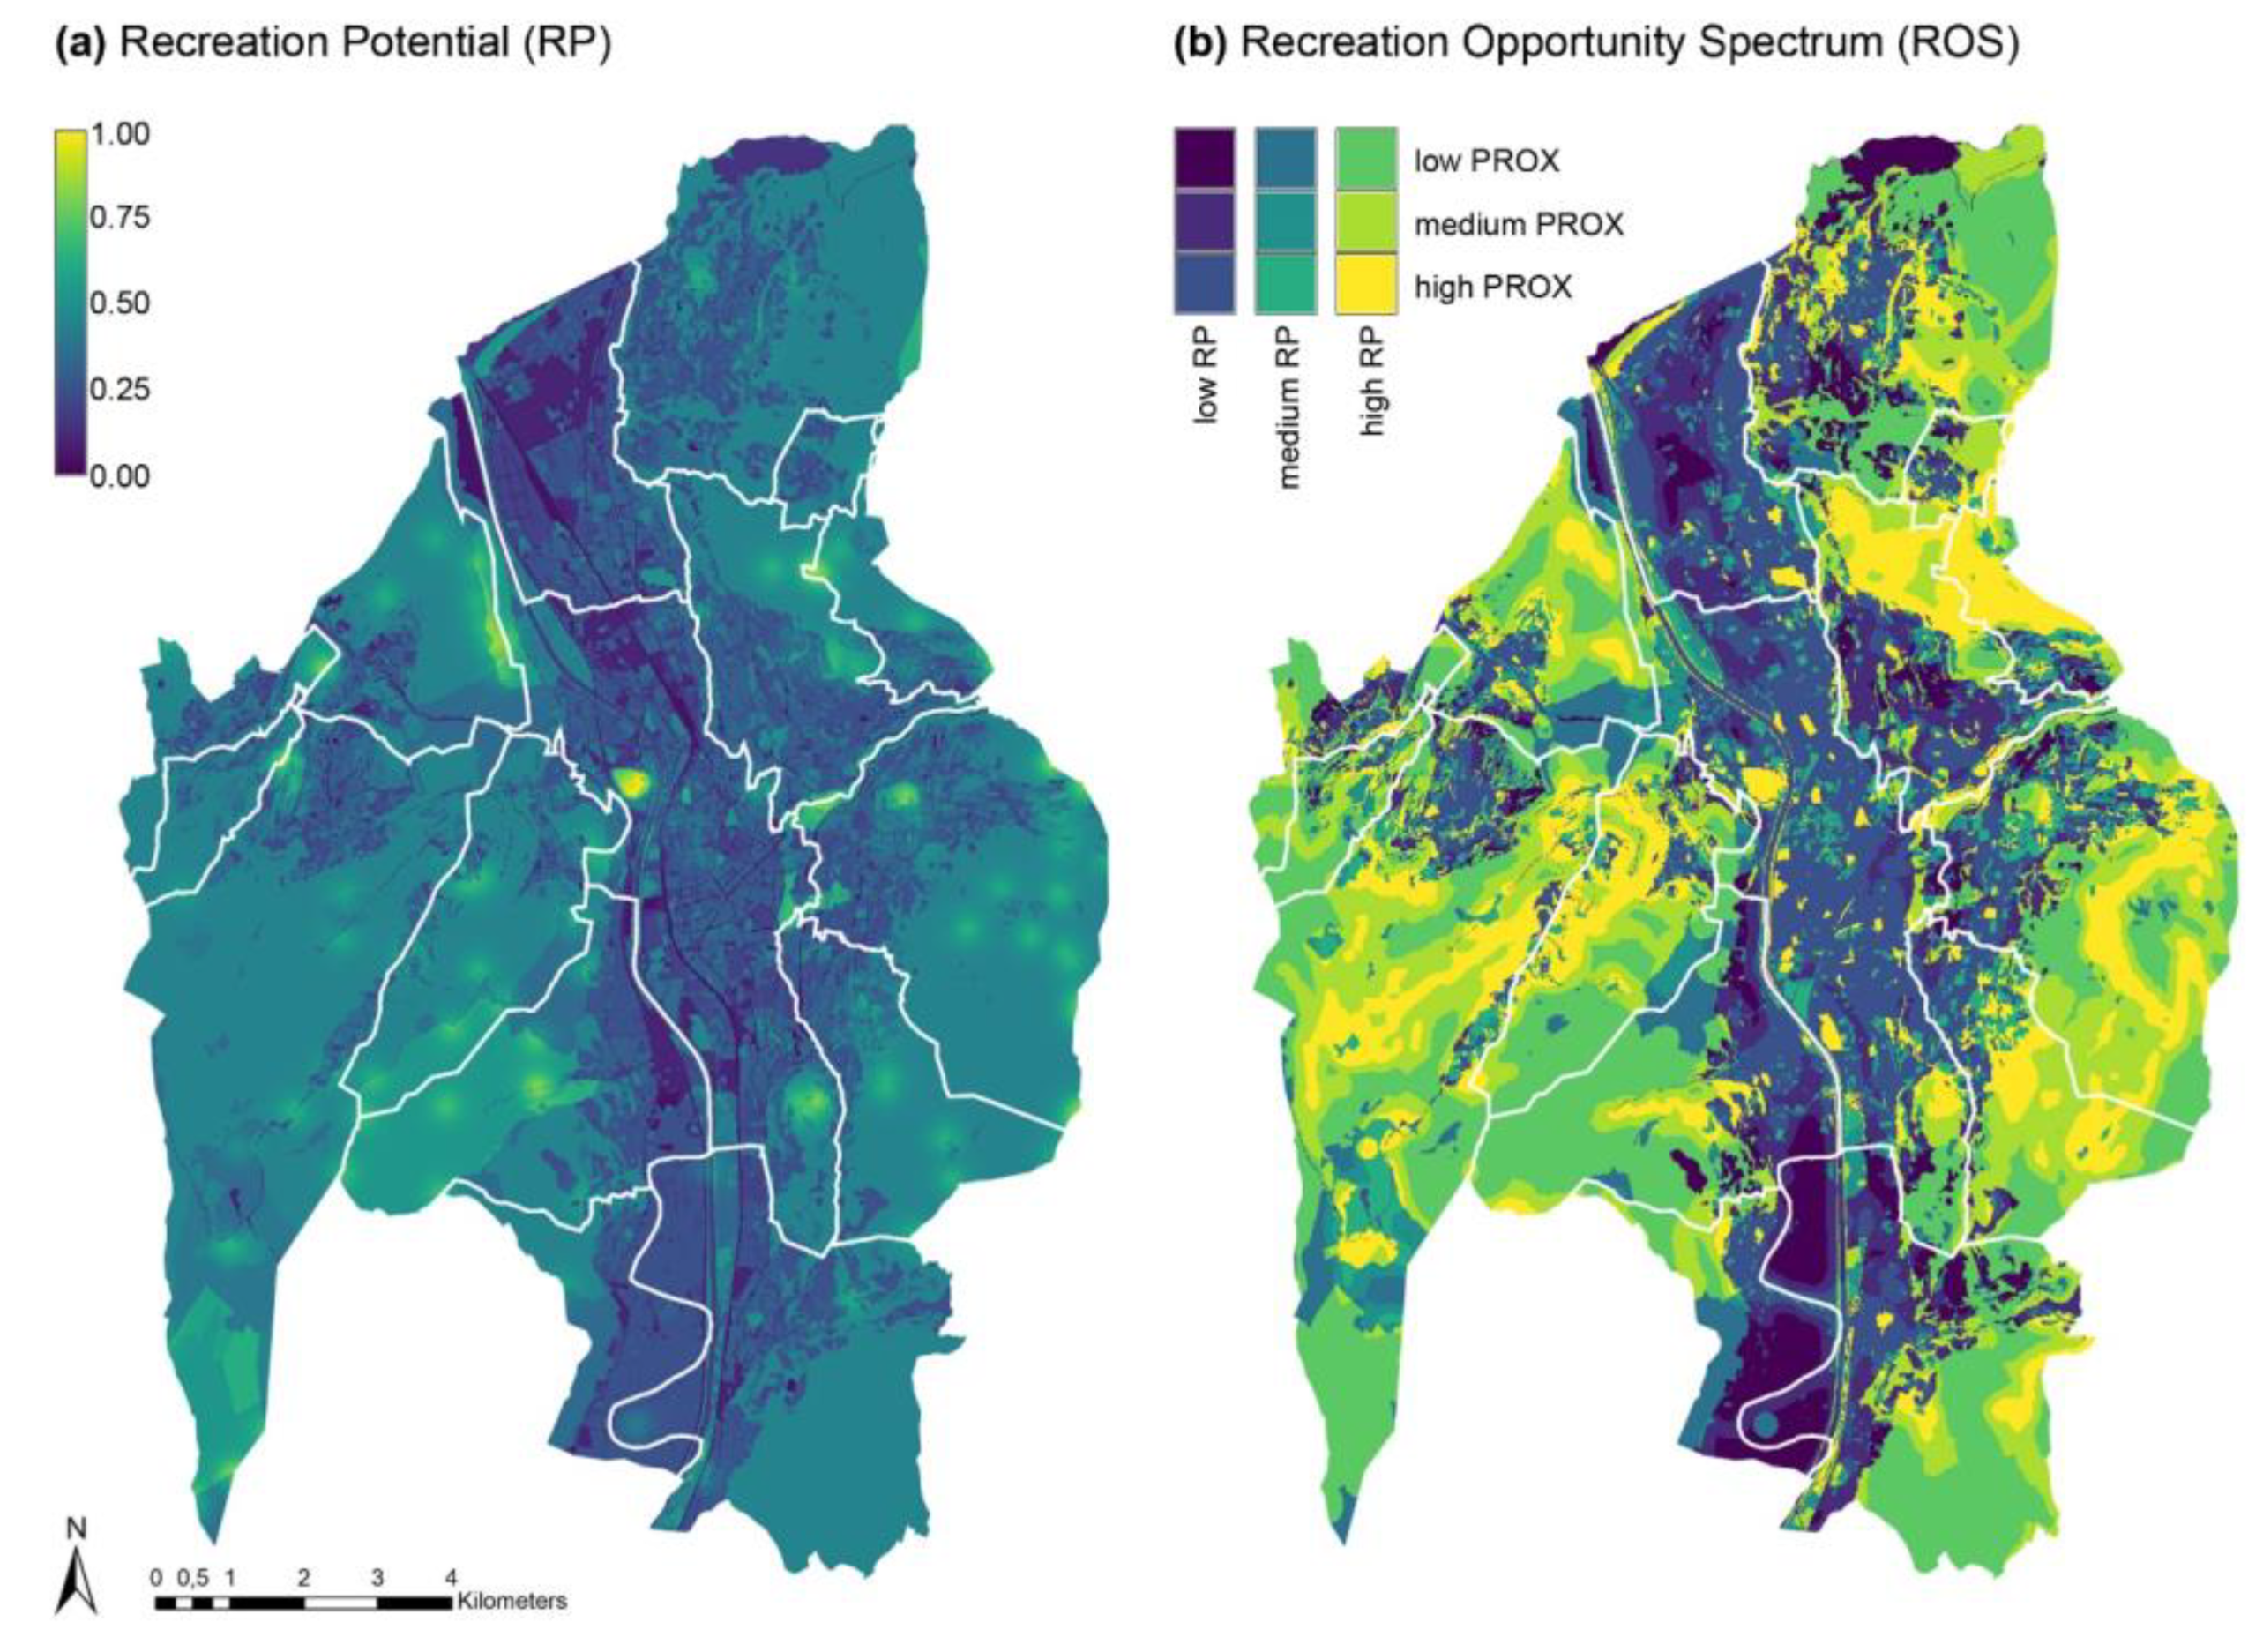
The results of the expert consultation are summarized in Figure 3 (land use classes) and Figure 4 (natural features and urban green infrastructure) for the first component, and in Figure 5 (use-related and access-related facilities and infrastructures) for the second component of the model. The final normalized scores shown in Figure 3, Figure 4 and Figure 5 were used to run the ESTIMAP-recreation model, generating the Recreation Potential (RP) and Recreation Opportunity Spectrum (ROS) maps for the city of Trento (Figure 6). RP measures the capacity of green infrastructure to support nature-based recreational activities based on their intrinsic characteristics, independently from their actual or potential use, and is expressed as a normalized value ranging from 0 (no RP) to 1 (maximum RP). A large part of the map shows values around 0.5 (Figure 6a). This is a consequence of the high scores received by most of the elements both in the “natural features” and in the “urban green infrastructure” components of the model (Figure 4), probably due to the wide range of green space typologies suitable to provide opportunities for day-to-day nature-based recreation in Trento. Since the scores of the three elements in the first component of the model (i.e., “natural features”, “urban green infrastructure”, and “land use”—see Figure 2) are summed up to obtain the total value of RP; areas that reach the highest value are urban parks with relevant natural features. This is the case of two among the largest urban parks of the city, which partially overlap with natural protected areas. Overall, excluding urban parks, the valley floor presents low values of RP. The river itself does not emerge, since its dimension and speed make it unsuitable to support water-based recreational activities. However, its banks receive a high score, particularly those recognized for their landscape value. The surrounding hills and mountains are characterized, on average, by a higher value of RP compared to the valley floor. This is mostly due to the presence of forests and of various attractive natural features that promote nature-based recreational activities.
The map of ROS (Figure 6b) combines values of RP and proximity, here defined as the availability of facilities and infrastructures for accessing and using the green spaces. The main urban settlement in the valley floor, though mostly characterized by low values of RP, shows high values of proximity, especially due to the concentration of transport infrastructures and the resulting high accessibility. All urban parks fall in the best class of ROS. The same can be said for the river banks, which host one of the most important touristic cycle paths in Italy, used by Trento citizens for running, cycling, and skating. Outside the most urbanized areas, accounting for the availability of infrastructures and facilities helps to distinguish the different opportunities offered by green spaces other than urban parks, and particularly forests. Areas with high proximity due to the presence of forest tracks, hiking trails, and facilities dedicated to specific activities such as climbing routes and MTB trails can be mainly found close to the settlements. However, the two sides of the valley show a quite different performance in terms of recreation opportunities. The east side is characterized, on average, by a higher proximity compared to the west side, where the settlements are sparser and the connections with the valley floor are more difficult. Hence, areas in the highest class of ROS prevail on the east side, whilst the west side is mostly classified as high RP and low proximity.
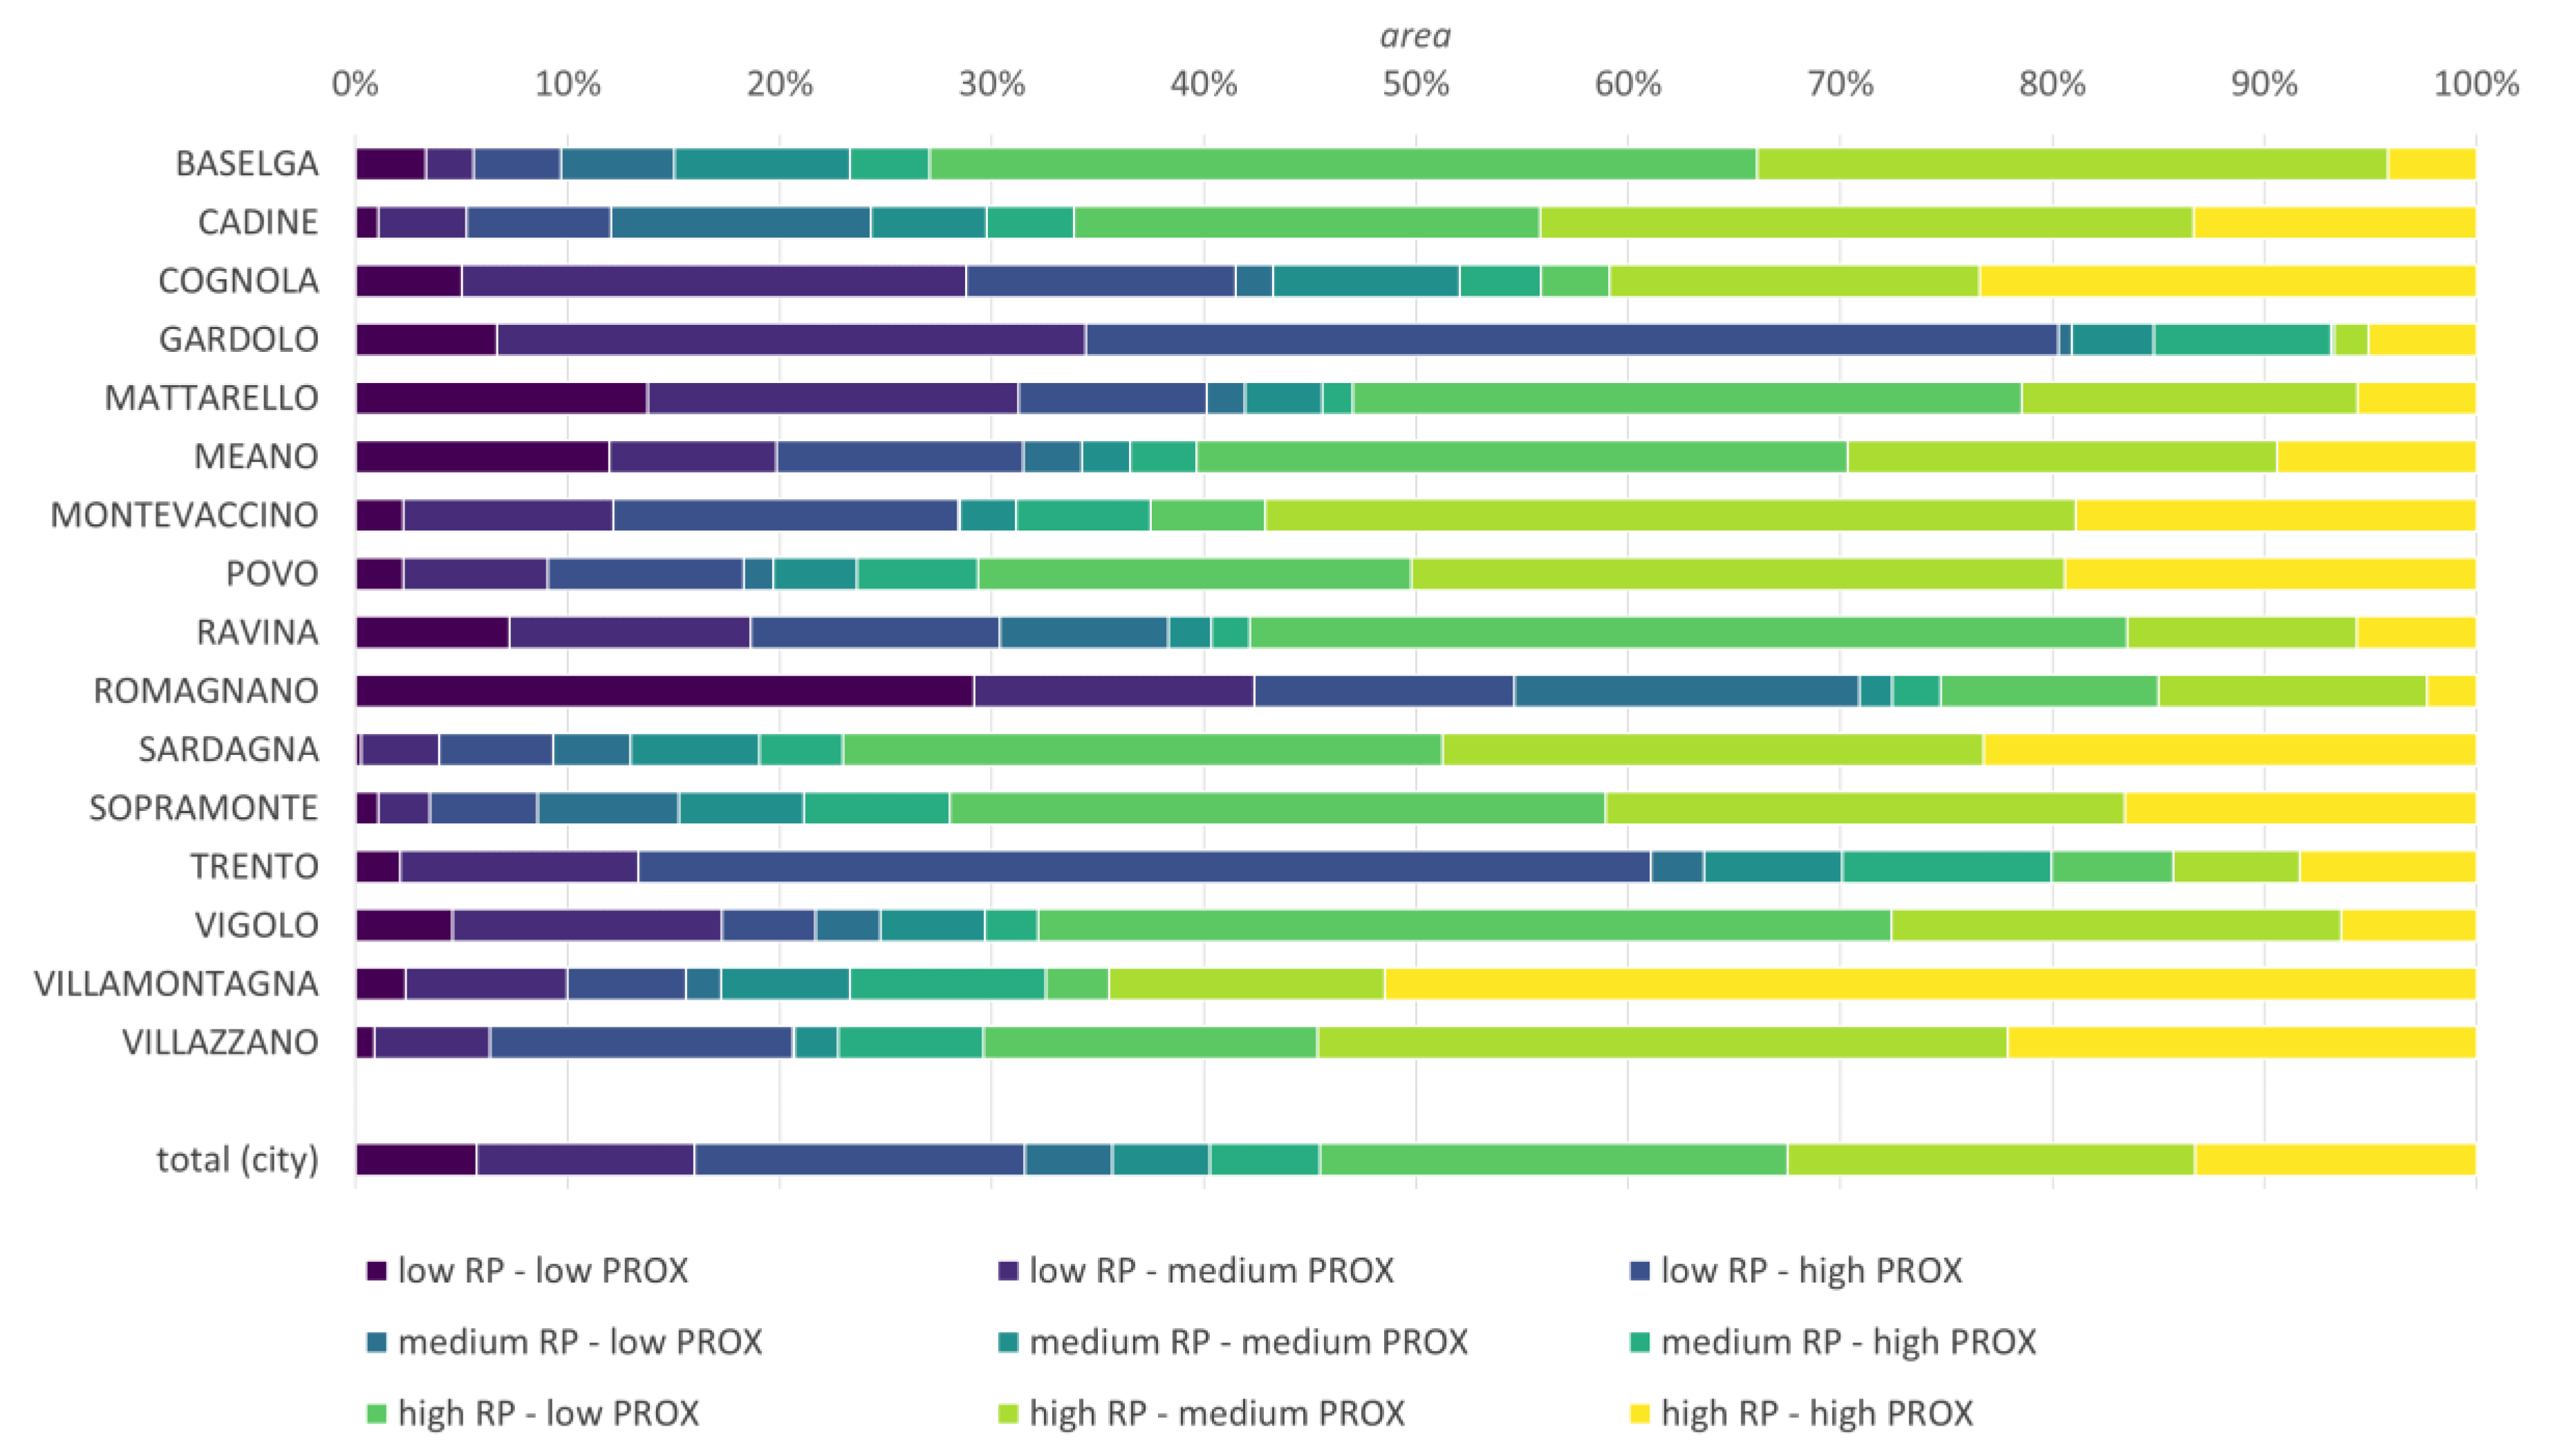
Breaking down the results at the district level helps to better visualize the differences among the different parts of the city (Figure 7). On the west side of the valley, the districts of Baselga, Vigolo, and Ravina show a clear prevalence of the class of ROS characterized by high RP and low proximity. Quite the opposite, on the east side (e.g., in Cognola, Povo, and Villazzano), areas with high RP are mostly characterized by medium to high proximity, and in Villamontagna half of the district area falls in the highest class of ROS. Sardagna and Sopramonte, though located on the west side, show a partly different characterization with a share of the district area classified in the highest class of ROS ranging from 15% to 25%. This is due to the presence of infrastructural elements that connect the districts with the city center (i.e., the main road that provides access to the top of Monte Bondone), and to the presence of many facilities to take advantage of the recreation potential, including hiking trails, forest tracks, alpine huts, and picnic areas. In the valley floor, the strongly-urbanized districts of Trento and Gardolo show a similar distribution in the different classes of ROS, with a prevalence of areas characterized by low RP and high proximity.
3.2. A Comparison of Indicators for Urban Planning
Starting from the results of the ESTIMAP-recreation model, we compared the total and per-capita areas for nature-based recreation measured, on the one hand, considering urban parks only, and, on the other hand, including all areas in the highest class of ROS (Table 1). In the whole municipal territory, the total area classified in the highest class of ROS is almost ten times the area of urban parks, resulting in per-capita values of 179.1 m2/person vs. 8.0 m2/person, respectively. At the district level, the ratio between the two quantities ranges from values around 3 and 4 of the most urbanized districts in the valley floor (i.e., Trento and Gardolo), to values between 170 and 200 of mountain settlements such as Cadine, Montevaccino, and Vigolo. Villamontagna, where there is only one urban park of around 2000 m2 but more than half of the territory falls in the highest class of ROS, is the most extreme case, with a ratio of around 740. The per-capita area of urban parks ranges from 1.1 m2/person in Romagnano to 22.4 m2/person in Baselga. Interestingly, values above average characterize the most densely-populated districts of Trento and Gardolo, demonstrating the effectiveness of policies that, in the last years, have been targeted at enhancing the availability of green spaces in these parts of the city. The per-capita area classified in the highest class of ROS ranges from 27.5 m2/person in Trento to 1844.5 m2/person in Sardagna. Values below average characterize the districts in the valley floor, where a low availability of areas in the highest class of ROS combines with a high population density.
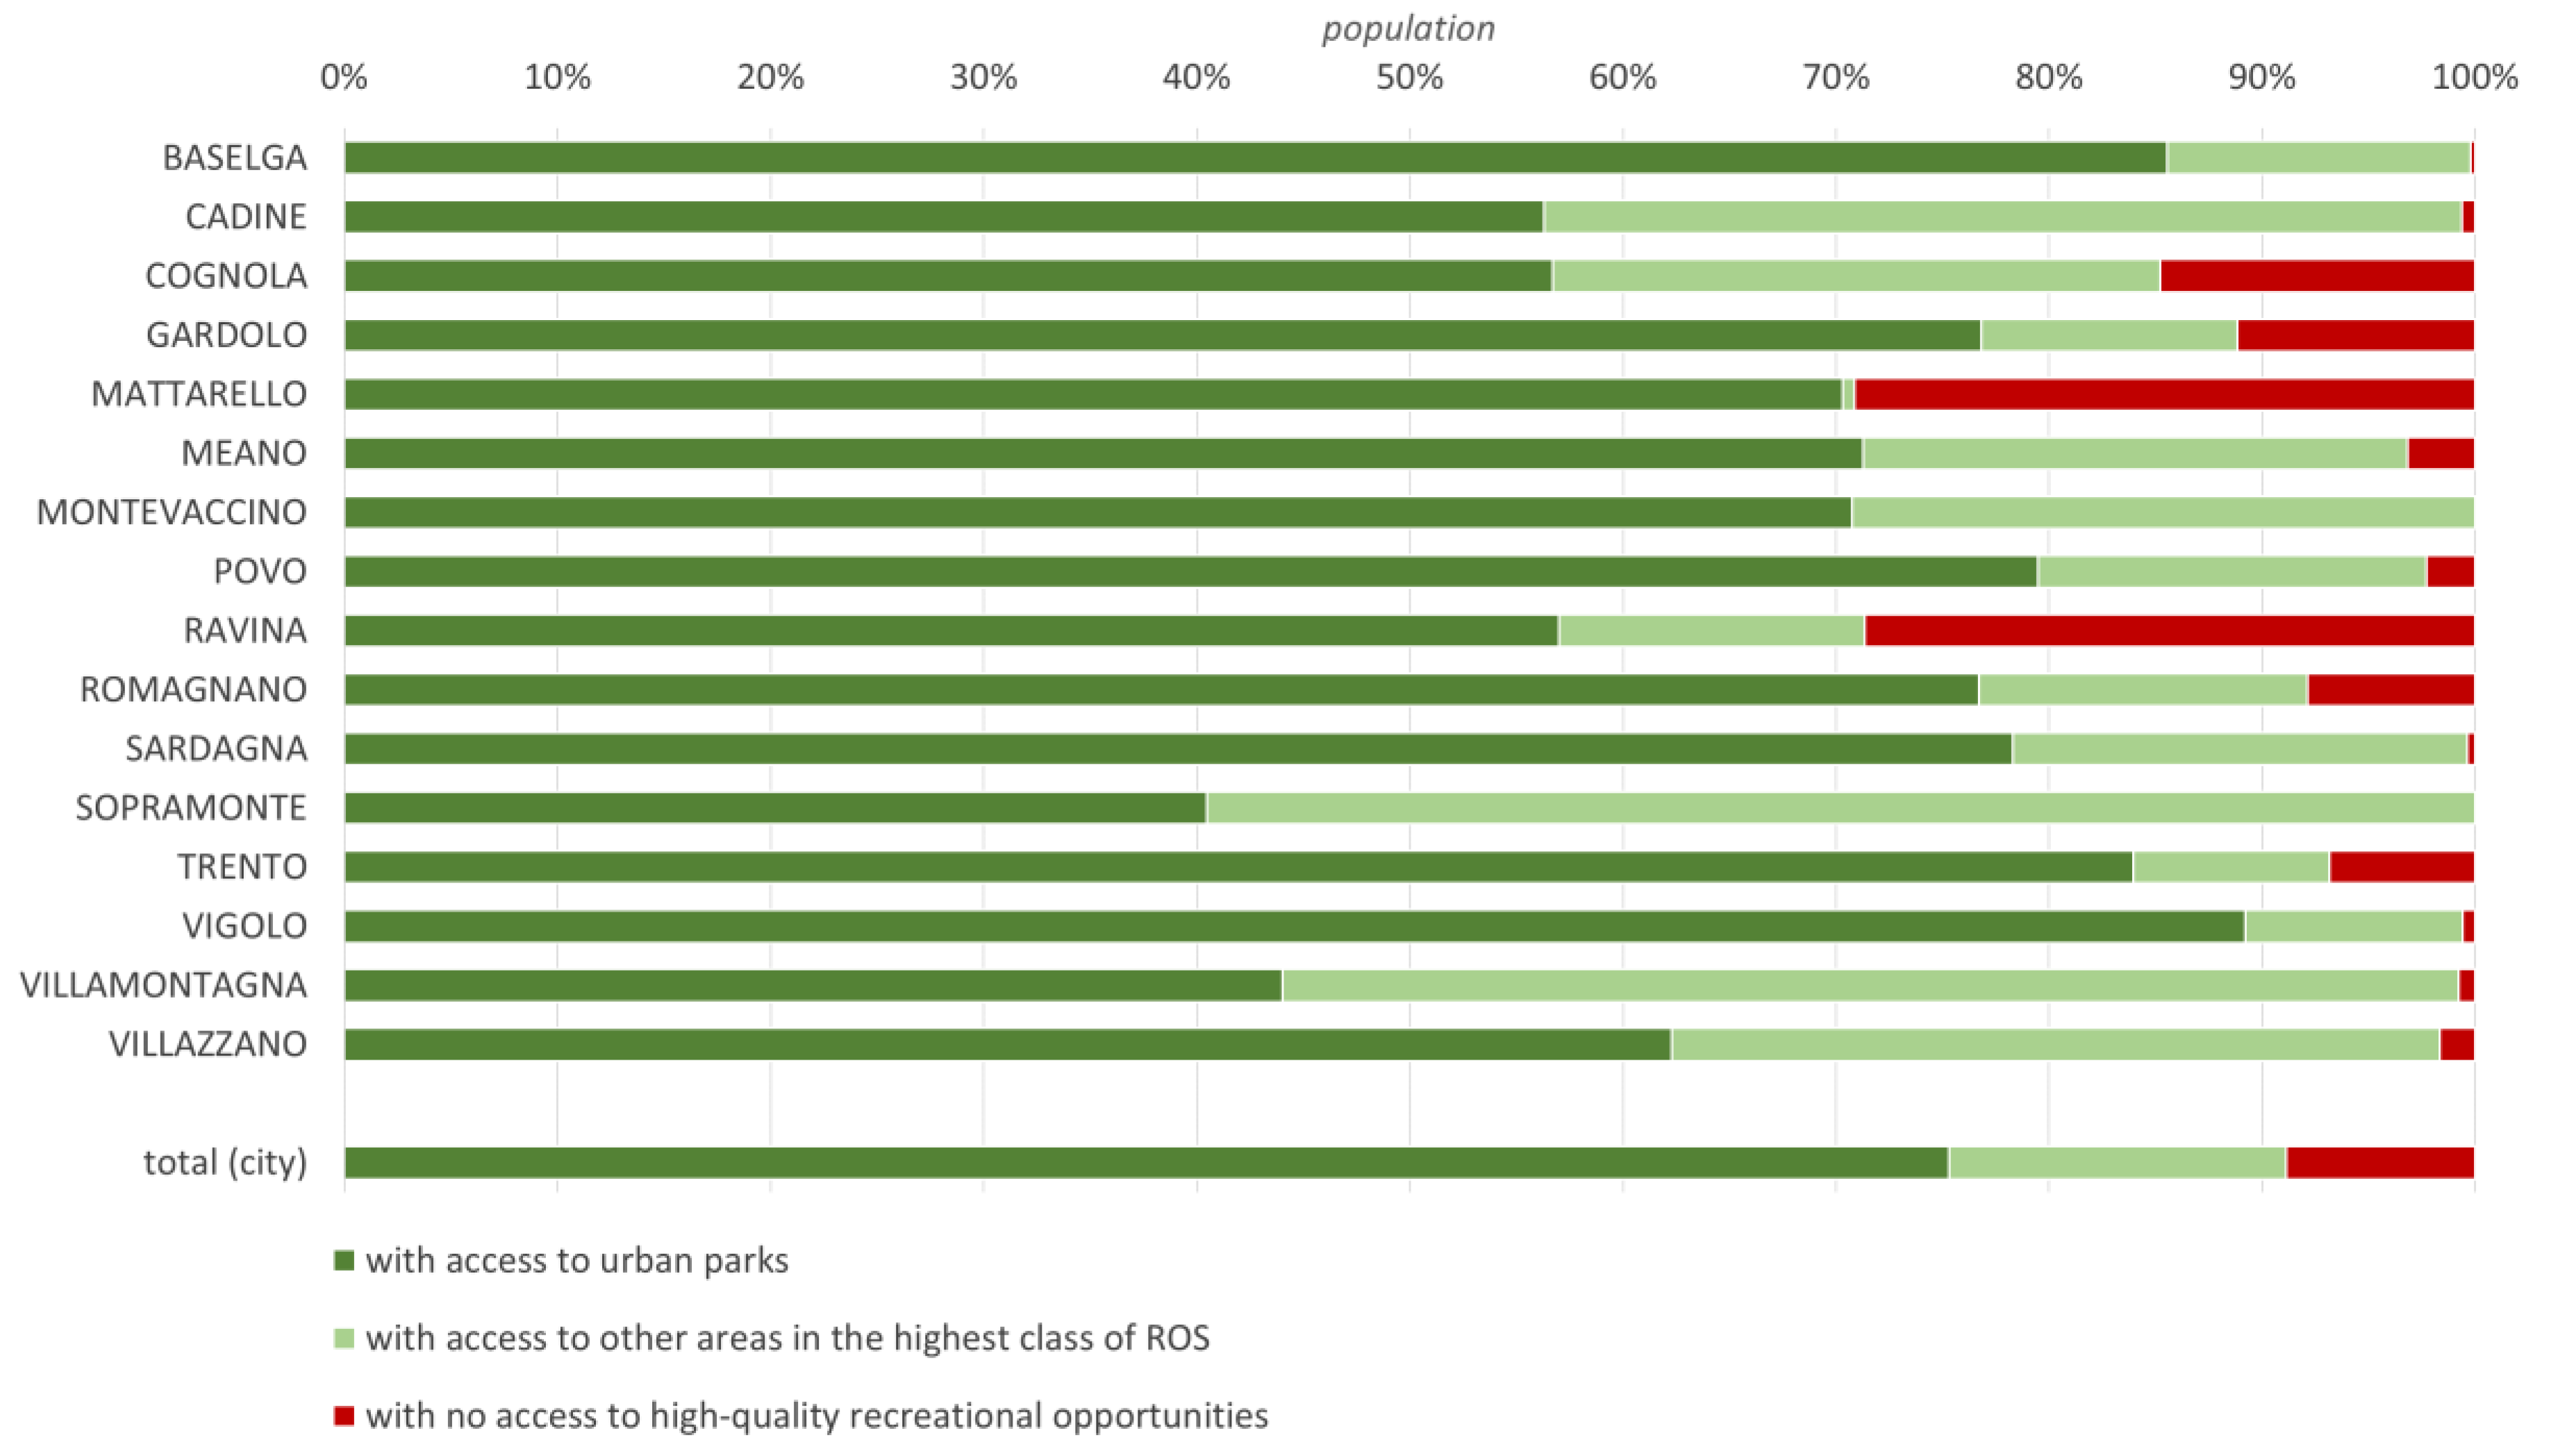
A similar comparison between urban parks and areas in the highest class of ROS was conducted for another indicator commonly adopted to inform planning and management of urban green infrastructure, i.e., the share of population with adequate access to close-to-home recreational areas (Figure 8). In this case, considering all areas classified in the highest class of ROS allows identifying those citizens who, despite living away from urban parks, can however benefit from the presence of other typologies of nearby green spaces that provide high-level opportunities for nature-based recreation. At the city level, more than 75% of the population live within 300 m from an urban park, and the value reaches 91% when all green spaces in the highest class of ROS are considered. At the district level, the most disadvantaged areas in terms of accessibility to urban parks are Sopramonte and Villamontagna, where less than 50% of the population live within 300 m from an urban park. More than 1/3 of the residents do not have access to close-to-home urban parks in Cadine, Cognola, Ravina, and Villazzano, too. The picture changes when considering the access to green spaces in the highest class of ROS. The share of population without access to any close-to-home green space for nature-based recreation is generally very low (around 9% in the whole city), and lower than 5% in 10 out of 16 districts. Values around 30% are measured only in Mattarello and Ravina, while in two other districts, i.e., Cognola and Gardolo, they exceed 10%.
The difference between the values of the two indicators is small in the valley floor (i.e., in the districts of Trento, Gardolo, and Mattarello), where areas in the highest class of ROS correspond almost exclusively to urban parks. Conversely, the share of population living far from urban parks but close to other green spaces providing high-level opportunities for nature-based recreation exceeds 50% of the residents of Sopramonte and Villamontagna and is above 25% in most mountain districts. The result highlights the role of close-by forests and natural areas in supporting nature-based recreation in Trento. However, the case of Vigolo exemplifies the importance of the spatial distribution of residential settlements and green spaces in determining the actual service offered to the population. Here, in fact, the total area classified in the highest class of ROS is almost 200 times bigger than the area of the only urban park in the district (Table 1), but, since the settlement is very small and adjacent to the park, the difference in terms of population with access to recreational areas is just 10% (Figure 8).
4. Discussion
4.1. Nature-Based Recreation from an Ecosystem Service Perspective
The aim of the research was to investigate to what extent innovative methods for the assessment of nature-based recreation, such as the ESTIMAP-recreation model, can improve urban planning decisions.
As demonstrated by previous studies, nature-based recreation in cities is not limited to urban parks, but covers a wide range of urban ecosystems, from the most human-dominated and intensely-managed typologies of green infrastructure such as tree-lined streets or vegetable gardens [18,64], to semi-natural and natural areas such as wetlands and protected areas [65,66], which are often overlooked by traditional indicators. The ESTIMAP-recreation model allows identifying service providing areas not a-priori, but through a relative and context-specific definition of recreation potential based on the scores assigned by local experts. Beyond urban parks, natural and semi-natural areas close to residential settlements, especially forests, emerge as key places for recreation in Trento. This result is consistent with studies conducted in a variety of cities and metropolitan areas in Europe, which have highlighted the role of urban and peri-urban forests in supporting nature-based recreation [17,39,67]. On the other hand, in the case study, the contribution of agricultural areas to nature-based recreational opportunities is very low. This is the consequence of the low recreation potential assigned by local experts to the corresponding land use classes, and of the scarce presence of facilities (e.g., footpaths, cycleways, and resting areas) to use these areas for recreational purposes. The competition offered by the mountain environment and the management prevalently directed to the intensive mono-functional farming, with a scarce possibility of integration with other activities, are the most probable reasons for this result. However, the high landscape value of these forms of peri-urban agriculture, already acknowledged by Trento citizens and administration, could be interpreted as an opportunity for promoting synergies between agricultural production and recreational activities, thus moving towards a multi-functional agricultural model [19].
The demand was included in the assessment in two ways: first, by considering the preferences of local users; second, by accounting for the spatial distribution of the population. Local experts were asked to discuss about the type of users and recreational activities in Trento, and to score the elements accordingly. Then, in the spatial analysis of the results, the share of population living close to areas with high-level opportunities for nature-based recreation was adopted as an indicator of satisfied demand. These two aspects correspond to the two components that determine the demand for nature-based recreation, and more in general for all cultural ecosystem services: on the one hand, people’s preferences and values, i.e., what activities people like and what green space typologies are considered suitable to perform those activities; on the other hand, their direct use, i.e., the actual possibility of carrying out a certain activity in a certain area [68]. In studies about nature-based recreation, these two aspects are generally dealt with alternatively. Assessments usually focus either on the actual possibility to benefit from the presence of a green space, measured through proximity and accessibility models [34,40], or on individual preferences, elicited through surveys and interviews [67,69,70] or inferred from geolocated photos, social media, and other sources of geographic information [71,72,73]. While the former type of analyses is based on rigid causal assumptions that fail to consider individual attitudes and perspectives, the latter are place-specific, with scarce possibility of generalization. In the proposed methodology, the scores assigned by local experts, which reflect the preferences of Trento citizens for recreational activities, are combined with the spatial distribution of the population, thus allowing for a spatially-explicit assessment that is fundamental to support urban planning [74].
4.2. How the Assessment of Nature-Based Recreation Can Support Urban Planning
The comparison between indicators obtained from the proposed methodology and indicators considering only urban parks revealed significant differences, potentially affecting the direction of future planning and management interventions. A key information such as the relative performance of the districts, hence their ranking, changed significantly between the two types of indicators. Districts that appear disadvantaged when considering the per-capita area of urban parks turn out to be among the richest in areas providing high-quality opportunities for nature-based recreation, and vice-versa. At the same time, districts characterized by a low share of residents with adequate access to urban parks show a good coverage of the population when all opportunities for close-to-home nature-based recreation are considered, while some of the districts with good accessibility to urban parks present a significant part of the population that live far from any area suitable for nature-based recreation. Since planning decisions, such as the location of new green spaces, are based on priorities [51], selecting the right indicator is crucial. A clear understanding of what is measured and its correspondence with planning objectives should be at the basis of indicator selection [75]. The ESTIMAP-recreation model combined with a simple accessibility model proved to be a relatively simple and effective method to identify unsatisfied demand for nature-based recreation: a key information for urban planning [32,39], especially when an equal distribution of ecosystem services is among the goals of planning actions [28].
Overall, considering nature-based recreation as an ecosystem service supplied by different typologies of green infrastructure mitigates the role assigned to urban parks and to the recreational activities carried out inside them, and reveals a variety of actions through which urban planning can promote and support nature-based recreation. These include, for example, preserving and protecting natural areas, as well as promoting management practices that support multifunctionality of agricultural areas and forests with acknowledged recreation potential [41,76]. While the conditions of Trento may be considered peculiar due to its location, many cities are characterized by the proximity of residential neighborhoods to (semi-)natural areas. This is true not only in small- and medium-sized cities, but also in big cities such as Barcelona [39], Berlin [17], and Milan [77]. Moreover, recent studies revealed that, in the European Union, 15.2% of the surface covered by the Natura 2000 network falls within Functional Urban Areas [52], with local recreationists prevailing among the visitors of Natura 2000 sites located close to urban agglomerations [78]. Adopting an ecosystem service perspective in the assessment of nature-based recreation helps to widen the portfolio of actions available for urban planning and to highlight possible synergies with different sectors towards the promotion of multifunctionality in the management of urban green infrastructure [79].
Another key aspect in which the proposed methodology supports the design of planning actions is the explicit distinction between potential and actual opportunities for nature-based recreation. Highlighting the role of facilities and infrastructures to access and to use the areas as a pre-requisite to realize the recreation potential is coherent with studies about recreation in both urban parks and extra-urban areas [43,67,80], and limits causal assumptions that link the presence of green spaces to their use for recreation, which proved to be largely unfounded [81]. Discriminating whether scarce opportunities for nature-based recreation are the consequence of a low recreation potential or the result of scarce availability of facilities and infrastructures supports the selection of appropriate planning and management interventions. For example, in the case study, enhancing opportunities for recreation in the valley floor requires increasing the availability of green spaces with high recreation potential, which will then be easily accessible to the many people living close-by thanks to the existing network of transport infrastructures. On the contrary, in mountain districts, opportunities for nature-based recreation can be improved by creating facilities and infrastructures that make the already-available areas of high recreation potential more accessible and usable.
4.3. Limitations of the Study
The proposed methodology is characterized by some limitations related to both the indicators and the applied methodology. The indicators have intrinsic shortcomings, independent from how the areas suitable for nature-based recreation are identified, hence are equally valid both in the case of urban parks and in the case of areas classified through the ESTIMAP-recreation model. The first aspect to consider when different territorial units are compared is the boundary effect. This may be especially relevant in the quantification of total and per-capita area at the district level, since it neglects the contribution of green spaces that can be used by citizens living in neighboring districts [32]. The second aspect is the use of Euclidean distance as an approximation of road distance. If the road network is not homogeneous and the study area is characterized by altitude variations, the error can be expected to increase and vary across the city [82,83]. However, in our analysis, the results were used only to compare the two types of indicators, which should limit the final error. The distance of 300 m adopted to measure accessibility is also an approximation based on the shorter distance usually considered in studies analyzing pedestrian accessibility to green spaces [30], on the requirements for green space planning set in some cities [35], and on recommendations from international organizations such as the WHO [54]. However, different areas can be expected to be characterized by different distances that visitors are willing to cover to reach them, depending on their features and on the activities that can be carried out [35,41]. Changing the threshold would affect the results of the model [30].
Regarding the local application of the ESTIMAP-recreation model, the elements included in the components of the model are limited to those that were considered the most important by the members of the city lab and the local experts. The selection of these elements is context-specific and restricted to the most relevant, hence it should not be expected to cover the whole range of characteristics affecting the potential and opportunities for nature-based recreation. A wide scientific literature has explored this issue, investigating relevant features of urban parks (e.g., [69,79,84]) and forests (e.g., [85,86]), including both structural features of the areas and presence of facilities. In the local application, defining the role of structural features of urban parks was particularly challenging for the involved experts, and no agreement could be found on what features should be included and how to weight them. The final version of the model accounts only for the dimension of urban parks, which was considered a good proxy of their capacity to provide a suitable place for various nature-based recreational activities.
A final comment regards the interpretation of the synthetic indicators proposed by the ESTIMAP-recreation model. The overall potential and opportunities for nature-based recreation are calculated considering multiple activities that are summed-up as if they were fully interchangeable, although they are carried out by different types of users. The weighting phase allows accounting for the relative importance of the different activities in the local context, but in the end a pocket park with a playground for children may fall in the same class of ROS as an area close to an alpine hut in the mountain. While most green spaces, including both urban parks and forests, are indeed able to support multiple activities, hence to provide a service to multiple types of users, some activities require specific facilities or management practices [67]. A trade-off between a synthetic view able to capture the multiple aspects of nature-based recreation in cities and a detailed mapping of the single nature-based recreational activities and respective settings emerges. The proposed methodology aims to widen the perspective of urban planners and decision-makers from the focus on urban parks to a more comprehensive understanding of nature-based recreation in cities. Future users must be aware of the limitations that this implies and interpret the results accordingly.
4.4. Remarks from the Application Process in the Case Study
The first phase of the methodology required adapting the original ESTIMAP-recreation model developed for EU-wide applications to the case study [44]. The adaptation process required not only adapting the components of the model and respective elements to reflect the specificities of the local context in terms of nature-based recreational activities and green space typologies, but also tailoring the analysis to the decision-making process that the analysis aimed to support, i.e., the planning and management of green infrastructure at the city scale. This adaptation process was carried out thanks to the successful interface established between researchers and local administration within the city-lab, and to the active involvement of local experts. The importance of active knowledge brokering in the context of ecosystem service indicators to support decision-making has already been highlighted in other applications [87]. In Trento, nature-based recreation falls within the competence of different departments of the municipal and provincial administration, whose representatives were invited to contribute to the assessment as local experts. The assessment can therefore be considered a successful exercise of cross-sectoral communication based on the development of a mutual understating, and a first step towards the establishment of a community of practice that is a pre-requisite to successfully manage green infrastructure for the provision of cultural ecosystem services [88]. Within this process, the ESTIMAP-recreation model demonstrated the required flexibility to accommodate knowledge co-production, thus producing indicators that can serve as effective boundary objects [89], with potential benefits that extend beyond their direct use in policy-making [90].
5. Conclusions
While providing all citizens with adequate green spaces for nature-based recreation is among the main goals of green infrastructure planning and management, especially in cities, commonly-adopted indicators that measure the availability and spatial distribution of urban parks offer only a partial view on such a multi-faceted issue. The research investigated to what extent innovative methods considering both the supply and the demand for nature-based recreation from an ecosystem service perspective would improve the way in which it is currently addressed by urban planning. Applying a locally-adapted version of the ESTIMAP-recreation model to Trento allowed for mapping the recreation potential and recreation opportunity spectrum across the whole city, hence quantifying the share of population without adequate access to areas for nature-based recreation. The comparison of the results with indicators limited to urban parks shows significant differences, with clear implications on planning decisions, e.g., in the prioritization of interventions.
The application provided useful information to urban planning, not only by revealing the most deprived areas of the city, but also directing decisions to the most effective interventions, either the increase of green spaces or the enhancement of facilities and infrastructures to access and use recreational areas. Overall, this widens the portfolio of actions that urban planners and local decision-makers can put in place to improve nature-based recreation in cities, and highlights possible synergies with other sectors, such as agriculture, forestry, and protected areas, usually managed according to different goals and at different scales.
Further research is needed on this issue. In the case study, the model could be finetuned and the results of the application could be validated through a more direct involvement of citizens. Interviews and direct observations could provide information about the demand for different nature-based recreational activities and help to identify important features of urban parks to include in the model, as well as site-specific threshold distances to apply in the accessibility analysis. Moreover, further case studies and applications in other socio-ecological contexts are needed to confirm the results.
Nature-based recreation, together with the other cultural ecosystem services, can act as gateway to promote a sustainable planning and management of urban green infrastructure [91]. The proposed methodology appears to be a promising tool to enhance the quality of information on which planning decisions are currently based, but it requires a successful science-policy interface and the establishment of a local community of practice that manages urban green infrastructure towards multifunctionality.
Author Contributions
C.C., G.Z. and D.G. conceived and designed the experiments; C.C. and G.Z. performed the experiments; and C.C., G.Z. and D.G. analyzed the data and wrote the paper.
Funding
This research received no external funding.
Acknowledgments
The authors gratefully acknowledge Arch. Giovanna Ulrici (Comune di Trento) for her valuable contribution to the activities of the city-lab, and all the experts who participated to the study. This research received support from the project EnRoute ‘Enhancing Resilience of Urban Ecosystems through Green Infrastructure’ funded by the European Commission. Map data copyrighted OpenStreetMap contributors and available from https://www.openstreetmap.org.
Conflicts of Interest
The authors declare no conflict of interest.
References
- Haines-Young, R.; Potschin-Young, M. Common International Classification of Ecosystem Services (CICES) V5.1 and Guidance on the Application of the Revised Structure. 2018. Available online: https://cices.eu/ (accessed on 31 July 2018).
- Gómez-Baggethun, E.; Barton, D.N. Classifying and valuing ecosystem services for urban planning. Ecol. Econ. 2013, 86, 235–245. [Google Scholar] [CrossRef]
- Elmqvist, T.; Gómez-Baggethun, E.; Langemeyer, J. Ecosystem Services provided by urban green infrastructure. In Routledge Handbook of Ecosystem Services; Potschin, M., Haines-Young, R., Fish, R., Turner, R.K., Eds.; Routledge: New York, NY, USA, 2016; pp. 452–464. [Google Scholar]
- Bratman, G.N.; Hamilton, J.P.; Hahn, K.S.; Daily, G.C.; Gross, J.J. Nature experience reduces rumination and subgenual prefrontal cortex activation. Proc. Natl. Acad. Sci. USA 2015, 112, 8567–8572. [Google Scholar] [CrossRef] [PubMed]
- Park, B.J.; Tsunetsugu, Y.; Kasetani, T.; Hirano, H.; Kagawa, T.; Sato, M.; Miyazaki, Y. Physiological effects of Shinrin-yoku (taking in the atmosphere of the forest)-using salivary cortisol and cerebral activity as indicators. J. Physiol. Anthropol. 2007, 26, 123–128. [Google Scholar] [CrossRef] [PubMed]
- Bowler, D.E.; Buyung-Ali, L.M.; Knight, T.M.; Pullin, A.S. A systematic review of evidence for the added benefits to health of exposure to natural environments. BMC Public Health 2010, 10, 456. [Google Scholar] [CrossRef] [PubMed]
- Barton, J.; Pretty, J. What is the best dose of nature and green exercise for improving mental health? A multi-study analysis. Environ. Sci. Technol. 2010, 44, 3947–3955. [Google Scholar] [CrossRef] [PubMed]
- Bratman, G.N.; Daily, G.C.; Levy, B.J.; Gross, J.J. The benefits of nature experience: Improved affect and cognition. Landsc. Urban Plan. 2015, 138, 41–50. [Google Scholar] [CrossRef]
- Faber Taylor, A.; Kuo, F.E. Children with Attention Deficits Concentrate Better After Walk in the Park. J. Atten. Disord. 2008, 12, 402–409. [Google Scholar] [CrossRef] [PubMed]
- Dadvand, P.; Nieuwenhuijsen, M.J.; Esnaola, M.; Forns, J.; Basagaña, X.; Alvarez-Pedrerol, M.; Rivas, I.; López-Vicente, M.; Pascual, M.D.; Su, J.; et al. Green spaces and cognitive development in primary schoolchildren. Proc. Natl. Acad. Sci. USA 2015, 112, 7937–7942. [Google Scholar] [CrossRef] [PubMed] [Green Version]
- Kaczynski, A.T.; Henderson, K.A. Environmental Correlates of Physical Activity: A Review of Evidence about Parks and Recreation. Leis. Sci. 2007, 29, 315–354. [Google Scholar] [CrossRef]
- Floyd, M.F.; Bocarro, J.N.; Smith, W.R.; Baran, P.K.; Moore, R.C.; Cosco, N.G.; Edwards, M.B.; Suau, L.J.; Fang, K. Park-based physical activity among children and adolescents. Am. J. Prev. Med. 2011, 41, 258–265. [Google Scholar] [CrossRef] [PubMed]
- Kingsley, J.Y.; Townsend, M. ‘Dig In’ to Social Capital: Community Gardens as Mechanisms for Growing Urban Social Connectedness. Urban Policy Res. 2006, 24, 525–537. [Google Scholar] [CrossRef]
- Westphal, L.M. Urban greening and social benefits: A study of empowerment outcomes. J. Arboric. 2003, 29, 137–147. [Google Scholar]
- Shinew, K.J.; Glover, T.D.; Parry, D.C. Leisure spaces as potential sites for interracial interactions: Community gardens in urban areas. J. Leis. Res. 2004, 36, 336–355. [Google Scholar] [CrossRef]
- Chiesura, A. The role of urban parks for the sustainable city. Landsc. Urban Plan. 2004, 68, 129–138. [Google Scholar] [CrossRef]
- Bertram, C.; Larondelle, N. Going to the woods is going home: Recreational benefits of a larger urban forest site—A travel cost analysis for Berlin, Germany. Ecol. Econ. 2016, 132, 255–263. [Google Scholar] [CrossRef]
- Takano, T.; Nakamura, K.; Watanabe, M. Urban residential environments and senior citizens’ longevity in megacity areas: The importance of walkable green spaces. J. Epidemiol. Community Health 2002, 56, 913–918. [Google Scholar] [CrossRef] [PubMed]
- Zasada, I. Multifunctional peri-urban agriculture—A review of societal demands and the provision of goods and services by farming. Land Use Policy 2011, 28, 639–648. [Google Scholar] [CrossRef]
- Pueffel, C.; Haase, D.; Priess, J.A. Mapping ecosystem services on brownfields in Leipzig, Germany. Ecosyst. Serv. 2018, 30, 73–85. [Google Scholar] [CrossRef]
- Foster, J. Hiding in plain view: Vacancy and prospect in Paris’ Petite Ceinture. Cities 2014, 40, 124–132. [Google Scholar] [CrossRef]
- Caspersen, O.H.; Olafsson, A.S. Recreational mapping and planning for enlargement of the green structure in greater Copenhagen. Urban For. Urban Green. 2010, 9, 101–112. [Google Scholar] [CrossRef]
- Kienast, F.; Degenhardt, B.; Weilenmann, B.; Wäger, Y.; Buchecker, M. GIS-assisted mapping of landscape suitability for nearby recreation. Landsc. Urban Plan. 2012, 105, 385–399. [Google Scholar] [CrossRef]
- Sasidharan, V.; And, F.W.; Godbey, G. Cultural differences in urban recreation patterns: An examination of park usage and activity participation across six population subgroups. Manag. Leis. 2005, 10, 19–38. [Google Scholar] [CrossRef]
- Cortinovis, C.; Geneletti, D. Ecosystem services in urban plans: What is there and what is still needed for better decisions. Land Use Policy 2018, 70, 298–312. [Google Scholar] [CrossRef]
- Wilkinson, C.; Saarne, T.; Peterson, G.D.; Colding, J. Strategic spatial planning and the ecosystem services concept—An historical exploration. Ecol. Soc. 2013, 18, 37. [Google Scholar] [CrossRef]
- Rall, E.L.; Kabisch, N.; Hansen, R. A comparative exploration of uptake and potential application of ecosystem services in urban planning. Ecosyst. Serv. 2015, 16, 230–242. [Google Scholar] [CrossRef]
- Kabisch, N.; Haase, D. Green justice or just green? Provision of urban green spaces in Berlin, Germany. Landsc. Urban Plan. 2014, 122, 129–139. [Google Scholar] [CrossRef]
- Badiu, D.L.; Iojă, C.I.; Pătroescu, M.; Breuste, J.; Artmann, M.; Niță, M.R.; Grădinaru, S.R.; Hossua, C.A.; Onosea, D.A. Is urban green space per capita a valuable target to achieve cities’ sustainability goals? Romania as a case study. Ecol. Indic. 2016, 70, 53–66. [Google Scholar] [CrossRef]
- Kabisch, N.; Strohbach, M.W.; Haase, D.; Kronenberg, J. Urban green space availability in European cities. Ecol. Indic. 2016, 70, 586–596. [Google Scholar] [CrossRef]
- Fuller, R.A.; Gaston, K.J. The scaling of green space coverage in European cities. Biol. Lett. 2009, 5, 352–355. [Google Scholar] [CrossRef] [PubMed] [Green Version]
- Ortiz, M.S.O.; Geneletti, D. Assessing Mismatches in the Provision of Urban Ecosystem Services to Support Spatial Planning: A Case Study on Recreation and Food Supply in Havana, Cuba. Sustainability 2018, 10, 2165. [Google Scholar] [CrossRef]
- Wolch, J.R.; Byrne, J.; Newell, J.P. Urban green space, public health, and environmental justice: The challenge of making cities ‘just green enough’. Landsc. Urban Plan. 2014, 125, 234–244. [Google Scholar] [CrossRef] [Green Version]
- La Rosa, D. Accessibility to greenspaces: GIS based indicators for sustainable planning in a dense urban context. Ecol. Indic. 2014, 42, 122–134. [Google Scholar] [CrossRef]
- Stessens, P.; Khan, A.Z.; Huysmans, M.; Canters, F. Analysing urban green space accessibility and quality: A GIS-based model as spatial decision support for urban ecosystem services in Brussels. Ecosyst. Serv. 2017, 28, 328–340. [Google Scholar] [CrossRef]
- Paracchini, M.L.; Zulian, G.; Kopperoinen, L.; Maes, J.; Schägner, J.P.; Termansen, M.; Zandersen, M.; Perez-Soba, M.; Scholefield, P.A.; Bidoglio, G. Mapping cultural ecosystem services: A framework to assess the potential for outdoor recreation across the EU. Ecol. Indic. 2014, 45, 371–385. [Google Scholar] [CrossRef] [Green Version]
- Schirpke, U.; Meisch, C.; Marsoner, T.; Tappeiner, U. Revealing spatial and temporal patterns of outdoor recreation in the European Alps and their surroundings. Ecosyst. Serv. 2018, 31, 336–350. [Google Scholar] [CrossRef]
- Ala-Hulkko, T.; Kotavaara, O.; Alahuhta, J.; Helle, P.; Hjort, J. Introducing accessibility analysis in mapping cultural ecosystem services. Ecol. Indic. 2016, 66, 416–427. [Google Scholar] [CrossRef]
- Baró, F.; Palomo, I.; Zulian, G.; Vizcaino, P.; Haase, D.; Gómez-Baggethungh, E. Mapping ecosystem service capacity, flow and demand for landscape and urban planning: A case study in the Barcelona metropolitan region. Land Use Policy 2016, 57, 405–417. [Google Scholar] [CrossRef]
- Rall, E.L.; Bieling, C.; Zytynska, S.; Haase, D. Exploring city-wide patterns of cultural ecosystem service perceptions and use. Ecol. Indic. 2017, 77, 80–95. [Google Scholar] [CrossRef]
- Niemelä, J.; Saarela, S.R.; Söderman, T.; Kopperoinen, L.; Yli-Pelkonen, V.; Väre, S.; Kotze, D.J. Using the ecosystem services approach for better planning and conservation of urban green spaces: A Finland case study. Biodivers. Conserv. 2010, 19, 3225–3243. [Google Scholar] [CrossRef]
- Hegetschweiler, K.T.; de Vries, S.; Arnberger, A.; Bell, S.; Brennan, M.; Siter, N.; Olafsson, A.S.; Voigt, A.; Hunziker, M. Linking demand and supply factors in identifying cultural ecosystem services of urban green infrastructures: A review of European studies. Urban For. Urban Green. 2017, 21, 48–59. [Google Scholar] [CrossRef] [Green Version]
- Kulczyk, S.; Woźniak, E.; Derek, M. Landscape, facilities and visitors: An integrated model of recreational ecosystem services. Ecosyst. Serv. 2018, 31, 491–501. [Google Scholar] [CrossRef]
- Zulian, G.; Stange, E.; Woods, H.; Carvalho, L.; Dick, J.; Andrews, C.; Baró, F.; Vizcain, P.; Barton, D.N.; Rusch, G.M.; et al. Practical application of spatial ecosystem service models to aid decision support. Ecosyst. Serv. 2018, 29, 465–480. [Google Scholar] [CrossRef] [PubMed]
- Comune Di Trento. Carta Di Uso Del Suolo/Land Use Map. 2017. Available online: http://www.comune.trento.it/Aree-tematiche/Cartografia/Download/Carta-uso-del-suolo-Open-Data2 (accessed on 1 September 2017).
- Zulian, G.; Paracchini, M.L.; Maes, J.; Liquete Garcia, M.D.C. ESTIMAP: Ecosystem Services Mapping at European Scale; Publications Office of the European Union: Luxembourg, 2013. [Google Scholar]
- Vallecillo, S.; La Notte, A.; Polce, C.; Zulian, G.; Maes, J.; Alexandris, N.; Ferrini, S. Ecosystem Services Accounting: Part. I—Outdoor Recreation and Crop Pollination; Publications Office of the European Union: Luxembourg, 2018. [Google Scholar]
- Liquete, C.; Piroddi, C.; Macías, D.; Druon, J.-N.; Zulian, G. Ecosystem services sustainability in the Mediterranean Sea: Assessment of status and trends using multiple modelling approaches. Sci. Rep. 2016, 6, 34162. [Google Scholar] [CrossRef] [PubMed]
- La Notte, A.; Vallecillo, S.; Polce, C.; Zulian, G.; Maes, J. Implementing an EU System of Accounting for Ecosystems and Their Services. Initial Proposals for the Implementation of Ecosystem Services Accounts; Publications Office of the European Union: Luxembourg, 2017. [Google Scholar]
- Maes, J.; Teller, A.; Erhard, M.; Liquete, C.; Braat, L.; Berry, P.; Lavalle, C.; Egoh, B.; Kristensen, P.; Paracchini, M.L.; et al. Mapping and Assessment of Ecosystems and Their Services: Trends in Ecosystems and Ecosystem Services in the European Union between 2000 and 2010; Publications Office of the European Union: Luxembourg, 2015. [Google Scholar]
- Cortinovis, C.; Geneletti, D. Mapping and assessing ecosystem services to support urban planning: A case study on brownfield regeneration. One Ecosyst. 2018, 3, e25477. [Google Scholar] [CrossRef]
- Zulian, G.; Thijssen, M.; Maes, J. Enhancing Resilience of Urban Ecosystems through Green Infrastructure (EnRoute) Progress Report; Publication Office of the European Union: Luxembourg, 2018. [Google Scholar]
- Open Street Map Contributors. 2017. Available online: https://www.openstreetmap.org (accessed on 1 September 2017).
- World Health Organization. Urban Green Spaces and Health: A Review of Evidence; WHO Regional Office for Europe: Copenhagen, Denmark, 2016; Available online: http://www.euro.who.int/__data/assets/pdf_file/0005/321971/Urban-green-spaces-and-health-review-evidence.pdf?ua=1 (accessed on 31 July 2018).
- Boscoe, F.P.; Henry, K.A.; Zdeb, M.S. A Nationwide Comparison of Driving Distance Versus Straight-Line Distance to Hospitals. Prof. Geogr. 2012, 64, 188–196. [Google Scholar] [CrossRef] [PubMed] [Green Version]
- Provincia Autonoma di Trento. Piano Urbanistico Provinciale/Urban Plan of the Autonomous Province of Trento. 2017. Available online: http://www.urbanistica.provincia.tn.it/pianificazione/piano_urbanistico_provinciale/cartografia/pagina147.html (accessed on 1 September 2017).
- Provincia Autonoma di Trento. Piano Generale di Utilizzazione delle Acque Pubbliche/General Plan of Public Water Uses. 2006. Available online: http://pguap.provincia.tn.it/ (accessed on 1 September 2017).
- Lando, M.; Gadotti, A. Alberi Maestri Nella Città E Nel Territorio di Trento; Comune di Trento, MUSE: Trento, Italy, 2016; Available online: http://www.comune.trento.it/Comunicazione/Il-Comune-informa/Ultime-notizie/Alberi-maestri-anno-2017 (accessed on 31 July 2018).
- Comune di Trento. Cartografia Verde e Mobilità Sostenibile/Database of Public Green Areas and Sustainable Mobility. 2010. Available online: http://webapps.comune.trento.it/mapaccel/?project=generale&view=verde&locale=it (accessed on 1 September 2017).
- Provincia Autonoma di Trento. Viabilità forestale/Map of Forest Tracks-2nd Edition. 2013. Available online: http://www.territorio.provincia.tn.it/portal/server.pt/community/sgc_-_geocatalogo/862/sgc_-_geocatalogo/32157 (accessed on 1 September 2017).
- Comune di Trento. Stradario del Comune di Trento/Street Map of Trento. 2017. Available online: http://www.comune.trento.it/Aree-tematiche/Cartografia/Download/Stradario-Open-Data2 (accessed on 1 September 2017).
- Provincia Autonoma di Trento. Piste ciclabili/Map of Cycle Paths-2nd Edition. 2010. Available online: http://www.territorio.provincia.tn.it/portal/server.pt/community/sgc_-_geocatalogo/862/sgc_-_geocatalogo/32157 (accessed on 1 September 2017).
- Società Alpinisti Tridentini. I Sentieri SAT del Trentino/SAT Hiking Trails in Trentino. 2017. Available online: https://trentino.webmapp.it/#/?map=12/46.0614/11.1326 (accessed on 1 September 2017).
- Camps-Calvet, M.; Langemeyer, J.; Calvet-Mir, L.; Gómez-Baggethun, E. Ecosystem services provided by urban gardens in Barcelona, Spain: Insights for policy and planning. Environ. Sci. Policy 2015, 62, 14–23. [Google Scholar] [CrossRef]
- Sanon, S.; Hein, T.; Douven, W.; Winkler, P. Quantifying ecosystem service trade-offs: The case of an urban floodplain in Vienna, Austria. J. Environ. Manag. 2012, 111, 159–172. [Google Scholar] [CrossRef] [PubMed]
- Casado-Arzuaga, I.; Onaindia, M.; Madariaga, I.; Verburg, P.H. Mapping recreation and aesthetic value of ecosystems in the Bilbao Metropolitan Greenbelt (northern Spain) to support landscape planning. Landsc. Ecol. 2013, 29, 1393–1405. [Google Scholar] [CrossRef]
- Gundersen, V.S.; Tangeland, T.; Kaltenborn, B.P. Planning for recreation along the opportunity spectrum: The case of Oslo, Norway. Urban For. Urban Green. 2015, 14, 210–217. [Google Scholar] [CrossRef]
- Wolff, S.; Schulp, C.J.E.; Verburg, P.H. Mapping ecosystem services demand: A review of current research and future perspectives. Ecol. Indic. 2015, 55, 159–171. [Google Scholar] [CrossRef]
- Voigt, A.; Kabisch, N.; Wurster, D.; Haase, D.; Breuste, J. Structural diversity: A multi-Dimensional approach to assess recreational services in urban parks. Ambio 2014, 43, 480–491. [Google Scholar] [CrossRef] [PubMed]
- Boll, T.; von Haaren, C.; von Ruschkowski, E. The Preference and Actual Use of Different Types of Rural Recreation Areas by Urban Dwellers—The Hamburg Case Study. PLoS ONE 2014, 9, e108638. [Google Scholar] [CrossRef] [PubMed] [Green Version]
- Hamstead, Z.A.; Fisher, D.; Ilieva, R.T.; Wood, S.A.; McPhearson, T.; Kremer, P. Geolocated social media as a rapid indicator of park visitation and equitable park access. Comput. Environ. Urban Syst. 2018, 72, 38–50. [Google Scholar] [CrossRef]
- Donahue, M.L.; Keeler, B.L.; Wood, S.A.; Fisher, D.M.; Hamstead, Z.A.; McPhearson, T. Using social media to understand drivers of urban park visitation in the Twin Cities, MN. Landsc. Urban Plan. 2018, 175, 1–10. [Google Scholar] [CrossRef]
- Balzan, M.; Debono, I. Assessing urban recreation ecosystem services through the use of geocache visitation and preference data: A case-study from an urbanised island environment. OneEcosystem 2018, 3, e24490. [Google Scholar] [CrossRef]
- La Rosa, D.; Spyra, M.; Inostroza, L. Indicators of Cultural Ecosystem Services for urban planning: A review. Ecol. Indic. 2015, 61, 74–89. [Google Scholar] [CrossRef]
- Albert, C.; Galler, C.; Hermes, J.; Neuendorf, F.; Von Haaren, C.; Lovett, A. Applying ecosystem services indicators in landscape planning and management: The ES-in-Planning framework. Ecol. Indic. 2015, 61, 100–113. [Google Scholar] [CrossRef]
- Baró, F.; Gómez-Baggethun, E.; Haase, D. Ecosystem service bundles along the urban-rural gradient: Insights for landscape planning and management. Ecosyst. Serv. 2017, 24, 147–159. [Google Scholar] [CrossRef]
- Panno, A.; Carrus, G.; Lafortezza, R.; Mariani, L.; Sanesi, G. Nature-based solutions to promote human resilience and wellbeing in cities during increasingly hot summers. Environ. Res. 2017, 159, 249–256. [Google Scholar] [CrossRef] [PubMed]
- Schirpke, U.; Scolozzi, R.; Da Re, R.; Masiero, M.; Pellegrino, D.; Marino, D. Recreational ecosystem services in protected areas: A survey of visitors to Natura 2000 sites in Italy. J. Outdoor Recreat. Tour. 2018, 21, 39–50. [Google Scholar] [CrossRef]
- Hansen, R.; Pauleit, S. From multifunctionality to multiple ecosystem services? A conceptual framework for multifunctionality in green infrastructure planning for Urban Areas. Ambio 2014, 43, 516–529. [Google Scholar] [CrossRef] [PubMed]
- McCormack, G.R.; Rock, M.; Toohey, A.M.; Hignell, D. Characteristics of urban parks associated with park use and physical activity: A review of qualitative research. Health Place 2010, 16, 712–726. [Google Scholar] [CrossRef] [PubMed]
- Eigenbrod, F.; Armsworth, P.R.; Anderson, B.J.; Heinemeyer, A.; Gillings, S.; Roy, D.B.; Thomas, C.D.; Gaston, K.J. The impact of proxy-based methods on mapping the distribution of ecosystem services. J. Appl. Ecol. 2010, 47, 377–385. [Google Scholar] [CrossRef] [Green Version]
- Gonçalves, D.N.S.; Gonçalves, C.D.M.; Assis, T.F.; De Silva, M.A. Analysis of the difference between the euclidean distance and the actual road distance in Brazil. Transp. Res. Procedia 2014, 3, 876–885. [Google Scholar] [CrossRef]
- Carling, K.; Han, M.; Håkansson, J. Does Euclidean distance work well when the p-median model is applied in rural areas? Ann. Oper. Res. 2012, 201, 83–97. [Google Scholar] [CrossRef]
- Massoni, E.S.; Barton, D.N.; Rusch, G.M.; Gundersen, V. Bigger, more diverse and better? Mapping structural diversity and its recreational value in urban green spaces. Ecosyst. Serv. 2018, 31, 502–516. [Google Scholar] [CrossRef]
- Edwards, D.; Jay, M.; Jensen, F.S.; Lucas, B.; Marzano, M.; Montagné, C.; Weiss, G.; Marzano, M. Public preferences for structural attributes of forests: Towards a pan-European perspective. For. Policy Econ. 2012, 19, 12–19. [Google Scholar] [CrossRef]
- Gundersen, V.S.; Frivold, L.H. Public preferences for forest structures: A review of quantitative surveys from Finland, Norway and Sweden. Urban For. Urban Green. 2008, 7, 241–258. [Google Scholar] [CrossRef]
- Saarela, S.-R.; Rinne, J. Knowledge brokering and boundary work for ecosystem service indicators. An urban case study in Finland. Ecol. Indic. 2015, 61, 49–62. [Google Scholar] [CrossRef]
- Palacios-Agundez, I.; Peña, L.; Ametzaga-Arregi, I.; Rodríguez-Loinaz, G.; Onaindia, M. Sustainable landscape management based on cultural ecosystem services. Chang. Adapt. Soc.-Ecol. Syst. 2017, 3, 103–110. [Google Scholar] [CrossRef] [Green Version]
- Turnhout, E. The effectiveness of boundary objects: The case of ecological indicators. Sci. Public Policy 2009, 36, 403–412. [Google Scholar] [CrossRef]
- Sébastien, L.; Bauler, T.; Lehtonen, M. Can Indicators Bridge the Gap between Science and Policy? An Exploration into the (Non)Use and (Non)Influence of Indicators in EU and UK Policy Making. Nat. Cult. 2014, 9, 316–343. [Google Scholar] [CrossRef] [Green Version]
- Andersson, E.; Tengö, M.; McPhearson, T.; Kremer, P. Cultural ecosystem services as a gateway for improving urban sustainability. Ecosyst. Serv. 2015, 12, 165–168. [Google Scholar] [CrossRef]
Figure 1.
Main land uses in Trento [45] and the 16 districts used as spatial units for the analysis. In brackets: number of residents in each district (December 2014).
Figure 1.
Main land uses in Trento [45] and the 16 districts used as spatial units for the analysis. In brackets: number of residents in each district (December 2014).
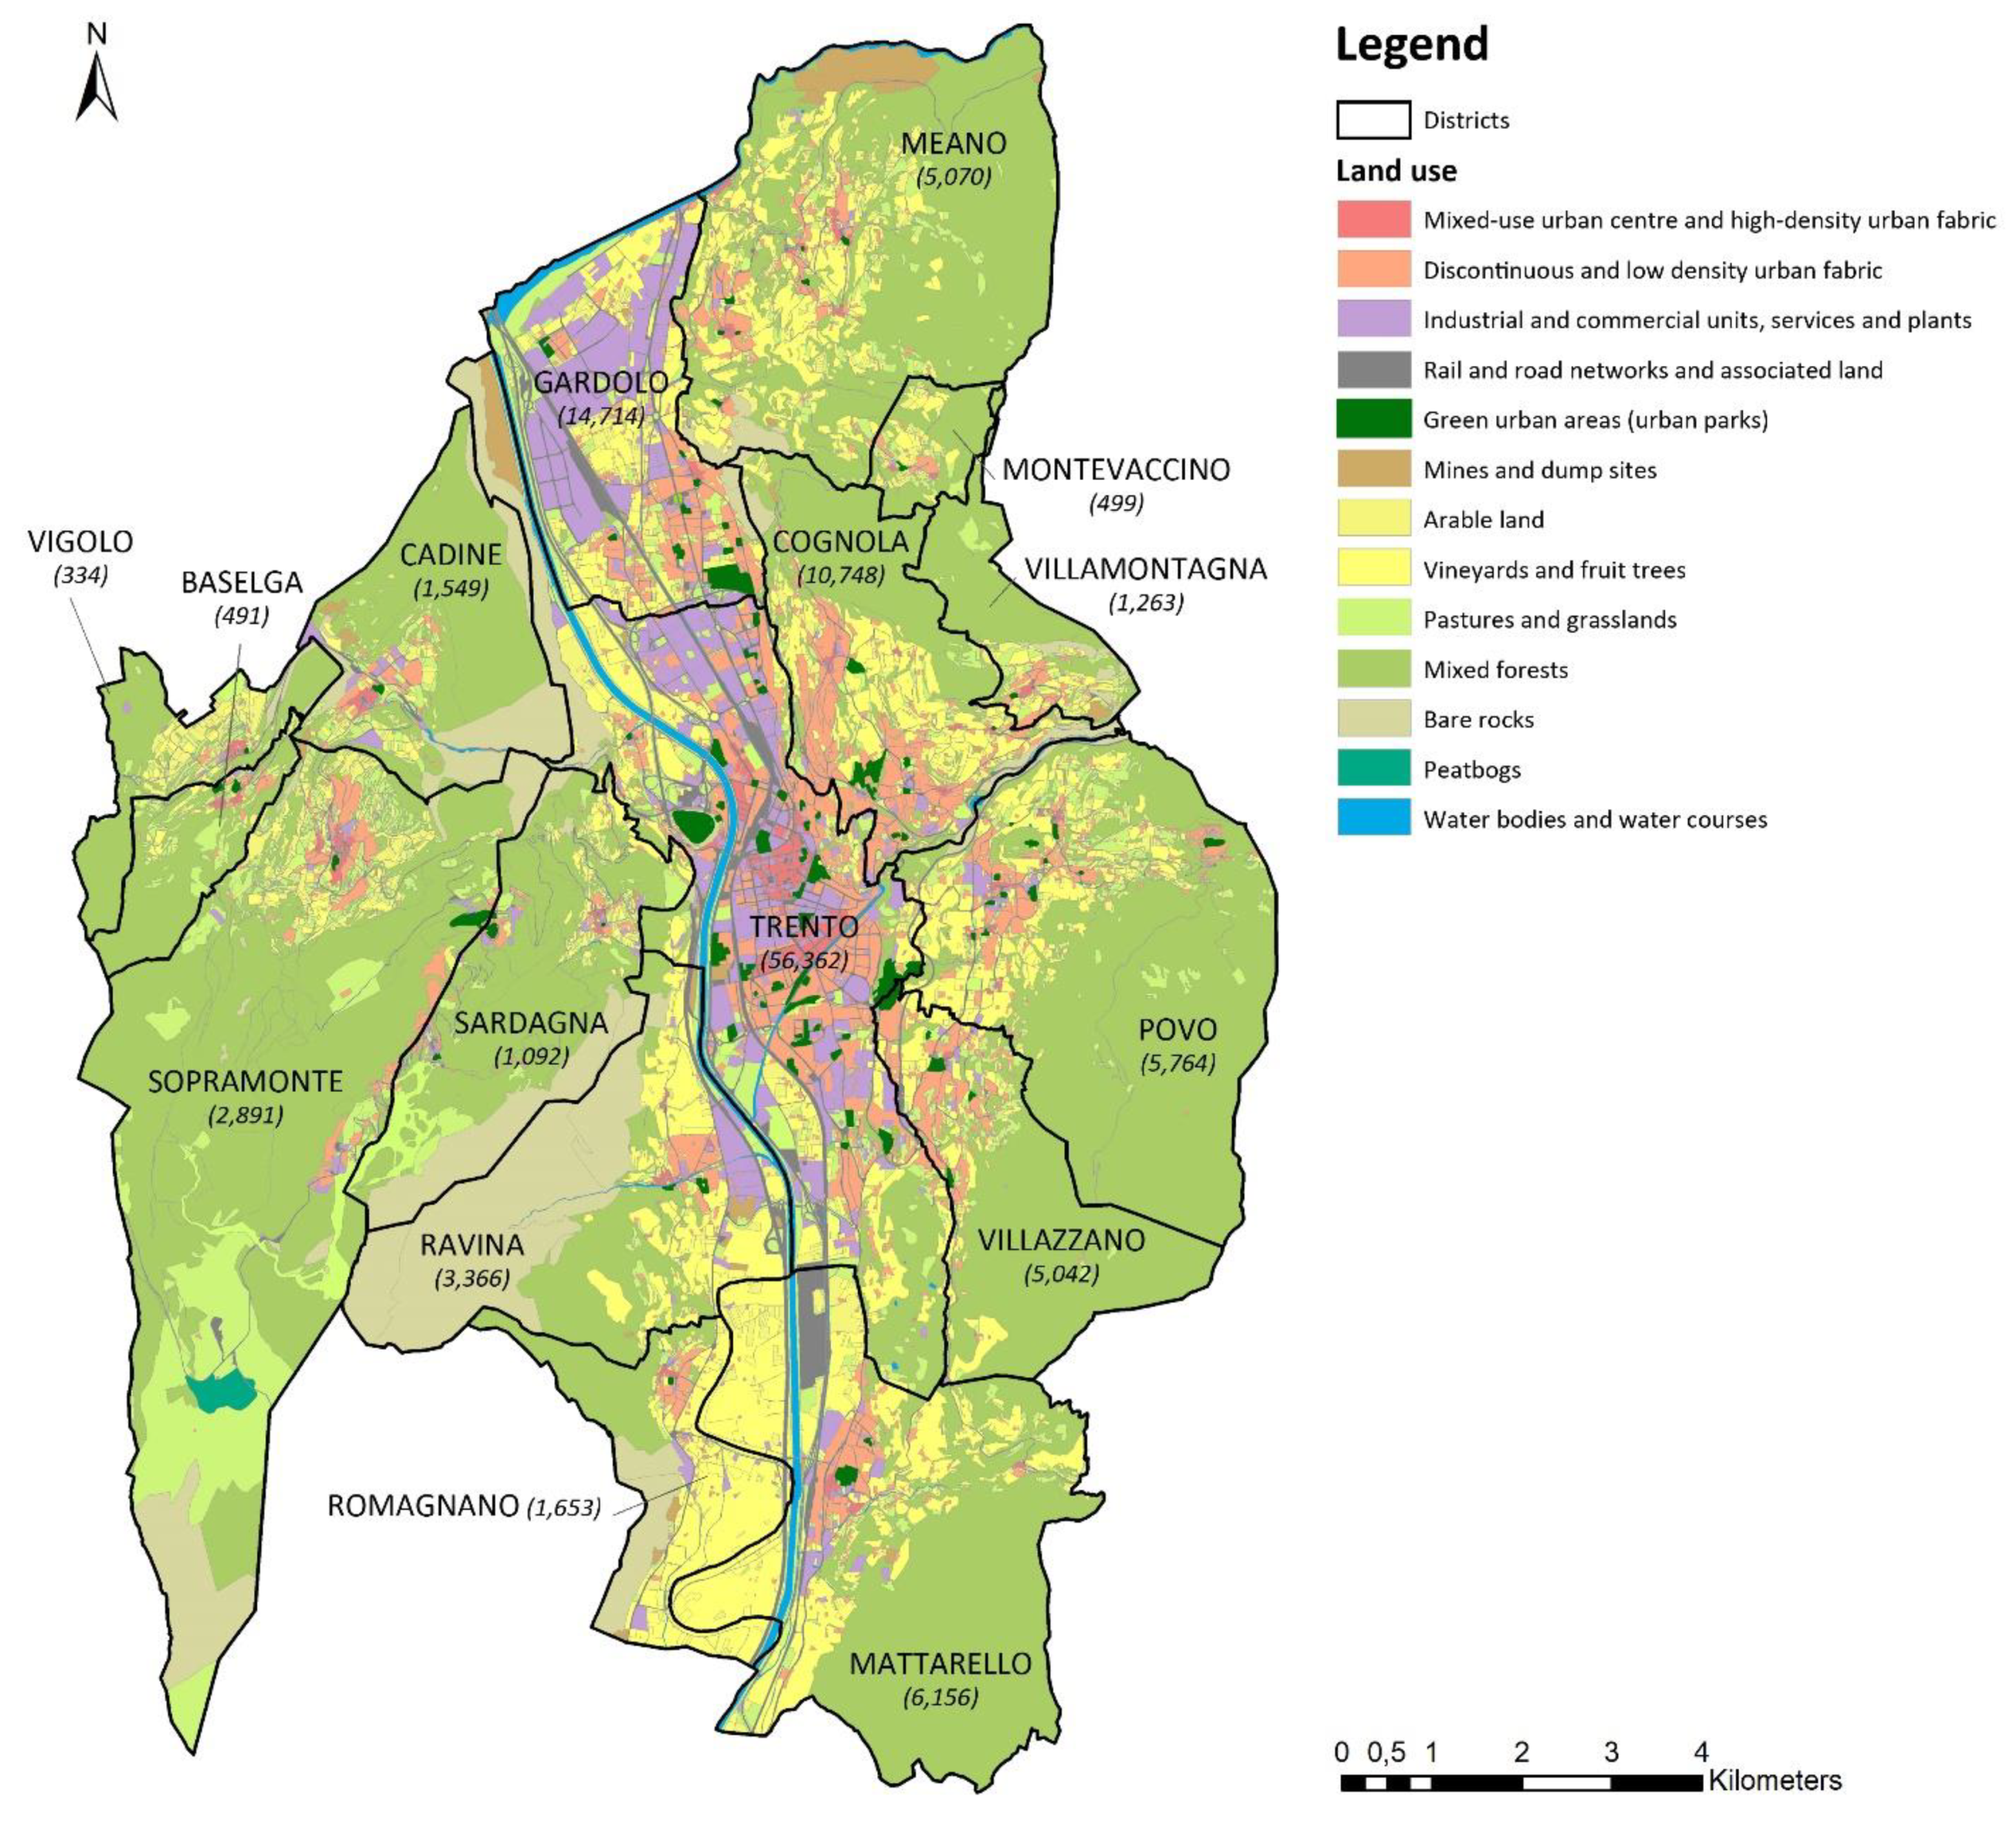
Figure 2.
Flow chart of the adapted version of the ESTIMAP-recreation model applied to analyze nature-based recreation in Trento. Based on Ref. [51], modified after Ref. [46].

Figure 3.
Box-plots showing the distribution of the scores assigned to the different land use classes by local experts. In square brackets are the final normalized scores used to run the model. Colors identify main categories of land uses. * A score of 0.7 was assigned to community gardens. Map data retrieved from the Land Use Map of the city of Trento [45].
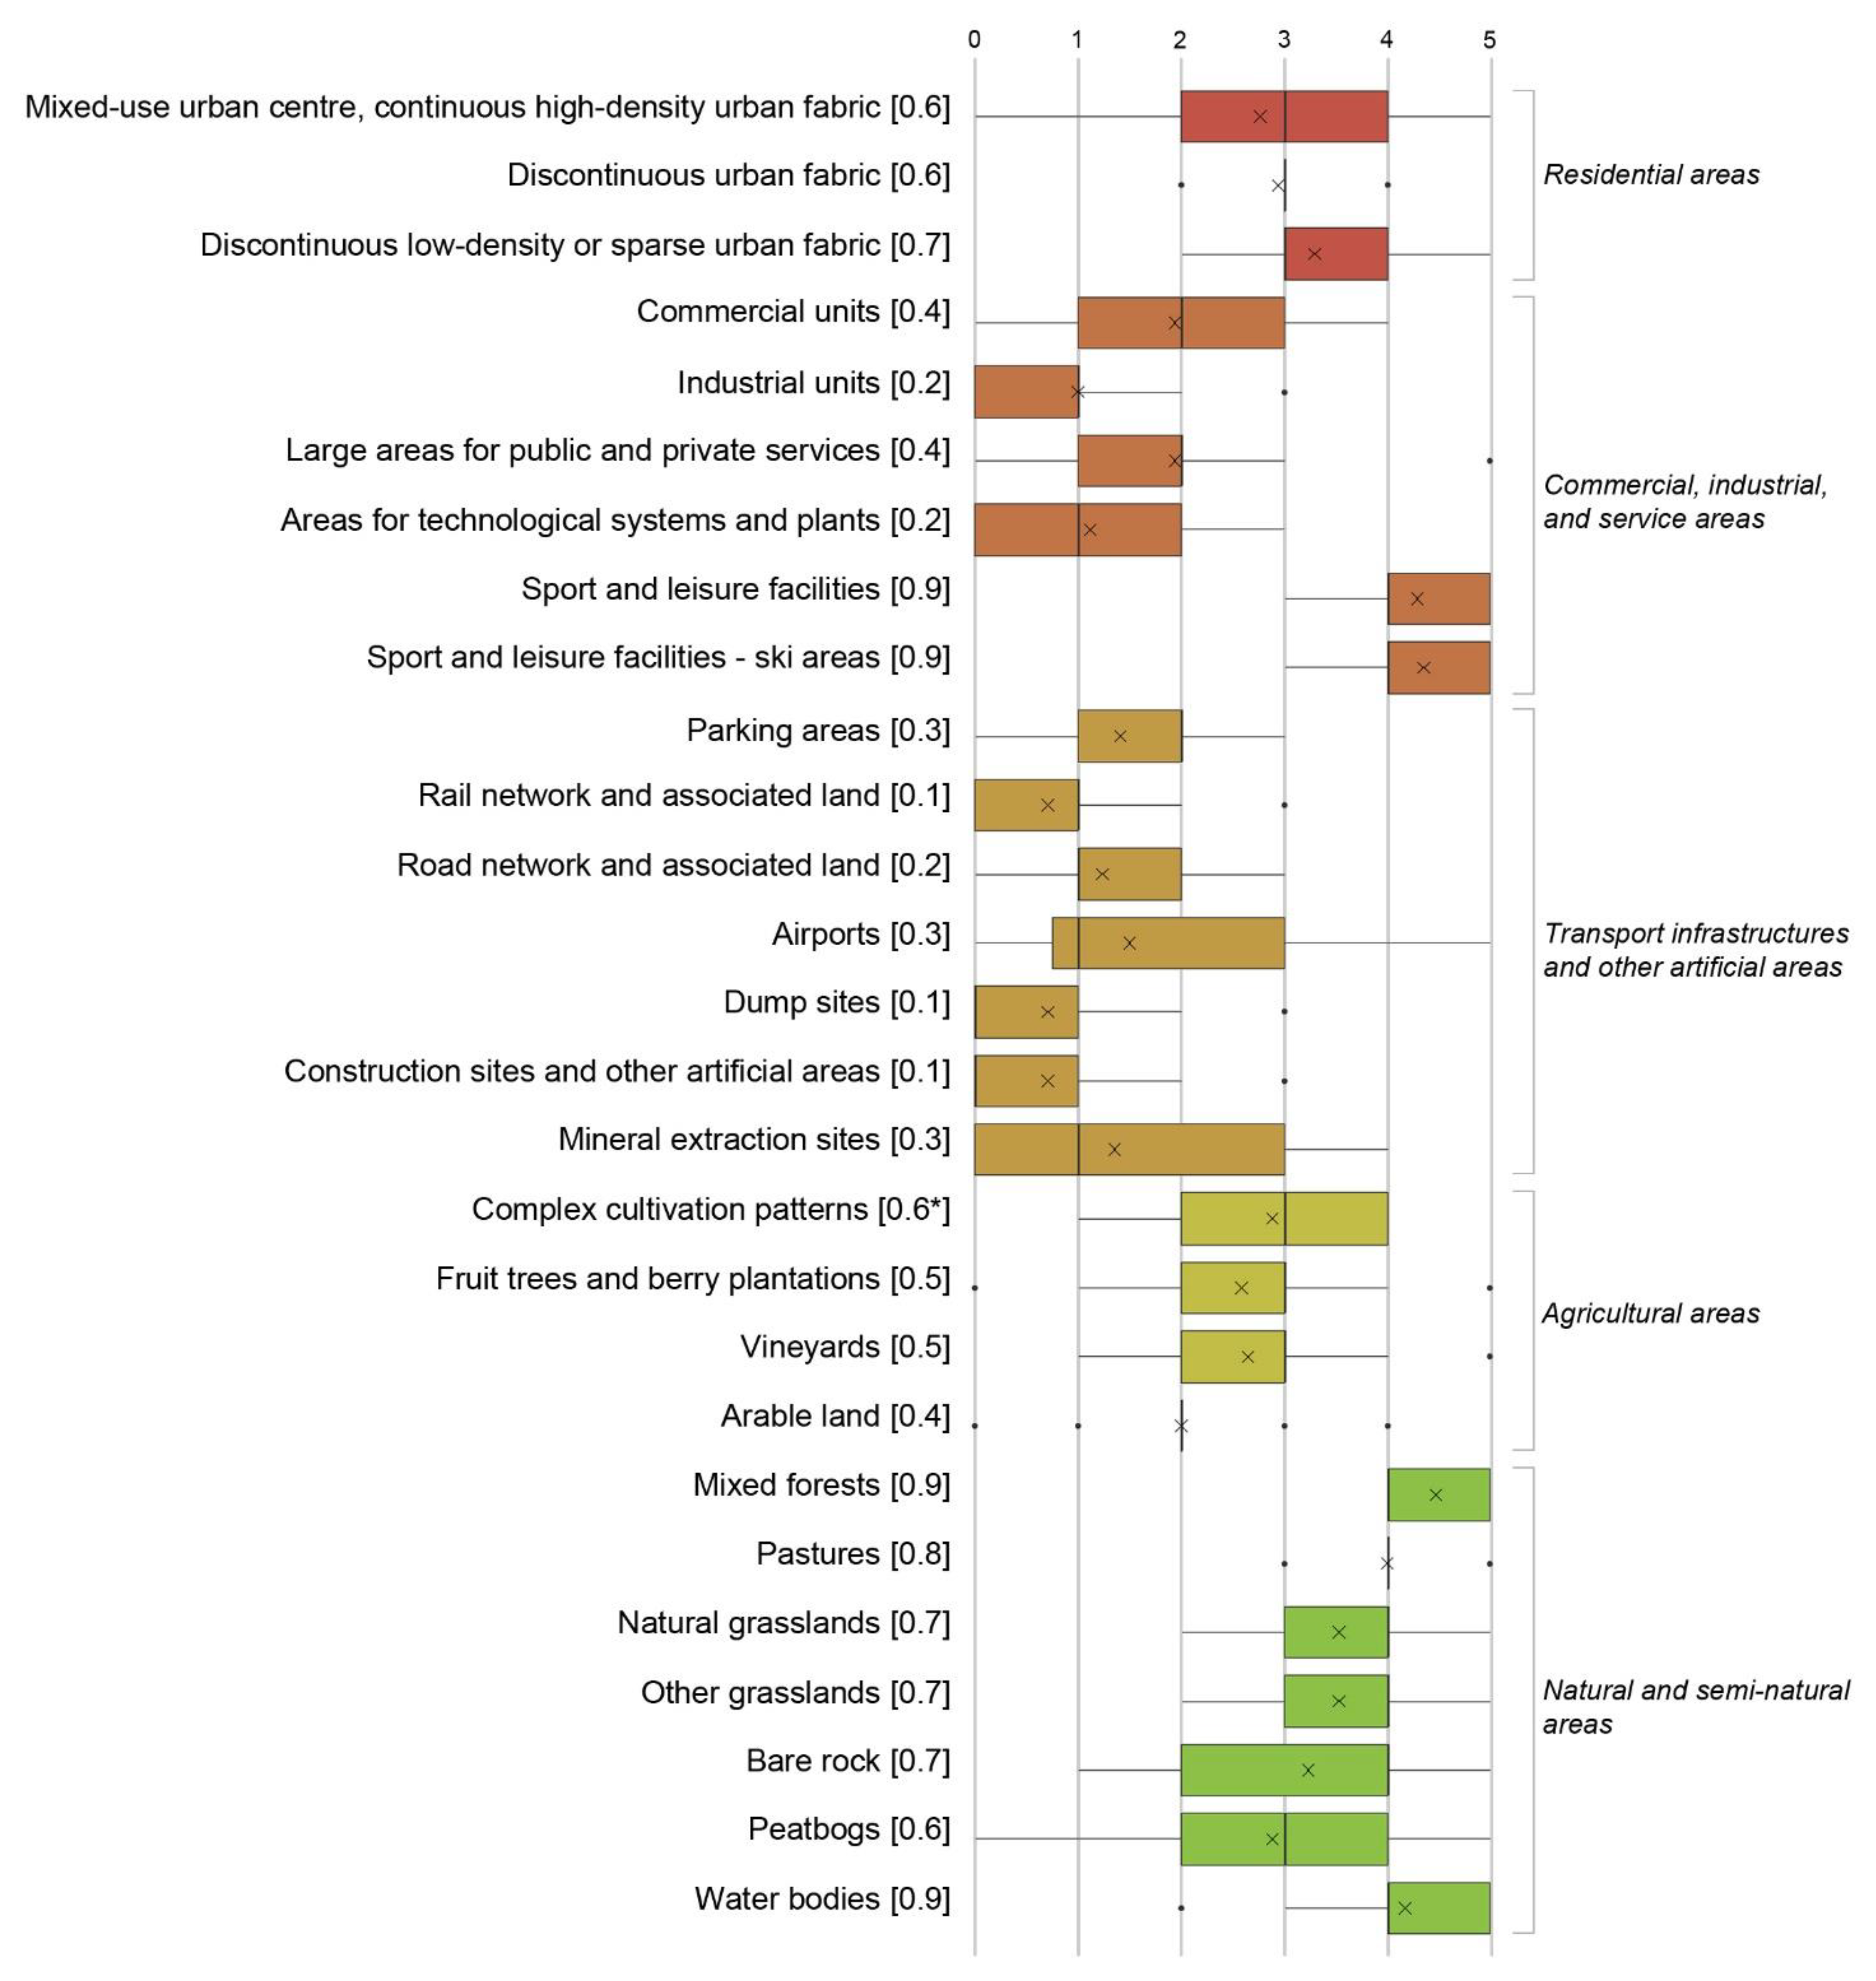
Figure 4.
Box-plots showing the distribution of the scores assigned to the components of recreation potential by local experts. In square brackets are the final normalized scores used to run the model. Colors identify main categories of data. Data sources: (a) [56]; (b) [53]; (c) [57]; (d) [45]; (e) [58]; and (f) [59].
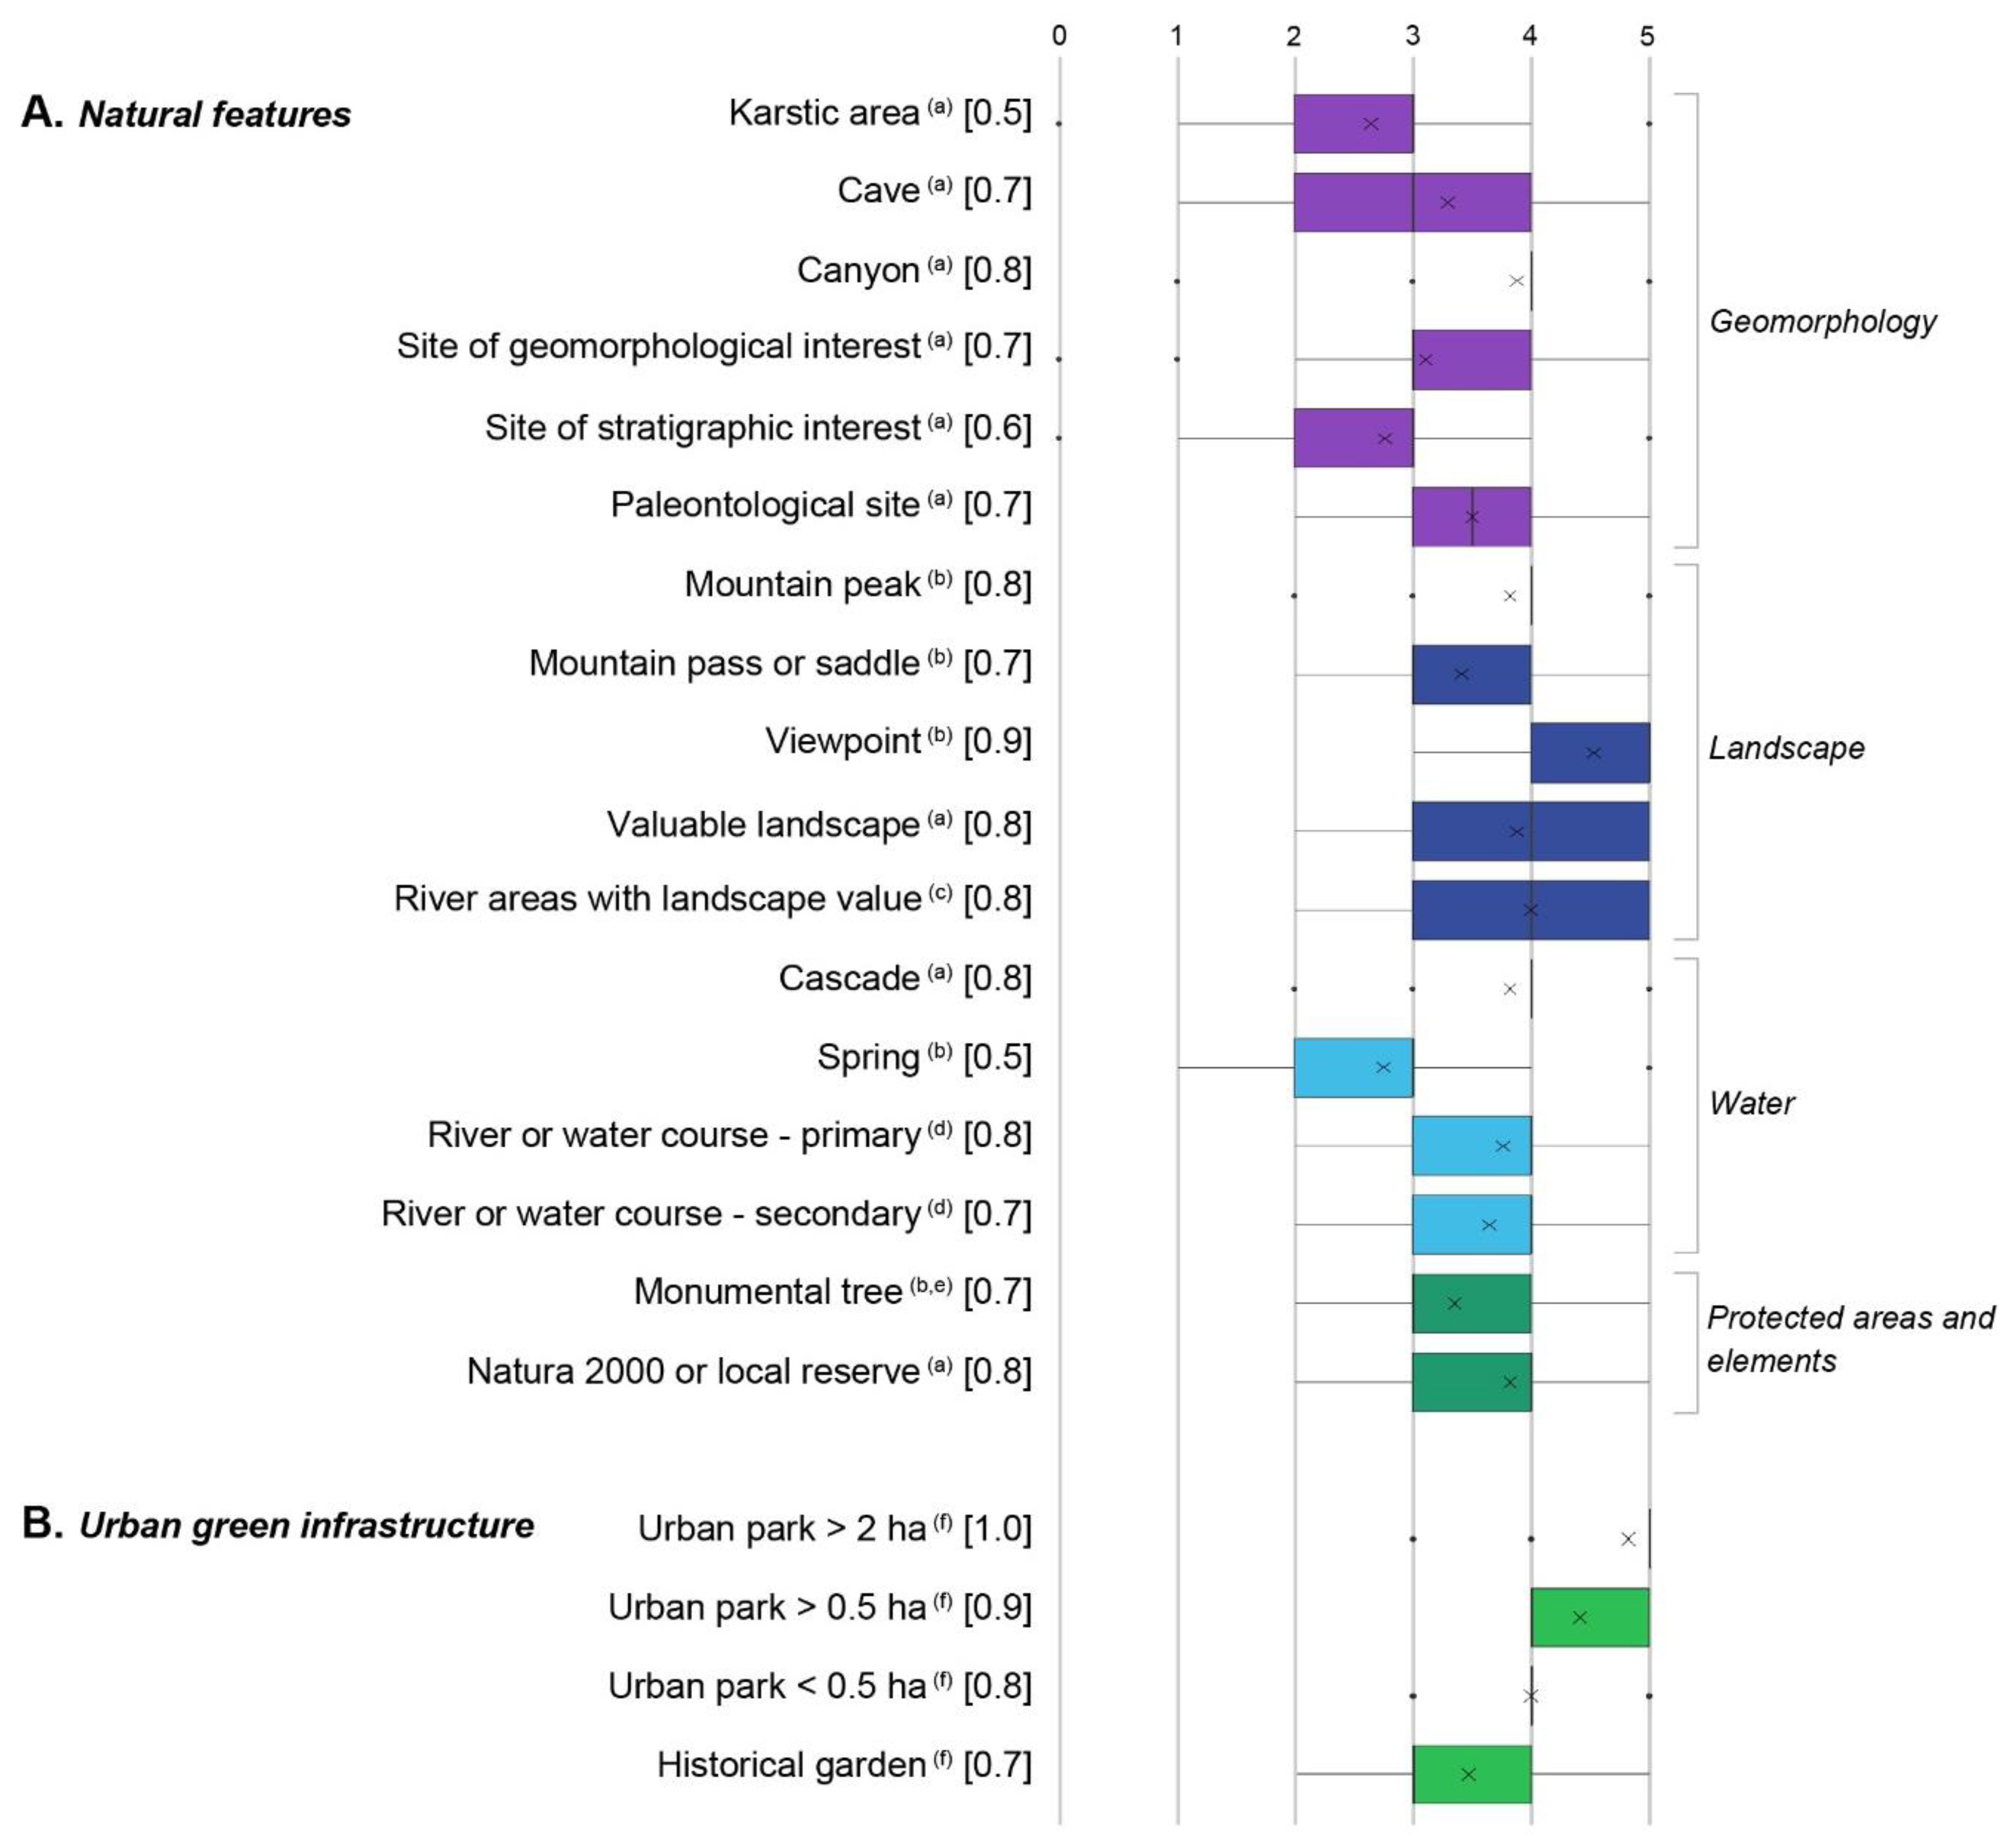
Figure 5.
Box-plots showing the distribution of the scores assigned to access-related and use-related facilities and infrastructures by local experts. In square brackets are the final normalized scores used to run the model. Colors identify main categories of data. Data sources: (a) [53]; (b) [59]; (c) [60]; (d) [61]; (e) [62]; and (f) [63].
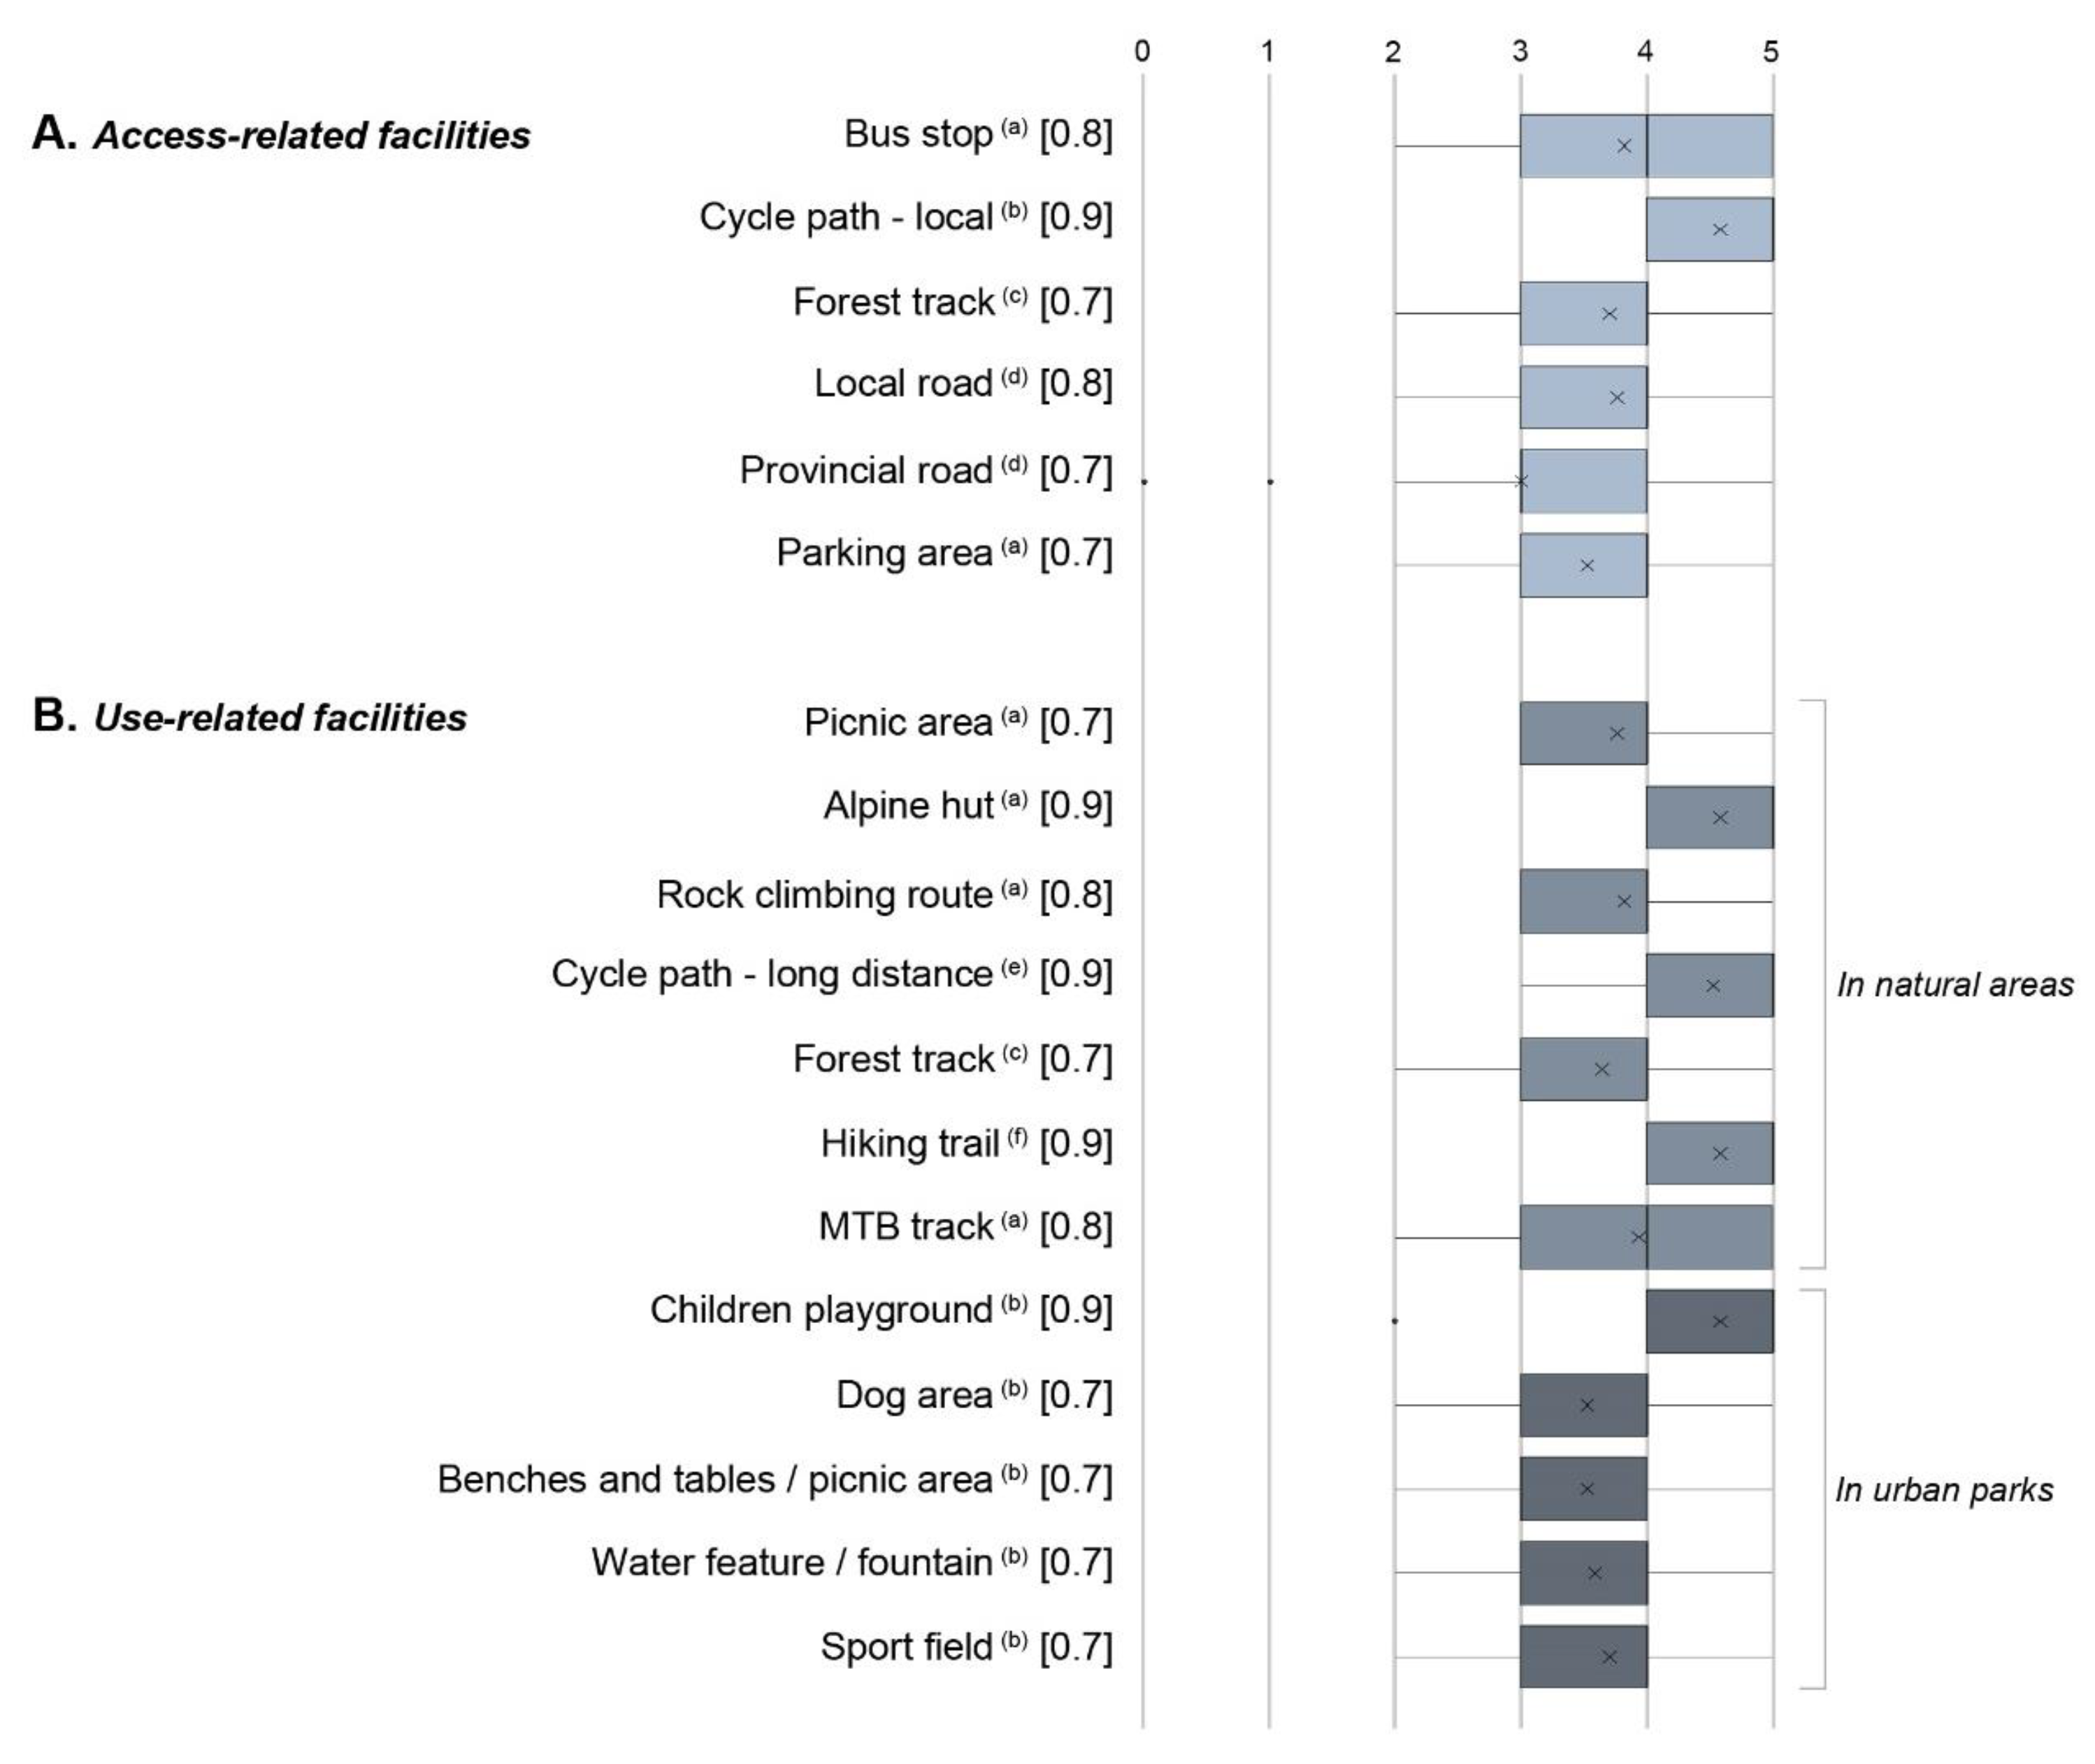
Figure 6.
Maps of (a) Recreation Potential (RP) and (b) Recreation Opportunity Spectrum (ROS) in the city of Trento.
Figure 6.
Maps of (a) Recreation Potential (RP) and (b) Recreation Opportunity Spectrum (ROS) in the city of Trento.

Figure 7.
Percentage of district area classified in each class of ROS.

Figure 8.
Share of population with access to urban parks and to other areas in the highest class of ROS.
Figure 8.
Share of population with access to urban parks and to other areas in the highest class of ROS.

Table 1.
District-level comparison among values of total and per-capita area of urban parks and total and per-capita area in the highest class of ROS.
Table 1.
District-level comparison among values of total and per-capita area of urban parks and total and per-capita area in the highest class of ROS.
| District | District Area [ha] | Urban Parks [m2] | Areas in the Highest Class of ROS [m2] | Population | Per-Capita Area of Urban Parks [m2/person] | Per-Capita Area in the Highest Class of ROS [m2/person] |
|---|---|---|---|---|---|---|
| Baselga | 246.67 | 11,017 | 103,602 | 491 | 22.4 | 211.0 |
| Cadine | 727.47 | 5554 | 971,173 | 1549 | 3.6 | 627.0 |
| Cognola | 862.44 | 78,869 | 2,022,433 | 10,748 | 7.3 | 188.2 |
| Gardolo | 881.80 | 141,625 | 451,480 | 14,714 | 9.6 | 30.7 |
| Mattarello | 1640.96 | 35,083 | 920,576 | 6156 | 5.7 | 149.5 |
| Meano | 1571.93 | 13,703 | 1,477,611 | 5070 | 2.7 | 291.4 |
| Montevaccino | 154.10 | 1720 | 291,564 | 499 | 3.4 | 584.3 |
| Povo | 1542.57 | 38,335 | 2,997,208 | 5764 | 6.7 | 520.0 |
| Ravina | 1138.51 | 10,456 | 643,260 | 3366 | 3.1 | 191.1 |
| Romagnano | 530.27 | 1756 | 124,082 | 1653 | 1.1 | 75.1 |
| Sardagna | 866.33 | 15,016 | 2,014,200 | 1092 | 13.8 | 1844.5 |
| Sopramonte | 2414.17 | 45,333 | 4,002,694 | 2891 | 15.7 | 1384.5 |
| Trento | 1863.53 | 471,375 | 1,552,321 | 56,362 | 8.4 | 27.5 |
| Vigolo | 306.64 | 986 | 196,252 | 334 | 3.0 | 587.6 |
| Villamontagna | 302.68 | 2111 | 1,558,512 | 1263 | 1.7 | 1234.0 |
| Villazzano | 734.28 | 63,251 | 1,622,761 | 5042 | 12.5 | 321.8 |
| Total (city) | 15,784.34 | 936,191 | 20,949,729 | 116,994 | 8.0 | 179.1 |
© 2018 by the authors. Licensee MDPI, Basel, Switzerland. This article is an open access article distributed under the terms and conditions of the Creative Commons Attribution (CC BY) license (http://creativecommons.org/licenses/by/4.0/).
Share and Cite
MDPI and ACS Style
Cortinovis, C.; Zulian, G.; Geneletti, D. Assessing Nature-Based Recreation to Support Urban Green Infrastructure Planning in Trento (Italy). Land 2018, 7, 112. https://doi.org/10.3390/land7040112
AMA Style
Cortinovis C, Zulian G, Geneletti D. Assessing Nature-Based Recreation to Support Urban Green Infrastructure Planning in Trento (Italy). Land. 2018; 7(4):112. https://doi.org/10.3390/land7040112
Chicago/Turabian StyleCortinovis, Chiara, Grazia Zulian, and Davide Geneletti. 2018. "Assessing Nature-Based Recreation to Support Urban Green Infrastructure Planning in Trento (Italy)" Land 7, no. 4: 112. https://doi.org/10.3390/land7040112
Note that from the first issue of 2016, this journal uses article numbers instead of page numbers. See further details here.