1. Introduction
Argan (
Argania spinosa) is an endemic tree species in southern Morocco. Argan forests are linked with complex landscapes where human society and the natural environment strongly interact. Recent observations show that argan forests undergo a very slow but steady decrease of tree density and a rapid qualitative degradation [
1,
2]. In parallel, local stakeholders are abandoning traditional usage rights to privatize forest lands as a result of the argan oil boom and socio-economic mutations.
Recently, the scientific community produced a large set of applied models that can be used to predict or explore possible land use/cover change (LUCC) trajectories [
3,
4,
5,
6,
7,
8], vegetation dynamics [
9], crop sequences and bio-economic interactions [
10], land suitability evaluation [
11] and stakeholder preferences for land conservation [
12]. In addition to being a learning tool, LUCC models play an important role in exploring possible future developments in the landscape system. These exploratory and projective capacities allow models to be used as a communication and learning environment for stakeholders involved in land use decision making processes [
13,
14]. Through “
what if” scenarios analysis, land use models can also support land use planning and policy [
15,
16].
A variety of modelling approaches are used for LUCC simulation [
17]. These include: (
1)
Equation based models and system models: The most common mathematical formulation used for these models is sets of equations based on economic theory [
18], linear programming [
10], heuristic solution techniques such as simulated annealing for forest landscape management [
19] or theories of population growth and diffusion over time [
20]. A major drawback of such models is that a numerical or analytical solution of the system of equations must be obtained, limiting the level of complexity that may practically be built into such models [
21]; (
2)
Empirical and statistical techniques include stochastic methods (e.g., Monte Carlo techniques) and a variety of regression techniques such as generalized linear models [
3], logistic models applied to space and more tailored spatial statistical methods [
22,
23].They sometimes incorporate expert judgment with probability techniques, such as Bayesian probability or Dempster-Schaefer theory [
24]. Artificial neural networks approaches can also be classified in this category. (
3)
Cellular models (
CM) include cellular automata (
CA) and Markov models [
25]. CM methods have recently supported many LUCC models [
4,
5,
16], but they hardly incorporate human decision making. (
4)
Agent-Based Models (
ABM) focus on human decision making materialized by agents [
26]. Agents must act according to some model of cognition that links their autonomous goals to the environment through their behaviors. Such models are very data intensive and the specification of realistic agent behavior and diversity is very challenging, especially when it comes to the behavior of the agent at higher levels of organization such as institutions [
5,
16].
In spatially explicit models, geographic space is typically represented as a grid of regular cells. The modelling results may vary according to the cell size [
27], the neighborhood configuration [
28,
29], the stability of the model and its ability to reproduce spatial patterns [
25]. To cope with this scale sensitivity, some authors have used, instead of a regular grid, an irregular tessellation to represent space layer such as Voronoi diagrams [
30] or Delaunay triangle network [
31]. Irregular tessellation has been used with success in CM. One limitation of these approaches, however, is that the polygons do not match the real-world entities composing the landscape as determined by stakeholders’ perceptions. In addition, using a pixel-based approach results in an increased patchiness of the landscape compared to entity-based simulations using land management units such as parcels [
16]. The entity-based landscape models avoid these disadvantages by splitting the landscape into meaningful objects with semantic features.
Land use modelling rarely reflects the uncertainties in stakeholders’ decision making. Deterministic modelling approaches indeed take a single value for each parameter and yield a single prediction of the system response. One way to incorporate uncertainty is probabilistic modelling (e.g., using the Monte Carlo technique), where uncertain input and output parameters are described by probability density functions [
32].
This study aims at developing a decision support system to assess the impact of different incentive mechanisms on the argan forest degradation within a co-management framework. The model simulates the expected change for the next 30 years of land possession by locals and forest stand degradation levels according to three scenarios based on land tenure policy and economic incentives. The three scenarios are compared for their effects on argan forest degradation measured by tree density and qualitative stand degradation level. The proposed modelling approach relies on two keys elements: (i) the use of an entity-based model to represent real-world parcels making the landscape; and (ii) the implementation of stochastic processes to simulate uncertainty and document the variability among model repetitions for the simulated land possession and stand degradation dynamics.
2. Challenges for Argan Forest Conservation
2.1. Brief History of Forest Management in Morocco
Until the beginning of the 20th century, the Moroccan forest policy was non-existent. At that time, the community management (common property management) based on Islamic and traditional rights completely controlled the access and use of various goods and services of the forest. It is only in 1917 that the forest administration was created and that forest and private domains were distinguished. Although usufruct rights were granted to the local population under the forest domain, this led to a deep mistrust between local communities and forest officers and to persistent conflicts between the parties. In the 90s, following the recommendations of the Rio World Summit on Sustainable Development, forest management plans started to be elaborated in collaboration with the local population. This participation was, however, limited to discussions about the infrastructure and social facilities to be developed. In general, the Moroccan forest policy is still empowered by the central administration according to a “top-down” scheme but includes progressively more and more social realities. Local communities are now considered as stakeholders in the land management and forest conservation measures. Nevertheless, the involvement of the local population is not sufficient to stop forest degradation.
2.2. Argan Forest Agro-Sylvo-Pastoral System
Only 10% of the total argan area is currently covered by forest management plans. The lack of natural regrowth and the failure of reforestation are the main challenges for the administration, mostly due to the difficulty of regulating the grazing activity or enforcing closure periods. Most of the time, the actions of the forest officers generate the hostility of the population and local authorities.
Private parcels in the argan region are usually exploited as farmland. On the other hand, the majority of argan parcels are public properties under one of the two traditional users’ management strategies, i.e., “agdal” and “mouchaa”: (i) Trees in agdal areas are assigned to particular users through traditional arrangements within the community that exclusively holds the rights of nut harvesting. Agdal areas are precisely delimited and the related rights are transmitted to heirs; (ii) Mouchaa land is a common forested area, basically a buffer for other categories, where the trees are not assigned to individuals.
Recently, a new kind of agdal, named “managed agdal”, appeared in the region. It can be considered as semi-private zones with permanent restrictions imposed on the grazing rights of the other users. In addition to being illicit possession, this proliferation of “managed agdal” demonstrates the weakening of the community power and a trend towards a more individual management of argan stands resulting from the increasing profits from argan oil.
While user rights are officially recognized, the State remains the legal owner of the trees, which is arguably discouraging users’ investments [
33]. Today, several authors contest the current legislation and claim that more efforts have to be made to gain the trust between users and forest officers [
34], to reform the law towards co-administration of natural resources [
35], rethinking the actual boundaries of the forest domain [
36,
37], to return to the state before delimitation (before the protectorate period) [
38] or to empower local institutions for management [
39].
In short, the argan forest is increasingly seen as an agro-ecosystem where users must be involved in any conservation management strategy. It should be fully managed like an agro-ecosystem, taking into account its peculiarities of combining fruit trees and a pastoral area.
2.3. Experiences of Public/Private Partnership in Natural Resource Management
Incentive and market-based mechanisms (IMBM) have been considered as likely solutions to support the farmers, communities, private companies and other managers of the natural resources to adopt sustainable management practices [
40]. Nevertheless, incentives solely based on market valuation (labels, geographic areas (IGP—Indication Géographique Protégée) or certifications), give most advantage to stakeholders at the tail of the marketing chain compared to the local farmers, who are the effective users of the natural resources. In many cases, these IMBM therefore remain insufficient to encourage the population to invest and be involved in sustainable management practices. The efficiency of these mechanisms could be improved if used in combination with financial incentives that stakeholders profit from directly such as through payment for ecosystem services (PES) [
41,
42]. This however raises some operational issues: how to proceed with the economic incentives? At which level (household or community) and at which land unit (parcel or forest) should the sustainable actions be executed and controlled? How could these incentives insure the involvement of all (beneficiaries and non-beneficiaries)?
The traditional management practices linking local inhabitants to argan trees identify the spatial units (agdal parcels) to successfully set up economic incentives. Nevertheless, because of the deeply embedded mistrust between locals and forest officers, such economic incentives should be coupled with a land tenure policy offering more warranties to locals. Combining economic incentive with ownership recognition could make the difference in adopting conservation and afforestation actions in argan forests.
Public/Private Partnerships (PPP) allowing more flexibility for forest co-management yielded promising results for protecting and developing natural resources. For instance, China’s wastelands policy [
40] and the joint forest management in India [
43] achieved their sustainable objectives. In Morocco, households’ plantations of almond trees on collective domains proved to be successful in the Anti-Atlas Mountain (Tafraout, Ighrem) and the Green Morocco Plan (GMP) promoting the PPP for agricultural lands.
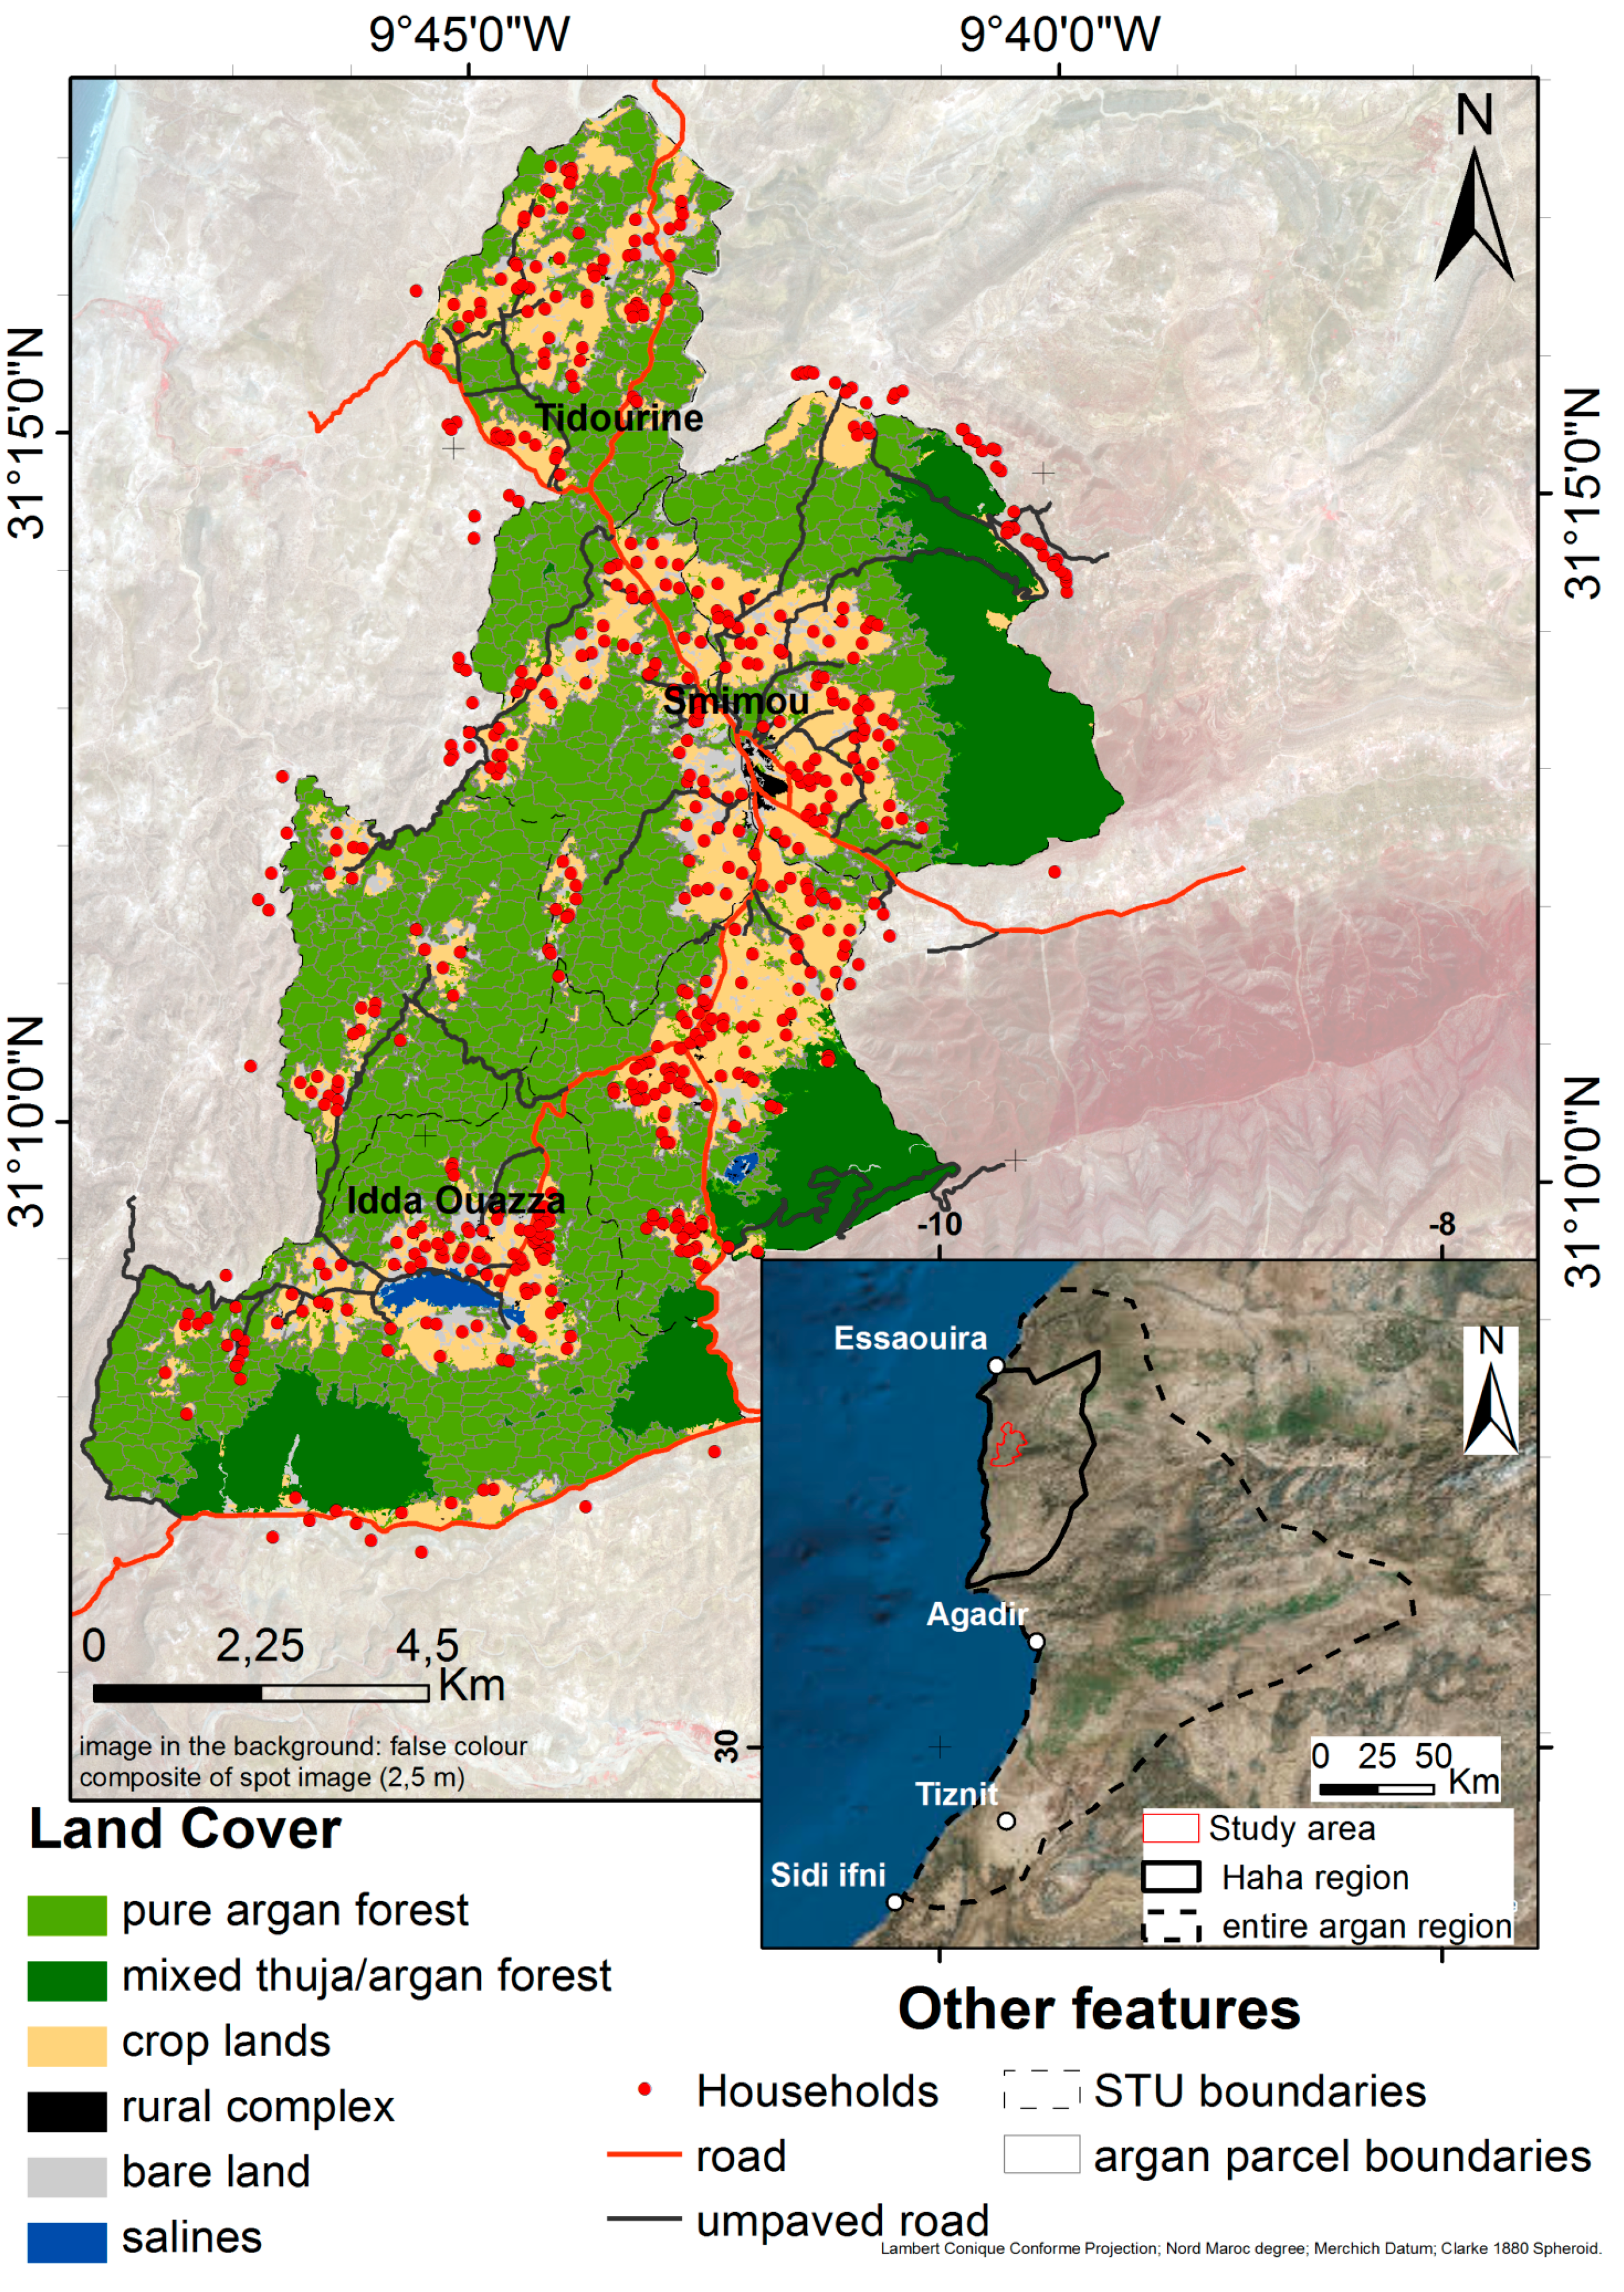
Figure 1.
Study area showing land cover, socio-territorial units (STU) and argan parcels boundaries.
Figure 1.
Study area showing land cover, socio-territorial units (STU) and argan parcels boundaries.
3. Study Area and Related Data
The argan (
Argania spinosa) forest covers about 950,000 ha [
44] bordering the Sahara desert, in Southern Morocco. Argan trees have provided multiple ecosystem goods and services, argan oil being the special flagship product. It became famous for its cosmetic virtues and has been exported at prices up to several hundred dollars a liter to Europe, Japan and the United States for the last two decades.
The study area covers approximately 12,500 ha (
Figure 1) and includes 11 villages corresponding to two rural districts (Smimou and Idda ou Azza). These are located on the Haha plateau, in the northern part of the argan region. The argan tree is the keystone species within the study area and two natural vegetation types (argan and thuja forests) can be distinguished based on their socio-economic roles. Thuja forests (
Tetraclinis articulate sp.) have closed canopies and dominate the upper level of the mountains (Amsiten, Aguirar). They are the main supply for fuel-wood consumption. The pure argan woodlands are agro-sylvo-pastoral systems located at lower elevations. They are generally scattered throughout the undulating landscape with a tree density that varies from 30 to 80 trees/ha.
The study area can be divided into six socio-territorial units (STU) (Tidourine, Ida Ou Talilt, Sidi Brouzekri, Tadart, Id M’barek ou Ahmed, Tourhnist;
Figure 1). A STU is defined as a geographic region exploited by the same community (fraction of the local population linked by relations of solidarity, common interests and specific organization for the exploitation of agro-sylvo-pastoral resources). Benomar [
45] delineated the STUs’ boundaries from village surveys based on ethnic affiliation and herd movements.
4. Methods
4.1. Outline
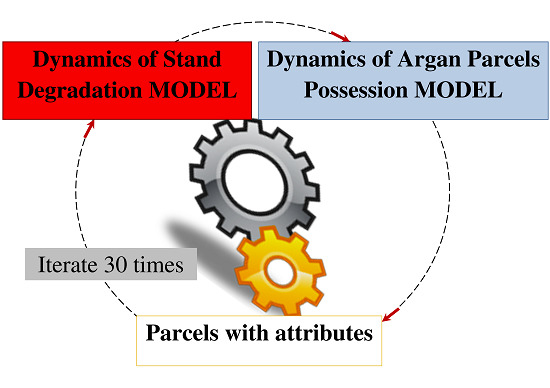
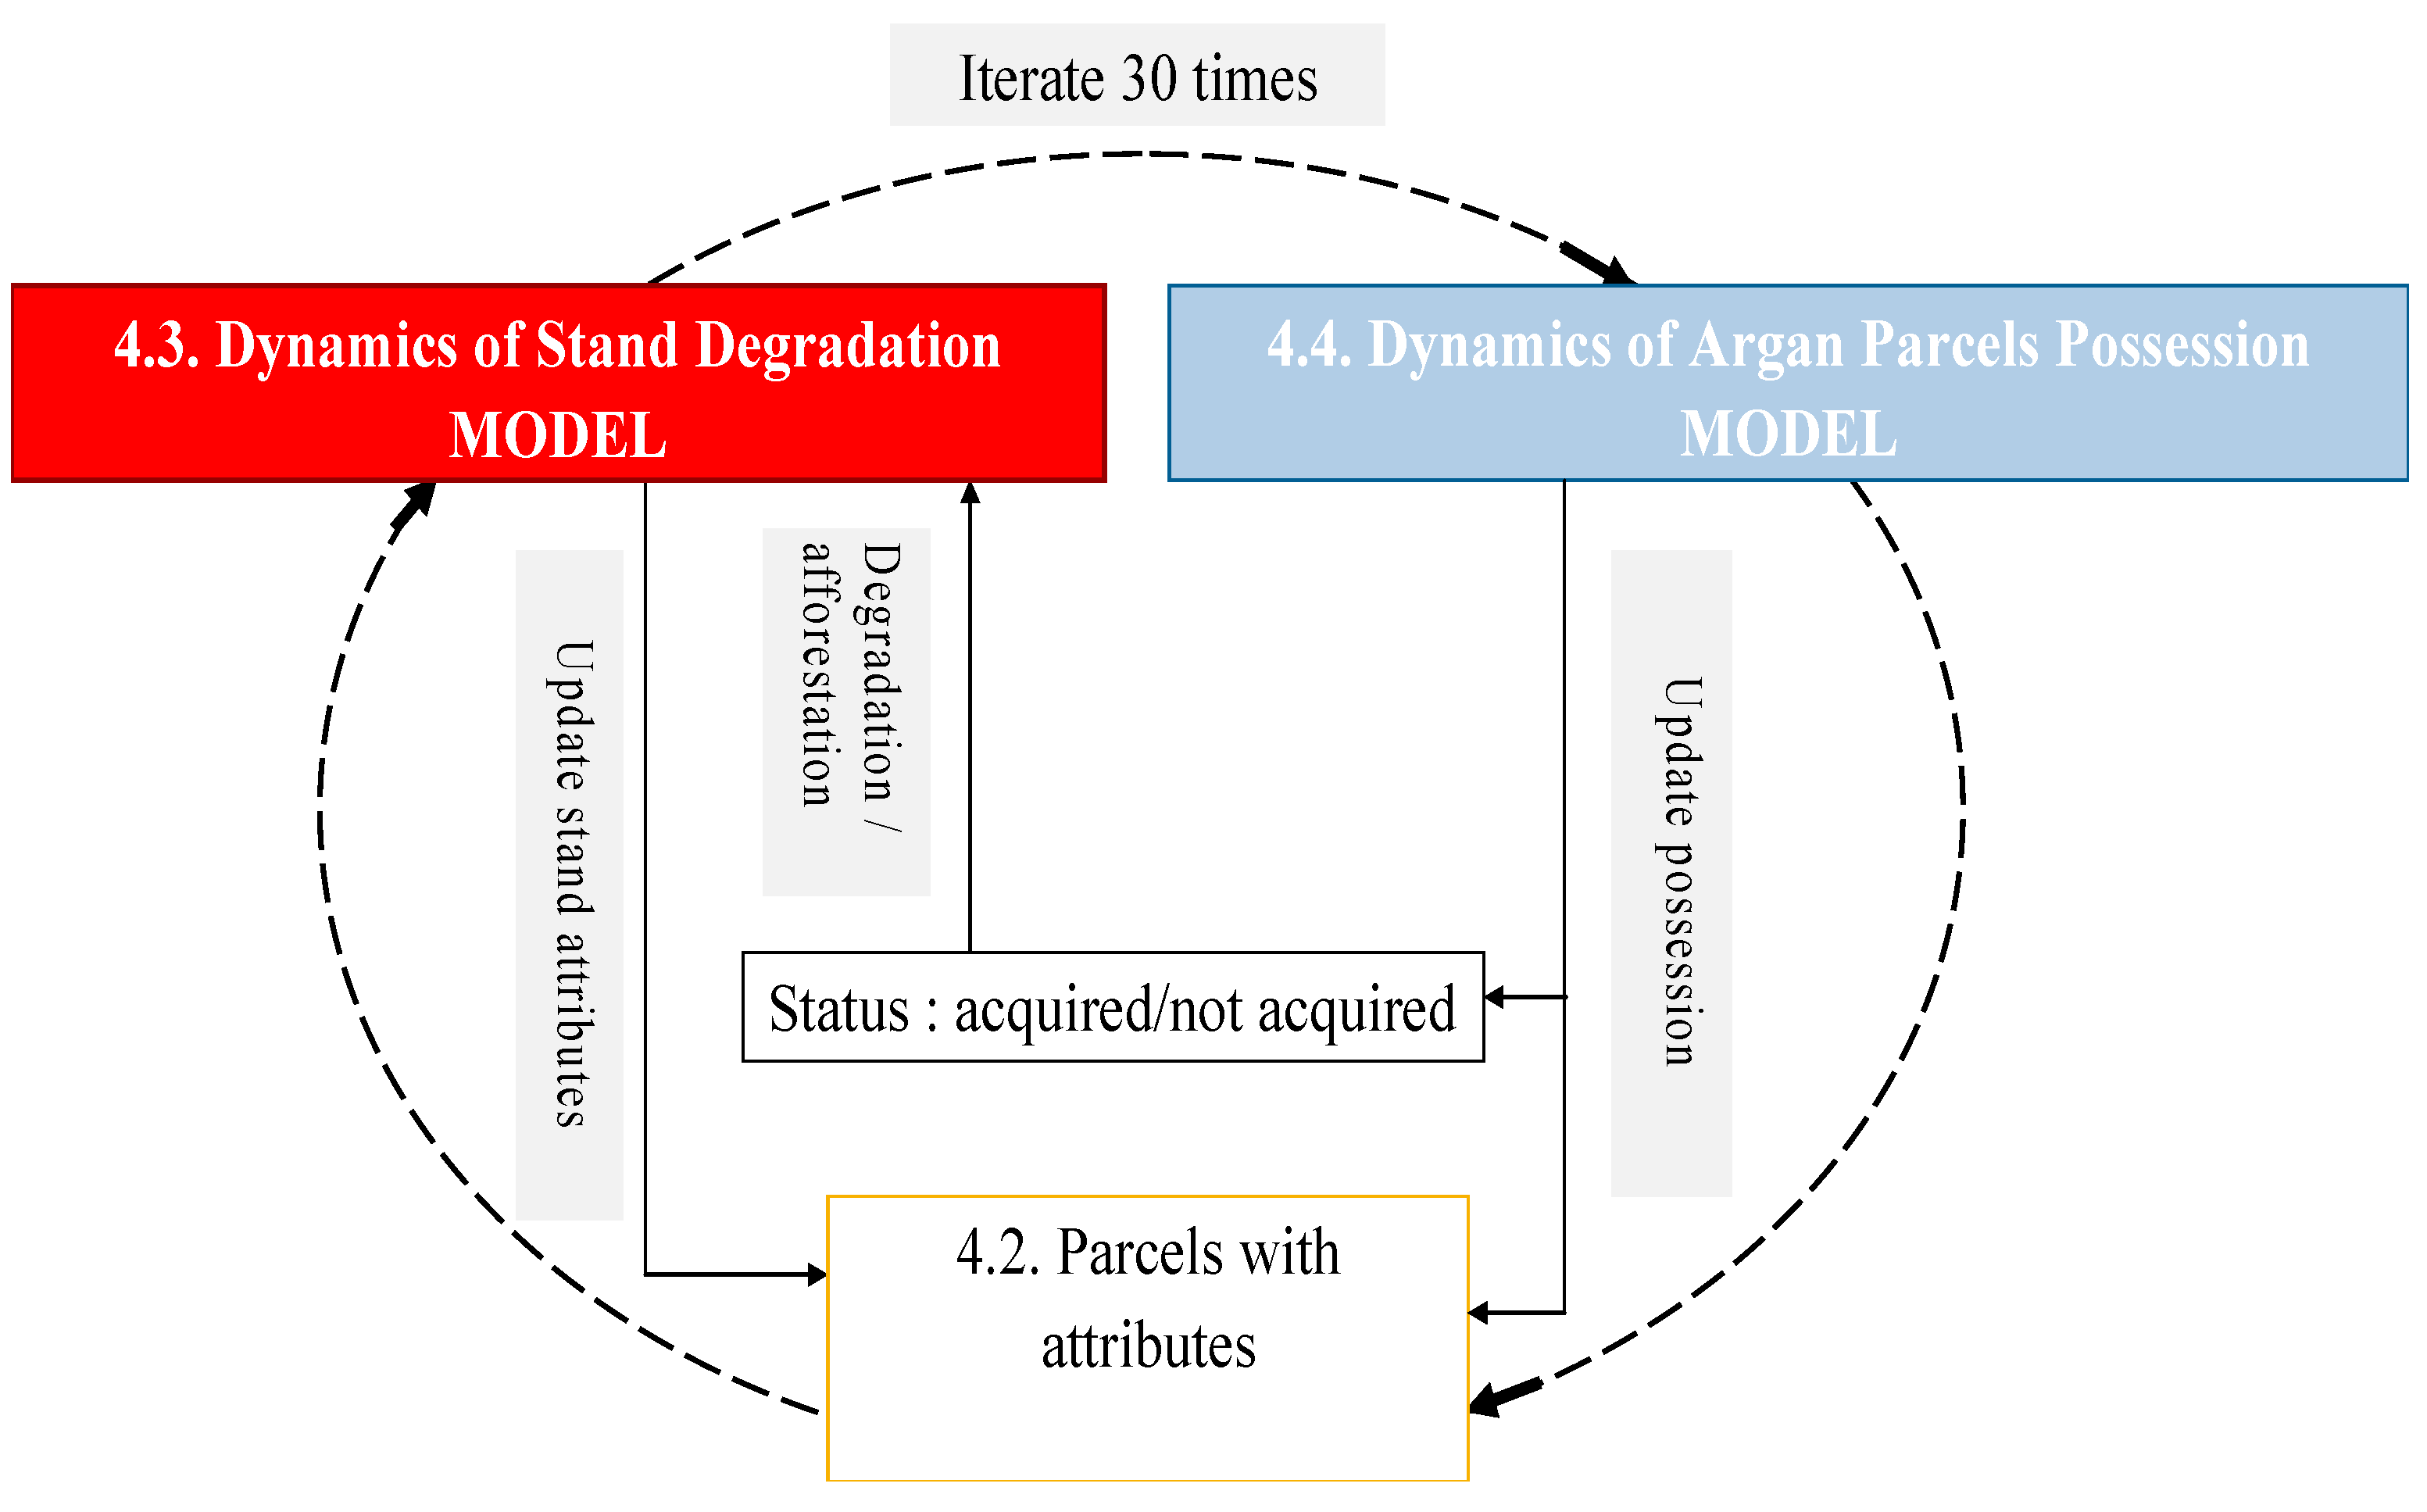
The proposed model (
Figure 2) computes the fate of argan parcels over a 30-year simulation period. Each parcel is initially characterized by a set of attributes related to environmental variables, socio-economic variables and forest stand degradation. At each step, the attributes of the parcels are updated according to two interrelated modules: (i) the argan parcels’ possession; and (ii) the stand degradation. Three scenarios were compared using the model in order to simulate two possible types of land possession dynamics with the current process of illicit possession:
- -
The Business As Usual scenario (BAU scenario) predicts the results of the current dynamic of illicit parcels possession inferred from the “managed agdal”. Farmers protect “their” parcels but are not involved in any kind of afforestation process. Possession and degradation are yearly updated.
- -
The Public/Private Partnership scenario (PPP scenario) is an optimistic scenario that simulates the impact of coupled economic incentive/rights recognition that encourages farmers to plant and protect trees in the newly acquired parcels. The possession of a parcel becomes legal upon condition that it is sustainably managed. Possession and degradation are updated at each step, but afforestation is also included in the forest degradation module.
- -
The Total Disengagement of the Population for forest protection (TDP scenario) corresponds to the pessimistic scenario when no possession (even illegal) occurs. This total disengagement of the local population could happen if the argan trees’ income is significantly low compared to non-farm activities. In this case, only the forest degradation will be updated.
The modules include a stochastic component. The model is therefore repeated 30 times (30 repetitions) and the outputs are summarized using the mean and standard deviation.
Figure 2.
General overview of the core model structure. The modules are described in the next sections (
Section 4.2,
Section 4.3 and
Section 4.4). The forest degradation module is common to all scenarios, while the land possession dynamics is absent from the TDP scenario.
Figure 2.
General overview of the core model structure. The modules are described in the next sections (
Section 4.2,
Section 4.3 and
Section 4.4). The forest degradation module is common to all scenarios, while the land possession dynamics is absent from the TDP scenario.
4.2. Parcel Extraction and Description
Argan parcels boundaries have been automatically generated using an image segmentation algorithm (eCognition software
®) applied to the SPOT-5 scene of July 2008. The parcels boundaries were delineated with a minimum area of 1000 m
2. Despite a small over-segmentation, the extracted boundaries accurately matched the reference boundaries. The attributes of the parcel were then derived from remote sensing and GIS analysis:
A land cover map depicting six classes (i.e., pure argan forest, mixed thuja/argan forest, agricultural lands, bare land, build-up areas and salines) was obtained using object-oriented image classification of the SPOT-5 image. The overall thematic accuracy estimated from a field survey of 200 points was 80%. This information is used to screen out all parcels without argan tree from the analysis.
The stand degradation level in the parcels was defined by two criteria,
i.e, tree density and qualitative degradation level. Argan tree density was estimated based on an automated tree crown detection method and validated with a sample of field plots (
R2= 0.85). A discrete variable was then used to characterize the forest Stand Degradation Level (SDL). Three SDL (slightly degraded, quite degraded and highly degraded) have been derived using the method described in [
46]. The overall accuracy was estimated at 76% using 127 survey plots. All parcels in the region were at least slightly degraded, but a restored class has been added to account for positive change in the future.
Topographic variables (slope, slope exposure and position in the valley) were computed from the GDEM ASTER with 30m ground resolution and ±9.8 m of locally estimated geometric precision [
47].
Household density was derived from a spatial layer showing the point location of the isolated houses (weight = 1) or grouped houses (hamlet) materialized by a point with a so-called weight of habitations (number of houses by hamlet). The layer of house location is digitized from a Quick Bird image with a 0.6 m spatial resolution acquired in 2006. The distance of argan parcels to the nearest household was computed with the same dataset.
Argan parcel scarcity corresponded to the surface of argan forest available within a radius of 1 km from each household
Distance-based variables (i.e., to the farm land, road, and unpaved trail) were obtained from the land cover map and digitized layers of roads and unpaved trails from the satellite image.
Two types of Traditional Land Management (TLM), mouchaa and agdal, were derived from a set of spatial variables (tree density, slope and distance to the household). The accuracy was 67% as estimated from the 127 field observation plots. Another attribute defined the actual possession status (legal or not) by local households.
4.3. Dynamics of Argan Parcel Degradation
Based on field observations, natural regeneration is completely absent in the study area and is not expected to occur as long as the grazing pressure does not decrease. Hence, the tree density will keep decreasing in the absence of plantation. Its evolution was therefore simulated using the rate of change (−2.04% in 22 years) estimated from remote sensing data in the study area [
48]. This density change rate was assumed constant over the whole period and applied to all parcels.
Qualitative degradation dynamics occurs in parcels located in the common domain. Transition matrices for
agdal and
mouchaa were computed from the actual distribution of the stand degradation level (
Appendix A). At each time step, parcels that degrade were selected among those with the upper vulnerability level. The transition probabilities for the
m steps were computed using Markov transition analysis.
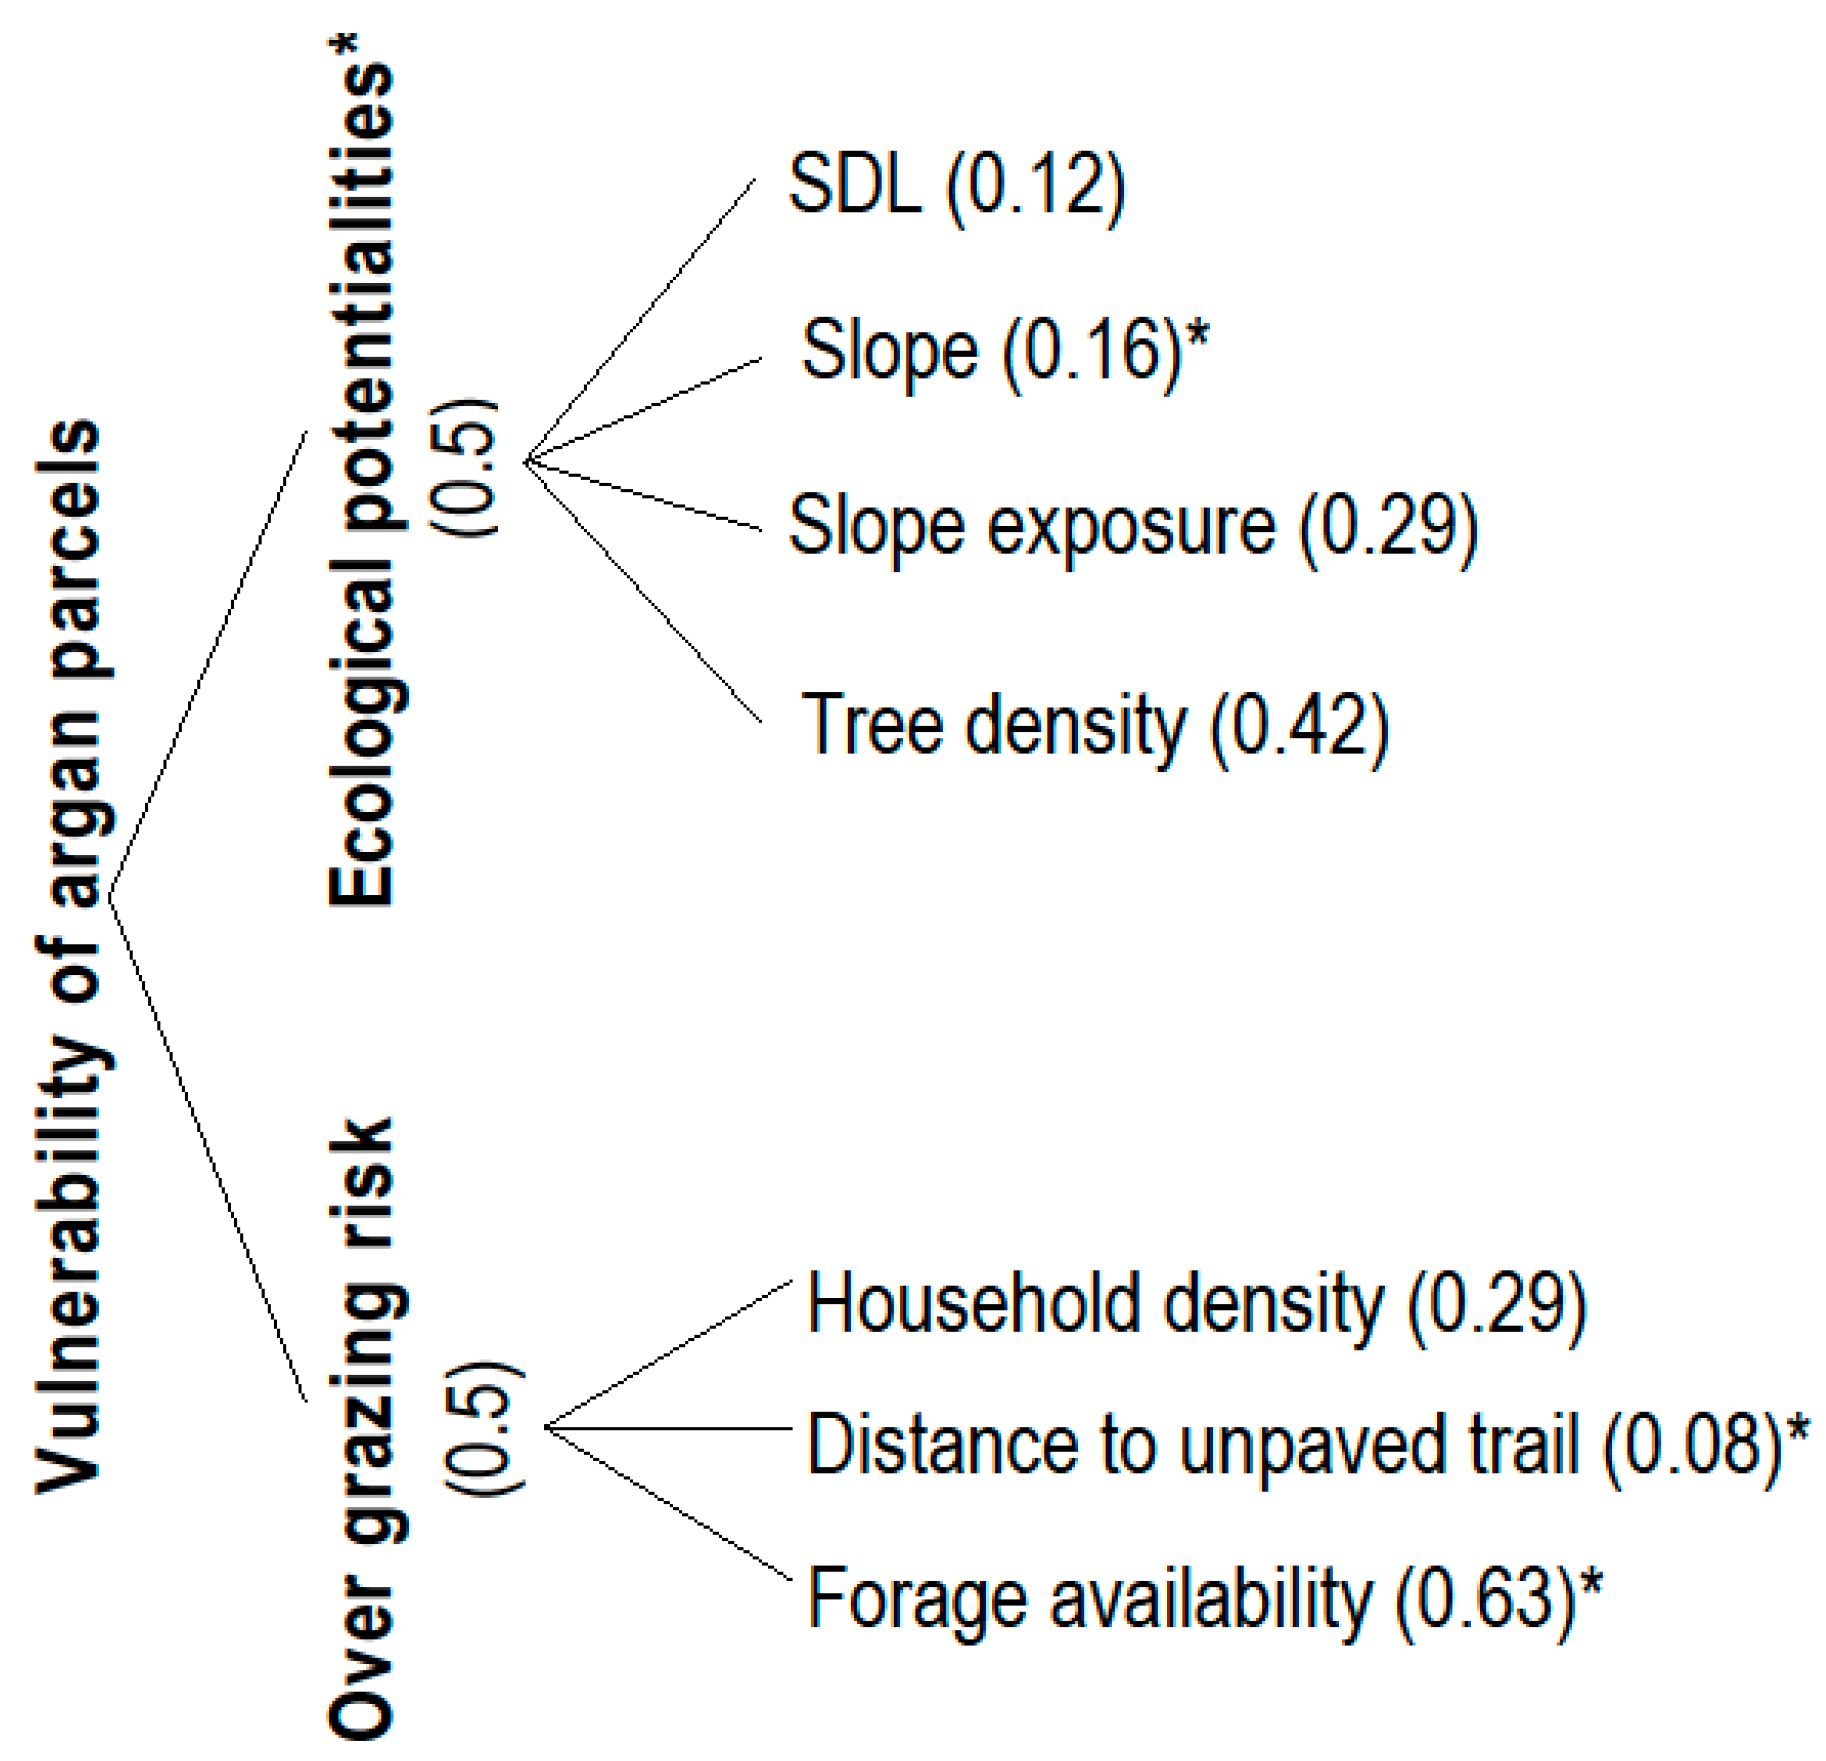
The argan parcel vulnerability was estimated using AHP (Analytic Hierarchy Process) [
49] method (
Figure 3). It depends on (i) the parcel ecological potential of resilience; and (ii) the risk of over-grazing. The ecological potential of the site was computed from the argan stand conditions (SDL and tree density) and from the topographic variables. The over-grazing risk was estimated using the household’s density and the forage availability in the parcel environment within a radius of 1000 m. The forage availability was in turn derived from Equation (1) (adapted from [
2,
34,
50]).
where SD, QD and HD are the total area of slightly, quite and highly degraded parcels, respectively.
Figure 3.
Components and weights (between brackets) used to estimate the vulnerability of argan parcels to further degradation. All variables are standardized (between 0 and 1). Variables with * are negatively correlated to the vulnerability.
Figure 3.
Components and weights (between brackets) used to estimate the vulnerability of argan parcels to further degradation. All variables are standardized (between 0 and 1). Variables with * are negatively correlated to the vulnerability.
In the special case of the PPP scenario, we assumed that legal possession was a sufficient incentive for undertaking a restoration process by plantation of argan trees. The planting success rate was set at 10% of the actual number of trees per hectare every three years. A parcel was allowed to move to the “restored” level after reaching a threshold tree density of 80 trees/ha (the maximum density currently observed) as long as the associated density change was higher than 10 trees/ha. The latter condition was introduced to prevent the denser parcels (acquired and having a density close to 80 trees/ha) from changing their status (restored) during the first five years of simulation. A minimum period of six years was deemed necessary to remove qualitative degradation.
4.4. Dynamics of Argan Parcel Possession
The possession dynamics was simulated using the suitability of argan parcels for the household possession and Markov chain analysis. The Markov chain process controls the temporal change among the parcel land tenure types (acquired/not acquired) based on transition matrices defined from the original transition probability matrix of land tenure type [
4]. The suitability function controls the spatial pattern of change through decision rules simulating the farmers’ rationale for choosing parcels. Furthermore, the final assignment incorporates local rules (required suitability or required rate of successful planting) as well as uncertainty related to farmer behavior.
The dynamics of the parcel possession are different for each of the three scenarios:
There is no change in possession for the TDP scenario.
The proportion of converted parcel possession is assumed to be constant over the next 30 years for scenario BAU. The annual rate of parcels recently enclosed was derived by photointerpretation of very high resolution images of 2006 (QuickBird) and 2009 (Google Earth) for each STU.
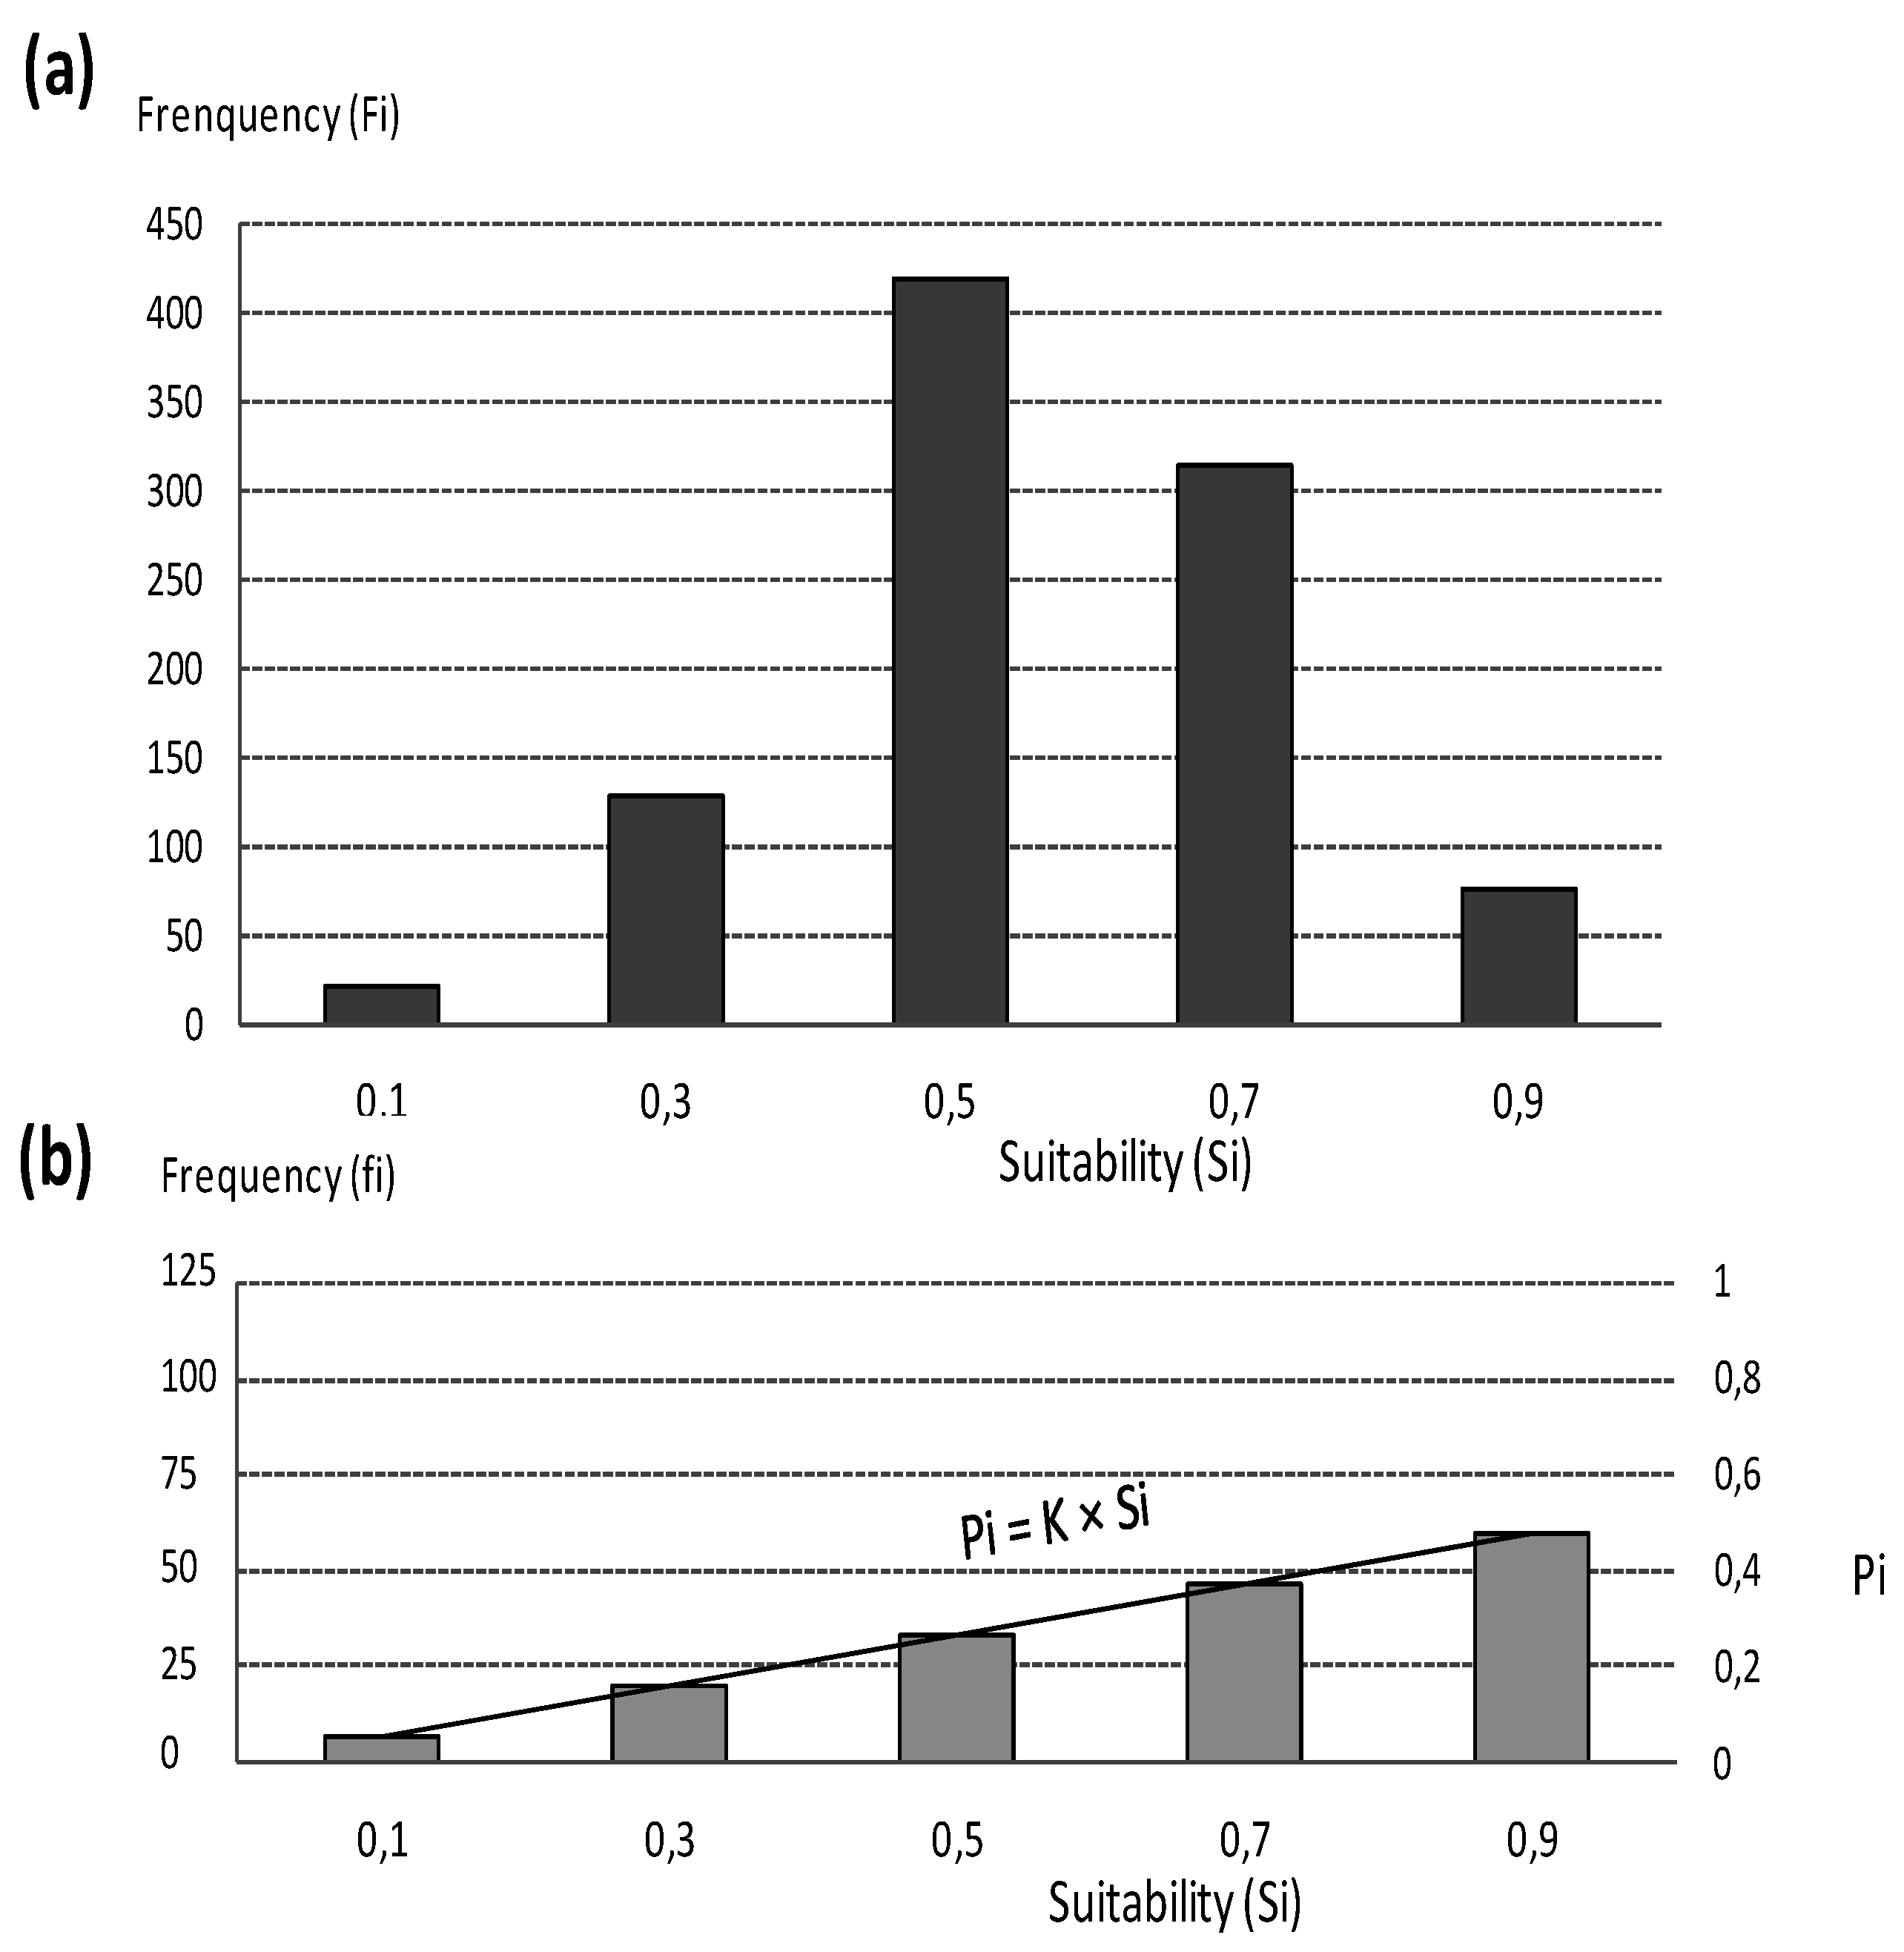
The transition matrix in the PPP scenario is established by considering, in the initial stage, that up to one parcel is allowed for each household. The same household is not entitled to a second parcel before a period of three years, a period deemed necessary to ensure the survival of argan seedlings. The forecast transition proportions of acquired parcels ( are estimated using transition probability matrix (P) and Markov process. The Markov process has two properties: (i) the status of a parcel in the m step depends only on its status in the (m − 1) step; and (ii) the probability of a “not acquired” parcel to be “acquired” in m steps, is the mth power of the transition matrix.
The converted parcels are selected according to a stochastic process, with uniform randomization, by favoring the parcels with a high possession suitability score while allowing other parcels to be included. While being driven by suitability scores, it also introduces a random effect in the household decision, accounting for considerations not included in the model (
i.e., historical, patrimonial or psychological interests).
Appendix B shows the theoretical development of the approach.
In addition to the above, the possession process was allowed to change over time as a function of parcels’ scarcity and vulnerability level to more closely mimic household decisions in the field.
Due to the risk of parcel withdrawal as a penalty, the local stakeholder is expected to invest more in the planting effort with an increasing scarcity of parcels under the PPP scenario; this is the case despite the fact that the conditions for planting success are becoming increasingly hard. The constraint of the required rate of planting success (Ti) was empirically derived from the scarcity level and compared to the vulnerability level (Vi; 0 ≤ Vi ≤ 1). The number of parcels that satisfy this constraint (1 − Vi ≥ Ti) corresponds with the real number () that will be chosen by households.
For the BAU scenario, the minimum required suitability (Si’) was lowered along with time as a result of increasing parcel scarcity, and less suitable parcels were thus progressively included in the range of regarded parcels.
The two constraints considered above (Si’;Ti) have been useful to ensure spatial contiguity of the selected parcels by raising the parcels chances to be selected in the neighborhood of the previously selected parcels, as was observed in the field.
Parcels’ possession suitability attempts to simulate the decision making of the farmers. The selection of a parcel is influenced by biophysical and socio-economic conditions within as well as in the neighbourhood of the argan parcel. Three components were considered in the suitability function, namely Forest and Pasture Aptitude (FPA), the Exploitation Convenience (EC), and the Social Attractiveness Level (SAL).
FPA translates the biophysical consistency of the forest stand regarding its tree density, its SDL and its position in the toposequence.
The parcel exploitability expressed by EC is computed based on the parcel area and the distance-based variables.
SAL reports the social pressure in the parcel environment and the competition between farmers for exploiting the same area. It reflects the scarcity of argan resources.
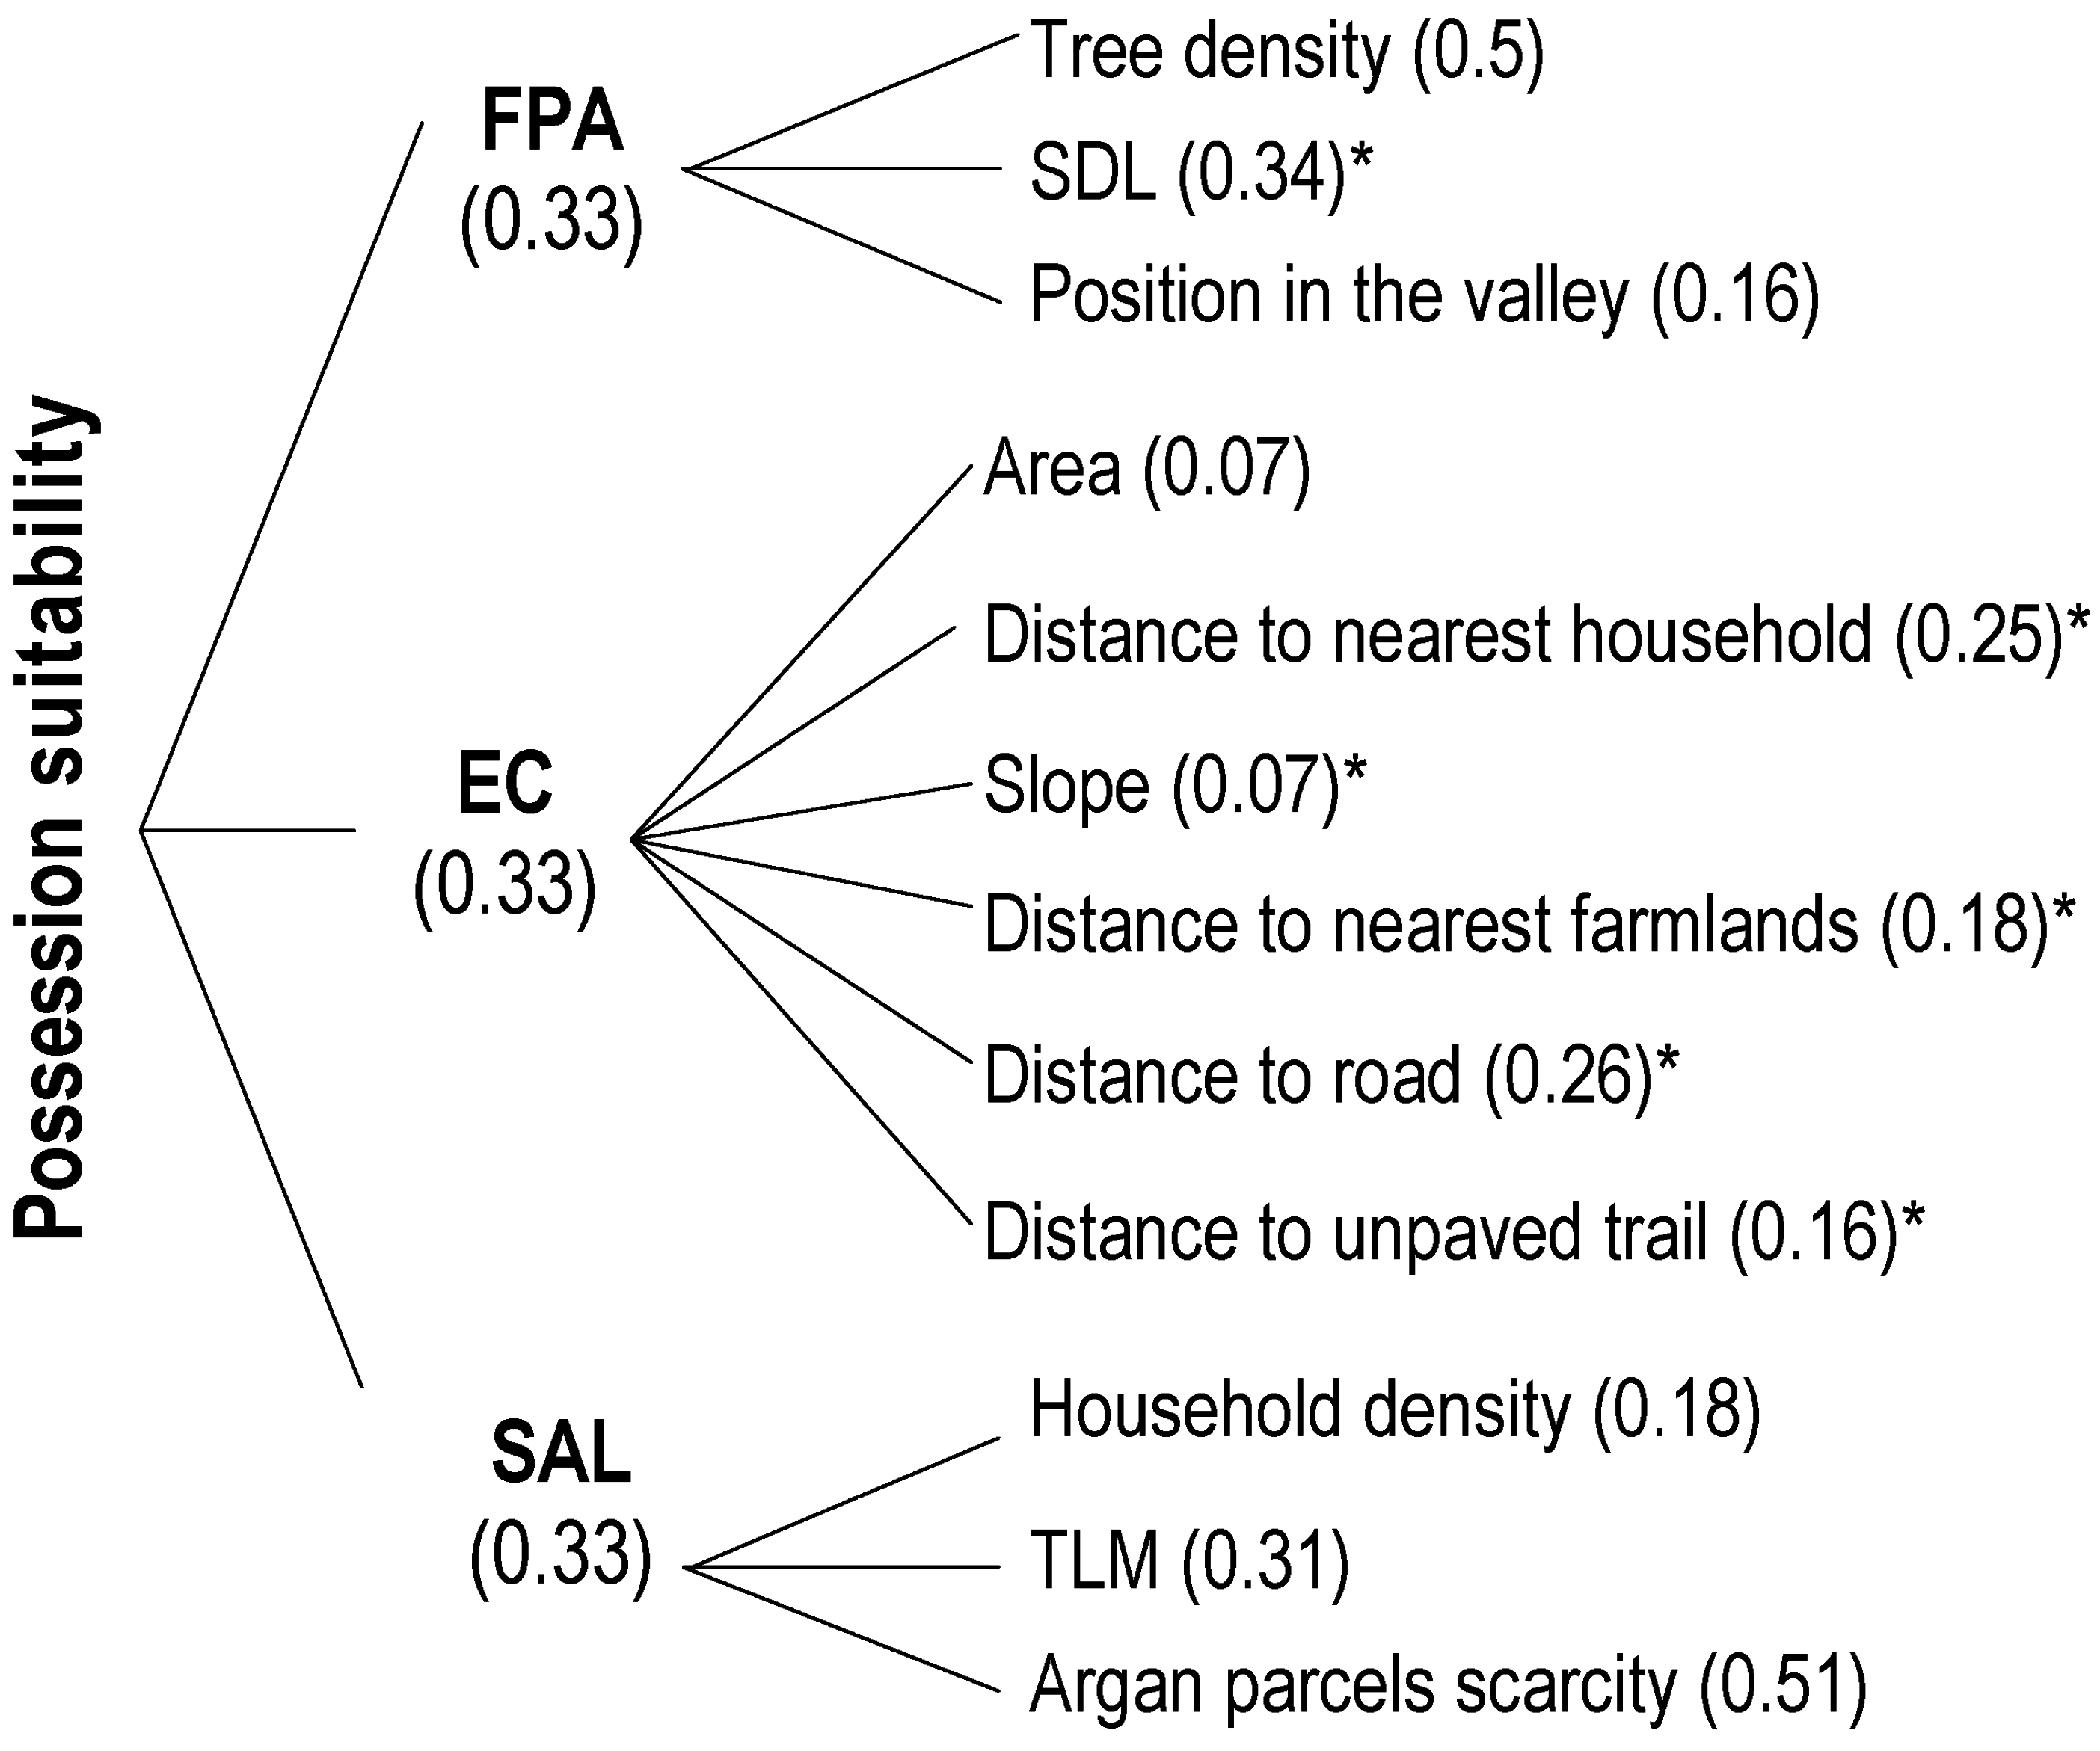
Parcels possession suitability was evaluated using the AHP method. In the model development, a two-stage AHP was performed (
Figure 4) with FPA, EC and SAL playing the role of intermediate variables with equal weighting.
Figure 4.
Components and weights (between brackets) used to estimate the possession suitability of argan parcels. All variables are standardized (between 0 and 1). Variables with * are inversely correlated (1—variable value) to its immediate goal. (FPA for Forest and Pasture Aptitude; EC for Exploitation Convenience; SAL for Social Attractiveness Level; SDL for Stand Degradation Level; TLM for Traditional Land Management).
4.5. Model Validation
For model validation, we compared the simulated possession maps for BAU and PPP with the observed acquired parcels (n = 76 parcels) hereafter called “reference parcels”. The reference parcels are those acquired during the period from 2006–2009 and used to calculate the transition matrices, as well as those that were acquired before 2006.
5. Results
5.1. Validation of the Possession Dynamics
The average proportions of the acquired parcels are respectively 5.33% (±0.24) and 47.78% (±0.53) for BAU and PPP. The possession dynamic is nearly 10 times higher in PPP than in the BAU.
Table 1 gives the overall simulation success,
i.e., the percentage of successful matching between the reference and possessed parcels, for selected distances to the actual center of the reference parcels and various possession occurrences scores (minimum number of times one parcel is possessed among the 30 repetitions).
Table 1.
Successful matching (%) between the reference parcels and the simulated possession as a function of the distance to the actual center of the reference parcels (lines) and to the possession occurrence (PO, rows), for the BAU and PPP scenarios. PO is the number of times one parcel is possessed among the 30 repetitions.
| BAU Scenario |
| | PO ≥ 10 | PO ≥ 5 | PO ≥ 1 |
| 50 m | 1.32 | 23.68 | 78.95 |
| 150 m | 2.63 | 32.89 | 90.79 |
| 250 m | 3.95 | 46.05 | 96.05 |
| PPP Scenario |
| | PO ≥ 20 | PO ≥ 10 | PO ≥ 5 |
| Exact location | 42.10 | 73.68 | 76.32 |
| 50 m | 69.74 | 89.47 | 92.10 |
| 150 m | 89.47 | 96.05 | 98.68 |
| 250 m | 97.37 | 100 | 100 |
BAU successfully (>78.9%) predicts the location of the acquired parcels in the overall area although no exact match could be obtained with the reference parcels. The main reason could be that the offer of suitable parcels is much larger than the historical demand. Despite the difficulty to match the exact location of the reference-parcels, the model predicts rather successfully the immediate vicinity of such areas or the potentially favorable areas for possession.
In PPP, the predictions more successfully agree with the observed possession dynamic. Almost 70% of the reference-parcels match the simulated parcels acquired at least 20 times out of the 30 model repetitions. This rate can reach up to 97% with a buffer area of 250 m around the acquired parcels. These results show that the model captures in a realistic manner the decision-making process of parcel selection.
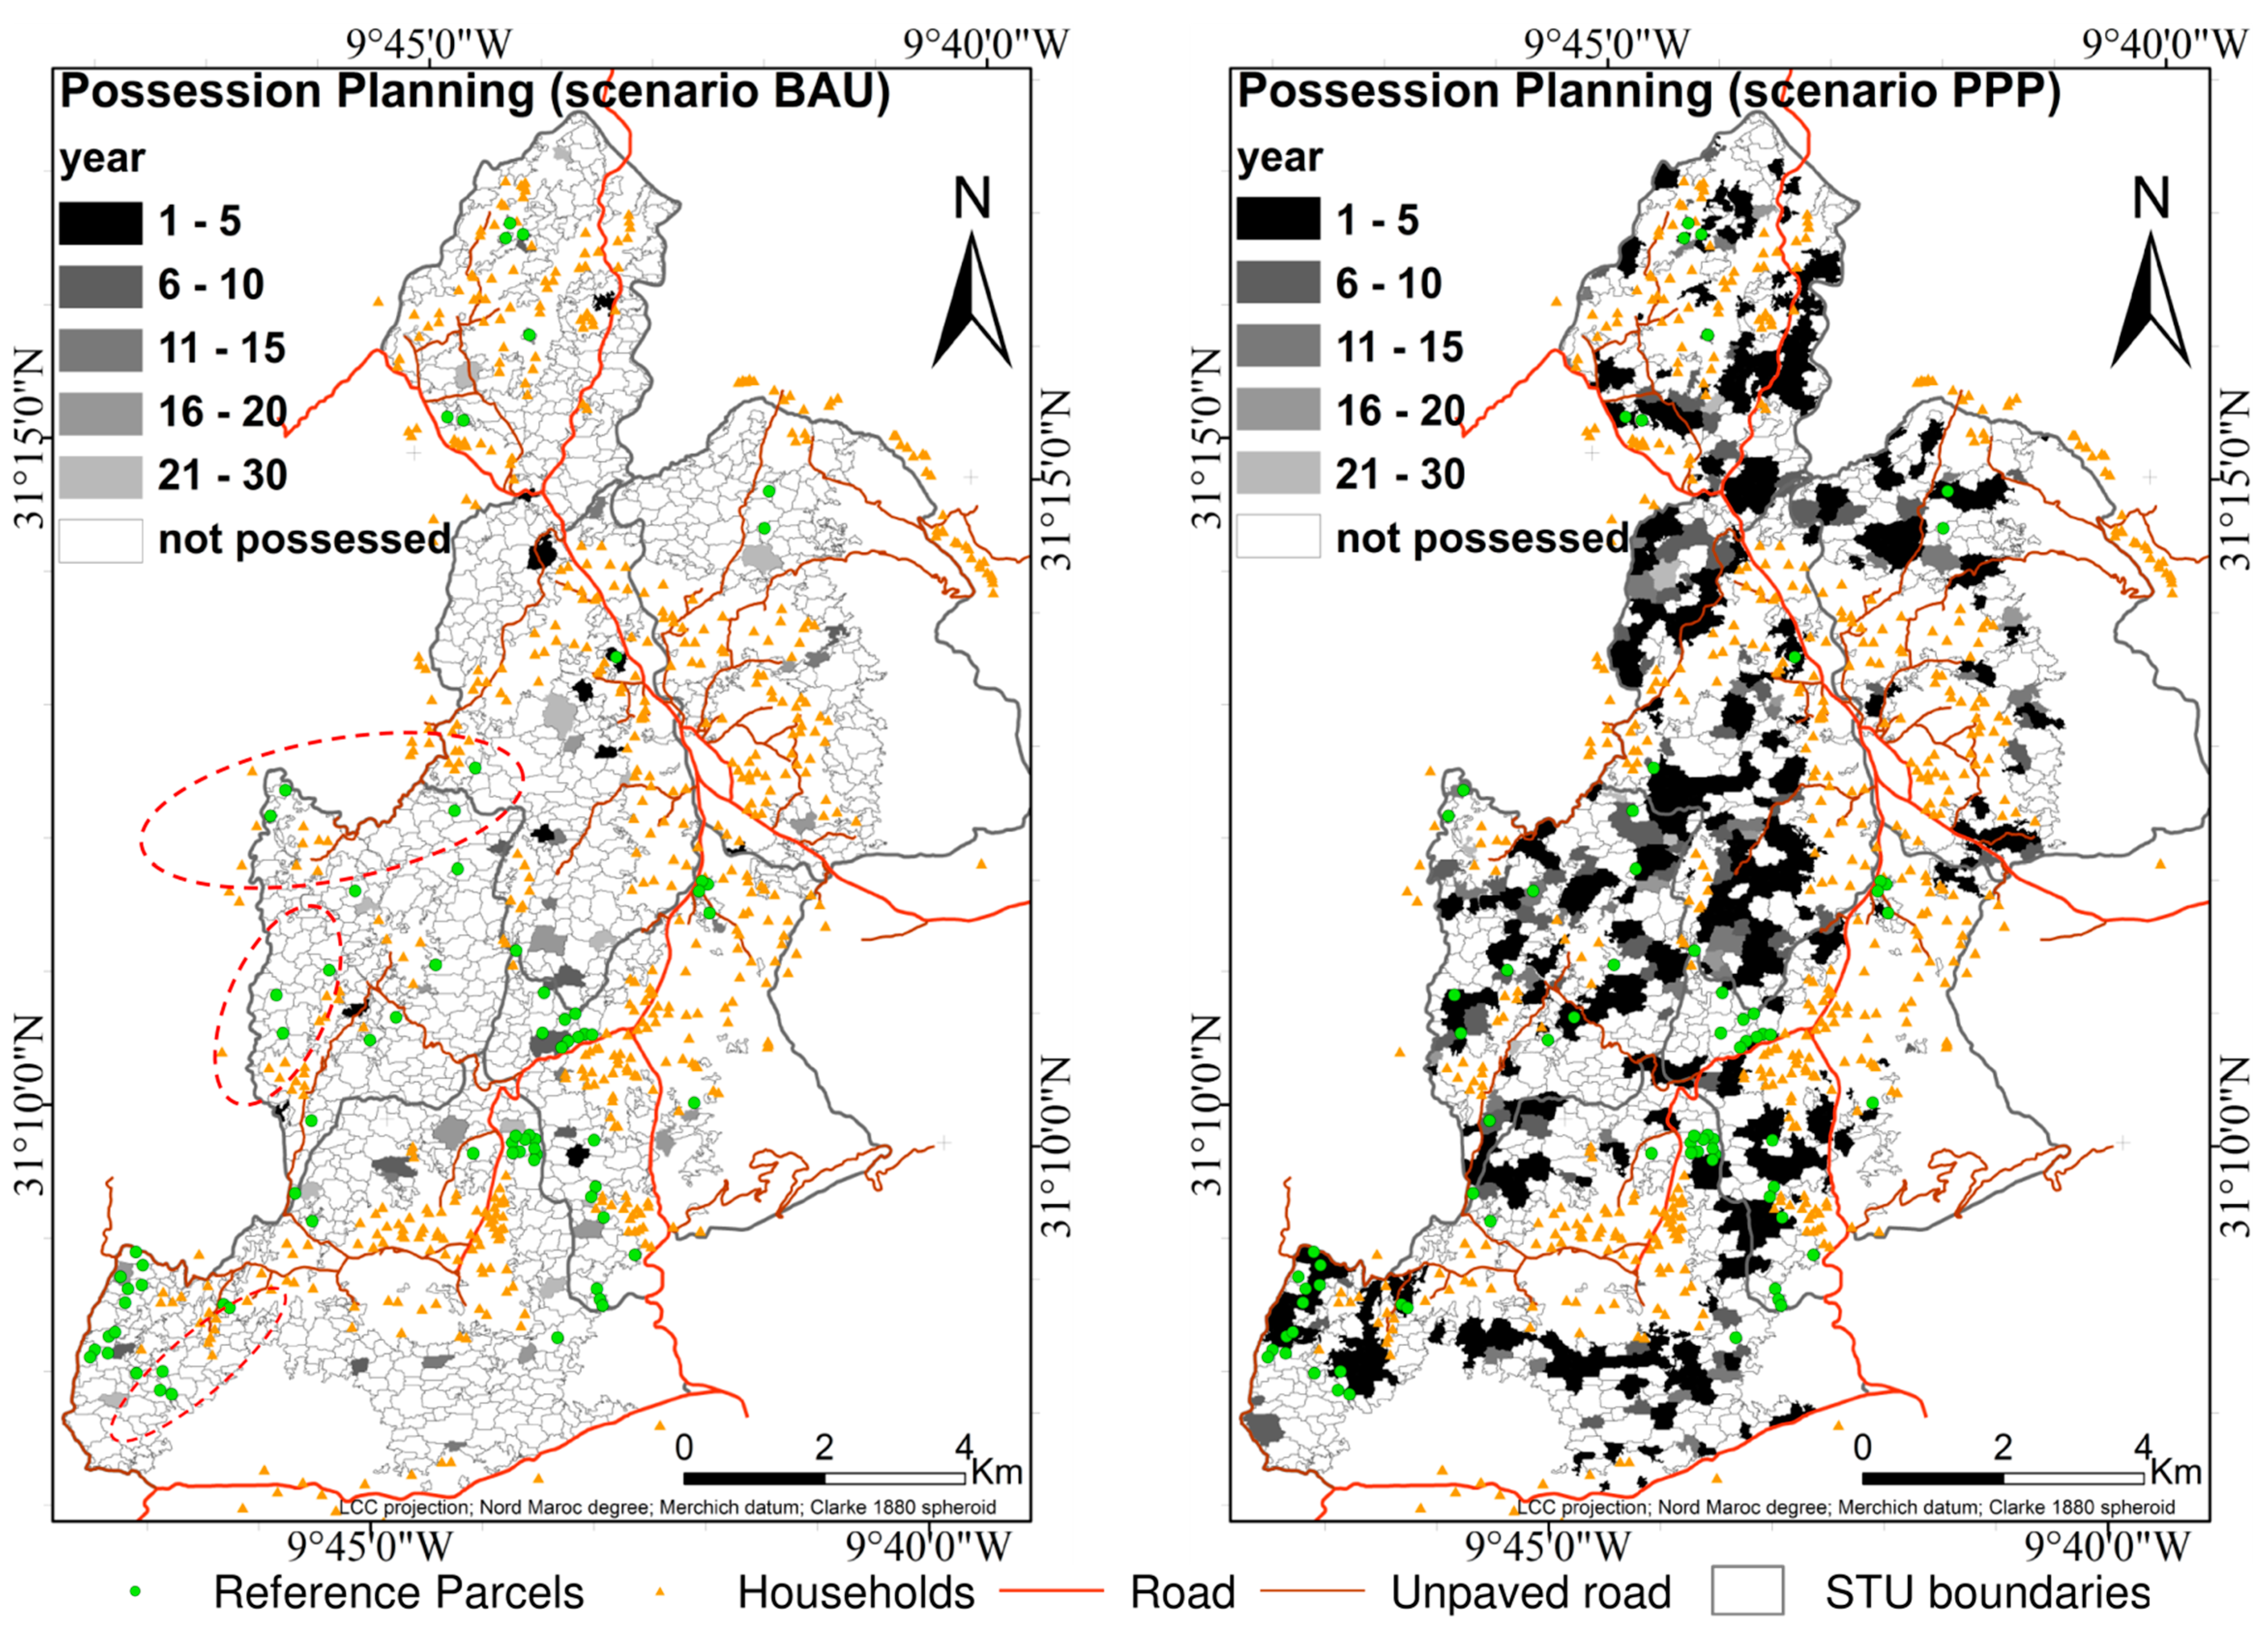
Figure 5 confirms the previous results, showing the great number of reference plots located in the close neighborhood of the early acquired plots in both scenarios. For
BAU, the possession dynamics look underestimated in some areas (circled in dotted line in
Figure 5); this is due to the fact that the pace of possession in those STU is not constant in the period 2006–2009 (as assumed in the model) and the period for carrying the reference-parcels (acquired parcels including those before 2006).
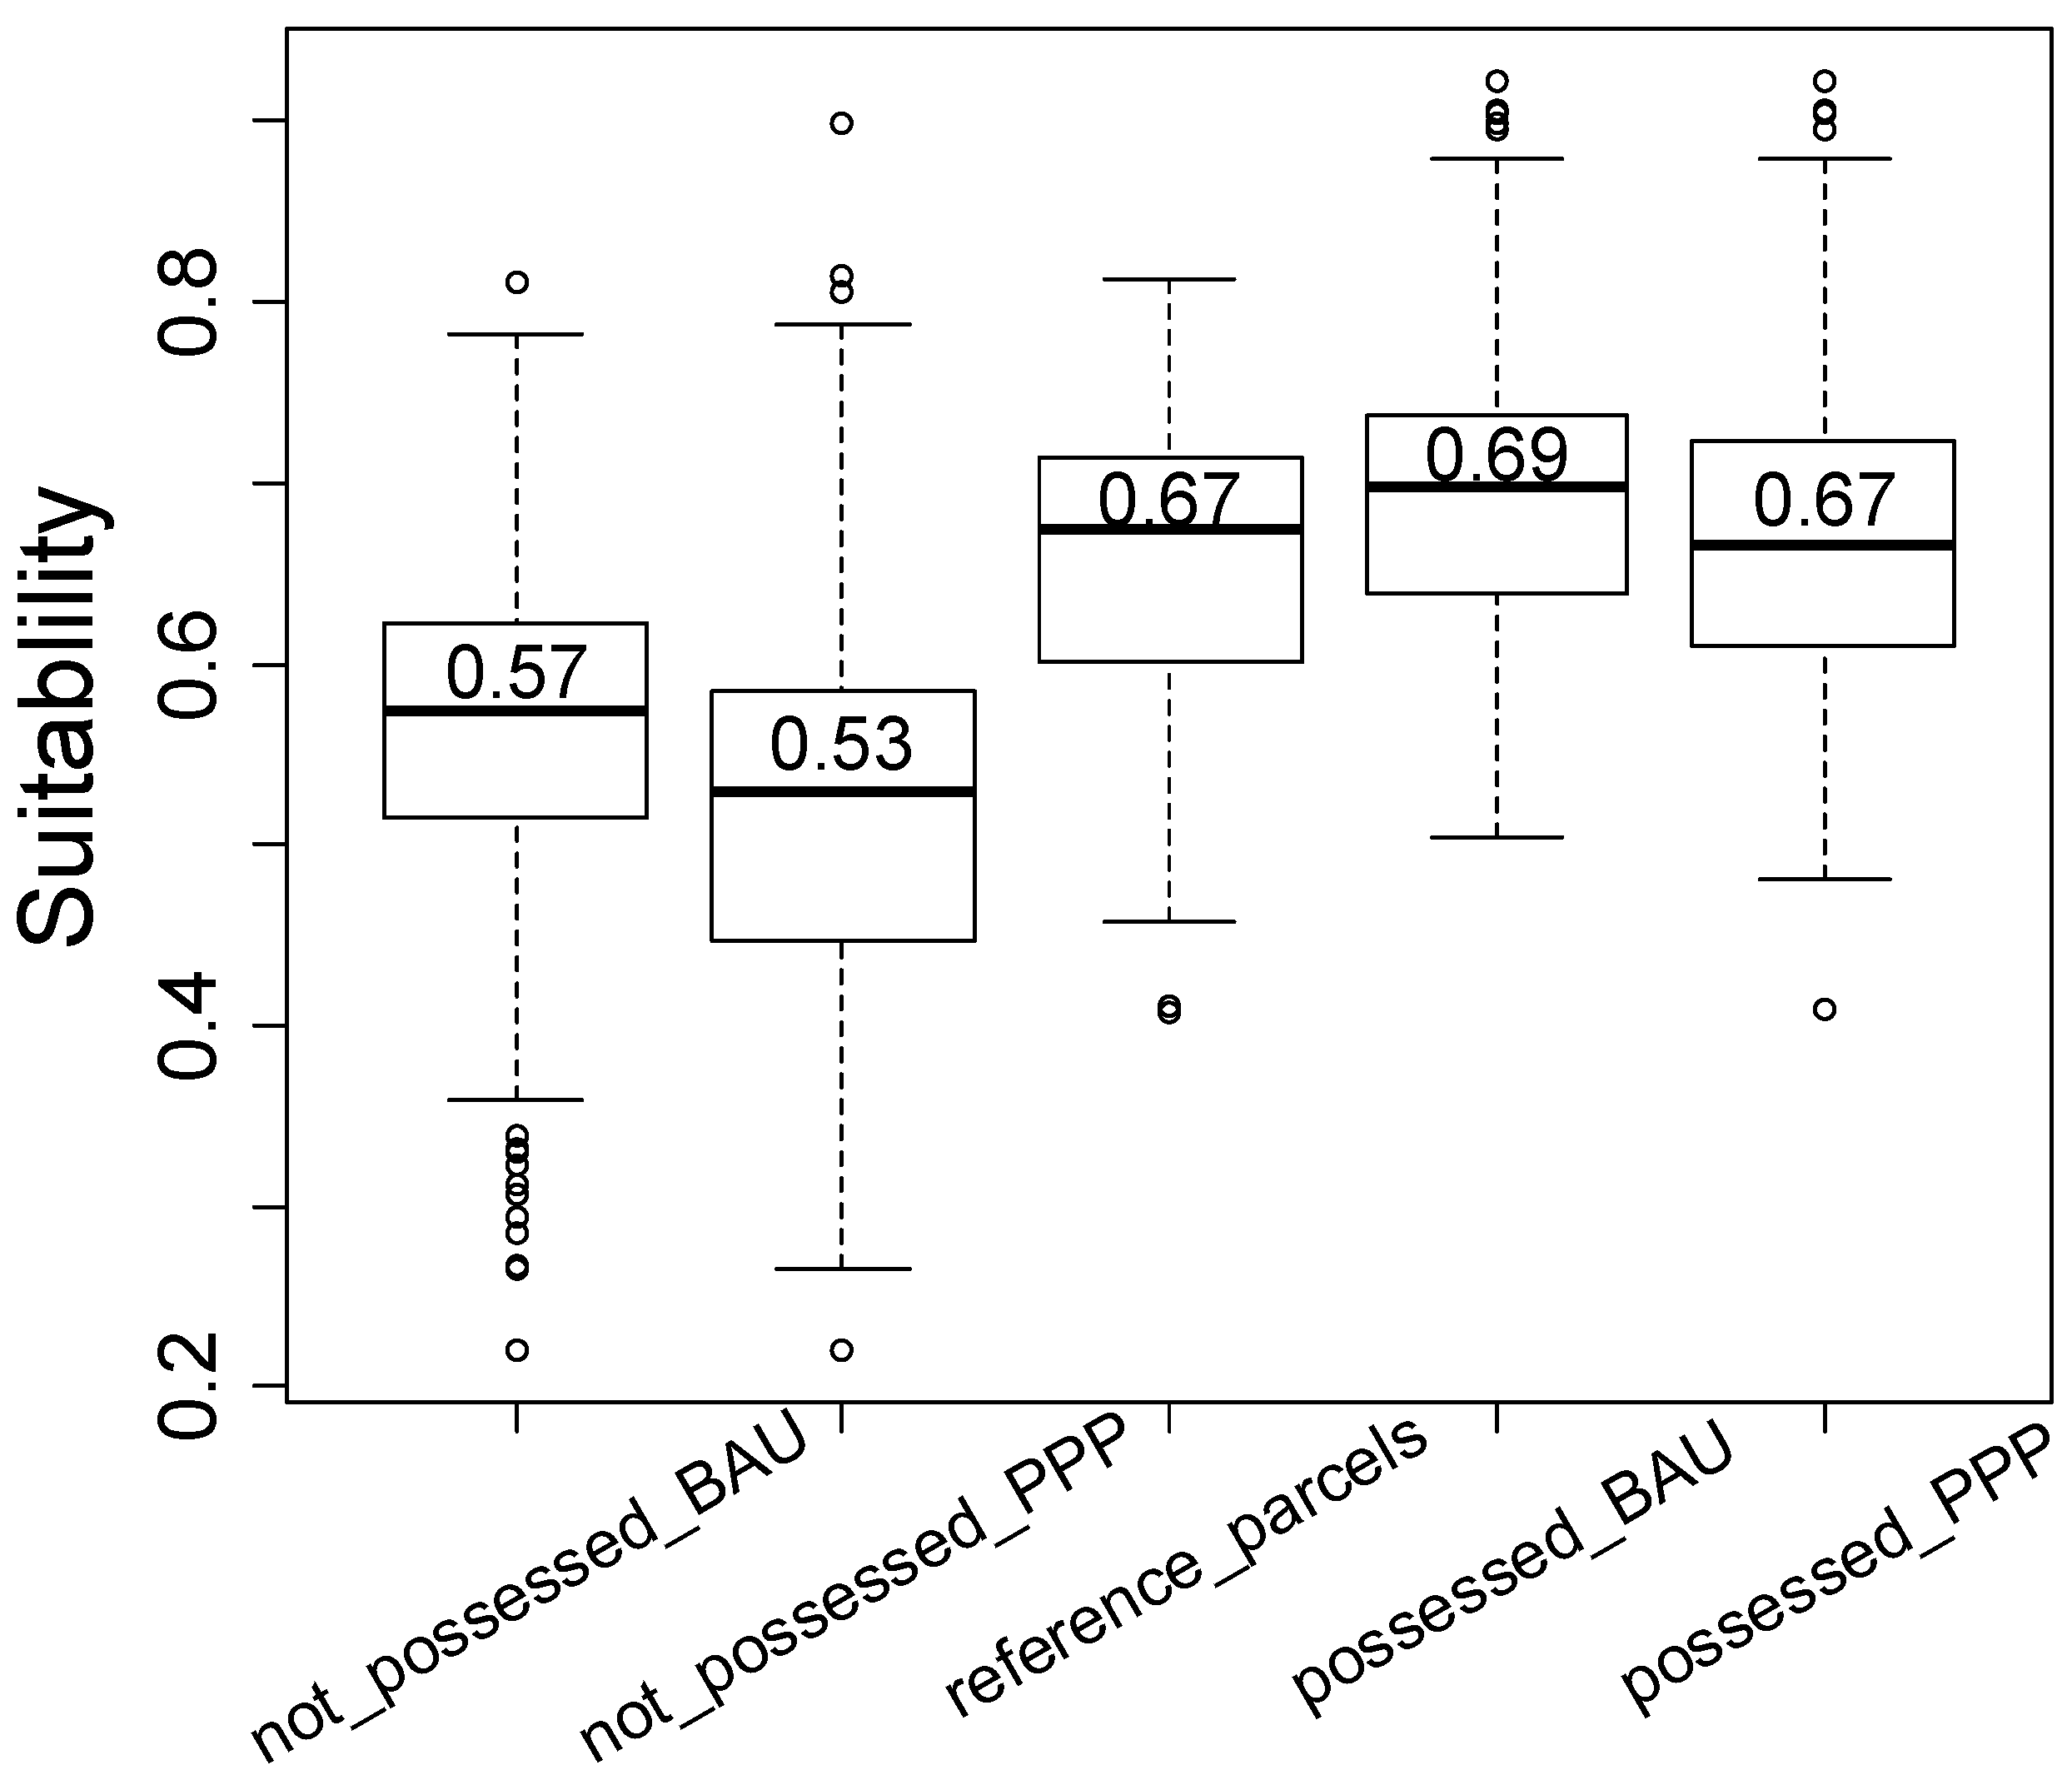
The box plot in
Figure 6 shows the suitability distributions of the reference-parcels as well as of the acquired and not acquired parcels for the
PPP and
BAU scenarios. For both scenarios, the suitability differs significantly (
p < 0.0001) between the reference and the not possessed parcels. Comparing the suitability between the reference and acquired parcels, the difference is not significant for
PPP (
p > 0.74) while it is highly significant (
p < 0.002) for
BAU. The currently acquired parcels (reference parcels) are not always the most suitable; thus, the suitability function calculated based on the biophysical and socio-economic data does not reflect the total complexity of the choices made by households. The use of the Monte Carlo technique allows including the uncertainty that could not be included in the suitability map. The decision to acquire a parcel indeed depends on variables that are difficult to identify and take into account explicitly into the model. Uncertainty affects possession dynamics, forest degradation prediction and the utility of subsequent decision. The outputs’ results (possession dynamic and SDL) are therefore formulated as a probabilistic distribution, rather than a single value.
Figure 5.
Simulated possession planning (schedule) dynamics for BAU (left) & PPP (right) scenarios. Dotted line circles delimits areas where the possession dynamics are under-estimated. The grey scale indicates the time steps for a parcel to change status tenure over the 30-year simulation period.
Figure 5.
Simulated possession planning (schedule) dynamics for BAU (left) & PPP (right) scenarios. Dotted line circles delimits areas where the possession dynamics are under-estimated. The grey scale indicates the time steps for a parcel to change status tenure over the 30-year simulation period.
Figure 6.
Suitability dispersion of reference-parcels, acquired parcels and not acquired parcels for the scenarios BAU and PPP.
Figure 6.
Suitability dispersion of reference-parcels, acquired parcels and not acquired parcels for the scenarios BAU and PPP.
5.2. Possession Transition Quantities and Spatial Maps
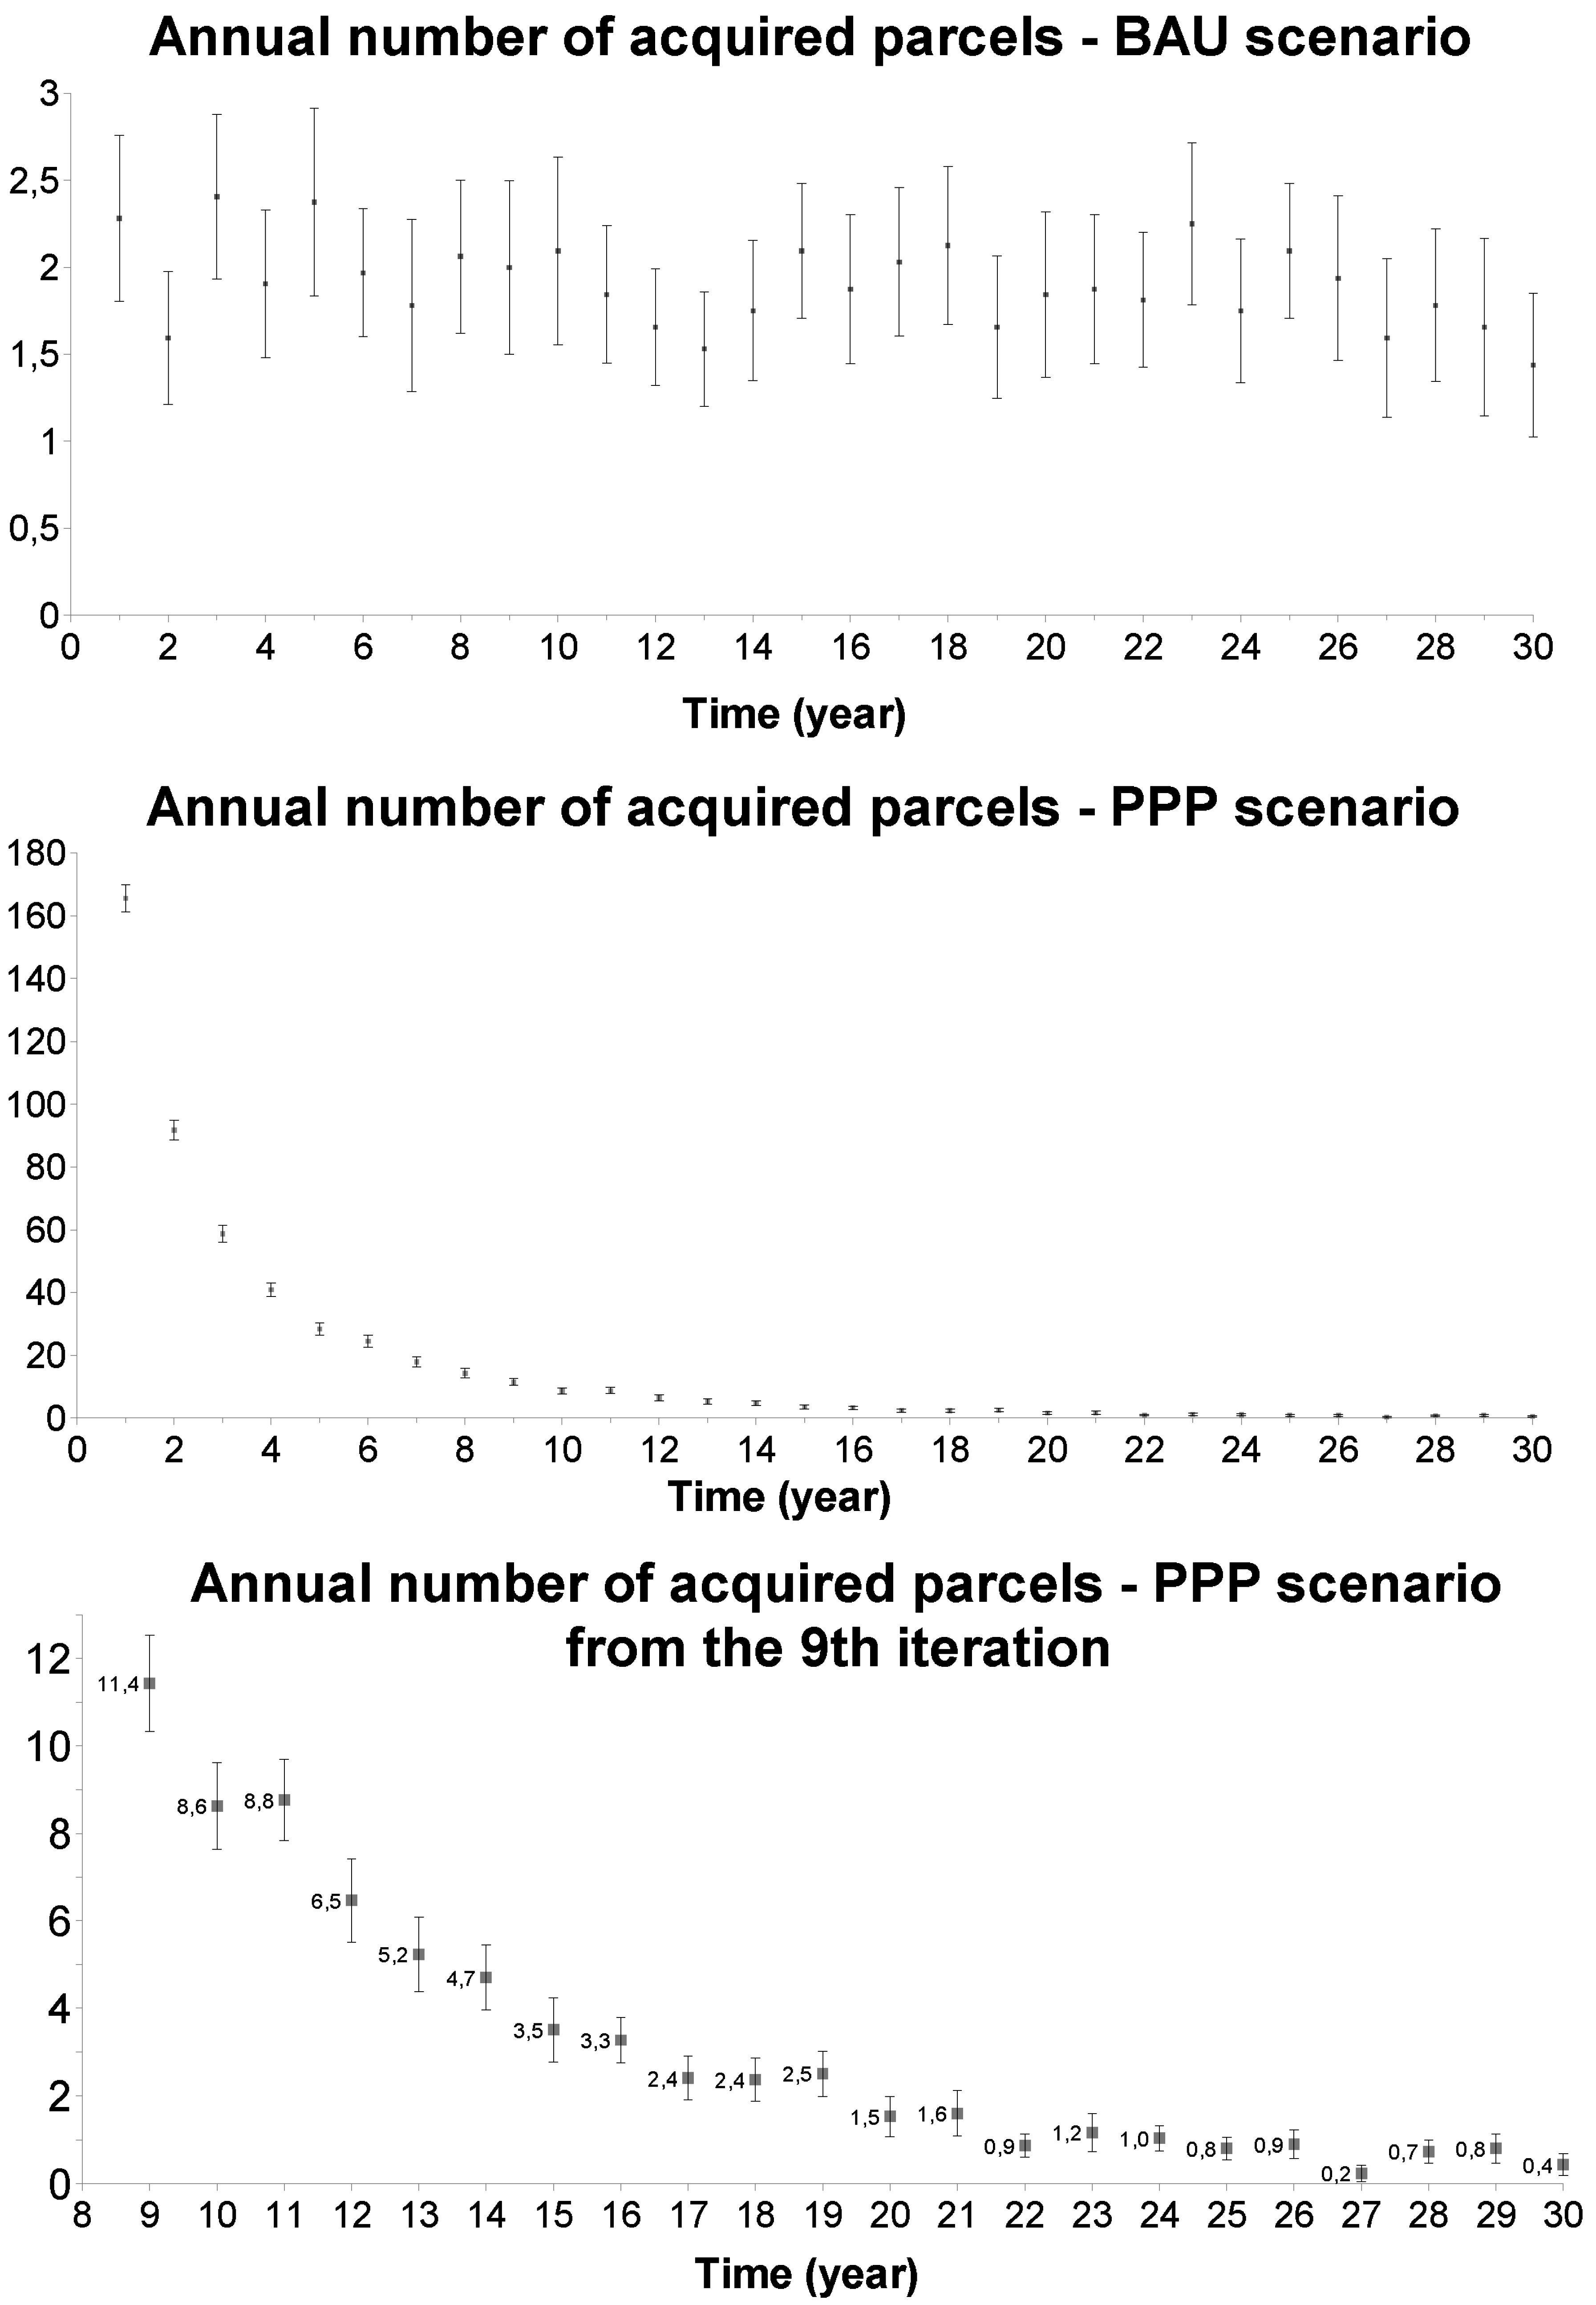
Figure 7 shows the number of parcels acquired each year. As imposed by the transition matrix, the quantity of parcels being acquired is stable (1.9 ± 0.4) over time for
BAU. Following the actual possession dynamics, less than two parcels change their tenure status each year in the whole study area. The estimated confidence interval (with α = 0.05 for
n = 30) is relatively important showing an inter-annual variation of these dynamics related to the number of acquired parcels should be rounded to the nearest integer value.
The majority of new possessions (
PPP) occurs at the beginning of the simulation period. In total, 75.37% of the acquired parcels are completed after the first five years. The yearly acquiring decreases quickly and becomes less than one parcel per year after the 24th year. Indeed, the suitable parcels become increasingly scarce and the constraint imposed by planting success is increasingly hard to meet (
Figure 7).
This gradual decrease in the amount of newly acquired parcels adequately depicts the marginal utility of these parcels compared to the energy and investments that should be mobilized to restore a newly acquired parcel. The farmer already possessing a parcel would become less motivated to claim other parcels because of the constraints cited before.
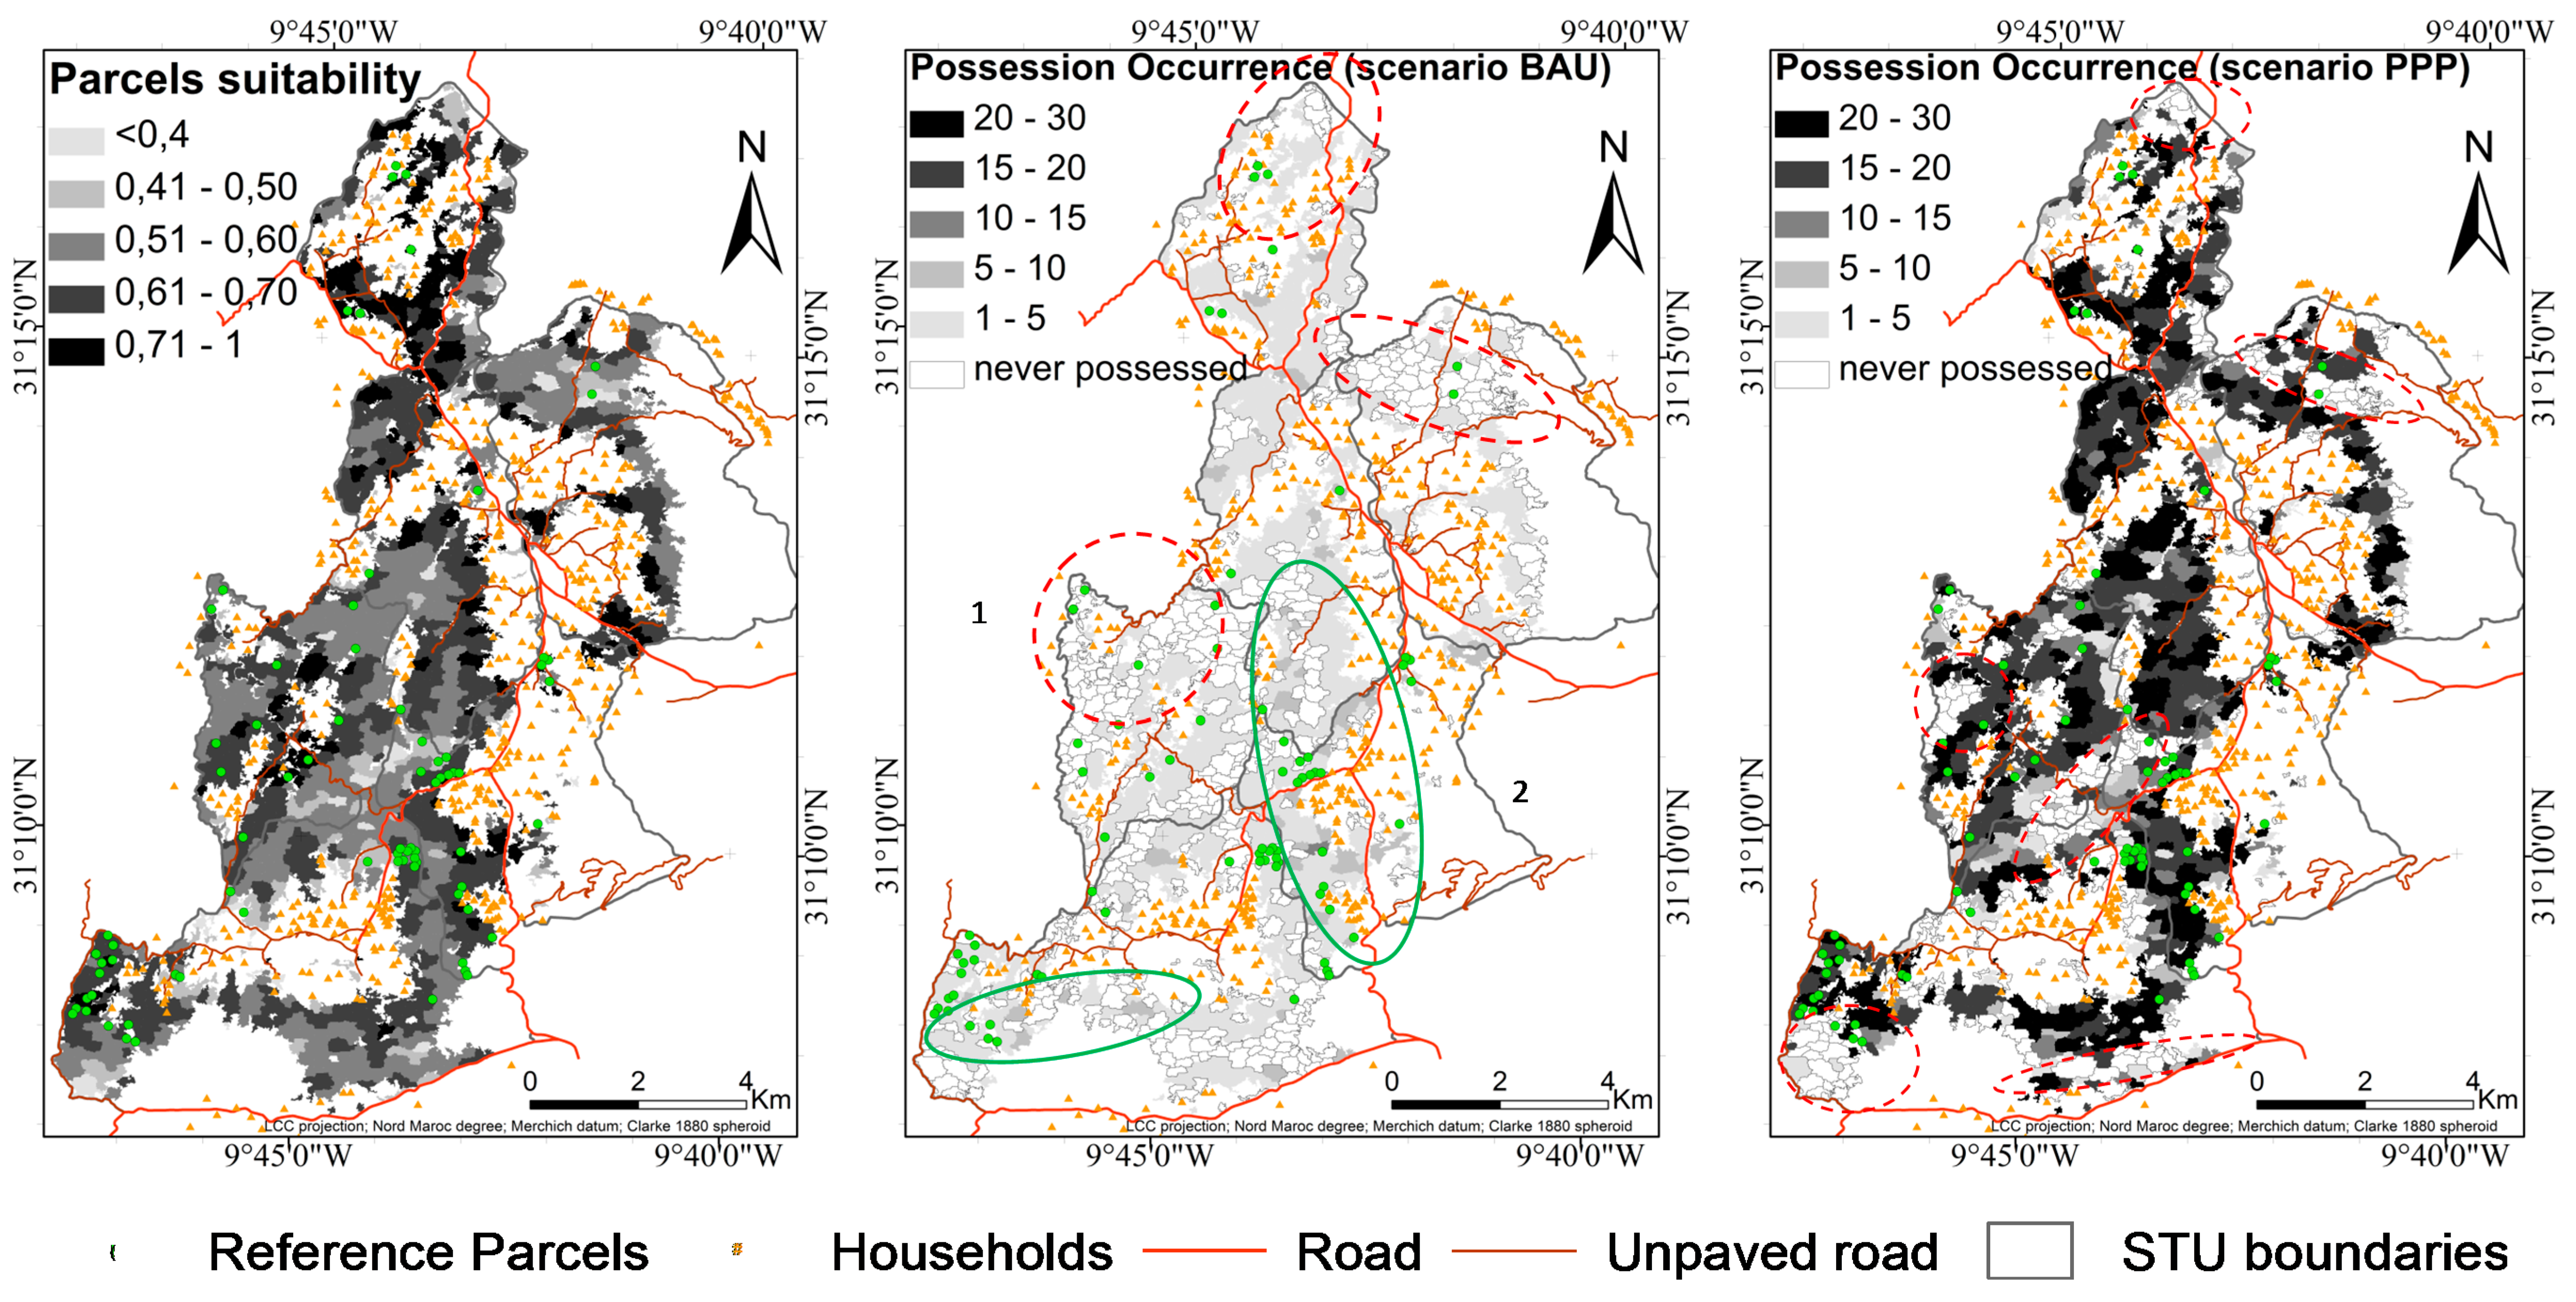
The spatial distribution of the most suitable parcels (
Figure 8) is mainly driven by the ecological potential gradient and is located in the most populated areas surrounding the farmlands.
Figure 7.
Annual number of acquired parcels and its confidence interval simulated over a 30-year period for the scenarios BAU and PPP (the sub-graph at the bottom shows the annual number of plots acquired from the ninth iteration for the PPP scenario).
Figure 7.
Annual number of acquired parcels and its confidence interval simulated over a 30-year period for the scenarios BAU and PPP (the sub-graph at the bottom shows the annual number of plots acquired from the ninth iteration for the PPP scenario).
Figure 8.
Spatial distribution of the parcels suitability and of the possession dynamics (BAU & PPP scenarios). Parcel suitability is quantified on a 0–1 scale according to
Figure 4. Number of occurrences: number of times a parcel is acquired among 30 repetitions. Plain green circles: areas with a high demand of argan parcels; red dotted line circles: areas with a low demand of argan parcels. 1, 2 (
BAU scenario) corresponds to the Socio-Territorial Units with the lowest (0.0014) and the highest (0.005) transition probabilities, respectively.
For the BAU scenario, we can distinguish between the areas with high demand of argan parcels (surrounded by a plain green line) and those with low demand (surrounded by a red dotted line). The possession dynamics occur in heterogeneous rhythm according to the transition probability estimated for each STU from 2006 to 2009. The highlighted circled areas (1, 2) correspond respectively to STU with the lowest (0.0014) and the highest (0.005) transition probabilities. These contrasted situations are driven by the territorial limits of each STU and their ethnic influence. In the PPP scenario, the possession dynamics are more important and more spread out in space. Indeed, the transition probabilities depend on the population density and on the available argan parcels. The non-acquired parcels in PPP scenario are the least accessible. In both scenarios, the possession dynamics occur by groups of adjacent parcels as observed in real cases. This pattern in contiguous groups is induced by using dynamic thresholds of scarcity level (scenario BAU) and the requirements for successful planting (scenario PPP), which also depend, among other factors, on the level of scarcity in a buffer zone of 1000 m.
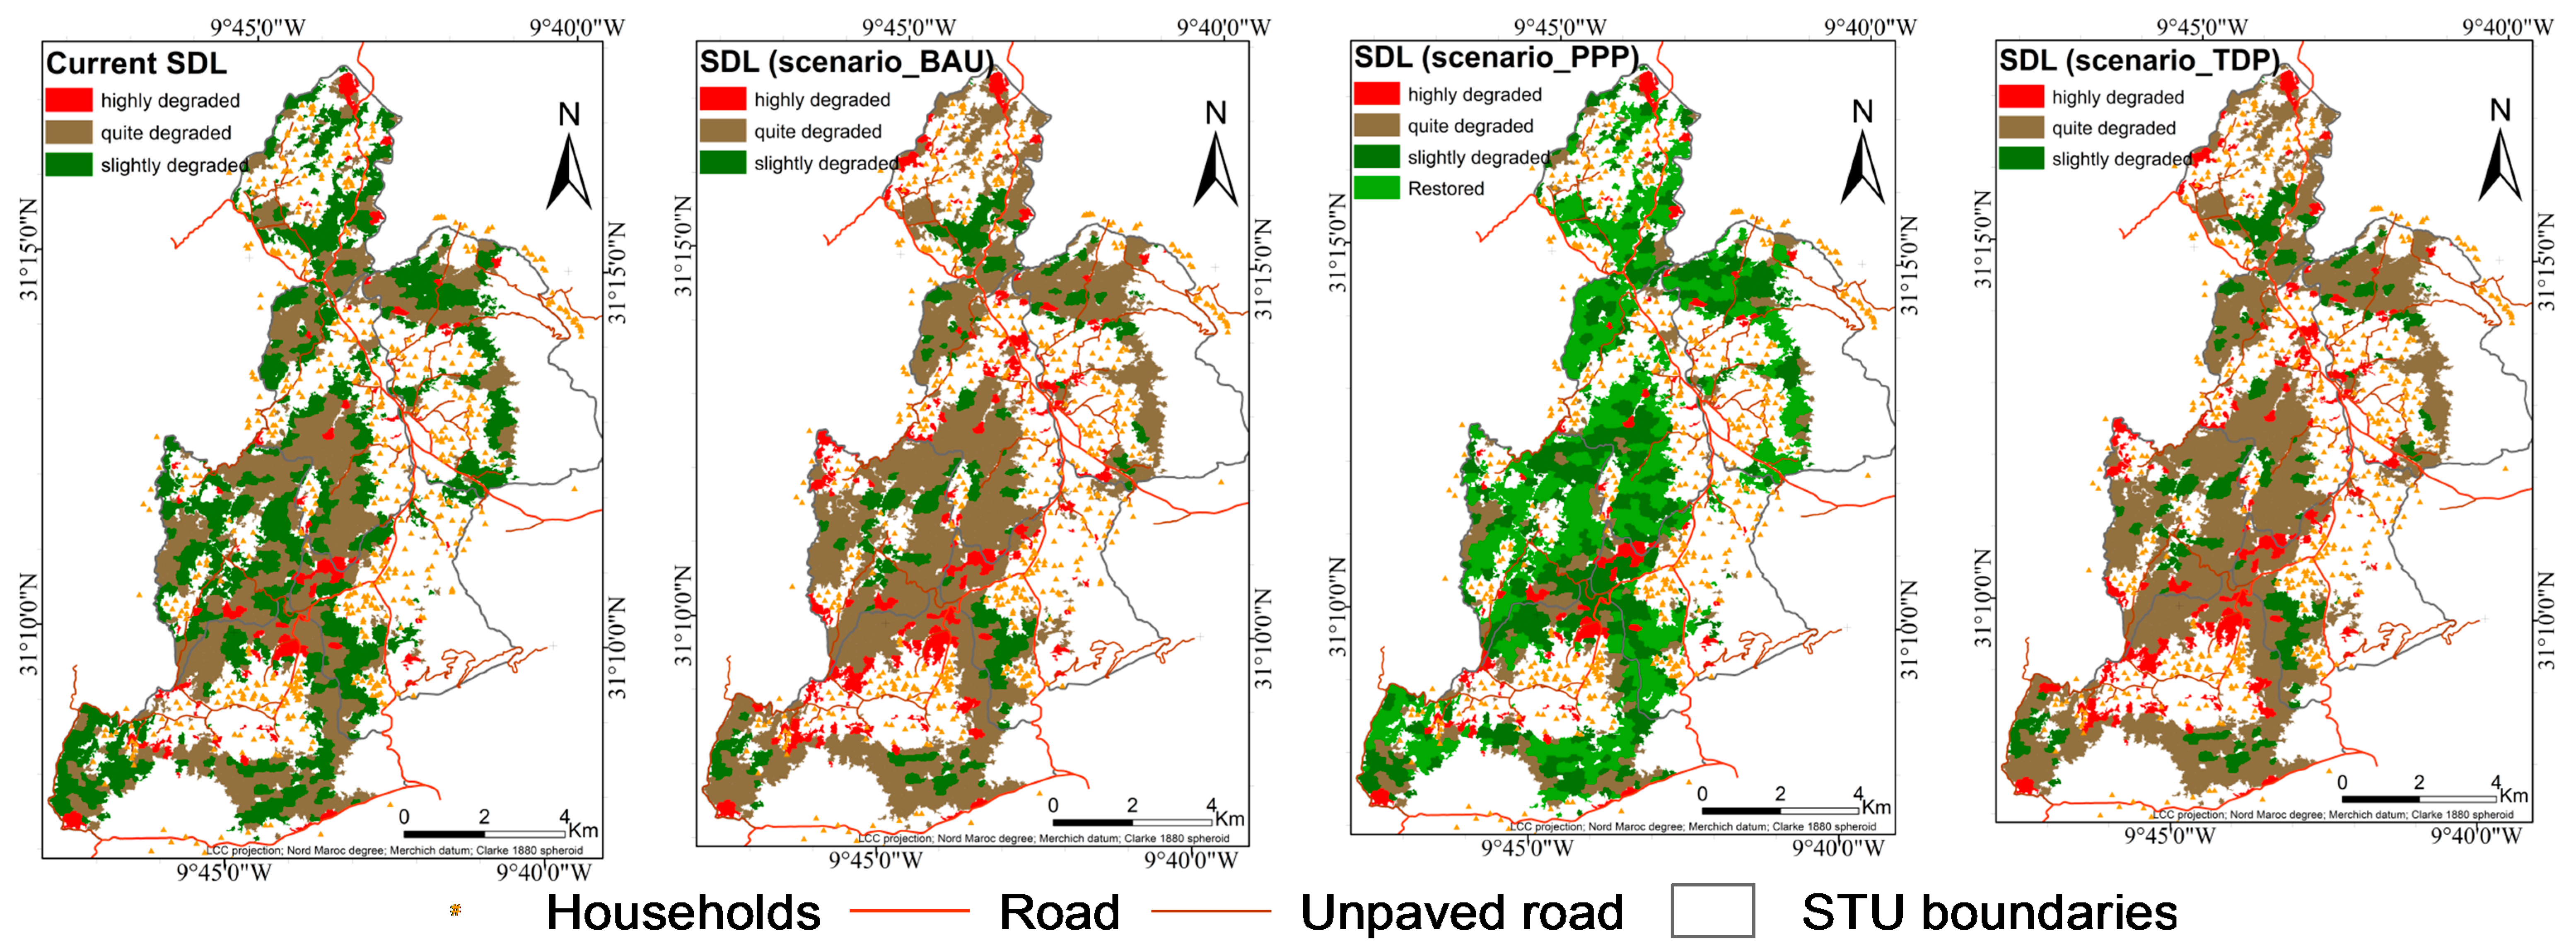
5.3. Stand Degradation Level and Tree Density Changes
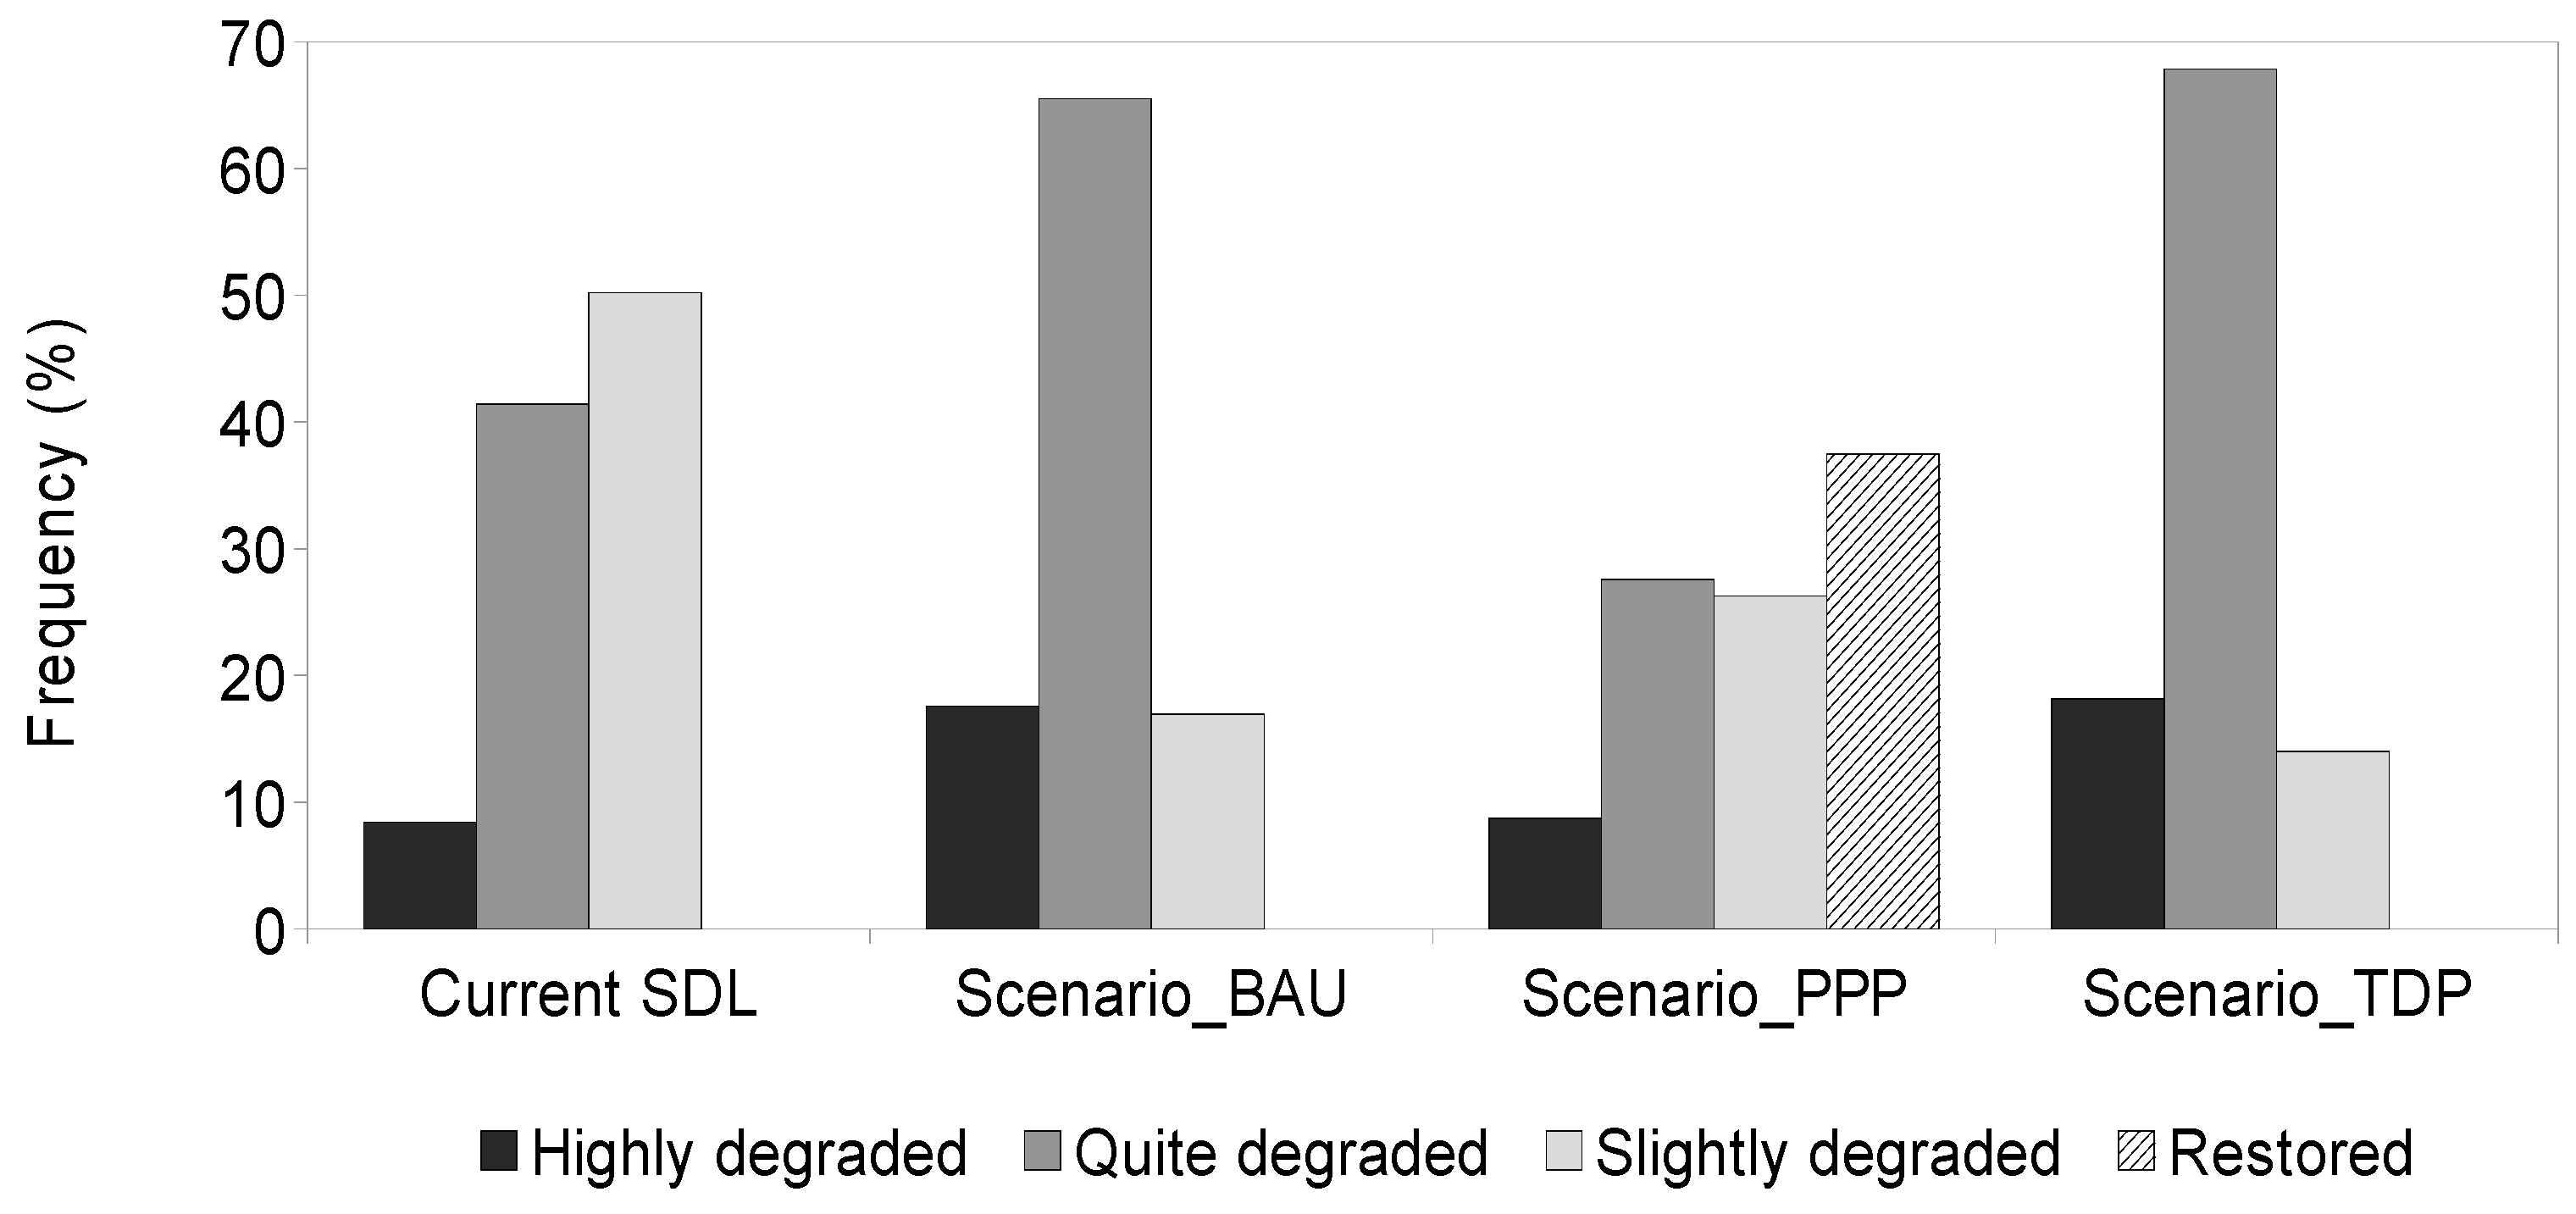
The frequency distribution (
Figure 9) as well as the spatial pattern of SDL (
Figure 10) show a strong convergence between the outcomes of
BAU and
TDP. The proportion of “
quite degraded” parcels rises from 41.4% (current state) to 65.5% (±0.15) and 67.8% in
BAU and
TDP, respectively. Moreover, the proportion of “highly degraded” areas would be doubled in both simulated situations.
Conversely, in
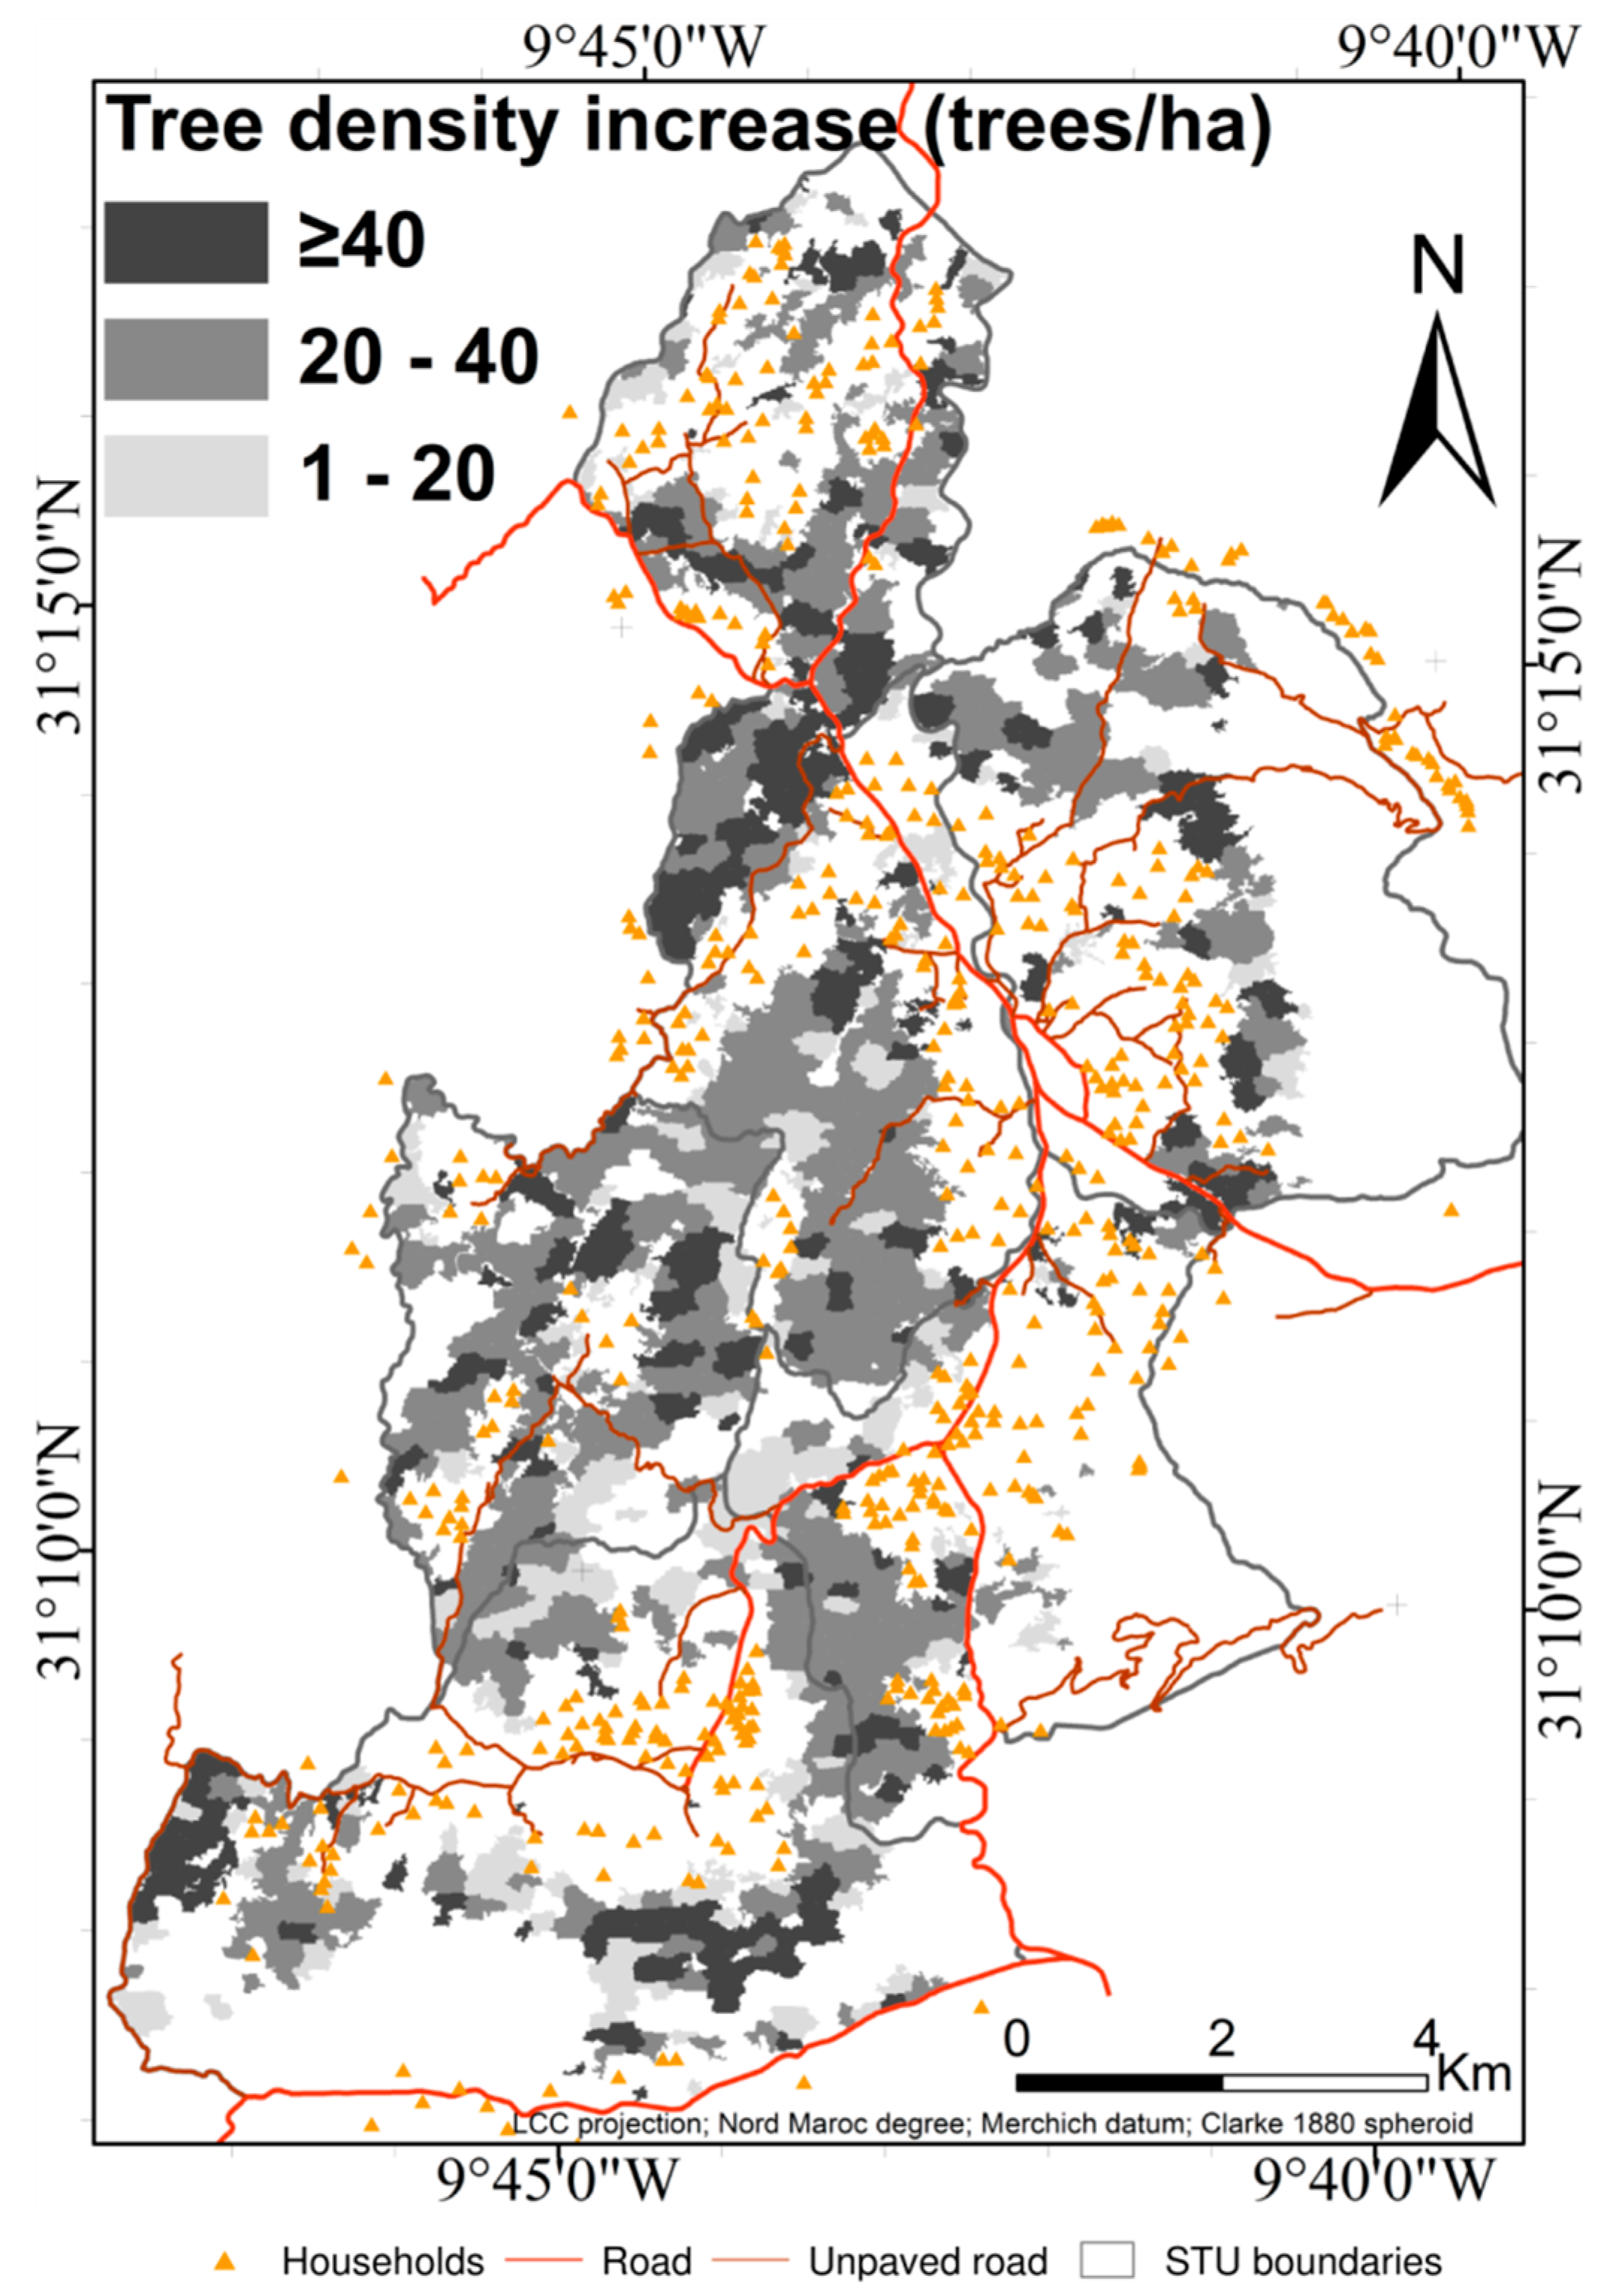
PPP, the total of “slightly degraded” and “restored” areas could reach up to 63.7% (±0.004). This change is mainly gained from the “quite degraded” areas 27.5% (±0.004). The “highly degraded” areas increased slightly from 8.4%–8.7% (±0.001). This overall improvement in stand health status is associated with an increased tree density (
Figure 11). Although SDL transition matrices were the same for all three scenarios, the simulation results show a clear advantage of
PPP.
Figure 9.
Simulated versus current SDL distribution frequencies according to the different scenario after 30 years.
Figure 9.
Simulated versus current SDL distribution frequencies according to the different scenario after 30 years.
Figure 10.
Current stand degradation level and simulated stand degradation level after a 30-year simulation period for scenarios BAU, PPP and TDP (the degradation level of the plots corresponds to the degradation level that has the maximum probability).
Figure 10.
Current stand degradation level and simulated stand degradation level after a 30-year simulation period for scenarios BAU, PPP and TDP (the degradation level of the plots corresponds to the degradation level that has the maximum probability).
Figure 11.
Simulated map of tree density change for scenario PPP after 30 years.
Figure 11.
Simulated map of tree density change for scenario PPP after 30 years.
6. Discussion
The integrated overall approach allowed contrasting observed changes to simulated dynamics under hypothetical scenarios. It successfully combined multisource data related to biophysical and socio-economic data, as well as cultural and ethnic behaviors, in order to compare the scenarios.
6.1. Methodological Contributions
Our model successfully accounts for the behaviour of the two main agents: farmers and forest officers. The farmer, as a local stakeholder (or group of stakeholders), acts in a delimited zone, depicted here as STU, to practice his rights of uses. He chooses to acquire (or not) an argan parcel; he goes through a selection process and determines at which moment it will be implemented. The decision making process is affected by the scarcity level of argan parcel implemented as a communication tool between farmers. The second agent is the forest officer who is in charge of applying state policies to manage the argan forest. This agent is incorporated into the model by taking into consideration three land tenure options and negotiating the application of the specified requirements for the use and conservation of argan parcels.
Incorporating locals’ behavior in a realistic way is very challenging for many approaches used in land use modelling. The combination of a suitability function and a stochastic process for argan parcel selection more closely mimics the actual stakeholder’s decision than a purely non-probabilistic approach.
6.2. Assumptions and Limitations
This modelling work is based on three assumptions derived from field observations. The first considers that, once a parcel is acquired, it is not abandoned later on. This abandonment seems unlikely, in particular for PPP which provides financial incentives (PES) to support the restoration of these parcels. Indeed, field based observation indicates an opposite trend of new parcel acquiring. Similarly, it was assumed that qualitative degradation stops once a parcel is acquired. From field observation, the argan stands located in enclosed parcels are more preserved. Indeed, closing reduces land use pressures typically supported by the argan parcel, being used exclusively by one household. The third assumption is related to the unlimited availability of the argan seedlings and the high planting success. This is realistic because the forest nurseries annually produce many thousands of argan seedlings which are made freely available to farmers. The seedlings settle and grow if they are protected from livestock. In this respect, farmers master traditional tools for protecting seedlings as is the case for other fruit trees planted in their private parcels.
The modelling approach also relies on methods/parameters which are defined by expert judgments. The impacts of this subjectivity and its variability according to experts could be assessed from simulation results. This concerns (i) the multicriteria evaluation method (AHP); (ii) the thresholds of required suitability (Si’) (BAU); and (iii) the required rate of planting success (Ti) (PPP).
The AHP provides a comprehensive and rational framework for structuring a decision problem, quantifying stakeholders’ preferences and correlating these measured criteria to overall goals. It has one of the strongest theoretical foundations over other ranking or rating methods and the ability to easily incorporate mixed elements (social and economic data) in the decision process [
51]. Therefore, it is widely used for calculating suitability functions [
12,
24]. To limit the sensitivity of suitability function, Garfi,
et al. [
51] recommends relying on variables mixing external experts and local people or stakeholders. These provide universally relevant knowledge and place specificities to decision process.
The second type of arbitrary parameters used in the modelling approach is the dynamic thresholds, i.e., Si’ and Ti. The former threshold doesn’t have any effect on the simulation results because it was implemented upstream of the parcel selection process. Being a variable threshold according to the parcels scarcity, it favours the contiguity of the acquired parcels as observed in the field. The Ti threshold retrieves among the available parcels, those showing very low ecological potentialities and/or high risk of overgrazing. It serves as a cultural rule necessary for the establishment and success of argan plants and allows contiguity of the possession process. This threshold arbitrarily calculated from the argan parcels scarcity could have an effect on the model simulation. Indeed, the stochastic component included in the model is responsible for variable results for the same parameter value, making it difficult to assess the model sensitivity to the Ti parameter, as long as it remains in the typical range of the Ti values.
6.3. Forest Impacts and Social Benefits
Our analysis shows that a successful PPP might serve to increase tree density and to better control the qualitative degradation. The possession dynamics could involve 48% of the argan area and make argan tree stands denser by an average of 25 trees/ha after 30 years. Two afforestation types could be done in this scenario namely “tree planting” by users in acquired parcels and “perimeter planting” as routinely implemented by the forest administration. The planting perimeters could involve the remaining available argan parcels, which amounts to 52% of the total argan parcels in the present case. Furthermore, this scenario would provide greater management flexibility.
With the BAU, the current dynamics of qualitative forest degradation continues and the proportions of “quite degraded” and “highly degraded” stand rise by 58% and 108%, respectively, compared to the present state. BAU appears to be quite similar to the pessimistic scenario (TDP), which could be due to the low rate of illegal acquiring. It is however surprising that the current practices observed in a context of argan oil boom lead to the same qualitative degradation than a scenario without any interest in argan forest.
In addition to the argan forest ecological and environmental roles, the increasing tree capital (25 trees/ha in average over 30 years for PPP) should contribute to the survival of several hundreds of domestic livestock and improve household income. The annual harvest of nuts would increase by an amount equivalent to 750 kg/ha (30 kg of nuts per tree with 25 trees/ha). It could contribute to the household budget with an additional financial input of about 200–370 US $ per year. Such an increase will undoubtedly have a significant effect on local poverty mitigation.
Beyond the quantitative results comparing these three scenarios, the proposed model leads to the establishment of a decision support system. The proposed system is an operational framework to further investigate forest management scenarios by assessing their expected impact in the context of a real landscape. In this study, this system provides different kind of answers:
- (i)
“if we give more latitude rights to locals and economic incentive for argan tree planting”, what would be the impact on land possession and stand degradation changes of argan forest. It could be used to identify the order of magnitude of the on-going process and the possible alternatives of the future landscape scenarios (how much);
- (ii)
Quantifying household preferences and perceptions of their territory for adverse possession pretentions and anticipating possible land competition induced by the new policy (feedback);
- (iii)
Pinpointing the high priority areas with high potential for land conservation and degradation hot-spots (where).
The public/private partnership as a framework for co-management of the argan forest could restore trust between the forest staff and the local communities. Redefining this relationship by giving more local communities more opportunity to take initiative with full recognition of the rights of use and by providing interesting economic incentives to support sustainable forest management as a payment for ecosystem services could increase their involvement in managing and restoring this ecosystem. Additional incentive mechanisms already implemented in the region (cooperatives, IGP, oil marketing, etc.) should be maintained in synergy with those explored by the PPP scenario to sustain forest conservation and rural development. The system of incentive mechanisms could fit in existing traditional system of land management to determine beneficiaries and delineate land management units (agdal parcels). The compliance with existing rights when implementing incentives would help in preventing conflicts between local stakeholders.
To improve predictions in the mid- to long-term, the modelling approach should include the following three drivers: (1) the demography which slightly decreases in the studied area; (2) the climatic change that seems to induce an increasing aridity; and (3) the exponential impact of aging forest stands on tree dieback and tree density decrease.
Restoring the trust between forest officers and local stakeholders and providing incentive to the population for taking over the management of their own forests might play in favor of a better conservation of the argan forest. Nevertheless, it is also interesting to note that the risk of degradation becomes higher for parcels that remain not acquired according to the theory of tragedy of the commons. Such zones could be used to install reforestation perimeters, without any local conflict.


