


Abstract
Enclaves of protected areas are spatial units located within protected area boundaries but excluded from unified management. The spatial scales of associations between enclaves and their surrounding habitat quality remain poorly quantified. Using Wuyishan National Park, with a representative mid-subtropical forest ecosystem, as a case study, we simulated land-use and habitat quality changes for 2035 and 2050 under four management scenarios. By integrating land-use simulations, landscape metrics, and the InVEST habitat quality model, we assessed the direction and relative strength of associations between landscape changes within enclaves and habitat quality changes in the national park and identified the corresponding predictive spatial thresholds. Results show that associations between landscape changes in enclaves and habitat quality change in the national park varied in direction and spatial scale. In the overall analysis, CONTAG showed the largest negative contrasts under BAU and BCM, while PD and LPI had longer predictive thresholds under alternative management scenarios, at 48.5 and 39.0 km, respectively. Large built-up disturbance enclaves had the largest mean absolute conditional contrasts across all six metrics under alternative management scenarios. The findings provide actionable evidence for differentiated enclave management and spatially targeted conservation planning, with broader implications for biodiversity conservation in protected areas facing complex human–nature interactions.
1. Introduction
Under the combined effects of climate change and intensive human activities, continuing biodiversity loss, ecosystem degradation, and functional decline have become increasingly prominent worldwide, posing shared challenges for ecosystem conservation [1,2,3]. In response, protected areas have continued to increase globally [4,5], as becoming important spatial instruments for biodiversity conservation [6,7]. However, protected area designation does not necessarily ensure uniform conservation outcomes, which may vary among taxonomic groups, biogeographic regions, and environmental contexts [8,9]. The Kunming–Montreal Global Biodiversity Framework further emphasizes the importance of maintaining and restoring ecosystem integrity, connectivity, and resilience [10]. Within national parks, these conservation objectives require attention to the spatial distribution of habitats and human activities. For national parks established to conserve representative ecosystems, ecosystem integrity is reflected not only in the delineation of national park boundaries, but also in the continuity of internal landscape structures and the extent to which human activity units interfere with ecological processes [11]. Accordingly, whether special spatial units that may weaken ecosystem integrity exist within national parks, and how such units affect overall habitat quality, have become important questions requiring further attention [12].
In protected areas worldwide, enclaves not incorporated into unified management exist within protected area boundaries. Similar cases have been reported in Cross River National Park in Nigeria [13,14], Nahanni National Park Reserve in Canada [15], Gunung Leuser National Park [16], Mount Halimun National Park [17], and Kerinci Seblat National Park [18,19] in Indonesia, as well as the Kalakad–Mundanthurai Tiger Reserve in India [20,21]. These discontinuous spaces are usually located within the geographical boundaries of protected areas but remain relatively independent in terms of governance, tenure, land use, and development objectives. Their formation contexts and governance arrangements vary considerably across countries, shaped by property rights systems, community relations, historical processes, and the implementation of conservation policies [22,23,24]. As a result, enclaves can become weak links in the ecological integrity of protected areas. On the one hand, in some studies, enclaves were regarded as a practical pathway for balancing ecological conservation and community development and for reducing conflicts over land tenure [25,26]. On the other hand, enclaves may intensify habitat fragmentation, weaken landscape connectivity, increase edge effects and risks of human disturbance, and even give rise to issues of environmental equity and community governance [27,28,29,30,31,32]. Overall, the existing research has focused mainly on enclave governance models, ecosystem service values, and the degree of forest fragmentation [33,34,35]. Systematic quantitative analyses of their spatial distribution, future trajectories, and spatial associations with ecological quality changes in protected areas remain limited, particularly with respect to identifying their associations and predictive spatial thresholds under different policy scenarios. This limitation constrains refined management for different types of enclaves in protected areas.
Enclaves within national parks in China share several common features with similar cases in protected areas worldwide. They are spatially located inside protected area boundaries but remain partly or fully outside unified conservation management because of differences in land tenure, land use, community livelihoods, or development objectives. Enclaves of national parks in China share a common issue with many protected areas elsewhere, namely conservation boundaries must be managed alongside existing human activities and local development needs. However, their formation is closely tied to China’s institutional context. The national park system has been developed in parallel with territorial spatial planning tools, including the Ecological Conservation Redline, Permanent Basic Farmland Protection Redline, and Urban Development Boundary. As national park boundaries were defined and adjusted, some village settlements, town built-up areas, commercial forests, and permanent basic farmland remained geographically inside the parks but outside unified park management [12]. Compared with enclaves shaped mainly by historical settlement, customary tenure, or community-based arrangements in other countries, Chinese national park enclaves are more directly linked to state-led boundary optimization and land-use coordination [24]. This institutional background makes them a useful case for analysing the relationships between internal human-use spaces and ecological integrity and how differentiated management can be designed for national parks.
Wuyishan National Park is a suitable case for analysing spatial associations between enclave landscape patterns and habitat quality in China’s national park system. As one of the first officially designated national parks in China, it is located in the Wuyishan Biodiversity Priority Conservation Area [36] and contains extensive well-preserved mid-subtropical primary forest [37]. Its enclaves are spatially scattered, differ in land-use composition, and are closely associated with local production and settlement activities [38]. However, there is limited understanding of how enclave landscape patterns and modeled habitat quality change under alternative management scenarios, and how their relationships vary with spatial scale, enclave type, and area. To address these questions, multi-scenario land-use simulation, landscape pattern analysis, InVEST-based habitat quality assessment, and spatial threshold analysis were integrated to examine three research questions: (1) To what extent do the four management scenarios reshape enclave land use, landscape patterns, and habitat quality by mid-century? (2) What are the directions, relative strengths, and predictive spatial thresholds of the associations between enclave landscape metrics and modeled habitat quality change across management scenarios? (3) What differences in these associations and predictive spatial thresholds occur among enclave types, area classes, and their combinations? By linking enclave landscape dynamics with modeled habitat quality change in the national parks and identifying predictive spatial thresholds, a quantitative basis is provided for differentiated management of national park enclaves.
2. Materials and Methods
2.1. Study Area
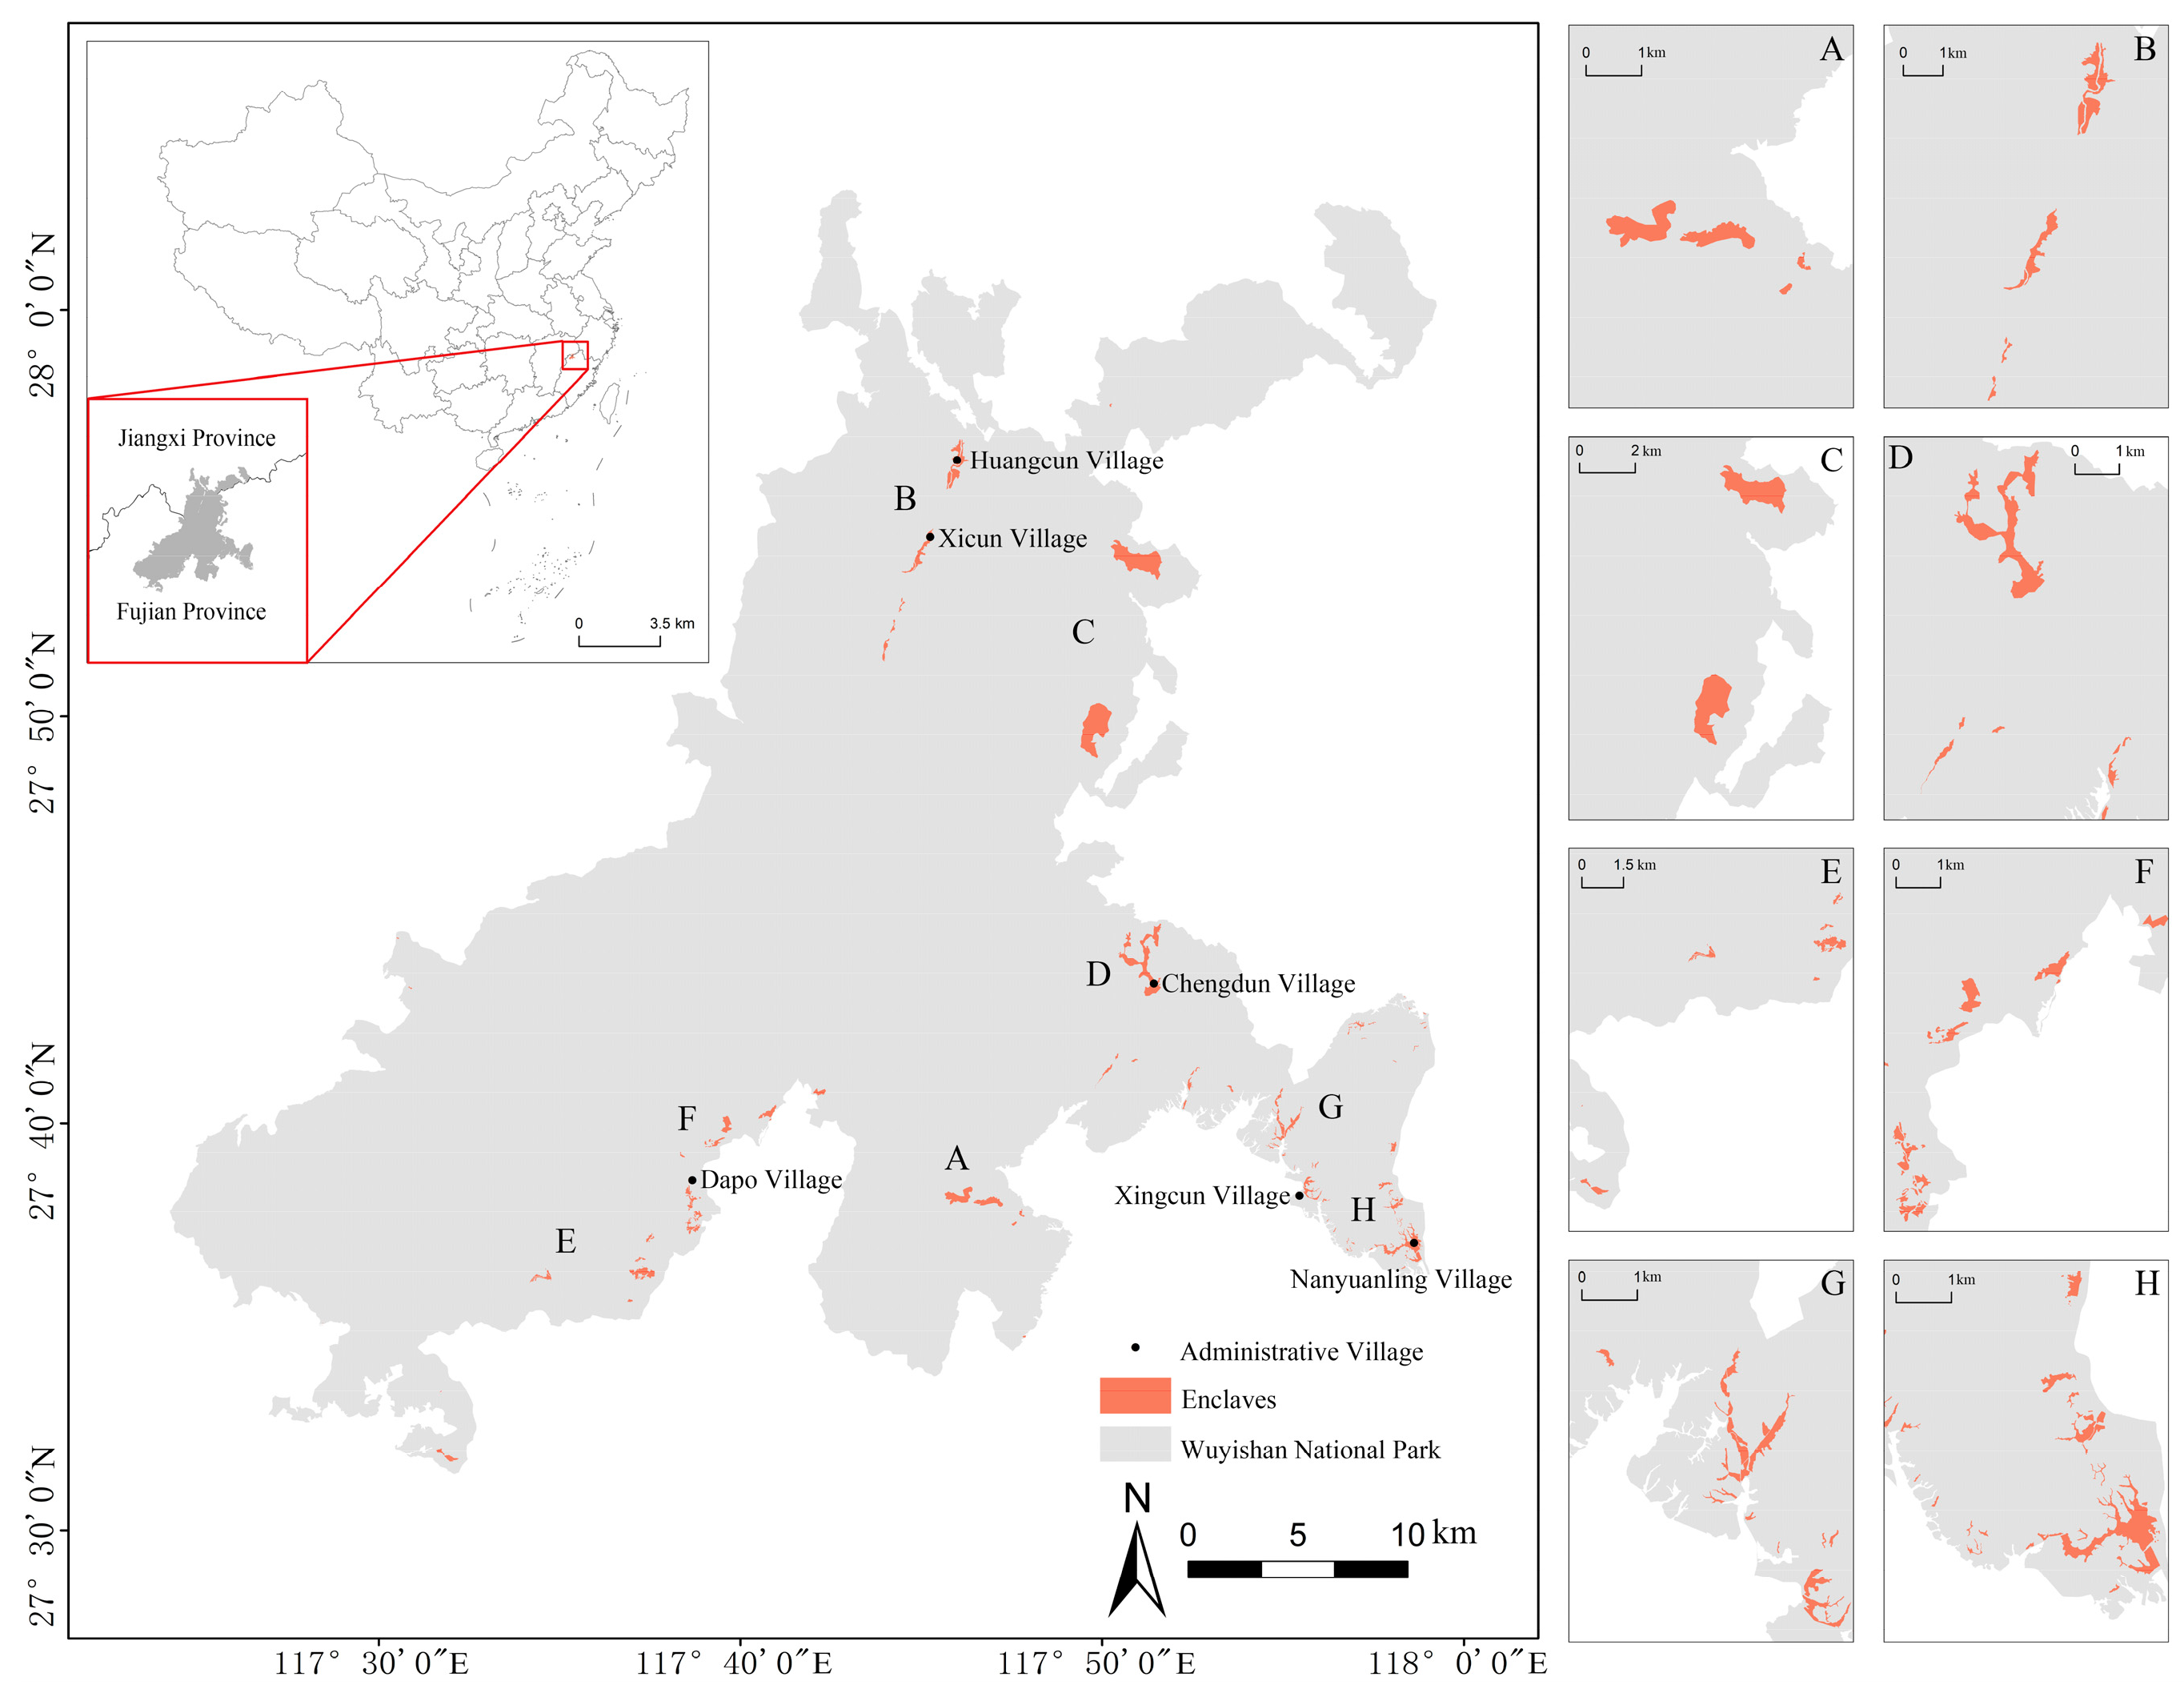
Wuyishan National Park was included in China’s first group of officially designated national parks. It preserves a large area of primary mid-subtropical forest, which is considered highly representative among forests at comparable latitudes [39]. The national park is located in southeastern China, in the northern part of the Wuyi Mountains along the Fujian–Jiangxi provincial boundary, extending from 117°24′15″ to 117°59′33″ E and from 27°31′21″ to 28°02′53″ N (Figure 1). During the establishment of the national park, several enclave areas were delimited within the park boundary, but they are discontinuously distributed. These enclaves are clustered mainly in the eastern and southern parts of the national park, particularly in the Fujian section near Xikeng, Chengdun, Dapo, and Nanyuanling villages. Together, the enclaves occupy 11.14 km2, equivalent to about 0.87% of the park’s total area, and their elevation spans from 187 to 1786 m. The study area is characterized by a subtropical monsoon climate, with clear seasonal temperature differences, an annual mean temperature of about 17–19 °C, and relatively high rainfall. Mean annual precipitation ranges between 1684 and 1780 mm.
Figure 1.
Location of enclaves in Wuyishan National Park, China.
2.2. Data Sources and Preprocessing
The data used included Landsat remote sensing imagery, digital elevation model (DEM) data, mean annual temperature, mean annual precipitation, road network data, water data, settlement data, and enclave boundary data for Wuyishan National Park. Raster datasets were preprocessed in ArcGIS 10.8 through mosaicking, projection, resampling, and clipping to ensure a consistent 30 m spatial resolution and a common coordinate system, WGS 1984 UTM Zone 50N. Detailed data sources are provided in Supplementary Table S1.
2.3. Methods
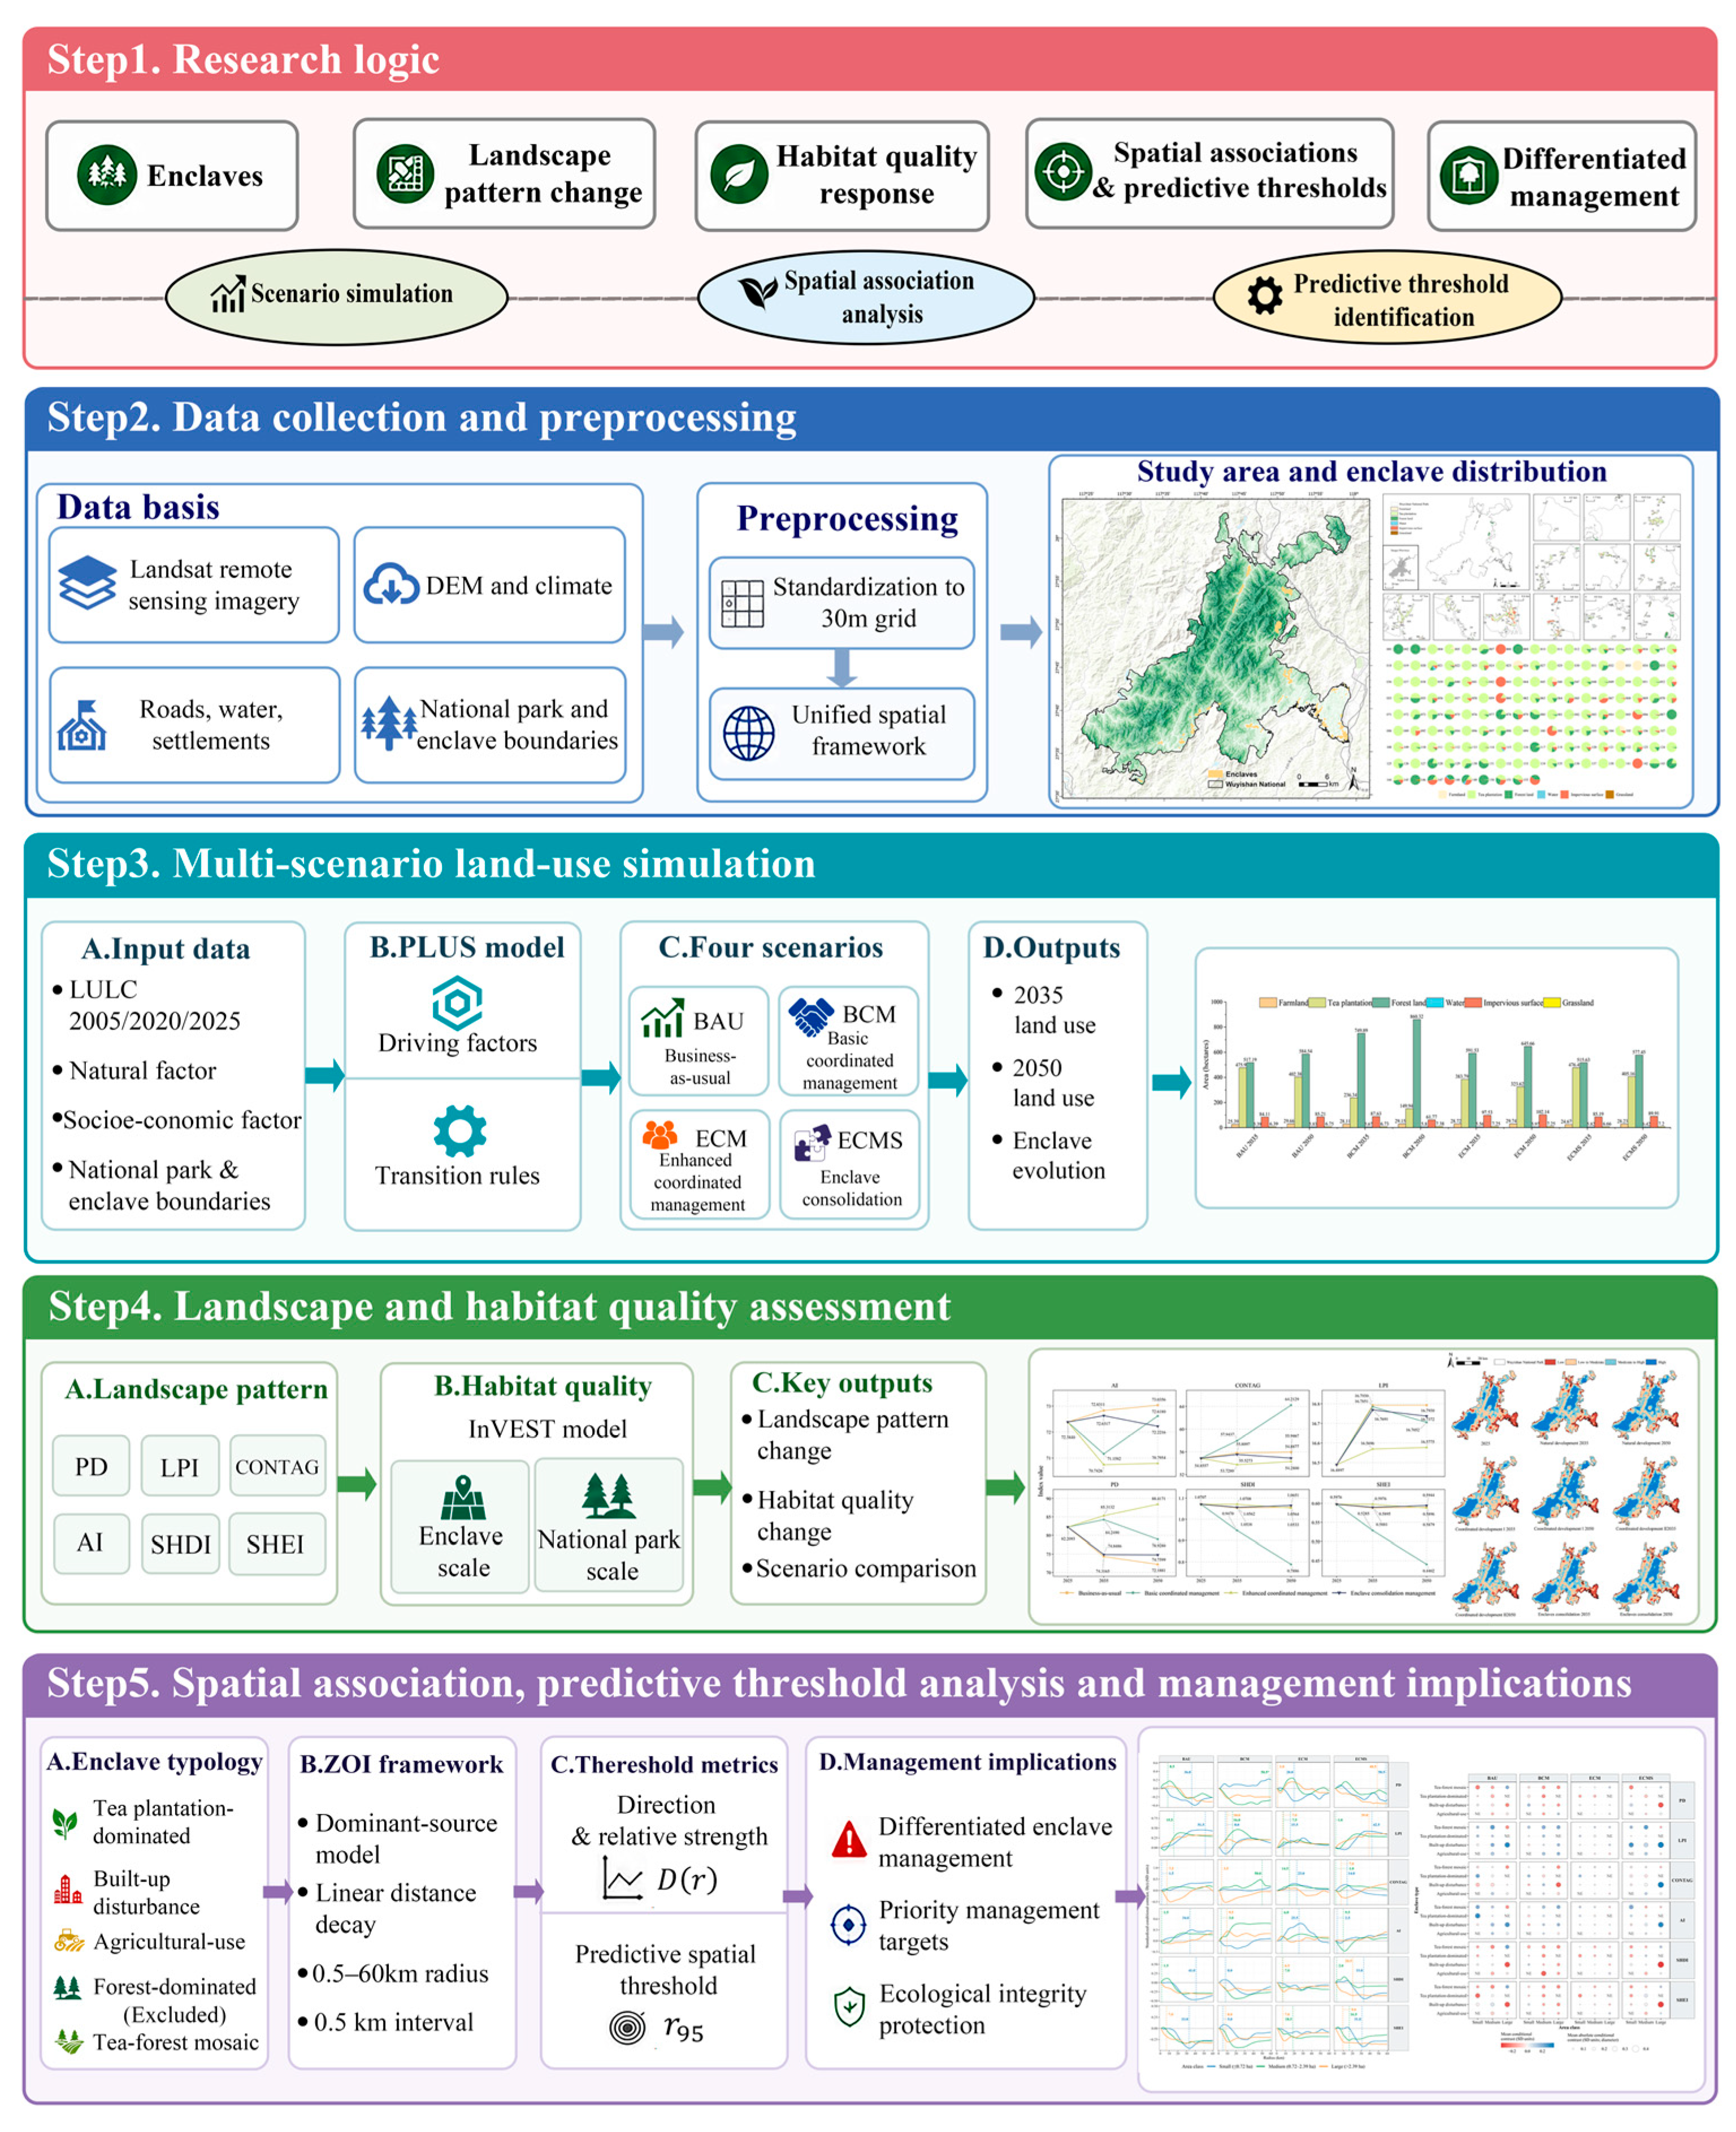
An integrated analytical framework was developed to assess landscape changes in national park enclaves and characterize their spatial associations with habitat quality change in the national park. First, multi-source spatial datasets, including land-use maps, environmental variables, road networks, water, settlements, and park/enclave boundaries, were standardized to a 30 m grid. The current spatial pattern and land-use composition of the enclaves were then characterized, and future land-use patterns for 2035 and 2050 were simulated using the PLUS model under four management scenarios. Based on the simulated land-use maps, landscape pattern metrics were calculated for the enclaves, and habitat quality was assessed for both the enclaves and Wuyishan National Park using the InVEST Habitat Quality module. Enclave types were further identified using k-means clustering based on land-use composition. Finally, a zone-of-influence framework and a dominant-source model were used to evaluate the conditional spatial associations between changes in landscape patterns within enclaves and changes in habitat quality across Wuyishan National Park at a series of candidate radii. The standardized conditional contrast, D(r), was used to describe the direction and relative strength of these associations. The incremental out-of-sample predictive contribution, expressed as ΔCV-R2, was used to derive , the minimum radius at which the positive predictive gain reached 95% of its maximum, which was used as the predictive spatial threshold (Figure 2).
Figure 2.
Methodology framework.
2.3.1. Multi-Scenario Land-Use Simulation of Enclaves and the National Park
- PLUS future land-use model
The PLUS model provides a spatially explicit analytical framework simulating land-use transitions by combining cellular automata with patch-scale land expansion processes. PLUS improves the extraction of land-transition rules and represents dynamic land-use processes, allowing land-use simulations to account for land-use planning policies and regional sustainability goals [40,41]. Land-use maps from 2005 and 2020 were used as the baseline inputs. To evaluate the simulation accuracy of the PLUS model, the simulated land-use map for 2020 was compared with the observed map for the same year using the Kappa coefficient. The resulting coefficient was 0.90, indicating high agreement between the simulated and observed land-use patterns. This assessment supported the subsequent application of the model to future scenario simulations. The model was then applied to project land-use patterns for 2035 and 2050 under four scenarios: the business-as-usual scenario (BAU), the basic coordinated management scenario (BCM), the enhanced coordinated management scenario (ECM), and the enclave consolidation management scenario (ECMS).
Based on previous studies and the local conditions in Wuyishan National Park, eight driving factors were selected according to consistency, quantifiability, relevance, and data availability (see Supplementary Table S2). These factors were used to characterize environmental conditions and accessibility, including elevation, climate variables, slope, aspect, and proximity to roads, water, and settlements [42,43,44].
- 2.
- Multi-scenario land-use simulation;
To compare strategies for balancing enclave conservation and development in Wuyishan National Park, four scenarios were designed. Differences in management measures and simulated ecological outcomes were compared to evaluate potential pathways for balancing conservation and development under different management approaches. The four scenarios were the Business-as-usual scenario (BAU), Basic coordinated management scenario (BCM), Enhanced coordinated management scenario (ECM), and Enclave consolidation management scenario (ECMS).
The coordinated management scenarios were developed based on the requirements of the Master Plan for the Protection and Development Belt around Wuyishan National Park, under which enclaves are managed under the policy framework of the conservation coordination zone. These requirements emphasize the protection of natural ecological communities and permanent basic farmland, moderate restrictions on human activities, and control of urban expansion. To represent these management priorities, different percentage adjustments were applied to the historical land-use transition probabilities to explore alternative combinations of forest protection and restoration (Table 1). To reduce boundary effects during land-use transitions, the national park was included in the simulation domain. Under all coordinated management scenarios, the conversion of farmland within enclaves to other land-use types was restricted, the national park within the simulation domain was designated as a forest conservation area, and transition probabilities among the remaining land-use types were constrained. Scenario settings are described below.
Table 1.
Scenario settings.
2.3.2. Landscape Pattern Metrics of Enclaves
Considering the features of the study area and previous studies, six metrics were selected at the landscape level to represent fragmentation, connectivity, and diversity: patch density (PD), largest patch index (LPI), aggregation index (AI), contagion index (CONTAG), Shannon’s diversity index (SHDI), and Shannon’s evenness index (SHEI) (see Supplementary Table S3). The moving window method in Fragstats 4.2 was used to visualize landscape pattern metrics. To assess the sensitivity of each landscape metric to window size, PD, LPI, AI, CONTAG, SHDI, and SHEI were calculated using square windows of 90, 150, 210, 270, and 330 m based on the 2020 land-use data at a 30 m resolution. Correlations and numerical differences were assessed separately for each metric at sampling locations with valid values under all five window sizes. Between the 210 m and 270 m windows, Pearson correlation coefficients were 0.92 for PD, 0.97 for LPI, 0.96 for AI, 0.92 for CONTAG, 0.98 for SHDI, and 0.97 for SHEI, indicating high consistency in relative spatial patterns across the six metrics at these two scales. Considering these results, the landscape patch scale of the study area, local landscape representation needs, computational stability, and comparability among metrics, a 210 m window was selected as the common analytical scale for all six metrics.
2.3.3. Habitat Quality Assessment of Enclaves and the National Park
The habitat status of Wuyishan National Park and its enclaves was assessed using the habitat quality module of the InVEST model. Required inputs included land-use data, threat factor data, threat source parameters, habitat suitability, land-use sensitivity to threats, and the half-saturation constant (see Supplementary Section S4 for details). Considering the environmental characteristics of the study area and previous research, farmland, tea plantations, and impervious surfaces were identified as habitat threat factors. The threat factors, maximum threat distance, weights, and decay types were then defined. To enable comparison across scenarios and years, habitat quality was classified using the 2025 enclave habitat quality results as the baseline, and was divided into four classes using the natural breaks method in ArcGIS: low (0), medium–low (0–0.316), medium–high (0.316–0.444), and high (0.444–1). The same classification standard was applied to all subsequent scenario analyses.
2.3.4. Spatial Association and Threshold Analysis of Enclaves
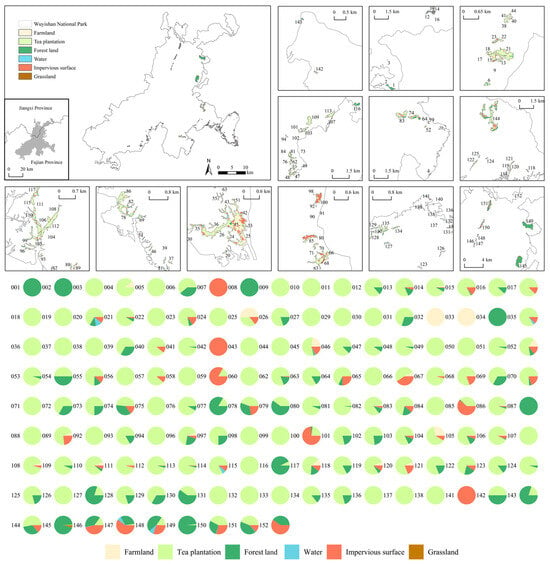
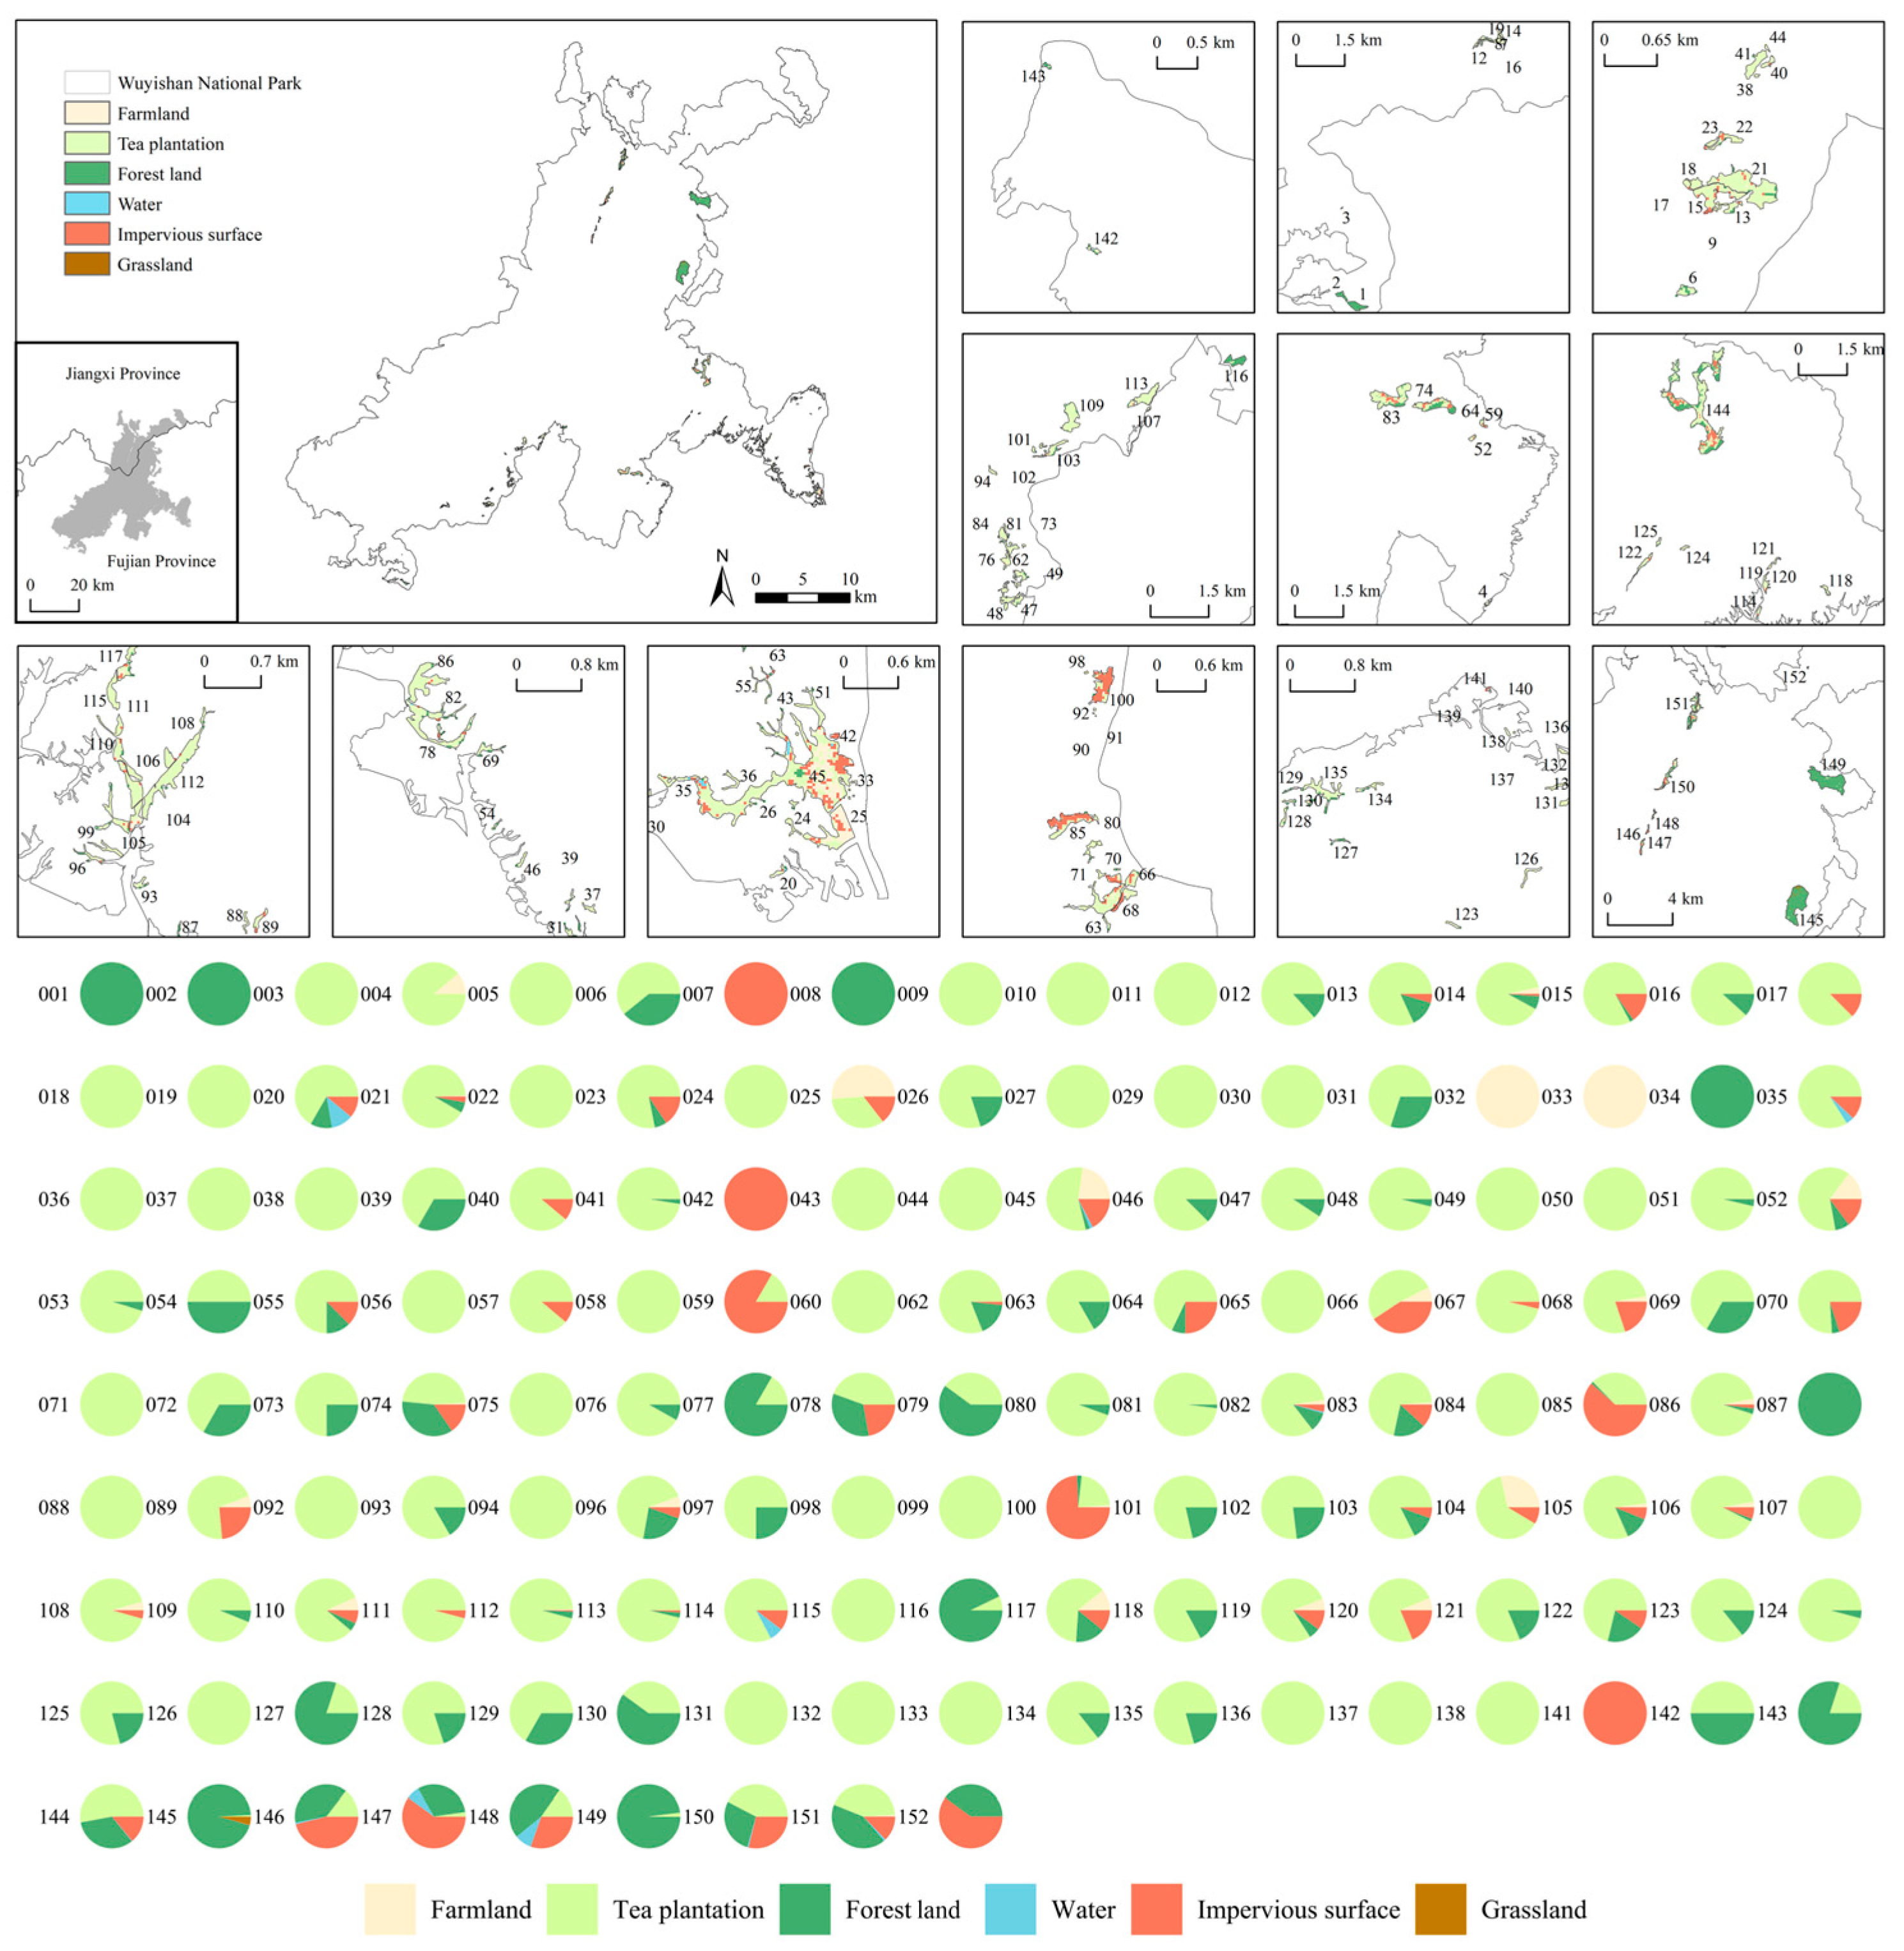
Of the 152 enclaves identified within Wuyishan National Park, seven yielded no valid land-use raster values under the 30 m raster extraction procedure (see Figure 3 for the excluded enclaves). The remaining 145 enclaves were classified according to their land-use composition using unsupervised k-means clustering (see Supplementary Section S5 for details), enclaves containing very high forest proportions were further identified. Five enclave types were distinguished: tea plantation-dominated enclaves, built-up disturbance enclaves, agricultural-use enclaves, forest-dominated enclaves, and tea–forest mosaic enclaves. The subsequent spatial association analyses were restricted to enclaves containing substantial areas of agricultural land, tea plantations, or impervious surfaces, as these land uses reflect production activities that may affect ecological processes within protected areas [45,46]. The 13 forest-dominated enclaves were excluded because their land-use composition was similar to the surrounding forest matrix and therefore provided limited contrast in the land-use conditions examined. The remaining 132 enclaves, comprising the other four enclave types, were included in the subsequent analyses.
Figure 3.
Current land use of enclaves in Wuyishan National Park (note: due to limitations in data resolution, zoning statistics could not be calculated for enclaves No. 028, 061, 090, 091, 095, 139, and 140. These enclaves were excluded, and 145 enclaves were included in the analysis).
To examine conditional spatial associations between landscape pattern changes in different enclave types and habitat quality in the national park, the zone-of-influence (ZOI) framework proposed by Niebuhr et al. (2023) [47] was adopted. The source strength of each enclave was defined as its area-weighted signed change in a given landscape metric. A linear distance–decay function was applied, and the enclave with the largest absolute distance-weighted contribution was retained as the dominant source for each sampling point. Details of the ZOI exposure variable are provided in Supplementary Section S6. For each candidate radius from 0.5 to 60 km in 0.5 km increments, a linear model was fitted using the ZOI exposure variable together with elevation, slope, distance to roads, and distance to settlements. For each analysis, 30,000 valid raster cells within the national park and outside the enclave masks were sampled. Predictive performance was evaluated using five-fold spatial block cross-validation with 10 km blocks.
The change in cross-validated R2 after adding the ZOI exposure variable was used to represent the incremental out-of-sample predictive contribution of the enclave landscape pattern variable at radius r:
where denotes the change in cross-validated predictive performance at radius ; is the five-fold spatially cross-validated R2 of the model containing the control variables and the ZOI exposure value; and is the corresponding R2 of the control-only model containing only the control variables.
To describe the direction and relative strength of the conditional association between ZOI exposure and habitat quality change, was defined as the standardized difference in predicted habitat quality change between high and low ZOI exposure:
where is the standardized predicted habitat quality change contrast between the 95th and 5th percentiles of ZOI exposure at radius ; is the corresponding regression coefficient; and are the 95th and 5th percentiles of ZOI exposure, representing relatively high and low exposure levels; and is the standard deviation of habitat quality change.
To identify a predictive gain spatial threshold, the minimum radius at which the positive incremental predictive gain reached at least 95% of its maximum across the candidate radii was defined as the predictive spatial threshold:
where represents the smallest radius at which the positive incremental predictive gain reaches at least 95% of its maximum; is the candidate radius evaluated; and indexes all candidate radii. The candidate set was km. Sensitivity analyses were conducted using maximum candidate radii of 30, 40, 50, and 60 km and predictive gain criteria of 90%, 95%, and 99% of the maximum positive ΔCV-R2. A maximum candidate radius of 60 km and the 95% criterion were adopted for the main analysis (see Supplementary Section S7). For each combination of scenario and landscape metric, the procedure was applied to the full retained enclave sample and then separately to groups defined by enclave type and to groups defined by enclave area class. Further details of ZOI construction, sampling, and spatial cross-validation are provided in Supplementary Section S6.
3. Results
3.1. Current Status of Enclaves in Wuyishan National Park
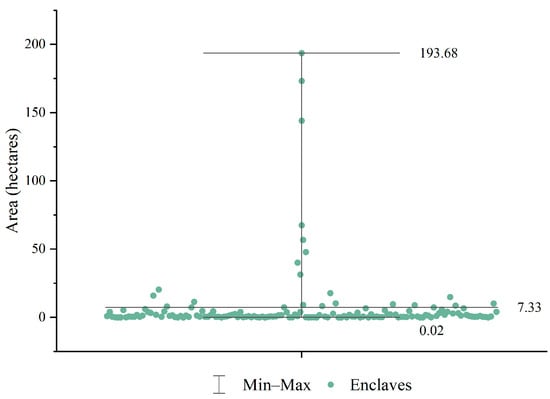
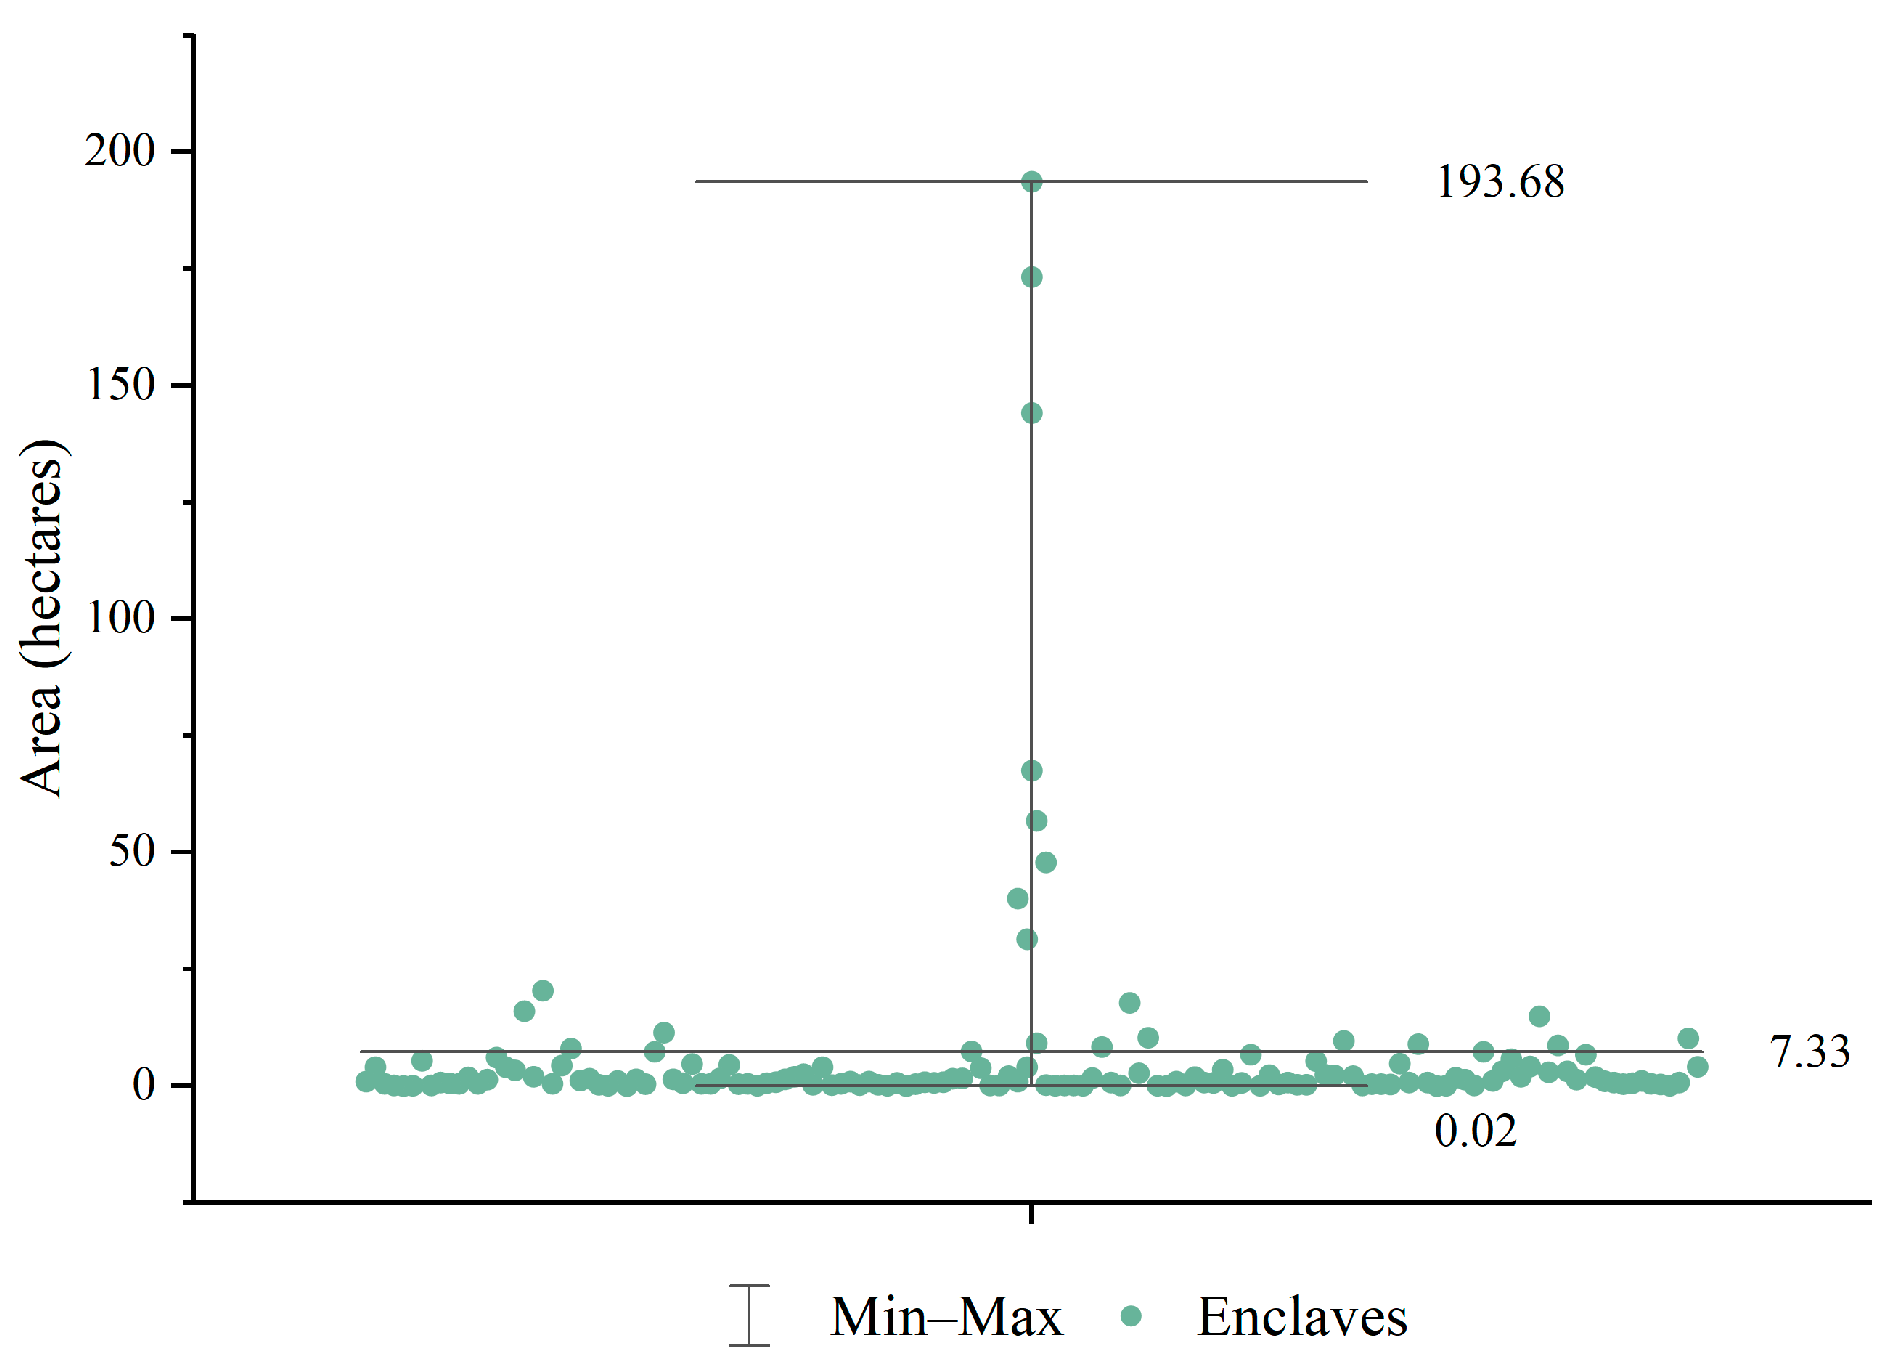
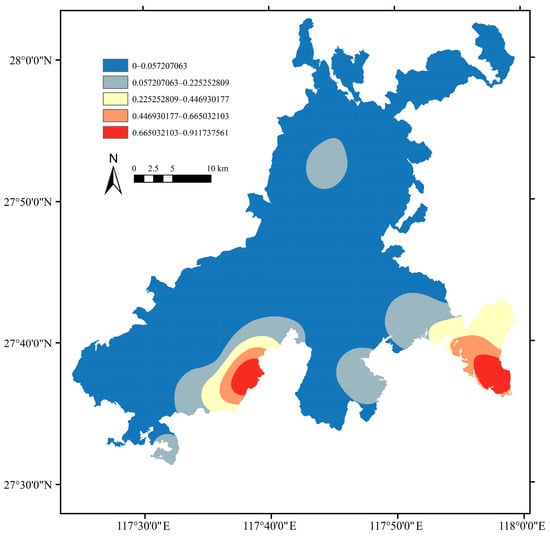
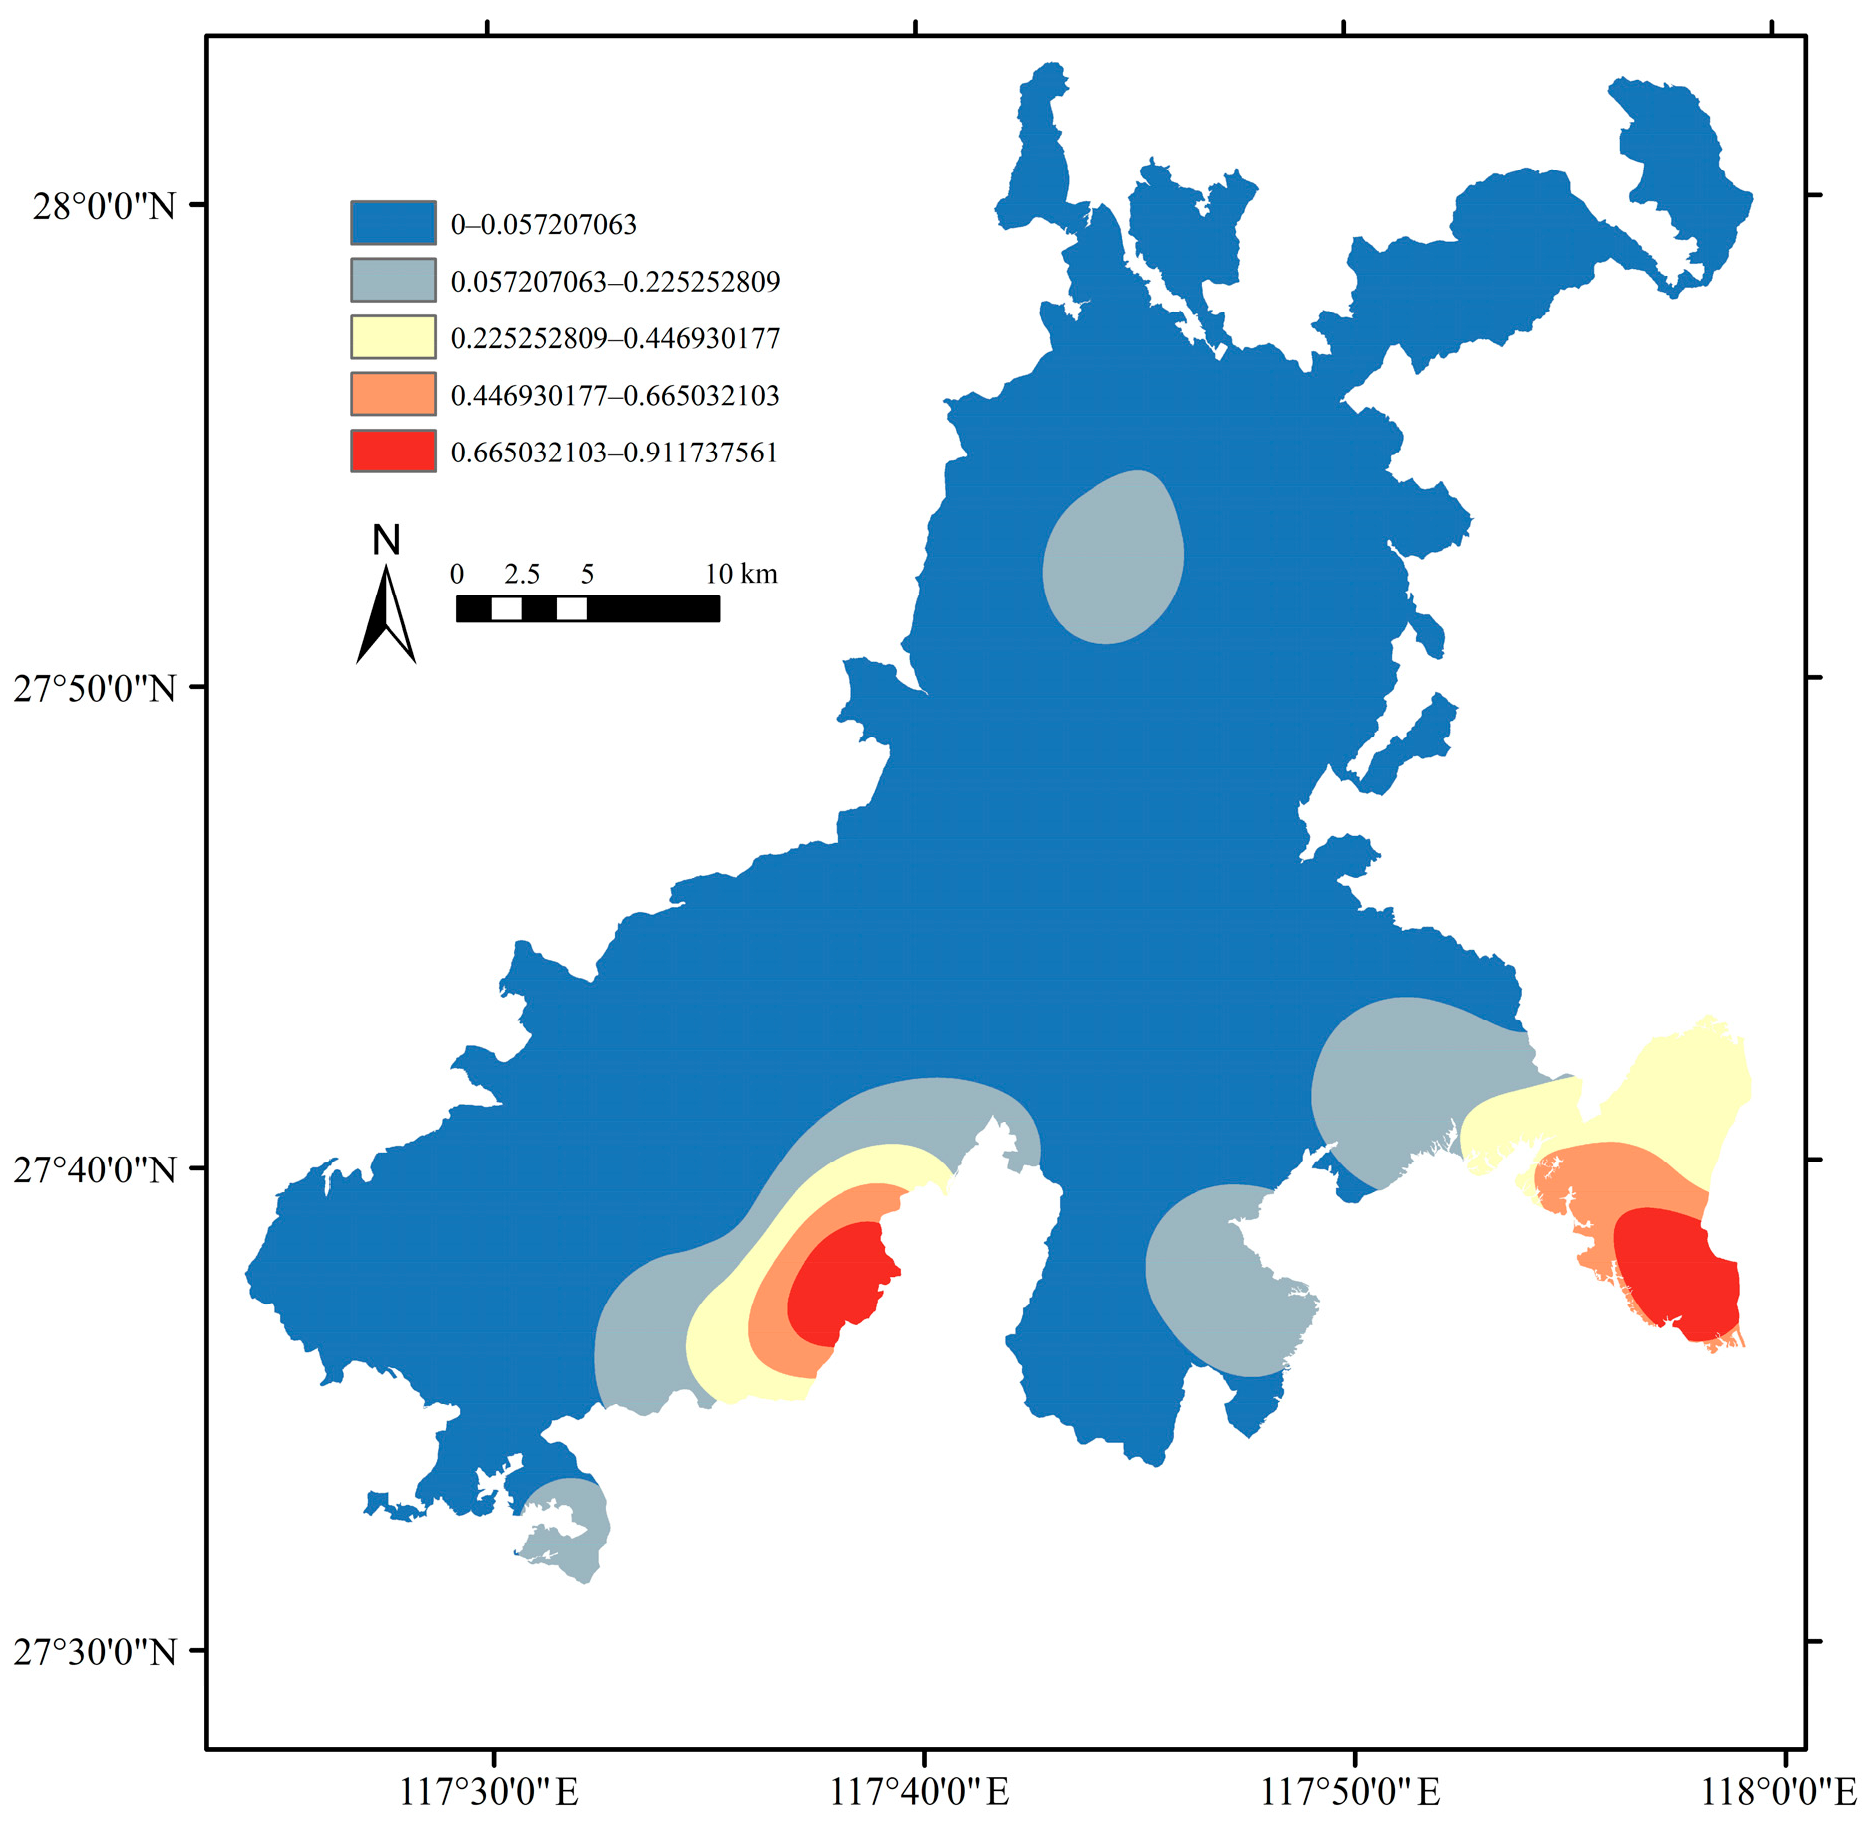
Wuyishan National Park contains 152 enclaves, covering a total area of 1114 ha and accounting for 0.87% of the park area. Of these, 127 ha are located in the Jiangxi section, accounting for 11.4%, and 987 ha are located in the Fujian section, accounting for 88.6%. As shown in Figure 4, enclave size varies considerably. The largest enclave covers 193.68 ha, whereas the smallest covers only 0.02 ha, and 50% of the enclaves are smaller than 1 ha. Their spatial distribution is highly uneven (Figure 5). Enclaves are densely distributed along the boundary of Wuyishan National Park, with irregular shapes and a fragmented spatial arrangement. Their boundaries mainly follow mountain valleys and village boundaries. A prominent high-density cluster is found in the southern part of the national park’s Fujian section, while the Jiangxi section contains fewer enclaves with a relatively concentrated distribution.
Figure 4.
Area distribution of enclaves in Wuyishan National Park.
Figure 5.
Kernel density map of enclaves in Wuyishan National Park.
The area and land-use composition of the enclaves are summarized in Figure 3 and Table 2. Six categories were included in the classification: farmland, tea plantations, forest land, water, impervious surfaces, and grassland. Tea plantations and forest land were the dominant land-use types. Impervious surfaces were mainly concentrated in the southeastern part of Wuyishan National Park and in the Jiangxi section, and were primarily associated with local communities. Farmland was also concentrated in the southeastern part of the park, especially around Nanyuanling Village, where a distinct agricultural area has formed. Tea plantations were mainly concentrated in the southern part of the Fujian section and showed a distinct spatial clustering.
Table 2.
Area of land-use types in the enclaves of Wuyishan National Park.
3.2. Spatiotemporal Changes in Enclave Land Use and Landscape Patterns Under Multi-Scenario Simulation
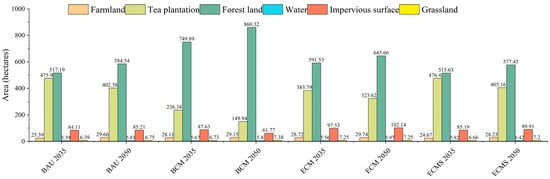
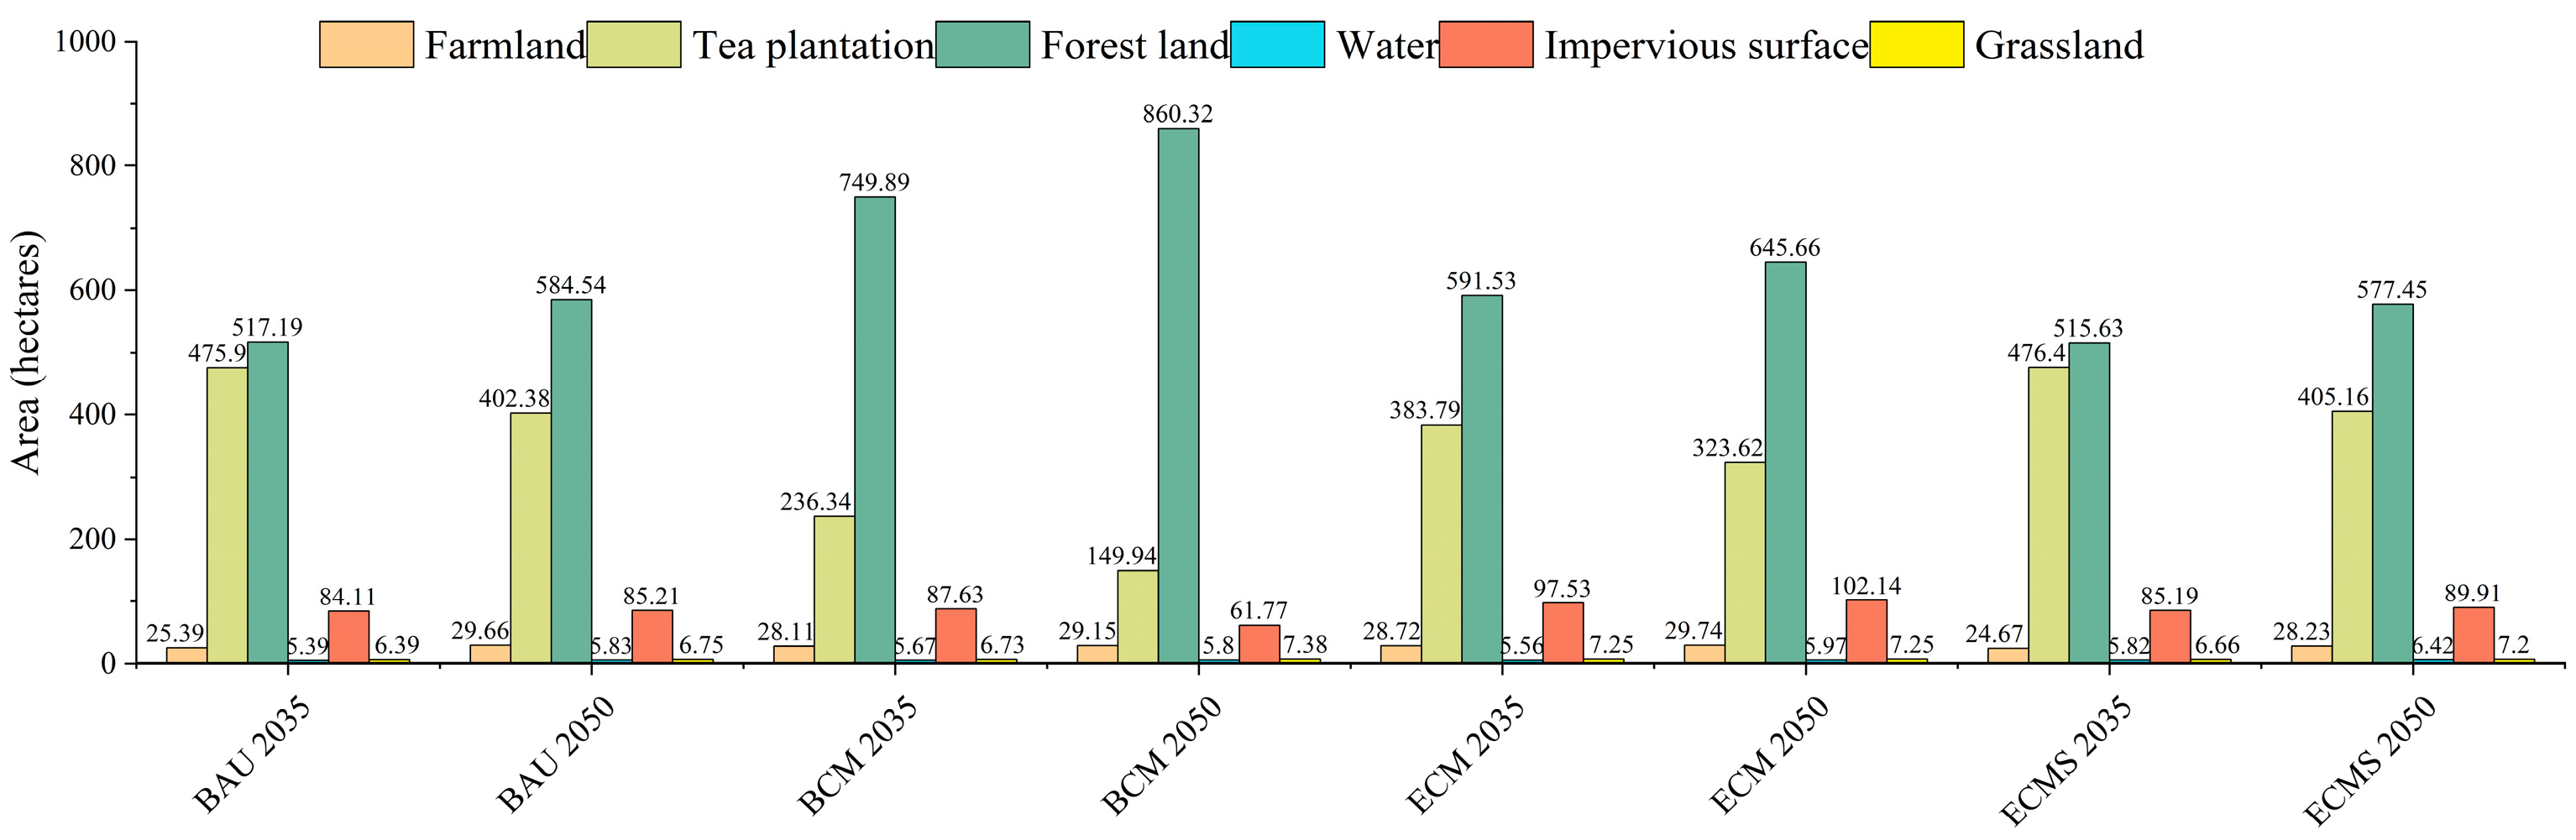
In terms of land use change, the area of tea plantations generally decreased, while the area of forest land increased. Farmland, water, and grassland showed only slight fluctuations. Under the BAU and ECMS scenarios, land-use composition changed only marginally, with impervious surfaces showing a slight overall increase. By contrast, the coordinated management scenarios showed clearer regulatory improvements. The BCM scenario showed the most pronounced changes in land-use composition, with an increase in forest land, a reduction in tea plantations, and the largest decline in impervious surfaces. In comparison, the ECM scenario showed a milder change, with smaller reductions in tea plantations and a more limited expansion of forest land, reflecting a less intensive restoration pathway (Figure 6).
Figure 6.
Land-use changes in the enclaves of Wuyishan National Park under multi-scenario simulation.
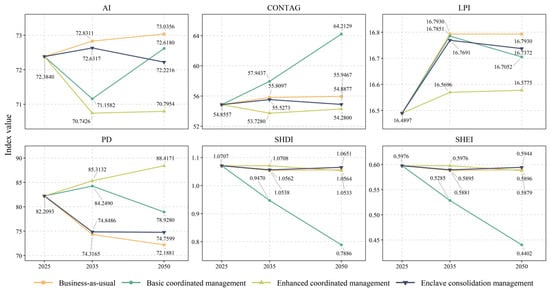
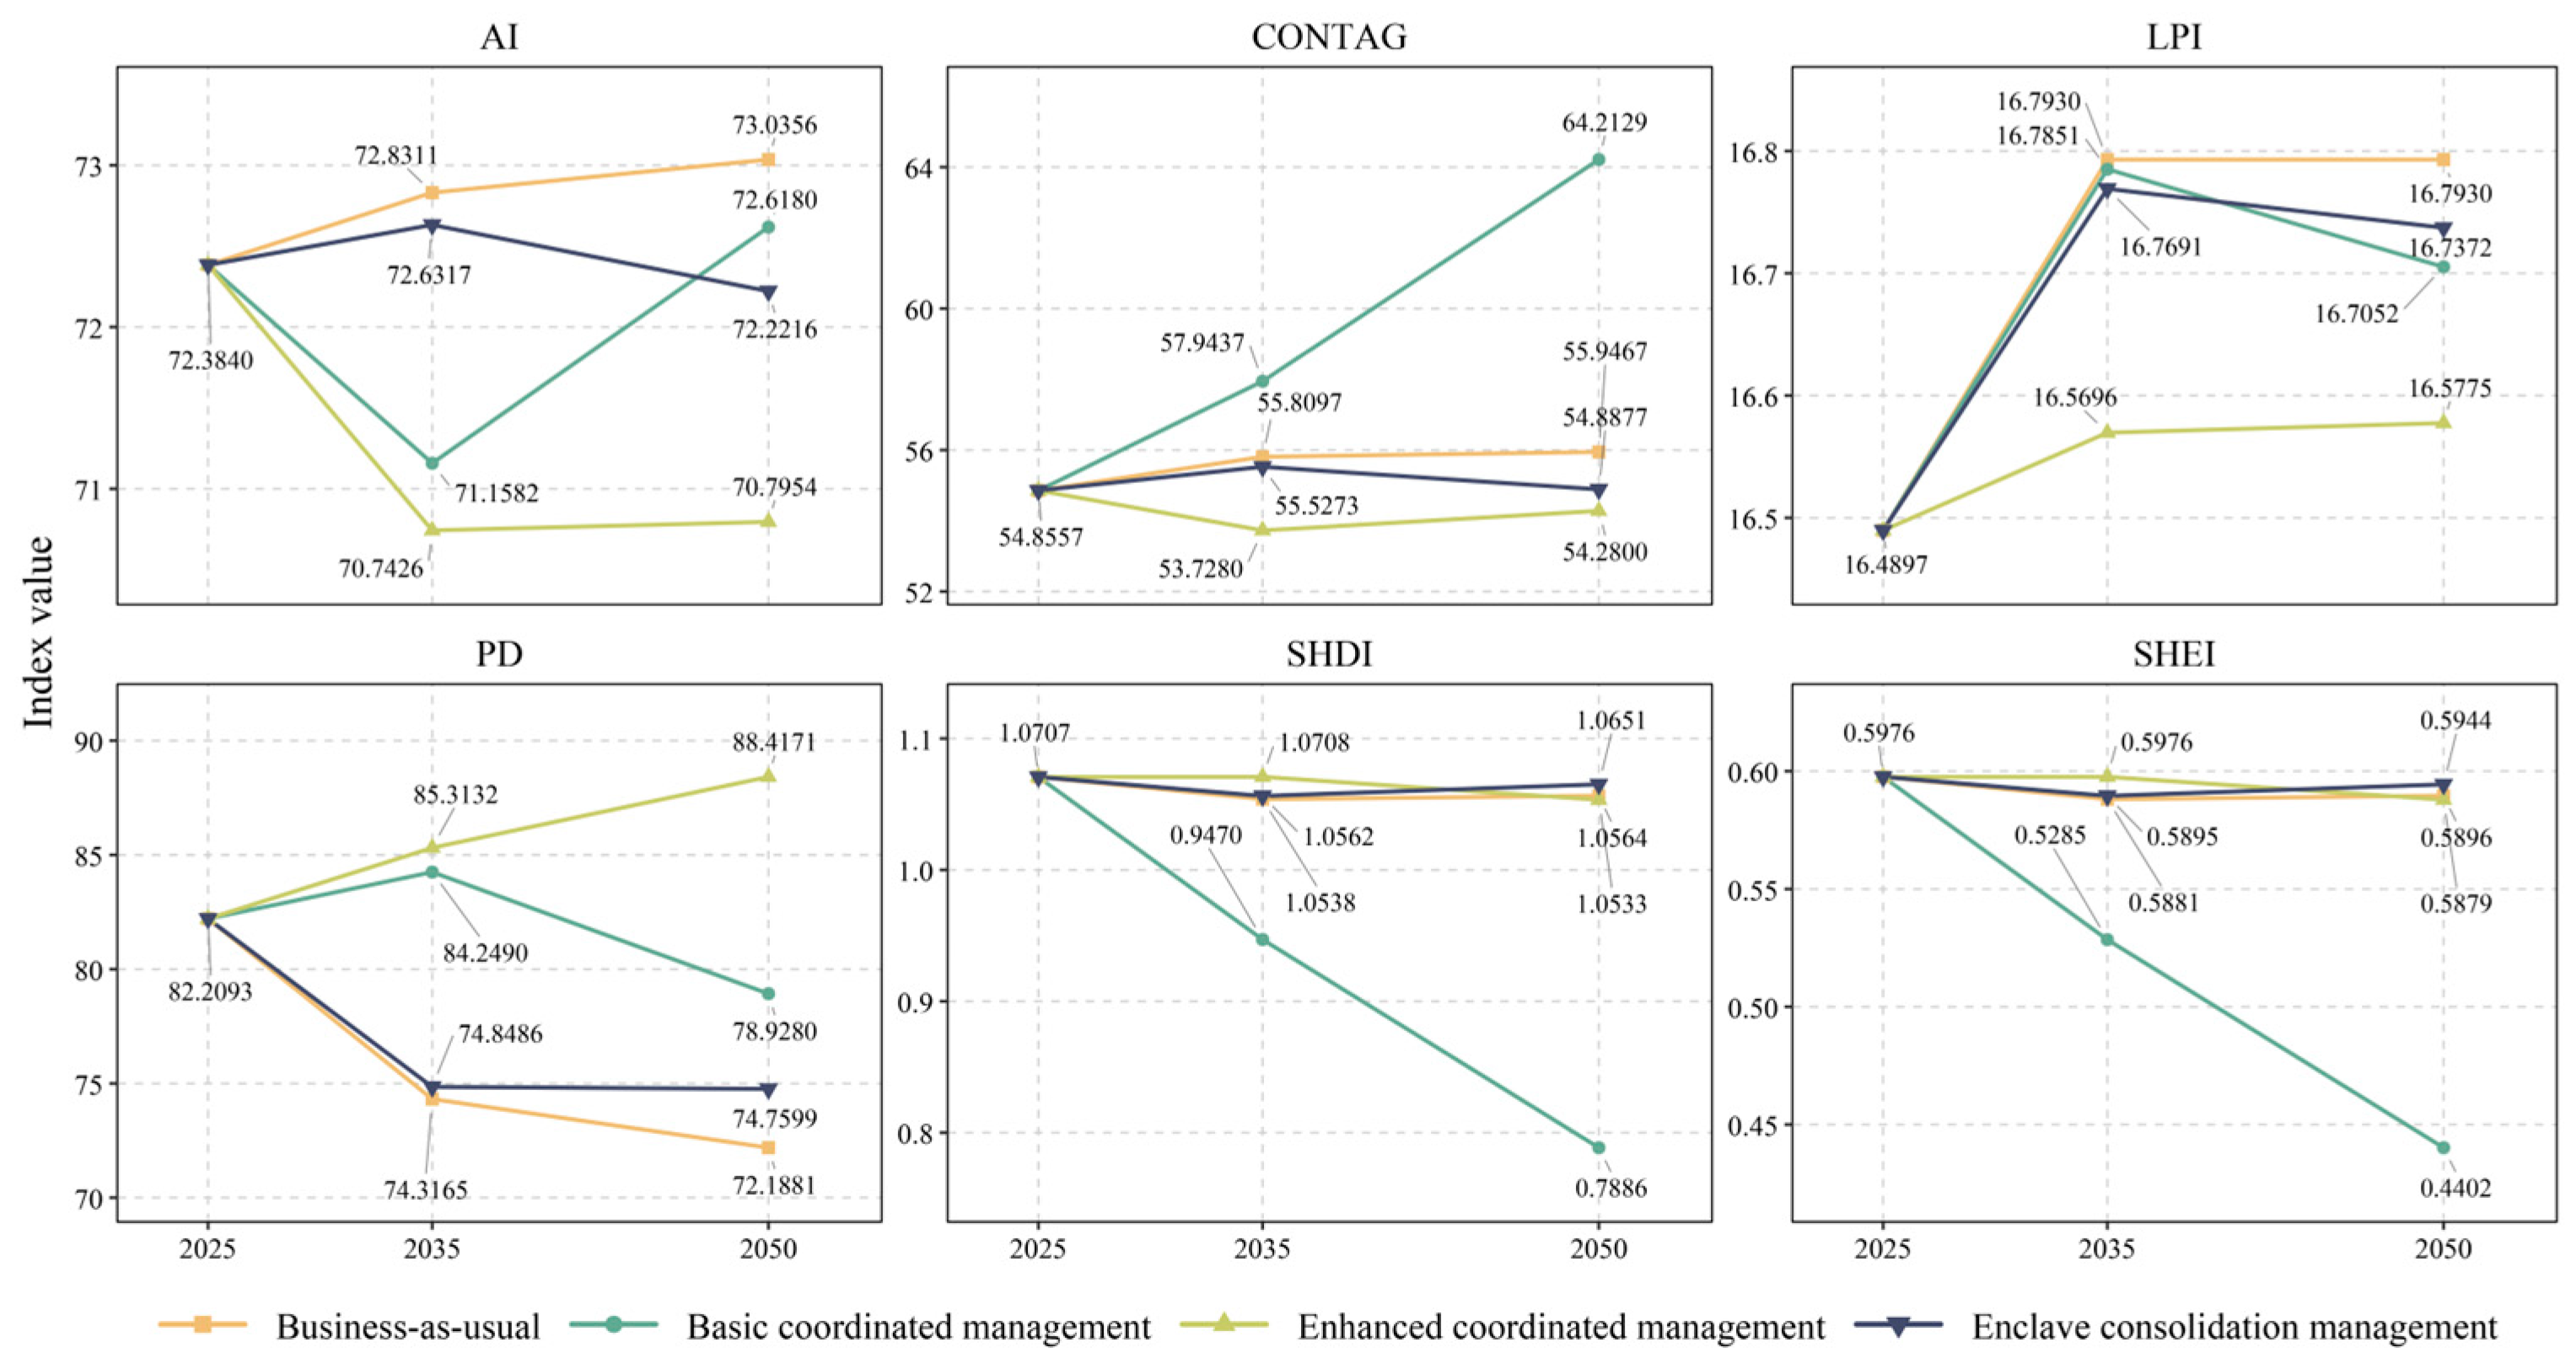
In terms of landscape patterns, the largest patch index (LPI) showed limited variation across scenarios, indicating that the dominant landscape pattern within the enclaves remained generally stable (Figure 7). In most scenarios, PD, AI, and CONTAG changed in a coordinated manner, suggesting that landscape structure gradually shifted toward a new spatial configuration during adjustment. Clear differences were observed in the pathways of landscape optimization among scenarios. Under the BAU and ECMS scenarios, overall changes were relatively moderate; fragmentation declined slightly or remained stable, landscape aggregation and connectivity increased modestly, and diversity and evenness changed little, indicating strong path dependence. The BCM scenario showed the greatest increase in landscape aggregation and contagion, with a clear increase in CONTAG. However, landscape diversity and evenness declined more substantially, suggesting a shift toward greater dominance by fewer landscape types. The ECM scenario maintained a relatively high level of fragmentation, showed limited improvement in aggregation, and retained higher landscape diversity. Overall, stronger ecological management can improve enclave landscape connectivity and stability, but different management intensities and implementation pathways may create clear trade-offs between landscape optimization and biodiversity conservation.
Figure 7.
Landscape pattern changes in the enclaves of Wuyishan National Park under multi-scenario simulation.
3.3. Habitat Quality of Enclaves and Wuyishan National Park Under Multi-Scenario Simulation
Habitat quality within the enclaves showed a generally consistent trend towards improvement. Under all scenarios, habitat quality increased in both 2035 and 2050. In terms of habitat quality classes, the areas of low- and medium–low-quality habitats generally decreased, while medium–high-quality and high-quality habitats expanded, although the magnitude of improvement differed clearly among scenarios (see Supplementary Figures S1–S5 for details). The overall improvement followed the order: the basic coordinated management scenario (BCM) showed the most pronounced improvement, with a substantial expansion of high-quality habitats and a clear reduction in low-quality habitats; the business-as-usual scenario (BAU) and enclave consolidation management scenario (ECMS) showed moderate improvement, with steady expansion of high-quality habitats and continued decline of medium–low-quality habitats; and the enhanced coordinated management scenario (ECM) showed relatively weaker improvement. Spatially, enclave habitat quality was characterized by contiguous high-quality areas and scattered low-quality patches. Habitat quality remained high in the contiguous forest areas in the northern and central parts, whereas low-quality habitats were mainly concentrated around southeastern villages and park margins.
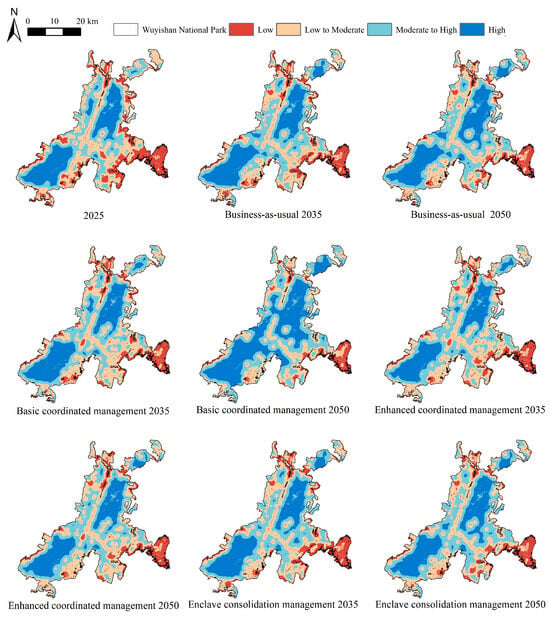
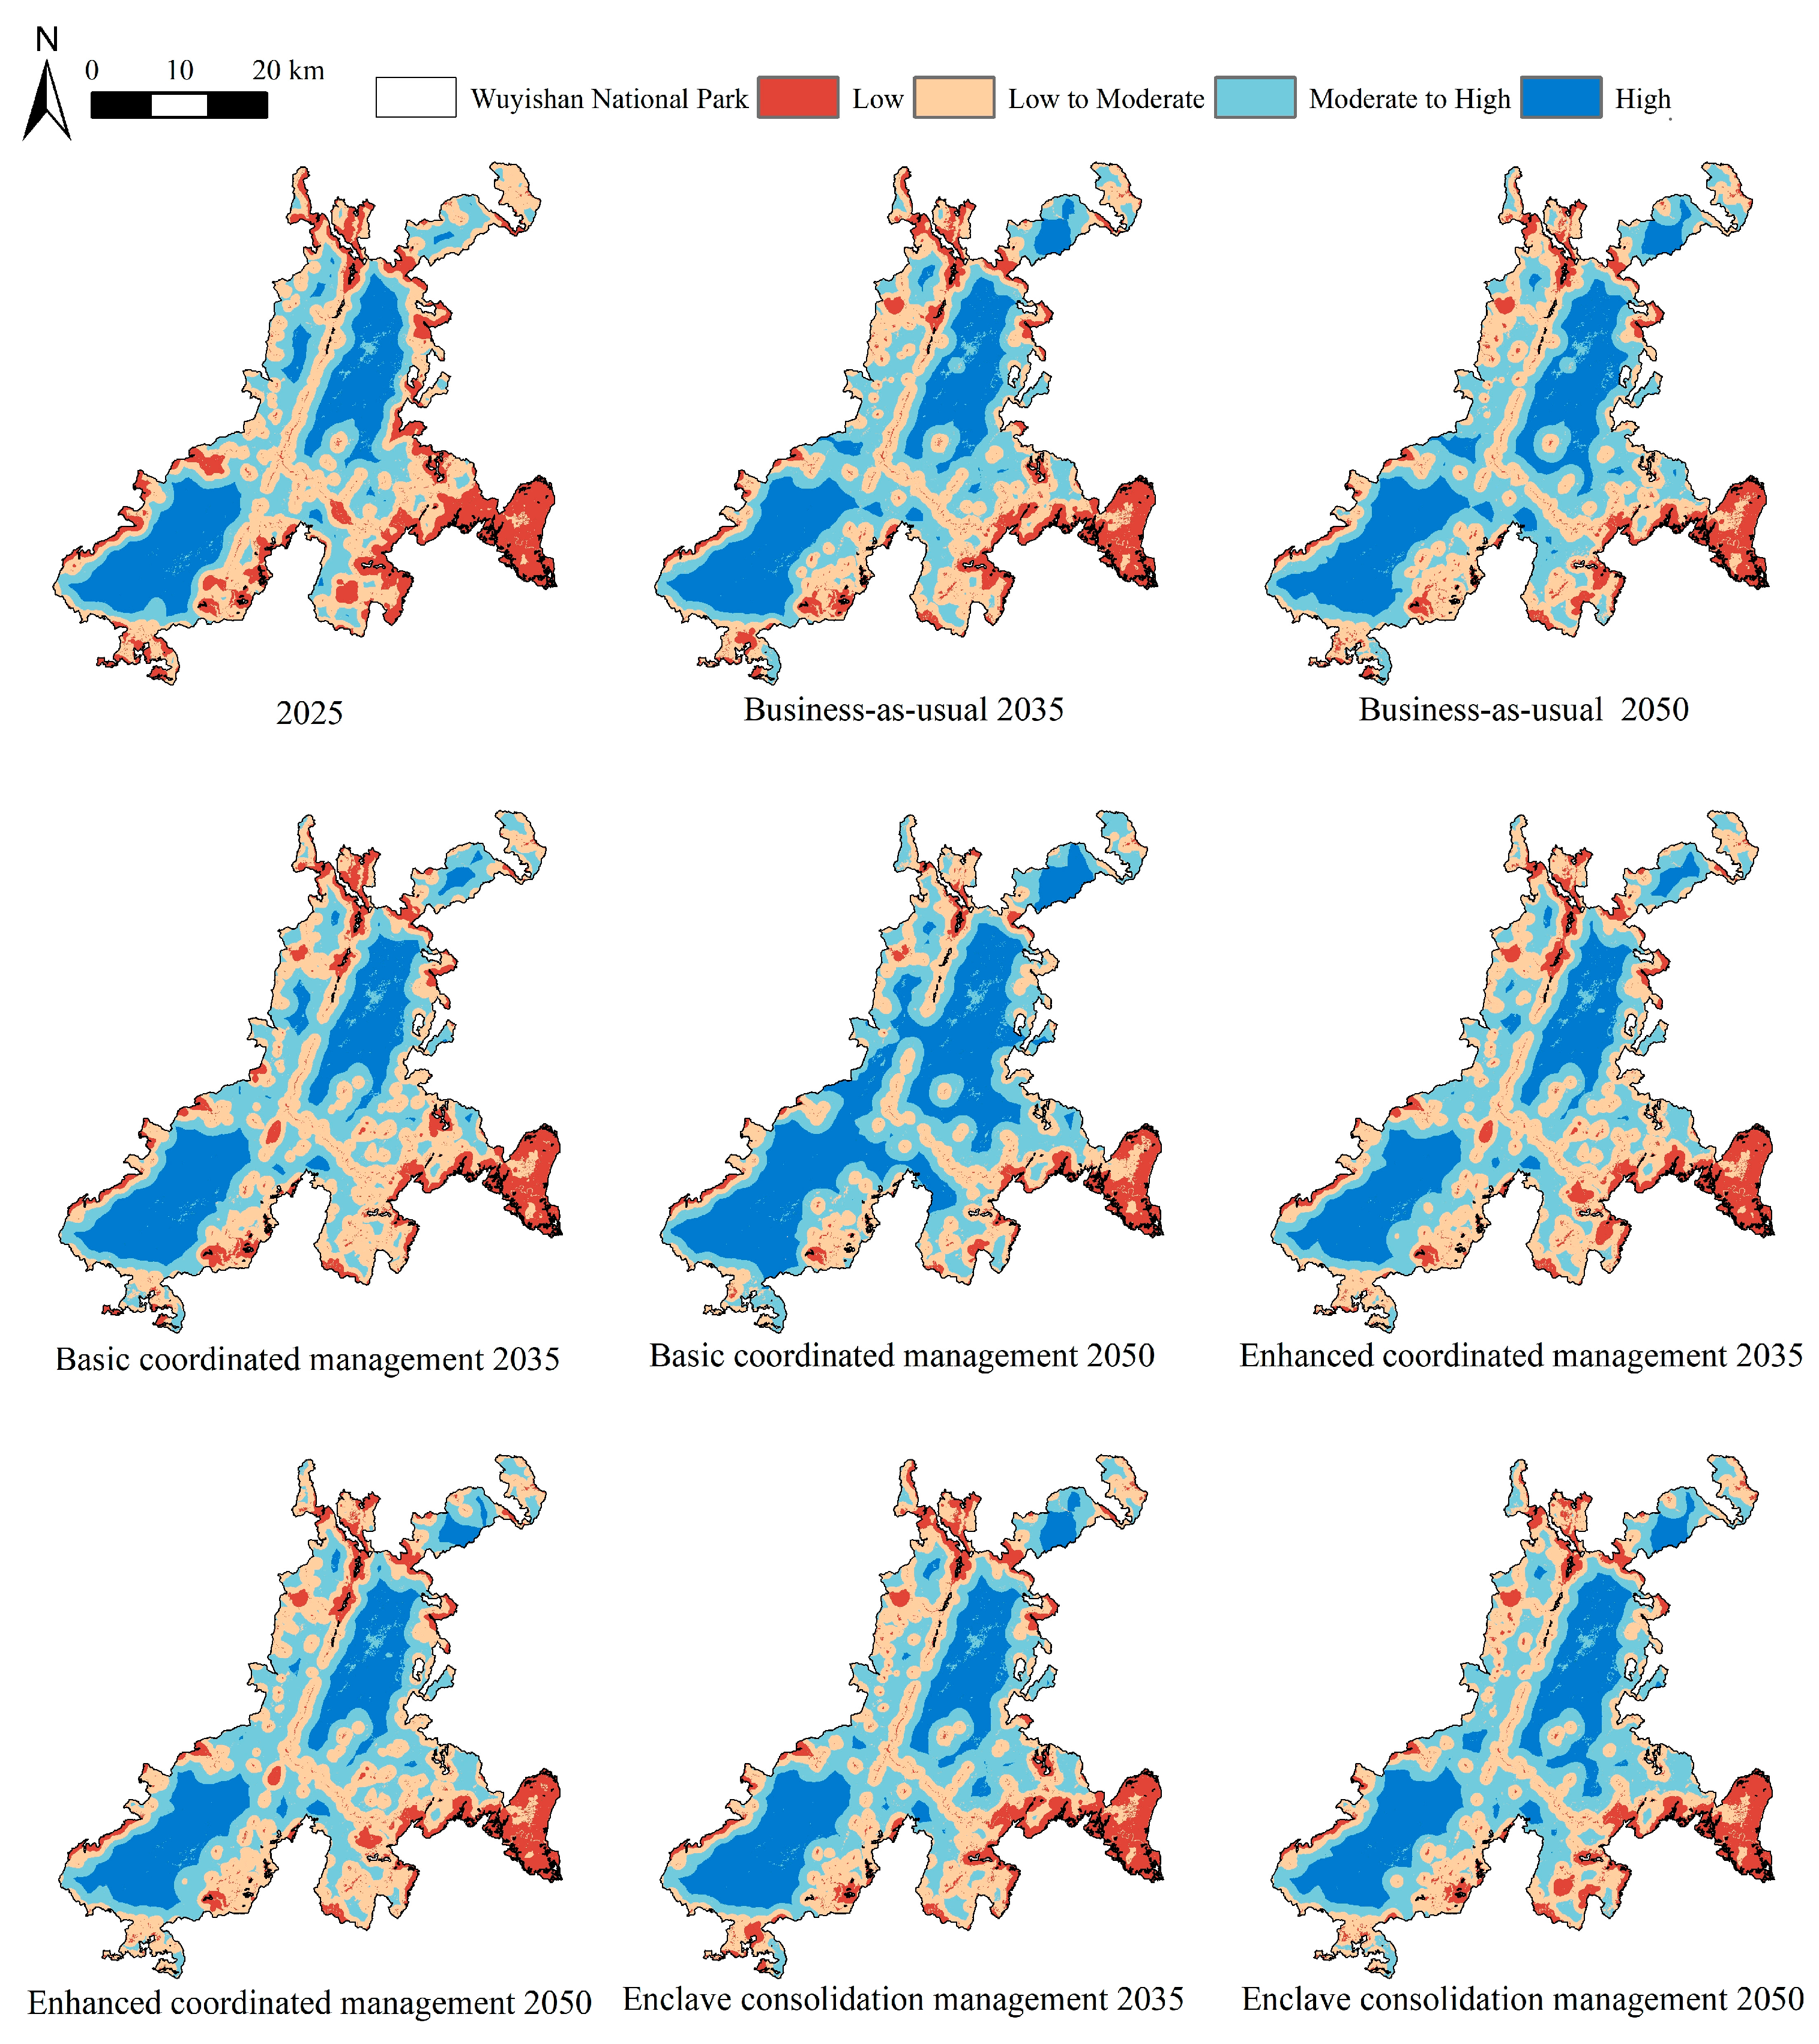
At the national park scale, habitat quality improved under all scenarios, with more areas moving into higher-quality categories (Figure 8). The magnitude and spatial extent of the simulated improvement varied among scenarios, particularly in terms of high-quality habitat expansion and the reduction in medium–low-quality habitat. BCM showed the most evident improvement in habitat quality, while ECM was mainly characterized by a decrease in low-quality habitat and an increase in medium–high-quality habitat. ECMS showed a level of improvement between those under BAU and BCM, with a smaller area of low-quality habitat and gradual increases in the areas of medium–high-quality and high-quality habitats.
Figure 8.
Habitat quality changes in Wuyishan National Park under multi-scenario simulation.
In spatial terms, habitat quality in Wuyishan National Park was higher in the central core area and lower near the park edges, forming clear internal gradients. High-quality habitats were mostly connected within the core area, while low-quality habitats occurred mainly along the park margins in bands, where human disturbance was more pronounced.
3.4. Spatial Associations of Enclave Landscape Pattern Changes with Habitat Quality Change in Wuyishan National Park
3.4.1. Spatial Associations and Predictive Thresholds for All Enclaves Under Different Scenarios
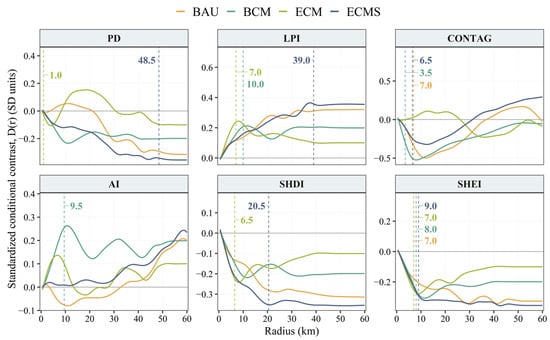
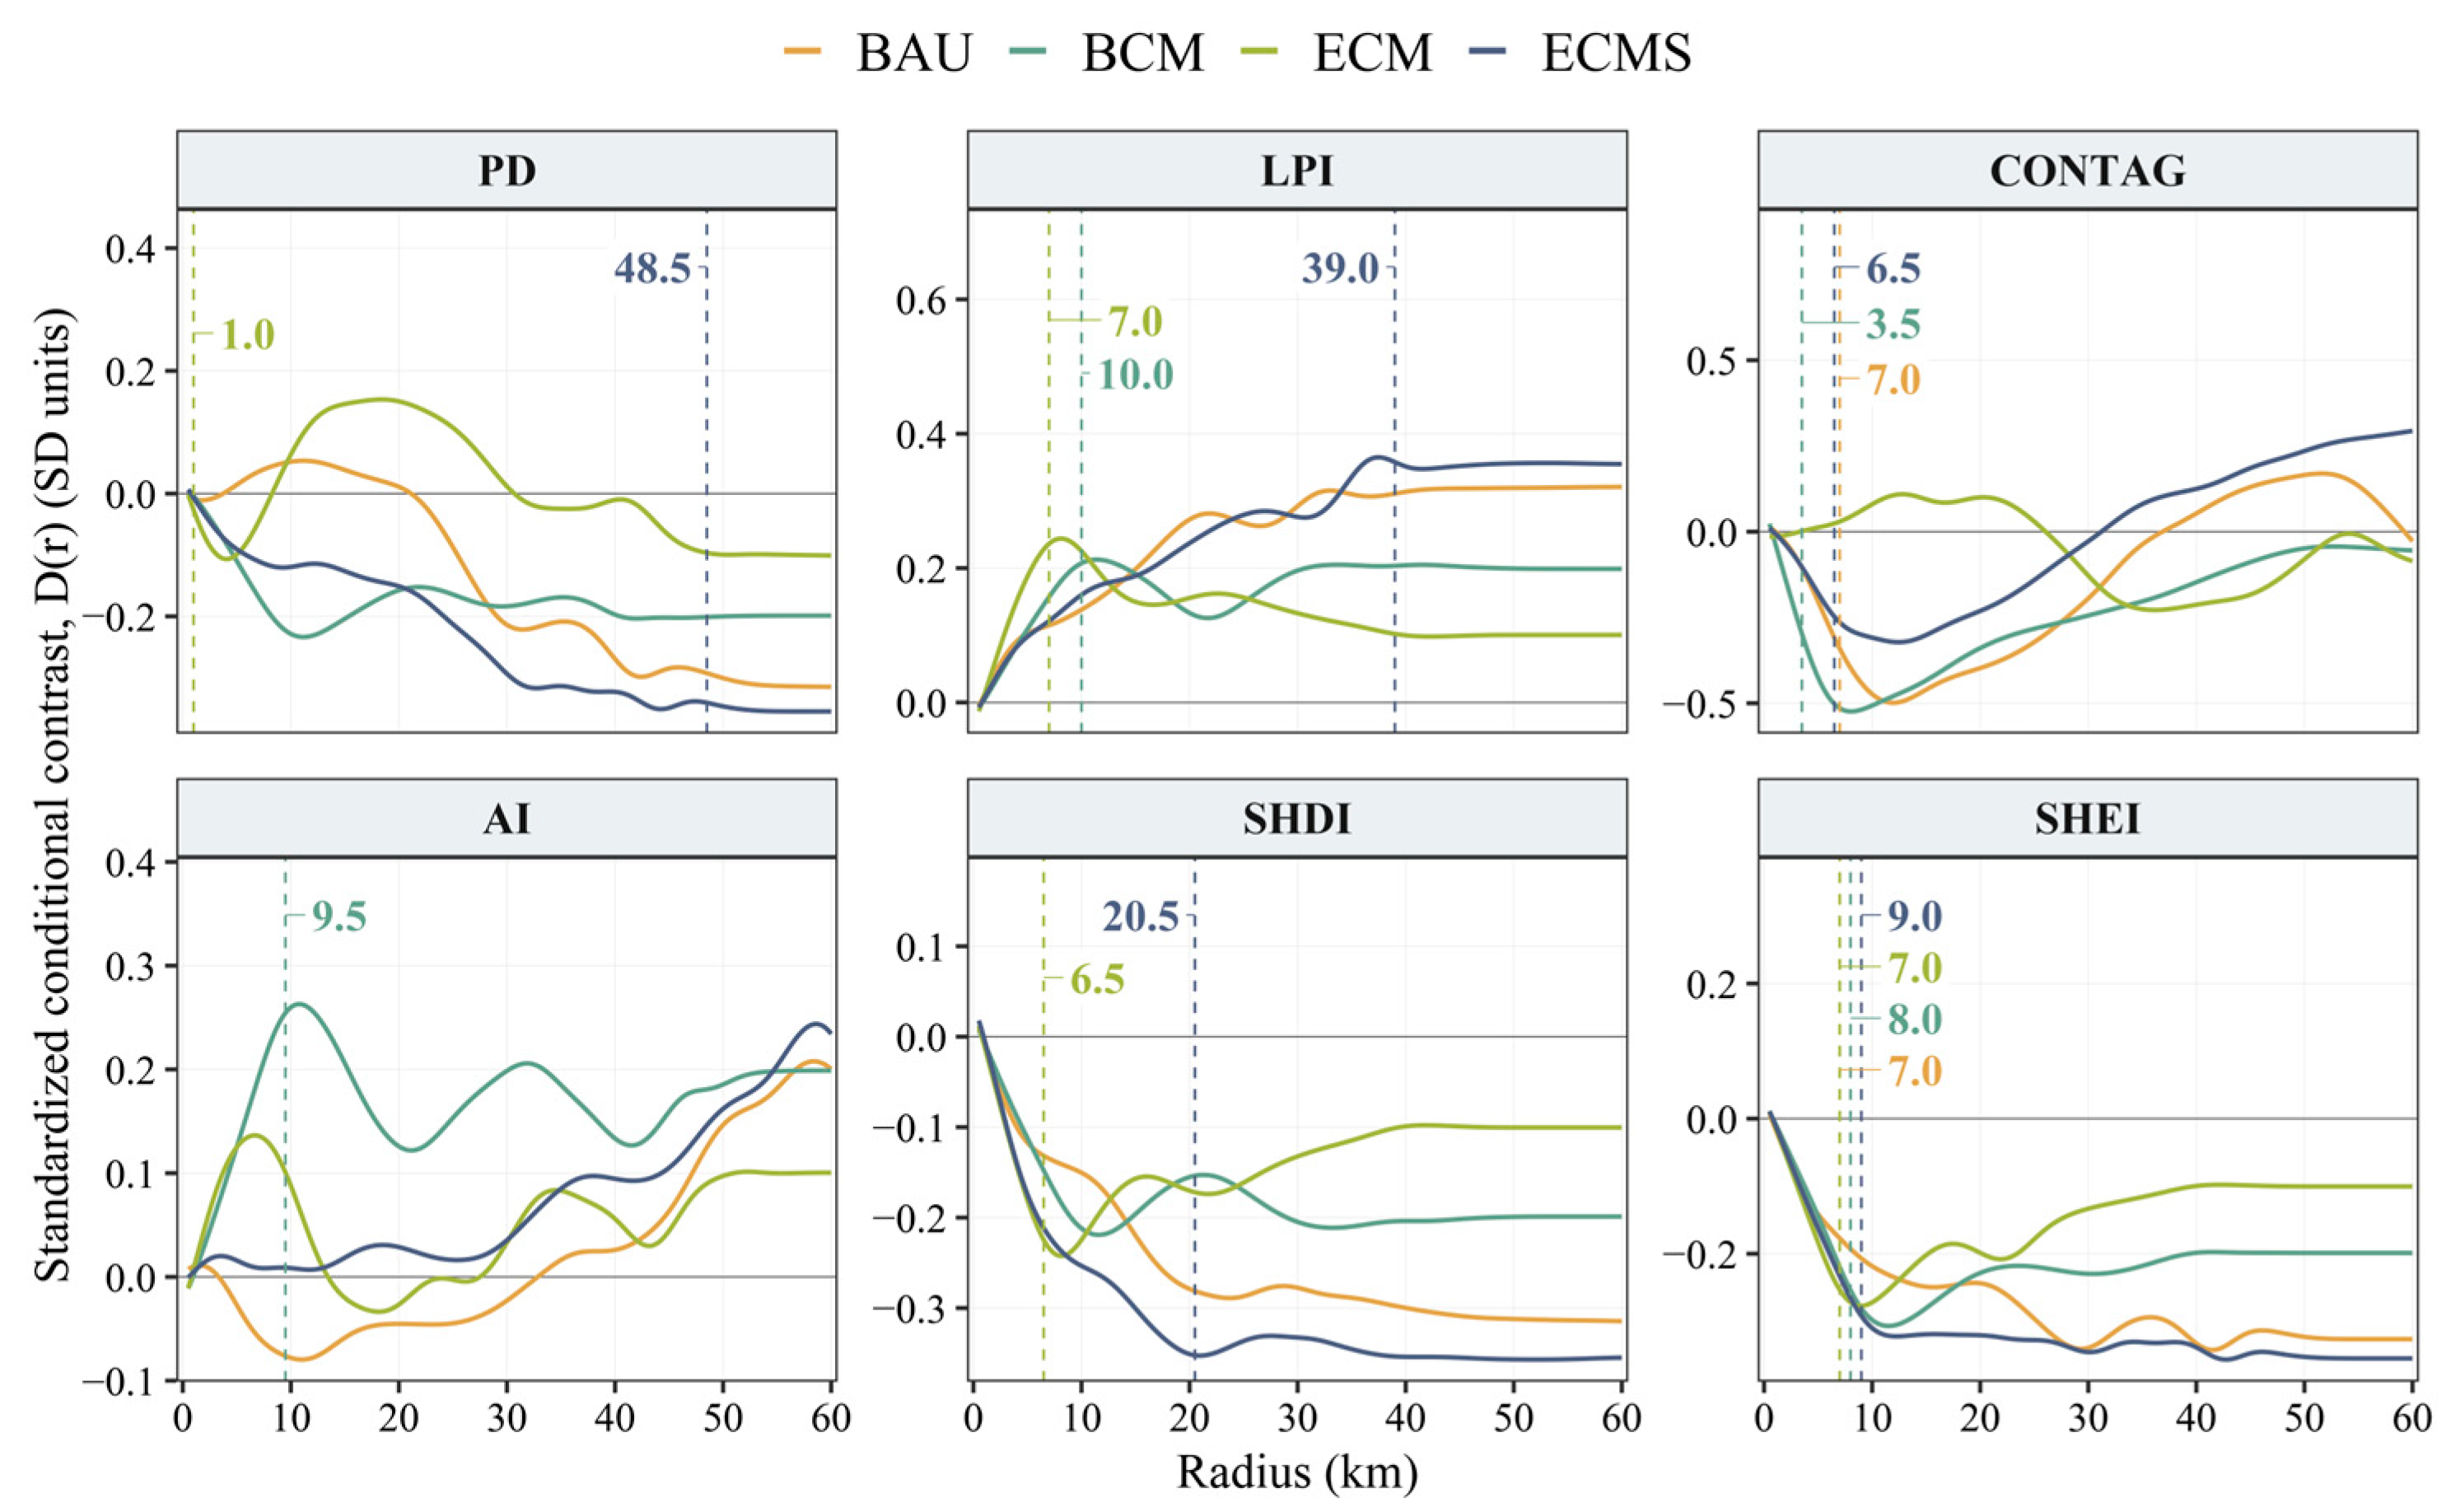
The direction and strength of conditional associations varied among scenarios, landscape metrics, and candidate radii (Figure 9). The association between PD change and habitat quality change switched sign under BAU and ECM, whereas its association was predominantly negative under BCM and ECMS. Under ECMS, conditional contrast in habitat quality change generally became more negative as the candidate radius increased, reaching −0.345 SD at the predictive threshold of 48.5 km. Under ECM, the corresponding threshold was 1.0 km, while no threshold was detected under BAU or BCM. LPI exhibited predominantly positive associations across all four scenarios, with larger positive contrasts under ECMS and BAU at larger radii, reaching approximately 0.35 and 0.32 SD, respectively. Its predictive thresholds were 10.0 km under BCM, 7.0 km under ECM, and 39.0 km under ECMS, while no threshold was detected under BAU. CONTAG showed the largest negative contrasts among the six metrics under BAU and BCM, approaching −0.50 SD at relatively short radii. The corresponding predictive thresholds were 7.0 and 3.5 km, at which the contrasts were −0.372 and −0.309 SD, respectively. Under ECM, the association for CONTAG was weakly positive at some shorter radii and became negative at approximately 25 km; no predictive threshold was detected. Under ECMS, the association was negative at shorter radii, became positive at approximately 30–35 km, and increased thereafter. Its predictive threshold was 6.5 km, at which the contrast remained negative at −0.290 SD.
Figure 9.
Scenario-specific spatial associations and predictive spatial thresholds for all enclaves.
Among the remaining metrics, AI showed a pronounced positive association under BCM, with a contrast of 0.276 SD at its predictive threshold of 9.5 km. No AI threshold was detected under BAU, ECM, or ECMS. SHDI was predominantly negative across the tested radii, with the largest negative contrasts under ECMS. Its thresholds were 6.5 km under ECM and 20.5 km under ECMS, with corresponding contrasts of −0.249 and −0.364 SD. No SHDI threshold was detected under BAU or BCM. SHEI was predominantly negatively associated with habitat quality change across all four scenarios and had similar predictive thresholds across these scenarios: 7.0 km under BAU, 8.0 km under BCM, 7.0 km under ECM, and 9.0 km under ECMS. These thresholds summarize incremental predictive gain within the tested radius range and do not necessarily coincide with the largest absolute conditional contrasts.
3.4.2. Type-Specific Spatial Associations and Predictive Spatial Thresholds Under Different Scenarios
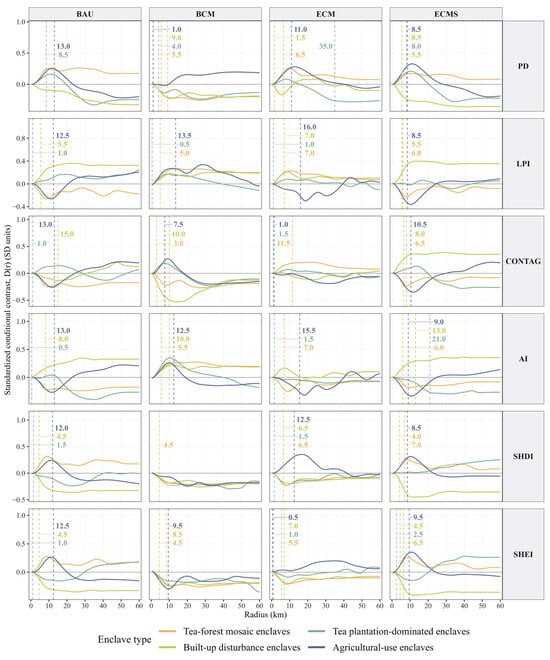
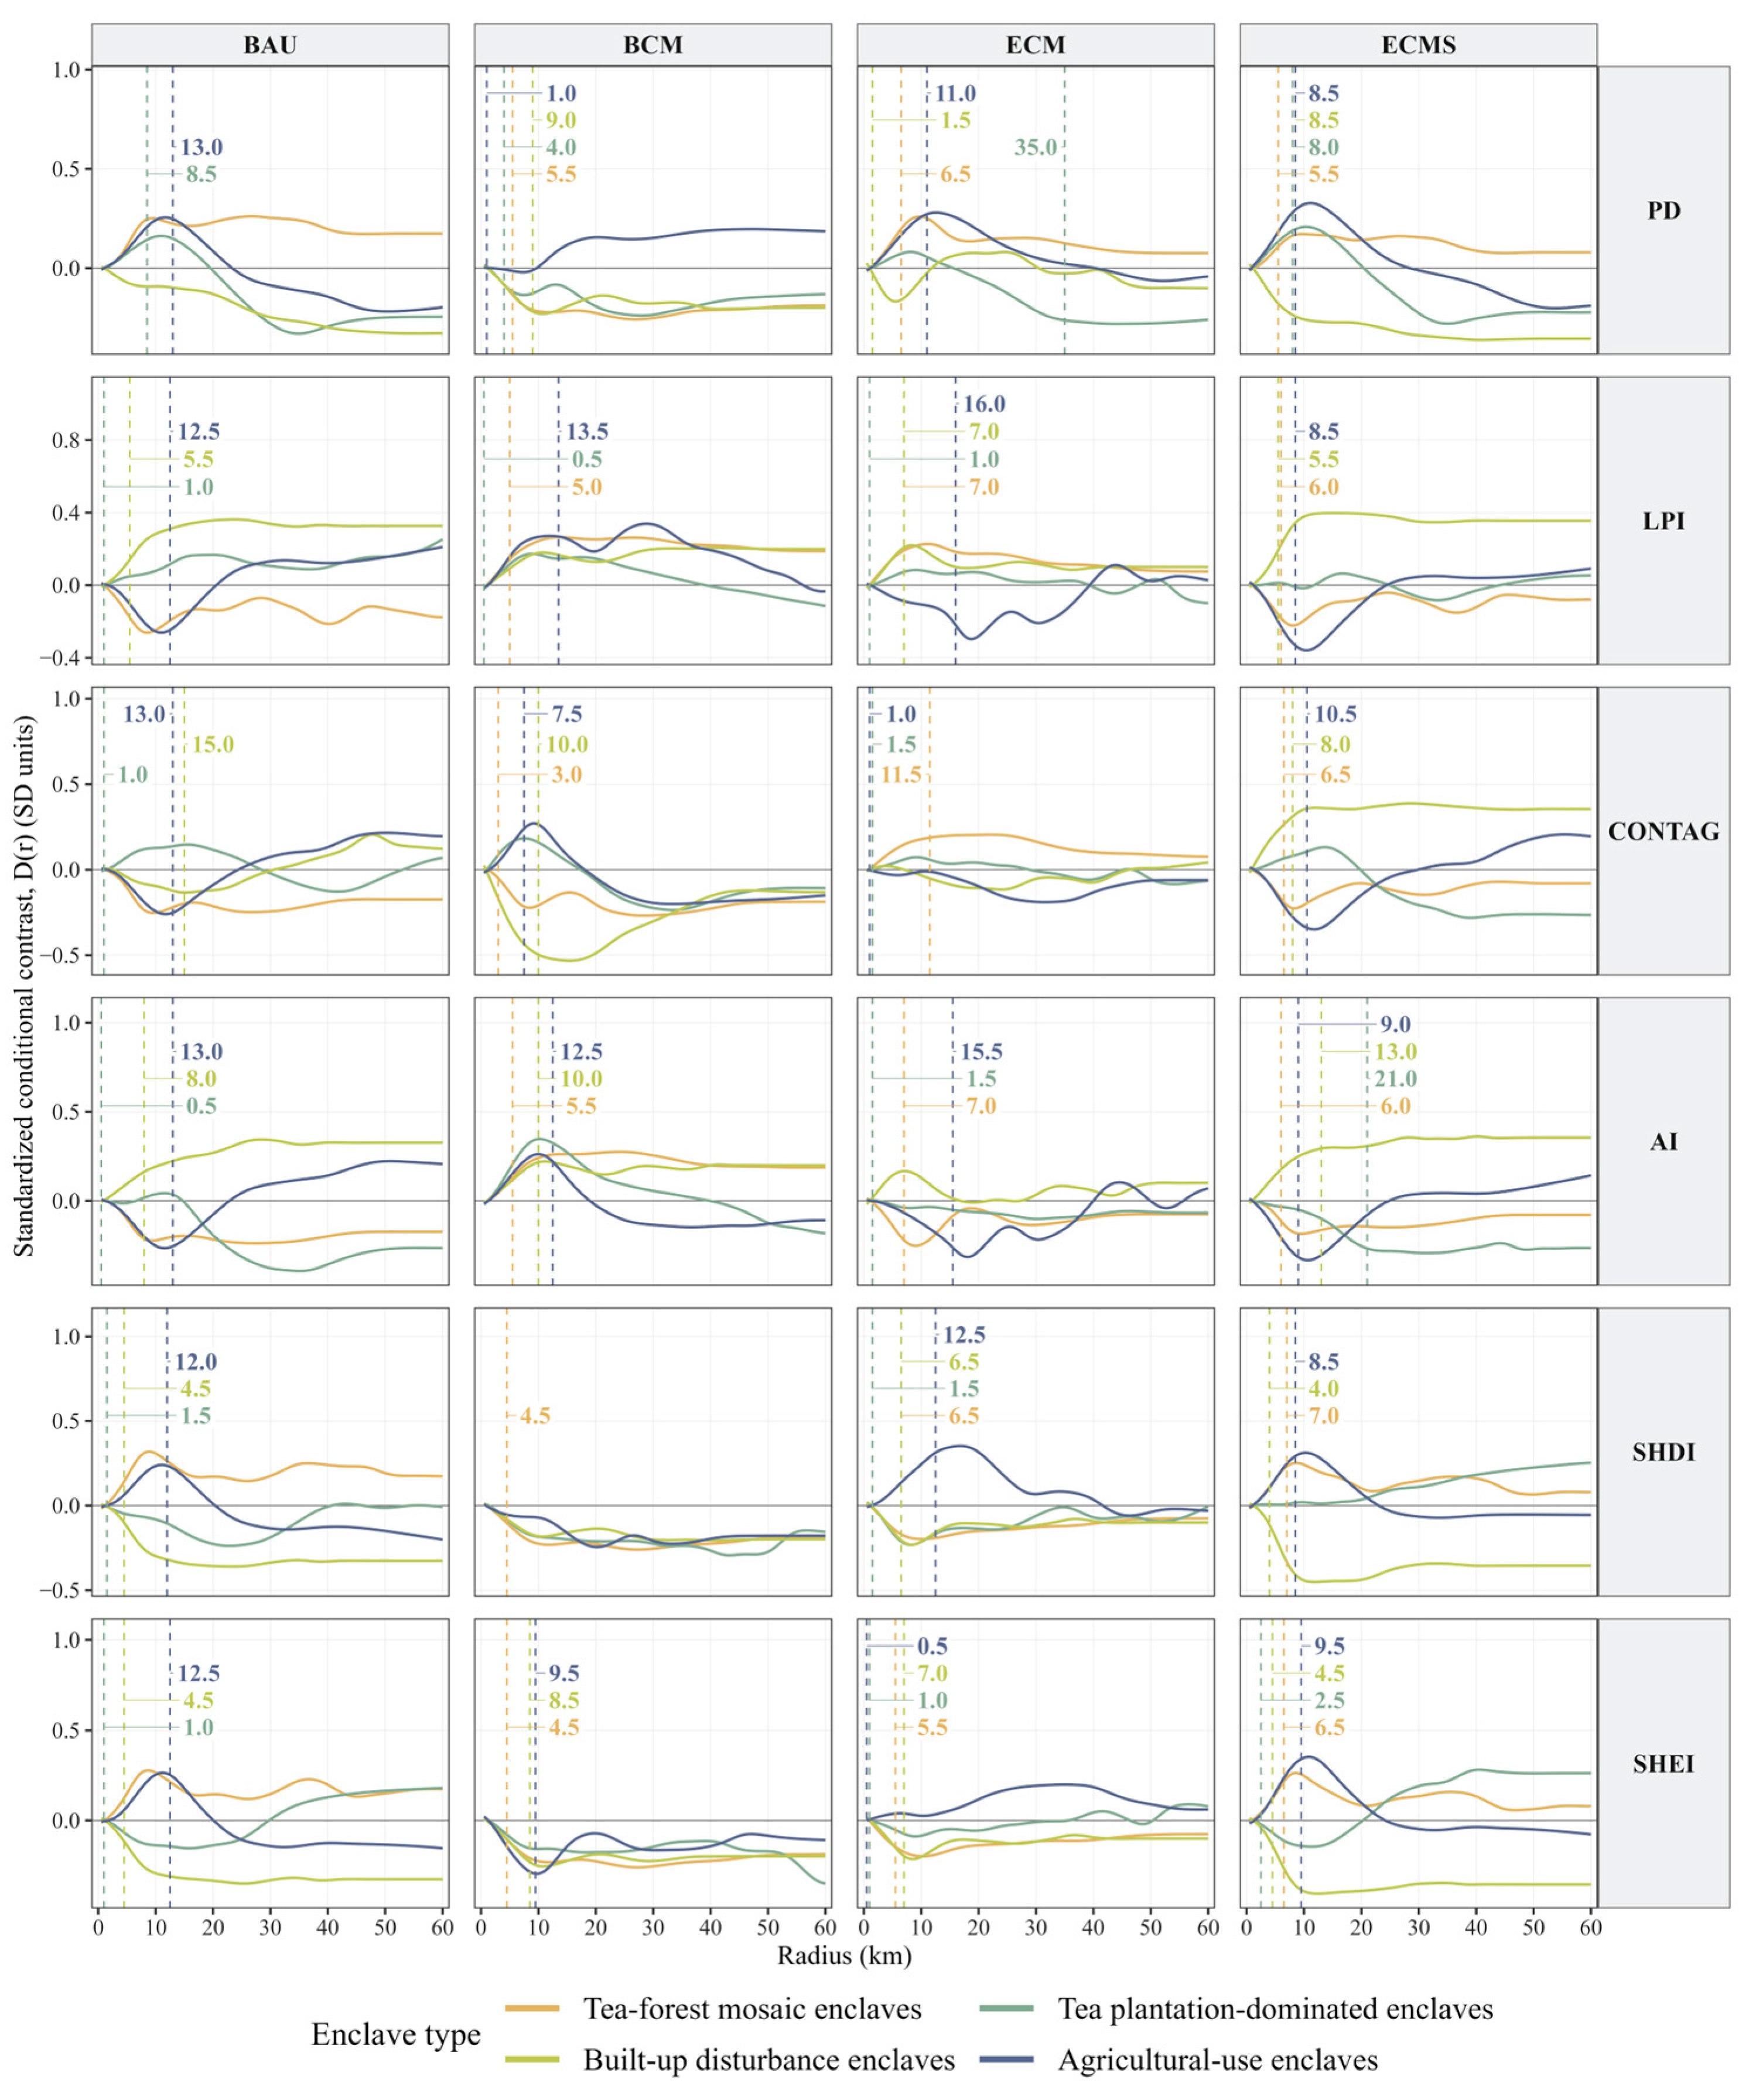
The direction and strength of conditional associations and the detected predictive thresholds varied among enclave types and scenarios (Figure 10). For built-up disturbance enclaves, thresholds ranged from 1.5 to 15.0 km. Under BAU, associations were predominantly positive for LPI and AI and negative for SHDI and SHEI, while CONTAG contrasts shifted from negative at shorter radii to positive at larger radii. Under BCM, LPI and AI showed predominantly positive associations, whereas CONTAG showed the largest negative contrast among the metrics, reaching −0.511 SD at its threshold of 10.0 km. Under ECM, LPI associations remained predominantly positive for LPI and negative for SHDI and SHEI, while the association for PD changed from negative to positive before becoming negative again at larger radii. No threshold was detected for CONTAG or AI under ECM. Under ECMS, associations were predominantly positive for LPI, CONTAG, and AI and negative for PD, SHDI, and SHEI.
Figure 10.
Enclave type-specific spatial associations and predictive spatial thresholds under different scenarios.
For agricultural-use enclaves, the direction of associations varied markedly across scenarios and candidate radii. Thresholds were detected for 23 of the 24 metric-scenario combinations, ranging from 0.5 to 16.0 km; SHDI under BCM was the only exception. Under BAU, associations for LPI, CONTAG, and AI shifted from negative at shorter radii to positive at larger radii, while those for PD, SHDI, and SHEI generally showed the opposite pattern. Under BCM, contrasts were predominantly positive for LPI and negative for SHEI, whereas those for CONTAG and AI changed from positive to negative as the radius increased. Under ECM and ECMS, LPI, CONTAG, and AI were generally negative at short-to-intermediate radii, becoming less negative or positive at larger radii. SHDI was positive at shorter radii and became predominantly negative at larger radii in both scenarios. SHEI contrasts were positive over much of the tested radius range under ECM but changed from positive to negative under ECMS. Under ECMS, the contrasts at the detected thresholds were −0.353 SD for LPI, −0.358 SD for CONTAG, and 0.362 SD for SHEI.
For tea–forest mosaic enclaves, no threshold was detected under BAU, whereas thresholds were detected for all six metrics under BCM, ECM, and ECMS. These ranged from 3.0 to 5.5 km under BCM, 5.5 to 11.5 km under ECM, and 5.5 to 7.0 km under ECMS. For tea plantation-dominated enclaves, most detected thresholds ranged from 0.5 to 8.5 km, with two longer thresholds: 35.0 km for PD under ECM and 21.0 km for AI under ECMS. No threshold was detected for four metrics under BCM and three under ECMS.
3.4.3. Area-Specific Spatial Associations and Predictive Spatial Thresholds with Type-Area Comparisons
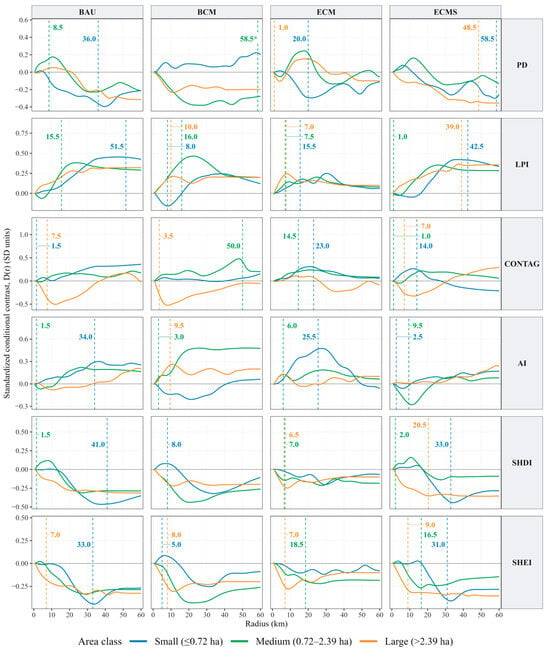
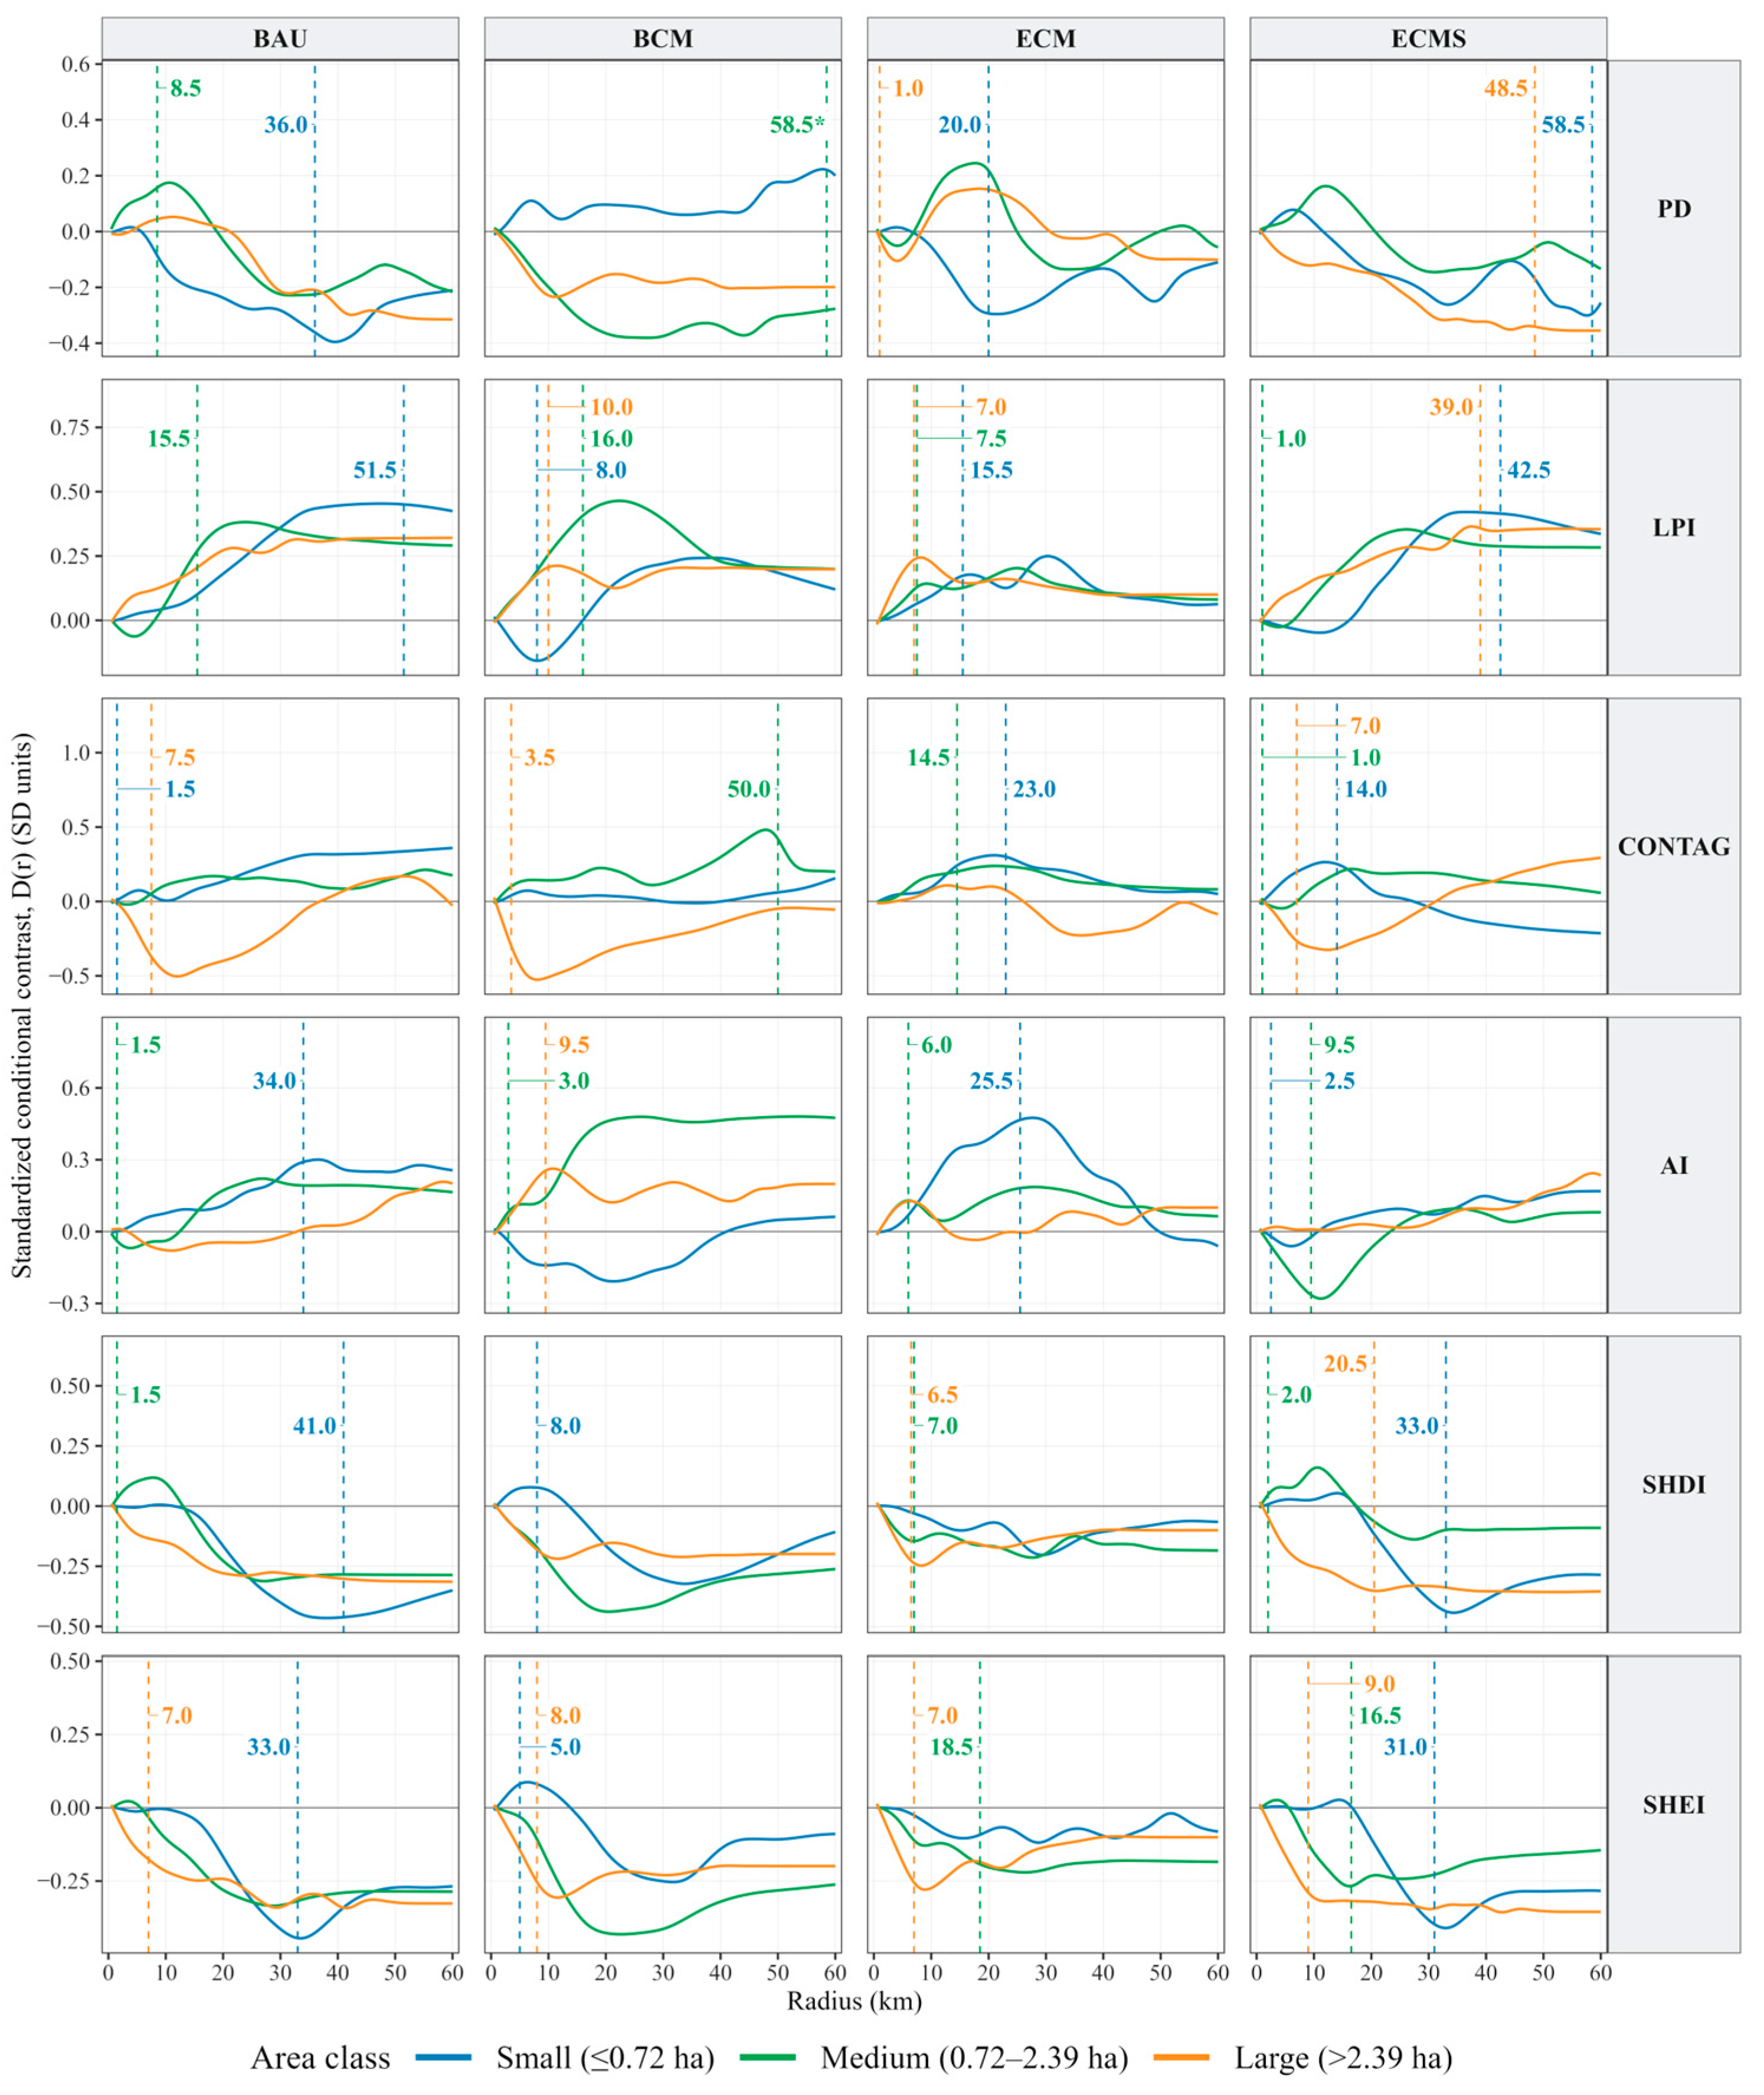
To compare enclaves of different sizes, the enclave samples were divided into three groups with similar sample sizes: small enclaves (n = 45, ≤0.72 ha), medium enclaves (n = 43, >0.72 to ≤2.39 ha), and large enclaves (n = 44, >2.39 ha). Association strength and detected predictive thresholds showed no consistent monotonic pattern with enclave area, while association directions varied among scenarios and landscape metrics (Figure 11).
Figure 11.
Area-specific spatial associations and predictive spatial thresholds under different scenarios.
Small enclaves showed marked variation in conditional contrasts among scenarios and radii. LPI, CONTAG, and AI showed predominantly positive contrasts under BAU and ECM. Under BCM, LPI shifted from negative to positive as the radius increased, while those for AI were negative over much of the radius range. Under ECMS, LPI became positive and increased over intermediate radii, whereas CONTAG shifted from positive to negative. PD, SHDI, and SHEI showed predominantly negative at larger radii under BAU and ECMS. Detected thresholds ranged from 1.5 km for CONTAG under BAU to 58.5 km for PD under ECMS; LPI under BAU also had a relatively large threshold of 51.5 km. For medium enclaves, LPI, CONTAG, and AI were predominantly positive under BAU, BCM, and ECM, whereas under ECMS, LPI and AI showed negative contrasts at shorter radii before becoming positive, while CONTAG contrasts were mostly positive. SHDI and SHEI were predominantly negative across the four scenarios, although brief positive associations occurred at shorter radii. PD was predominantly negative under BCM and generally shifted from positive at shorter radii to negative at larger radii under the other scenarios. Detected thresholds ranged from 1.0 km for LPI and CONTAG under ECMS to 58.5 km for PD under BCM. CONTAG under BCM also had a relatively large threshold of 50.0 km. For large enclaves, associations were predominantly positive for LPI and negative for SHDI and SHEI across all four scenarios. CONTAG shifted from negative to positive as the radius increased under BAU and ECMS, showed the reverse pattern under ECM, and remained predominantly negative under BCM. All detected thresholds under BAU, BCM, and ECM were ≤10.0 km, including the 1.0 km PD threshold under ECM. Larger thresholds occurred under ECMS for PD (48.5 km), LPI (39.0 km), and SHDI (20.5 km).
However, some area-specific thresholds remained sensitive to the search range (Supplementary Section S7). With the predictive gain criterion fixed at 95%, increasing the maximum candidate radius from 50 to 60 km left the overall and type-specific thresholds unchanged. In the area-specific analysis, this increase shifted the LPI threshold for small enclaves under BAU from 48.5 to 51.5 km, the PD threshold for medium enclaves under BCM from 50.0 to 58.5 km, and the PD threshold for small enclaves under ECMS from 7.0 to 58.5 km. Sensitivity to the predictive gain criterion was assessed at a fixed maximum candidate radius of 60 km. Of the 52 detected area-specific thresholds, 46 differed by no more than 2 km between the 90% and 99% criteria. PD for small enclaves under ECMS showed the largest difference: the thresholds under the 90%, 95%, and 99% criteria were 7.0, 58.5, and 58.5 km, respectively.
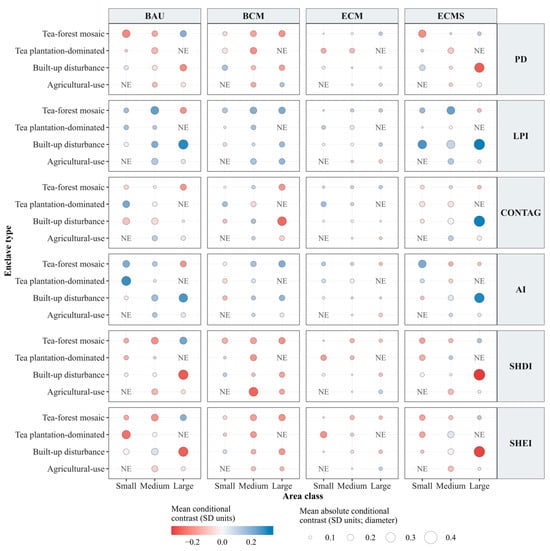
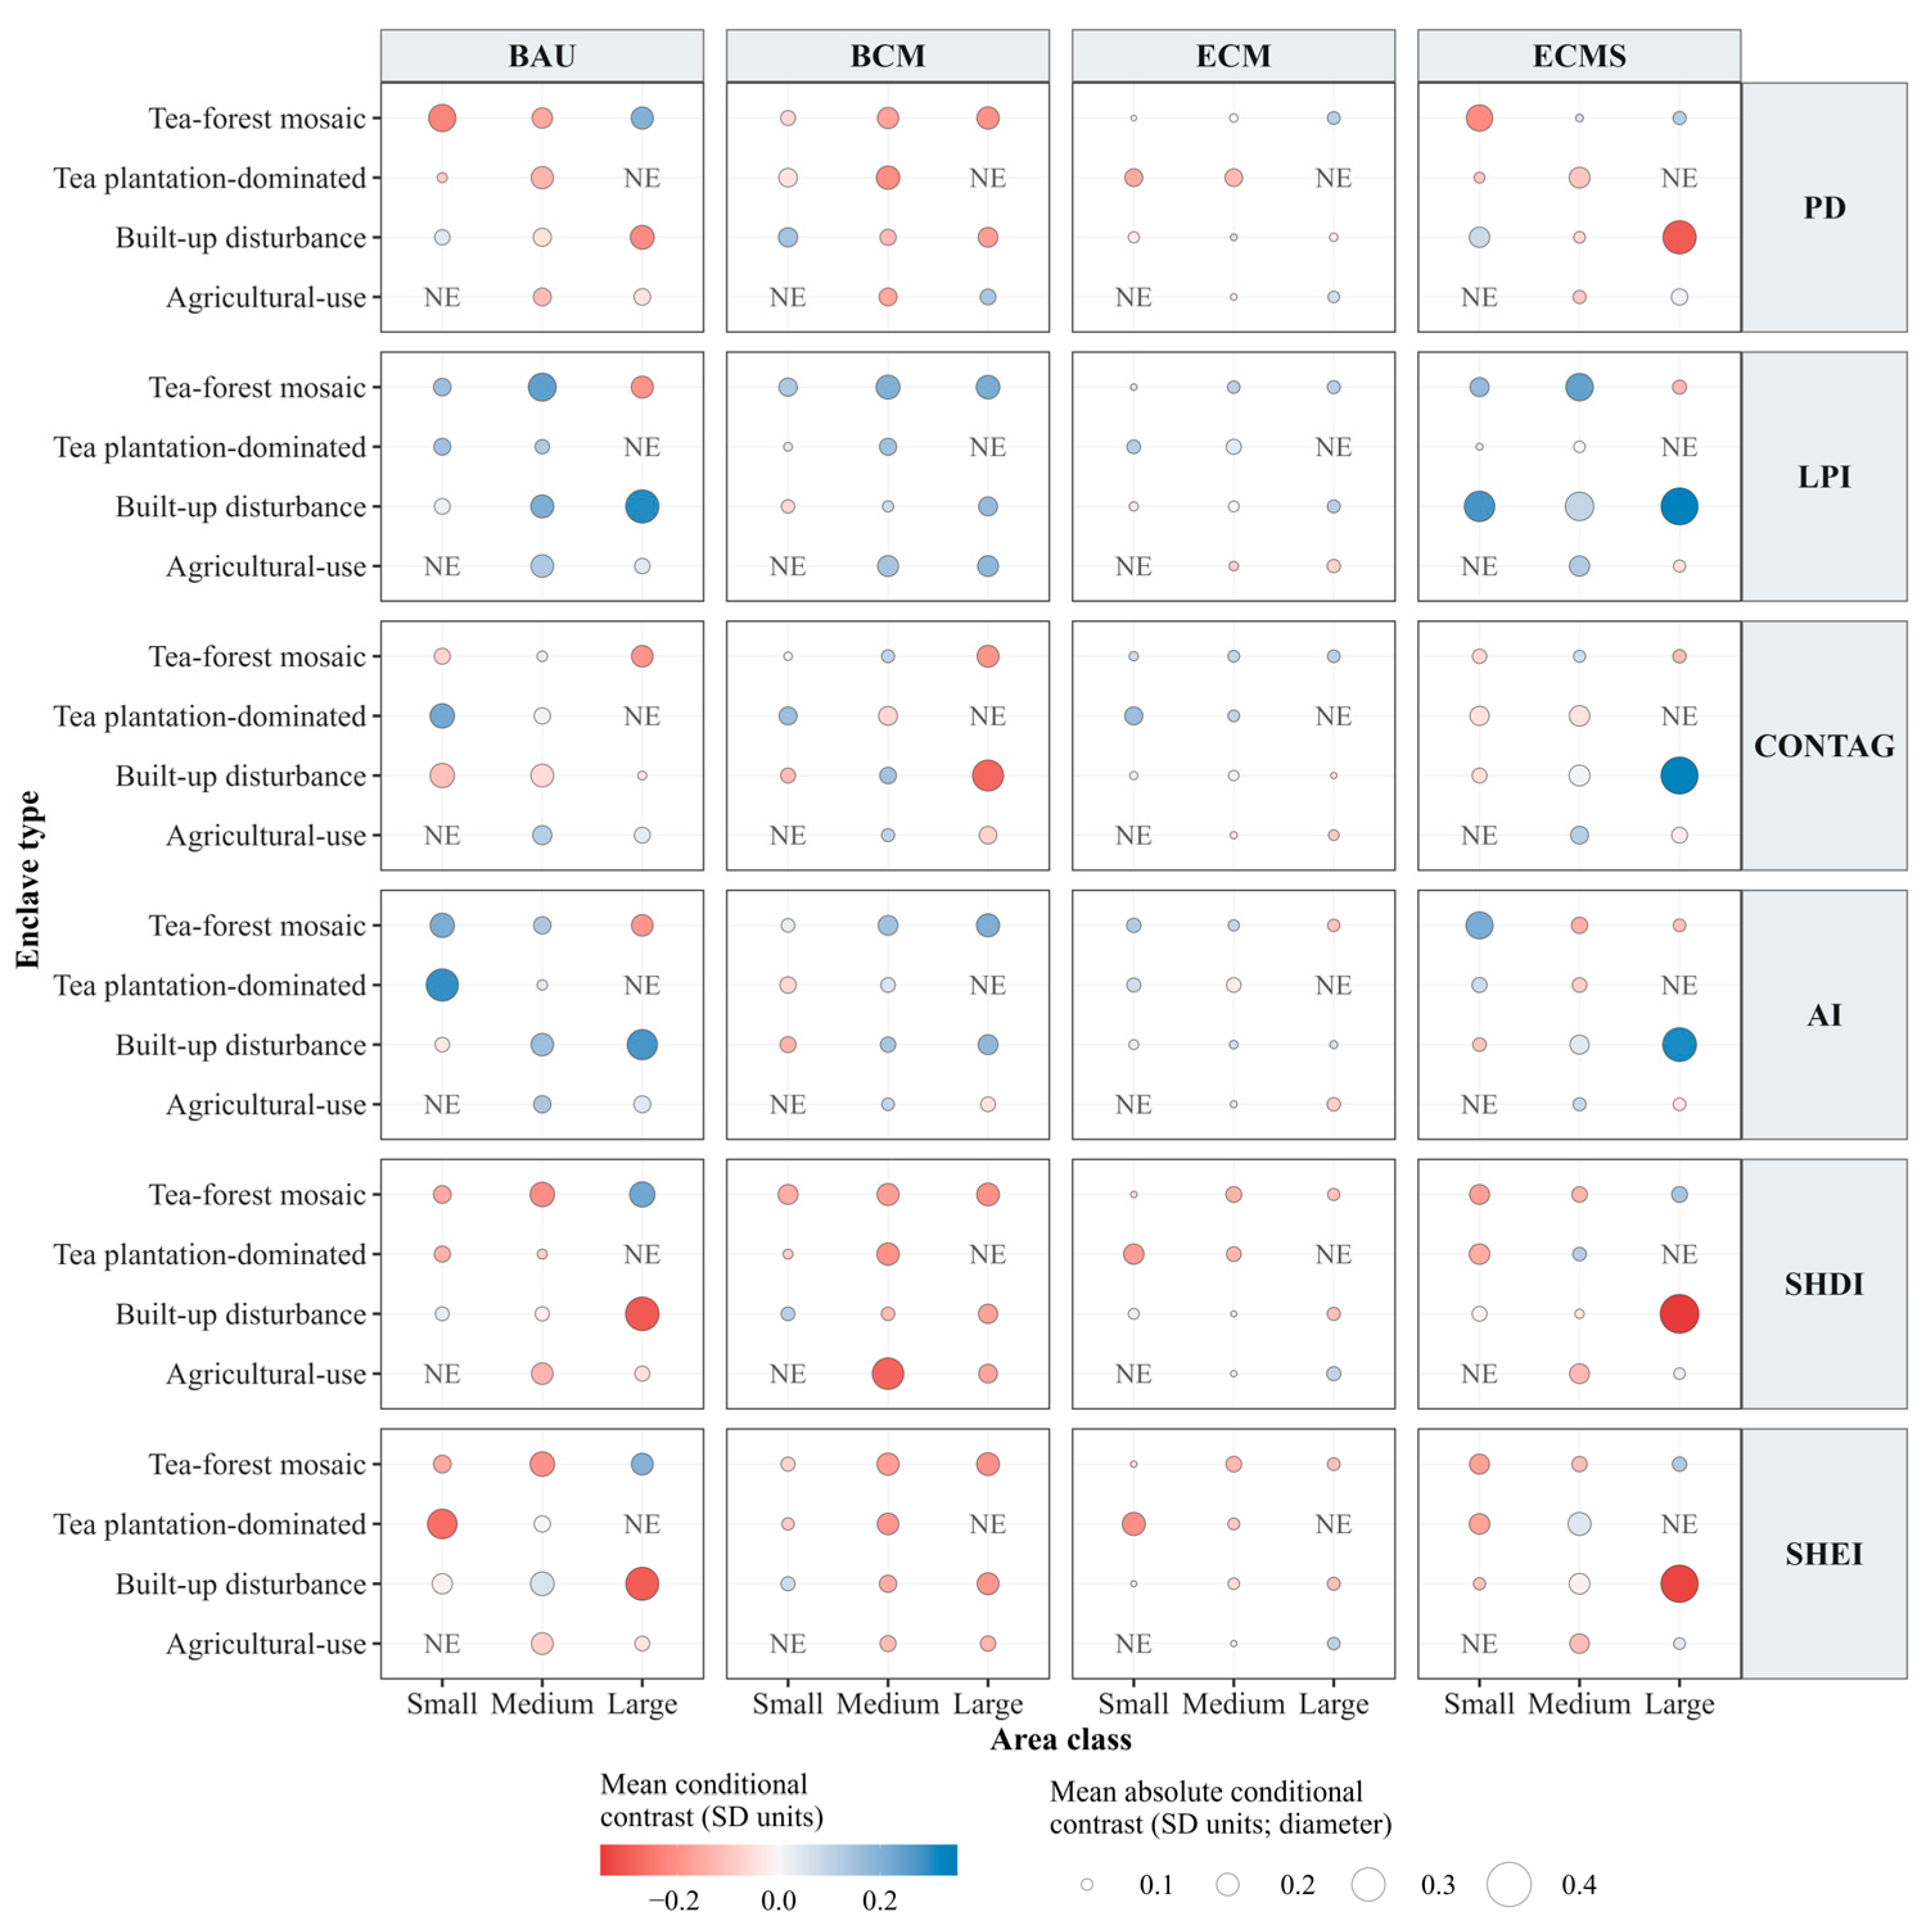
The type and area analysis showed substantial differences among enclave types within the same area class (Figure 12). Mean conditional contrasts and mean absolute conditional contrasts were calculated over the 0.5–60 km radius range. Large built-up disturbance enclaves (n = 16) had the largest mean absolute contrasts for all six metrics under ECMS and for LPI, SHDI, and SHEI under BAU. Under ECMS, their mean contrasts were positive for LPI, CONTAG, and AI (0.306–0.336 SD) and negative for PD, SHDI, and SHEI (−0.351 to −0.301 SD). Their mean absolute contrasts were smaller under ECM. Other type–area combinations showed pronounced associations for particular metrics: small tea plantation-dominated enclaves had the largest mean absolute AI contrast under BAU (0.291 SD), while medium agricultural-use enclaves had the largest mean absolute SHDI contrast under BCM (0.284 SD). Contrasts could not be estimated for large tea-plantation-dominated enclaves (n = 1) or small agricultural-use enclaves (n = 2) because of the limited number of enclaves in these groups.
Figure 12.
Type-area comparisons of conditional associations under different scenarios (note: sample sizes for the small, medium, and large enclaves within each type are, respectively: tea–forest mosaic, 10/15/10; tea-plantation-dominated, 28/12/1; built-up disturbance, 5/10/16; and agricultural-use, 2/6/17. NE indicates that conditional contrasts could not be estimated).
4. Discussion
4.1. Distribution Pattern and Dynamic Evolution of Enclaves in Wuyishan National Park
The designation of national park enclaves in China is closely related to the management of human–land conflicts [48]. In boundary adjustment, conservation requirements need to be balanced with the Ecological Conservation Redline, permanent basic farmland, and the living and development demands of local communities [49,50]. Wuyishan National Park provides a typical example of southern China’s collectively-owned forest areas. Within the national park, collective forests cover about 67% of the total area, while collective land accounts for 54.36%. Human–land relations are therefore particularly complex within the park, mainly reflected in conflicts among living, production, and ecological spaces [51]. According to the Master Plan of Wuyishan National Park (2017–2025), areas with frequent human activities, including permanent basic farmland and commercial plantations, were excluded from the national park during the pilot phase. After the official establishment of Wuyishan National Park, the Jiangxi section was incorporated into the park, leading to increases in both the number and area of enclaves. A comparison between the Master Plan of Wuyishan National Park (2017–2025) and the Master Plan of Wuyishan National Park (2022–2030) shows that, after 2021, natural villages along the Wuyishan Grand Canyon in the newly added Jiangxi section were designated as new enclaves, whereas the number and area of enclaves in the Fujian section remained unchanged. Enclaves in Wuyishan National Park are mainly concentrated in the Fujian section, which accounts for more than 88.6% of the total enclave area. They consist of six landscape types: farmland, tea plantations, forest land, water, impervious surfaces, and grassland. Forest land occupied the largest proportion of enclave land use, while tea plantations represented the second major type. Community-related enclaves were concentrated in the Jiangxi section and southeastern Fujian, with notable clusters around Xikeng, Huangcun, and Chengdun villages.
Because enclaves are embedded within the national park, the high-quality habitats inside the park impose clear ecological constraints on land-use change within enclaves. Under future scenarios, a common trend toward ecological optimization was observed. Across the four scenarios, tea plantations tended to decrease, while forest land showed an overall increase. The scale of this adjustment, however, differed among scenarios. The coordinated management scenarios improved certain aspects of the enclave landscape, but no scenario performed best for all metrics. Improvements in connectivity and aggregation were sometimes accompanied by changes in fragmentation or landscape heterogeneity, suggesting that enclave governance requires balancing several landscape objectives rather than pursuing a single restoration target. Under BCM, forest land restoration and habitat quality improvement were the most pronounced, while the landscape became more concentrated. Under ECM, relatively high landscape heterogeneity was maintained, but fragmentation remained high. These findings are generally consistent with studies on enclaves in Hainan Tropical Rainforest National Park [33] and the Oban and Okwangwo enclaves in Cross River National Park [34]. By contrast, changes under BAU and ECMS were more moderate, showing stronger steady-state characteristics. Therefore, enclave management in national parks should not simply equate an increase in forest land with overall optimality. Optimization pathways under different scenarios should be understood from the perspective of coordinating multiple landscape objectives.
4.2. Spatial Differentiation in Habitat Quality Changes in Wuyishan National Park and Its Enclaves
In the future scenario simulations, habitat quality increased both inside the enclaves and in the wider area of Wuyishan National Park. Similar patterns have been reported in previous InVEST-based studies of protected areas and watersheds [52,53]. Forest land provided the main ecological basis for high habitat quality, while impervious surfaces, farmland, and tea plantations were more often linked to lower habitat quality. These results further show that land-use composition remains important for explaining habitat quality within national parks. Although overall habitat quality improved, low-value areas remained concentrated along park margins and around villages, indicating that human-use units within the national park may continue to shape local differences in habitat quality. Different from studies that focus on administrative units, watersheds, or protected areas as a whole, this study examined the enclaves and the surrounding national park area as separate analytical units.
Among the scenarios, BCM showed a clear improvement in habitat quality, indicating that an ecological restoration-oriented pathway can promote the transition from low-quality habitats to higher-quality habitats. However, when considered together with the landscape pattern results, stronger restoration-oriented management may also lead to the concentration of landscape types and a decline in heterogeneity. Therefore, improved habitat quality does not necessarily indicate comprehensive optimization of landscape patterns. Forest land expansion or habitat quality improvement has often been regarded as an important sign of ecological improvement [54,55]. In national park enclave governance, however, attention should also be paid to where improvement occurs and whether the improvement process leads to simplification of landscape structure.
4.3. Scale-Dependent Spatial Associations and Predictive Thresholds Across Enclave Types and Area Classes
Changes in enclave landscape patterns were spatially associated with habitat quality change in Wuyishan National Park, but most correlations were weak to moderate. The observed relationships therefore reflect spatial association rather than evidence of causation. Habitat quality may also vary with topography, roads, settlements, surrounding ecological conditions, and conservation policies. Variation in these associations is scale dependent, consistent with previous research identifying different spatial scales of association between landscape metrics and ecological quality [56]. In the overall analysis, the relatively consistent SHEI thresholds of 7.0–9.0 km contrasted with the larger PD and LPI thresholds under ECMS. Negative associations under BCM and ECMS do not by themselves indicate poorer management outcomes. They describe differences in predicted habitat quality change along the enclave-related exposure gradient within each scenario, rather than the scenario’s overall habitat quality change. Management comparisons should therefore consider these spatial associations together with the habitat quality outcomes reported for each scenario.
Differences among enclave types may partly reflect differences in land-use composition, disturbance intensity, and enclave area. Built-up disturbance enclaves showed pronounced negative CONTAG associations under BCM, but association strength and predictive thresholds showed no consistent ranking among types. Built-up disturbance enclaves contain a greater proportion of impervious surfaces, which may contrast more sharply with the surrounding forest matrix and increase the potential for fragmentation and edge disturbance. In agricultural-use enclaves, the configuration of farmland and tea plantations may also be associated with variation in landscape continuity and local habitat conditions. Tea–forest mosaic enclaves, by comparison, may form a more gradual transition to the surrounding forest matrix, although their associations and thresholds remained scenario dependent. These land-use characteristics offer plausible explanations for the observed differences, but the present analysis did not directly test the underlying ecological processes.
Enclave area did not show a consistent monotonic relationship with association strength or predictive thresholds. The type and area analysis showed substantial variation among types within the same area class. Large built-up disturbance enclaves had the largest mean absolute conditional contrasts across all six metrics under ECMS, whereas small tea plantation-dominated enclaves had the largest AI contrast under BAU. This pattern is consistent with studies showing that patch area alone does not fully explain fragmentation or landscape-scale ecological responses [57,58]. Evidence from Cross River National Park similarly indicates that fragmentation is also related to patch number, edge conditions, and landscape configuration [34]. Management priorities should therefore be assessed by considering enclave type, landscape structure, and area together. Large built-up disturbance enclaves warrant particular attention in monitoring and site-level assessment, while smaller enclaves should be evaluated according to their land-use composition and landscape context.
4.4. Management Strategies for National Park Enclaves
In many protected areas, early conservation practices tended to separate local communities from protected landscapes through strict restrictions on resource use or relocation. To balance long-term conservation effectiveness with community livelihoods, conservation approaches have increasingly incorporated co-management involving both national park authorities and local residents [59]. China’s national park system is still at an early stage of development. Management should enforce land-use restrictions under territorial spatial planning and regulate population growth and the extent of construction within enclaves according to local ecological conditions to limit human disturbance. The results indicate that enclaves with stronger associations with modeled habitat quality change in the national park tend to be characterised by human disturbance, alongside intensified landscape fragmentation, expansion of dominant patches, and changes in landscape connectivity. Although the predictive thresholds alone are insufficient to define precise management boundaries or intervention distances, they may inform priorities for monitoring and further ecological assessment. Policy implications are therefore discussed for two contexts: enclave management in China’s national parks and in protected areas worldwide.
4.4.1. Recommendations for Enclave Governance in China’s National Parks
For China’s national parks, enclave governance should shift from boundary coordination toward differentiated management that prioritizes ecological integrity. First, the consolidation and integration of selected enclaves should be promoted. Small, spatially scattered enclaves with weaker associations with habitat quality change may be considered for consolidation and gradually incorporated into unified national park management to reduce fragmentation, where local ecological conditions and community needs permit. Second, differentiated management and adaptive governance of enclaves should be improved [60]. To meet the requirement that the three spatial control lines do not overlap, enclaves could be designated as a special zone outside the core protection zone and the general control zone [61]. This special zone should be managed under the unified coordination of national park authorities, with adaptive regulation implemented according to local resource and environmental conditions, and with locally appropriate industries compatible with conservation objectives developed where appropriate [62]. Finally, spatial control and long-term governance of enclaves should be strengthened. National park authorities should have the authority to review proposed planning revisions, land-use changes, and construction projects within enclaves before approval. Based on enclave resources and community development needs, green industries such as ecological agriculture and ecotourism should be developed in an orderly manner [12]. Ecological compensation, skills training for local communities, and livelihood support policies should also be implemented to reduce community dependence on high-disturbance land use modes. Enclave governance should clarify the roles of national park authorities, local governments, and communities. National park authorities may lead ecology supervision, local governments may coordinate land use adjustments and livelihood support, and local communities should be encouraged to participate in daily management. Regular monitoring should be conducted to record changes in landscape patterns, habitat quality, and human activities.
4.4.2. Implications for Management of Enclaves in Other Protected Areas Worldwide
For protected areas that include enclaves or other human-use spaces, management decisions need to consider both ecological risk and community dependence. Relocation and retention should therefore be treated as context-specific options rather than fixed solutions. More generally, enclaves should be incorporated into a more differentiated protected area management system according to differences in land-use characteristics, social functions, and the spatial associations identified under local conditions. First, where local assessment indicates relatively weak spatial associations between changes in enclave landscape patterns and habitat quality change across the protected area, enclaves on which local communities depend heavily may be managed through co-management and low-disturbance use to maintain a balance between community livelihoods and conservation objectives. Enclaves with pronounced built-up disturbance, high fragmentation, or larger predictive spatial thresholds may warrant further site-level assessment to determine whether stronger spatial control, restrictions on new development, ecological restoration, or changes in land-use configuration are appropriate. Second, spatially explicit management may complement conventional boundary-based management in protected areas containing enclaves. Because the formation contexts, land tenure, and community development needs of protected area enclaves differ across countries, the analytical framework used here should be adapted and locally parameterized before application elsewhere. Monitoring using remote sensing, landscape pattern analysis, habitat quality assessment, and predictive spatial threshold analysis may provide a common methodological structure, but the scenario settings and numerical thresholds require independent calibration and validation for each protected area. Such locally adapted assessments may support adjustments to protected area zoning, negotiations with local communities, ecological compensation, and long-term monitoring.
4.5. Limitations
Several limitations should be acknowledged. First, the future scenarios depend on the assumed land-use transition rules and planning constraints, and uncertainty in land-use projections may propagate to the derived landscape metrics and habitat quality estimates. Second, uncertainty may also arise from InVEST parameterization and from the fact that both landscape metrics and habitat quality estimates are derived from the same underlying land-use data. Third, enclave classification and the dominant-source assumption necessarily simplify variation among enclaves and the possible overlap in their spatial contributions. Residual spatial dependence remained, and some area-specific thresholds were sensitive to the maximum candidate radius and predictive gain criterion. These model-dependent predictive scales have limited applicability as precise ecological or management boundaries. Future research could further assess these uncertainties through multi-source ecological validation, alternative parameter settings, ensemble simulations, more flexible classification methods, cumulative-source models, and spatially explicit statistical approaches.
5. Conclusions
An integrated framework for examining the spatial associations and predictive spatial thresholds of national park enclaves was developed by linking multi-scenario land-use simulation, landscape pattern analysis, habitat quality assessment, and ZOI-based spatial association analysis and threshold identification. The findings demonstrate that changes in enclave landscape patterns were spatially associated with national park-scale habitat quality variation, with the direction, relative strength, and predictive spatial scale of these associations differing among scenarios, landscape metrics, enclave types, and area classes. In the overall analysis, PD and LPI had predictive thresholds of 48.5 and 39.0 km under ECMS, respectively. Under ECMS, large built-up disturbance enclaves had the largest mean absolute conditional contrasts across all six landscape metrics among the evaluated type-area groups. The results indicate that enclave area alone is insufficient for determining management priorities. Type, land-use composition, management scenario, and spatial location also need to be considered together with association strength and predictive spatial scale. For this reason, enclave management should combine boundary coordination with spatially explicit assessment of associations between enclave landscape patterns and habitat quality. Enclaves with strong human disturbance and larger predictive spatial thresholds or stronger conditional associations should be prioritized for further ecological assessment to determine whether stronger spatial controls, land-use adjustments, or ecological restoration are needed. In contrast, enclaves with weaker conditional associations but close links to community livelihoods may be considered for co-management and low-disturbance use. Overall, an approach was developed to identify ecological vulnerabilities within protected areas and support targeted, type-specific management of national park enclaves informed by predictive spatial thresholds.
Supplementary Materials
The following supporting information can be downloaded at https://www.mdpi.com/article/10.3390/land15101871/s1, Section S1: Data sources and preprocessing; Table S1: Data sources in the study; Section S2: Rationale for driving factor selection in the PLUS Model; Table S2: Drivers of natural and social factors [42,43,44]; Section S3: Rationale for the landscape pattern index selection; Table S3: Selection and ecological significance of landscape pattern indices; Section S4: Habitat quality model formulation and parameters; Table S4: Threat factors, maximum influence distances, relative weights, and distance–decay types; Table S5: Habitat suitability and sensitivity of land-use types to each threat; Section S5: K-means classification of enclave types; Table S6: CLR cluster centres and sample sizes for the selected K = 4 solution; Section S6: ZOI exposure construction and spatial model evaluation; Section S7: Rationale for selecting the maximum candidate radius and predictive gain criterion; Table S7: Number of detected thresholds under different maximum candidate radii and stability between adjacent search ranges; Table S8: Representative combinations sensitive to the maximum candidate radius and their predictive spatial thresholds; Table S9: Differences between thresholds derived using the 90% and 99% predictive gain criteria at a maximum candidate radius of 60 km; Table S10: Area-specific combinations with threshold differences greater than 2 km between the 90% and 99% predictive gain criteria; Section S8: Results of habitat quality assessment within enclaves under different scenarios; Figure S1: Habitat quality distribution in Wuyishan National Park enclaves in 2025; Figure S2: Habitat quality distribution of Wuyishan National Park enclaves under BAU in 2035 and 2050; Figure S3: Habitat quality distribution of Wuyishan National Park enclaves under BCM in 2035 and 2050; Figure S4: Habitat quality distribution of Wuyishan National Park enclaves under ECM in 2035 and 2050; Figure S5: Habitat quality distribution of Wuyishan National Park enclaves under ECMS in 2035 and 2050.
Author Contributions
Conceptualization, X.C. and L.L.; methodology, X.C.; software, X.C.; formal analysis, X.C.; investigation, X.C., L.L. and W.Z.; writing—original draft preparation, X.C.; writing—review and editing, X.C., L.L., G.D. and W.Z.; visualization, X.C.; supervision, G.D.; project administration, L.L.; funding acquisition, L.L. and G.D. All authors have read and agreed to the published version of the manuscript.
Funding
This research was funded by the National Natural Science Foundation of China, grant number 32401461, as well as the Hainan Province Philosophy and Social Sciences Research Planning Project, grant number HNSK(QN)26-81, And The APC was funded by the Special Grant for Research on Biodiversity and Carbon Sink Monitoring in Fuzhou’s Urban Parks, grant number KKYC25007A.
Data Availability Statement
The original contributions presented in the study are included in the article. Further inquiries can be directed to the corresponding author.
Conflicts of Interest
The authors declare no conflicts of interest.
Abbreviations
The following abbreviations are used in this manuscript:
| AI | Aggregation Index |
| BAU | Business-as-usual scenario |
| BCM | Basic coordinated management scenario |
| CONTAG | Contagion Index |
| DEM | Digital Elevation Model |
| ECM | Enhanced coordinated management scenario |
| ECMS | Enclave consolidation management scenario |
| InVEST | Integrated Valuation of Ecosystem Services and Trade-offs |
| LPI | Largest Patch Index |
| PD | Patch Density |
| PLUS | Patch-generating Land Use Simulation |
| SHDI | Shannon’s Diversity Index |
| SHEI | Shannon’s Evenness Index |
| ZOI | Zone of Influence |
References
- Shin, Y.J.; Midgley, G.F.; Archer, E.R.; Arneth, A.; Barnes, D.K.; Chan, L.; Hashimoto, S.; Hoegh-Guldberg, O.; Insarov, G.; Leadley, P. Actions to halt biodiversity loss generally benefit the climate. Glob. Change Biol. 2022, 28, 2846–2874. [Google Scholar] [CrossRef] [Scilit] [PubMed]
- Yang, L.; Xu, H.; Pan, S.; Chen, W.; Zeng, J. Identifying the impact of global human activities expansion on natural habitats. J. Clean. Prod. 2024, 434, 140247. [Google Scholar] [CrossRef] [Scilit]
- Wudu, K.; Abegaz, A.; Ayele, L.; Ybabe, M. The impacts of climate change on biodiversity loss and its remedial measures using nature based conservation approach: A global perspective. Biodivers. Conserv. 2023, 32, 3681–3701. [Google Scholar] [CrossRef] [Scilit]
- Duncanson, L.; Liang, M.; Leitold, V.; Armston, J.; Krishna Moorthy, S.; Dubayah, R.; Costedoat, S.; Enquist, B.; Fatoyinbo, L.; Goetz, S. The effectiveness of global protected areas for climate change mitigation. Nat. Commun. 2023, 14, 2908. [Google Scholar] [CrossRef] [Scilit] [PubMed]
- Ghoddousi, A.; Loos, J.; Kuemmerle, T. An outcome-oriented, social–ecological framework for assessing protected area effectiveness. BioScience 2022, 72, 201–212. [Google Scholar] [CrossRef] [Scilit] [PubMed]
- Velazco, S.J.E.; Bedrij, N.A.; Rojas, J.L.; Keller, H.A.; Ribeiro, B.R.; De Marco, P. Quantifying the role of protected areas for safeguarding the uses of biodiversity. Biol. Conserv. 2022, 268, 109525. [Google Scholar] [CrossRef] [Scilit]
- Schauman, S.A.; Peñuelas, J.; Jobbágy, E.G.; Baldi, G. The geometry of global protected lands. Nat. Sustain. 2024, 7, 82–89. [Google Scholar] [CrossRef] [Scilit]
- Ricci, L.; Di Musciano, M.; Sabatini, F.M.; Chiarucci, A.; Zannini, P.; Gatti, R.C.; Beierkuhnlein, C.; Walentowitz, A.; Lawrence, A.; Frattaroli, A.R. A multitaxonomic assessment of Natura 2000 effectiveness across European biogeographic regions. Conserv. Biol. 2024, 38, e14212. [Google Scholar] [CrossRef] [Scilit] [PubMed]
- Di Musciano, M.; Zannini, P.; Testolin, R.; Sabatini, F.M.; Santovito, D.; Jiménez-Alfaro, B.; Jansen, F.; Chytrý, M.; Ricci, L.; Agrillo, E. Representativeness of the Natura 2000 network for preserving plant biodiversity in the European Union. Conserv. Biol. 2026, 40, e70158. [Google Scholar] [CrossRef] [Scilit] [PubMed]
- Stephens, T. The Kunming–Montreal global biodiversity framework. Int. Leg. Mater. 2023, 62, 868–887. [Google Scholar] [CrossRef] [Scilit]
- Fan, X.; Zang, Z.; Tang, J.; Zhao, L.; Xu, W.; Ouyang, Z. Ecological integrity assessment system for Wuyishan National Park. Ecol. Indic. 2025, 178, 113910. [Google Scholar] [CrossRef] [Scilit]
- Wang, Z.; Tang, L.; Li, L.; Sun, G.; Huang, B. “Tianchuang” management in China′s national parks: Current status, challenges, and recommendations. Natl. Park 2025, 3, 547–555. [Google Scholar]
- Enuoh, O.O.; Ogogo, A.U. Cross River National Park and communities: Is authoritarian park protection the answer? J. Sustain. Dev. 2018, 11, 212. [Google Scholar] [CrossRef] [Scilit]
- Ewah, J.O. The effects of creating access roads on the integrity of conserved areas: A case study of Okwangwo rainforest in Cross River National Park, Nigeria. J. Hum. Ecol. 2012, 38, 105–115. [Google Scholar] [CrossRef] [Scilit]
- Kuyek, J. A Disaster Waiting to Happen: Prairie Creek Mine; MiningWatch Canada: Ottawa, ON, Canada, 2004. [Google Scholar]
- Government of the Republic of Indonesia. Submission for Nomination of Tropical Rainforest Heritage of Sumatra to Be Included in the World Heritage List; Directorate General of Forest Protection and Nature Conservation, Ministry of Forestry: Jakarta, Indonesia, 2003.
- Sardjo, S. The Green Encounters:“Common Good” Narrative and Community Struggle in Halimun Salak Coridor, West Java. Antropol. Indones. 2023, 44, 2. [Google Scholar] [CrossRef] [Scilit]
- Bettinger, K. Death by 1000 cuts: Road politics at Sumatra’s Kerinci Seblat National Park. Conserv. Soc. 2014, 12, 280–293. [Google Scholar] [CrossRef] [Scilit]
- Fathoni, T. Managing Conflict in National Parks: The Case of Encroachment in Kerinci Seblat, Indonesia. Ph.D. Thesis, University of Edinburgh, Edinburgh, Scotland, 1998. [Google Scholar]
- Ali, R. Enclaves in Kalakad-Mundanthurai Tiger Reserve; Project Tiger, KMTR; North: Ottawa, ON, Canada, 1999. [Google Scholar]
- Ali, R.; Pai, A. Human use areas in the Kalakad–Mundanthurai Tiger Reserve. Curr. Sci. 2001, 80, 448–452. [Google Scholar]
- Renkert, S.R. Community-owned tourism and degrowth: A case study in the Kichwa Añangu community. J. Sustain. Tour. 2019, 27, 1893–1908. [Google Scholar] [CrossRef] [Scilit]
- Tagowa, W.N.; Buba, U.N. Emergent strategies for sustainable rural tourism development of Gashaka-Gumti National Park, Nigeria. WIT Trans. Ecol. Environ. 2012, 161, 27–41. [Google Scholar] [CrossRef] [Scilit]
- Tao, R.; Li, T.; Zhang, X. Tianchuang in national parks of China: Its concept, causes, and consequences. Land 2025, 14, 2275. [Google Scholar] [CrossRef] [Scilit]
- Sahabo, A. Community participation in tourist resort development in Gashaka Gumti National Park, north eastern Nigeria. FUTY J. Environ. 2019, 13, 112–127. [Google Scholar]
- Wu, L.; Dong, C.; Su, X.-Y.; Zeng, S.-B.; Tan, X.-M. Discussion on China’s natural protected area planning under the guidance of spatial planning. World For. Res. 2020, 33, 94–100. [Google Scholar] [CrossRef]
- Kwesaba, D.A.; Daniel, O.E.; Delphine, D.; Benjamin, E. Examination of the challenges militating against the development of Gashaka-Gumti National Park, Nigeria. J. Emerg. Technol. Innov. Res. 2023, 10, b665–b673. [Google Scholar]
- Bennett, D.; Ross, C. Fulani of the highlands: Costs and benefits of living in national park enclaves. In Primates of Gashaka: Socioecology and Conservation in Nigeria’s Biodiversity Hotspot; Sommer, V., Ross, C., Eds.; Springer: New York, NY, USA, 2011; pp. 283–317. [Google Scholar]
- Ma, Y.; He, S. Path and practice of gap management in national parks: A comparison between China and the US and inspirations therefrom. Landsc. Archit. 2025, 32, 20–27. [Google Scholar] [CrossRef] [Scilit]
- Zhang, H.; Xue, R.; Wang, A.; Zhang, Y.; Yao, L.; Sun, Y.; Zhang, T. From embedded to dis-embedded community: With a discussion of community theory for the national parks and its policy enlightenments. J. Nat. Resour. 2023, 38, 885–901. [Google Scholar] [CrossRef] [Scilit]
- Wu, C.; Wang, C. The nature, development characters and policy needs of national park gateway communities in China. Chin. Landsc. Archit. 2022, 38, 14–19. [Google Scholar]
- Gao, J.; Liu, X.; Zhou, D.; Ma, K.; Wu, Q.; Li, G. Some opinions on the integration and optimization of natural protected areas in China. Biodivers. Sci. 2021, 29, 290–294. [Google Scholar] [CrossRef] [Scilit]
- Li, L. Analysis of Landscape Pattern and Spatio-Temporal Change for Ecosystem Service Value in Hainan Tropical Rainforest National Park. Ph.D. Thesis, Hainan University, Haikou, China, 2022. [Google Scholar]
- Fitz, J.; Adenle, A.A.; Speranza, C.I. Increasing signs of forest fragmentation in the Cross River National Park in Nigeria: Underlying drivers and need for sustainable responses. Ecol. Indic. 2022, 139, 108943. [Google Scholar] [CrossRef] [Scilit]
- Jang, Y.; Yang, X.; Zhu, Z.; Lang, C.; Wang, C.; He, Y.; Wu, T.; Li, Y.; Zhang, S.; Li, J.; et al. Comparative analysis of the driving forces behind land use change in the rural community of Hainan Tropical Rainforest National Park. Chin. J. Trop. Crops 2025, 46, 474–489. [Google Scholar]
- Fu, T.; Cao, Y.; Lan, S.; Yu, L.; Liao, L. Can protected area networks effectively conserve ecosystem services at the landscape scale? Evidence from Wuyishan Biodiversity Priority Conservation Area, China. Ecosyst. Serv. 2026, 78, 101816. [Google Scholar] [CrossRef] [Scilit]
- Zhang, M.; Lin, N.; You, G.; Wang, Y.; Wang, L.; Zou, C.; Yan, R.; Zhang, Y. Variations and influencing factors of vegetation net primary productivity over 31 years in Wuyishan National Park, China. Sci. Rep. 2024, 14, 29002. [Google Scholar] [CrossRef] [Scilit] [PubMed]
- Sun, Q.; Cao, Y.; Zhang, J.; Xu, J. An empirical study on the effects of the “Sky Window” policy on household income in rural communities: Evidence from Wuyi Mountain National Park. Forests 2025, 16, 1443. [Google Scholar] [CrossRef] [Scilit]
- He, S.; Su, Y. Experience and improvement recommendations of Wuyishan National Park pilot: Difficulty and solutions in the reform of national park located in the collective forest area in South China. Biodivers. Sci. 2021, 29, 321–324. [Google Scholar] [CrossRef] [Scilit]
- Liang, X.; Guan, Q.; Clarke, K.C.; Liu, S.; Wang, B.; Yao, Y. Understanding the drivers of sustainable land expansion using a patch-generating land use simulation (PLUS) model: A case study in Wuhan, China. Comput. Environ. Urban Syst. 2021, 85, 101569. [Google Scholar] [CrossRef] [Scilit]
- Zhang, J.; Wang, J.; Chen, Y.; Huang, S.; Liang, B. Spatiotemporal variation and prediction of NPP in Beijing-Tianjin-Hebei region by coupling PLUS and CASA models. Ecol. Inform. 2024, 81, 102620. [Google Scholar] [CrossRef] [Scilit]
- Huang, C.; Zhou, Y.; Wu, T.; Zhang, M.; Qiu, Y. A cellular automata model coupled with partitioning CNN-LSTM and PLUS models for urban land change simulation. J. Environ. Manag. 2024, 351, 119828. [Google Scholar] [CrossRef] [Scilit] [PubMed]
- Tan, G.; Zhu, J.; Chen, Z. Evolution and dynamic prediction of urban-rural settlement patterns in a Chinese county-level city under new-type urbanization. Habitat Int. 2025, 165, 103540. [Google Scholar] [CrossRef] [Scilit]
- Liu, J.; Kong, X.; Zhu, Y.; Zhang, B. A study on land use change simulation based on PLUS model and the U-Net structure: A case study of Jilin Province. Ecol. Indic. 2025, 176, 113619. [Google Scholar] [CrossRef] [Scilit]
- Hansen, A.J.; DeFries, R. Ecological mechanisms linking protected areas to surrounding lands. Ecol. Appl. 2007, 17, 974–988. [Google Scholar] [CrossRef] [Scilit] [PubMed]
- DeFries, R.; Hansen, A.; Turner, B.L.; Reid, R.; Liu, J. Land use change around protected areas: Management to balance human needs and ecological function. Ecol. Appl. 2007, 17, 1031–1038. [Google Scholar] [CrossRef] [Scilit] [PubMed]
- Niebuhr, B.B.; Van Moorter, B.; Stien, A.; Tveraa, T.; Strand, O.; Langeland, K.; Sandström, P.; Alam, M.; Skarin, A.; Panzacchi, M. Estimating the cumulative impact and zone of influence of anthropogenic features on biodiversity. Methods Ecol. Evol. 2023, 14, 2362–2375. [Google Scholar] [CrossRef] [Scilit]
- Cai, X.; Su, Y. From conflict to mutualism: The institutional logic of national parks in the construction of ecological civilization. J. Manag. World 2022, 38, 131–154. [Google Scholar]
- Gao, X.; Wu, D.; Zhou, K.; Liao, L. Delimitation of urban space and urban development boundaries in national spatial planning. Geogr. Res. 2019, 38, 2458–2472. [Google Scholar]
- Zhang, S.; Liu, Z.; Wang, Y. Delineation of the “three zones and three lines” and optimization of spatial layout: Obstacles and methodological thinking. In Proceedings of the Urban Planning Forum, Katowice, Poland, 26–30 June 2022; pp. 12–19. [Google Scholar]
- Tang, X. Functional orientation and spatial attribute analysis of the National Park Planning System of China. Biodivers. Sci. 2020, 28, 1246–1254. [Google Scholar] [CrossRef] [Scilit]
- Zhao, J.; Yu, L.; Newbold, T.; Chen, X. Trends in habitat quality and habitat degradation in terrestrial protected areas. Conserv. Biol. 2025, 39, e14348. [Google Scholar] [CrossRef] [Scilit] [PubMed]
- Dai, P.; Ye, J.; Liu, J.; Zhou, D.; Cheng, X.; Wang, Y. Evolution of habitat quality and multi-scenario simulation in the Giant Panda National Park. Environ. Sustain. Indic. 2025, 28, 100893. [Google Scholar] [CrossRef] [Scilit]
- Ameztegui, A.; Morán-Ordóñez, A.; Márquez, A.; Blázquez-Casado, Á.; Pla, M.; Villero, D.; García, M.B.; Errea, M.P.; Coll, L. Forest expansion in mountain protected areas: Trends and consequences for the landscape. Landsc. Urban Plan. 2021, 216, 104240. [Google Scholar] [CrossRef] [Scilit]
- Kimaro, E.W.; Wilson, M.L.; Pintea, L.; Mjema, P.; Powers, J.S. Community-managed forests can secure forest regrowth and permanence in human-modified landscapes. Glob. Ecol. Conserv. 2024, 52, e02966. [Google Scholar] [CrossRef] [Scilit]
- Yang, H.; Xu, W.; Yu, J.; Xie, X.; Xie, Z.; Lei, X.; Wu, Z.; Ding, Z. Exploring the impact of changing landscape patterns on ecological quality in different cities: A comparative study among three megacities in eastern and western China. Ecol. Inform. 2023, 77, 102255. [Google Scholar] [CrossRef] [Scilit]
- Fahrig, L.; Arroyo-Rodríguez, V.; Bennett, J.R.; Boucher-Lalonde, V.; Cazetta, E.; Currie, D.J.; Eigenbrod, F.; Ford, A.T.; Harrison, S.P.; Jaeger, J.A.G.; et al. Is habitat fragmentation bad for biodiversity? Biol. Conserv. 2019, 230, 179–186. [Google Scholar] [CrossRef] [Scilit]
- Riva, F.; Fahrig, L. Landscape-scale habitat fragmentation is positively related to biodiversity, despite patch-scale ecosystem decay. Ecol. Lett. 2023, 26, 268–277. [Google Scholar] [CrossRef] [Scilit] [PubMed]
- Ayeni, S.; Meduna, P.; Babatunde, A. Effects of banditry and illegal logging on conservation in Kainji Lake National Park, Nigeria. J. Appl. Sci. Environ. Manag. 2025, 29, 101–106. [Google Scholar] [CrossRef] [Scilit]
- Kang, X.; Du, M.; Zhao, L.; Liu, Q.; Liao, Z.; Su, H.; Xiang, T.; Gou, C.; Liu, N. Integrity-centered framework for determining protected areas boundary: An application in the China’s national park. Ecol. Inform. 2024, 84, 102885. [Google Scholar] [CrossRef] [Scilit]
- Rui, Y.; Zhicong, Z.; Zhenwei, Z. The responsibilities, rights, and rewards of original residents embedded in the National Park Act. Natl. Park 2024, 2, 677–686. [Google Scholar]
- Amaral, Y.T.; dos Santos, E.M.; Ribeiro, M.C.; Barreto, L. Landscape structural analysis of the Lençóis Maranhenses National Park: Implications for conservation. J. Nat. Conserv. 2019, 51, 125725. [Google Scholar] [CrossRef] [Scilit]

Disclaimer/Publisher’s Note: The statements, opinions and data contained in all publications are solely those of the individual author(s) and contributor(s) and not of MDPI and/or the editor(s). MDPI and/or the editor(s) disclaim responsibility for any injury to people or property resulting from any ideas, methods, instructions or products referred to in the content. |
© 2026 by the authors. Licensee MDPI, Basel, Switzerland. This article is an open access article distributed under the terms and conditions of the Creative Commons Attribution (CC BY) license.