Article

Spatio-Temporal Dynamics of Land Use and Land Cover Change in the Agricultural Plains of Cul-de-Sac, Maribahoux, and Léogâne (1997–2024): An Analysis Using Remote Sensing and Landscape Metrics

by
Roselande Jesuka
1,2,*,
Julien Bwazani Balandi
2,3,
Waselin Salomon
1,
Yannick Useni Sikuzani
4,
Héritier Khoji Muteya
4,
Henri Kabanyegeye
5,
Léa Mukubu Pika
2,
Médard Mpanda Mukenza
2,6,
Kouagou Raoul Sambieni
7,
Walguen Oscar
8,9,
Bastin Jean-François
2,
Jean Marie Théodat
10,11 and
Jan Bogaert
2
1
Henry Christophe Campus of Limonade, State University of Haiti, National Road #6, Limonade HT 1130, Haiti
2
Biodiversity, Ecosystem, and Landscape Axis, University of Liège—Gembloux Agro-BioTech, 5030 Gembloux, Belgium
3
Regional Postgraduate School of Integrated Management of Tropical Forests and Territories, Kinshasa P.O. Box 15373, Democratic Republic of the Congo
4
Ecology, Ecological Restoration and Landscape Unit, Faculty of Agronomic Sciences, University of Lubumbashi, Lubumbashi 1825, Democratic Republic of the Congo
5
Research Centre of Natural and Environmental Sciences, University of Burundi, Bujumbura P.O. Box 2700, Burundi
6
Department of Renewable Natural Resources Management, Faculty of Agronomic Sciences, University of Kolwezi, Kolwezi 1825, Democratic Republic of the Congo
7
Faculty of Architecture, University of Lubumbashi, Lubumbashi 1825, Democratic Republic of the Congo
8
Laboratory of Mathematics, Computer Science and Applications (LAMIA), University of the French West Indies, 97157 Pointe-à-Pitre, France
9
Department of Mathematics, École Normale Supérieure, State University of Haiti, Port-au-Prince HT 6110, Haiti
10
URBATeR, URBALaB, Faculty of Sciences, State University of Haiti, Corner of Joseph and Mgr Guilloux Street, Port-au-Prince HT 6110, Haiti
11
PRODIG Geography Laboratory, Research Building South 5, Condorcet Campus, University of Paris 1, 93322 Paris, France
*
Author to whom correspondence should be addressed.
Land 2025, 14(11), 2230; https://doi.org/10.3390/land14112230
Submission received: 29 September 2025 / Revised: 24 October 2025 / Accepted: 8 November 2025 / Published: 11 November 2025
(This article belongs to the Section Landscape Ecology)

Abstract

In Haiti, uncontrolled urbanization is increasing pressure on agricultural landscapes, compromising both their ecological integrity and productivity. This study examines spatio-temporal land-use changes across three agricultural plains, Cul-de-Sac, Maribahoux, and Léogâne, between 1997 and 2024, using Landsat imagery and landscape metrics of composition (percentage of landscape, PLAND) and configuration (largest patch index, LPI). The findings reveal a rapid expansion of built-up areas, primarily at the expense of farmland. In the Cul-de-Sac plain, built-up areas and bare soil grew by 152%, from 41.26 km2 to 104.11 km2, while agricultural land became highly fragmented (LPI dropping from 94.51% to 57.63%). In Maribahoux, urbanization was more moderate, partly offset by a temporary rise in woody vegetation that peaked at 20.04% in 2022 before declining. The Léogâne plain experienced a 17.38 km2 increase in built-up areas and bare soil, alongside a slight decrease in woody vegetation. Population density showed limited differences in Maribahoux and Léogâne, but marked disparities in Cul-de-Sac, where landscape transformation was more pronounced. These findings highlight increasing fragmentation of agricultural landscapes, threatening ecological connectivity and functionality, and stress the urgent need for land-use planning that curbs urban growth, protects farmland, and safeguards biodiversity.

1. Introduction

When aligned with sustainable development principles, agriculture plays a vital role in the socio-ecological transition by providing key economic, social, and ecological functions such as food security, carbon sequestration, watershed regulation, and biodiversity conservation [1,2]. Globally, it remains a cornerstone of human development, employing 26.2% of the workforce in 2022 [3] and accounting for 4.1% of the world’s GDP [4]. However, urbanization has become a significant global challenge for agriculture: the urban population increased from 2.6 billion in 1950 to 8 billion in 2024 and is expected to reach 9.7 billion by 2050 [5]. Often occurring without planning, this growth exerts considerable pressure on agricultural land, reducing its area and fragmenting its structure [6,7]. Worldwide, urbanization is projected to cause the loss of 1.80–2.40% of agricultural land by 2030, with the most productive plots being affected 1.77 times more [8].
Latin America and the Caribbean, where over 80% of the population lives in urban areas [9], are no exception. Significant agricultural losses have also been documented in other Caribbean territories [10], highlighting the regional scope of this issue. However, the situation in Haiti appears particularly critical. The Republic of Haiti, one of the most densely populated countries in the Caribbean, is particularly vulnerable to natural disasters. In 2015, 58.6% of its population lived in urban areas [11], a proportion that could rise to 76% by 2050 [12]. This population growth is accompanied by rapid, informal, and largely unplanned urban expansion that encroaches on agricultural plains. These plains cover about 20% of the country’s land area [13] and have historically supported agricultural production since colonial times. Until 2010, the agricultural sector contributed 25% of the nation’s GDP [13], reaffirming its vital role in the country’s economy and food security. However, the lack of suitable land-use policies leaves these strategic areas vulnerable to disorderly urbanization and a gradual loss of their agricultural function.
In Haiti, unplanned urbanization is primarily informal and spreads across fertile, low-lying agricultural zones [12]. According to [14], planned urban development can promote sustainable growth, whereas uncontrolled urbanization tends to exacerbate social inequalities, increase poverty levels, and worsen structural vulnerabilities. As cultivated land in the plains decreases, more people are forced to farm in mountainous areas, many of which are unsuitable for farming. This shift to marginal land accelerates erosion, damages watersheds, and permanently reduces soil fertility, weakening the resilience of farming systems [13]. The plains of Léogâne, Cul-de-Sac, and Maribahoux, home to the cities of Léogâne, Port-au-Prince, and Ouanaminthe, respectively, have experienced unplanned urban growth over the past 30 years, increasing human pressure on farmland and forcing farmers into more vulnerable areas.
Despite the strategic importance of these plains for national food security, few studies have documented their transformation under urbanization, even though such degradation permanently undermines the resilience of Haiti’s agricultural systems. However, at a global scale, numerous studies have shown that rapid urban expansion profoundly alters the use of rural and peri-urban lands, leading to the conversion and fragmentation of agricultural landscapes and increased vulnerability of socio-ecological systems [15,16]. In countries such as China and Egypt, unplanned urban growth has fragmented cultivated lands, reduced their ecological connectivity, and degraded ecosystem services, thereby compromising the sustainability of agricultural livelihoods [17]. This pattern is not confined to Asia or Africa. The Latin America and Caribbean region has also experienced significant agricultural land loss in Guadeloupe (22%) and Martinique (25%) between 2000 and 2010, reflecting similar pressures from urban expansion [9].
Against this backdrop, this research characterizes the spatio-temporal dynamics of land-use from 1997 to 2024 in the Cul-de-Sac, Maribahoux, and Léogâne plains. We propose two main hypotheses: (i) increases in built-up areas and bare soil primarily occur at the expense of cultivated land and degraded vegetation, with particularly notable changes in the Cul-de-Sac plain; and (ii) these changes are more noticeable in densely populated areas, where urbanization leads to greater fragmentation of agricultural landscapes and the spatial clustering of built-up areas. These hypotheses are based on several conceptual frameworks. Urban-transition theory suggests that demographic and economic growth drive the spatial expansion of cities, often at the expense of nearby agricultural land [15]. Similarly, approaches to agricultural resilience indicate that the fragmentation and reduction in productive land weaken the capacity of farming systems to sustain their functions amidst human and environmental pressures [18]. In the Cul-de-Sac plain, the proximity to Port-au-Prince amplifies these dynamics, increasing both the concentration of built-up areas and the vulnerability of agricultural zones [19].
This study, therefore, helps fill a knowledge gap by documenting, in space and time, the transformation of Haiti’s agricultural plains under unplanned urbanization. Using remote sensing, geographic information systems, and landscape ecology metrics, it provides a sound scientific basis for informing land-use policy and promoting better coordination between urbanization and the preservation of agricultural land.

2. Materials and Methods

2.1. Study Area
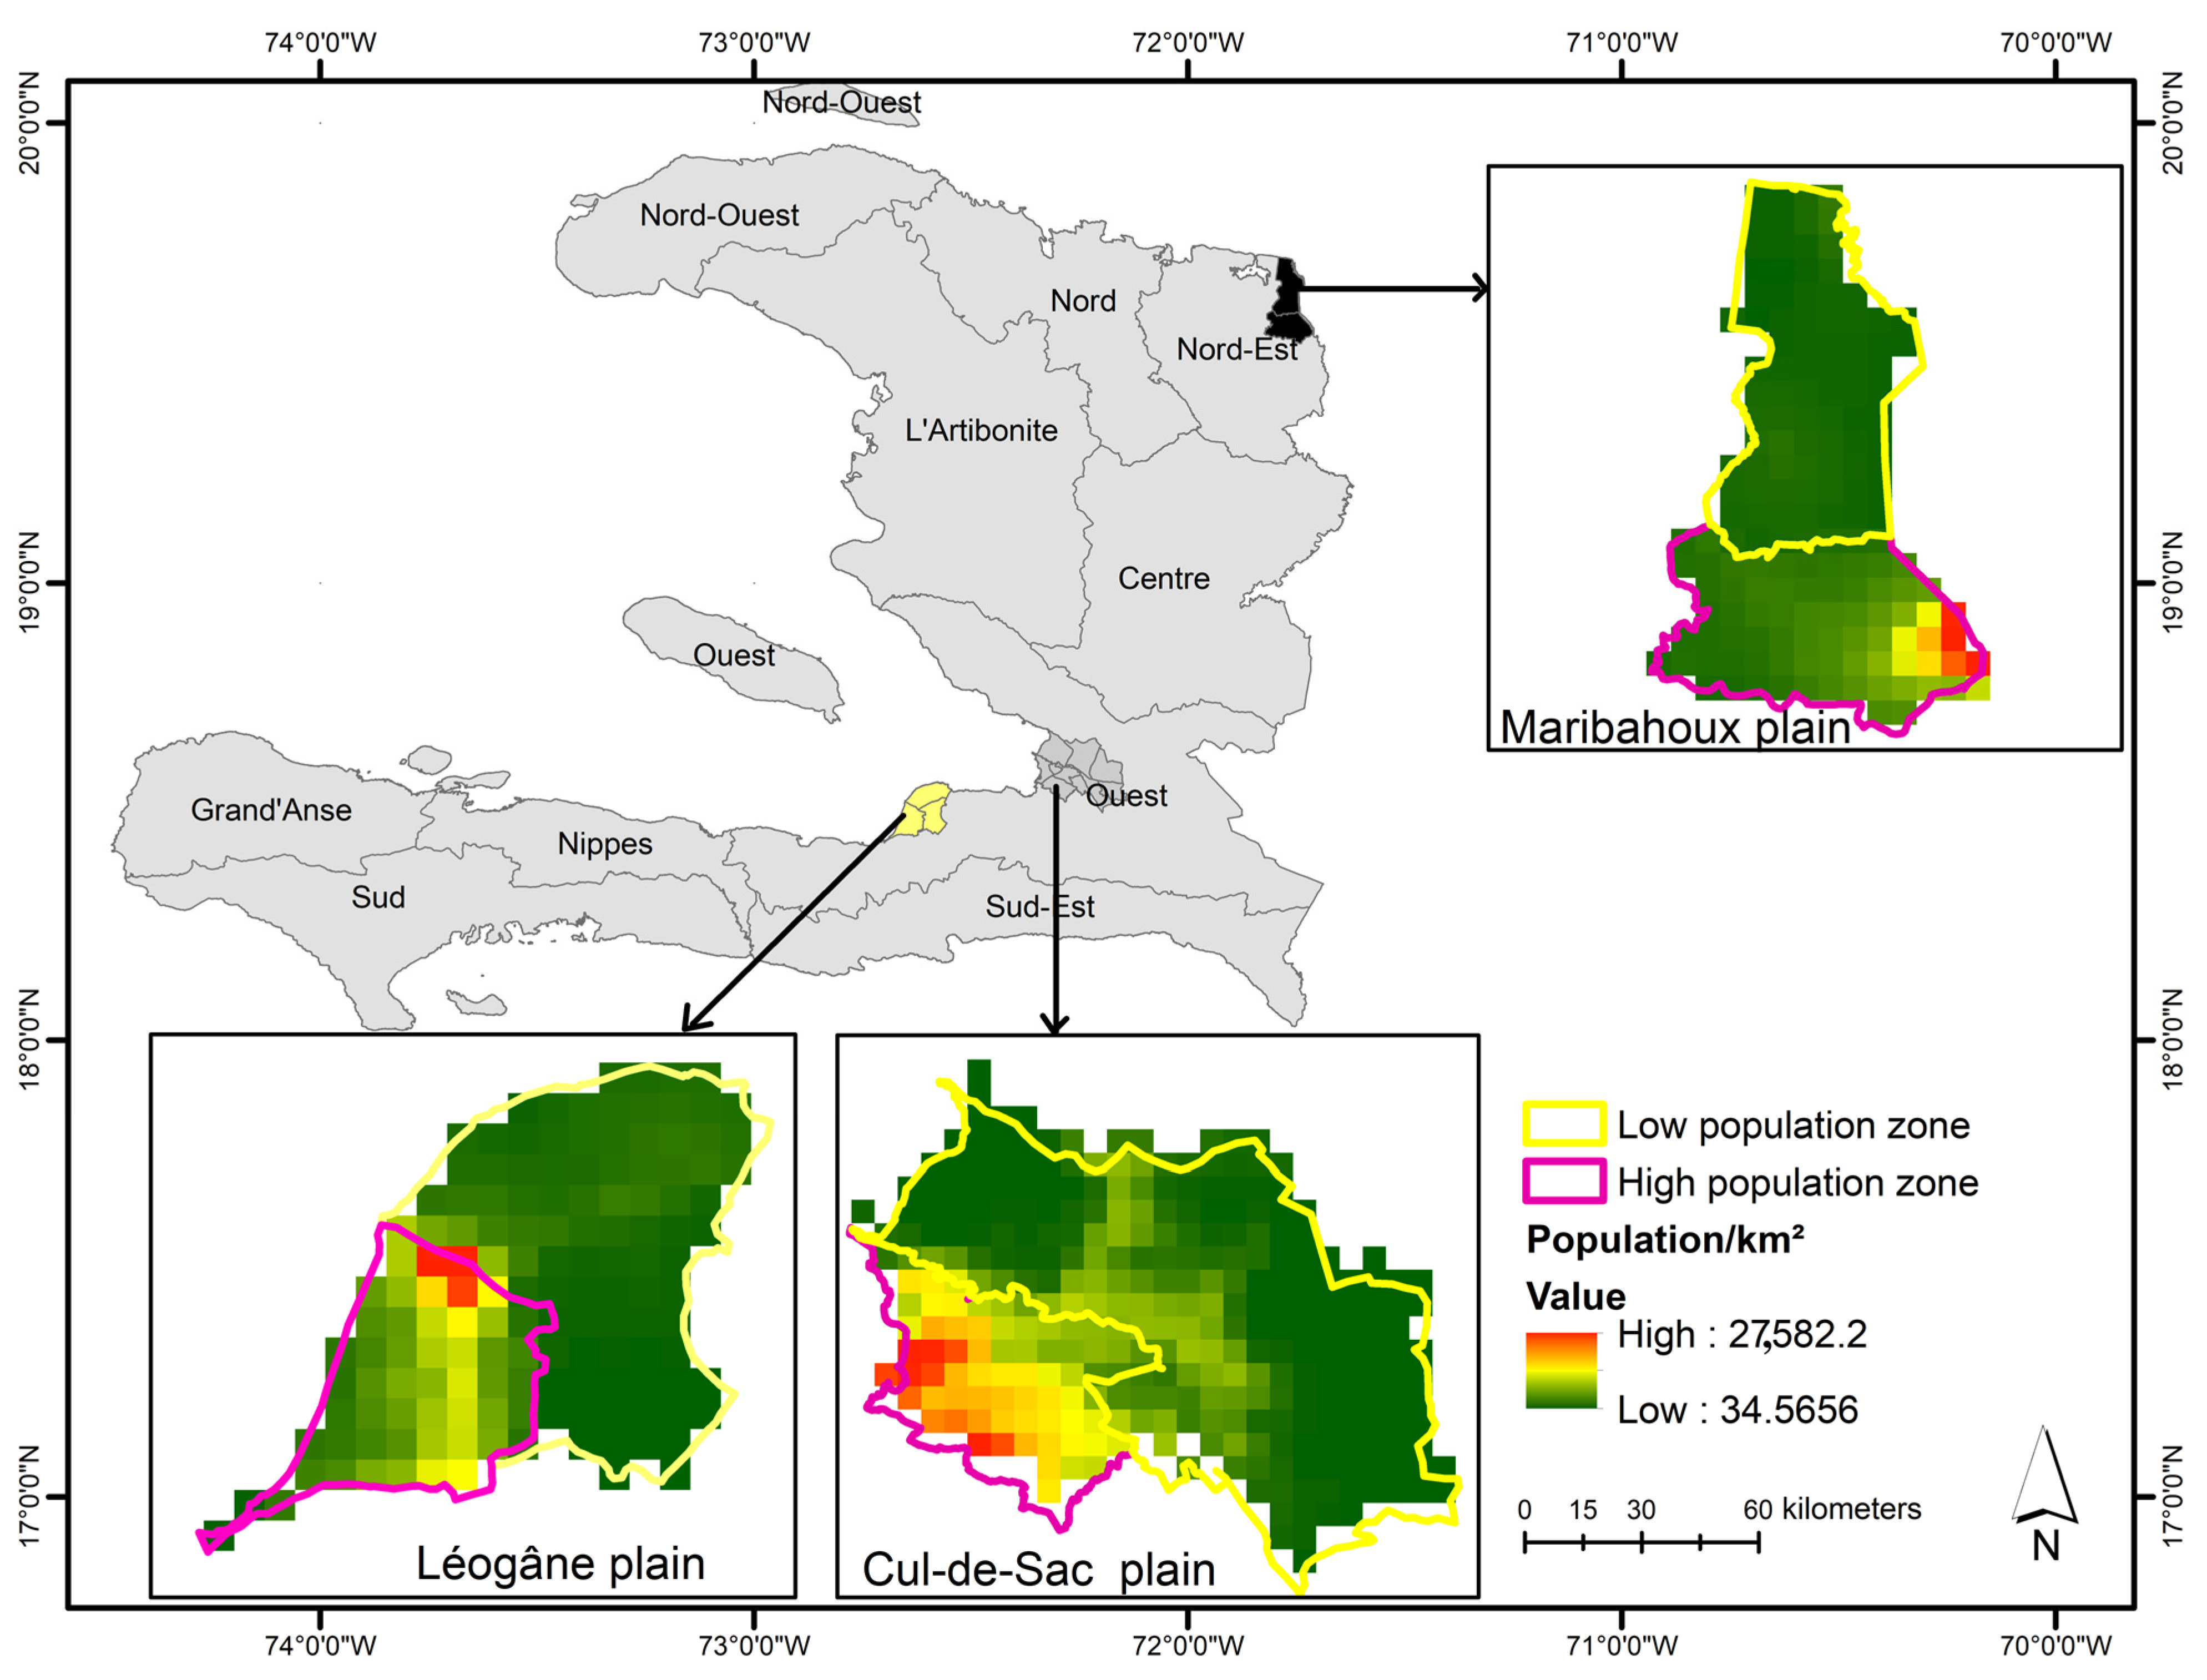
This research focuses on three strategic agricultural plains in Haiti: Cul-de-Sac, Maribahoux, and Léogâne (Figure 1). The Cul-de-Sac plain lies between 18°30′–18°40′ N and 72°02′–72°20′ W, stretching from Port-au-Prince Bay to the Matheux, Trou d’Eau, and Selle ranges. It has a Köppen–Geiger Aw (savanna) climate, with an average annual temperature of 26.2 °C and 898 mm of precipitation. However, it shows significant variation between years, with recent periods of drought and heavy rainfall affecting irrigation and growing seasons. Its agro-ecosystem, including dry zones and irrigated areas, supports a diverse range of crops such as cereals, legumes, tubers, vegetables, and orchards [20]. Located within the Port-au-Prince metropolitan area, it faces constant urban pressure, which has increased since the 2010 earthquake due to population displacement and expanded housing development. The study area covers 256 km2.
The Maribahoux plain, located in northeastern Haiti between 19°31′–19°43′ N and 70°41′12″–71°52′30″ W, covers approximately 122.66 km2 across the communal sections of Bas Maribahoux and Haut Maribahoux (commune of Ouanaminthe). It has an Aw savanna climate (25.5 °C; 855 mm annually) and features deep alluvial soils. Its shrubby savanna, mainly composed of Prosopis juliflora, supports a significant charcoal industry. Local agriculture, focusing on rice (Oryza sativa), maize (Zea mays), beans (Phaseolus vulgaris), tomato (Solanum lycopersicum), eggplant (Solanum melongena), sweet potato (Ipomoea batatas), and cassava (Manihot esculenta), exists alongside active cross-border trade and industrial growth [21].
The Léogâne plain, located 32 km west of Port-au-Prince (18°30′39″ N; 72°38′02″ W), covers an area of 118 km2. It experiences an Aw savanna climate (25.6 °C; 1047 mm annually) and has soils rich in organic matter, making it suitable for crops like sugarcane (Saccharum officinarum), plantain (Musa balbisiana), and mango (Mangifera indica) [22]. As the epicenter of the 2010 earthquake, it has undergone demographic changes and widespread suburbanization. Collectively, these rapidly urbanizing plains offer an ideal setting for studying the spatio-temporal dynamics of land-use and the fragmentation of agricultural landscapes.
Figure 1. Location map of the agricultural plains of Cul-de-Sac, Léogâne, and Maribahoux in Haiti. These plains are subdivided into communal sections and grouped into high-density (HD) and low-density (LD) population zones, defined using [23] population density data and a cutoff of 50,000 inhabitants/km2 to highlight gradients of human pressure.
Land 14 02230 g001

2.2. Data Selection and Acquisition

The spatial dynamics of the three study sites were analyzed using satellite images from Landsat TM (1997), ETM+ (2002, 2007, 2012), and OLI-TIRS (2017, 2022, 2024), all with a 30 m spatial resolution. The images were chosen not only for their availability and quality but also for their alignment with key periods in Haiti’s recent history, marked by socio-economic and political changes that are likely to have influenced land-use. Thus, the year 1997 reflects the post-liberalization of the rice trade (1995–1996), which led to the restructuring of the agricultural sector after customs duties were cut from 35% to 3%. The year 2002 preceded the gradual establishment of the Compagnie de Développement Industriel (CODEVI) Free Trade Zone in the Maribahoux plain (2003–2006), which significantly changed the local agricultural landscape. The years 2007 and 2012 encompass a period of socio-economic instability characterized by a series of hurricanes (2004–2008) and the 2010 earthquake, whose impacts intensified pressure on agricultural land and caused migration to certain plains. The years 2017, 2022, and 2024 document the latest changes amid increasing insecurity in Port-au-Prince, which led to substantial population movement to surrounding areas. The shapefiles delineating the three study sites were obtained from the National Center for Geospatial Information (CNIGS). Open-source software tools were used, including Google Earth Engine for image classification, QGIS (version 3.30.3) for post-classification processing, and Python (version 3.13) for data analysis.

2.3. Preprocessing of Landsat Images

Surface reflectance (SR) images were preferred to minimize atmospheric effects and radiometric differences caused by varying Landsat sensors [24]. For each study year, a scene-level cloud-cover filter (<20%) is first applied, followed by per-pixel median compositing (January–December) to mitigate cloud contamination and improve data quality. The surface reflectance for Landsat 4–5 TM and Landsat 7 ETM+ satellites is generated using the LEDAPS (Landsat Ecosystem Disturbance Adaptive Processing System) algorithm. Meanwhile, data from Landsat 8 and 9 sensors are produced with the LaSRC (Land Surface Reflectance Code) [25]. These processes enable the creation of images with consistent radiometric and spectral features, supporting reliable multi-temporal analyses [26]. The images were reprojected to the UTM coordinate system, zones 18N (Cul-de-Sac and Léogâne plains) and 19N (Maribahoux plain), using the WGS-84 ellipsoid to ensure spatial alignment [27]. False-color composites were generated by combining the green, red, and near-infrared bands, with the latter two bands particularly useful for distinguishing vegetation [28]. This approach facilitated the selection of training samples for supervised classification [29].

2.4. Supervised Classification of Landsat Images

For supervised classification, four land cover classes were identified at the three study sites: built-up and bare soil, woody vegetation, fields and degraded vegetation, and water (Table 1). Representative points for each class were selected from the false-color composite of the Landsat images. For the reference year 2024, 180 in situ points were collected in the Maribahoux plain using a Garmin GPS 66s device (±3 m accuracy) and used as training samples. In the Cul-de-Sac and Léogâne plains, where field access was precluded by severe gang-related insecurity, calibration points were delineated through visual photo-interpretation of very high-resolution imagery (Google Earth Pro, version 7.3.6.10441, 64-bit). An independent validation set comprising 600 samples (50 per class in each plain) was assembled to assess classification accuracy. For earlier epochs, training samples were drawn from spectrally homogeneous and temporally stable parcels to minimize mixed-pixel effects and ensure label consistency across dates. To avoid mixed pixels, the selected points were excluded from edge areas [30]. The Random Forest algorithm was used for supervised image classification. For each classification, a Random Forest with 80 trees was used, with the same parameterization applied across all years and sites. This algorithm was chosen for its ability to generate multiple decision trees that independently analyze and assign samples to their respective classes [31]. Subsequently, the classification quality was evaluated using overall accuracy, user accuracy, and producer accuracy, all derived from confusion matrices.

2.5. Subdivision of Study Areas

The three study sites were divided into high-density (HD) and low-density (LD) zones. This division is mainly based on an analysis of the global population density map proposed by [23], along with demographic data from the Haitian Institute of Statistics and Information Technology [11]. Since Haiti lacks an official threshold to distinguish between these two zones, a cutoff of 50,000 residents was selected. This cutoff is based on the work of [32], conducted in Mexico, a country with demographic traits similar to those of Haiti. This decision is also supported by the fact that Haiti is among the most urbanized countries in the region, after Trinidad and Tobago and Mexico [12]. Therefore, in this study, a communal section is classified as LD if its population is below 50,000 residents, and as HD if it is equal to or exceeds this threshold.

2.6. Highlighting the Dynamics of Change

The assessment of landscape dynamics was conducted at two spatial scales: the entire plain and sub-areas defined by human density, specifically high-density (HD) and low-density (LD) zones. At the overall scale of each plain, two landscape ecology indicators were calculated: the percentage of landscape (PLAND) and the largest patch index (LPI). PLAND measures the proportion of each land-use class, helping to identify dominant classes and analyze their changes over time. The LPI, on the other hand, is the ratio of the area of the largest patch of a specific class to the total landscape area [33]. Expressed as a percentage, it indicates spatial dominance and connectivity. High values near 100% suggest a low level of fragmentation, while low values indicate a fragmented, dispersed landscape [34]. These two indices were chosen for their complementary roles in analyzing landscape composition and spatial arrangement together [35]. Furthermore, to assess the significance of temporal dynamics, simple linear regressions were fitted with PLAND and LPI as response variables and year as the explanatory variable. This analysis estimates the temporal trend and tests its statistical significance, thereby quantifying the temporal effect on the dynamics of each land-cover class.
To gain a more detailed understanding of the dynamics within the sub-areas (HD and LD), random sampling was conducted in each. For the reference year 2024, ten observation plots were randomly selected per sub-area in each plain. Each plot was 500 m by 500 m. This strategy aimed to capture the diversity of ecological conditions and land-use types while ensuring sufficient representativeness for an objective assessment of landscape variability. As with the global scale, the PLAND and LPI indices were also calculated for each sampling plot. For 2024, data on the composition (PLAND) and spatial configuration (LPI) of the components of sub-areas across different agricultural plains were first logarithmically transformed to meet the normality requirements for the ANOVA test. Two statistical tests were then used to compare differences between high-density (HD) and low-density (LD) areas. When the distributions failed the normality assumption, the nonparametric Mann–Whitney test was used. However, when normality was observed in both groups, the Student’s t-test was preferred. A p-value < 0.05 was deemed statistically significant and interpreted as evidence of a difference between HD and LD areas.

3. Results

3.1. Validation of Supervised Classifications and Land Cover Mapping

The results show that, overall, users’ and producers’ accuracies exceed 80% (Table 2), indicating a strong ability to distinguish between land-use classes. A visual review of the land-use maps (Figure 2), which cover the three agricultural plains studied, reveals a spatial pattern characterized by the gradual expansion of built-up areas and bare soil, accompanied by a corresponding decrease in cultivated agricultural land.

3.2. Landscape Configuration and Composition at the Landscape Scale

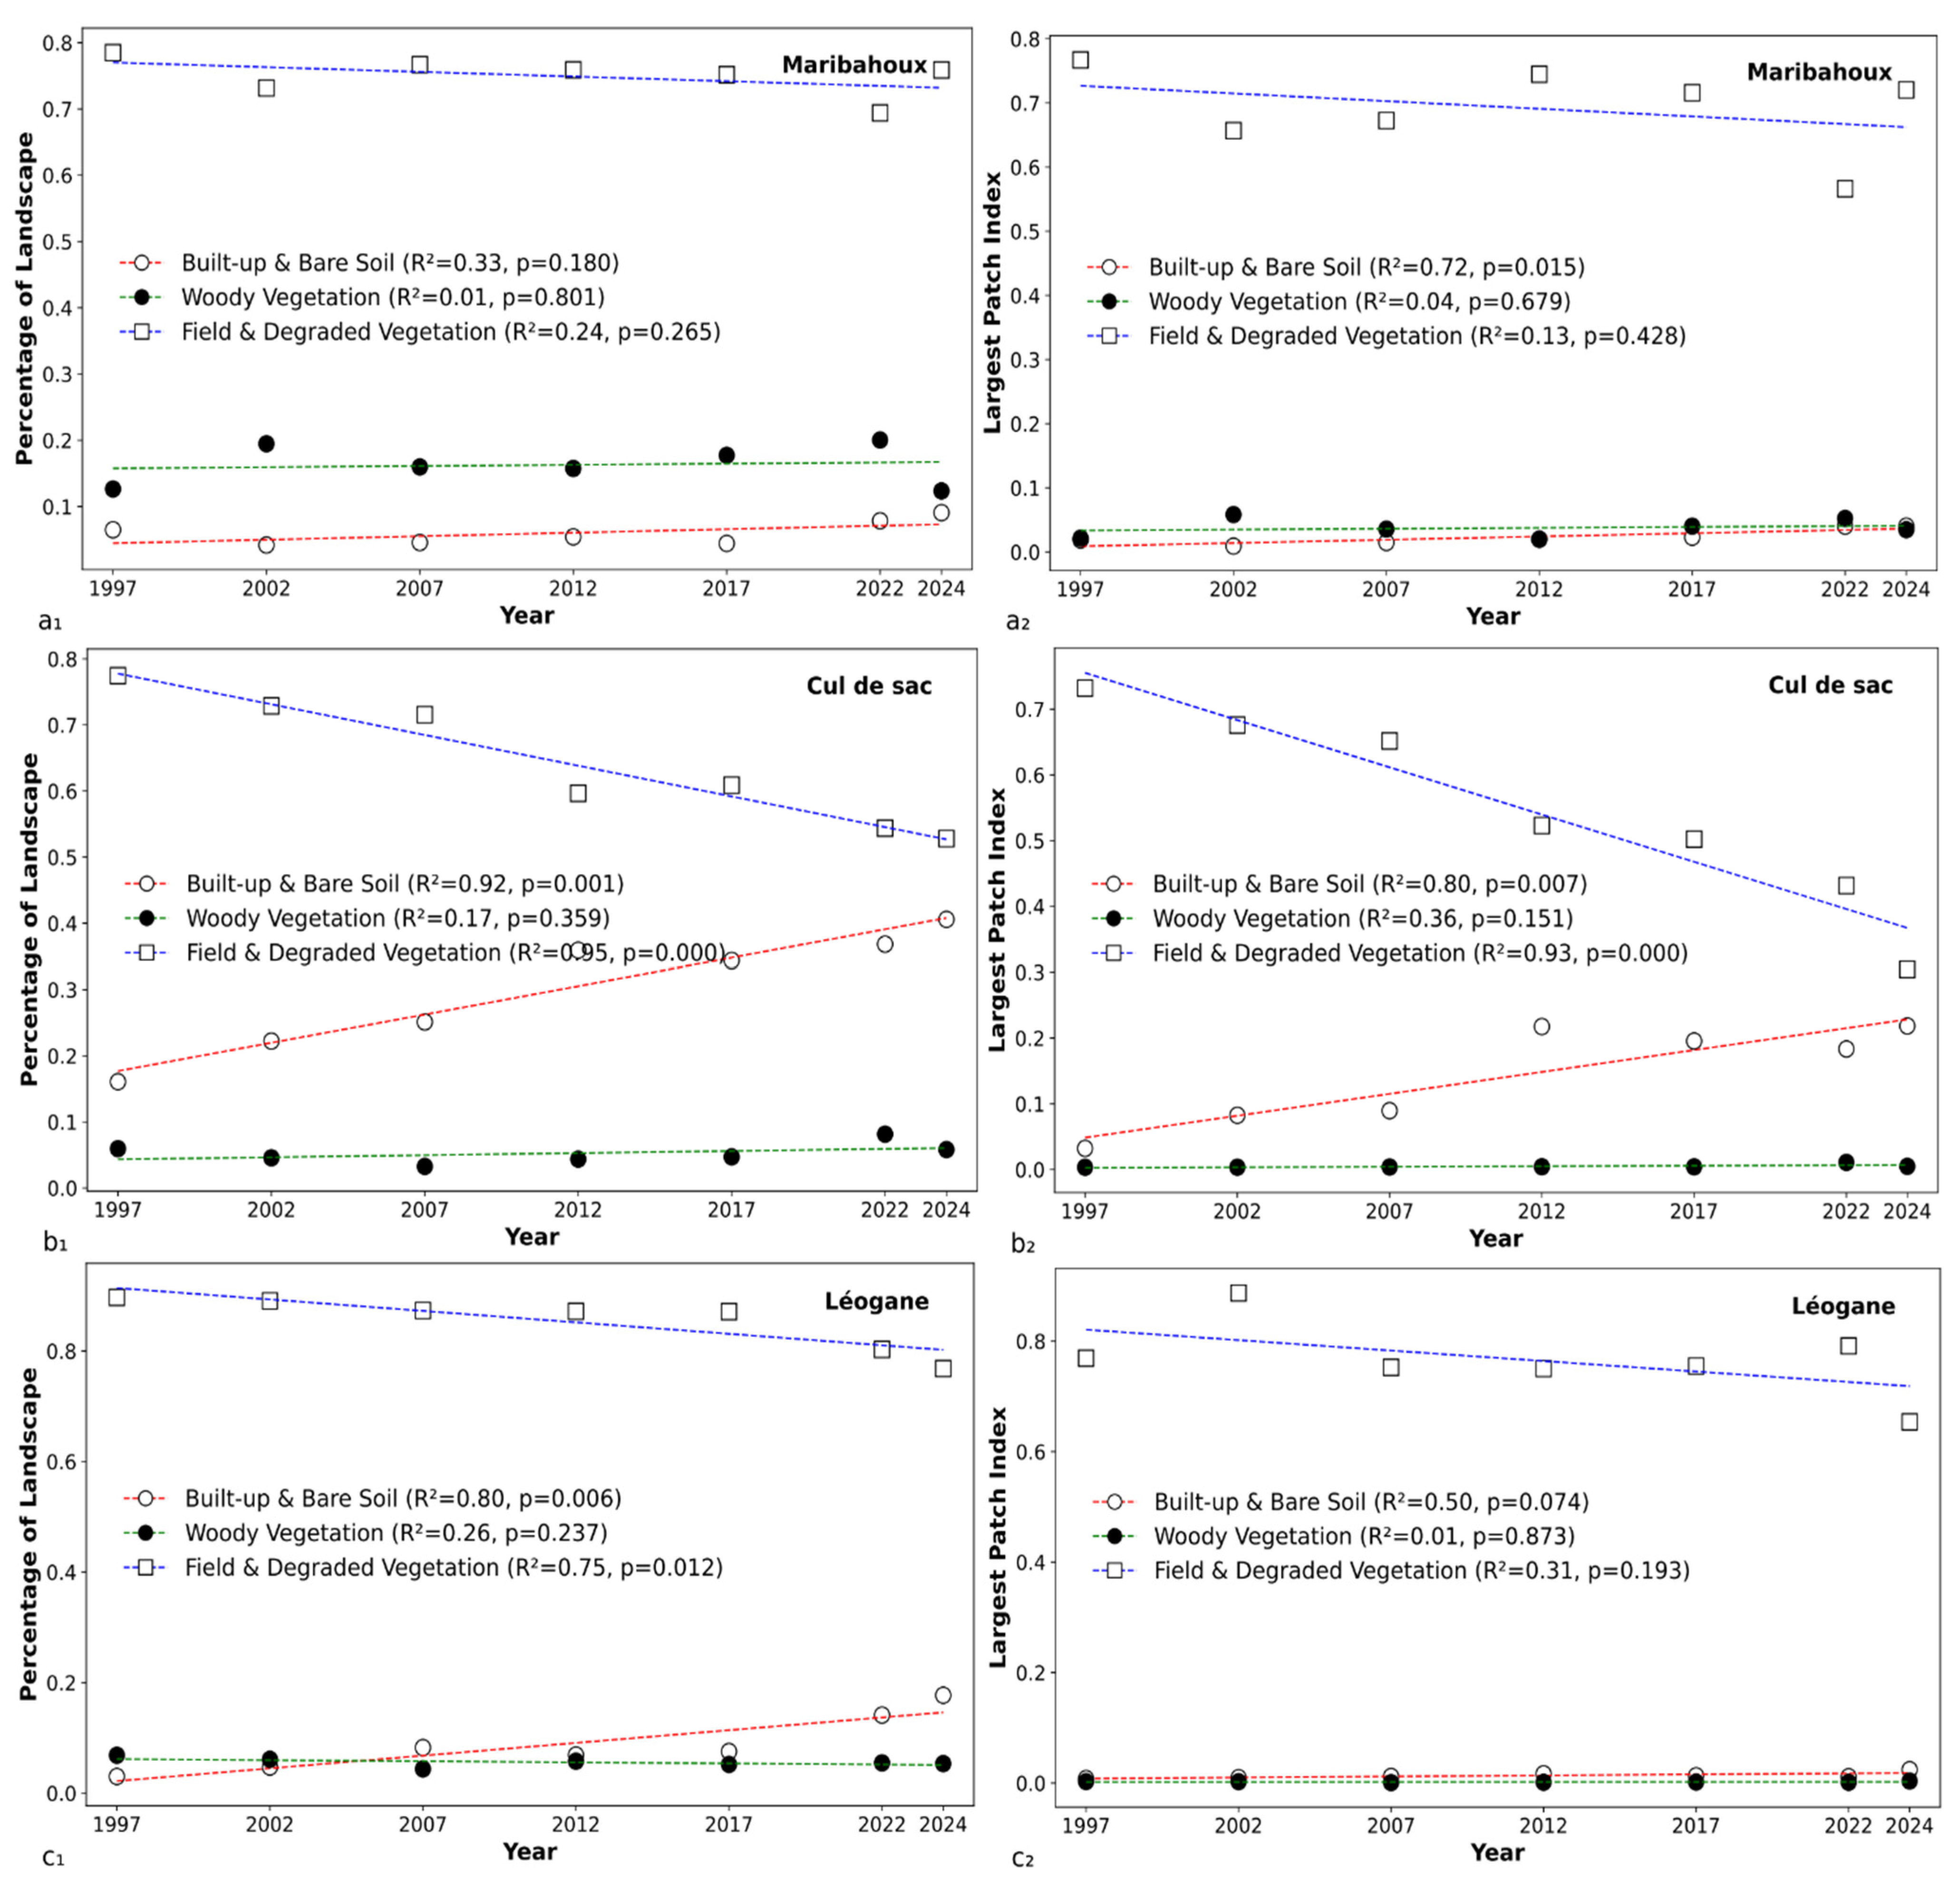
At the landscape level, between 1997 and 2024, landscape dynamics varied considerably across the three studied agricultural plains (Figure 3). On the Maribahoux plain, fields and degraded vegetation were dominant in 1997, representing 78.50% of the landscape. By 2024, this proportion had decreased to 72.39%. This decline was accompanied by a slight reduction in the Largest Patch Index (LPI), from 97.72% to 95.13%, indicating a modest increase in fragmentation. Meanwhile, built-up areas and bare soil nearly doubled in extent, expanding from 8.34 km2 to 15.97 km2. Their LPI rose from 28.64% to 43.78%, reflecting greater spatial cohesion. Woody vegetation increased steadily until 2022, reaching a peak of 20.04%, before declining to 12.63% in 2024. Interestingly, its LPI rose from 17.07% to 31.78%, suggesting a temporary expansion and improved connectivity. However, these dynamics are statistically significant only for the increase in the LPI of built-up and bare soil (R2 = 0.72; p = 0.015).
On the Cul-de-Sac plain, fields and degraded vegetation initially covered 77.46% of the landscape in 1997 but declined sharply to 52.80% by 2024. This decrease was particularly pronounced between 2007 and 2012 and was accompanied by substantial fragmentation, as indicated by a decline in the LPI from 94.51% to 57.63%. In contrast, built-up areas and bare soil expanded steadily, increasing from 41.26 km2 in 1997 to 104.11 km2 in 2024. Their LPI also rose sharply from 19.99% to 53.87%. Woody vegetation remained relatively stable in both extent and configuration, with its area slightly decreasing from 15.25 km2 to 14.88 km2. In this plain, the expansion of built-up areas and bare soil (R2 = 0.92; p = 0.001) and the regression of fields and degraded vegetation (R2 = 0.95; p = 0.000) are highly significant, confirming a marked transformation of the landscape.
On the Léogâne plain, fields and degraded vegetation continued to dominate the landscape, although their extent decreased from 89.69% in 1997 to 76.92% in 2024, representing a reduction of 15.22 km2. Despite this decline, their spatial configuration remained stable, with the LPI changing slightly, reflecting the persistence of a coherent agricultural core. In contrast, built-up areas and bare soil increased markedly from 3.57 km2 to 20.95 km2, accompanied by a notable rise in their LPI, indicating growing spatial continuity. Woody vegetation decreased modestly, from 8.11 km2 to 6.32 km2. Its LPI remained nearly stable (12.44% to 13.12%), suggesting the continued presence of scattered woody patches with no significant structural change. In this plain, only the expansion of built-up areas and bare soil is statistically significant over time (R2 = 0.80; p = 0.006).

3.3. Landscape Configuration and Composition Based on the Demographic Gradient

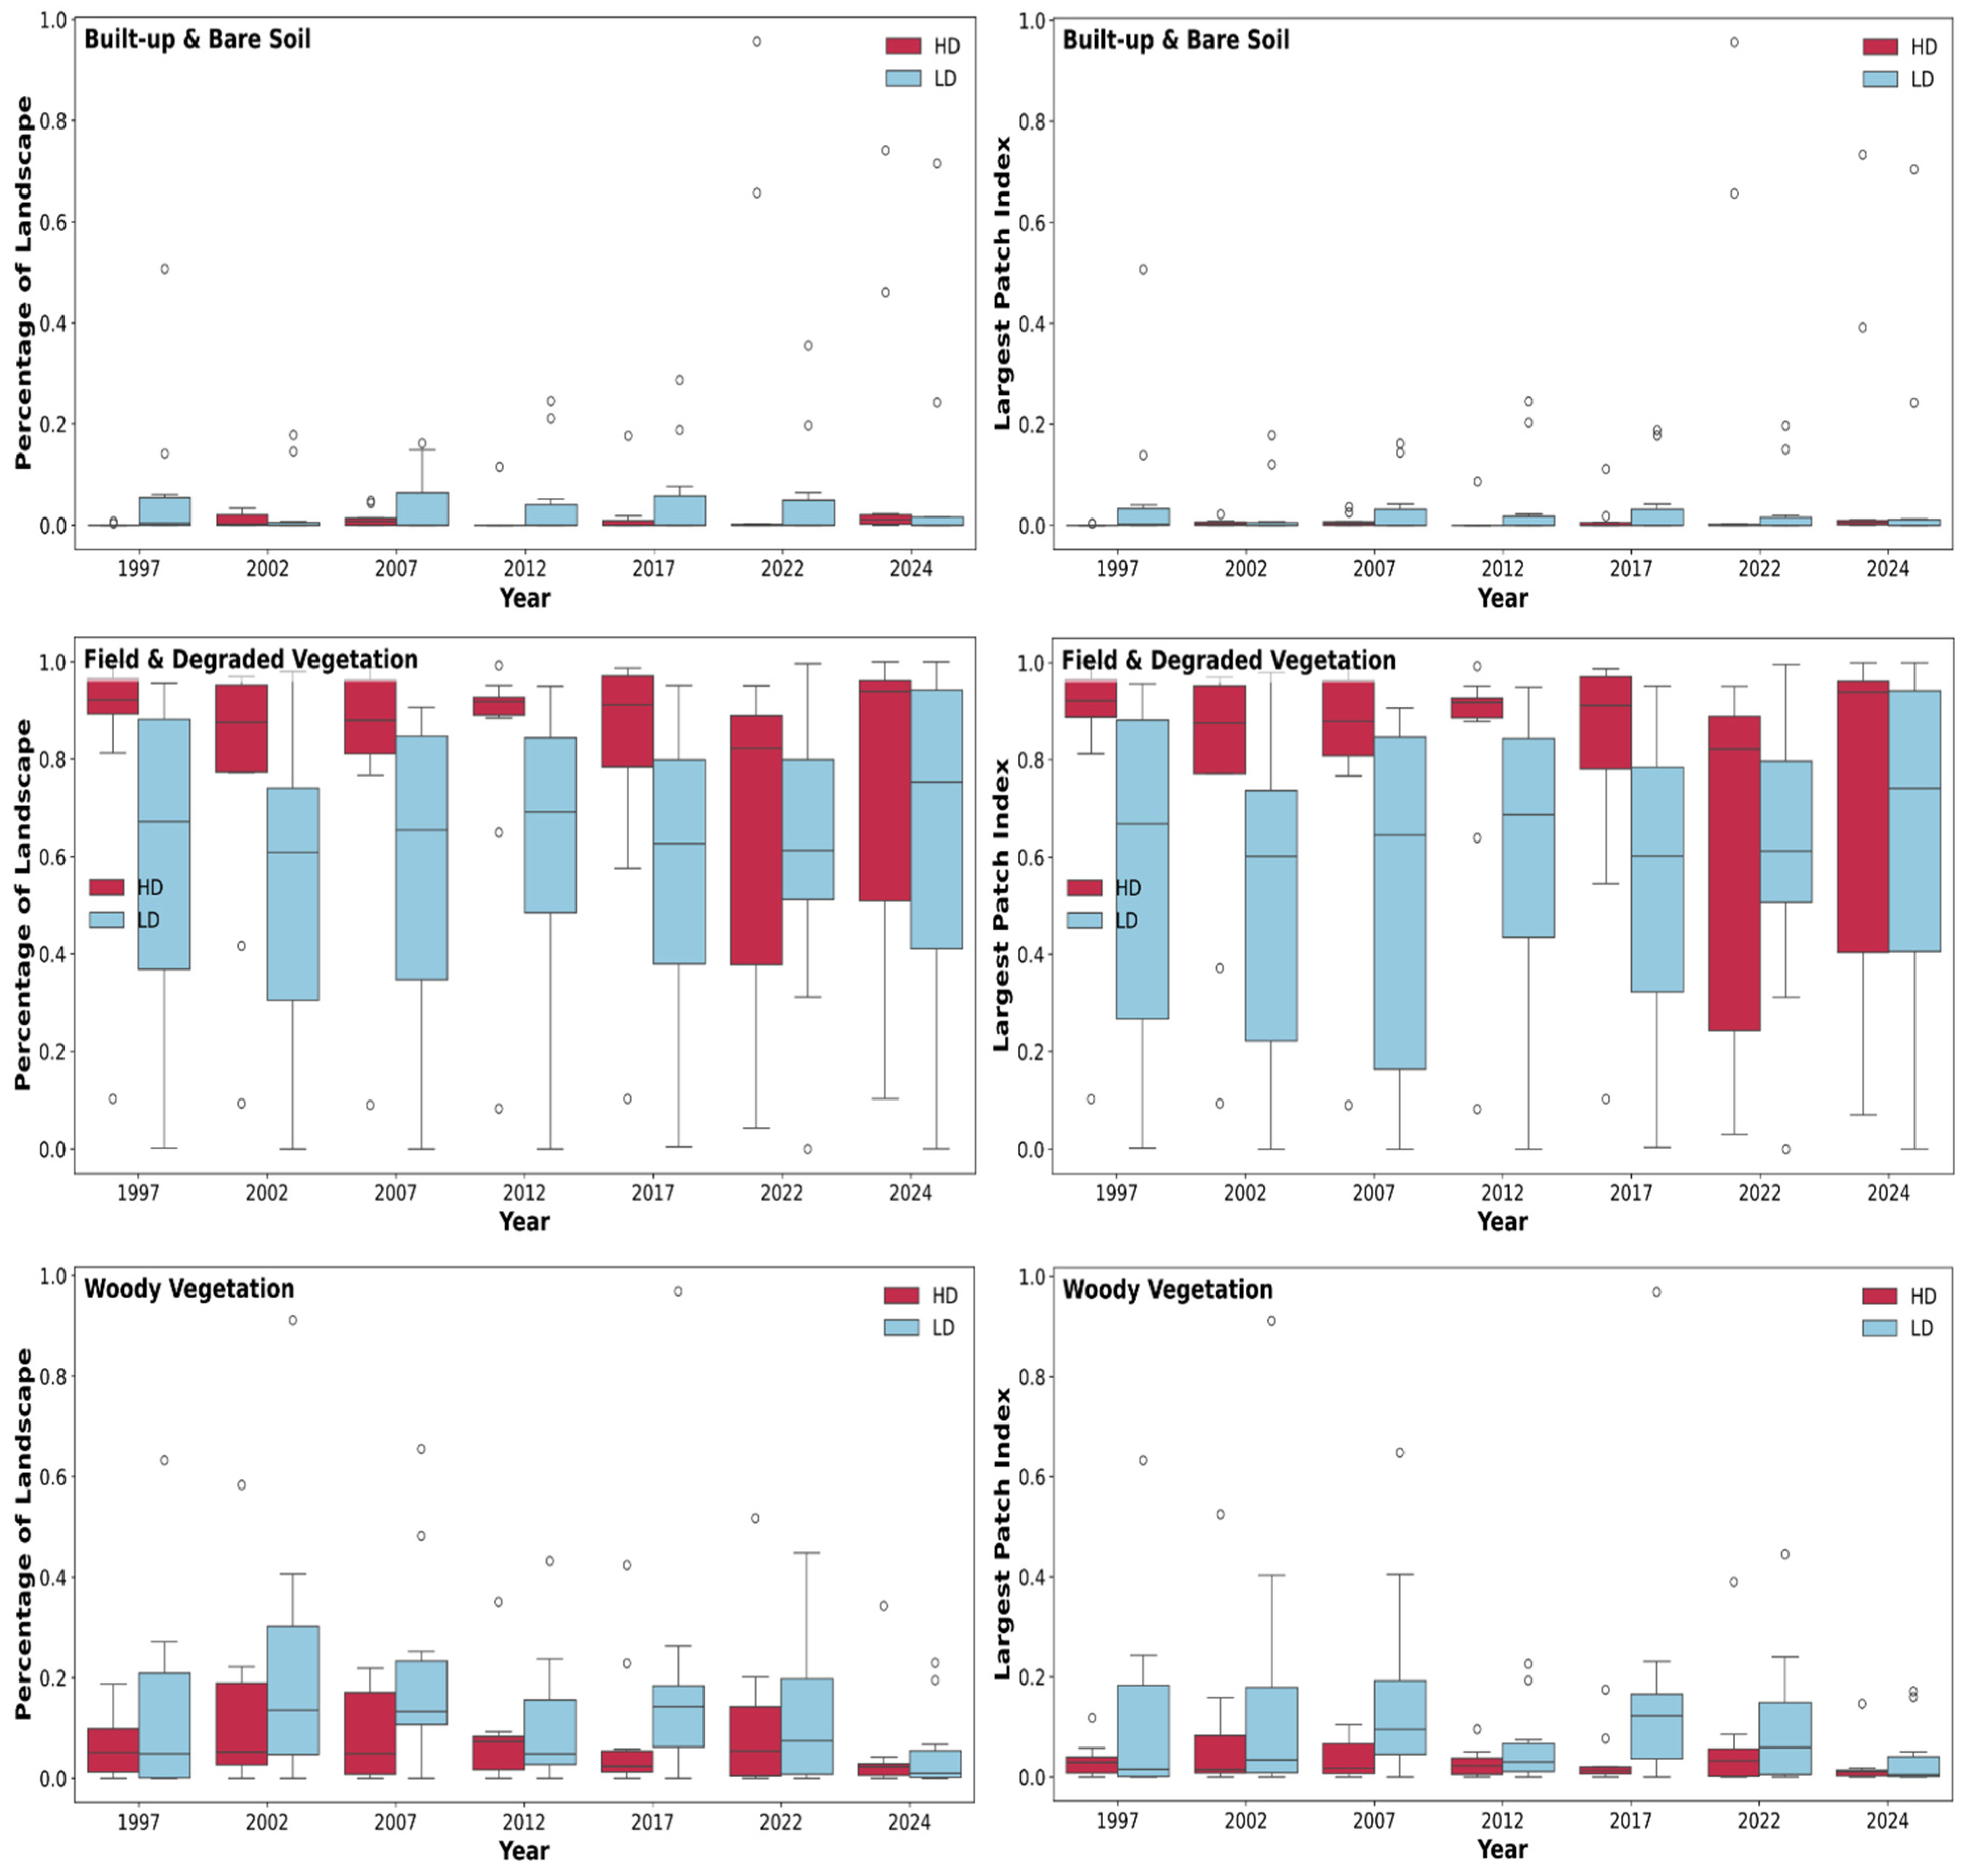
Statistical analysis of the PLAND and LPI indices (Figure 4) reveals contrasting spatio-temporal patterns in the Maribahoux plain from 1997 to 2024, depending on land cover class and population density. For the “built-up area and bare soil” class, both PLAND and LPI values consistently remain low across the entire plain, with a slight increase in LD areas beginning in 2007. However, median values never exceed 0.1, indicating very limited urbanization. Mann–Whitney U tests show no statistically significant differences between HD and LD areas (p > 0.05), although mean values are consistently higher in LD. Conversely, agricultural areas continue to dominate the landscape throughout the period, with PLAND and LPI values remaining close to 1 in both density zones until 2024. Despite a slight decline in connectivity in LD areas after 2012, no statistically significant difference is observed between HD and LD zones. More notable differences appear in the “fields and degraded vegetation” class. Statistical tests reveal significant differences between HD and LD zones in 1997 and 2017 for both PLAND and LPI (p < 0.05), indicating distinct patterns of fragmentation related to human density. Although woody vegetation accounts for only a small portion of the overall land cover, it has increased modestly since 2017, especially in LD zones. Statistically significant differences are observed in 2022 and 2024 for both PLAND and LPI (p < 0.05), reflecting a spatially distinct pattern of vegetation recolonization between the density zones.
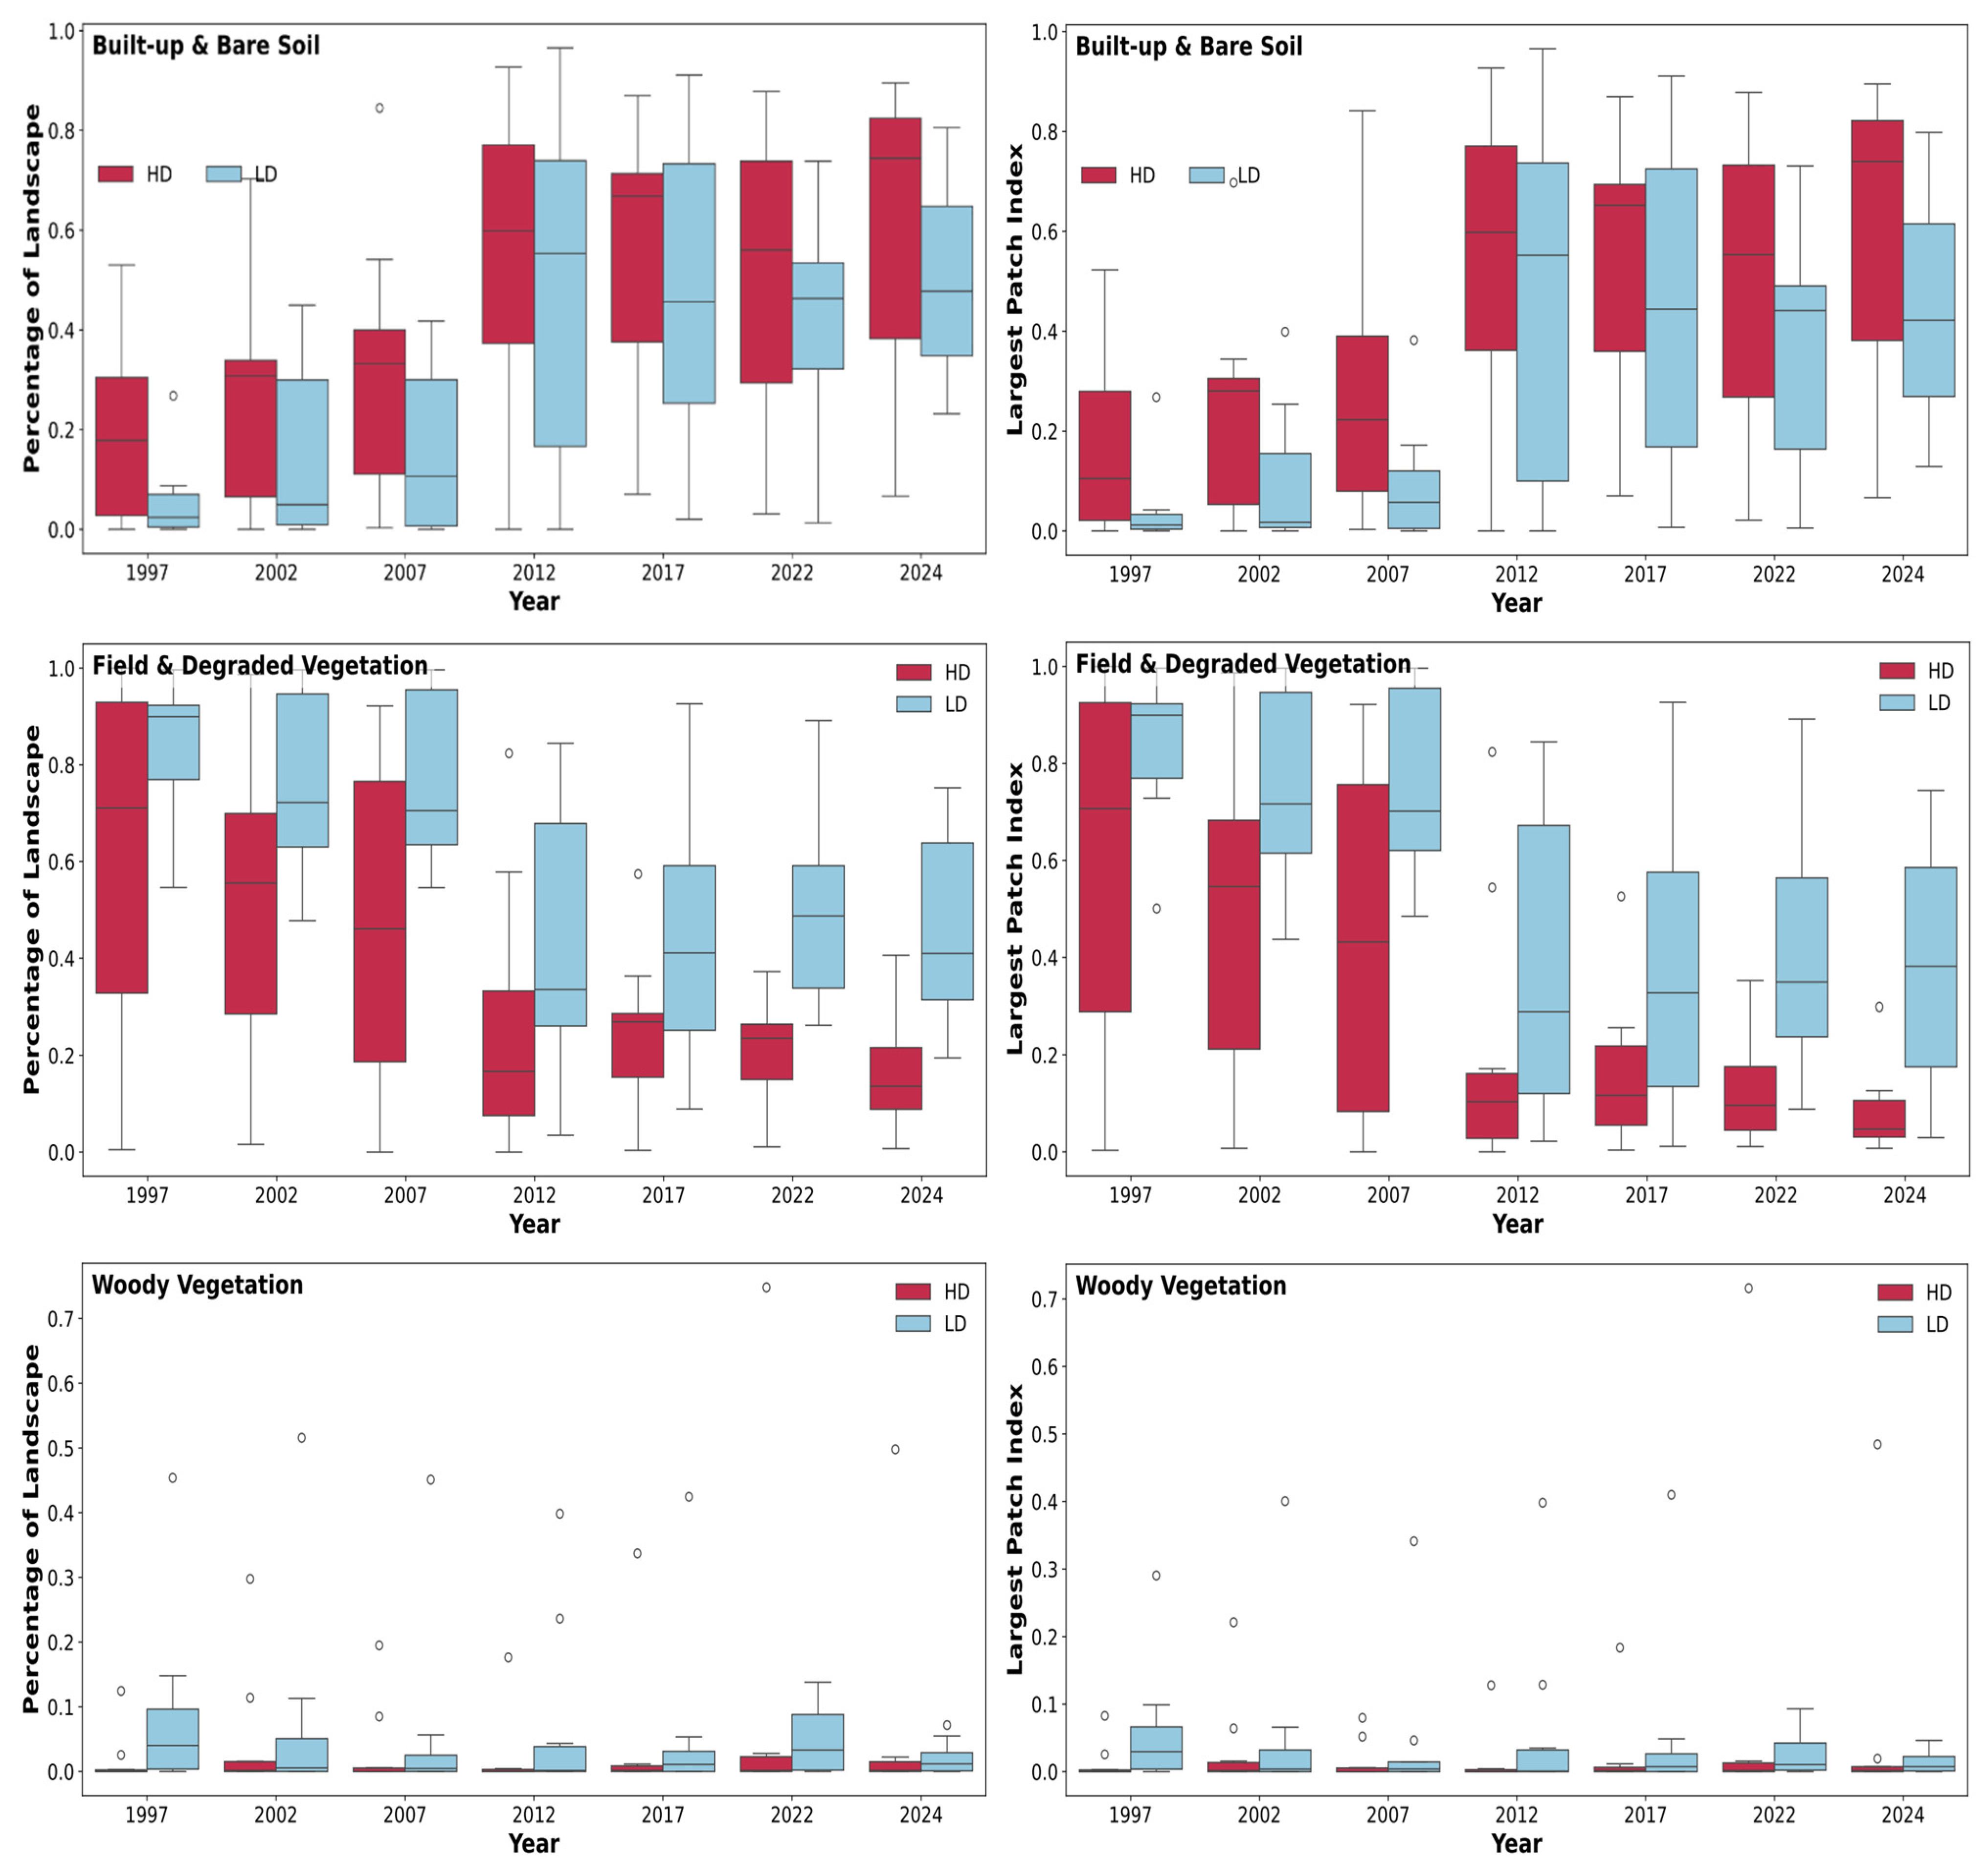
Statistical analysis of the PLAND and LPI indices (Figure 5) shows significant spatio-temporal changes in the Cul-de-Sac plain from 1997 to 2024, with variations based on land cover type and settlement density gradient. For the “built-up and bare soil” class, both PLAND and LPI increased sharply from 2012 onward, especially in high-density (HD) areas. This trend suggests accelerated urbanization and a growing concentration of built-up features. By 2024, median values reach their peak levels (PLAND_HD = 0.50; LPI_HD = 0.50). Although most statistical tests reveal no significant difference between HD and LD areas (p > 0.05), 2012 stands out as an exception, indicating a temporary phase of spatial divergence. In contrast, the “fields and degraded vegetation” class shows a gradual decline in both PLAND and LPI, with the most notable drops in HD zones after 2007. Statistical comparisons confirm significant differences between HD and LD areas from 2007 onward (p < 0.05), reflecting increased fragmentation and breaking of continuity in cultivated landscapes, especially in more populated zones. Woody vegetation remains minimal throughout the study period, with PLAND values consistently below 0.1 and LPI values near zero. No statistically significant differences are found between HD and LD zones, except in 1997 (p = 0.038), which may represent a short-term spatial anomaly early on.
In the Léogâne plain, the “built-up and bare soil” class has shown a rising trend in PLAND and LPI values since 2007, mainly in low-density (LD) areas. By 2024, median values reach about 0.3 for PLAND and 0.2 for LPI (Figure 6). In contrast, high-density (HD) areas display much lower and relatively steady values, indicating more limited and dispersed urbanization. Statistical tests (p > 0.05) confirm no significant differences between HD and LD zones, even though mean values have consistently been higher in LD areas since 2007. The “fields and degraded vegetation” class maintains high PLAND and LPI values throughout the study period in both density zones. Median values stay near 1 for PLAND and above 0.8 for LPI until 2017, then decline in 2022 and 2024. These results indicate a general preservation of agricultural land in the plain, with no statistically significant differences observed between HD and LD zones (p > 0.1), unlike the more notable changes in the Cul-de-Sac plain. Regarding woody vegetation, although PLAND and LPI values remain low overall (<0.1), an increasing trend has been observed since 2017, particularly in LD areas. Notably, in 2022 and 2024, significant differences were recorded between HD and LD zones for both indices (p < 0.05), indicating a process of vegetation recolonization.
Finally, the contrasting evolution of PLAND and LPI across the three plains reflects different levels of functional stability and adaptive capacity within agricultural systems. In the Maribahoux and Léogâne plains, the relative stability of PLAND and LPI values for agricultural classes until 2024 indicates a strong resistance capacity, that is, the ability of these landscapes to absorb urban and environmental pressures without losing their main structure and functions. Conversely, the marked decline of both indices in the Cul-de-Sac plain, particularly in high-density zones after 2012, illustrates a loss of spatial cohesion and ecological connectivity, which can be interpreted as a reduction in the resistance capacity of agricultural landscapes and an increased vulnerability to external pressures such as land conversion and soil degradation.
The slight recovery of woody vegetation and degraded fields observed after 2017, especially in low-density zones, represents a capacity for reorganization, showing that some areas are able to rebuild ecological functions through spontaneous vegetation regrowth or small-scale agroforestry practices.
Together, these results demonstrate that fragmentation not only modifies the spatial structure of agricultural landscapes but also weakens their resilience, first by reducing their ability to maintain key functions, and second by limiting their potential for adaptive reorganization in response to environmental and socio-economic disturbances.

4. Discussion

4.1. Methodological Approach

This study used Landsat imagery (30 m resolution), which remains one of the most appropriate datasets for long-term land-use and land-cover analysis owing to its systematic global coverage, radiometric consistency, and open access [36,37], while providing valuable insights into the spatio-temporal dynamics of land-use change [38]. However, Landsat’s moderate spatial resolution and susceptibility to cloud contamination constrain its ability to capture fine-scale urban features and stable time series [39]. Despite these limitations, Landsat remains one of the few consistent global archives suitable for multi-decadal analysis [40]. To address these known constraints, two measures were implemented. First, the number of land-cover classes was deliberately reduced to minimize spectral overlap between built-up areas, bare soil, and mixed vegetation, a common strategy to enhance classification robustness in heterogeneous landscapes [41]. Indeed, in urban areas, the spectral similarity between built-up surfaces and bare soil often leads to classification confusion. Since several studies have shown that distinguishing these classes with Landsat data is challenging, they were grouped into a single category to minimize errors [42]. Although restrictive, this approach is common in studies using medium-resolution imagery. In our case, the grouping still captures the overall trend of land artificialization at the expense of agricultural land. Second, cloud masking and temporal compositing were applied to generate radiometrically consistent, low-cloud mosaics for each time step [43].
Image processing and classification were performed on the Google Earth Engine (GEE) platform, a cloud environment designed for large-scale spatial data processing [44].
The Random Forest algorithm was used to perform supervised classification. This algorithm’s main advantage lies in its ability to generate multiple decision trees that independently analyze and classify the samples into their respective categories, thereby enhancing overall classification performance [45]. A refined temporal grid, with 2-to-5-year intervals, enabled close monitoring of spatial transformation processes. The reliability of the classification was confirmed by high user, producer, and overall accuracy values [46], further supported by field observations, which together attest to the robustness of the resulting maps.
The analysis of the spatial distribution of the three agricultural plains was based on two complementary indices: landscape composition (PLAND) and spatial configuration (LPI). These indicators, widely used to assess the impact of human activities on landscape structure [47], capture both the proportion of each land-use type and its spatial arrangement. It is important to note, however, that no single metric can fully capture landscape complexity [48]. Although additional landscape ecology metrics could have been applied, many are strongly correlated [49]. In light of our hypotheses, PLAND and LPI proved sufficient to highlight the observed changes and provide meaningful insights into the dynamics of these agricultural landscapes. From a landscape ecology perspective, the PLAND and LPI indices offer complementary insights into spatial transformation dynamics. An increase in PLAND for built-up areas, for example, indicates the growing dominance of anthropogenic land-uses, whereas a decrease in LPI for vegetation land reflects higher fragmentation and reduced ecological connectivity. Conversely, stable or increasing LPI values can suggest persistence or aggregation of certain land-cover types, interpreted as a form of resilience in agricultural systems. Together, these indicators capture both compositional and configurational dimensions of land-use change, highlighting the joint effects of urban expansion.
Beyond the empirical results, this study also introduces several methodological and conceptual innovations to the analysis of urbanization and agricultural land dynamics. First, it simultaneously examines three agricultural plains, Cul-de-Sac, Léogâne, and Maribahoux, that differ markedly in their socio-economic, cultural, and environmental contexts. This comparative multi-site design provides a more comprehensive understanding of the diverse trajectories of land-use change in Haiti, a topic rarely addressed in previous research focused on a single region. Second, unlike conventional studies that rely on concentric-zone or transect-based approaches to analyze urban expansion and land-use change, this research adopts a parcel-based analysis. This method provides finer spatial resolution for detecting fragmentation patterns and capturing local-scale processes that broader zoning methods often overlook. Third, the subdivision of each study area by population density provides an original framework for linking demographic pressure with spatial patterns of urban growth and agricultural land degradation. Collectively, these methodological choices strengthen the robustness of the analysis and enhance its relevance for understanding the complex interactions between urbanization and agricultural resilience in Haiti.
For future research, it would be essential to integrate a prospective dimension by combining this approach with spatio-temporal predictive models [50]. Such models could anticipate landscape evolution under various socio-economic and planning scenarios, thereby enhancing our ability to assess potential trajectories and inform sustainable land management strategies.

4.2. Urbanization: A Threat to the Preservation of Agricultural Land in Haiti’s Plains

Between 1997 and 2024, the Cul-de-Sac, Léogâne, and Maribahoux plains underwent significant land-use changes, primarily driven by unplanned urbanization. The decline in agricultural land in all three regions coincides with an equivalent expansion of built-up areas, reflecting the increasing artificialization of land driven by population growth, rural exodus, ineffective land-use planning, and land pressure from nearby urban centers. These patterns corroborate spatial dynamics previously documented in Cap-Haïtien and Port-au-Prince [7,19]. Similar global processes have been described by [51,52,53] who identified weak land governance, population pressure, and urban sprawl as key drivers of agricultural land conversion across developing regions.
The promotion of municipalities such as Tabarre, east of Port-au-Prince, is part of rapid urbanization moving toward the Cul-de-Sac Plain. However, this area, covering more than 15,000 hectares, has developed without a proper administrative status, which limits land regulation and management capacity [54]. These patterns align with global trends where urbanization increases at the urban–rural boundary, especially where infrastructure access and socioeconomic opportunities overlap [8]. The decrease in LPI indicates increasing fragmentation, which could disrupt ecological corridors vital to species movement and dispersal. In Port-au-Prince, for example, bird diversity declines as the proportion of built-up land around small green spaces grows [55], highlighting the need to preserve vegetated corridors in urban areas.
In the Cul-de-Sac plain, built-up growth accelerated after 2012 due to the earthquake, which triggered significant population displacement as people sought land to build homes. This pattern is especially clear in the high-density (HD) zone, where urban gaps were quickly filled, leading to the widespread conversion of farmland into unstable residential areas [56,57]. The low-density (LD) zone, although less developed, was also affected, showing that urban growth went beyond the typical boundaries of formal urbanization. This trend is consistent with multiscale analyses conducted in China, where built-up expansion rapidly consumes fertile agricultural land in response to housing and migration pressures [58]. Interestingly, a revival of woody vegetation was seen between 2017 and 2022, mainly in brownfields and old abandoned farms. This might indicate spontaneous regrowth by pioneer species and the expansion of small-scale agroforestry methods. Similar patterns have been seen in Bujumbura after socio-environmental disruptions [59].
In the Léogâne plain, urban dynamics follow a similar, though less intense, pattern. Acting as a buffer between Port-au-Prince and rural communes to the west, it has attracted post-earthquake migration and forms a front of diffuse urbanization. The loss of nearly 30% of land previously used for sugarcane [60] illustrates the pressure from informal urbanization on the land, further intensified by the lack of alternative housing for disaster victims. Spatial analysis shows stronger development in LD than in HD since 2007, again emphasizing the influence of proximity to the capital on land-use change. The woody cover fluctuates due to the coexistence of fallows, fruit-tree replanting, and the natural evolution of agroforestry systems, whose spectral signatures can partially overlap with those of natural vegetation. Consistent with metropolitan spillover theory, proximity to the capital channels unmet housing demand toward peripheral communes, where subdivision is easier and land parcels are significantly cheaper than in the saturated urban core [16]. This process, driven by land speculation, weak governance, and the lack of coherent spatial planning, closely mirrors the pressures observed in Haiti’s Léogâne plain, where proximity to the capital and demand for affordable housing foster diffuse urban expansion.
The Maribahoux plain is primarily shaped by industrial expansion. The establishment of the CODEVI park in Ouanaminthe in 2002 triggered a spatial reorganization marked by farmland expropriation and the growth of informal worker settlements [61]. Comparable dynamics have been observed in peri-urban Hanoi, where industrial corridors and informal housing have fragmented agricultural landscapes [62]. As a result, the area of built-up and bare land nearly doubled, reflecting Ouanaminthe’s strategic location on the Dominican border and its attraction for cross-border trade and migration. In Ouanaminthe, the lack of coherent planning and housing policy has facilitated unregulated land conversion. Industrial and commercial growth, coupled with private speculation and unmet housing demand, has pushed informal settlements onto former agricultural plots, leading to dispersed and fragmented land-use patterns. Although differences between HD and LD zones remain statistically insignificant, built-up areas dominate in HD zones while bare land prevails in LD zones, illustrating how the internal composition of a single land-use class can vary depending on the socio-demographic context, and why interpretation sometimes requires looking beyond broad categories. Such intra-class variability is a common challenge in medium-resolution imagery, where built-up and semi-vegetated surfaces often overlap spectrally [46].
Paradoxically, woody vegetation increased until 2022 before declining in 2024. This change is linked to the colonization of abandoned land by Prosopis juliflora, an invasive xerophilous species that thrives in highly degraded environments [63]. Multiple sources have documented the invasive nature of Prosopis juliflora, including its ability to outcompete and replace native plants even in protected areas of South Asia [64]. Overall, the Maribahoux case shows how industrial expansion, border trade, and weak governance interact to reshape agricultural frontiers.
Across the three plains, the trajectories of urban expansion and agricultural decline diverge markedly: intense and clustered in Cul-de-Sac, moderate and structured in Léogâne, and diffuse and weakly regulated in Maribahoux. These contrasts illustrate how local socio-economic and institutional contexts condition the pace and pattern of land transformation.

4.3. Implications for the Planning and Development of Agricultural Plains

The patterns seen in the Cul-de-Sac, Léogâne, and Maribahoux plains highlight a worrying trend of agricultural fragmentation caused by informal urbanization and uncontrolled socioeconomic forces. These transformations are closely linked to the institutional weaknesses of Haiti’s land governance system, characterized by overlapping tenure regimes, insufficient enforcement of planning laws, and fragmented responsibilities among central and local authorities. Despite the adoption of the National Land-Use Planning Framework (PNAT) and the 2006 decentralization decrees, implementation remains limited, particularly in rural and peri-urban communes where technical and financial capacities are low. The situation underscores the need for urgent review of land-use planning strategies in Haiti, particularly through the implementation of the National Land-Use Planning Framework (PNAT) under the coordination of the Ministry of Planning and External Cooperation (MPCE), in collaboration with municipal authorities and the National Center for Geospatial Information (CNIGS). At the local scale, land-use strategies should be operationalized through participatory micro-zoning led by communes, supported by university research centers and farmers’ associations, to adapt planning measures to local realities.
The sharp decline in cultivated land, especially in Cul-de-Sac, underscores the lack of effective systems for protecting farmland, aligning with analyses of increasing urbanization pressures on farmland in developing countries and the weakness of regulatory frameworks [65]. The lack of protected agricultural zones or legally binding land-use plans promotes opportunistic land grabbing, often without government oversight or regard for existing land-uses, a situation also highlighted in land-governance guidance [66]. These land-tenure challenges are compounded by the predominance of informal transactions and the absence of a reliable cadastral system, which make it difficult to monitor land conversions or enforce agricultural protection measures. In this context, functional territorial zoning that includes protected agricultural areas is essntial to ensure food security and the sustainability of local production systems [67]. These protected areas could be established under the leadership of the Ministry of Agriculture, Natural Resources and Rural Development (MARNDR), in coordination with the Ministry of Environment (MDE) and local municipalities and integrated into the PNAT. Their delineation could rely on participatory mapping processes that combine geospatial data with customary land-use information, ensuring that zoning decisions reflect both ecological priorities and community needs. Such zoning would help prevent farmland artificialization and manage competition between urban and rural land-uses. Its effectiveness, however, depends on proper enforcement of planning and land-use laws by competent authorities, along with prioritized micro-zoning in high-pressure areas supported by a digitized (rural) cadastre, transaction traceability, and local conflict-resolution mechanisms to secure land rights and limit opportunistic land conversions.
The expansion of built-up areas in agricultural settings, often at the margins of planning, reflects a chronic deficit in urban-policy implementation [68]. In Haiti, urbanization is mainly unplanned and informal; nevertheless, planned sectors exist in some cities (business parks, authorized subdivisions). This duality has practical implications: authorized operations can be handled with conventional tools (densification near networks, permit conditions, easements, possible compensation, and agricultural reserves), whereas unplanned extensions call for stepwise responses (progressive land securitization, a minimal access-road grid, and basic services) to contain sprawl onto cultivated land. Accordingly, integrated urban planning tailored to institutional capacities should prioritize inter-municipal coordination, the densification of existing urban centers, and participatory micro-zoning in the most vulnerable areas. The challenge is not to control everything at once, but to target interventions where land pressure is most significant and agricultural losses most rapid.
The partial recolonization of some agricultural areas by woody vegetation, as seen in Maribahoux and certain fallows in Cul-de-Sac, provides opportunities for repurposing abandoned land. These processes can be directed toward agroforestry systems that integrate food crops, fruit trees, and ecologically valuable woody species. Specific initiatives in the southern part of the country demonstrate the effectiveness of this approach [69]. However, agroforestry is not a universal solution; its adoption depends on socio-economic factors such as access to seed and seedlings, land tenure, labor costs, and short-term profitability. Implementation is more practical where seed centers ensure a consistent supply in coordination with university nurseries and farmers’ associations. In farming plains, priority can be given to low-cost productive strips like fruit and fodder hedgerows, tree rows along plot boundaries and canals, with minimal land security for participating plots and technical support through demonstration plots and adapted guidelines. Simultaneously, maintaining vegetated corridors like riparian forests and hedges helps reduce habitat fragmentation and preserve ecological functions that support agricultural systems.
The development of the CODEVI industrial park in Ouanaminthe has also led to rapid peripheral urbanization, often occurring without coherent territorial planning. This highlights the collateral effects of poorly regulated industrial growth: land pressure, pollution, and fragmentation of rural landscapes. To prevent these externalities, future industrial projects should be integrated into proactive land-use planning, including buffer zones, agricultural reserves, and collective infrastructure such as housing, transportation, and services. Integrated planning is crucial for balancing industrial needs with the preservation of agricultural resources, maintaining ecosystem health, and conditioning approvals on credible compensatory measures.
Finally, restructuring peri-urban landscapes requires active involvement from local stakeholders. Land governance is still hindered by poor coordination among the central government, local authorities, and land-users, which undermines effective and fair management [70]. To fix this, participatory planning mechanisms that include farmers, urban planners, engineers, and residents such as those established by the February 2006 decentralization decrees (communal and communal-section development councils) should be revived and supported [71]. Practically, small technical units that bring together local authorities, universities, and producer organizations can manage micro-zoning, seed and plant supply, and dispute resolution. Stricter municipal planning controls can also help secure rights-of-way and land-use changes. Overall, these measures aim to coordinate land protection, urban-growth management, and support productive practices to help stabilize agricultural plains over the long term.

5. Conclusions

This study examined land-use and land-cover change over 27 years (1997–2024) in the agricultural plains of Cul-de-Sac, Léogâne, and Maribahoux in Haiti, using remote sensing, geographic information systems (GIS), and landscape ecology tools. The results reveal a decline in agricultural areas and degraded vegetation, especially in the Cul-de-Sac plain, where rapid, unplanned, and spatially clustered urbanization has fragmented agricultural landscapes. This trend is driven by continuous population growth, internal migration, and the rise in economic centers. In Maribahoux, artificialization is more moderate and is locally accompanied by vegetation recolonization related to land abandonment. Conversely, Léogâne experienced a 17.38 km2 increase in built-up and bare-soil areas during the period, along with a gradual decrease in woody cover.
Overall, the findings show a clear trend of declining ecological connectivity and decreasing functionality of agricultural landscapes. Given this trend, there is an urgent need to develop and implement more ambitious public policies in land-use planning, land regulation, and farmland preservation. This includes establishing effective zoning mechanisms, promoting sustainable and resilient agriculture, and advancing inclusive territorial governance based on the participation of local actors. These strategies are crucial to curb uncontrolled urban sprawl and enhance the sustainability of socio-ecological systems in the study regions. Due to the prevalence of informality and uneven enforcement capacity, many traditional planning tools seem unsuitable in the short term; therefore, the approaches discussed should be considered as tentative and conditional.

Author Contributions

Conceptualization: R.J., Y.U.S., K.R.S., J.M.T. and J.B.; Methodology: R.J., J.B.B., W.S. and J.B.; Software: R.J. and H.K.M.; Validation: J.M.T. and J.B.; Formal Analysis: R.J., and J.B.B.; Investigation: R.J.; Resources: J.B.; Data Curation: R.J.; Writing—Original Draft: R.J. and W.S.; Writing—Review and Editing: R.J., J.B.B., W.S., Y.U.S., H.K.M., H.K., L.M.P., M.M.M., K.R.S., W.O., B.J.-F., J.M.T. and J.B.; Visualization: R.J. and J.B.B.; Supervision: J.M.T. and J.B.; Project Administration: J.B.; Funding Acquisition: J.B. All authors have read and agreed to the published version of the manuscript.

Funding

This work was supported by the Academy of Research and Higher Education (ARES) and the University Agency for Francophonie (AUF, Anténor Firmin Scholarship).

Data Availability Statement

Landsat imagery used in this study was accessed through the Google Earth Engine (GEE) platform https://earthengine.google.com/ accessed between December 2024 and February 2025. Processed datasets generated during the analysis are not publicly available but can be obtained from the corresponding author upon reasonable request.

Acknowledgments

The authors are grateful to the Academy of Research and Higher Education (ARES) and the University Agency for Francophonie (AUF) for their financial support of this research.

Conflicts of Interest

The authors declare no conflicts of interest.

References

  1. World Bank. Agriculture for Development. In World Development Report; World Bank: Washington, DC, USA, 2008. [Google Scholar]
  2. Food and Agriculture Organization of the United Nations (FAO). Building a Common Vision for Sustainable Food and Agriculture: Principles and Approaches; Food and Agriculture Organization of the United Nations (FAO): Rome, Italy, 2014. [Google Scholar]
  3. Food and Agriculture Organization of the United Nations (FAO). Employment Indicators 2000–2022. October 2024 Update; FAOSTAT Analytical Brief, No. 92; FAO: Rome, Italy, 2024; pp. 2–6. [Google Scholar]
  4. World Bank. Agriculture, Forestry, and Fishing, Value Added (% of GDP)|Data. Available online: https://data.worldbank.org/indicator/NV.AGR.TOTL.ZS (accessed on 31 May 2025).
  5. United Nations Department of Economic and Social Affairs Population Division. World Population Prospects 2024: Summary of Results (UN DESA/POP/2024/TR/NO. 9); United Nations Department of Economic and Social Affairs Population Division: New York, NY, USA, 2024. [Google Scholar]
  6. Augusseau, X.; Bourgoin, J.; David, D.; Degenne, P.; Lagabrielle, E.; Lestrelin, G.; Lo Seen, D. Spatial–Temporal Models and Simulations as “Boundary Objects”: The Case of Urban Sprawl on Réunion Island. Chapter 9. In Éditions Quæ; OpenEdition: Marseille, France, 2018; ISBN 9782759230297. [Google Scholar]
  7. Salomon, W.; Sikuzani, Y.U.; Kouakou, A.T.M.; Kaleba, S.C.; Barthelemy, J.P.; Bogaert, J. Characterization of Land-Use Dynamics in the Urban and Peri-Urban Areas of Cap-Haïtien (Haiti) from 1986 to 2017. Tropicultura 2020, 38, 1–17. [Google Scholar] [CrossRef]
  8. D’Amour, C.B.; Reitsma, F.; Baiocchi, G.; Barthel, S.; Güneralp, B.; Erb, K.H.; Haberl, H.; Creutzig, F.; Seto, K.C. Future urban land expansion and implications for global croplands. Proc. Natl. Acad. Sci. USA 2016, 114, 8939–8944. [Google Scholar] [CrossRef]
  9. United Nations. World Urbanization Prospects: The 2014 Revision, (ST/ESA/SER.A/366); United Nations: New York, NY, USA, 2015. [Google Scholar]
  10. Mohamed Soilihi, T.; Gremillet, D.; Karam, A. Land-Use Conflicts and Land-Use Planning in the French Overseas Territories. Information Report N° 616 (2016–2017); Le Sénat: Paris, France, 2017. [Google Scholar]
  11. Institut Haïtien de Statistique et d’Informatique. IHSI Total Population, Population Aged 18 and over, Households and Densities Estimated in 2015; Institut Haïtien de Statistique et d’Informatique (IHSI): Port-au-Prince, Haiti, 2015. [Google Scholar]
  12. Lozano-Gracia, N.; Lozano, M.G. Haitian Cities: Actions for Today with an Eye on Tomorrow; The World Bank: Washington, DC, USA, 2017. [Google Scholar]
  13. Ministère de l’Agriculture, des Ressources Naturelles et du Développent Rural. Haiti National Agricultural Investment Plan. Available online: https://faolex.fao.org/docs/pdf/hai146377.pdf (accessed on 30 May 2025).
  14. Bogaert, J.; Halleux, J.-M. Peri-Urban territories. In Development, Challenges and Perspectives in the Global Sout; Presses Agronomiques de Gembloux: Gembloux, Belgium, 2015. [Google Scholar]
  15. Seto, K.C.; Fragkias, M.; Güneralp, B.; Reilly, M.K. A Meta-analysis of global urban land expansion. PLoS ONE 2011, 6, e23777. [Google Scholar] [CrossRef]
  16. Angel, S. Urban Expansion: Theory, evidence and practice. Build. Cities 2023, 4, 124–138. [Google Scholar] [CrossRef]
  17. Yu, D.; Wang, D.; Li, W.; Liu, S.; Zhu, Y.; Wu, W.; Zhou, Y. Decreased landscape ecological security of peri-urban cultivated land following rapid urbanization: An impediment to sustainable agriculture. Sustainability 2018, 10, 394. [Google Scholar] [CrossRef]
  18. Chen, Y.; Wen, Q.; Zhang, H. The impact of the fragmentation of the cultivated land on “non-Grain” Usage. Arch. Agron. Soil. Sci. 2025, 71, 1–22. [Google Scholar] [CrossRef]
  19. Salomon, W.; Sikuzani, Y.U.; Sambieni, K.R.; Kouakou, A.T.M.; Barima, Y.S.S.; Théodat, J.M.; Bogaert, J. Land cover dynamics along the urban–rural gradient of the Port-au-Prince agglomeration (Republic of Haiti) from 1986 to 2021. Land 2022, 11, 355. [Google Scholar] [CrossRef]
  20. United States International Development Agency; United States Department of Agriculture; Natural Resources Conservation Service; Haiti Ministry of Agriculture. Soil Survey of Cul de Sac, Haiti; Natural Resources Conservation Service: Washington, DC, USA, 2014.
  21. Ministère de L’agriculture des Ressources Naturelles et du Développement Rural(MARNDR). Diagnosis of Production Systems for Reviving Agricultural Extension in the Project Communes of RESEPAG II and PTTA: Borgne, Bahon, Saint-Raphaël, Grison-Garde (Nord), Ferrier (Bas Maribahoux), Ouanaminthe (Haut Maribahoux), Mont-Organisé and Carice; Ministère de L’agriculture des Ressources Naturelles et du Développement Rural (MARNDR): Port-au-Prince, Haïti, 2015. [Google Scholar]
  22. Guerrier, N. Study of Population Vulnerability in the Léogâne plain (Haiti) to Flood Risk. Master’s Thesis, Arlon Campus Environnement, Gembloux Agro-Bio Tech, University of Liège, Liège, Belgium, 2015. [Google Scholar]
  23. WorldPop (www.worldpop.org–School of Geography and Environmental Science, University of Southampton; Department of Geography and Geosciences, University of Louisville; Department of Geography, University of Namur) and Center for International Earth Science Information Network (CIESIN), Columbia University (2018). Global High-Resolution Population Denominators Project–Funded by the Bill and Melinda Gates Foundation (OPP1134076). Available online: https://hub.worldpop.org/geodata/summary?id=46640 (accessed on 20 January 2025).
  24. Noi Phan, T.; Kuch, V.; Lehnert, L.W. Land cover classification using Google Earth Engine and Random Forest classifier-the role of image composition. Remote Sens. 2020, 12, 2411. [Google Scholar] [CrossRef]
  25. Sayler, K.; Zanter, K. Landsat 4–7 Level 2 Science Product (L2SP) Guide; Version 4.0; U.S. Geological Survey (USGS): Reston, VA, USA, 2021.
  26. Padró, J.C.; Pons, X.; Aragonés, D.; Díaz-Delgado, R.; García, D.; Bustamante, J.; Pesquer, L.; Domingo-Marimon, C.; González-Guerrero, Ò.; Cristóbal, J.; et al. Radiometric correction of simultaneously acquired Landsat-7/Landsat-8 and Sentinel-2A imagery using pseudoinvariant areas (PIA): Contributing to the Landsat time series legacy. Remote Sens. 2017, 9, 1319. [Google Scholar] [CrossRef]
  27. Biaou, S.; Houeto, F.; Gouwakinnou, G.; Sorotori, S.; Biaou, H.; Awessou, B.; Tovihessi, S.; Tete, R. Spatio-temporal dynamics of land-use in the Ouénou-Bénou classified forest, Northern Benin. In Proceedings of the Conférence OSFACO: Satellite Images for Sustainable Land Management in Africa, Cotonou, Bénin, 19 July 2019. [Google Scholar]
  28. Imam, E. Remote Sensing and GIS Module: Colour Composite Images and Visual Image Interpretation; University Grand Commission (UGC), MHRD, Govt of India: New Delhi, India, 2019. [Google Scholar]
  29. Balandi, J.B.; To Hulu, J.P.P.M.; Sambieni, K.R.; Sikuzani, Y.U.; Bastin, J.F.; Musavandalo, C.M.; Nguba, T.B.; Molo, J.E.L.; Selemani, T.M.; Mweru, J.P.M.; et al. Urban Sprawl and Changes in Landscape Patterns: The Case of Kisangani City and Its Periphery (DR Congo). Land 2023, 12, 2066. [Google Scholar] [CrossRef]
  30. Imorou, I.T.; Arouna, O.; Zakari, S.; Djaouga, M.; Thomas, O.; Kinmadon, G. Des Images Satellites Pour La Gestion Durable Des Territoires En Afrique. In Proceedings of the la Conférence OSFACO, Cotonou, Bénin, 13–15 March 2019; pp. 1–25. [Google Scholar]
  31. Del Río, S.; López, V.; Benítez, J.M.; Herrera, F. On the Use of MapReduce for Imbalanced Big Data Using Random Forest. Inf. Sci. 2014, 285, 112–137. [Google Scholar] [CrossRef]
  32. Gaudin, Y.; Padilla Pérez, R.; Soloaga, I. New Methods to Define and Measure Rurality in Latin America and Their Impact on Public Policies: The Cases of Mexico and Panama; International Fund for Agricultural Development: Rome, Italy, 2024. [Google Scholar]
  33. McGarigal, K.; Cushman, S.A. Comparative Evaluation of Experimental Approaches to the Study of Habitat Fragmentation Effects. Ecol. Appl. 2002, 12, 335–345. [Google Scholar] [CrossRef]
  34. Bogaert, J.; Zhou, L.; Tucker, C.J.; Myneni, R.B.; Ceulemans, R. Evidence for a Persistent and Extensive Greening Trend in Eurasia Inferred from Satellite Vegetation Index Data. J. Geophys. Res. Atmos. 2002, 107, ACL 4-1. [Google Scholar] [CrossRef]
  35. Balandi, J.B.; To Hulu, J.P.P.M.; Sambieni, K.R.; Sikuzani, Y.U.; Bastin, J.F.; Musavandalo, C.M.; Nguba, T.B.; Jesuka, R.; Sodalo, C.; Pika, L.M.; et al. Anthropogenic effects on green infrastructure spatial patterns in Kisangani city and its urban–rural gradient. Land 2024, 13, 1794. [Google Scholar] [CrossRef]
  36. Useni Sikuzani, Y.; Cabala Kaleba, S.; Halleux, J.-M.; Bogaert, J.; Munyemba Kankumbi, F. Characterization of urban spatial growth in Lubumbashi city (Haut-Katanga, DR Congo) between 1989 and 2014. Agri-Overseas 2018, 36, 99–108. [Google Scholar]
  37. Muteya, H.K.; Nghonda, D.D.N.; Malaisse, F.; Waselin, S.; Sambiéni, K.R.; Kaleba, S.C.; Kankumbi, F.M.; Bastin, J.F.; Bogaert, J.; Sikuzani, Y.U. Quantification and Simulation of Landscape Anthropization around the Mining Agglomerations of Southeastern Katanga (DR Congo) between 1979 and 2090. Land 2022, 11, 850. [Google Scholar] [CrossRef]
  38. Potapov, P.V.; Turubanova, S.A.; Hansen, M.C.; Adusei, B.; Broich, M.; Altstatt, A.; Mane, L.; Justice, C.O. Quantifying Forest Cover Loss in Democratic Republic of the Congo, 2000–2010, with Landsat ETM+ Data. Remote Sens. Environ. 2012, 122, 106–116. [Google Scholar] [CrossRef]
  39. Lu, D.; Weng, Q. A Survey of Image Classification Methods and Techniques for Improving Classification Performance. Int. J. Remote Sens. 2007, 28, 823–870. [Google Scholar] [CrossRef]
  40. Wulder, M.A.; Loveland, T.R.; Roy, D.P.; Crawford, C.J.; Masek, J.G.; Woodcock, C.E.; Allen, R.G.; Anderson, M.C.; Belward, A.S.; Cohen, W.B.; et al. Current Status of Landsat Program, Science, and Applications. Remote Sens. Environ. 2019, 225, 127–147. [Google Scholar] [CrossRef]
  41. Lu, D.; Weng, Q. Urban Classification Using Full Spectral Information of Landsat ETM+ Imagery in Marion County, Indiana. Photogramm. Eng. Remote Sens. 2005, 71, 1275–1284. [Google Scholar] [CrossRef]
  42. Schneider, A.; Friedl, M.A.; Potere, D. Mapping Global Urban Areas Using MODIS 500-m Data: New Methods and Datasets Based on ‘Urban Ecoregions’. Remote Sens. Environ. 2010, 114, 1733–1746. [Google Scholar] [CrossRef]
  43. Roy, D.P.; Kovalskyy, V.; Zhang, H.K.; Vermote, E.F.; Yan, L.; Kumar, S.S.; Egorov, A. Characterization of Landsat-7 to Landsat-8 Reflective Wavelength and Normalized Difference Vegetation Index Continuity. Remote Sens. Environ. 2016, 185, 57–70. [Google Scholar] [CrossRef]
  44. Gorelick, N.; Hancher, M.; Dixon, M.; Ilyushchenko, S.; Thau, D.; Moore, R. Google Earth Engine: Planetary-Scale Geospatial Analysis for Everyone. Remote Sens. Environ. 2017, 202, 18–27. [Google Scholar] [CrossRef]
  45. Belgiu, M.; Drăgu, L. Random Forest in Remote Sensing: A Review of Applications and Future Directions. ISPRS J. Photogramm. Remote Sens. 2016, 114, 24–31. [Google Scholar] [CrossRef]
  46. Olofsson, P.; Foody, G.M.; Herold, M.; Stehman, S.V.; Woodcock, C.E.; Wulder, M.A. Good Practices for Estimating Area and Assessing Accuracy of Land Change. Remote Sens. Environ. 2014, 148, 42–57. [Google Scholar] [CrossRef]
  47. Bogaert, J.; Mahamane, A. Ecologie du paysage: Cibler la configuration et l’echelle Spatiale. Ann. Des Sci. Agron. 2005, 7. [Google Scholar] [CrossRef]
  48. Bamba, I.; Mama, A.; R Neuba, D.F.; Koffi, K.J.; Traoré, D.; Visser, M.; Sinsin, B.; Lejoly, J.; Bogaert, J. Influence Des Actions Anthropiques Sur La Dynamique Spatio-Temporelle de L\’occupation Du Sol Dans La Province Du Bas-Congo (R.D. Congo). Sci. Nat. 2008, 5, 49–60. [Google Scholar] [CrossRef]
  49. Riitters, K.H.; O’Neill, R.V.; Hunsaker, C.T.; Wickham, J.D.; Yankee, D.H.; Timmins, S.P.; Jones, K.B.; Jackson, B.L. A Factor Analysis of Landscape Pattern and Structure Metrics. Landsc. Ecol. 1995, 10, 23–39. [Google Scholar] [CrossRef]
  50. Sang, L.; Zhang, C.; Yang, J.; Zhu, D.; Yun, W. Simulation of Land Use Spatial Pattern of Towns and Villages Based on CA–Markov Model. Math. Comput. Model. 2011, 54, 938–943. [Google Scholar] [CrossRef]
  51. Azadi, H.; Ho, P.; Hasfiati, L. Agricultural Land Conversion Drivers: A Comparison between Less Developed, Developing and Developed Countries. Land Degrad. Dev. 2011, 22, 596–604. [Google Scholar] [CrossRef]
  52. Fazal, S. Urban Expansion and Loss of Agricultural Land—A GIS Based Study of Saharanpur City, India. Environ. Urban. 2000, 12, 133–149. [Google Scholar] [CrossRef]
  53. Romero-Padilla, A.; Hernández-Juárez, M.; Espinosa Herrera, J.M. Pérdida de Superficie Agrícola en los Distritos de Riego Del Estado de México y Patrones de Crecimiento Urbano. Investig. Geográficas 2024, 115, e60863. [Google Scholar] [CrossRef]
  54. Théodat, J.M. L’eau dans l’État, l’État nan dlo: Dilution des Responsabilités Publiques et Crise Urbaine dans l’Aire Métropolitaine de Port-Au-Prince (Water and State: Dilution of Political Responsibilities and Urban Crisis in Metropolitan Port-Au-Prince). Bull. Assoc. Geogr. Fr. 2010, 87, 336–350. [Google Scholar] [CrossRef]
  55. Exantus, J.M.; Beaune, D.; Cézilly, F. The Relevance of Urban Agroforestry and Urban Remnant Forest for Avian Diversity in a Densely-Populated Developing Country: The Case of Port-Au-Prince, Haiti. Urban For. Urban Green. 2021, 63, 127217. [Google Scholar] [CrossRef]
  56. Poulard, J.C. Save Our Plains Destroyed by Concrete/Spatial Planning, an Imperative for Survival. Available online: https://diezakbemol.wordpress.com/tag/plaine-du-cul-de-sac-haiti/ (accessed on 31 May 2025).
  57. Jean, M. Haïti-Environnement: The Cul-de-Sac plain, an Agricultural Area also Affected by Unregulated Construction. Available online: https://www.alterpresse.org/spip.php?article28251 (accessed on 31 May 2025).
  58. Shi, K.; Chen, Y.; Yu, B.; Xu, T.; Li, L.; Huang, C.; Liu, R.; Chen, Z.; Wu, J. Urban Expansion and Agricultural Land Loss in China: A Multiscale Perspective. Sustainability 2016, 8, 790. [Google Scholar] [CrossRef]
  59. Kabanyegeye, H.; Useni Sikuzani, Y.; Masharabu, T.; Sambieni, K.R.; Havyarimana, F.; Bogaert, J. Thirty-Three Years of Spatial Dynamics of Land Use in the City of Bujumbura, Republic of Burundi. Afr. Sci. 2021, 18, 203–215. [Google Scholar]
  60. Celiné, S. Ten Years After the Earthquake: Concrete Replaces Sugarcane in Léogâne. AyiboPost. 2020. Available online: https://ayibopost.com/10-ans-apres-le-seisme-le-beton-remplace-la-canne-a-sucre-a-leogane/ (accessed on 31 May 2025).
  61. Useni Sikuzani, Y.; Boisson, S.; Cabala Kaleba, S.; Nkuku Khonde, C.; Malaisse, F.; Halleux, J.-M.; Bogaert, J.; Munyemba Kankumbi, F. Land-Use Dynamics Around Mining Sites Along the Urban–Rural Gradient of Lubumbashi City, DR Congo. Biotechnol. Agron. Soc. Environ. 2020, 24, 14–27. [Google Scholar] [CrossRef]
  62. Pham, V.C.; Pham, T.T.H.; Tong, T.H.A.; Nguyen, T.T.H.; Pham, N.H. The Conversion of Agricultural Land in the Peri-Urban Areas of Hanoi (Vietnam): Patterns in Space and Time. J. Land. Use Sci. 2015, 10, 224–242. [Google Scholar] [CrossRef]
  63. Time, A.; Garrido, M.; Acevedo, E. Water Relations and Growth Response to Drought Stress of Prosopis Tamarugo Phil. A Review. J. Soil. Sci. Plant Nutr. 2018, 18, 329–343. [Google Scholar] [CrossRef]
  64. Chapman, D.; Le Roux, J.J.; Linnamagi, M.; Pasiecznik, N. EPPO Prosopis Juliflora (Sw.) DC. EPPO Bull. 2019, 49, 290–297. [Google Scholar] [CrossRef]
  65. Food and Agriculture Organization of the United Nations (FAO). The State of the World’s Land and Water Resources for Food and Agriculture (SOLAW)—Managing Systems at Risk; Food and Agriculture Organization of the United Nations: Rome, Italy; Earthscan: London, UK, 2011. [Google Scholar]
  66. OECD. The Governance of Land Use in OECD Countries: Policy Analysis and Recommendations, OECD Regional Development Studies; OECD Publishing: Paris, France, 2017; ISBN 9789264268593. [Google Scholar]
  67. Caron, P.; Ferrero y de Loma-Osorio, G.; Nabarro, D.; Hainzelin, E.; Guillou, M.; Andersen, I.; Arnold, T.; Astralaga, M.; Beukeboom, M.; Bickersteth, S.; et al. Food Systems for Sustainable Development: Proposals for a Profound Four-Part Transformation. Agron. Sustain. Dev. 2018, 38, 1–12. [Google Scholar] [CrossRef] [PubMed]
  68. ONU-Habitat. Initiative de Développement Urbain (URDI). for the Canaan Area, Port-Au-Prince. Urban Development Strategic Framework. Available online: https://unhabitat.org/sites/default/files/2020/09/82.urdi_fr_cadre_strategique_de_developpement_urbain_-_port-au-prince_2016.pdf (accessed on 31 May 2025).
  69. Agronomes & Vétérinaires Sans Frontières (AVSF). Haïti: Agroforestry Systems to Produce and Protect. Available online: https://www.avsf.org/haiti-des-systemes-agroforestiers-pour-produire-et-proteger/ (accessed on 31 May 2025).
  70. Dorner, V.; Rochegude, A. Land Tenure in Haiti: Land Ownership Between Legal Complexities and Informal Improvisations Since Independence; Technical Committee “Land Tenure and Development”, French Development Agency (AFD) & Ministry for Europe and Foreign Affairs (MEAE): Paris, France, 2020. [Google Scholar]
  71. Programme de Développement Local en Haïti (PDLH); Centre d’Étude et de Coopération Internationale (CECI); Centre de Recherche et de Consultation en Gestion (CRC-SOGEMA); École Nationale d’Administration Publique (ÉNAP); Société de Coopération pour le Développement International (SOCODEVI). Capitalization of Support Strategies for Local Eelected Oficials and Municipal Administration Staff to Enable Local Governance; Québec, QC, Canada, 2012; Available online: https://ceci-ressources.nyc3.cdn.digitaloceanspaces.com/uploads/Import/fr-rapport-pdlh-capitalisation-juin2012haiti_2024-03-06-162811_fotc.pdf?utm_ (accessed on 31 May 2025).
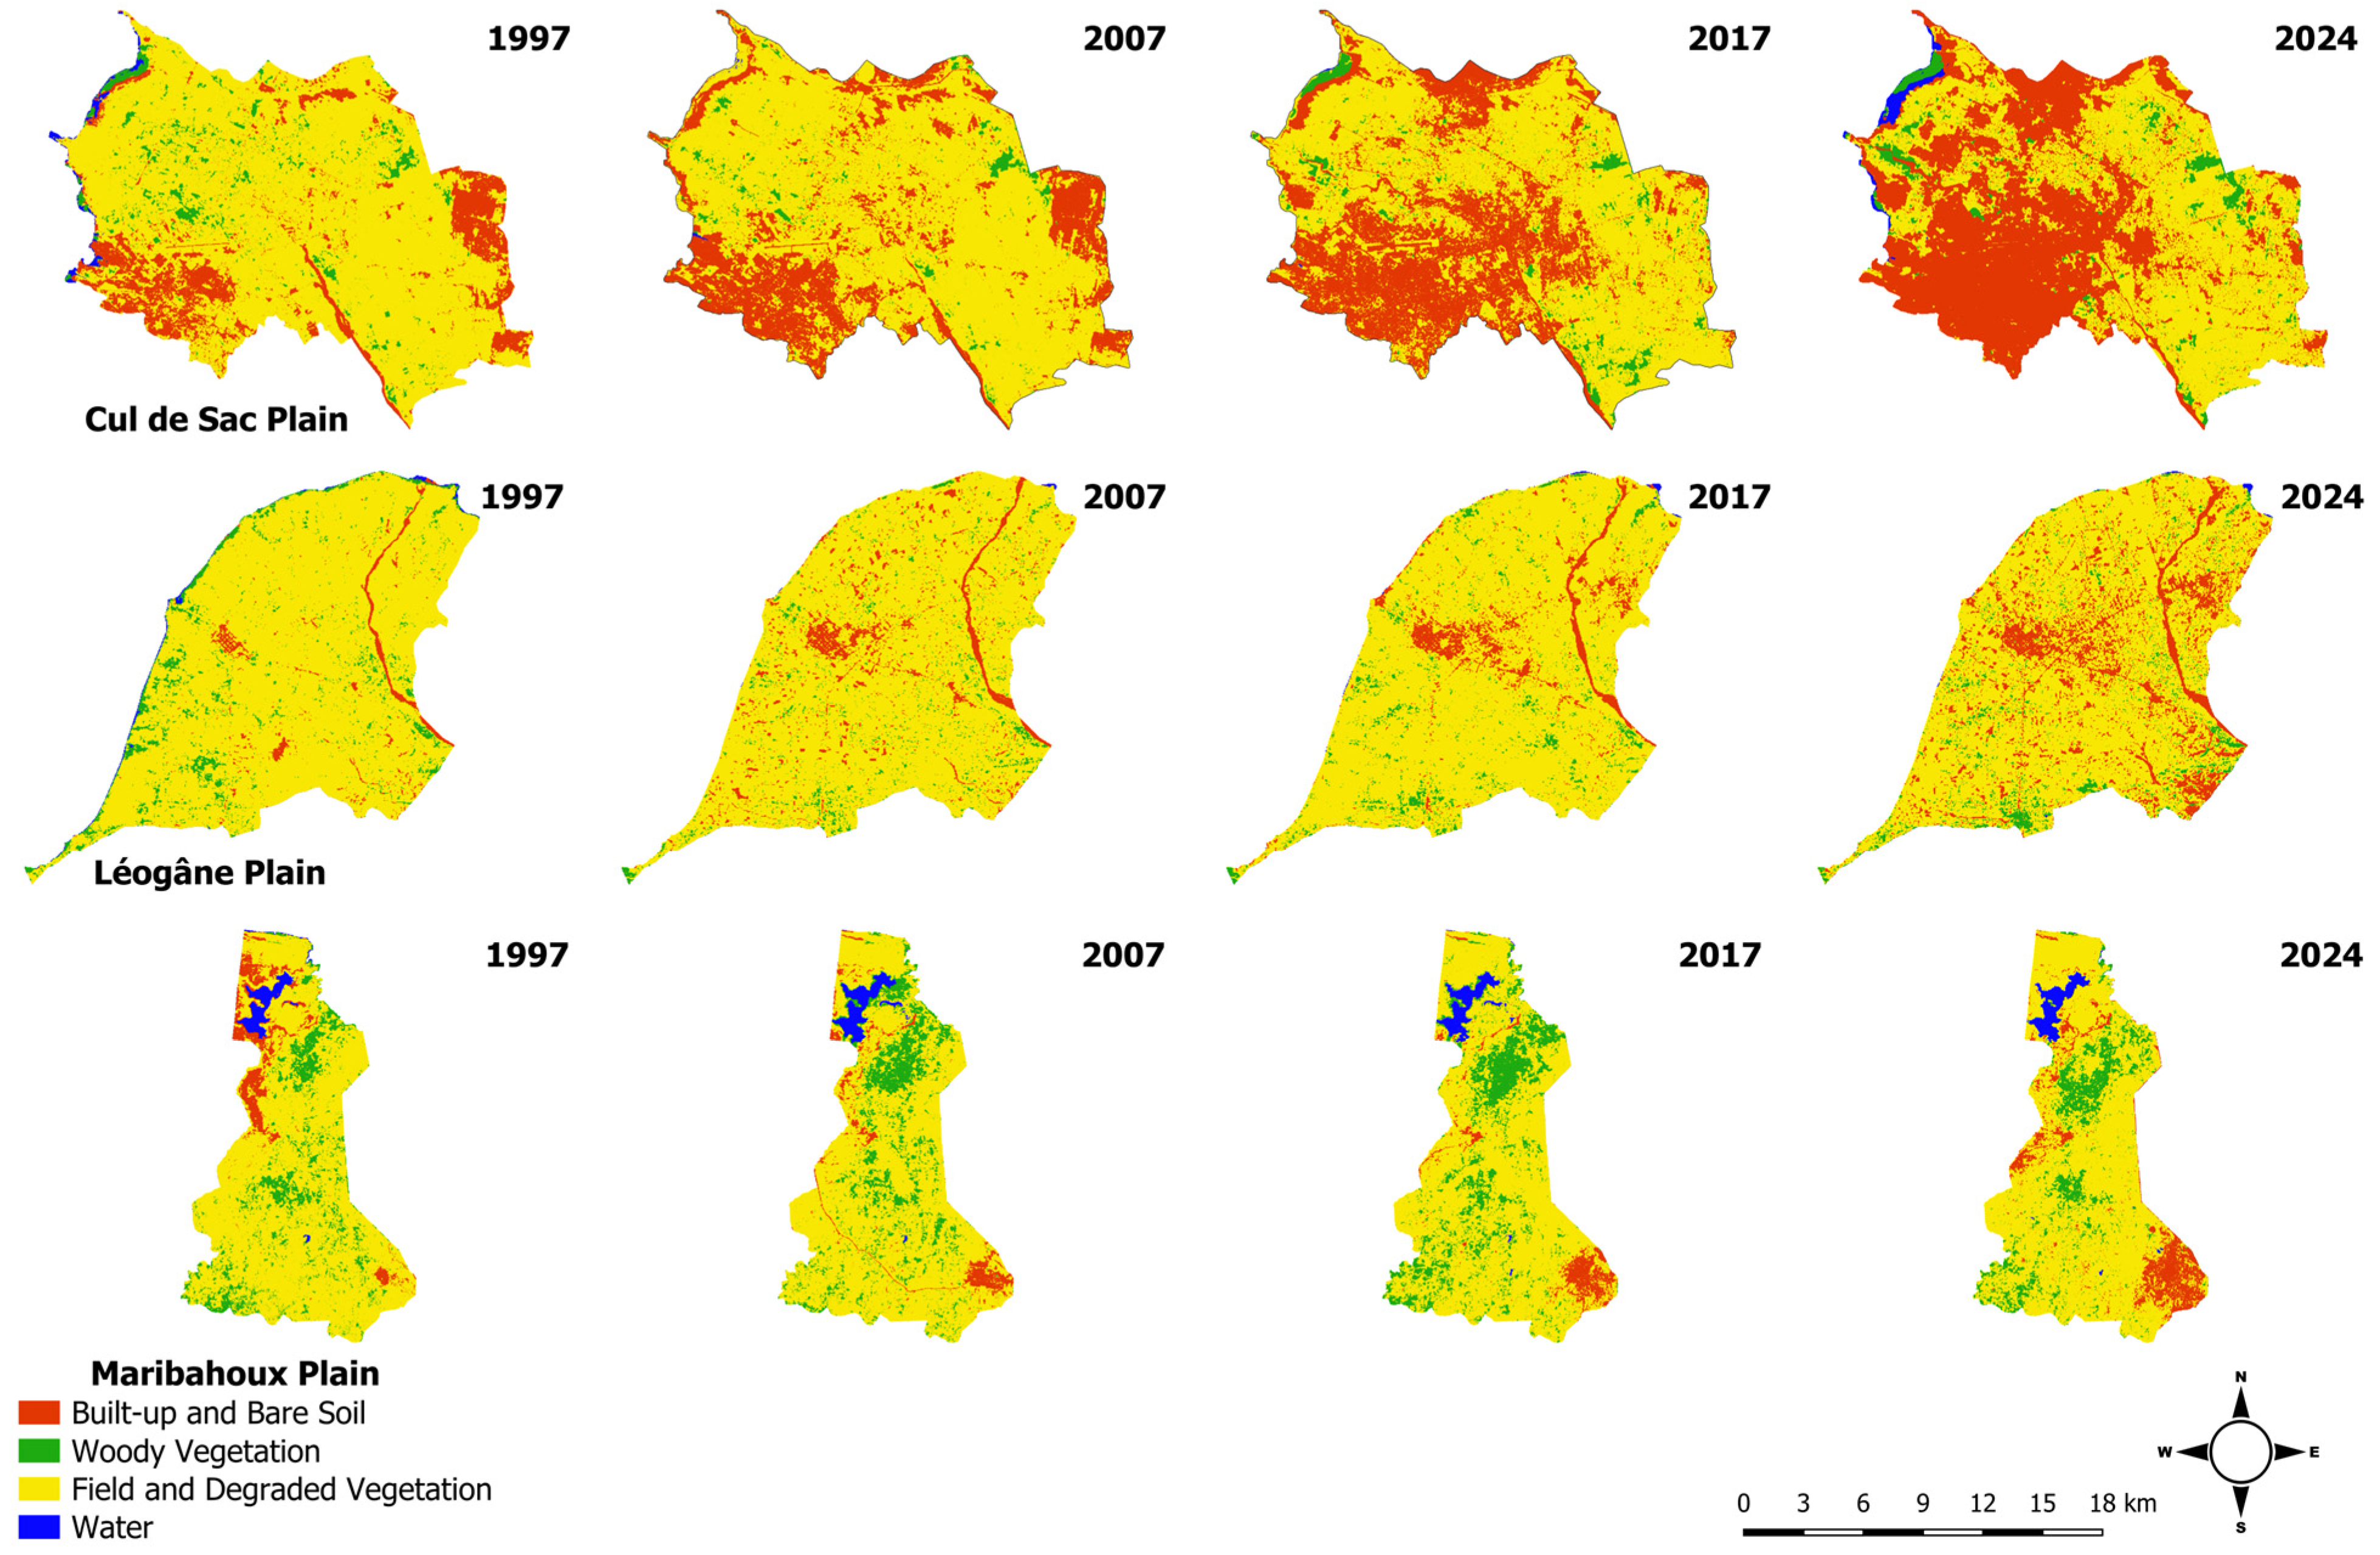
Figure 2. Land-use maps of the agricultural plain of Cul-de-Sac, Maribahoux, and Léogâne derived from supervised classification of Landsat images from 1997 to 2024 using the Random Forest algorithm.
Land 14 02230 g002
Figure 3. Changes in the configuration and composition of the landscape of the Maribahoux (a1,a2), Cul-de-Sac (b1,b2) and Léogâne (c1,c2) plains from 1997 to 2024. Dynamics varied across the plains: in Maribahoux, urbanization increased slightly, but only the spatial cohesion of built-up areas is statistically significant. In the Cul-de-Sac plain, urban expansion and the decline of fields are highly significant, indicating a marked landscape transformation. In Léogâne, only the growth of built-up areas is significant, while agricultural and woody vegetation losses are not statistically significant.
Land 14 02230 g003
Figure 4. Changes in landscape structure and composition according to human density gradients in the Maribahoux plain from 1997 to 2024. HD corresponds to high population density and LD to low population density.
Land 14 02230 g004
Figure 5. Changes in landscape configuration and composition according to human density gradients in the Cul-de-Sac plain from 1997 to 2024. HD corresponds to high population density and LD to low population density.
Land 14 02230 g005
Figure 6. Changes in landscape configuration and composition according to human density gradients in the Léogâne plain from 1997 to 2024. HD corresponds to high population density and LD to low population density.
Land 14 02230 g006
Table 1. Definition of land-use/land-cover classes in the Cul-de-Sac, Léogâne, and Maribahoux plains.
Land-Use/Land-Cover ClassDescriptionRepresentative Photographs
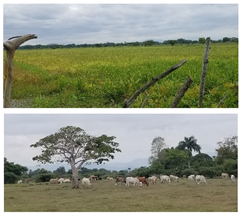
Field and degraded vegetationThis class includes cultivated fields, fallow lands, agroforestry systems, and areas used for livestock grazing.Land 14 02230 i001
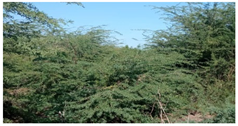
Woody vegetationThis class encompasses the Campeche forest and shrub savannas, mainly composed of Prosopis juliflora and other woody species.Land 14 02230 i002
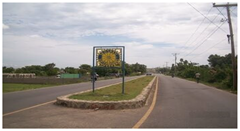
Built-up and bare soilThis class includes residential areas, roads, and bare soil surfaces.Land 14 02230 i003
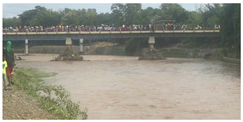
WaterThis class includes rivers and other surface water features.Land 14 02230 i004
Table 2. Validation of land cover classifications based on Landsat images using the Random Forest classifier. CA corresponds to user accuracy; PA to producer accuracy; OA to overall accuracy.
Cul-de-Sac Plain
Built-up & bare soil1997200220072012201720222024
PA98.5610099.2410099.01100100
CA95.1398.3697.0510099.0194.6499.23
Woody vegetation1997200220072012201720222024
PA96.8498.1196.3693.8497.0591.6698.33
CA10010098.1410010095.6589.39
Field & degraded vegetation1997200220072012201720222024
PA95.0797.7296.2110099.0293.6994.07
CA96.4299.2396.9494.6997.1494.5499.21
Water1997200220072012201720222024
PA10010093.7580.6610085.71100
CA100100100100100100100
OA96.9098.9597.3297.9098.5895.0499.36
Maribahoux Plain
Built-up & bare soil1997200220072012201720222024
PA98.8798.2998.9698.0010096.2593.83
CA98.8710010010010010097.44
Woody vegetation1997200220072012201720222024
PA10091.3096.0598.5789.5510096.23
CA95.9491.3010098.5796.7710096.23
Field & degraded vegetation1997200220072012201720222024
PA97.6591.0810099.0297.6498.8596.30
CA97.6588.4695.8697.1492.2296.6293.69
Water1997200220072012201720222024
PA97.1998.8699.05100100100100
CA10010010010010097.77100
OA98.2394.5498.7398.8796.6998.4995.72
Léogâne plain
Built-up & bare soil1997200220072012201720222024
PA10098.6410099.0810098.82100
CA98.77100100100100100100
Woody vegetation1997200220072012201720222024
PA90.9010092.3010092.30100100
CA10098.1110010010096.96100
Field & degraded vegetation1997200220072012201720222024
PA10098.8810010010098.78100
CA94.3197.8097.5398.8699.2196.4299.06
Water1997200220072012201720222024
PA90.9080.0010010010084.6187.50
CA100100100100100100100
OA97.3898.6498.9699.5699.5998.1199.60
Disclaimer/Publisher’s Note: The statements, opinions and data contained in all publications are solely those of the individual author(s) and contributor(s) and not of MDPI and/or the editor(s). MDPI and/or the editor(s) disclaim responsibility for any injury to people or property resulting from any ideas, methods, instructions or products referred to in the content.