
Attitudes and Behaviors toward the Use of Public and Private Green Space during the COVID-19 Pandemic in Iran


1
Faculty of Arts, University of Birjand, Birjand 9718854987, Iran
2
Institute of Bioeconomy–National Research Council, Via Madonna del Piano 10, Sesto Fiorentino, 50019 Firenze, Italy
*
Author to whom correspondence should be addressed.
†
Co-first author.
Land 2021, 10(10), 1085; https://doi.org/10.3390/land10101085
Submission received: 3 September 2021
/
Revised: 11 October 2021
/
Accepted: 12 October 2021
/
Published: 14 October 2021
(This article belongs to the Special Issue Effects of the COVID-19 Pandemic on the Use and Perception of Urban Green Space)
Abstract
:This paper reports the results of an exploratory study carried out in Birjand, Iran, during the first year of the COVID-19 pandemic. The aim of the study was to explore the behavioral change in the use and the motivation to visit a green space (public or private) during the pandemic as compared to the pre-pandemic period, the effect of green spaces (private and public) on users’ feelings, the relations between the extent to which the access to green spaces was missed, and characteristics of respondents and the place they live. A survey was carried out through an online questionnaire in winter 2020 and about 400 responses were collected. The results showed a decrease in visitation of public green spaces during the pandemic, and higher visitation of private green spaces such as gardens or courtyards by those with access. In addition, both public and private green spaces enhance positive feelings and decrease the negative ones. Respondents missed access to green spaces, especially when their visitation before the pandemic was high, and women missed them more than men. Therefore, private green spaces might represent an opportunity for psychological respite in time of a pandemic, but also for socialization. The study reports respondents’ useful suggestions for urban landscape planning for the city of Birjand that might also be useful for other cities in dry lands; improving the quality of green spaces beyond the quantity may play a role in enhancing the connection to nature in the time of a pandemic, with positive effects on mental health, and this can also can improve recreation opportunities and reduce inequalities.
1. Introduction
1.1. COVID-19 and Urban Green Spaces
The emergence of the COVID-19 pandemic as a global crisis deprived people worldwide of many usual activities, due to governmental restrictions set to limit social gatherings and crowding and to avoid contagion. People experienced to some extent measures of lockdowns, with some governments specifically preventing also possibility of visiting public green spaces for a prolonged period of time [1,2], while in other countries visiting green spaces was allowed. Although many people were afraid to use them [3], in general there was a great demand for urban green space [4]. In the US the public health authorities recommended to design and implement social distancing guidelines specifically for visiting parks and closely monitor people’s behaviors and travel patterns to parks [5]. Indeed, the pandemic changed the way many people viewed and interacted with the natural environment and UGS [6]. For example, in Europe going to UGS for reasons that could be considered as non-essential, such as observing nature or meeting people-which could pose a risk for possible contagion, decreased dramatically, while UGS were used for physical activities, passing through them to reach a destination or for taking kids outdoors and by dog walkers [1]. In a study carried out in Tokyo (Japan), the use of UGS changed according to lifestyles and user typologies, who visited specific green spaces depending on their characteristics and their stress-reducing functions [7].
In general, it seems that in the countries where access to UGS was allowed, the use of UGS increased [8], although there were also evidences that UGS use was influenced by the perception of contagion risk. For instance, in New York City, Lopez et al. [9] found that most surveyed users declared to visit UGS less often than before the pandemic because of the crowds and low social distancing. This can be obviously exacerbated by the UGS density and accessibility within a town or neighborhood, and the presence of a private green space [10]. For example, UK and US parks and gardens remained open, although in many big cities this evidenced the inequalities in UGS access between neighborhoods–with communities characterized by socio-economic disadvantages such as lower income, and often with higher ethnic diversity, suffering inadequate quality, functionality and location of UGS [11,12]. Similar results were found in Mexico City [13], where low access to UGS has prevented their use especially in low-income neighborhoods and by women who were also scared by the risk of contagion.
This situation highlighted the significant role that urban nature can play in the health and wellbeing of urban dwellers [14,15,16,17]. It is acknowledged how urban green spaces (UGS) in both private and public forms have positive socio-ecological benefits: they provide opportunities for social interactions [18,19,20], improve numerous health and well-being indicators [14,21,22,23,24,25,26], and enhance the air quality and thermal comfort in the urban environment [27,28,29]. Thus, UGS represent a social right that public policy should guarantee, by enhancing equity in access to nature, especially on public lands [30,31,32,33,34]. Also residential yards provide access to nature, and in other studies have been demonstrated as having an important role [35,36,37] in providing moments of respite, especially during such crises. Ma, Lam, Cheung, & Fok [38] highlighted the importance of accessible natural green areas as they represent an opportunity to withstand the detrimental psychological effects of the pandemic (fear for contagion, anxiety), facilitating the adaptation and resilience of people in term of both mental and physical heath, with consequences in both the short and long run. Maintaining physical activity also has a potential buffering effect against COVID-19 related consequences, and on increasing the immune vigilance [39,40,41,42]. In contrast, the restrictions on movement and consequent reduction of physical activity resulting from governmental decisions induced further consequences: in Canada, the majority of children and youth decreased their outdoor activities during the COVID-19 pandemic, increased their screen time on digital devices and other sedentary behaviors [43]; in Brazil, those who reduced their level of physical activity revealed higher levels of mood confusions [44].
The COVID-19 crisis presents an exceptional opportunity for policy makers to take transformative actions regarding appropriate behaviors and adaptative rules to counter the spread of the virus [32] in relation to the use of public spaces, particularly urban green spaces. COVID-19 is also an opportunity to reflect about the spatial distribution of the urban fabric in terms of urban planning [45], urban greening policy and UGS design [46]. Knowing more about the usage and perception of the urban spaces during such a crisis can help define strategies to mitigate the effects of the pandemic [46] and develop urban planning approaches aimed to decrease the inequalities towards poor, marginalized, and vulnerable groups, and it is even an impetus to start a green revolution in terms of green mobility (i.e., cycling and walking) [47], and to rethink the nature of urban space for safer and more sustainable cities [48,49].
1.2. The COVID-19 Pandemic in Iran
Iran was the second country to experience fatalities due to COVID-19, declaring two deaths on 18 February 2020 (less than 50 days after the first fatalities in China), and during the first wave of the pandemic (February 2020–April 2021) it counted the highest number of cases and deaths among the Eastern Mediterranean countries [50]. The situation was exacerbated by the political and economic sanctions imposed on the country [51]. In response to COVID-19, from February to April 2020 the government cancelled public events, closed schools, universities, shopping centers, bazaars, and holy shrines, and banned festival celebrations. Government restrictions were gradually eased from late April 2020, although the number of new cases increased again in May with new peaks reported in July and December 2020 [52]. During the whole year of 2020, theatres, swimming pools, saunas, beauty salons, schools and universities were closed most of the time, and cultural and sports gatherings were banned, though most of the mosques remained open. In contrast, urban parks, gardens and other types of green infrastructure remained open to the public, though access was defined by health protocols, such as social distancing and other rules [51].
1.3. Context of the Study
During the recent decades, urban expansion in Iran has caused a dramatic decrease in UGS [53,54,55], especially in cities located in a dry climate zones, where urban planning has been occurring without an appropriate consideration of public green space [56]. This has yielded high disparities in the distribution of urban parks and contributed to citizens’ unequal access to UGS [57].
In this study, the authors focused on the city of Birjand, located in a highly strategic position in the East of the country, at an elevation of 1491 m. It is characterized by a cold desert climate with extreme drought: an average of 150 mm annual rainfall and temperature extremes of 44 °C in the summer and −15 °C in the winter.
Birjand has a limited number of newly-established contemporary urban parks, but counts many tree-lined streets with pine trees (mostly Pinus nigra) which have been planted since the 1940s, forming the green landscape of Birjand. The first city park, called the National Garden, was established in those years while the city entrance park was established in the early 1970s [58].
In the last 30 years of urban development, several new neighborhoods have been built, but only a few small parks have been established in these areas. Moreover, between 1997 and 2020, the population increased from 133,474 inhabitants to about 200,000 people (an annual growth rate of 1.49%), the city surface expanded from 1690 hectares to 3630 hectares (becoming 2.14 times larger) (Figure 1), while in contrast, UGS increased by only 1.6 times (from 160 to 253.54 hectares) [59] (Table S1). The absence of an urban greening policy permitted neighborhoods to grow denser without incorporating green spaces in any meaningful way. Additionally, despite an enhancement of the green space per capita from about 12 m2 to 13.8 m2 during the mentioned period, even the access to private green spaces has decreased. People used to have access to nature through the private yards, but the mass construction pattern especially in the last decade has favored housing without private green space, greater building density and the transformation of yards into parking lots [60]. This caused UGS to be insufficiently accessible to urban dwellers, as large urban are parks are usually too far away.
At the same time, many historical gardens such as the landscape heritage gardens have been restored and opened to the public, and they represent the most visited green spaces together with the parks (Figure 2).
Today, the city is divided into two districts and counts 57 neighborhoods: 24 located in District 1, and 33 in District 2. District 1 has an area of 1798 hectares, 88,846 inhabitants and 33.02 ha of green spaces while District 2 has an area of 1831 hectares, 111,091 inhabitants and 47.63 ha of green spaces (Table S2). In general, green space per capita, per capita income, property prices and preference for living are higher in District 2 than in District 1 (Table S3) [62].
1.4. Hypotheses and Aims of the Current Study
The benefits of green spaces in a harsh climate are well acknowledged [34,61,63]. However, despite the possibility for Iranian citizens to visit UGS during the pandemic, we hypothesized that the COVID-19 crisis and related government measures may have fundamentally changed the public’s use of UGS, with consequent questions about the general public’s appreciation of UGS services and benefits [1,64] and the role of public vs. private green spaces. Knowing more about it can aid policy making to design green spaces as a form of “spatial medicine” [65,66] by ensuring safe and unrestricted use of green areas during the next predictable crises [67,68,69].
The study aimed at exploring the following aspects concerning visitors of public and private green spaces in the town of Birjand: (i) the behavioral changes in the use and in the motivation to visit a green space during the pandemic, as compared to the pre-pandemic period; (ii) the feelings (positive/negative) perceived in a green space; (iii) the extent to which access to a public green space during the pandemic was missed by users; and (iv) the perception of meaningful ecosystem services and benefits connected to green spaces. This was done through an exploratory survey targeting the inhabitants of Birjand.
2. Materials and Methods
2.1. The Questionnaire
The exploratory survey was done through an online questionnaire the using Google Modules online platform. Compared to other types of distribution, online forms are generally more efficient and easily allow for complex patterns of question branching and skipping. In this specific case, the choice of an online survey was also made on the basis of the following considerations: affordable and less time-consuming method for both administrators and respondents, the characteristics of the Iranian population, largely urban and young (32 years old is the average age, with 67% between 16 and 64 years old), with a rather high rate of literacy (85% of adult population) and making extensive use of digital devices and the internet. Statistics show an increasing trend of those using the internet (currently 70% of the population) and a 155% rate of mobile connections with respect to the population [70].
Nevertheless, the fact that online surveys do limit the respondents to those who have internet access and use online communication (such as email and social media) raises the probability that the sample is non-representative of the actual population, and thus limits the generalization of the findings.
The minimum sample size (n = 384) was calculated according to the equation:
where N is the population size and X = Zα/22 × p × (1−p)/MOE2, and Zα/2 is the critical value of the Normal distribution at α/2 (for a confidence level of 95%, α is 0.05 and the critical value is 1.96), MOE is the margin of error (set at 5%), p is the sample proportion (expected number of respondents visiting green spaces = 50%).
n = N × X/(X + N − 1)
The questionnaire was structured in six main sections and contained between 20 and 31 questions (see Supplementary Materials), depending on whether respondents self-identified as those who usually visit a public urban green space or those who do not, and on whether they had access to a private green space or not. The first section asked respondents for information about the characteristics of the place where they live (i.e., type of housing, presence of public green spaces near the residency, and size of the accessible private green space, if any. In order to characterize the neighborhoods of the respondents, respondents were asked to write down the name of their neighborhood in Birjand (as optional) in order to associate it with territorial municipal information. This included the price of urban lands (class rank from 1–most expensive, to 7–cheapest) taken from the Atlas of Spatial Divisions of Birjand [62], the preferred area for residency (class rank from 1–most preferred, to 6–least preferred) taken from the Comprehensive Plan of Birjand [65,71], and the greenery per capita (class rank from 1 to 8 classes of green e.g., class 1 = 61–70 m2 per capita;…; class 8 = 0–10 m2 per capita etc.) taken from the official Database of the Organization of Birjand’s Urban Parks & Green Spaces [72] (Table S3). This information was used for regression analysis (see Section 2.3).
The second section was about the pre-pandemic usage of public green spaces (A) i.e., frequency of visitation, distance, type of green space and motivation to visit it, and/or of private green spaces (B) i.e., size of the private green space, if it is shared with other people, frequency and motivation of visitation; the third section was about the usage (i.e., frequency and motivation of visitation) and an assessment of the feelings (i.e., happiness, pleasure, excitement, physical energy, anxiety, depression, fear, tension, anger, sadness) in public green spaces (A) and/or in private green spaces (B) during the pandemic (the period which started in February 2020 and it was ongoing at the time of the survey, characterized by diverse types of restrictive measures e.g., lockdowns, social distancing etc., although the access to public green spaces was always allowed). The fourth section was about the level to which respondents missed having access to urban green spaces and “what” was mainly missed in relation to a green space, as an open question. Finally, the fifth section was about personal details (i.e., gender, age, occupation).
The questionnaire included closed questions in order to reduce the probability of errors, some of which allowed multiple selection (up to two) among different options (e.g., reason of visitation of green spaces), and some others included a 4 (or 5)-point Likert scale (e.g., feelings in green spaces, missing level of a green space, and perception of benefits and services of green spaces).
One open question, about what the respondents missed most during the pandemic regarding the visitation of a green space, aimed at leaving respondents the freedom to express their thoughts. For the analysis, the responses were interpreted, simplified and coded according to a common meaning. For instance, we coded as “nature” all texts such as “enjoying nature”, “listening to birds and water”, “connection to nature”; as “breathing in open air” the sentences related to “breathing outside”, “breathing without masks”; or “quiet” those sentences or words related to “calm green areas”, “quiet”, and “peace”. The same coded-answers were further aggregated into a smaller number of categories for the regression analysis (see next chapter). For instance, when respondents expressed concepts like missing “meeting people”, “children playing” and “staying together with the family”, these were coded “sociality” as they are related to social aspects of green spaces. The new code “Relax and quiet” aggregated answers connected to “relaxation”, “quiet green spaces” and “no stress”.
The survey was pilot-tested by a small group of people who checked the translation into Persian and identified any words or phrases that were not clear in order to revise them and increase the reliability.
2.2. Administration of the Questionnaire
The questionnaire distribution and data collection took place from the 5 January 2021 to the 14 February 2021, just after the peak of COVID-19 contagions of the previous fall.
Initially, the link to the online survey questionnaire was sent via email to the first author’s networks of professional and personal contacts living in Birjand and posted on social media (WhatsApp, Telegram, etc.). The people contacted were kindly invited to forward the link of the survey to their contacts. This created such a snowball effect so that it was difficult to track its distribution and the people invited to participate in the survey.
The introduction to the questionnaire reported a brief explanation about the purpose of the study, the target group (inhabitants of Birjand without any specific characteristics), the time needed to fill it in and information regarding data handling and the responsible institutions and persons. This information had to be checked before accessing the questionnaire.
The questionnaire was anonymous and took approximately 15 min to complete and responses were collected without identifiers via Google Spreadsheets, and downloaded for analysis.
2.3. Statistical Analysis
All the responses were checked if they were fully filled for the analysis.
Among the respondents (n = 401), 7 were not considered for the analysis because they did not live in Birjand. Due to the fact that most questions were mandatory–except the one about the neighborhood, we did not have uncompleted questionnaires, since all respondents indicated their neighborhood.
Descriptive statistics (with the frequencies and percentages) were performed for all valid answers. We identified two groups of respondents: those with only access to public green spaces and those with access also to private green spaces.
To assess if the frequency and motivation to visit a public or private green space in the period before the pandemic, were related to the type of green, the Chi Square goodness of fit test was used, assuming as null hypothesis that the visitation does not change with the type of green space.
To assess if the pandemic influenced the frequency and the motivation to visit a green space (public and private), the Wilcoxon signed-rank test was applied for the comparisons of the variables between pre-pandemic and during the pandemic at p < 0.05.
The feeling connected to staying outdoors in a green space (private and public) was assessed through a 5-point Likert scale, with the nominal value scale transformed into an ordinal scale (1 = Much less, 2 = Less, 3 = No change, 4 = More, 5 = Much more).
To assess if having access to a private green space changed the frequency and the motivation for visiting a public green space, the Chi Square goodness of fit test was used, assuming as null hypothesis that having access to a private green space would not affect the visitation of public green spaces.
When the frequency in a cell was <5, the Fisher exact test was applied.
In addition, multiple regression analysis with forward stepwise selection method was performed specifying an alpha significance level 0.05, to find any relationship between dependent and independent variables in the two groups, separately: visitors of public green spaces and visitors of private green spaces. Categorical variables such as occupation, type of house, and presence of a private green space were coded as dummy variables (0 not in the category, 1 within the category). The analysis was also performed to check if the visitation of public green spaces was related to the presence of private green spaces and other variables (i.e., type of house, access to private green space–as respondents with private green spaces could visit public ones, frequency of visitation of private green space and distance of a public green space), pre-pandemic and during the pandemic (for the latter, we included also the frequency of visitation of public green spaces before the pandemic).
Regarding gender, male (M) was set to 1, female (F) to 0. Variables with categorial scales such as age, education, frequency of visitation, and the classes related to municipal information of the neighborhood (greenery, urban land price and preference for residency) were used as ordinal value scales. For this reason, age classes ranged from 1 (less than 20 years old) to 8 (more than 80 years old), education ranged from 1 (mandatory) to 4 (post-graduate), frequency of visitation from 1 (Never) to 6 (Every day), distance of the closest public green space from 1 (closest) to 4 (farthest), missing a green space from 1 (not at all) to 4 (a lot) and classes of greenery, urban land price and of preference for residency as indicated in Section 2.1. The following relationships were investigated:
- (i)
- feelings in a public and private green space (dependent variable) and gender, age, education, occupation, municipal information of the neighborhood, in addition to specific variables for the visitors of public (frequency of visitation during the pandemic) or private green space (size of the private green space and frequency of visitation during the pandemic as independent variables.
- (ii)
- perceived benefits or services and other aspects of public and private green spaces (each item as dependent variable) and the above-mentioned independent variables.
- (iii)
- extent to which a green space was missed (dependent ordinal variables) and gender; age; education; occupation; access to private green space (Yes = 1); frequency of visitation pre and during the pandemic, distance of public green space.
3. Results
3.1. Characteristics of the Respondents
The survey collected 394 valid responses, mostly represented by women, mainly ranging from 20 to 39 years old, while males represented 39% of the sample, mainly ranging from 20 to 49 years old (Table S4). A large majority of respondents (91%) had higher education degree. In addition, most respondents (45%) were employees in public or private companies and self-employed, especially men, while among females, students and housewives were also represented (Table S4).
Regarding the type of house where respondents live, 55% declared to live in a flat in a condominium (n = 218) and 45% in a single house (n = 176) (Table S5). Approximately half of all respondents (n = 185) did not have any private green space available nearby the house. This occurred especially for those living in a flat, while 88% of those living in a single house had access to a private green space. The most frequent size of private green space was between 30 and 100 m2, especially linked to single houses. Big green spaces (more than 100 m2) represented 10% of all responses and they were more typical of single houses. Only 5% of respondents living in a condominium declared to have access to a big (more than 100 m2) private green space.
The large majority of respondents without access to a private green space had a public green space available within 300 m (Table S6), mainly represented by a park (indicated by 40% of those living in flats and 37% living in single houses). Only 8% of respondents declared that they did not have any public green space nearby the residence, the majority of which also did not have a private green space to enjoy.
3.2. Use of Public Green Space before the Pandemic
Before the pandemic, the use of public green spaces was fairly good as 96% of respondents (n = 379) declared to visit a public green space. About one third of them (33.8%) used to go to the closest public green space and altogether, 60% visited green spaces no farther than 500 m (Table S7). The most visited green space typology was the urban park (55.1%), followed by green areas out of the town (about 20%) (Table S7). The frequency of visitation was quite high, as 65.2% went many times in a single month (Table S7).
The highest frequency of visitation of public green spaces was related to the lack of a private green space by respondents, although the majority of those with a private green space demonstrated to be habitual visitors of public green spaces, going at least several times a month (Table S8). In addition, the frequency was positively related to the motivations to visit the green space such as physical exercise (p < 0.05) and walking (p < 0.05) and to the distance of the public green space (Table S9).
Among the most selected reasons to visit a public green space were: taking the kids outdoors and walking (Table S7), regardless of access to a private green space (Table S8).
Those respondents who declared to visit a private green space before the pandemic (n = 209), did so pretty often as 52% of them declared to visit it many times a week (and much more everyday as compared to visitors of public green spaces) and 22% several times a month (Table S7). Activities performed in the private green space were various, mainly used for staying outdoors and relaxing but also gardening or passing through the space to go somewhere else, as compared to the reasons for visiting public green spaces. Observing nature and taking the kids outdoors we also selected (Table S7).
3.3. During the Pandemic
During the pandemic, the visitation of green spaces in general was much reduced, especially regarding the public green spaces (p < 0.0001) with respect to the pre-pandemic time (Table 1), even by respondents who did not have access to a private green space (Table S8). 42% respondents never visited a public green space during the pandemic and 40% did it at most once a month (Table 1). 10% of those with access to private green space never visited it during the pandemic and in general the visitation occurred less frequently (Table 1). The frequency of visitation of public green spaces was positively related to the motivations physical exercise (Table S9).
As well as before the pandemic, the main common reasons for visiting a public green space were walking, observing nature, and taking the kids outdoors (strongly decreased with respect to pre-pandemic though, p < 0.001) and to a minor degree meeting people, which increased (p < 0.01) (Table 1). These were especially selected by respondents without access to a private green space; instead, those with access to private green space significantly reduced the visitation of public green spaces for taking the kids outdoors (p < 0.001) (Table S8). The motivations to visit a private green space were mostly taking kids outdoors and observing nature (which increased, p < 0.001 and p < 0.01, respectively), but also relaxing and staying outdoors (Table 1 and Table S10).
3.4. Green Space Effect on Feelings
Being in a green space (Table 2) resulted in an enhancement of positive feelings, such as happiness and pleasure and physical energy (although rated to a minor extent), without difference between public or private green spaces. In addition, a large majority of respondents indicated that green spaces contribute to reducing a series of negative feelings such as anxiety and tension and sadness and depression. Private green spaces contributed more to the reduction of anxiety and fear than the public green spaces.
The regression analysis also showed some interesting results (Table 3): the positive feelings (i.e., happy, pleased) were correlated to the higher price of urban lands (p < 0.05) but also to the lower amount of greenery per capita (higher classes), while negative feelings such as anxiety, fear and hanger were more typical of males and greater in less preferred neighborhoods for residency, and tension, hanger and sadness (depression, feeling blue) were greater in neighborhoods with higher greenery per capita.
Regarding the feeling connected to the visitation of public green spaces (Table 3), younger people and with higher education level felt more ecstatic; respondents feeling more anxious and nervous were those living in neighborhoods with greater greenery per capita and those living in less preferred areas.
3.5. Appreciation of Ecosystem Services and Other Aspects Relative to Green Spaces
As Table 4 shows, respondents mostly appreciated the clean air and the comfortable climate that in general green spaces provide, regardless of the type of green space. Public green spaces were also more appreciated than private ones for cleanliness (p < 0.01), natural value (p < 0.01), biodiversity (p < 0.001) and socialization (p < 0.001). In contrast, private green spaces were appreciated to a greater extent for the privacy (p < 0.001). Safety from contagion in green spaces was appreciated by about 83% of respondents in both groups, with no differences between public or private green space.
The regression analysis (Table S11) evidenced how the appreciation of natural value and biodiversity was linked to people living in single houses and in areas with lower price of land (p < 0.05) when referred to a private green space, and to females (p < 0.05) and respondents living in areas with lower green surface per capita (p < 0.01) when referred to a public green space. Housewives (p < 0.05) and respondents with higher education level (p < 0.01) appreciated the quiet of a private green space (p < 0.05, p < 0.01 respectively) while socialization was particularly appreciated in public green spaces, especially when the visitation before the pandemic was greater and the green surface per capita in the neighborhood was lower (p < 0.05). In general, women felt less safe than men for the presence of bad people in green spaces (p < 0.01) and security of a private green space was appreciated by respondents living in the least preferred place for residency.
Finally, females and those who did visit private green spaces to greater extent during the pandemic felt safer from COVID-19 contagion in private green spaces.
3.6. How Much the Green Area Visitation Is Missed
When respondents were asked to what extent they missed going to a green space, 66% said they missed it very much and 22% rather much. Only 10% missed it only to a small extent. The regression analysis (Table 5) evidenced a positive relationship between the extent to which a green area was missed and the frequency of visitation of public green spaces pre-pandemic (p < 0.001) and the distance of public green space (p < 0.05), and a negative relationship with male, which means that women (p < 0.01) suffered more than men. Having access or not a private green space did not influence the deprivation feeling.
What respondents missed (Table S12) was mainly related to nature (19%) (staying in connection with nature, observing and listening the sounds of nature), meeting people (18%) and staying with the family (10%).
Nature was especially missed by women (Table S13) while the “social aspect” (meeting people, family togetherness, children’s play) was especially related to males (p < 0.05) and younger people (p < 0.05) and to the distance of the public green space (p < 0.01) or lesser per capita greenery (p < 0.05).
Physical activity including walking and doing physical exercise (e.g., running) was especially missed by students (p < 0.05) and older people (p < 0.01).
Those who declared not to miss anything, were mostly respondents who declared low visitation frequency of public green spaces before the pandemic (p < 0.01) and those living at shorter distance from a public green space (p < 0.001) or near a square with trees (p < 0.01).
4. Discussion
The study revealed how green spaces are important elements for the respondents. It should be noted that respondents were mostly young citizens, less than 49 years old, with a large majority of people with higher level education. Despite the inherent bias due to the snowballing approach, which makes it impractical to achieve a truly representative sample of the overall population, the exploratory study reports that the public green spaces are frequently visited by the respondents, although the accessibility of nearby public green spaces (distance set at 300 m) is limited to only one third of all respondents. Also, approximately half of the respondents did not have any private green space available nearby their residence, especially those living in a condominium, and a few did not have any public green space in the surroundings. This depends on the characteristics of the urban fabric, whose urban expansion during the last decades put little attention on the provision of green spaces to urban dwellers. The urban fabric and the harsh climate amplify the importance of green spaces in such a dryland and invited reflection on how the COVID-19 pandemic affected behaviors and perceptions of green spaces. From the analysis of the collected data, we noticed that the respondents were quite habitual users of public green spaces before the pandemic. We identified two groups of respondents, those with no access and those with access to a private green space, in the form of a private garden (mainly in connection to a single house) or yards shared among neighbors, to understand the role of private green space in such peculiar conditions.
The following discussion, in accordance with the objectives and research questions, takes into consideration the type of green space (public vs. private) used by respondents and is presented in three sections: the behavioral change due to the pandemic; the effect of green spaces on feelings, and the perception of services, benefits and other aspects related to green spaces in general, such as the extent to which people missed accessing to them.
- Behavioral change in the use and in the motivation to visit a green space during the pandemic
The study showed how the visitation of green spaces in Birjand was in general much reduced during the pandemic, especially in public green spaces. This kind of behavioral change was also observed in European contexts where the governments’ regulations were more restrictive [1], whereas in many other countries, the visitation of parks and green areas increased [8]. In Asian cities, Lu, Zhao, Wu, & Lo [73] found a 5.3% increase in the odds of people using green spaces regardless of the increase of COVID-19 infections, and Hamidi & Zandiatashbar [5] found that residents of compact counties in the United States were less likely to reduce their trips to parks during the shelter-in-place order. During the same period, Norwegians had and increased need for contact with urban green space, and in particular Venter, Barton, Gundersen, Figari, & Nowell [17] reported a 291% increase in physical activity in green spaces. Also in the UK, people spent more time in nature and visited nature more often during the pandemic [73]. However, in compact counties of the US, the high number of COVID-19 deaths coupled with the small size homes and the lack of private green spaces have demonstrated psychological counteracting effects, with an increase of feelings of anxiety and isolation, while visiting a park represented a real possibility of respite to mitigate physical and psychological challenges [5]. This is why in general, there was an increase in the visitation of green spaces to the extent allowed, at least for essential activities such as for taking the dog out, physical exercise and relaxing in contexts with more restrictive regulations [1].
In Birjand, the reduction in the usage of green spaces declared by respondents was likely due to two main reasons: on one hand, the governmental regulations that posed a limitation in movement for citizens, on the other hand, the fear of exposure to contagion due to gatherings among people visiting urban parks [38]. The decline in the visitation of the urban parks observed was severe, as 42% never visited a public green space (vs. 4% before the pandemic) and 40% did it at most once a month during the time considered. Perhaps such a sharp decline was also exacerbated by the chronic scarce accessibility of public urban green spaces, as urban parks are concentrated in some parts of the city and the long travel distance might have discouraged people to travel for the perceived risk to contagion during travelling [74], as respondents did not perceive private or public green spaces as an unsafe place for contagion risk. The urban expansion characterizing the city of Birjand has not favored a diversification or increase in the number of green spaces over time. Indeed, the per capita green space is about 14 m2, which is much lower than the optimal amount (50 m2 per person) [75], and inadequate especially considering the contextual harsh environmental conditions.
Most of the people’s interaction with urban nature happens in a few urban parks, historical gardens and private yards. In this regard, this study highlighted the importance of providing accessible green areas or other types of nature-based spaces to facilitate the adaptation of people to disease outbreaks. Private green spaces in the form of yards or gardens constitute a crucial alternative to the lack of public green spaces. The study has demonstrated the great visitation of private green spaces with respect to public ones during the pandemic (66% vs. 18% of respondents, respectively visited at least several times a month), most likely influenced by their proximity. Regarding the reasons to visit a green space, the pandemic did not substantially change those to visit a public green spaces -although the reduction of visitation for taking the kids outdoors and its increase in private green spaces, highlighting the possible fear of infection in public spaces [76], where people may not know each other [73]. Consequently, the private green spaces revealed their compensative role for the lack of residential greenery for the family members during the crises [77,78].
Public green spaces were visited for walking even by those people with a private green space, while the private ones became places to enjoy nature-centered activities such as relaxation, observing nature and staying outdoors, which were probably elicited by the situation. In addition, there was an increase of people passing through a green space to reach a destination, which supports the importance of green corridors made of tree-lined streets and gardens in the urban fabric, not only for the variety of services, such as shade, climate mitigation but also for psychological benefits and wellbeing [79].
The results are in harmony with previous studies which also reported how urban inhabitants feel the residential greenery as calm and safe places to be in contact with nature and to meet other people [80]. Even in Berlin, as green capital in Europe (with much higher per capita greenery than Birjand), public parks located far away during the pandemic have played a very small role in the urban dwellers’ everyday life due to the government restrictions on people’s movement, while residential greenery was the only accessible green space for many residents [80].
Thus, for future urban and landscape planning it would be crucial to preserve a pattern of public and private greenery-in the form of public pocket green spaces, traditional Iranian yards and gardens, or as collective residential proximity greenery which is more popular in European contexts. Urban regeneration projects aimed to increase the green area surfaces and accessibility will guarantee access in all parts of the town, thus even to most vulnerable users. As Säumel, Hogrefe, Battisti, Wachtel, & Larcher [80] proved, freely accessible residential greenery would play crucial role in the transformation of cities into livable, healthy and ecologically friendly environments.
- 2.
- Effect of green spaces on feelings during the pandemic
The results suggest that being in a green space (either public or private) enhances positive feelings such as happiness and pleasure (on average by 65.5% and 61% respondents, respectively declared that they felt happier and more pleased), and also physical energy, although to a lesser extent. However, happiness for those visiting private green spaces seemed to depend also on the neighborhood, especially the ones with lower greenery and lower price of land, enhancing the role of private green pockets for psychological wellbeing. Green spaces in general were effective in the reduction of all negative feelings, and the private ones were more effective in the reduction of anxiety and fear. However, in general, lesser preferred neighborhoods and greater greenery per capita were found to be related to greater anxiety, likely linked to the pandemic. In Poland, due to the COVID-19 epidemic there was observed a considerable decline in physical and psychological health, and the overall quality of life of youth in the period of limited access to public spaces [81]. Under circumstances of lockdown, with no access to public spaces, the importance of private spaces can indeed buffer individuals from depressive and anxiety-related symptoms, and function as a beneficial source of refuge, security, and stability during these stressful times [12,16,73]. While private gardens can compensate for a lack of access to public green spaces, both the public and private green spaces are the essential health resources in times of crisis [16].
The characteristics of a neighborhood play an important role. For instance, private green spaces contribute to the positive feelings (happiness and pleasure) especially if the neighborhood has lower land price. Less preferred areas for residency seemed to be more related to negative feelings such as anxiety and nervousness but also tension and fear. However, the presence of greenery in the neighborhood was found to be related to some negative feelings such as anxiety and nervousness if related to public green spaces. Therefore, beyond the private yards and gardens, strategic planning of neighborhoods that guarantees easy access to UGS and quality natural environments in neighborhoods are crucial to maintain favorable health and wellbeing [73,82], especially in times of pandemic. Neighborhood green spaces would guarantee easy accessibility and less crowding as compared to public urban parks [4,83,84,85,86,87] especially if these are limited in size and the urban fabric is compact [46,88], and also limited is the possibility of visual contact with nature through home windows [89,90,91,92]. Thus, landscape design strategies employing a tree-based landscaping neighborhood scale in the arid regions (and not only there) could create more comfortable outdoor spaces to enhance the livability and sustainability of neighborhoods [93]. A study in the UK revealed how a greater land-cover greenness within a 250 m radius around a respondent’s postcode was important in predicting higher levels of mental wellbeing during the COVID-19 pandemic.
Although it is hard to add large green spaces in the neighborhoods of Birjand, landscape planners can improve the existing pocket parks and strengthen linkages between nearby green spaces. It was demonstrated that a complete green network can ease walking for recreation and reduce inequality in green space distribution [87]. But in new developed neighborhoods where space is not limited, planners may consider adding new parks, addressing the people’s needs that are expressed by the reasons to visit a green space.
- 3.
- Perception of services and benefits and other aspects related to the green spaces
We noticed how the respondents were aware about a variety of services provided by green spaces, such as the amelioration of air quality and climate conditions. This seems obvious in a dryland; however, for decades the urban planning of the city has been continuously sealing land, preventing the creation of green spaces. If private greeneries provide immediate access to nature and the privacy component allows creative or reflective moments within one’s own private sphere that would be rarely feasible in public green spaces [94], public green spaces were highly appreciated by respondents for the socialization, cleanliness and natural value, highlighting the importance of a quality design and maintenance of public green spaces, beyond mere quantity. Ameliorating the quality of green spaces by targeting specific green functions [95], including natural value [96,97], biodiversity [98,99,100,101], but also socialization [102,103,104,105], facilities and security will improve the potential benefits of urban nature in wellbeing and health [106]. High-quality green areas also may help improve prosocial behavior in children [107] and the contact with nature in times of pandemic may be a key also for improved well-being post-COVID-19 [108]. In addition, our respondents in general did not consider green spaces as a place with risk of contagion and in this regard, Ma et al. [38] reported how the adaptative benefits of visiting nature may outweigh the risks when proper visitor management measures are implemented. In fact, other studies have shown how the risk of contagion outdoors is actually much less than indoors [109].
- 4.
- Extent to which the green space access was missed
Results highlighted that the majority of respondents missed going to a green space very much. The extent to which a green area was missed depended on the usual frequency of visitation before the pandemic, the gender (with women more influenced) and the distance of public green space visited before the pandemic, as if missing a green area was likely related to the actual scarce presence of favorite green spaces nearby. Again, this highlights the importance of equity in urban landscape planning. In simple words, the more greenery available, the more people would not miss anything-and the farther the green space, the more it is missed, as for social activities like those demonstrated by Schipperijn et al. [110]. Respondents confirmed their awareness about the services and benefits provided by green spaces even when we asked what they missed, as most thoughts were related to sensitiveness towards nature, meeting people and staying with the family in green spaces, all aspects that emphasize the importance of the quality green spaces beyond mere quantity.
We have noticed how the “nature” connected to green spaces was missed more by women. Roe et al. [111] showed that there may be a gender difference in perceiving nature as a coping mechanism as female stress levels were remarkably higher in areas of low green space compared to males, and Theodorou et al. [112] revealed that psychopathological distress from the pandemic through green spaces was higher for women and unmarried people. Hostetler & Noiseux [113] found how those spaces where residents can access nature close to home result in a variety of conservation, social, and health benefits. Thus, in the context of pandemic, when many people have lost access to many of their typical sources of socialization, UGS may serve as an important compensatory role in satisfying a variety of psychological needs [114].
5. Conclusions
The results of this study report useful information and suggestions for urban landscape planning of the city of Birjand and other cities in drylands. This is an arid city in the East of Iran that has developed according to an uncontrolled residential planning without enough attention to urban greening challenges. In addition, it also faces environmental challenges such as the lack of water and harsh climate that limit vegetation growth. Therefore, preparing adequate urban green spaces in an arid environment as a coping strategy against the pandemic might be very hard, but the study has demonstrated how important are green spaces in a time of limitation of movement due to restrictions against the spread of the pandemic, as they enhance positive feelings and reduce anxiety and stress, and allow different types of activities, especially linked to social aspects.
Private green spaces such as gardens and courtyards of single houses or condominium shared with neighbors represent the pocket greenery that allow moments of respite in time of pandemic. But, if private green spaces may convey a sense of safety, public green spaces are important for their social value.
Private green spaces mitigate the lack of public green spaces but in a way, they represent an unequal distribution of green areas access, that should be guaranteed to the whole community.
Women demonstrated high sensitiveness and appreciation towards public green spaces, as they likely take kids there-contact with nature is recognized as an important function, and appreciate the socialization, although in general, the perception of insecurity is greater than for men.
Therefore, some specific recommendation for urban and landscape planning in Birjand can be drawn. Firstly, the typology of compact residential development which has become the popular form of the neighborhoods must be integrated with existent and new green spaces. Although in Birjand it is hard to add large green spaces in many of neighborhoods, landscape planners can improve the existing pocket parks and strengthen linkages between nearby green spaces by creating green corridors and preserving the existing green spaces. A complete green network can ease walking for recreation and reduce inequality in green space distribution. In newly planned neighborhoods which are not in the city center and space is not a limiting factor, planners may consider balancing soil sealing with new green spaces. Secondly, promoting the quality of existing urban green spaces (e.g., natural value, biodiversity, security but also socialization) is a greening strategy for the city of Birjand. The findings emphasized that improving the quality of green space beyond quantity may play a role in provision of high-quality nature exposure for urban population in the time of pandemic as well as the key for improved well-being of urbanites post-COVID-19.
Thus, the Coronavirus pandemic has provided an opportunity for urban planners and landscape architects to reflect on the existent greenery and on how to adapt existing greening policies to the challenges of today and the future. Enhancing not only the quantity of green spaces but also their quality by targeting specific green functions which were highlighted by our respondents will improve the wellbeing and livability of the city.
The authors have made clear that this is an exploratory study and it does not claim to reflect the real situation. The obtained sample cannot be representative of the population and UGS users because the survey was not restricted to specific respondents and it was spread to people through a snowball effect. However, we believe that the sample is enough to provide the considerations we made without generalizing the results. In addition, we have provided a justification of the used methods and the limitations of such decision.
Supplementary Materials
The following are available online at https://www.mdpi.com/article/10.3390/land10101085/s1, Table S1. Area of different urban green space typologies in Birjand city, Table S2. Number and area of urban parks by districts, Table S3. Greenery class, price of land and preference for residency for the Birjand neighborhoods where respondents live, Table S4. Descriptive statistics of the sample, Table S5. Users of private green space per size of space and house typology, Table S6. Type of public green space within 300 m from home without/with presence of private green space, Table S7. Characteristics of visitation of public green spaces before the pandemic by users of public green spaces, Table S8. Difference in frequency (1), motivation (2) of visitation and benefits and services perception (3) regarding public green spaces by respondents without (No) and with (Yes) access to a private green space (pre and during the pandemic), Table S9. Frequency of visitation of public green spaces in relation to variables connected to the demographic and the presence of private green spaces, Table S10. Motivation (up to two choices) for visiting a public and private green space during the pandemic, Table S11. Aspects of private (left) and public (right) green space appreciated by respondents, in relationship to independent variables, Table S12. Missed things related to green spaces indicated by respondents, Table S13. What was missed by respondents (n = 394) in relation to demographic information and green space visitation before the pandemic, Survey: Use of green spaces during the pandemic by COVID-19 in Birjand.
Author Contributions
Conceptualization, M.R.K. and F.U.; methodology, M.R.K. and F.U.; formal analysis, F.U. and L.M.; investigation, M.R.K.; data curation, M.R.K. and F.U. and L.M.; writing—original draft preparation, M.R.K. and F.U.; writing—review and editing, M.R.K. and F.U. All authors have read and agreed to the published version of the manuscript.
Funding
This research received no external funding.
Institutional Review Board Statement
The study was conducted according to the guidelines of the 758 Declaration of Helsinki, and approved by the Research Ethics Committee of University of Birjand 759 (Approval ID: IR.BIRJAND.REC.1400.004; Approval Date: 23 August 2021).
Informed Consent Statement
Informed consent was obtained from all subjects involved in the study.
Conflicts of Interest
The authors declare no conflict of interest.
References
- Ugolini, F.; Massetti, L.; Calaza-Martínez, P.; Cariñanos, P.; Dobbs, C.; Ostoic, S.K.; Marin, A.M.; Pearlmutter, D.; Saaroni, H.; Šaulienė, I.; et al. Effects of the COVID-19 pandemic on the use and perceptions of urban green space: An international exploratory study. Urban For. Urban Green. 2020, 56, 126888. [Google Scholar] [CrossRef]
- Sandford, A. Coronavirus: Half of Humanity now on Lockdown as 90 Countries Call for Confinement. Available online: https://www.euronews.com/2020/04/02/coronavirus-in-europe-spain-s-death-toll-hits-10-000-after-record-950-new-deaths-in-24-hou (accessed on 24 May 2021).
- Fabisiak, B.; Jankowska, A.; Kłos, R. Attitudes of Polish seniors toward the use of public space during the first wave of the COVID-19 pandemic. Int. J. Environ. Res. Public Health 2020, 17, 8885. [Google Scholar] [CrossRef] [PubMed]
- Zhu, J.; Xu, C. Sina microblog sentiment in Beijing city parks as measure of demand for urban green space during the COVID-19. Urban For. Urban Green. 2021, 58, 126913. [Google Scholar] [CrossRef]
- Hamidi, S.; Zandiatashbar, A. Compact development and adherence to stay-at-home order during the COVID-19 pandemic: A longitudinal investigation in the United States. Landsc. Urban Plan. 2021, 205, 103952. [Google Scholar] [CrossRef] [PubMed]
- Meagher, B.R.; Cheadle, A.D. Distant from others, but close to home: The relationship between home attachment and mental health during COVID-19. J. Environ. Psychol. 2020, 72, 101516. [Google Scholar] [CrossRef]
- Yamazaki, T.; Iida, A.; Hino, K.; Murayama, A.; Hiroi, U.; Terada, T.; Koizumi, H.; Yokohari, M. Use of Urban Green Spaces in the Context of Lifestyle Changes during the COVID-19 Pandemic in Tokyo. Sustainability 2021, 13, 9817. [Google Scholar] [CrossRef]
- Geng, D.C.; Innes, J.; Wu, W.; Wang, G. Impacts of COVID-19 pandemic on urban park visitation: A global analysis. J. For. Res. 2021, 32, 553–567. [Google Scholar] [CrossRef]
- Lopez, B.; Kennedy, C.; Field, C.; Mcphearson, T. Who benefits from urban green spaces during times of crisis? Perception and use of urban green spaces in New York City during the COVID-19 pandemic. Urban For. Urban Green. 2021, 65, 127354. [Google Scholar] [CrossRef] [PubMed]
- da Schio, N.; Phillips, A.; Fransen, K.; Wolff, M.; Haase, D.; Ostoić, S.K.; De Vreese, R. The impact of the COVID-19 pandemic on the use of and attitudes towards urban forests and green spaces: Exploring the instigators of change in Belgium. Urban For. Urban Green. 2021, 65, 127305. [Google Scholar] [CrossRef]
- Mell, I.; Whitten, M. Access to nature in a post covid-19 world: Opportunities for green infrastructure financing, distribution and equitability in urban planning. Int. J. Environ. Res. Public Health 2021, 18, 1527. [Google Scholar] [CrossRef]
- Ye, Y.; Qiu, H. Using urban landscape pattern to understand and evaluate infectious disease risk. Urban For. Urban Green. 2021, 62, 127126. [Google Scholar] [CrossRef] [PubMed]
- Huerta Mayen, C.; Cafagna, G. Snapshot of the Use of Urban Green Spaces in Mexico City during the COVID-19 Pandemic: A Qualitative Study. Int. J. Environ. Res. Public Health 2021, 18, 4304. [Google Scholar] [CrossRef]
- Samuelsson, K.; Barthel, S.; Colding, J.; Macassa, G.; Giusti, M. Urban nature as a source of resilience during social distancing amidst the coronavirus pandemic. OSF Prepr. 2020. [Google Scholar] [CrossRef]
- Langemeyer, J.; Madrid-Lopez, C.; Mendoza Beltran, A.; Villalba Mendez, G. Urban agriculture—A necessary pathway towards urban resilience and global sustainability? Landsc. Urban Plan. 2021, 210, 104055. [Google Scholar] [CrossRef]
- Poortinga, W.; Bird, N.; Hallingberg, B.; Phillips, R.; Williams, D. The role of perceived public and private green space in subjective health and wellbeing during and after the first peak of the COVID-19 outbreak. Landsc. Urban Plan. 2021, 211, 104092. [Google Scholar] [CrossRef]
- Venter, Z.S.; Barton, D.N.; Gundersen, V.; Figari, H.; Nowell, M. Urban nature in a time of crisis: Recreational use of green space increases during the COVID-19 outbreak in Oslo, Norway. Environ. Res. Lett. 2020, 15, 104075. [Google Scholar] [CrossRef]
- Kaźmierczak, A. The contribution of local parks to neighbourhood social ties. Landsc. Urban Plan. 2013, 109, 31–44. [Google Scholar] [CrossRef]
- Wright Wendel, H.E.; Zarger, R.K.; Mihelcic, J.R. Accessibility and usability: Green space preferences, perceptions, and barriers in a rapidly urbanizing city in Latin America. Landsc. Urban Plan. 2012, 107, 272–282. [Google Scholar] [CrossRef]
- Rostami, R.; Lamit, H.; Khoshnava, S.M.; Rostami, R. Successful public places: A case study of historical Persian gardens. Urban For. Urban Green. 2016, 15, 211–224. [Google Scholar] [CrossRef]
- Wolf, I.D.; Wohlfart, T. Walking, hiking and running in parks: A multidisciplinary assessment of health and well-being benefits. Landsc. Urban Plan. 2014, 130, 89–103. [Google Scholar] [CrossRef]
- Wolch, J.R.; Byrne, J.; Newell, J.P. Urban green space, public health, and environmental justice: The challenge of making cities ‘just green enough’. Landsc. Urban Plan. 2014, 125, 234–244. [Google Scholar] [CrossRef] [Green Version]
- King, D.K.; Litt, J.; Hale, J.; Burniece, K.M.; Ross, C. ‘The park a tree built’: Evaluating how a park development project impacted where people play. Urban For. Urban Green. 2015, 14, 293–299. [Google Scholar] [CrossRef]
- Lee, A.C.K.; Maheswaran, R. The health benefits of urban green spaces: A review of the evidence. J. Public Health 2011, 33, 212–222. [Google Scholar] [CrossRef]
- Van den Berg, A.E.; Jorgensen, A.; Wilson, E.R. Evaluating restoration in urban green spaces: Does setting type make a difference? Landsc. Urban Plan. 2014, 127, 173–181. [Google Scholar] [CrossRef]
- Jones, R.; Tarter, R.; Ross, A.M. Greenspace interventions, stress and cortisol: A scoping review. Int. J. Environ. Res. Public Health 2021, 18, 2802. [Google Scholar] [CrossRef]
- Papangelis, G.; Tombrou, M.; Dandou, A.; Kontos, T. An urban “green planning” approach utilizing the Weather Research and Forecasting (WRF) modeling system. A case study of Athens, Greece. Landsc. Urban Plan. 2012, 105, 174–183. [Google Scholar] [CrossRef]
- Amani-Beni, M.; Zhang, B.; di Xie, G.; Xu, J. Impact of urban park’s tree, grass and waterbody on microclimate in hot summer days: A case study of Olympic Park in Beijing, China. Urban For. Urban Green. 2018, 32, 1–6. [Google Scholar] [CrossRef]
- Kuchcik, M.; Dudek, W.; Błażejczyk, K.; Milewski, P.; Błażejczyk, A. Two faces to the greenery on housing estates–mitigating climate but aggravating allergy. A Warsaw case study. Urban For. Urban Green. 2016, 16, 170–181. [Google Scholar] [CrossRef]
- Shanahan, D.F.; Lin, B.B.; Gaston, K.J.; Bush, R.; Fuller, R.A. Socio-economic inequalities in access to nature on public and private lands: A case study from Brisbane, Australia. Landsc. Urban Plan. 2014, 130, 14–23. [Google Scholar] [CrossRef]
- Gidlow, C.J.; Ellis, N.J.; Bostock, S. Development of the Neighbourhood Green Space Tool (NGST). Landsc. Urban Plan. 2012, 106, 347–358. [Google Scholar] [CrossRef]
- Bahrini, F.; Bell, S.; Mokhtarzadeh, S. Urban Forestry & Urban Greening The relationship between the distribution and use patterns of parks and their spatial accessibility at the city level: A case study from Tehran, Iran. Urban For. Urban Green. 2017, 27, 332–342. [Google Scholar] [CrossRef] [Green Version]
- Wei, F. Greener urbanization? Changing accessibility to parks in China. Landsc. Urban Plan. 2017, 157, 542–552. [Google Scholar] [CrossRef]
- Braubach, M.; Egorov, P.A.; Mudu, A.T.W. The effects of urban green space on environmental health equity and resilience to extreme weather. In Proceedings of the European Conference “Nature-Based Solutions to Climate Change in Urban Areas and Their Rural Surroundings“, Bonn, Germany, 17–19 November 2015; Kabisch, N., Stadler, J., Duffield, S., Korn, H., Bonn, A., Eds.; Bundesamt für Naturschutz (BfN): Bonn, Germany, 2015; pp. 63–65. [Google Scholar]
- Lin, B.B.; Gaston, K.J.; Fuller, R.A.; Wu, D.; Bush, R.; Shanahan, D.F. How green is your garden? Urban form and socio-demographic factors influence yard vegetation, visitation, and ecosystem service benefits. Landsc. Urban Plan. 2017, 157, 239–246. [Google Scholar] [CrossRef]
- Beumer, C. Show me your garden and I will tell you how sustainable you are: Dutch citizens’ perspectives on conserving biodiversity and promoting a sustainable urban living environment through domestic gardening. Urban For. Urban Green. 2018, 30, 260–279. [Google Scholar] [CrossRef]
- Taylor, J.R.; Lovell, S.T. Mapping public and private spaces of urban agriculture in Chicago through the analysis of high-resolution aerial images in Google Earth. Landsc. Urban Plan. 2012, 108, 57–70. [Google Scholar] [CrossRef]
- Ma, A.T.H.; Lam, T.W.L.; Cheung, L.T.O.; Fok, L. Protected areas as a space for pandemic disease adaptation: A case of COVID-19 in Hong Kong. Landsc. Urban Plan. 2021, 207, 103994. [Google Scholar] [CrossRef]
- Cunningham, G.B. Physical activity and its relationship with COVID-19 cases and deaths: Analysis of U.S. counties. J. Sport Health Sci. 2021. [Google Scholar] [CrossRef]
- Polero, P.; Rebollo-Seco, C.; Adsuar, J.C.; Pérez-Gómez, J.; Rojo-Ramos, J.; Manzano-Redondo, F.; Garcia-Gordillo, M.Á.; Carlos-Vivas, J. Physical Activity Recommendations during COVID-19: Narrative Review. Int. J. Environ. Res. Public Health 2020, 18, 65. [Google Scholar] [CrossRef]
- Filgueira, T.O.; Castoldi, A.; Santos, L.E.R.; de Amorim, G.J.; de Sousa Fernandes, M.S.; Anastácio, W. de L. do N.; Campos, E.Z.; Santos, T.M.; Souto, F.O. The Relevance of a Physical Active Lifestyle and Physical Fitness on Immune Defense: Mitigating Disease Burden, with Focus on COVID-19 Consequences. Front. Immunol. 2021, 12, 587146. [Google Scholar] [CrossRef]
- Sallis, R.; Young, D.R.; Tartof, S.Y.; Sallis, J.F.; Sall, J.; Li, Q.; Smith, G.N.; Cohen, D.A. Physical inactivity is associated with a higher risk for severe COVID-19 outcomes: A study in 48 440 adult patients. Br. J. Sports Med. 2021, 55, 1099–1105. [Google Scholar] [CrossRef]
- Mitra, R.; Moore, S.A.; Gillespie, M.; Faulkner, G.; Vanderloo, L.M.; Chulak-Bozzer, T.; Rhodes, R.E.; Brussoni, M.; Tremblay, M.S. Healthy movement behaviours in children and youth during the COVID-19 pandemic: Exploring the role of the neighbourhood environment. Heal. Place 2020, 65, 102418. [Google Scholar] [CrossRef] [PubMed]
- Puccinelli, P.J.; da Costa, T.S.; Seffrin, A.; de Lira, C.A.B.; Vancini, R.L.; Nikolaidis, P.T.; Knechtle, B.; Rosemann, T.; Hill, L.; Andrade, M.S. Reduced level of physical activity during COVID-19 pandemic is associated with depression and anxiety levels: An internet-based survey. BMC Public Health 2021, 21, 425. [Google Scholar] [CrossRef]
- Bereitschaft, B.; Scheller, D. How Might the COVID-19 Pandemic Affect 21st Century Urban Design, Planning, and Development? Urban Sci. 2020, 4, 56. [Google Scholar] [CrossRef]
- Sharifi, A.; Khavarian-Garmsir, A.R. The COVID-19 pandemic: Impacts on cities and major lessons for urban planning, design, and management. Sci. Total Environ. 2020, 749, 142391. [Google Scholar] [CrossRef] [PubMed]
- Barbarossa, L. The post pandemic city: Challenges and opportunities for a non-motorized urban environment. An overview of Italian cases. Sustainability 2020, 12, 7172. [Google Scholar] [CrossRef]
- Martínez, L.; Short, J.R. The pandemic city: Urban issues in the time of covid-19. Sustainability 2021, 13, 3295. [Google Scholar] [CrossRef]
- Sepe, M. Covid-19 pandemic and public spaces: Improving quality and flexibility for healthier places. URBAN Des. Int. 2021, 26, 159–173. [Google Scholar] [CrossRef]
- Rassouli, M.; Ashrafizadeh, H.; Shirinabadi Farahani, A.; Akbari, M.E. COVID-19 Management in Iran as One of the Most Affected Countries in the World: Advantages and Weaknesses. Front. Public Health 2020, 8, 2019–2021. [Google Scholar] [CrossRef]
- Abdoli, A. Iran, sanctions, and the COVID-19 crisis. J. Med. Econ. 2020, 23, 1461–1465. [Google Scholar] [CrossRef]
- Abdi, M.; Mirzaei, R. Iran without Mandatory Quarantine and with Social Distancing Strategy Against Coronavirus Disease (COVID-19). Health Secur. 2020, 18, 257–259. [Google Scholar] [CrossRef]
- Allahyari, H.; Salehi, E. Presentation of a suitable approach for green programming of urban ways through integrative method CA-Markov: Case study—Azadi Street of Tehran, Iran. Model. Earth Syst. Environ. 2020, 6, 373–382. [Google Scholar] [CrossRef] [Green Version]
- Ali asghar Pilehvar Spatial-geographical analysis of urbanization in Iran. Humanit. Soc. Sci. Commun. 2021, 8, 63. [CrossRef]
- Kiani, A.; Javadiyan, M.; Pasban, V. Evaluation of Urban Green Spaces and their Impact on Living Quality of Citizens (Case Study: Nehbandan City, Iran). J. Civ. Eng. Urban. 2014, 4, 89–95. [Google Scholar]
- Bahriny, F.; Bell, S. Patterns of urban park use and their relationship to factors of quality: A case study of tehran, Iran. Sustain. 2020, 12, 1560. [Google Scholar] [CrossRef] [Green Version]
- Fasihi, H. Urban Parks and Their Accessibility in Tehran, Iran. Environ. Justice 2019, 12, 242–249. [Google Scholar] [CrossRef] [Green Version]
- Naseh, M.A. Birjand Local History at Early Contemporary Period; Naseh, M.A., Ed.; Institute for Iranian Contemporary Historical Studies: Tehran, Iran, 2016; ISBN 9789642834778. [Google Scholar]
- Zista, A. Master Plan of Birjand City; U.C.E.: Birjand, Iran, 2020. [Google Scholar]
- Shokouhi, M.A.; Eskandari Sani, M.; Mohammadabadi, J. Strategic planning of Birjand city development with SWOT and QSPM models. Khorasan Socio-Cultural Stud. 2016, 11, 105–125. [Google Scholar]
- Aram, F.; Higueras García, E.; Solgi, E.; Mansournia, S. Urban green space cooling effect in cities. Heliyon 2019, 5, e01339. [Google Scholar] [CrossRef] [Green Version]
- Javid, M.A. Atlas of Birjand Spatial Divisions, 1st ed.; Fakhimzadeh, H., Ed.; Municipality of Birjand: Birjand, Iran, 2020. [Google Scholar]
- Vargas-Hernández, J.G.; Pallagst, K.; Zdunek-Wielgołaska, J. Urban Green Spaces as a Component of an Ecosystem. In Handbook of Engaged Sustainability; Dhiman, S., Ed.; Springer International Publishing: Cham, Switzerland, 2018; pp. 1–32. ISBN 978-3-319-53121-2. [Google Scholar]
- Carpentieri, G.; Guida, C.; Fevola, O.; Sgambati, S. The Covid-19 pandemic from the elderly perspective in urban areas: An evaluation of urban green areas in ten European capitals. TeMA-J. Land Use Mobil. Environ. 2020, 13, 389–408. [Google Scholar]
- Rice, L. After Covid-19: Urban design as spatial medicine. URBAN Des. Int. 2020. [Google Scholar] [CrossRef]
- Roe, M. Editorial: Food and landscape. Landsc. Res. 2016, 41, 709–713. [Google Scholar] [CrossRef]
- Uchiyama, Y.; Kohsaka, R. Access and use of green areas during the covid-19 pandemic: Green infrastructure management in the “new normal”. Sustainability 2020, 12, 9842. [Google Scholar] [CrossRef]
- Pamukcu-Albers, P.; Ugolini, F.; La Rosa, D.; Grădinaru, S.R.; Azevedo, J.C.; Wu, J. Building green infrastructure to enhance urban resilience to climate change and pandemics. Landsc. Ecol. 2021, 36, 665–673. [Google Scholar] [CrossRef] [PubMed]
- Cobbinah, P.B.; Erdiaw-Kwasie, M.; Adams, E.A. COVID-19: Can it transform urban planning in Africa? Cities Health 2020, 1–4. [Google Scholar] [CrossRef]
- Hootsuite 2021. Available online: https://datareportal.com/reports/digital-2021-iran (accessed on 24 May 2021).
- Zista, A. Master Plan of Birjand City; U.C.E.: Birjand, Iran, 1997. [Google Scholar]
- Ebrahimzadeh, A. Birjand Parks and Green Space Organization. 2017. Available online: http://birjandpark.ir/index.php/info/tables (accessed on 10 January 2021).
- Lu, Y.; Zhao, J.; Wu, X.; Lo, S.M. Escaping to nature during a pandemic: A natural experiment in Asian cities during the COVID-19 pandemic with big social media data. Sci. Total Environ. 2021, 777, 146092. [Google Scholar] [CrossRef]
- Sivak, C.J.; Pearson, A.L.; Hurlburt, P. Effects of vacant lots on human health: A systematic review of the evidence. Landsc. Urban Plan. 2021, 208, 104020. [Google Scholar] [CrossRef]
- WHO. Urban Planning, Environment and Health: From Evidence to Policy Action—Meeting Report. World Health Organization, 2010; p. 119. Available online: https://www.euro.who.int/__data/assets/pdf_file/0004/114448/E93987.pdf (accessed on 24 May 2021).
- Dong, N.; Chen, J.; Zhang, S. Safety Research of Children’s Recreational Space in Shanghai Urban Parks. Procedia Eng. 2017, 198, 612–621. [Google Scholar] [CrossRef]
- Groenewegen, P.P.; van den Berg, A.E.; Maas, J.; Verheij, R.A.; de Vries, S. Is a Green Residential Environment Better for Health? If So, Why? Ann. Assoc. Am. Geogr. 2012, 102, 996–1003. [Google Scholar] [CrossRef]
- Carver, A.; Lorenzon, A.; Veitch, J.; Macleod, A.; Sugiyama, T. Is greenery associated with mental health among residents of aged care facilities? A systematic search and narrative review. Aging Ment. Health 2020, 24, 1–7. [Google Scholar] [CrossRef]
- Massetti, L.; Petralli, M.; Napoli, M.; Brandani, G.; Orlandini, S.; Pearlmutter, D. Effects of deciduous shade trees on surface temperature and pedestrian thermal stress during summer and autumn. Int. J. Biometeorol. 2019, 63, 467–479. [Google Scholar] [CrossRef]
- Säumel, I.; Hogrefe, J.; Battisti, L.; Wachtel, T.; Larcher, F. The healthy green living room at one’s doorstep? Use and perception of residential greenery in Berlin, Germany. Urban For. Urban Green. 2021, 58, 126949. [Google Scholar] [CrossRef]
- Szczepańska, A.; Pietrzyka, K. The COVID-19 epidemic in Poland and its influence on the quality of life of university students (young adults) in the context of restricted access to public spaces. J. Public Health 2021, 7, 1–11. [Google Scholar] [CrossRef]
- Flouri, E.; Midouhas, E.; Joshi, H. The role of urban neighbourhood green space in children’s emotional and behavioural resilience. J. Environ. Psychol. 2014, 40, 179–186. [Google Scholar] [CrossRef] [Green Version]
- Xie, J.; Luo, S.; Furuya, K.; Sun, D. Urban parks as green buffers during the COVID-19 pandemic. Sustainability 2020, 12, 6751. [Google Scholar] [CrossRef]
- Chen, J.; Chang, Z. Rethinking urban green space accessibility: Evaluating and optimizing public transportation system through social network analysis in megacities. Landsc. Urban Plan. 2015, 143, 150–159. [Google Scholar] [CrossRef]
- Zhang, H.; Chen, B.; Sun, Z.; Bao, Z. Landscape perception and recreation needs in urban green space in Fuyang, Hangzhou, China. Urban For. Urban Green. 2013, 12, 44–52. [Google Scholar] [CrossRef]
- Gong, L.; Mao, B.; Qi, Y.; Xu, C. A satisfaction analysis of the infrastructure of country parks in Beijing. Urban For. Urban Green. 2015, 14, 480–489. [Google Scholar] [CrossRef]
- Wen, C.; Albert, C.; Von Haaren, C. Equality in access to urban green spaces: A case study in Hannover, Germany, with a focus on the elderly population. Urban For. Urban Green. 2020, 55, 126820. [Google Scholar] [CrossRef]
- Lennon, M. Green space and the compact city: Planning issues for a ‘new normal’. Cities Health 2020, 1–4. [Google Scholar] [CrossRef]
- Grinde, B.; Patil, G.G. Biophilia: Does visual contact with nature impact on health and well-being? Int. J. Environ. Res. Public Health 2009, 6, 2332–2343. [Google Scholar] [CrossRef] [PubMed] [Green Version]
- Ugolini, F.; Massetti, L.; Pearlmutter, D.; Sanesi, G. Usage of urban green space and related feelings of deprivation during the COVID-19 lockdown: Lessons learned from an Italian case study. Land Use Policy 2021, 105, 105437. [Google Scholar] [CrossRef]
- Ulrich, R. View through a window may influence recovery from surgery. Science 1984, 224, 420–421. [Google Scholar] [CrossRef] [PubMed] [Green Version]
- Gilchrist, K.; Brown, C.; Montarzino, A. Workplace settings and wellbeing: Greenspace use and views contribute to employee wellbeing at peri-urban business sites. Landsc. Urban Plan. 2015, 138, 32–40. [Google Scholar] [CrossRef]
- Birge, D.; Mandhan, S.; Qiu, W.; Berger, A.M. Potential for sustainable use of trees in hot arid regions: A case study of Emirati neighborhoods in Abu Dhabi. Landsc. Urban Plan. 2019, 190, 103577. [Google Scholar] [CrossRef]
- Chalmin-Pui, L.S.; Roe, J.; Griffiths, A.; Smyth, N.; Heaton, T.; Clayden, A.; Cameron, R. “It made me feel brighter in myself”—The health and well-being impacts of a residential front garden horticultural intervention. Landsc. Urban Plan. 2021, 205, 103958. [Google Scholar] [CrossRef]
- Seidl, M.; Saifane, M. A green intensity index to better assess the multiple functions of urban vegetation with an application to Paris metropolitan area. Environ. Dev. Sustain. 2021, 23, 15204–15224. [Google Scholar] [CrossRef]
- Irvine, K.N.; Fuller, R.A.; Devine-Wright, P.; Tratalos, J.; Payne, S.R.; Warren, P.H.; Lomas, K.J.; Gaston, K.J. Ecological and Psychological Value of Urban Green Space. In Dimensions of the Sustainable City. Future City; Jenks, M., Jones, C., Eds.; Springer: Dordrecht, The Netherlands, 2010; Volume 2, pp. 215–237. [Google Scholar] [CrossRef]
- Chang, C.-R.; Chen, M.-C.; Su, M.-H. Natural versus human drivers of plant diversity in urban parks and the anthropogenic species-area hypotheses. Landsc. Urban Plan. 2021, 208, 104023. [Google Scholar] [CrossRef]
- Carrus, G.; Scopelliti, M.; Lafortezza, R.; Colangelo, G.; Ferrini, F.; Salbitano, F.; Agrimi, M.; Portoghesi, L.; Semenzato, P.; Sanesi, G. Go greener, feel better? The positive effects of biodiversity on the well-being of individuals visiting urban and peri-urban green areas. Landsc. Urban Plan. 2015, 134, 221–228. [Google Scholar] [CrossRef]
- Marselle, M.R.; Irvine, K.N.; Lorenzo-Arribas, A.; Warber, S.L. Does perceived restorativeness mediate the effects of perceived biodiversity and perceived naturalness on emotional well-being following group walks in nature? J. Environ. Psychol. 2016, 46, 217–232. [Google Scholar] [CrossRef] [Green Version]
- Henwood, K.; Pidgeon, N. Talk about woods and trees: Threat of urbanization, stability, and biodiversity. J. Environ. Psychol. 2001, 21, 125–147. [Google Scholar] [CrossRef]
- Harvey, D.J.; Montgomery, L.N.; Harvey, H.; Hall, F.; Gange, A.C.; Watling, D. Psychological benefits of a biodiversity-focussed outdoor learning program for primary school children. J. Environ. Psychol. 2020, 67, 101381. [Google Scholar] [CrossRef]
- Hadavi, S.; Kaplan, R.; Hunter, M.C.R. Environmental affordances: A practical approach for design of nearby outdoor settings in urban residential areas. Landsc. Urban Plan. 2015, 134, 19–32. [Google Scholar] [CrossRef]
- Mouratidis, K.; Poortinga, W. Built environment, urban vitality and social cohesion: Do vibrant neighborhoods foster strong communities? Landsc. Urban Plan. 2020, 204, 103951. [Google Scholar] [CrossRef]
- Pham, T.T.H.; Labbé, D.; Lachapelle, U.; Pelletier, É. Perception of park access and park use amongst youth in Hanoi: How cultural and local context matters. Landsc. Urban Plan. 2019, 189, 156–165. [Google Scholar] [CrossRef]
- Cameron-Faulkner, T.; Melville, J.; Gattis, M. Responding to nature: Natural environments improve parent-child communication. J. Environ. Psychol. 2018, 59, 9–15. [Google Scholar] [CrossRef]
- Zhang, L.; Tan, P.Y.; Diehl, J.A. A conceptual framework for studying urban green spaces effects on health. J. Urban Ecol. 2017, 3, 1–13. [Google Scholar] [CrossRef] [Green Version]
- Putra, I.G.N.E.; Astell-Burt, T.; Cliff, D.P.; Vella, S.A.; Feng, X. Association between caregiver perceived green space quality and the development of prosocial behaviour from childhood to adolescence: Latent class trajectory and multilevel longitudinal analyses of Australian children over 10 years. J. Environ. Psychol. 2021, 74, 101579. [Google Scholar] [CrossRef]
- Olszewska-Guizzo, A.; Fogel, A.; Escoffier, N.; Ho, R. Effects of COVID-19-related stay-at-home order on neuropsychophysiological response to urban spaces: Beneficial role of exposure to nature? J. Environ. Psychol. 2021, 75, 101590. [Google Scholar] [CrossRef]
- Bulfone, T.C.; Malekinejad, M.; Rutherford, G.W.; Razani, N. Outdoor Transmission of SARS-CoV-2 and Other Respiratory Viruses: A Systematic Review. J. Infect. Dis. 2021, 223, 550–561. [Google Scholar] [CrossRef]
- Schipperijn, J.; Ekholm, O.; Stigsdotter, U.K.; Toftager, M.; Bentsen, P.; Kamper-Jørgensen, F.; Randrup, T.B. Factors influencing the use of green space: Results from a Danish national representative survey. Landsc. Urban Plan. 2010, 95, 130–137. [Google Scholar] [CrossRef]
- Roe, J.J.; Ward Thompson, C.; Aspinall, P.A.; Brewer, M.J.; Duff, E.I.; Miller, D.; Mitchell, R.; Clow, A. Green space and stress: Evidence from cortisol measures in deprived urban communities. Int. J. Environ. Res. Public Health 2013, 10, 4086–4103. [Google Scholar] [CrossRef] [PubMed] [Green Version]
- Theodorou, A.; Panno, A.; Carrus, G.; Carbone, G.A.; Massullo, C.; Imperatori, C. Stay home, stay safe, stay green: The role of gardening activities on mental health during the Covid-19 home confinement. Urban For. Urban Green. 2021, 61, 127091. [Google Scholar] [CrossRef]
- Hostetler, M.; Noiseux, K. Are green residential developments attracting environmentally savvy homeowners? Landsc. Urban Plan. 2010, 94, 234–243. [Google Scholar] [CrossRef]
- Keefer, L.A.; Landau, M.J.; Rothschild, Z.K.; Sullivan, D. Attachment to objects as compensation for close others’ perceived unreliability. J. Exp. Soc. Psychol. 2012, 48, 912–917. [Google Scholar] [CrossRef]
Figure 1.
Map of Birjand, old town (grey), urban expansion (light yellow), parks and green spaces (dark green), and planned green spaces (light green) [61].
Figure 1.
Map of Birjand, old town (grey), urban expansion (light yellow), parks and green spaces (dark green), and planned green spaces (light green) [61].
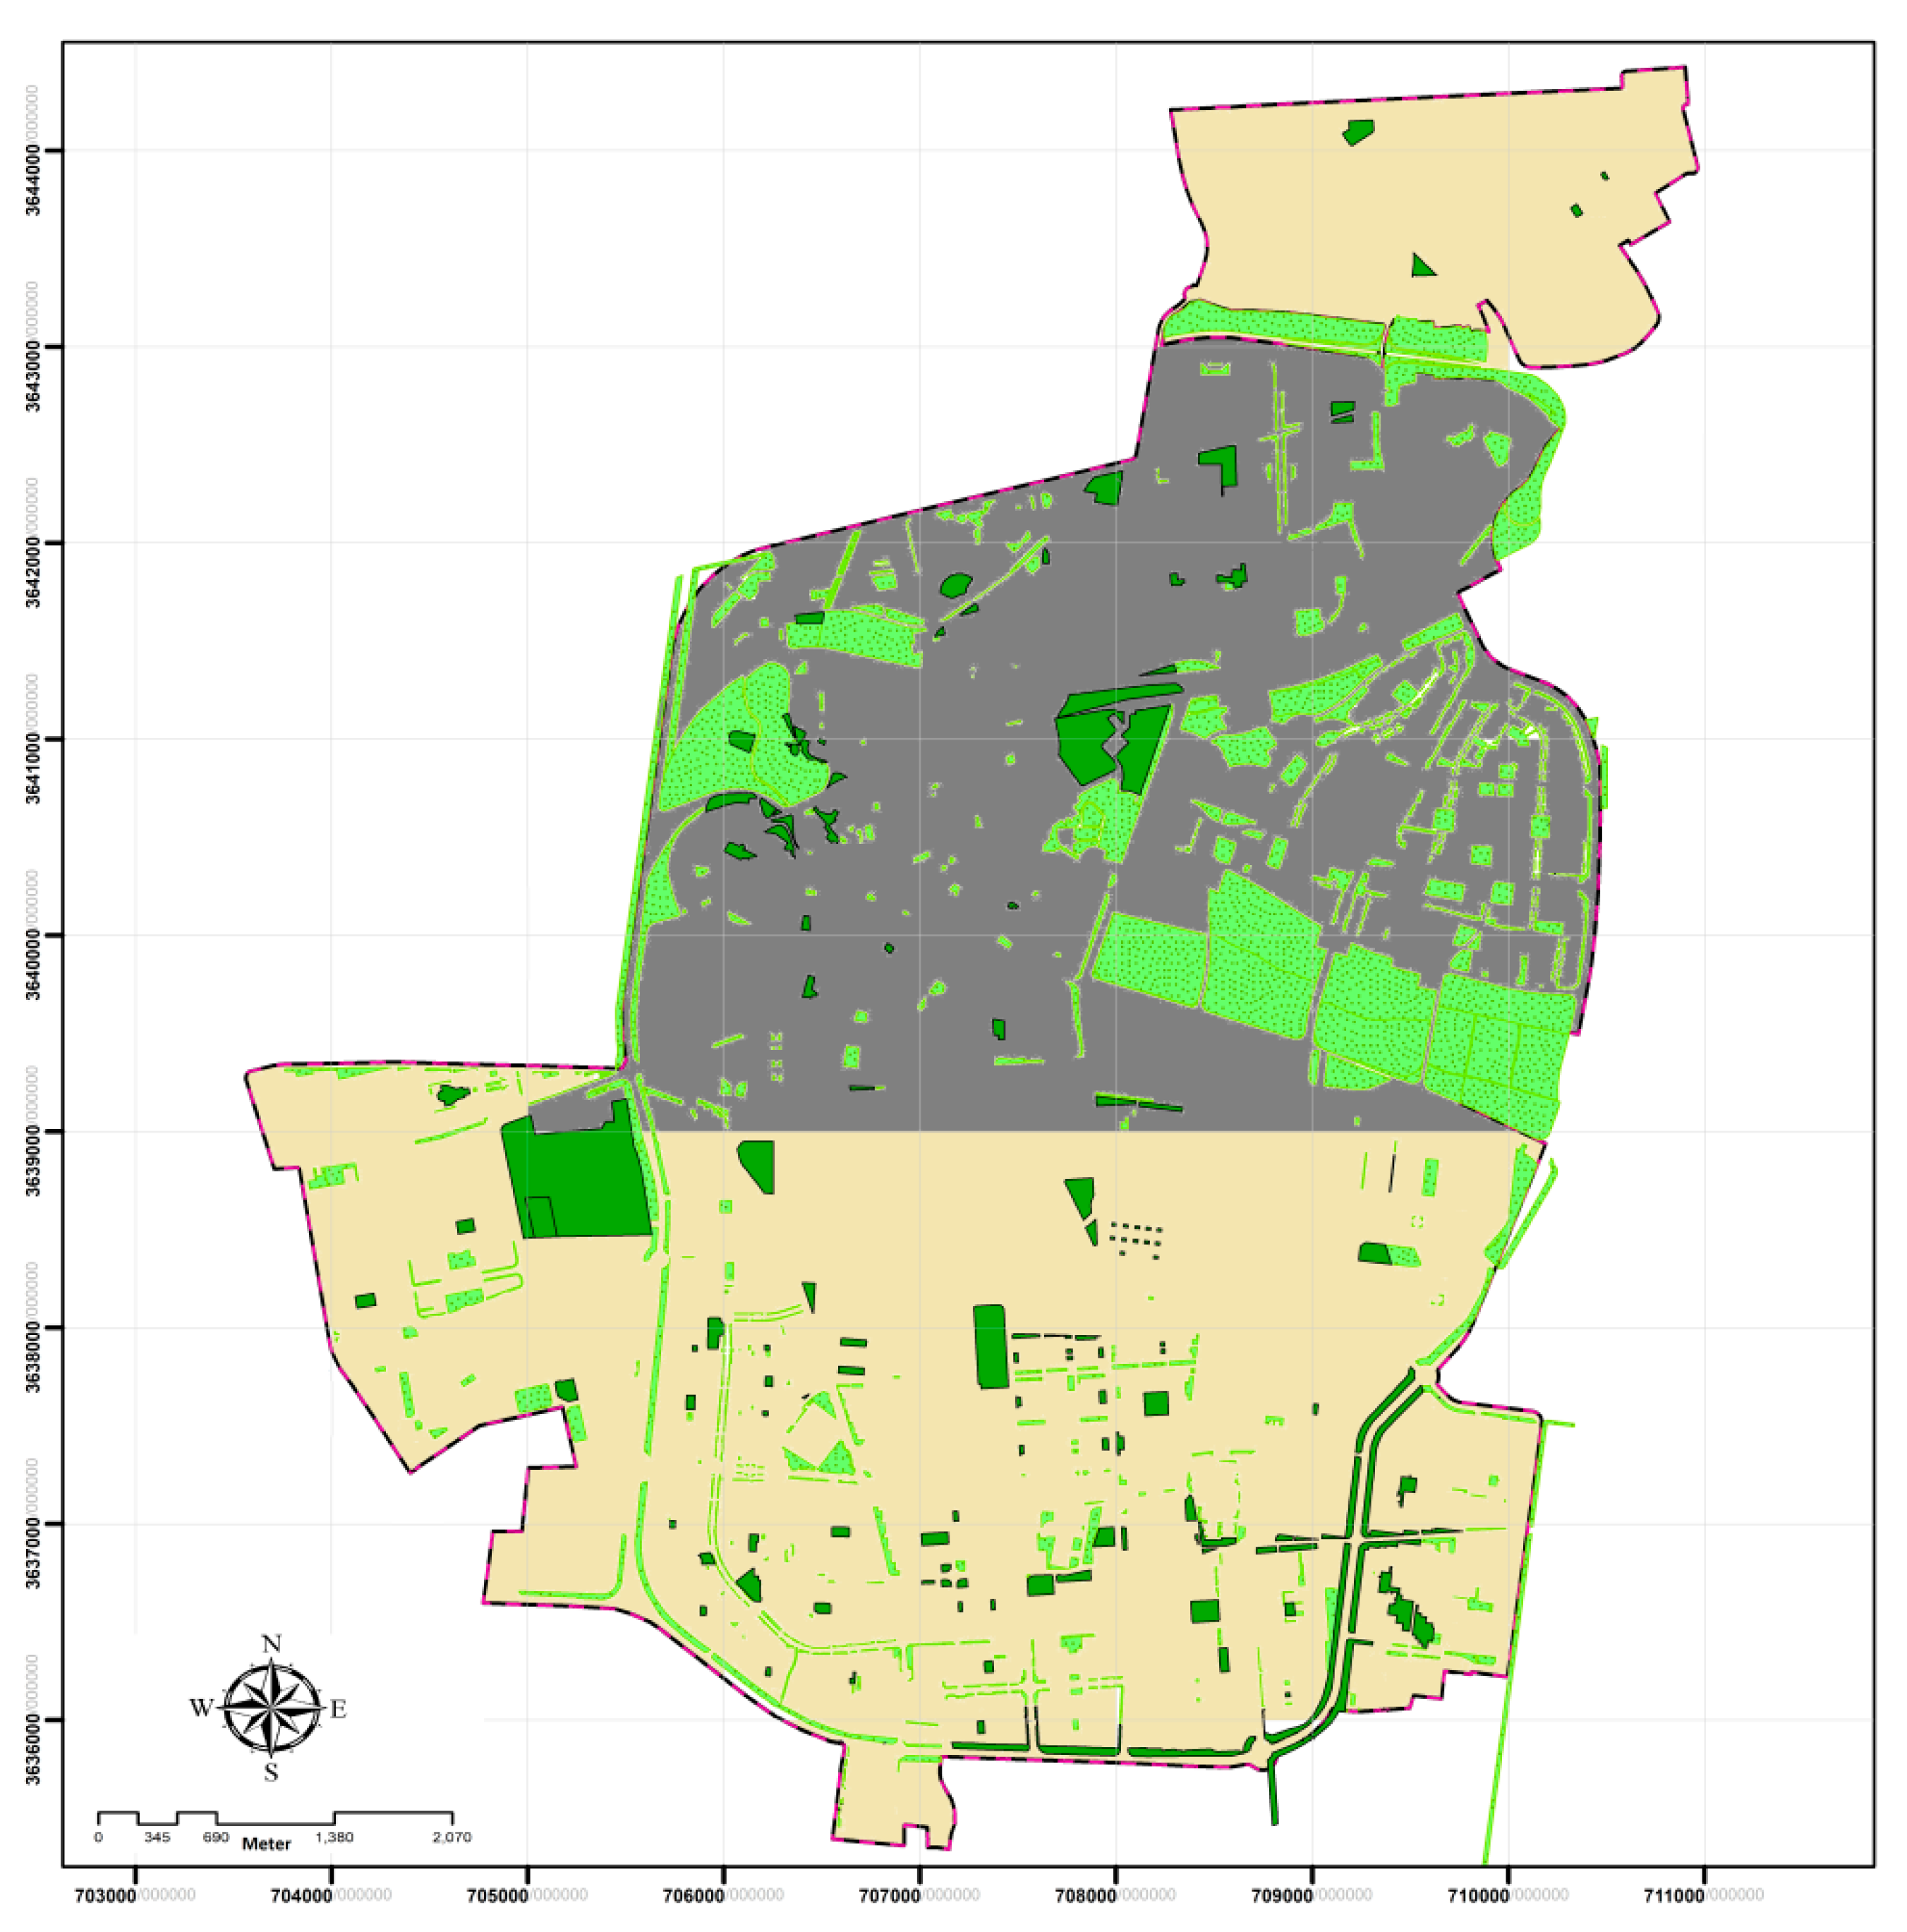
Figure 2.
Photos of cityscape (a,b), city parks (c,d), district parks (e,f), neighborhood parks (g,h) and private large (i) and small (j) courtyards in Birjand.
Figure 2.
Photos of cityscape (a,b), city parks (c,d), district parks (e,f), neighborhood parks (g,h) and private large (i) and small (j) courtyards in Birjand.


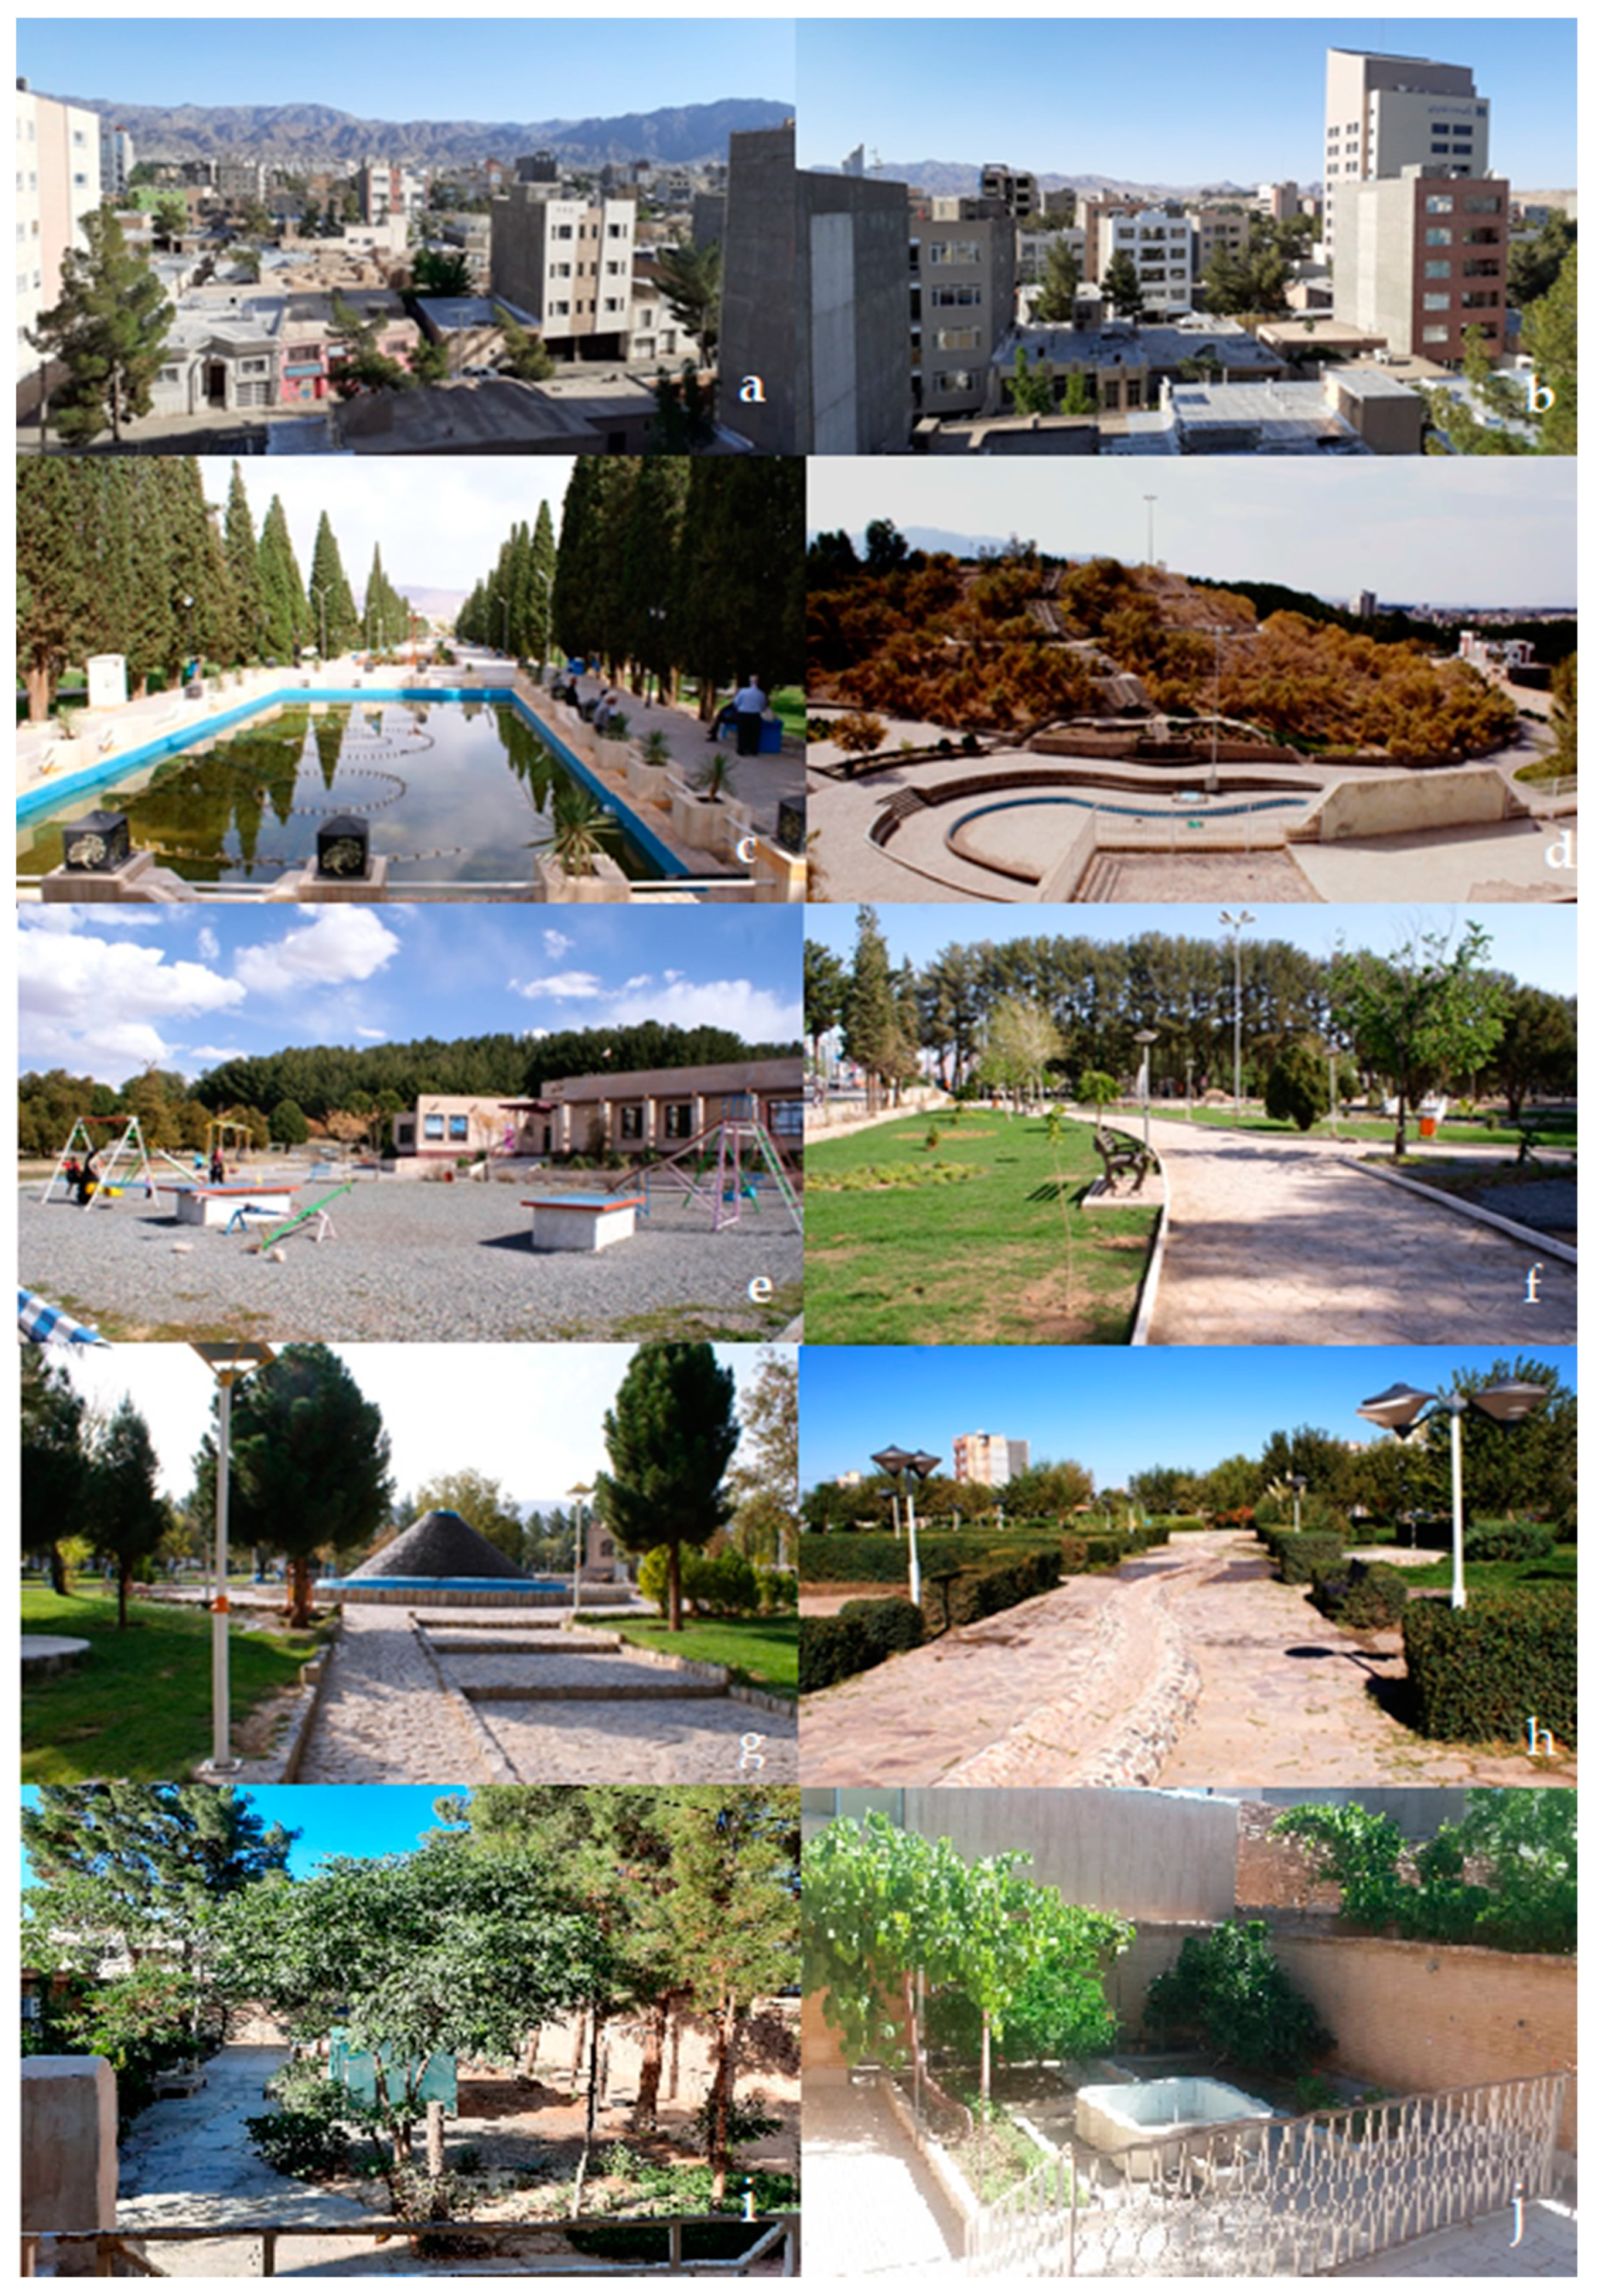
Table 1.
Frequency (1) and motivation (2) of visitation of public green spaces (n = 379 respondents, upper part in each block) and private green spaces (n = 209 respondents, lower part in each block) before and during the pandemic.
Table 1.
Frequency (1) and motivation (2) of visitation of public green spaces (n = 379 respondents, upper part in each block) and private green spaces (n = 209 respondents, lower part in each block) before and during the pandemic.
| Pre-Pandemic | During the Pandemic | |||||
|---|---|---|---|---|---|---|
| (1) Frequency of visitation | Count | Percentage | Count | Percentage | p-value | |
| Public green space | Every day | 33 | 9% | 14 | 4% | ** |
| More than once a week | 97 | 26% | 25 | 6% | *** | |
| Several times a month | 117 | 31% | 33 | 8% | *** | |
| Once a month | 74 | 19% | 37 | 9% | *** | |
| Less than once a month | 58 | 15% | 122 | 31% | *** | |
| Never | 15 | 4% | 164 | 42% | *** | |
| Total | 394 | 100% | 394 | 100% | ||
| Private green space | Every day | 58 | 28% | 41 | 20% | * |
| More than once a week | 50 | 24% | 45 | 22% | ns | |
| Several times a month | 45 | 22% | 46 | 22% | ns | |
| Once a month | 18 | 9% | 21 | 10% | ns | |
| Less than once a month | 31 | 15% | 35 | 17% | ns | |
| Never | 7 | 3% | 21 | 10% | ** | |
| Total | 209 | 100% | 209 | 100% | ||
| (2) Motivation of visitation a | ||||||
| Public green space | Gardening | 3 | 0.5% | 2 | 1% | ns |
| Meeting people | 34 | 5% | 38 | 10% | ** | |
| Observing nature | 110 | 17% | 61 | 16% | ns | |
| Passing through it | 35 | 5% | 43 | 11% | *** | |
| Physical exercise | 31 | 5% | 23 | 6% | ns | |
| Reading | 3 | 0.5% | 1 | 0% | ns | |
| Relaxing | 52 | 8% | 14 | 4% | ** | |
| Staying outdoors | 32 | 5% | 39 | 10% | *** | |
| Taking the dog out | 0 | 0% | 0 | 0.0% | - | |
| Taking the kids outdoor | 185 | 28% | 56 | 15% | *** | |
| Walking | 175 | 26% | 105 | 27% | ns | |
| Total | 660 | 100.0% | 382 | 100% | ||
| Private green space | Gardening | 45 | 13% | 30 | 6% | *** |
| Meeting people | 2 | 1% | 21 | 4% | *** | |
| Observing nature | 46 | 13% | 97 | 19% | * | |
| Passing through it else | 41 | 12% | 37 | 7% | * | |
| Physical exercise | 13 | 4% | 24 | 5% | ns | |
| Reading | 12 | 3% | 7 | 1% | * | |
| Relaxing | 65 | 19% | 82 | 16% | ns | |
| Staying outdoors | 75 | 21% | 76 | 15% | * | |
| Taking the dog out | 0 | 0% | 1 | 0% | - | |
| Taking the kids outdoor | 39 | 11% | 97 | 19% | *** | |
| Walking | 13 | 4% | 38 | 8% | * | |
| Total | 351 | 100% | 510 | 100% | ||
The Chi Square goodness of fit test was used to compare the items between pre- and during pandemic at p < 0.05. Significant differences are showed with * at p < 0.05; ** at p < 0.01; *** at p < 0.001; “ns” for non-significant differences. a Respondents could select up to two choices among the given options.
Table 2.
Feelings of people who visited a public (upper part) or a private (lower part) green space.
Table 2.
Feelings of people who visited a public (upper part) or a private (lower part) green space.
| Happy | Pleased | Excited (Ecstatic) | Physically Energetic | Anxious | Nervous | Tense | Frightened | Irritated | Upset | Depressed | Blue | ||
|---|---|---|---|---|---|---|---|---|---|---|---|---|---|
| Public green spaces (n = 231) | More | 65% | 59% | 31% | 57% | 24% * | 11% | 10% | 13% * | 22% | 10% | 9% | 10% |
| No change | 17% | 22% | 36% | 23% | 21% | 25% | 27% | 30% | 27% | 28% | 27% | 25% | |
| Less | 19% | 19% | 33% | 20% | 54% | 63% | 63% | 57% | 50% | 62% | 65% | 65% | |
| Avg. | 3.5 | 3.4 | 2.9 | 3.4 | 2.5 | 2.2 | 2.2 | 2.3 | 2.6 | 2.3 | 2.1 | 2.1 | |
| Private green spaces (n = 188) | More | 65% | 62% | 28% | 55% | 14%* | 11% | 15% | 4% * | 14% | 14% | 12% | 10% |
| No change | 17% | 19% | 43% | 25% | 19% | 23% | 17% | 30% | 26% | 17% | 21% | 19% | |
| Less | 18% | 19% | 29% | 20% | 66% | 66% | 68% | 65% | 60% | 69% | 67% | 71% | |
| Avg. | 3.6 | 3.5 | 2.9 | 3.4 | 2.1 | 2.1 | 2.1 | 2.0 | 2.3 | 2.1 | 2.1 | 2.0 |
Percentages are reported for each point of the Likert scale and the weighted average (avg) is calculated associating each point a score (1 = Much less; Less = 2; 3 = No change; 4 = More; 5 = Much more). The percentages of the positive scores (much more and more) and the negative scores (less, much less) were added. The Chi Square goodness of fit test was used to compare the feeling in the two types of green spaces at p < 0.05. Significant differences are showed with * at p < 0.05; ** at p < 0.01; *** at p < 0.001; ns for non-significant differences.
Table 3.
Feelings in a private (left) or public (right) green space in relation to some independent variables.
Table 3.
Feelings in a private (left) or public (right) green space in relation to some independent variables.
| Private Green Space (n = 209) | Public Green Space (n = 231) | |||||||
|---|---|---|---|---|---|---|---|---|
| b | Std. Err. | p-Value | b | Std. Err. | p-Value | |||
| Happy | Intercept | 3.101 | 0.252 | 0.000 | ||||
| Greenery class a | 0.087 | 0.029 | 0.003 | |||||
| Price of urban lands a | −0.076 | 0.037 | 0.038 | |||||
| Pleased | Intercept | 3.048 | 0.225 | 0.000 | ||||
| Greenery class a | 0.078 | 0.030 | 0.010 | |||||
| Price of urban lands a | −0.096 | 0.037 | 0.010 | |||||
| Excited (ecstatic) | Intercept | 2.165 | 0.367 | 0.000 | ||||
| Education | 0.417 | 0.102 | 0.000 | |||||
| Age | −0.210 | 0.060 | 0.001 | |||||
| Physically energetic | Intercept | 2.526 | 0.449 | 0.000 | ||||
| Greenery class a | 0.072 | 0.035 | 0.042 | |||||
| Anxious | Intercept | 3.116 | 0.300 | 0.000 | Intercept | 2.460 | 0.247 | 0.000 |
| Visit frequency of private green space during pandemic | −0.119 | 0.048 | 0.014 | Preferred for a residency | 0.606 | 0.282 | 0.033 | |
| Preferred for residency a | 0.428 a | 0.212 | 0.045 | Student | 0.446 | 0.182 | 0.015 | |
| Nervous | Intercept | 1.970 | 0.376 | 0.000 | Intercept | 2.375 | 0.394 | 0.000 |
| Age | −0.123 | 0.057 | 0.031 | Preferred for residency a | 0.665 | 0.252 | 0.009 | |
| Male | 0.344 | 0.126 | 0.007 | Greenery class a | −0.069 | 0.034 | 0.042 | |
| Employee | −0.271 | 0.135 | 0.046 | Price of urban lands a | −0.533 | 0.240 | 0.027 | |
| Tense | Intercept | 1.937 | 0.395 | 0.000 | ||||
| Male | 0.344 | 0.132 | 0.010 | |||||
| Employee | −0.307 | 0.142 | 0.031 | |||||
| Price of urban lands a | 0.081 | 0.040 | 0.045 | |||||
| Greenery class a | −0.063 | 0.032 | 0.049 | |||||
| Upset | Intercept | 2.190 | 0.197 | 0.000 | Intercept | 2.536 | 0.214 | 0.000 |
| Student | 0.364 | 0.148 | 0.015 | Preferred for residency a | 0.120 | 0.045 | 0.009 | |
| Greenery class a | −0.079 | 0.031 | 0.011 | Greenery class a | −0.086 | 0.034 | 0.012 | |
| Preferred for residency a | 0.100 | 0.041 | 0.015 | |||||
| Frightened | Intercept | 2.518 | 0.269 | 0.000 | Intercept | 2.834 | 0.275 | 0.000 |
| Preferred for residency a | 0.097 | 0.038 | 0.011 | Age | −0.143 | 0.059 | 0.017 | |
| Male | 0.249 | 0.119 | 0.037 | |||||
| Depressed | Intercept | 2.128 | 0.424 | 0.000 | Intercept | 2.406 | 0.245 | 0.000 |
| Male | 0.343 | 0.127 | 0.007 | Preferred for residency a | 0.122 | 0.044 | 0.006 | |
| Price of urban lands a | 0.090 | 0.039 | 0.020 | |||||
| Greenery class a | −0.085 | 0.031 | 0.006 | |||||
| Blue | Intercept | 1.941 | 0.416 | 0.000 | ||||
| Male | 0.265 | 0.123 | 0.032 | |||||
| Greenery class a | −0.087 | 0.030 | 0.004 | |||||
| Employee | −0.322 | 0.131 | 0.015 | |||||
a for this variable, the higher the class the smaller the value (for instance, class 1 means greater green surface per capita/higher price of the land/most preferred area; class 7 means smaller green surface per capita/cheapest price of the land/least preferred area for residency). Male was the reference (=1), b: non-standardized beta coefficient, Std. Err.: standard error of b; p-value: statistical significance. Only statistically significant results are shown.
Table 4.
To which extent ecosystem services and management aspects of public (top) and private (bottom) green spaces are appreciated by respondents.
Table 4.
To which extent ecosystem services and management aspects of public (top) and private (bottom) green spaces are appreciated by respondents.
| Natural Value | Biodiversity | Clean Air | Comfortable Climate | Quiet/Freedom from Noise | Proximity | Cleanness | Privacy | Socialization | Security from Bad People | Safety from Contagion | ||
|---|---|---|---|---|---|---|---|---|---|---|---|---|
| Public green space (n = 231) | Appreciated | 92% | 84% | 97% | 95% | 83% | 62% | 94% | 68% | 73% | 86% | 83% |
| Avg. | 3.5 | 3.3 | 3.6 | 3.6 | 3.3 | 2.8 | 3.6 | 3.0 | 3.0 | 3.4 | 3.3 | |
| Private green space (n = 183) | Appreciated | 86% | 73% | 93% | 94% | 86% | 49% | 90% | 93% | 45% | 84% | 84% |
| Avg. | 3.3 | 3.0 | 3.6 | 3.6 | 3.3 | 2.5 | 3.4 | 3.4 | 2.5 | 3.3 | 3.3 | |
| p value | ** | *** | ns | ns | ns | ** | * | *** | *** | ns | ns |
Percentages represent the sum of positive appreciation (very much appreciated and appreciated) of each item related to public (upper rows) and private (lower rows) green spaces, the latter evaluated by those with access to a private green space who responded the question. The weighted average (Avg) was calculated associating each point of the 4-point Likert scale a score (1 = Not at all appreciated; 2 = Little appreciated; 3 = Appreciated; 4 = Very much appreciated). The Chi Square goodness of fit test was used to compare the appreciation for the items in the two types of green spaces at p < 0.05. Significant differences are showed with * at p < 0.05; ** at p < 0.01; *** at p < 0.001; “ns” for non-significant differences.
Table 5.
Relationship between “Missing of a green space” and independent variables related to private (resulting not significant) and public green spaces.
Table 5.
Relationship between “Missing of a green space” and independent variables related to private (resulting not significant) and public green spaces.
| b | Std. Err. | p-Value | |
|---|---|---|---|
| Intercept | 3.67 | 0.13 | 0 |
| Male | −0.2 | 0.07 | 0.006 |
| Frequency of visitation of public green space pre-pandemic | 0.11 | 0.03 | 0.0002 |
| Distance of public green space | −0.06 | 0.03 | 0.032 |
Multiple regression analysis between the dependent variable “Missing a green space” and independent variables related to users of green spaces before the pandemic (n = 379). Only statistically significant results are reported. b: non-standardized beta coefficient, Std. Err.: standard error of b; p-value: statistical significance.
Publisher’s Note: MDPI stays neutral with regard to jurisdictional claims in published maps and institutional affiliations. |
© 2021 by the authors. Licensee MDPI, Basel, Switzerland. This article is an open access article distributed under the terms and conditions of the Creative Commons Attribution (CC BY) license (https://creativecommons.org/licenses/by/4.0/).
Share and Cite
MDPI and ACS Style
Khalilnezhad, M.R.; Ugolini, F.; Massetti, L. Attitudes and Behaviors toward the Use of Public and Private Green Space during the COVID-19 Pandemic in Iran. Land 2021, 10, 1085. https://doi.org/10.3390/land10101085
AMA Style
Khalilnezhad MR, Ugolini F, Massetti L. Attitudes and Behaviors toward the Use of Public and Private Green Space during the COVID-19 Pandemic in Iran. Land. 2021; 10(10):1085. https://doi.org/10.3390/land10101085
Chicago/Turabian StyleKhalilnezhad, Mohammad Reza, Francesca Ugolini, and Luciano Massetti. 2021. "Attitudes and Behaviors toward the Use of Public and Private Green Space during the COVID-19 Pandemic in Iran" Land 10, no. 10: 1085. https://doi.org/10.3390/land10101085
Note that from the first issue of 2016, this journal uses article numbers instead of page numbers. See further details here.