
Estimation of Groundwater Recharge Using Tracers and Numerical Modeling in the North China Plain


Abstract
:1. Introduction
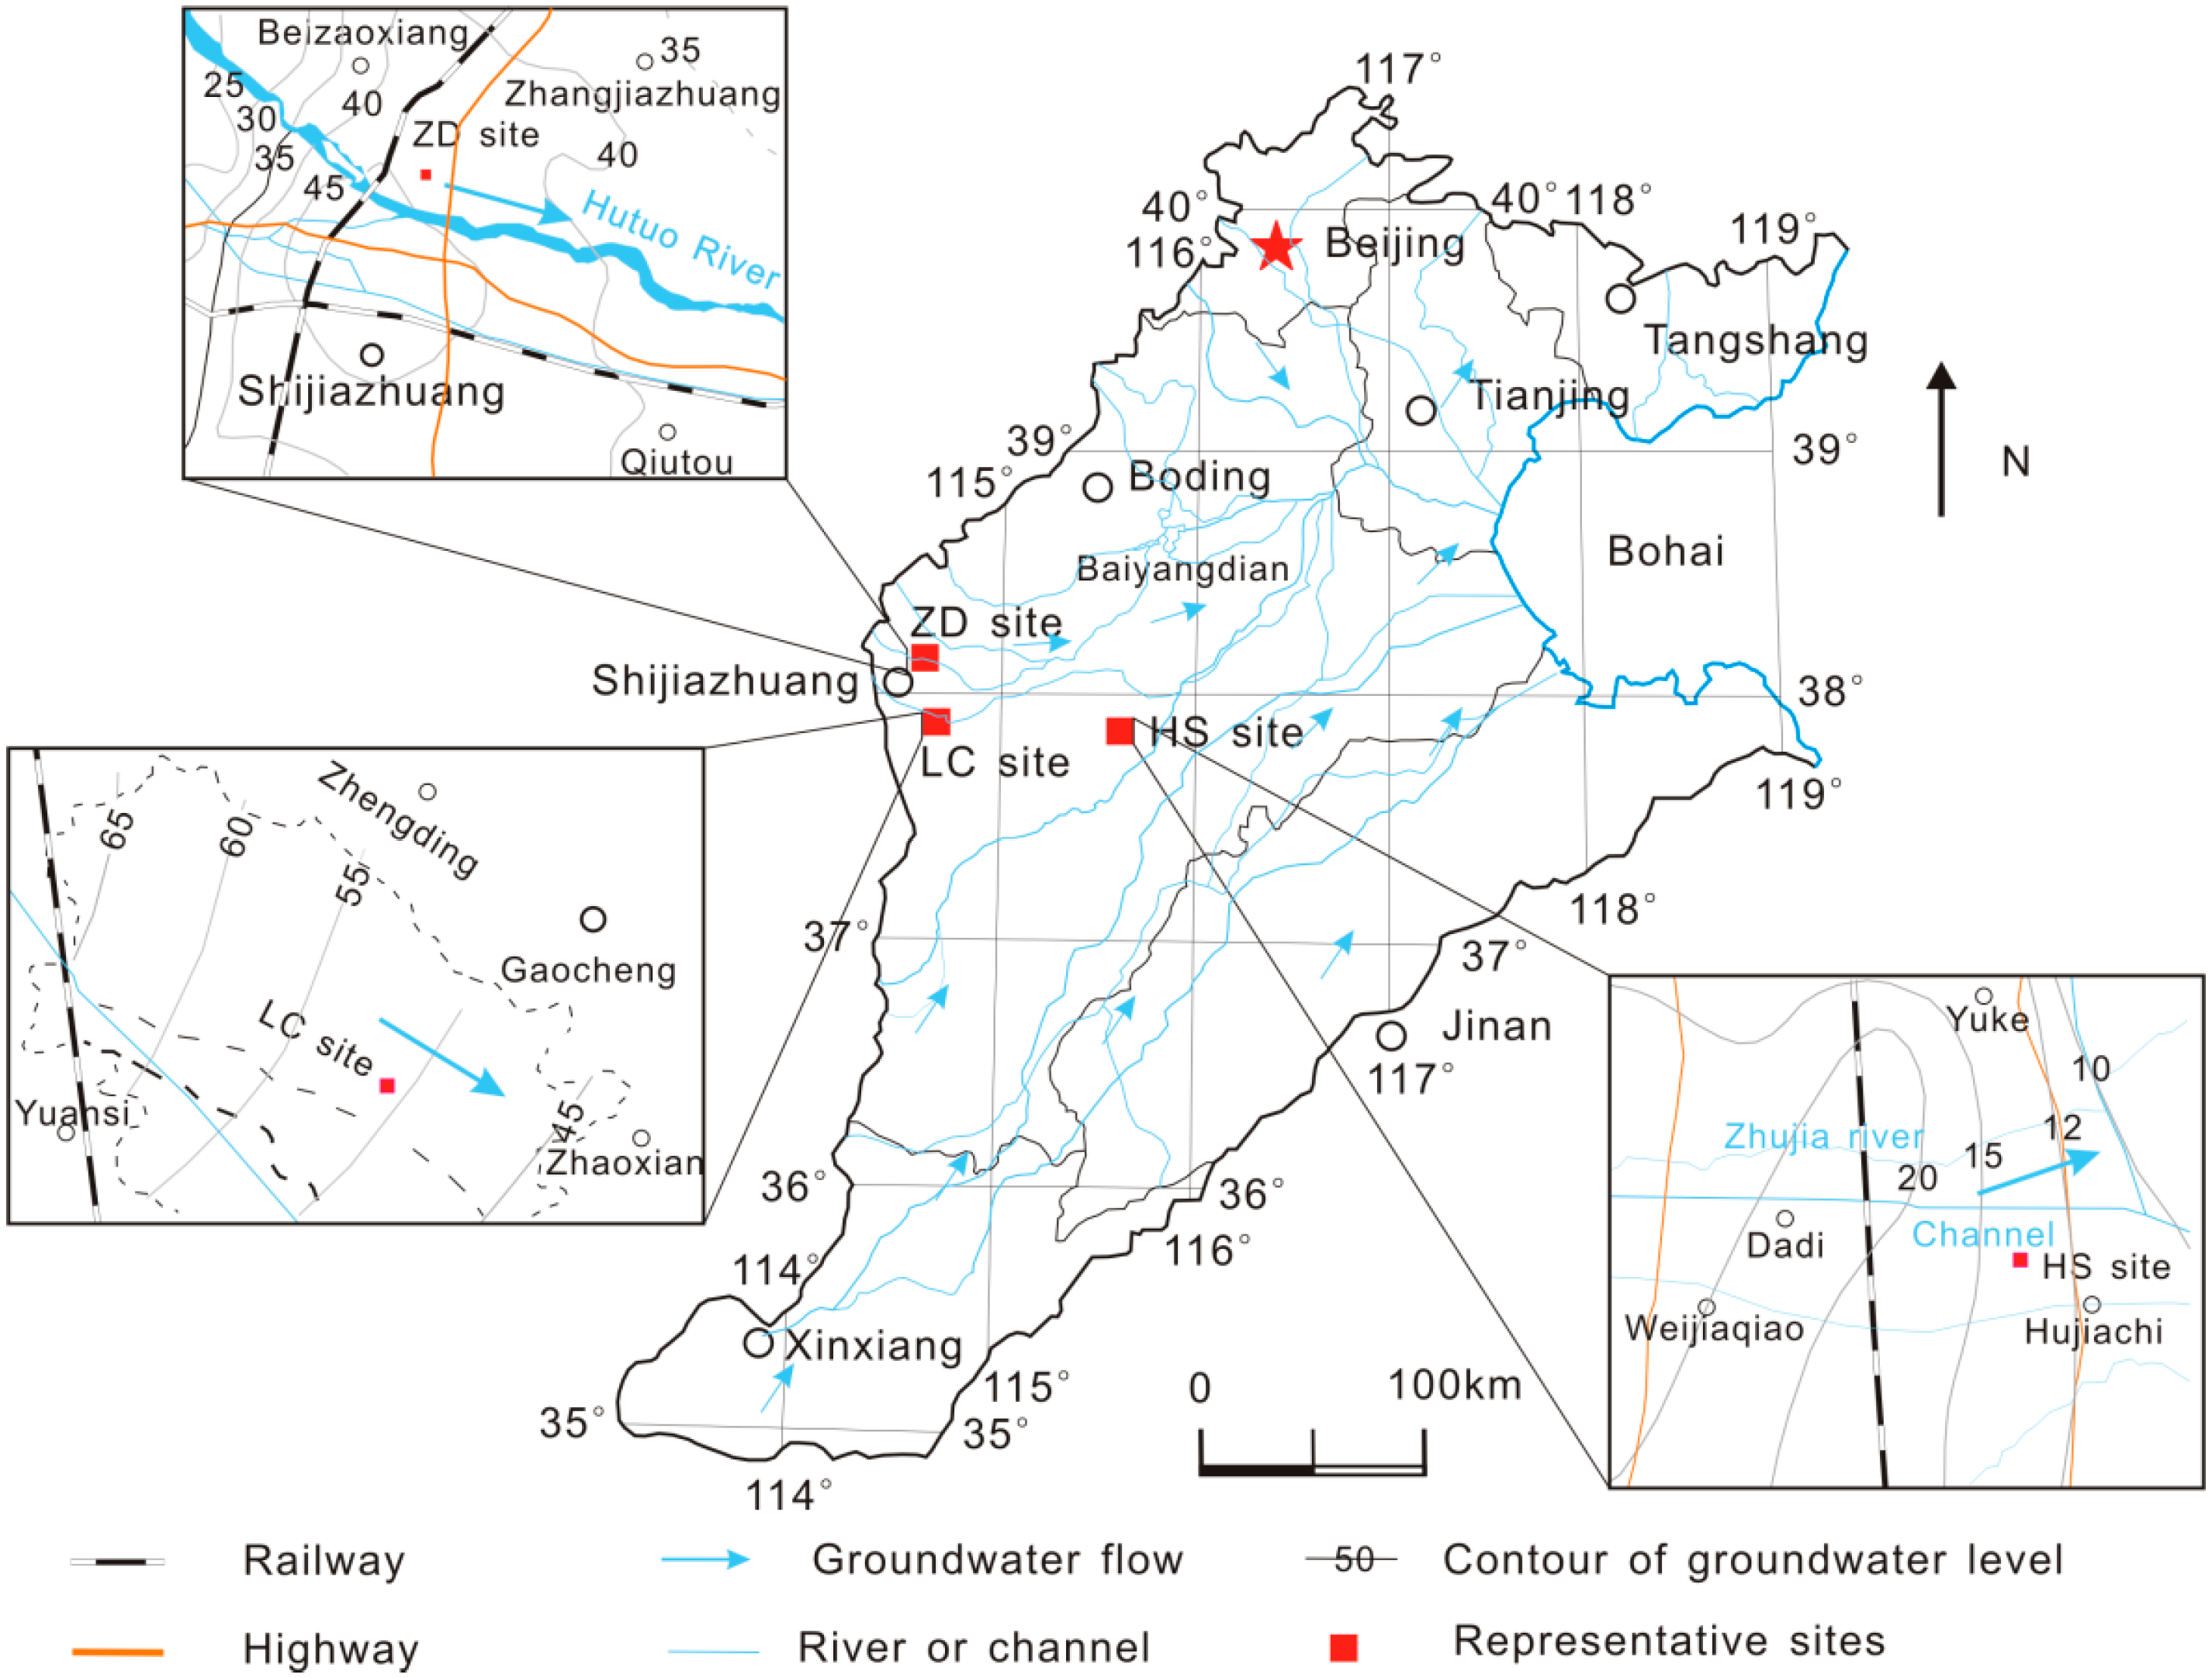
2. Site Description
3. Materials and Methods
3.1. Chloride Mass-Balance Method
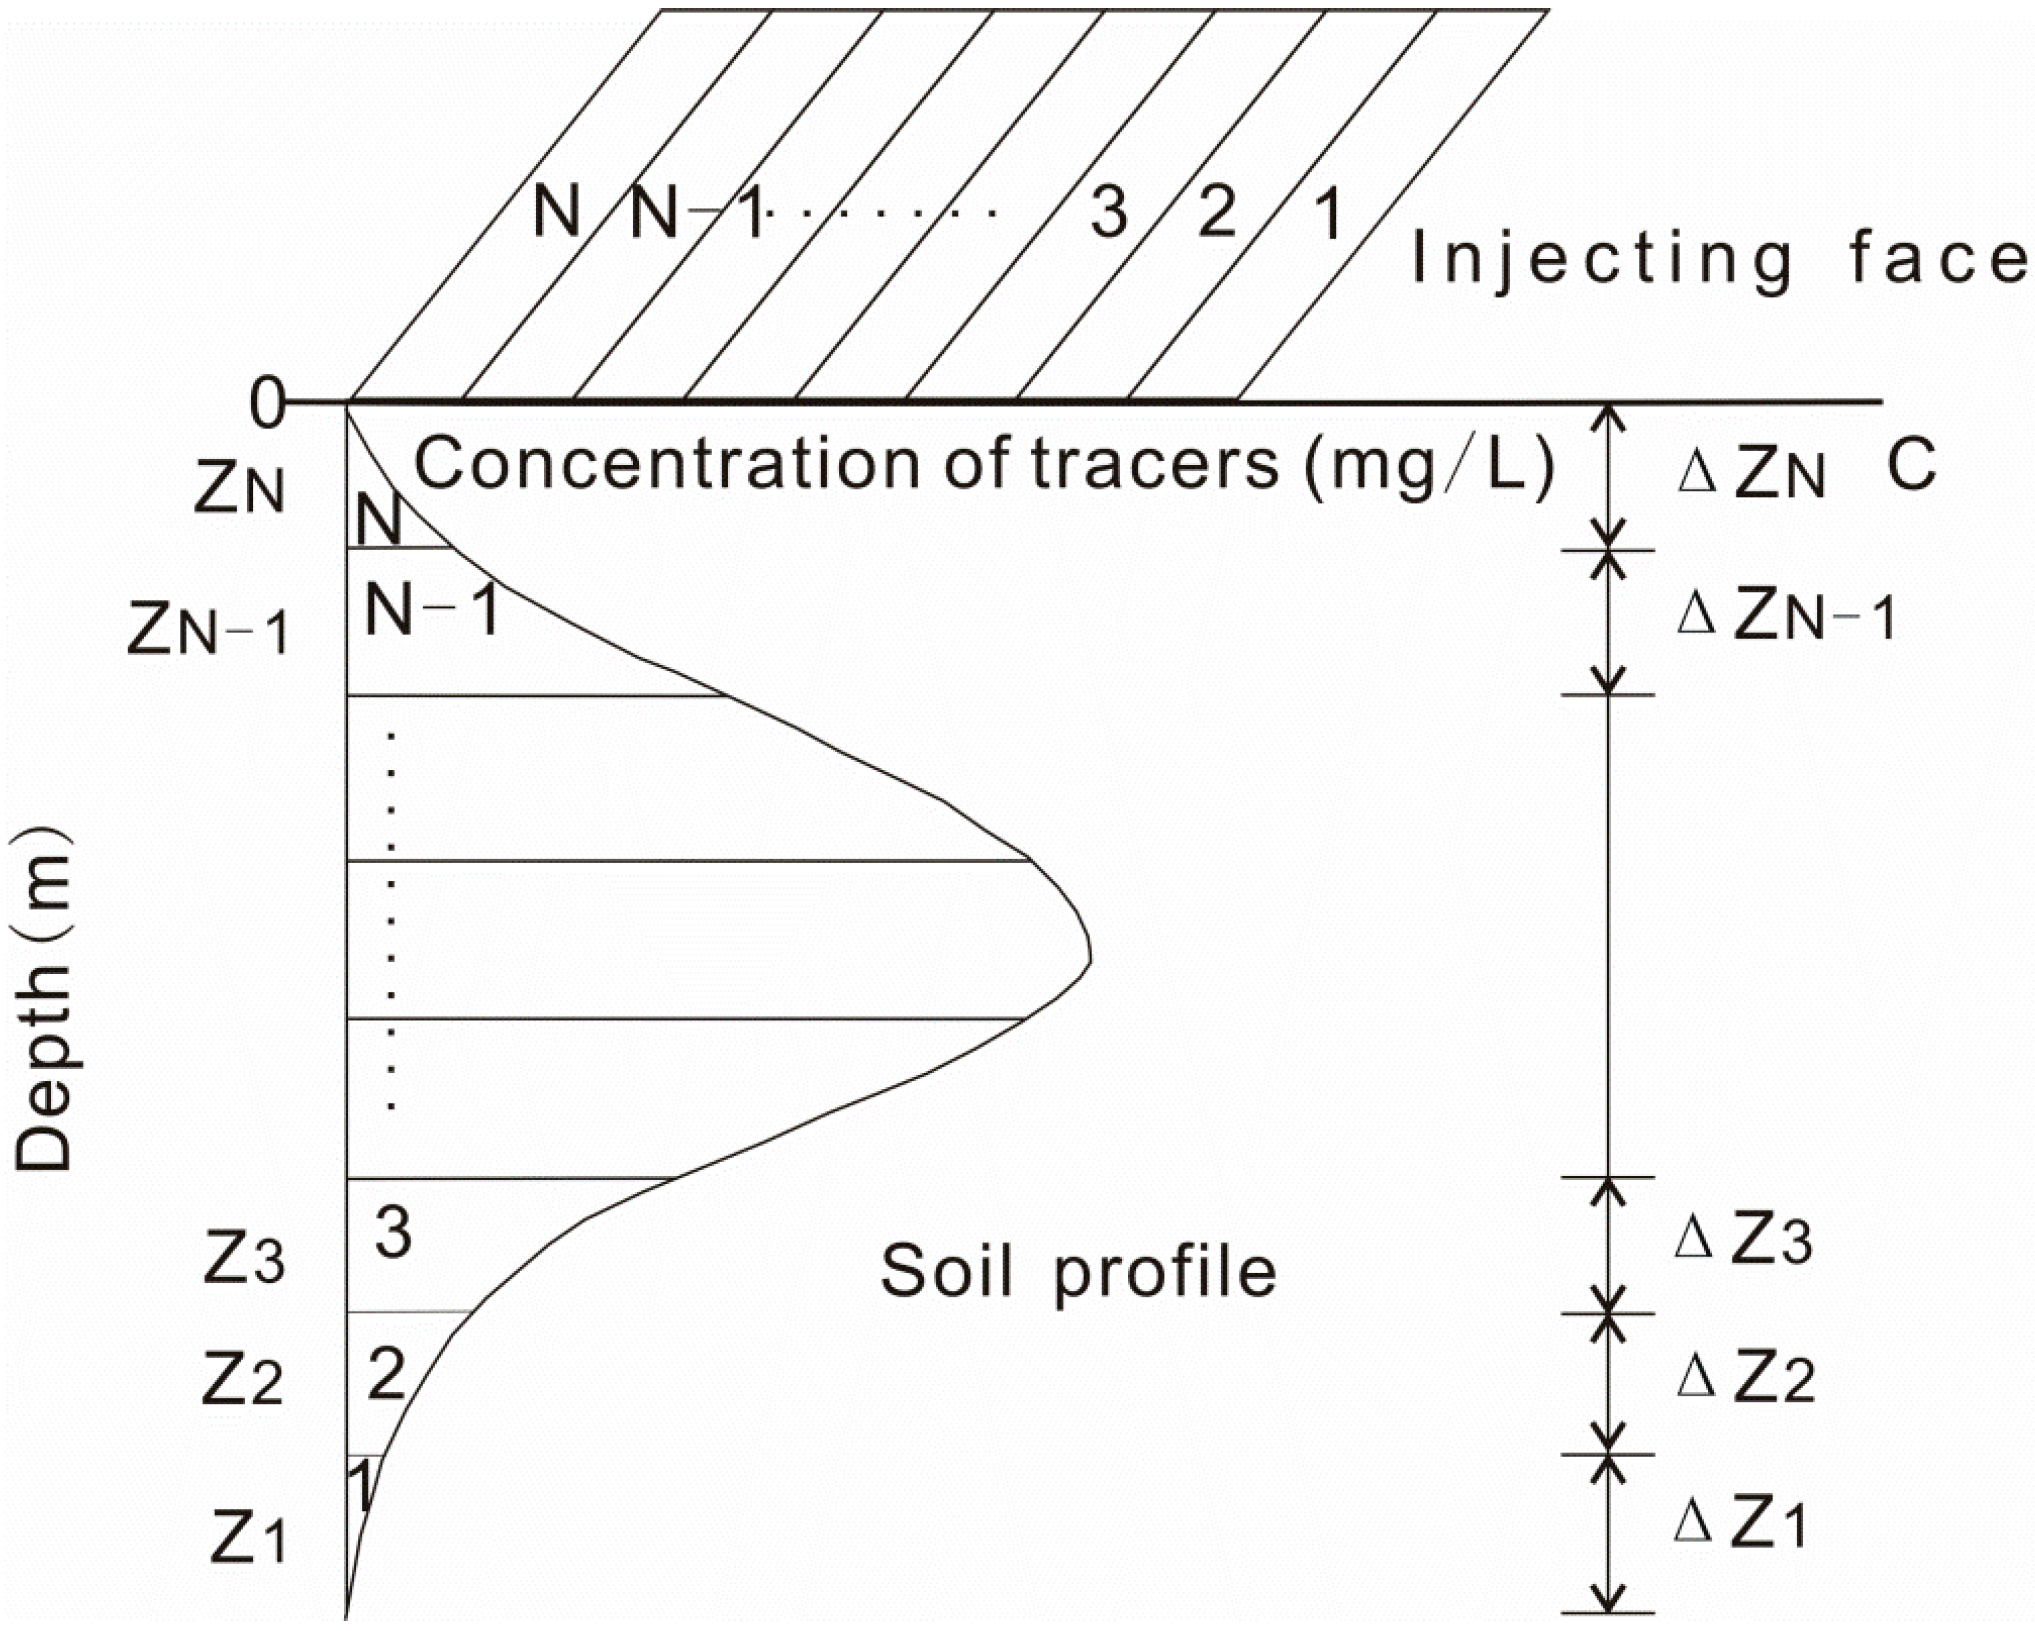
3.2. Applied Tracers Method
- (1)
- The travel time of soil water for the whole region is very short, and the total soil water of all sub-regions flows through the tracing face simultaneously.
- (2)
- The total recharge is the summation of each zone, and the area percentage of each zone is equal to the recharge percentage of each zone.
- (3)
- In the profile, the groundwater recharge of each region could be estimated according to Equation (3) multiplying a ratio parameter. The parameter is the tracer’s mass percentage of each interval depth in the soil profile. The tracer mass is calculated by each interval depth multiplied by the mean tracer concentration of the interval depth.
- (4)
- The soil water of Zone 1 on the tracing face with the largest flow velocity reaches at Zone 1 of the soil profile with the biggest depth in the soil profile, Zone 2 of the tracing face for Zone 2 of the soil profile, and so on.
3.3. Hydrus-1D Modeling Method
3.4. Experiment Procedure and Data Acquisition
4. Results and Discussion
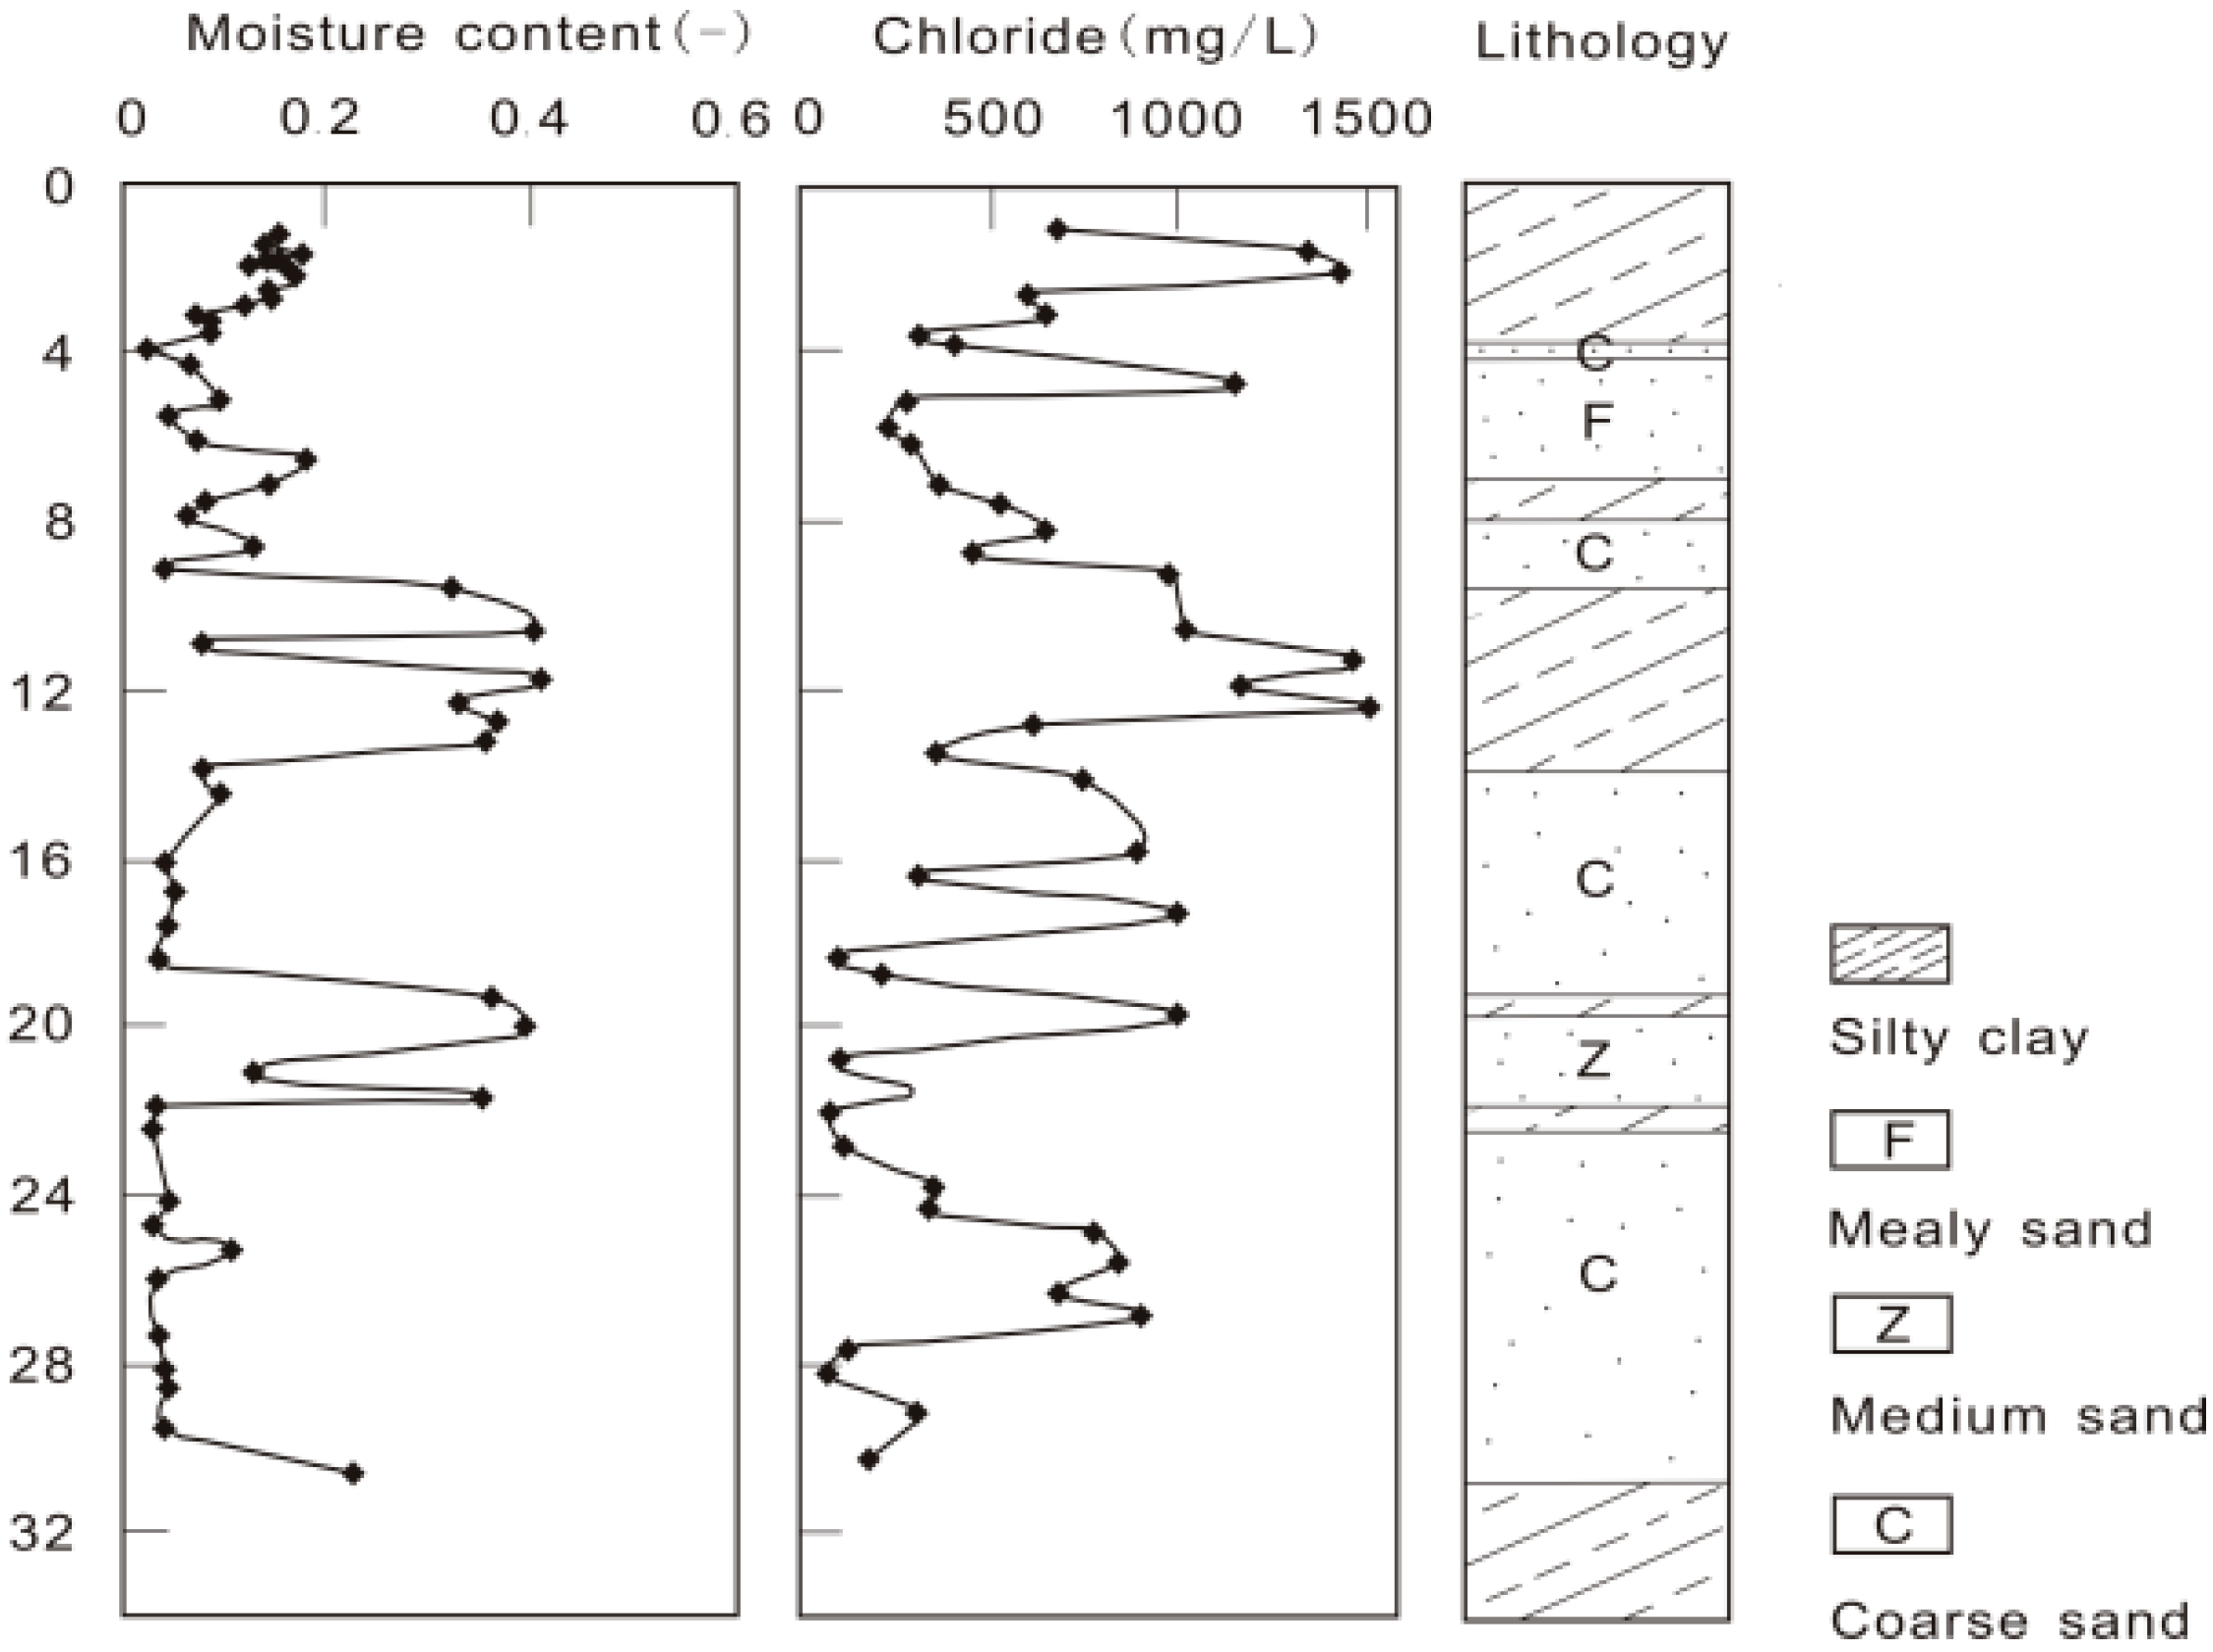
4.1. Chloride Profile
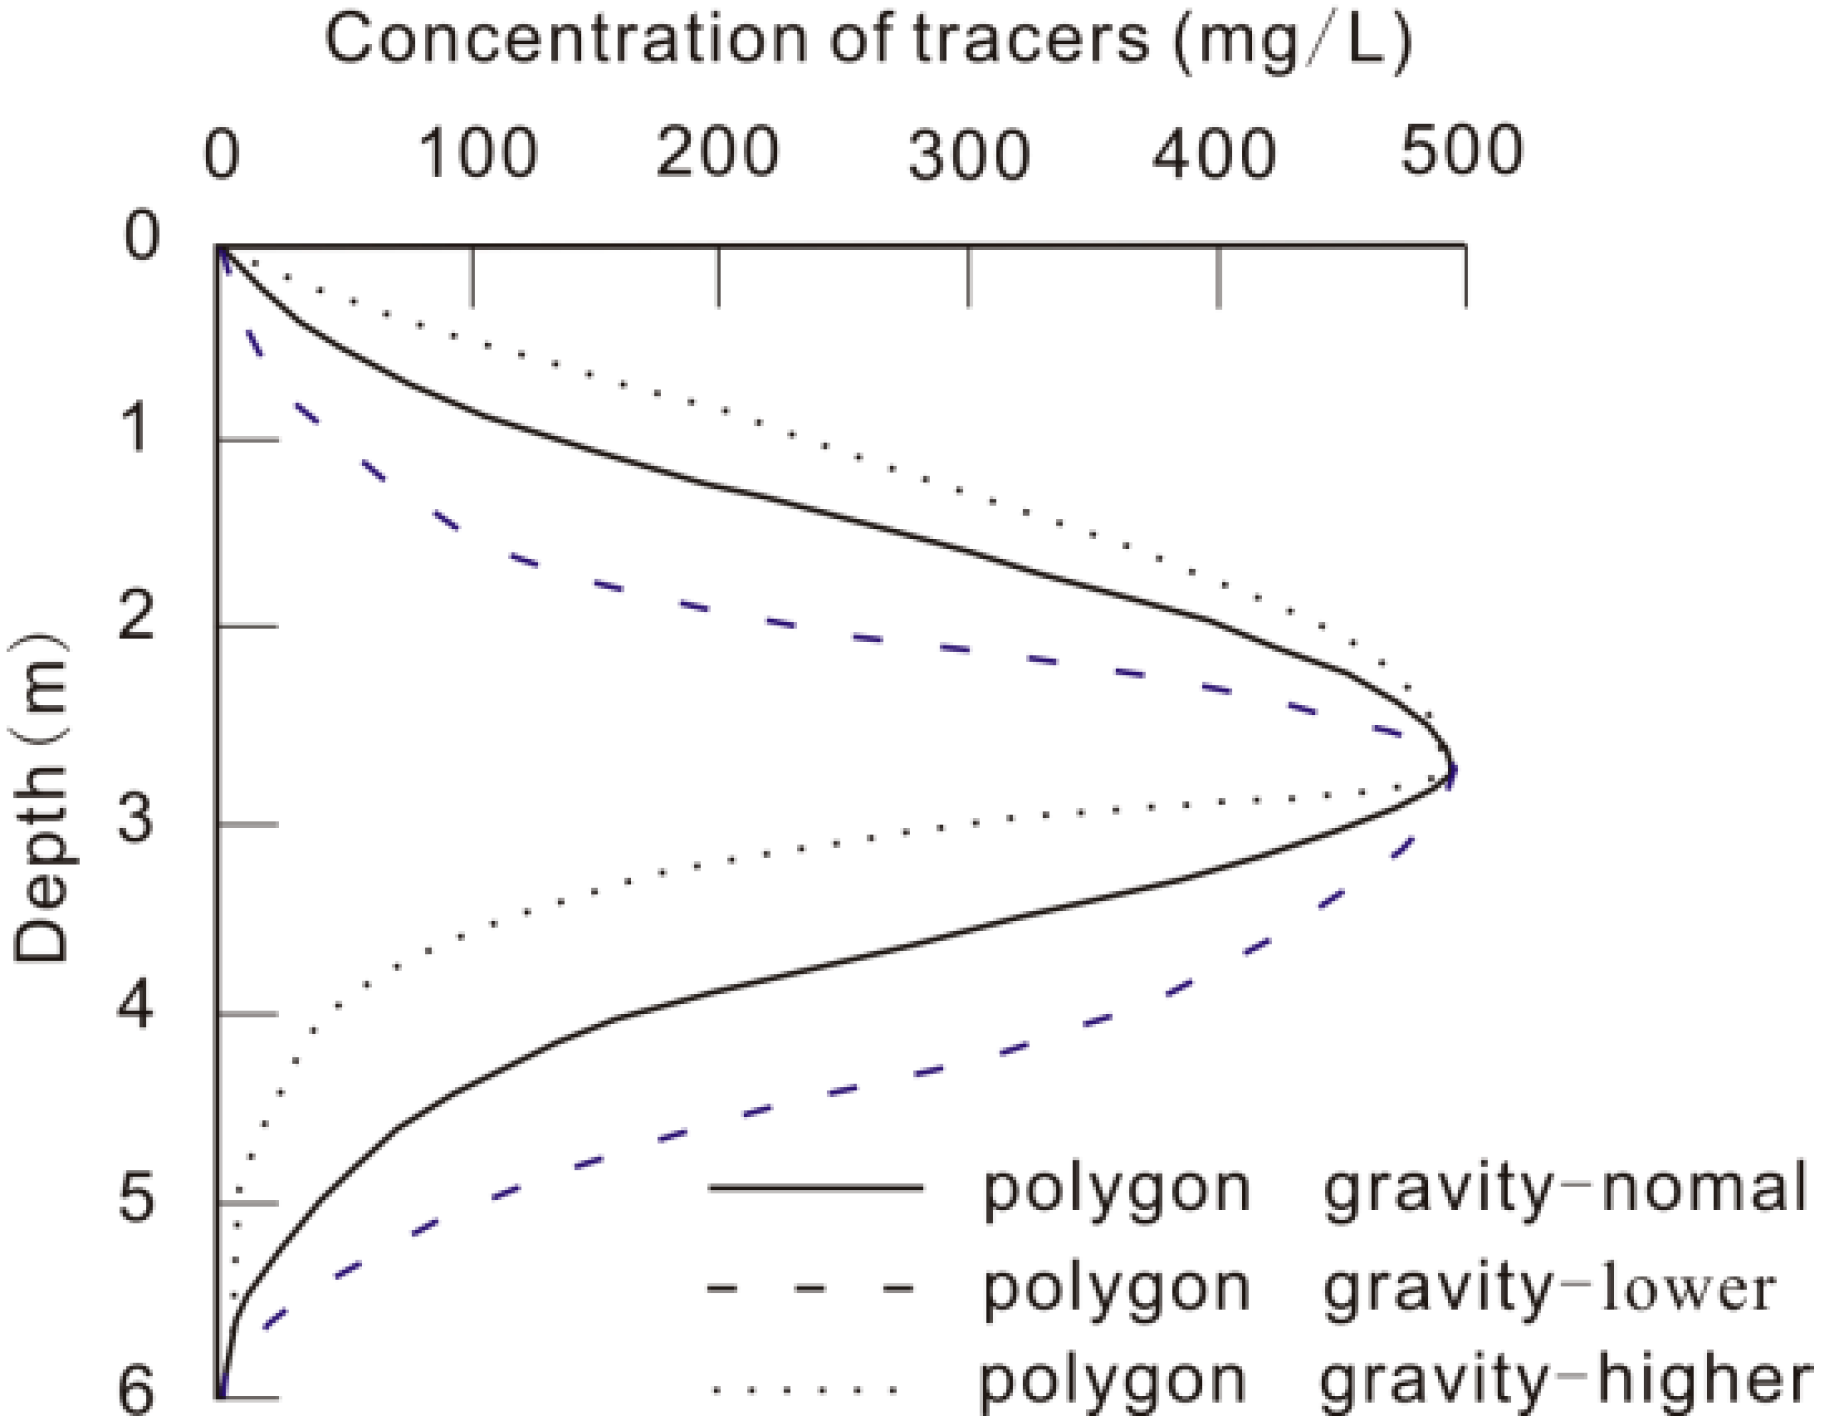
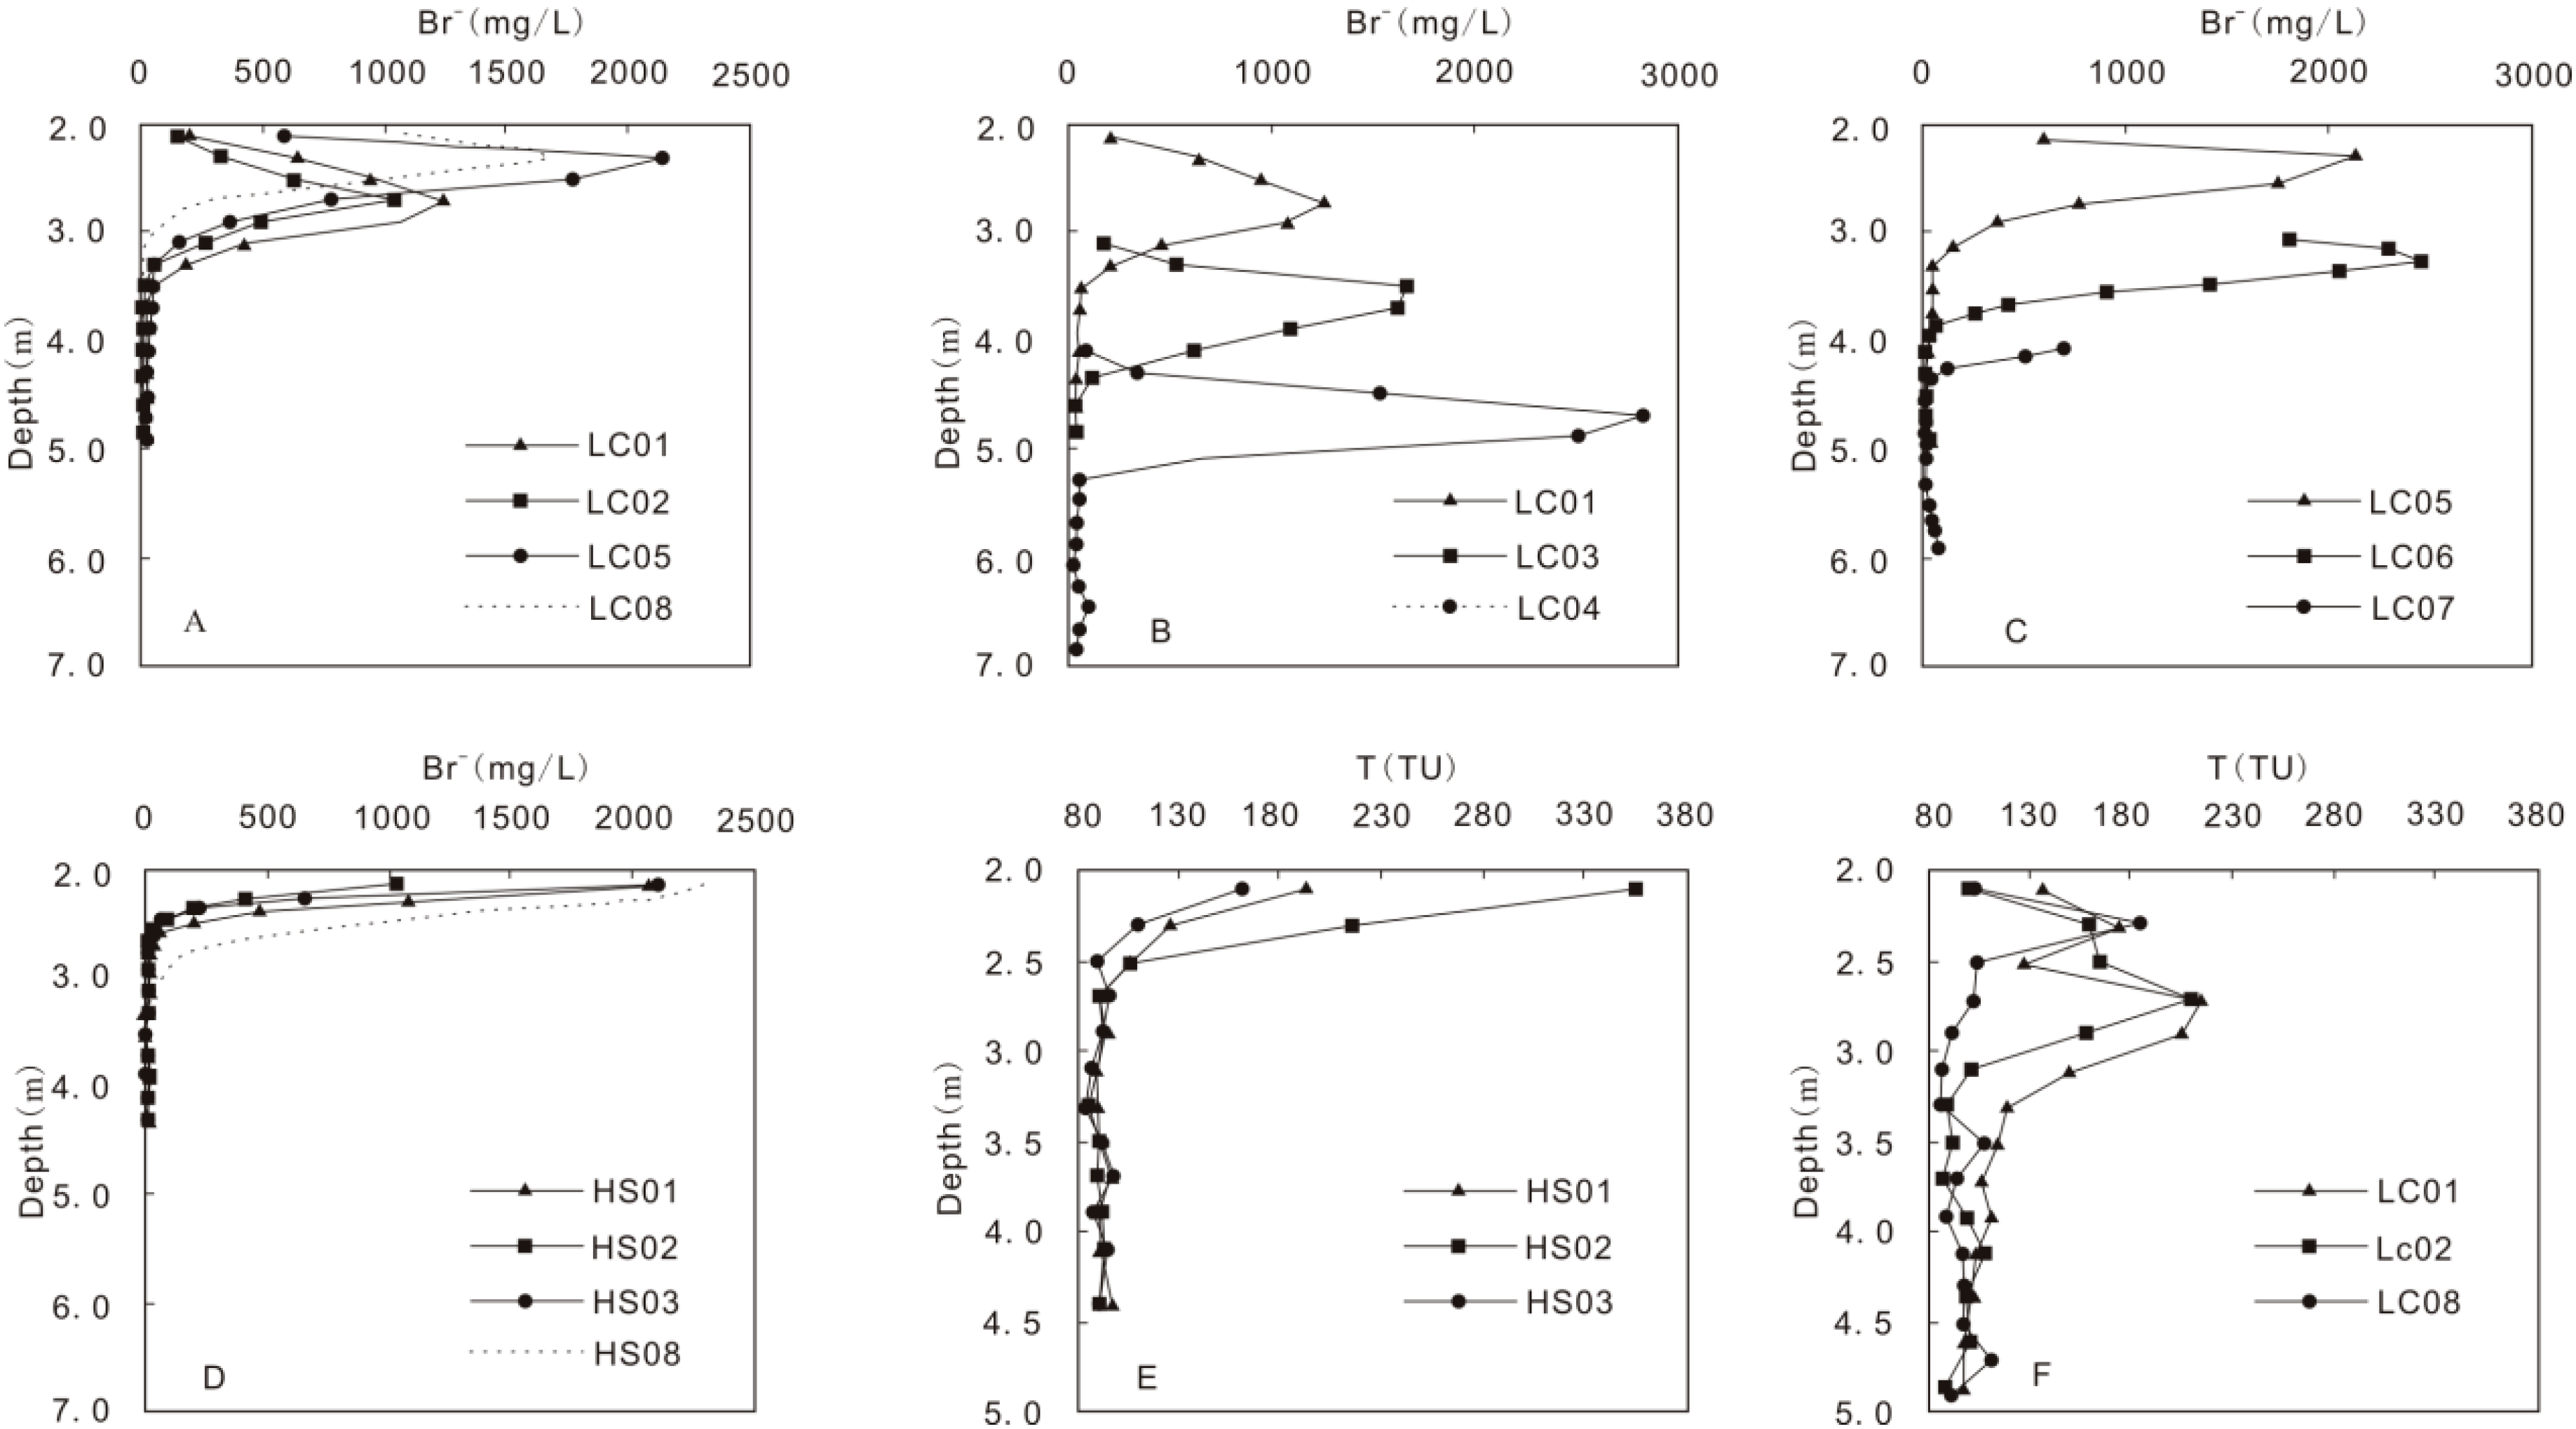
4.2. Applied Tracers Profile
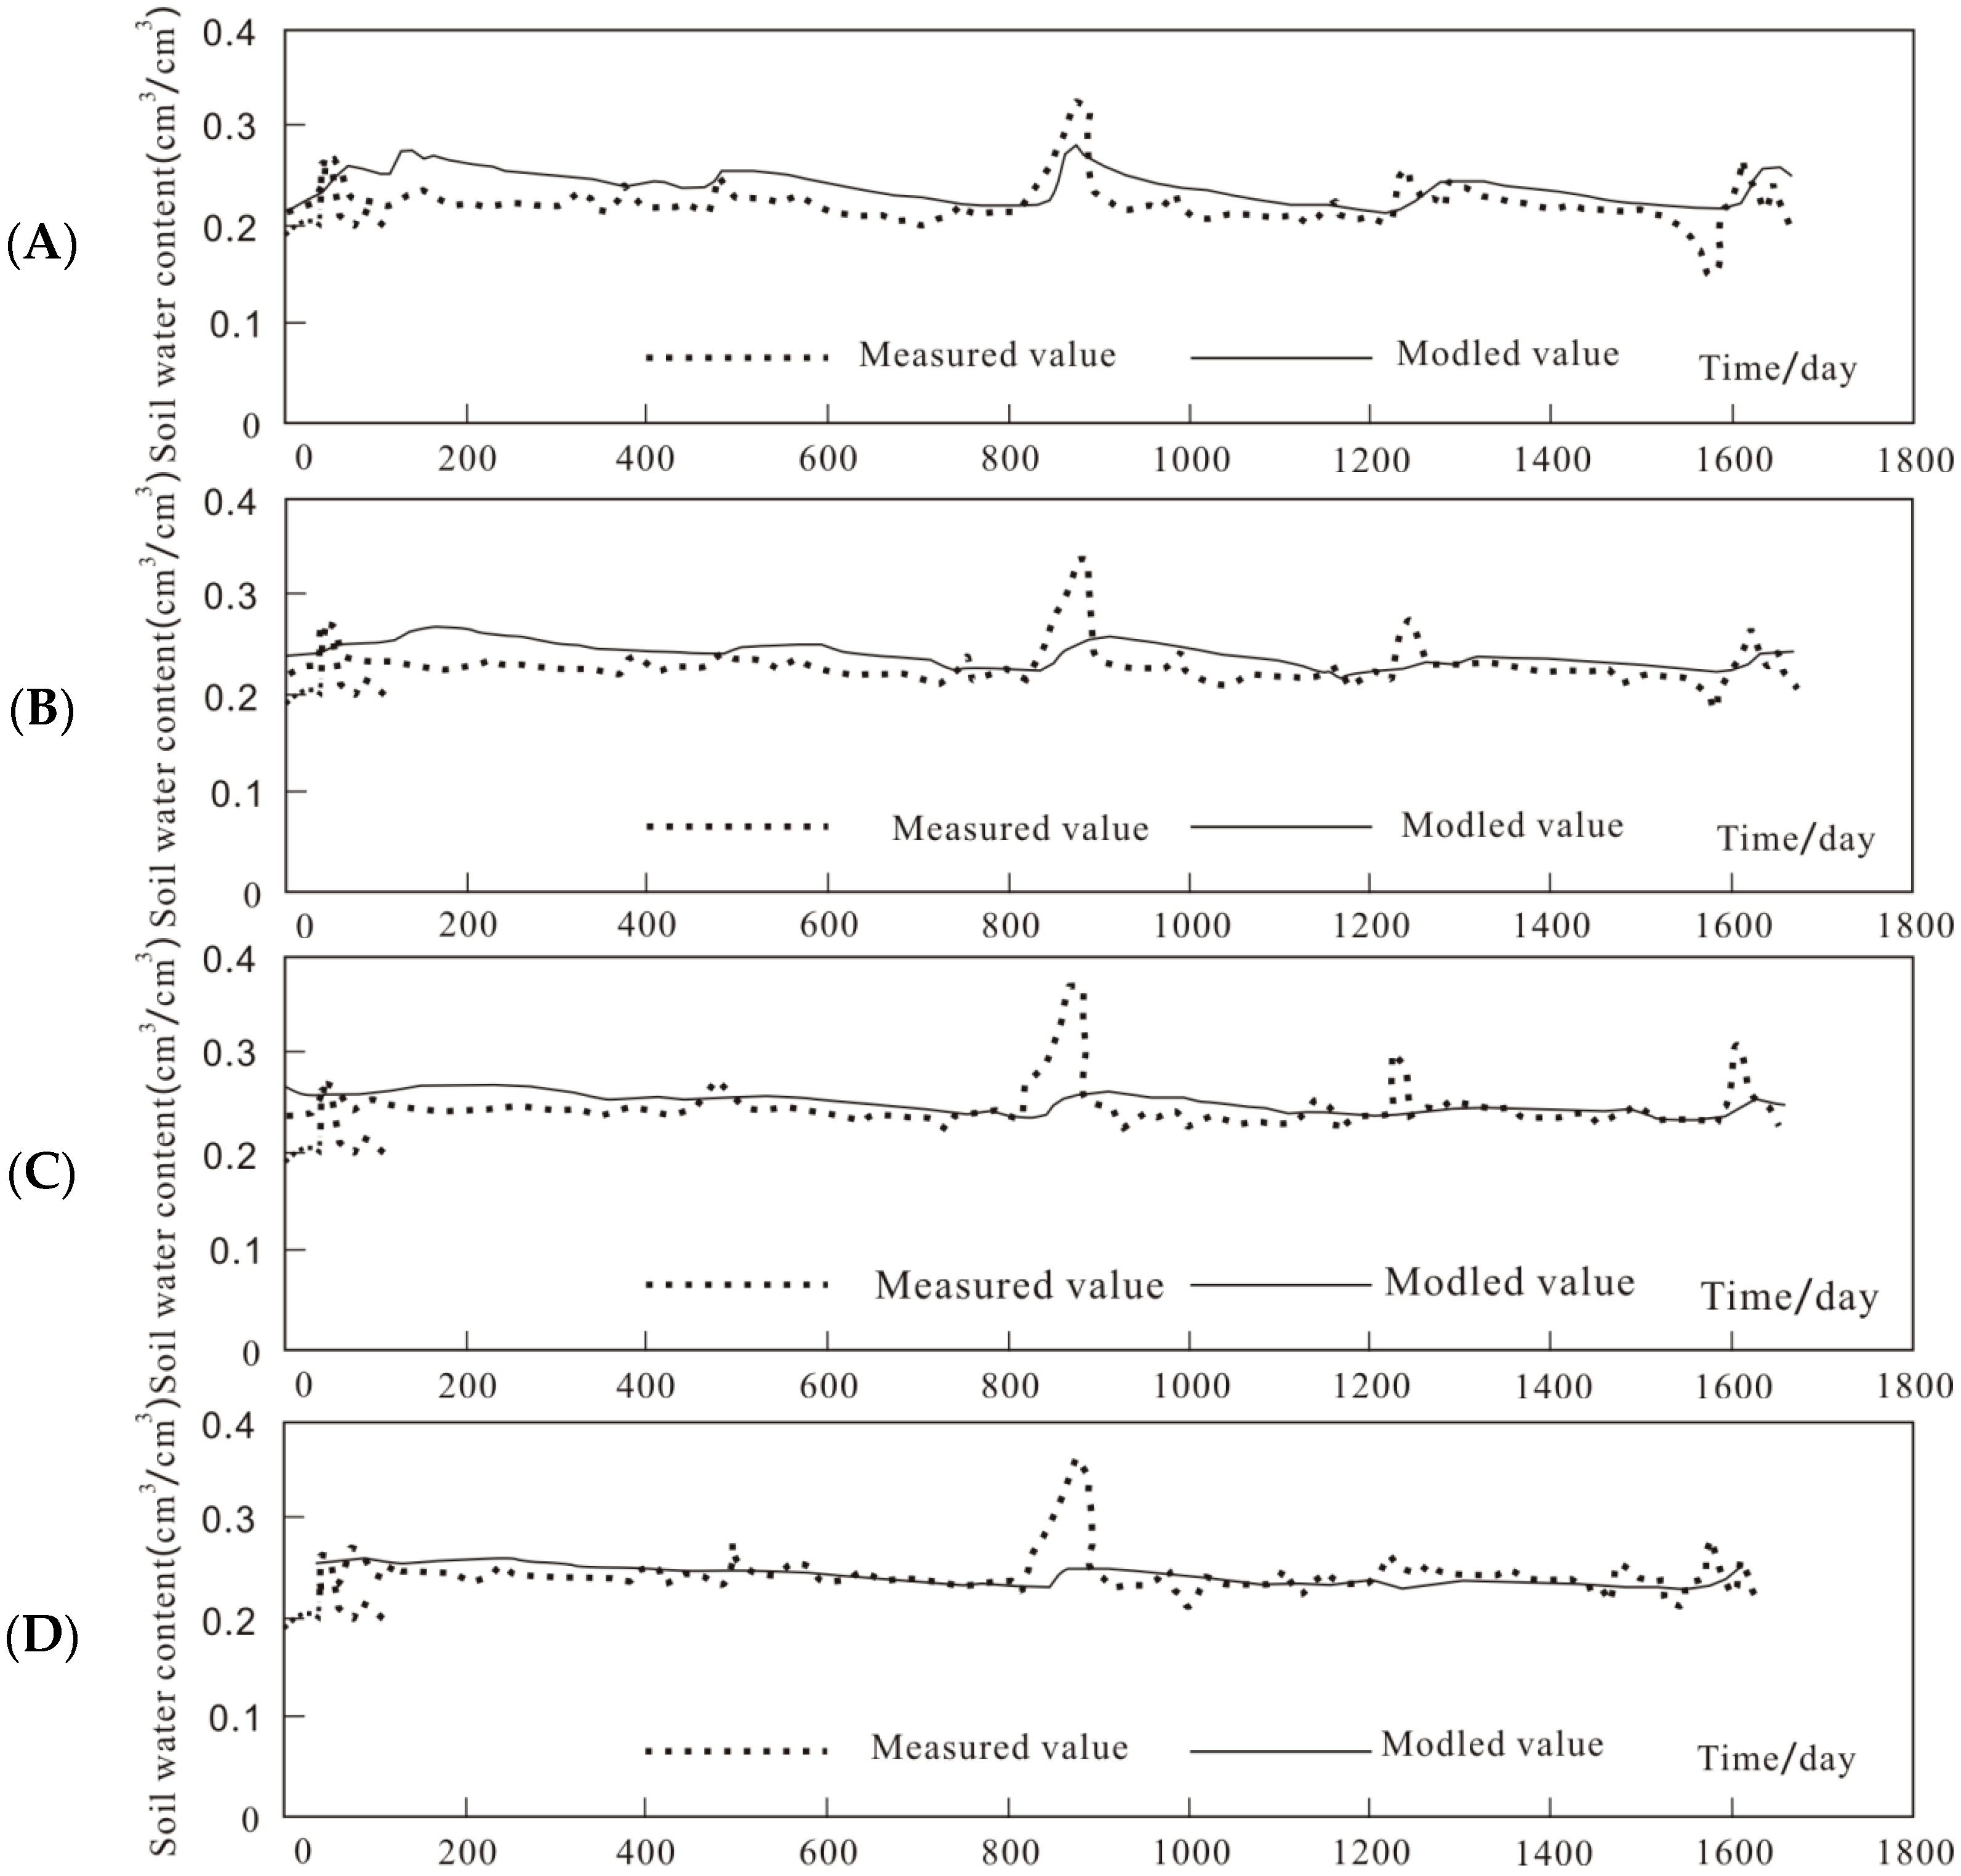
4.3. Hydrus-1D
4.4. Land Use and Irrigation Types
4.5. Different Depth
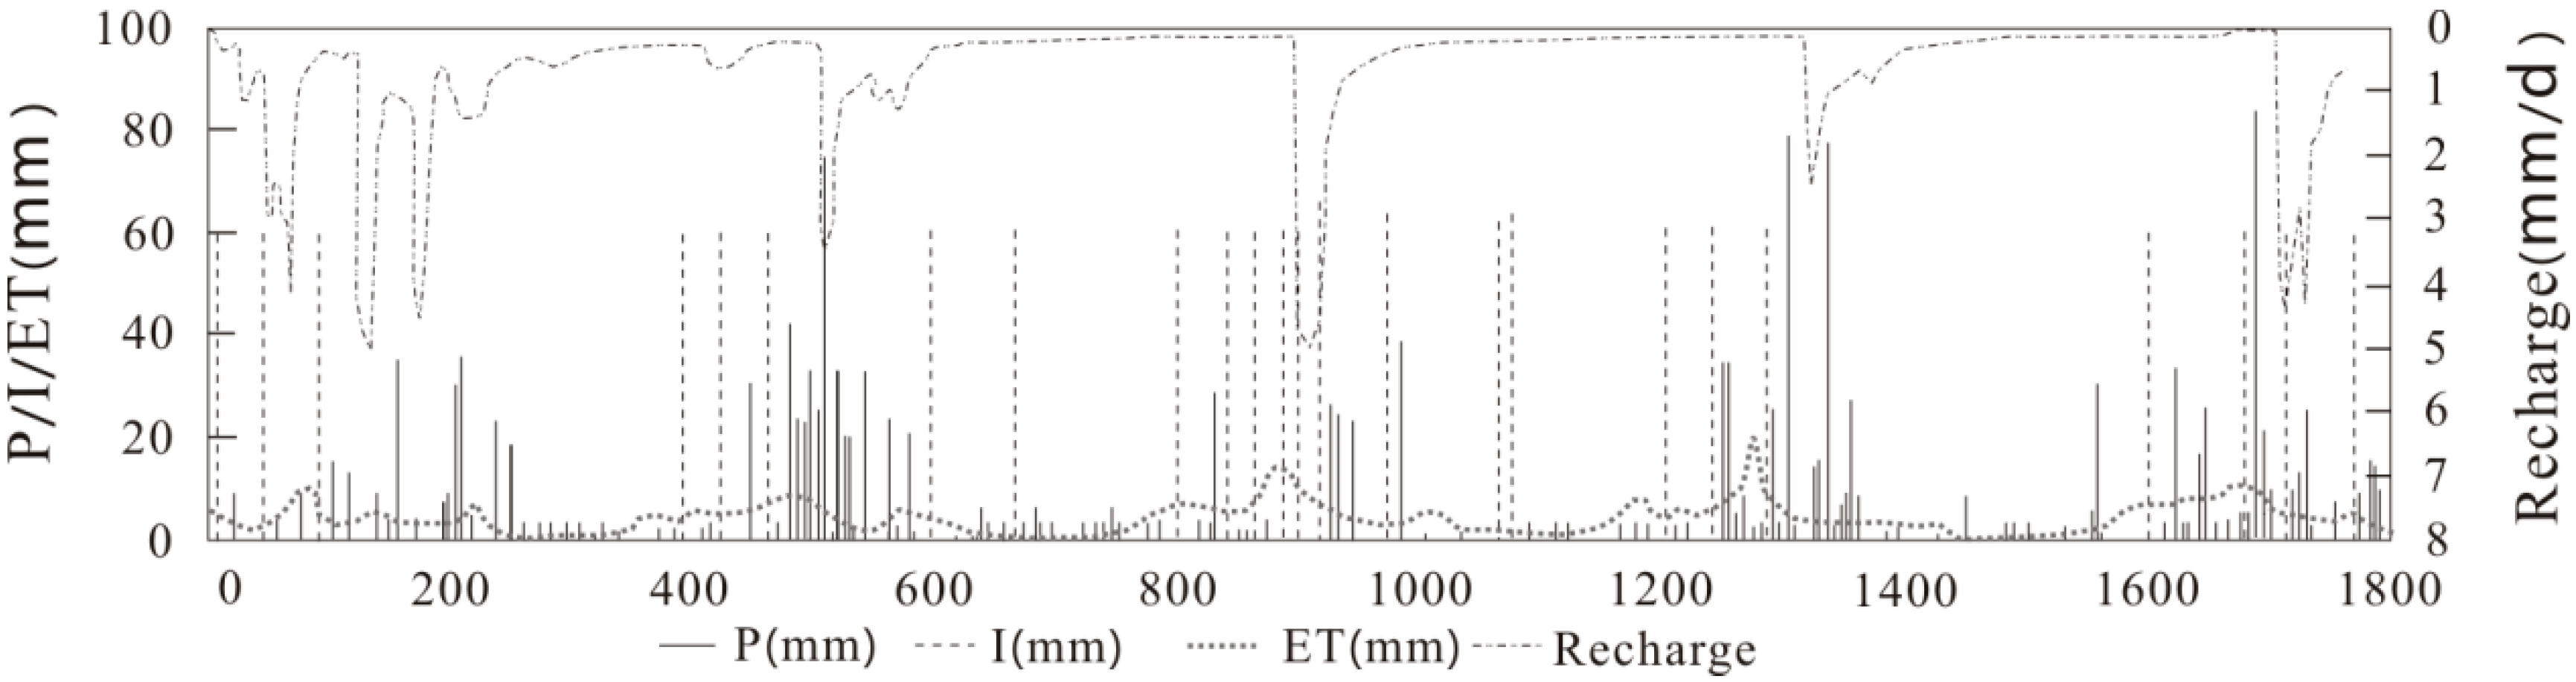
4.6. Precipitation and Irrigation
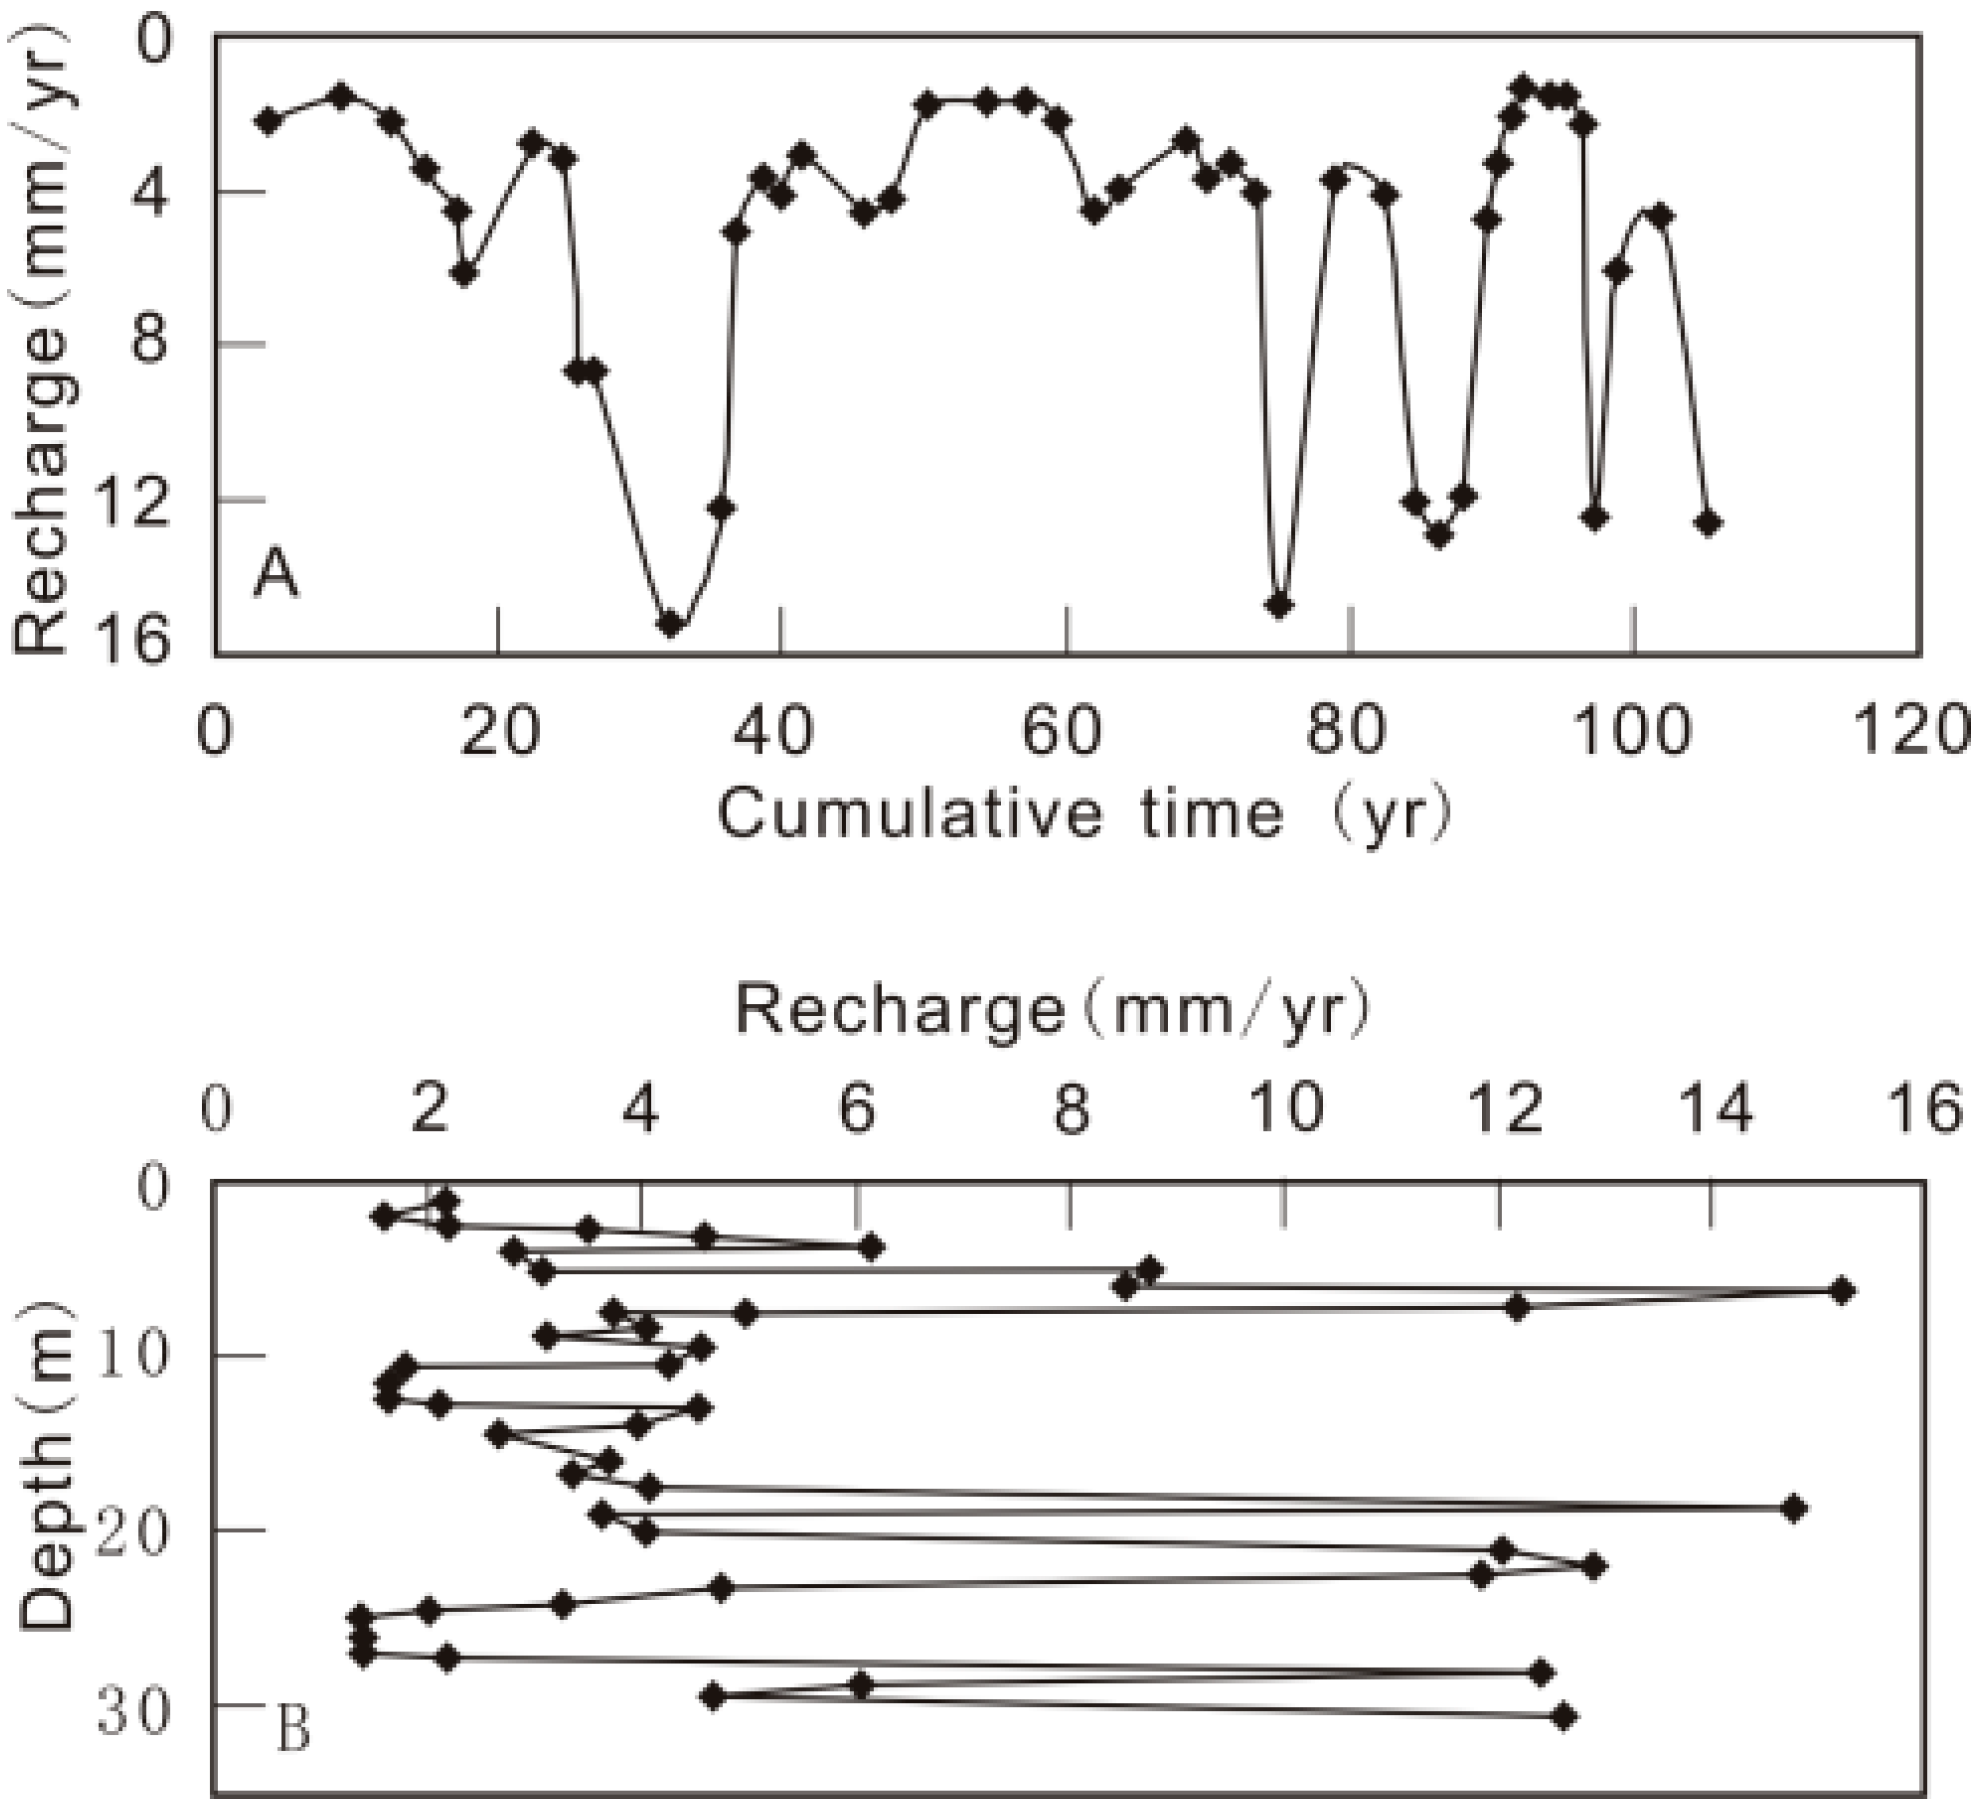
4.7. Temporal and Spatial Changes of Recharge
5. Conclusions
Acknowledgments
Author Contributions
Conflicts of Interest
References
- Fei, Y.; Zhang, Z.; Zhang, F.E.; Wang, Z.; Chen, Z.; Chen, J.; Qian, Y.; Li, Y. An analysis of influence of human activity and climate change on water resources of the North China Plain. Acta Geosci. Sin. 2007, 28, 567–571. [Google Scholar]
- Jun, X.I. A perspective on hydrological base of water security problem and its application study in North China. Prog. Geogr. 2002, 21, 517–526. [Google Scholar]
- Jin, M.; Zhang, R.; Sun, L.; Gao, Y. Temporal and spatial soil water management: A case study in the Heilonggang region, PR China. Agric. Water Manag. 1999, 42, 173–187. [Google Scholar] [CrossRef]
- Vries, J.J.D.; Simmers, I. Groundwater recharge: An overview of processes and challenges. Hydrogeol. J. 2002, 10, 5–17. [Google Scholar] [CrossRef]
- Scanlon, B.R.; Healy, R.W.; Cook, P.G. Choosing appropriate techniques for quantifying groundwater recharge. Hydrogeol. J. 2002, 10, 18–39. [Google Scholar] [CrossRef]
- Cervi, F.; Corsini, A.; Doveri, M.; Mussi, M.; Ronchetti, F.; Tazioli, A. Characterizing the recharge of fractured aquifers: A case study in a flysch rock mass of the northern Apennines (Italy). Eng. Geol. Soc. Territ. 2014, 3, 563–567. [Google Scholar]
- Ma, J.Z.; Ding, Z.; Gates, J.B.; Su, Y. Chloride and the environmental isotopes as the indicators of the groundwater recharge in the Gobi Desert, northwest China. Environ. Geol. 2008, 55, 1407–1419. [Google Scholar] [CrossRef]
- Lo, S.; Zavattaro, L.; Acutis, M.; Maria, G. Chloride profile technique to estimate water movement through unsatured zone in a cropped area in subhumid climate (Po Valley—NW Italy). J. Hydrol. 2003, 270, 65–74. [Google Scholar]
- Novotny, E.V.; Sander, A.R.; Mohseni, O.; Stefan, H.G. Chloride ion transport and mass balance in a metropolitan area using road salt. Water Resour. Res. 2009, 45, 1–13. [Google Scholar] [CrossRef]
- Subyani, A.M. Use of chloride-mass balance and environmental isotopes for evaluation of groundwater recharge in the alluvial aquifer, Wadi Tharad, western Saudi Arabia. Environ. Geol. 2004, 46, 741–749. [Google Scholar] [CrossRef]
- Ting, C.S.; Kerh, T.F.; Liao, C.J. Estimation of groundwater recharge using the chloride mass-balance method, Pingtung Plain, Taiwan. Hydrogeol. J. 1998, 6, 282–292. [Google Scholar] [CrossRef]
- Zagana, E.; Obeidat, M.; Kuells, C.; Udluft, P. Chloride, hydrochemical and isotope methods of groundwater recharge estimation in eastern Mediterranean areas: A case study in Jordan. Hydrol. Process. 2007, 21, 2112–2123. [Google Scholar] [CrossRef]
- Scanlon, B.R. Evaluation of liquid and vapor water flow in desert soils based on chlorine 36 and tritium tracers and nonisothermal flow simulations. Water Resour. Res. 1992, 28, 285–297. [Google Scholar] [CrossRef]
- Flint, A.L.; Flint, L.E.; Kwicklis, E.M.; Fabryka-martin, J.T.; Bodvarsson, G.S. Estimating recharge at Yucca Mountain, Nevada, USA: Comparison of methods. Hydrogeol. J. 2002, 10, 180–204. [Google Scholar] [CrossRef]
- Dassi, L. Use of chloride mass balance and tritium data for estimation of groundwater recharge and renewal rate in an unconfined aquifer from North Africa: A case study from Tunisia. Environ. Earth Sci. 2010, 60, 861–871. [Google Scholar] [CrossRef]
- Wang, B.G.; Jin, M.G.; Wang, W.; Nimmo, J.R.; Yang, L. Estimating groundwater recharge in Hebei Plain, China under varying land use practices using tritium and bromide tracers. J. Hydrol. 2008, 356, 209–222. [Google Scholar] [CrossRef]
- Aquilanti, L.; Clementi, F.; Nanni, T.; Palpacelli, S.; Tazioli, A.; Vivalda, P.M. DNA and fluorescein tracer tests to study the recharge, groundwater flowpath and hydraulic contact of aquifers in the Umbria-Marche limestone ridge (central Apennines, Italy). Environ. Earth Sci. 2016, 75, 5436–5441. [Google Scholar] [CrossRef]
- Bitterlich, S.; Durner, W.; Iden, S.C.; Knabner, P. Inverse estimation of the unsaturated soil hydraulic properties from column outflow experiments using free-form parameterizations. Vadose Zone J. 2004, 3, 971–981. [Google Scholar] [CrossRef]
- Iden, S.C.; Durner, W. Free-form estimation of the unsaturated soil hydraulic properties by inverse modeling using global optimization. Water Resour. Res. 2007, 43, 1–12. [Google Scholar] [CrossRef]
- Gogolev, M. Assessing groundwater recharge with two unsaturated zone modeling technologies. Environ. Geol. 2002, 42, 248–258. [Google Scholar] [CrossRef]
- Bethune, M.G.; Selle, B.; Wang, Q.J. Understanding and predicting deep percolation under surface irrigation. Water Resour. Res. 2008, 44, 1–16. [Google Scholar] [CrossRef]
- Jiménez-Martínez, J.; Skaggs, T.H.; van Genuchten, M.T.; Candela, L. A root zone modelling approach to estimating groundwater recharge from irrigated areas. J. Hydrol. 2009, 367, 138–149. [Google Scholar] [CrossRef]
- Mattern, S.; Vanclooster, M. Estimating travel time of recharge water through a deep vadose zone using a transfer function model. Environ. Fluid Mech. 2010, 10, 121–135. [Google Scholar] [CrossRef]
- Lu, X.H.; Jin, M.G.; van Genuchten, M.T.; Wang, B.G. Groundwater recharge at five representative sites in the Hebei Plain, China. Ground Water 2011, 49, 286–294. [Google Scholar] [CrossRef] [PubMed]
- Scott, R.L.; Shuttleworth, W.J.; Keefer, T.O.; Warrick, A.W. Modeling multiyear observations of soil moisture recharge in the semiarid American Southwest. Water Res. 2000, 36, 2233–2247. [Google Scholar] [CrossRef]
- An, Y.; Li, Y. Change of Evaporation in Recent 50 years in Heibei. J. Arid Land Resour. Environ. 2005, 19, 159–162. [Google Scholar]
- Urbanc, J.; Leis, A. Tracing of water movement through the unsaturated zone of a coarse gravel aquifer by means of dye and deuterated water. Environ. Geol. 2007, 51, 1401–1412. [Google Scholar]
- Lappan, R.E.; Hrymak, A.N.; Pelton, R. Dependence of in situ precipitate deposition on flow characteristics in multi-permeability porous media. Chem. Eng. Sci. 1997, 52, 2963–2975. [Google Scholar] [CrossRef]
- Ritter, A.; Hupet, F.; Mun, R.; Lambot, S.; Vanclooster, M. Using inverse methods for estimating soil hydraulic properties from field data as an alternative to direct methods. Agric. Water Manag. 2003, 59, 77–96. [Google Scholar] [CrossRef]
- Silva, O.; Carrera, J.; Dentz, M.; Kumar, S.; Alcolea, A.; Willmann, M. A general real-time formulation for multi-rate mass transfer problems. Hydrol. Earth Syst. Sci. 2009, 13, 1399–1411. [Google Scholar] [CrossRef]
- Šimůnek, J.; Šejna, M.; Saito, H.; Sakai, M.; van Genuchten, M.T. The HYDRUS-1D Software Package for Simulating the One-Dimensional Movement of Water, Heat, and Multiple Solute in Variably-Saturated Media, version 4.08; Department of Environmental Sciences, University of California Riverside: Riverside, CA, USA, 2009. [Google Scholar]
- Wu, Q.; Zhang, W.; Ling, W.; Wang, G. Study on soil water dynamics evolvement law under straw mulch condition. Agric. Res. Aird Areas 2009, 27, 76–82. [Google Scholar]
- Genuchten, V. A closed-form equation for predicting the hydraulic conductivity of unsaturated soils. Soil Sci. Soc. Am. J. 1980, 44, 892–898. [Google Scholar] [CrossRef]
- Inoue, M.; Šimůnek, J.; Hopmans, J.W.; Clausnitzer, V. In situ estimation of soil hydraulic functions using a multistep soil-water extraction technique. Water Resour. 1998, 34, 1035–1050. [Google Scholar] [CrossRef]
- Kelleners, T.J.; Soppe, R.W.O.; Ayars, J.E.; Šimůnek, J.; Skaggs, T.H. Inverse analysis of upward water flow in a groundwater table lysimeter. Vadose Zone J. 2005, 4, 558–272. [Google Scholar] [CrossRef]
- Alcalá, F.J.; Custodio, E. Atmospheric chloride deposition in continental Spain. Hydrol. Process. 2008, 22, 3636–3650. [Google Scholar] [CrossRef]
- Liu, J.; Chen, Z.; Zhang, Z.; Fei, Y.; Zhang, F.; Chen, J.; Wang, Z. Estimation of natural groundwater recharge in the Hutuo river alluvial-proluvial fan using environmental tracers. Geol. Sci. Technol. Inf. 2009, 28, 114–118. [Google Scholar]
- Wang, S.F.; Zhang, X.Y.; Pei, D. Impacts of different water supplied conditions on root distribution, yield and water utilization efficiency of winter wheat. Trans. CSAE 2006, 22, 27–32. [Google Scholar]
- Ying, Z.X. A review of agricultural water-saving research at Luancheng Agro-Ecosystem Experimental Station of Chinese Academy of Sciences over the last 30 years. Chin. J. Eco-Agric. 2011, 19, 987–996. [Google Scholar]
- Chen, M. Adsorption of main anions in variable charge soil. Chin. J. Soil Sci. 1994, 25, 46–49. [Google Scholar]
- Shao, Z.; Zhao, M.; Li, Q.; Ji, G. Metal cation-induced Cl− adsorption by soils. Environ. Chem. 2003, 22, 1–8. [Google Scholar]
- Porro, I.; Wierenga, P.W. Transient and steady-state solute transport through a large unsaturated soil column. Ground Water 1993, 31, 193–200. [Google Scholar] [CrossRef]
- Huyer, W.; Neumaier, A. Global optimization by multilevel coordinate search. J. Glob. Optim. 1999, 14, 331–355. [Google Scholar] [CrossRef]
- Lambot, S.; Javaux, M.; Hupet, F.; Vanclooster, M. A global multilevel coordinate search procedure for estimating the unsaturated soil hydraulic properties. Water Resour. Res. 2002, 38, 1–15. [Google Scholar] [CrossRef]
- Šimůnek, J.; van Genuchten, M.T.; Wendroth, O. Parameter estimation analysis of the evaporation method for determining soil hydraulic properties. Soil Sci. Soc. Am. J. 1995, 62, 894–905. [Google Scholar] [CrossRef]
- Wu, Q. Quantifying Preferential Flow for the Soil Water Infiltration; Chinese Academy of Geological Sciences: Beijing, China, 2013. [Google Scholar]


| Site | Lithology | Groundwater Depth (m) | Precipitation (mm/Year) | Irrigation (mm/Year) | Evaporation (mm/Year) |
|---|---|---|---|---|---|
| ZD | Clay, silt, sand | 45.0 | 471.8 | 0 | 1655 |
| LC | Clay, silt, sand | 36.5 | 439.5 | 300 | 1528 |
| HS | Clay | 9.0 | 442.6 | 300 | 1148 |
| Number | Lithology | Land Use | Method | Time | Irrigation |
|---|---|---|---|---|---|
| ZD01 | clay, silt and sand | no human activities | chloride mass-balance | 105 years ago–10 October 2009 | no |
| LC01 | clay, silt | wheat, corn with straw mulch | Br− and 3H[16], modeling | 5 March 2003–23 September 2005 | flood |
| wheat and corn | modeling | 24 September 2005–27 September 2007 | |||
| wheat, corn with straw mulch | Br−, 3H | 14 December 2009–16 April 2011 | |||
| LC02 | clay, silt | wheat and corn | Br−, 3H | 14 December 2009–16 April 2011 | flood |
| LC03 | clay, silt | wheat and corn | Br−, 3H | 14 December 2009–16 April 2011 | flood |
| LC04 | clay, silt | wheat and corn | Br−, 3H | 14 December 2009–16 April 2011 | flood |
| LC05 | clay, silt | no human activities | Br− | 14 December 2009–16 April 2011 | no |
| LC06 | clay, silt | no human activities | Br− | 14 December 2009–16 April 2011 | no |
| LC07 | clay, silt | no human activities | Br− | 14 December 2009–16 April 2011 | no |
| LC08 | clay, silt | grass | Br−, 3H | 14 December 2009–16 April 2011 | no |
| HS01 | clay | wheat and corn | Br−, 3H | 20 December 2009–20 April 2011 | furrow |
| HS02 | clay | wheat, corn with straw mulch | Br−, 3H | 20 December 2009–20 April 2011 | flood |
| HS03 | clay | no human activities | Br− | 20 December 2009–20 April 2011 | no |
| HS04 | clay | no human activities | Br− | 20 December 2009–20 April 2011 | no |
| HS05 | clay | no human activities | Br− | 20 December 2009–20 April 2011 | no |
| HS06 | clay | no human activities | Br− | 20 December 2009–20 April 2011 | no |
| HS07 | clay | no human activities | Br− | 20 December 2009–20 April 2011 | no |
| HS08 | clay | wheat and corn | Br− | 20 December 2009–20 April 2011 | sprinkling |
| Number | Tracer | Recharge | Injecting Depth (m) | |||
|---|---|---|---|---|---|---|
| Multi-Region | Peak | Mass Balance | Mean * | |||
| LC01 | Bromide | 149.5 | 160.8 | - | 149.5 | 2.0 |
| Tritium | 167.5 | 160.8 | - | 167.5 | ||
| LC02 | Bromide | 154.2 | 141.0 | - | 154.2 | 2.0 |
| Tritium | 159.4 | 141.0 | - | 159.4 | ||
| LC03 | Bromide | 142.6 | 110.4 | - | 142.6 | 3.0 |
| Tritium | 127.8 | 110.4 | - | 127.8 | ||
| LC04 | Bromide | 147.8 | 135.0 | - | 147.8 | 4.0 |
| Tritium | 129.9 | 135.0 | - | 129.9 | ||
| LC05 | Bromide | 96.0 | 68.5 | - | 96.0 | 2.0 |
| LC06 | Bromide | 76.6 | 54.8 | - | 76.6 | 3.0 |
| LC07 | Bromide | 64.0 | 0.0 | - | 64.0 | 4.0 |
| LC08 | Bromide | 83.6 | 62.7 | - | 83.6 | 2.0 |
| Tritium | 116.8 | 62.7 | - | 116.8 | 2.0 | |
| HS01 | Bromide | 18.3 | 0.0 | 17.8 | 18.05 | 2.0 |
| Tritium | 17.6 | 0.0 | - | 17.6 | ||
| HS02 | Bromide | 17.5 | 0.0 | 17.3 | 17.4 | 2.0 |
| Tritium | 17.2 | 0.0 | - | 17.2 | ||
| HS03 | Bromide | 16.6 | 0.0 | 16.3 | 16.45 | 2.0 |
| Tritium | 16.1 | 0.0 | - | 16.1 | ||
| HS04 | Bromide | 20.5 | 0.0 | 19.7 | 20.1 | 2.5 |
| HS05 | Bromide | 18.9 | 0.0 | 18.7 | 18.8 | 3.0 |
| HS06 | Bromide | 18.5 | 0.0 | 18.1 | 18.3 | 3.5 |
| HS07 | Bromide | 19.9 | 0.0 | 19.5 | 19.7 | 4.0 |
| HS08 | Bromide | 19.2 | 0.0 | 17.4 | 18.3 | 2.0 |
| Parameter | θr (cm3/cm3) | θs (cm3/cm3) | α (cm−1) | n (-) | Ks (cm/d) | L (cm/cm) |
|---|---|---|---|---|---|---|
| Initial estimate | 0.09 | 0.365 | 0.0151 | 1.5 | 1.6 | 0.5 |
| Minimum value | - | - | 0.01 | 1.1 | 0.2 | - |
| Maximum value | - | - | 1 | 3.0 | 60.0 | - |
| Optimized value | 0.09 | 0.365 | 0.1029 | 1.279 | 36.61 | 0.5 |
| Time | 2003 | 2004 | 2005 | 2006 | 2007 |
|---|---|---|---|---|---|
| Recharge rate (mm/year) | 340 | 230 | 230 | 106 | 90 |
| Recharge coefficient (%) | 42.3 | 27.3 | 26.6 | 15.3 | 13.4 |
© 2016 by the authors; licensee MDPI, Basel, Switzerland. This article is an open access article distributed under the terms and conditions of the Creative Commons Attribution (CC-BY) license (http://creativecommons.org/licenses/by/4.0/).
Share and Cite
Wu, Q.; Wang, G.; Zhang, W.; Cui, H.; Zhang, W. Estimation of Groundwater Recharge Using Tracers and Numerical Modeling in the North China Plain. Water 2016, 8, 353. https://doi.org/10.3390/w8080353
Wu Q, Wang G, Zhang W, Cui H, Zhang W. Estimation of Groundwater Recharge Using Tracers and Numerical Modeling in the North China Plain. Water. 2016; 8(8):353. https://doi.org/10.3390/w8080353
Chicago/Turabian StyleWu, Qinghua, Guiling Wang, Wei Zhang, Haodong Cui, and Wei Zhang. 2016. "Estimation of Groundwater Recharge Using Tracers and Numerical Modeling in the North China Plain" Water 8, no. 8: 353. https://doi.org/10.3390/w8080353