Article

Implications of Human Activities, Land Use Changes and Climate Variability in Mediterranean Lakes of Greece

by
Konstantinos Stefanidis
1,2,
Aikaterini Kostara
1 and
Eva Papastergiadou
1,*
1
Department of Biology, School of Natural Sciences, University of Patras University Campus Rio, GR 26500 Patras, Greece
2
Department of Water Resources and Environmental Engineering, School of Civil Engineering, National Technical University of Athens (NTUA), 5, Iroon Politechniou Street, 15780 Zografou, Athens, Greece
*
Author to whom correspondence should be addressed.
Water 2016, 8(11), 483; https://doi.org/10.3390/w8110483
Submission received: 29 June 2016 / Revised: 5 October 2016 / Accepted: 19 October 2016 / Published: 26 October 2016
(This article belongs to the Special Issue Lake Restoration and Management in a Climate Change Perspective)

Abstract

:
Lakes in the Mediterranean climate zone experience high variation in rainfall and are vulnerable to changes in climate, land cover and anthropogenically induced effects on water level and salinity. This paper presents the results from the analyses of spatiotemporal changes of land cover/uses at catchment scale of two connected lakes in Greece that have recently exhibited a dramatic loss of water volume, and investigates the potential role of climate change as a main driver of the lake water loss. The classification of the historical land cover/uses was based on a series of LANDSAT images from 1972 to 2011. Changes in the landscape structure were assessed using landscape metrics that were calculated with FRAGSTATS software. Climate data and temporal series of water level, conductivity and chloride concentration, were analyzed to investigate the potential role of climate variability to the lake hydrology and water quality. The results showed that between 1972 and 2011 almost 28% of Lake Vegoritis and 13% of Lake Petron were replaced by cultivations and reed beds. Landscape metrics showed that the lake catchment’s area is highly fragmented, indicating a heterogeneous spatial pattern and degradation of the rural habitats. Regarding the climatic factors, it appears that precipitation follows a declining trend correlating with water level fluctuations. The water level in Lake Vegoritis also correlated with the conductivity and chloride concentration, indicating a relationship between hydrological alteration and water quality. Overall, a combined effect of climate- and human-induced land cover changes appeared to be responsible for the drastic environmental changes that urge the need for implementing effective restoration and mitigation measures.

1. Introduction

Land cover/use alterations are widely considered as a dominant stressor for the water quality and freshwater ecosystems status within watersheds [1]. In particular, human activities and climate change are considered the most important factors that determine the impact of land cover/use changes on the water bodies around the world [2,3]. On a catchment scale, land uses associated with human presence can significantly alter natural hydrological processes such as runoff and ground water recharge with subsequent effect on the balance between supply and demand of water resources [1,4]. In particular, the hydrology of the freshwater ecosystems, especially those of the dry regions of the world, significantly relies on water level fluctuations, which are closely related to the human pressure from irrigated cultivations [5]. Moreover, land cover/use changes also affect ecosystem processes like nutrient transportation from watershed sources to lakes [6]. In addition, land cover/use changes may not only increase the demands for domestic and agricultural use of water but can also affect nutrient loading and nutrient leaching mechanisms.
In the Mediterranean region, climate change is expected to enhance many of these processes not only through changes in the major climate variables (precipitation, air temperature) but also due to predicted land use alterations. Recently, Pulido-Velasquez et al. [7] showed that the combined climate and land use change scenarios predicted a larger effect on the groundwater recharge in the Mancha Oriental aquifer system than climate change only. Such effects are likely to lower water tables and affect water supply, especially in areas where water abstraction will be intensified in order to meet the growing demand for water [8]. Other examples from Greece showed that historical land cover/use changes of lakes and wetlands revealed a significant shrinkage of water surface and its replacement with other types of land cover, mainly cultivations [9,10,11]. Consequently, these land use changes combined with climate induced hydrologic alterations are expected to have a drastic effect on the ecology of freshwater lakes, including changes of the biotic communities, eutrophication enhancement, increase of turbidity and a shift to brackish or even saline conditions [12,13,14]. Therefore, understanding the dynamics of land cover/uses in a changing climate and their impacts on freshwater systems is a matter of priority for remote sensing and landscape ecology.
Remote sensing techniques are commonly used throughout the world to monitor land cover/use changes [15,16]. Particularly in lake ecology, satellite images and aerial historical photos can provide detailed information on the spatiotemporal changes of land cover/uses and can therefore be used to assess the impacts on various components of ecosystem integrity [15,17]. Recently, Pilgrim et al. [15] applied remote sensing analysis to assess the changes of water quality in a lake of South Carolina (USA) due to related changes of the catchment’s land cover. Other studies investigated the role of climate change for the spatiotemporal changes of lake area [15,16], showing that remote sensing techniques have the potential to be an efficient tool for assessing the role of multiple pressures on lake ecosystems.
In this paper, we investigated the spatial and temporal changes of land cover/use and landscape structure of two connected Greek lakes that have exhibited a dramatic loss of water volume during the last four decades. We also examined the potential role of climate as a main driver of the water loss by assessing climate data (precipitation, mean air temperature, evapotranspiration and aridity index) for a thirty-year period and identify climate change trends in the area that might have influenced the pattern of the inter-annual water level fluctuations and land cover/use and landscape changes. Land cover changes were highlighted using remote sensing and spatial analysis techniques and the results were associated with major consequential ecological changes that have been recorded in the case study. Additionally, temporal landscape changes were examined using of commonly applied landscape metrics. Results were examined and discussed within the framework of the overall ecological impact.

2. Materials and Methods

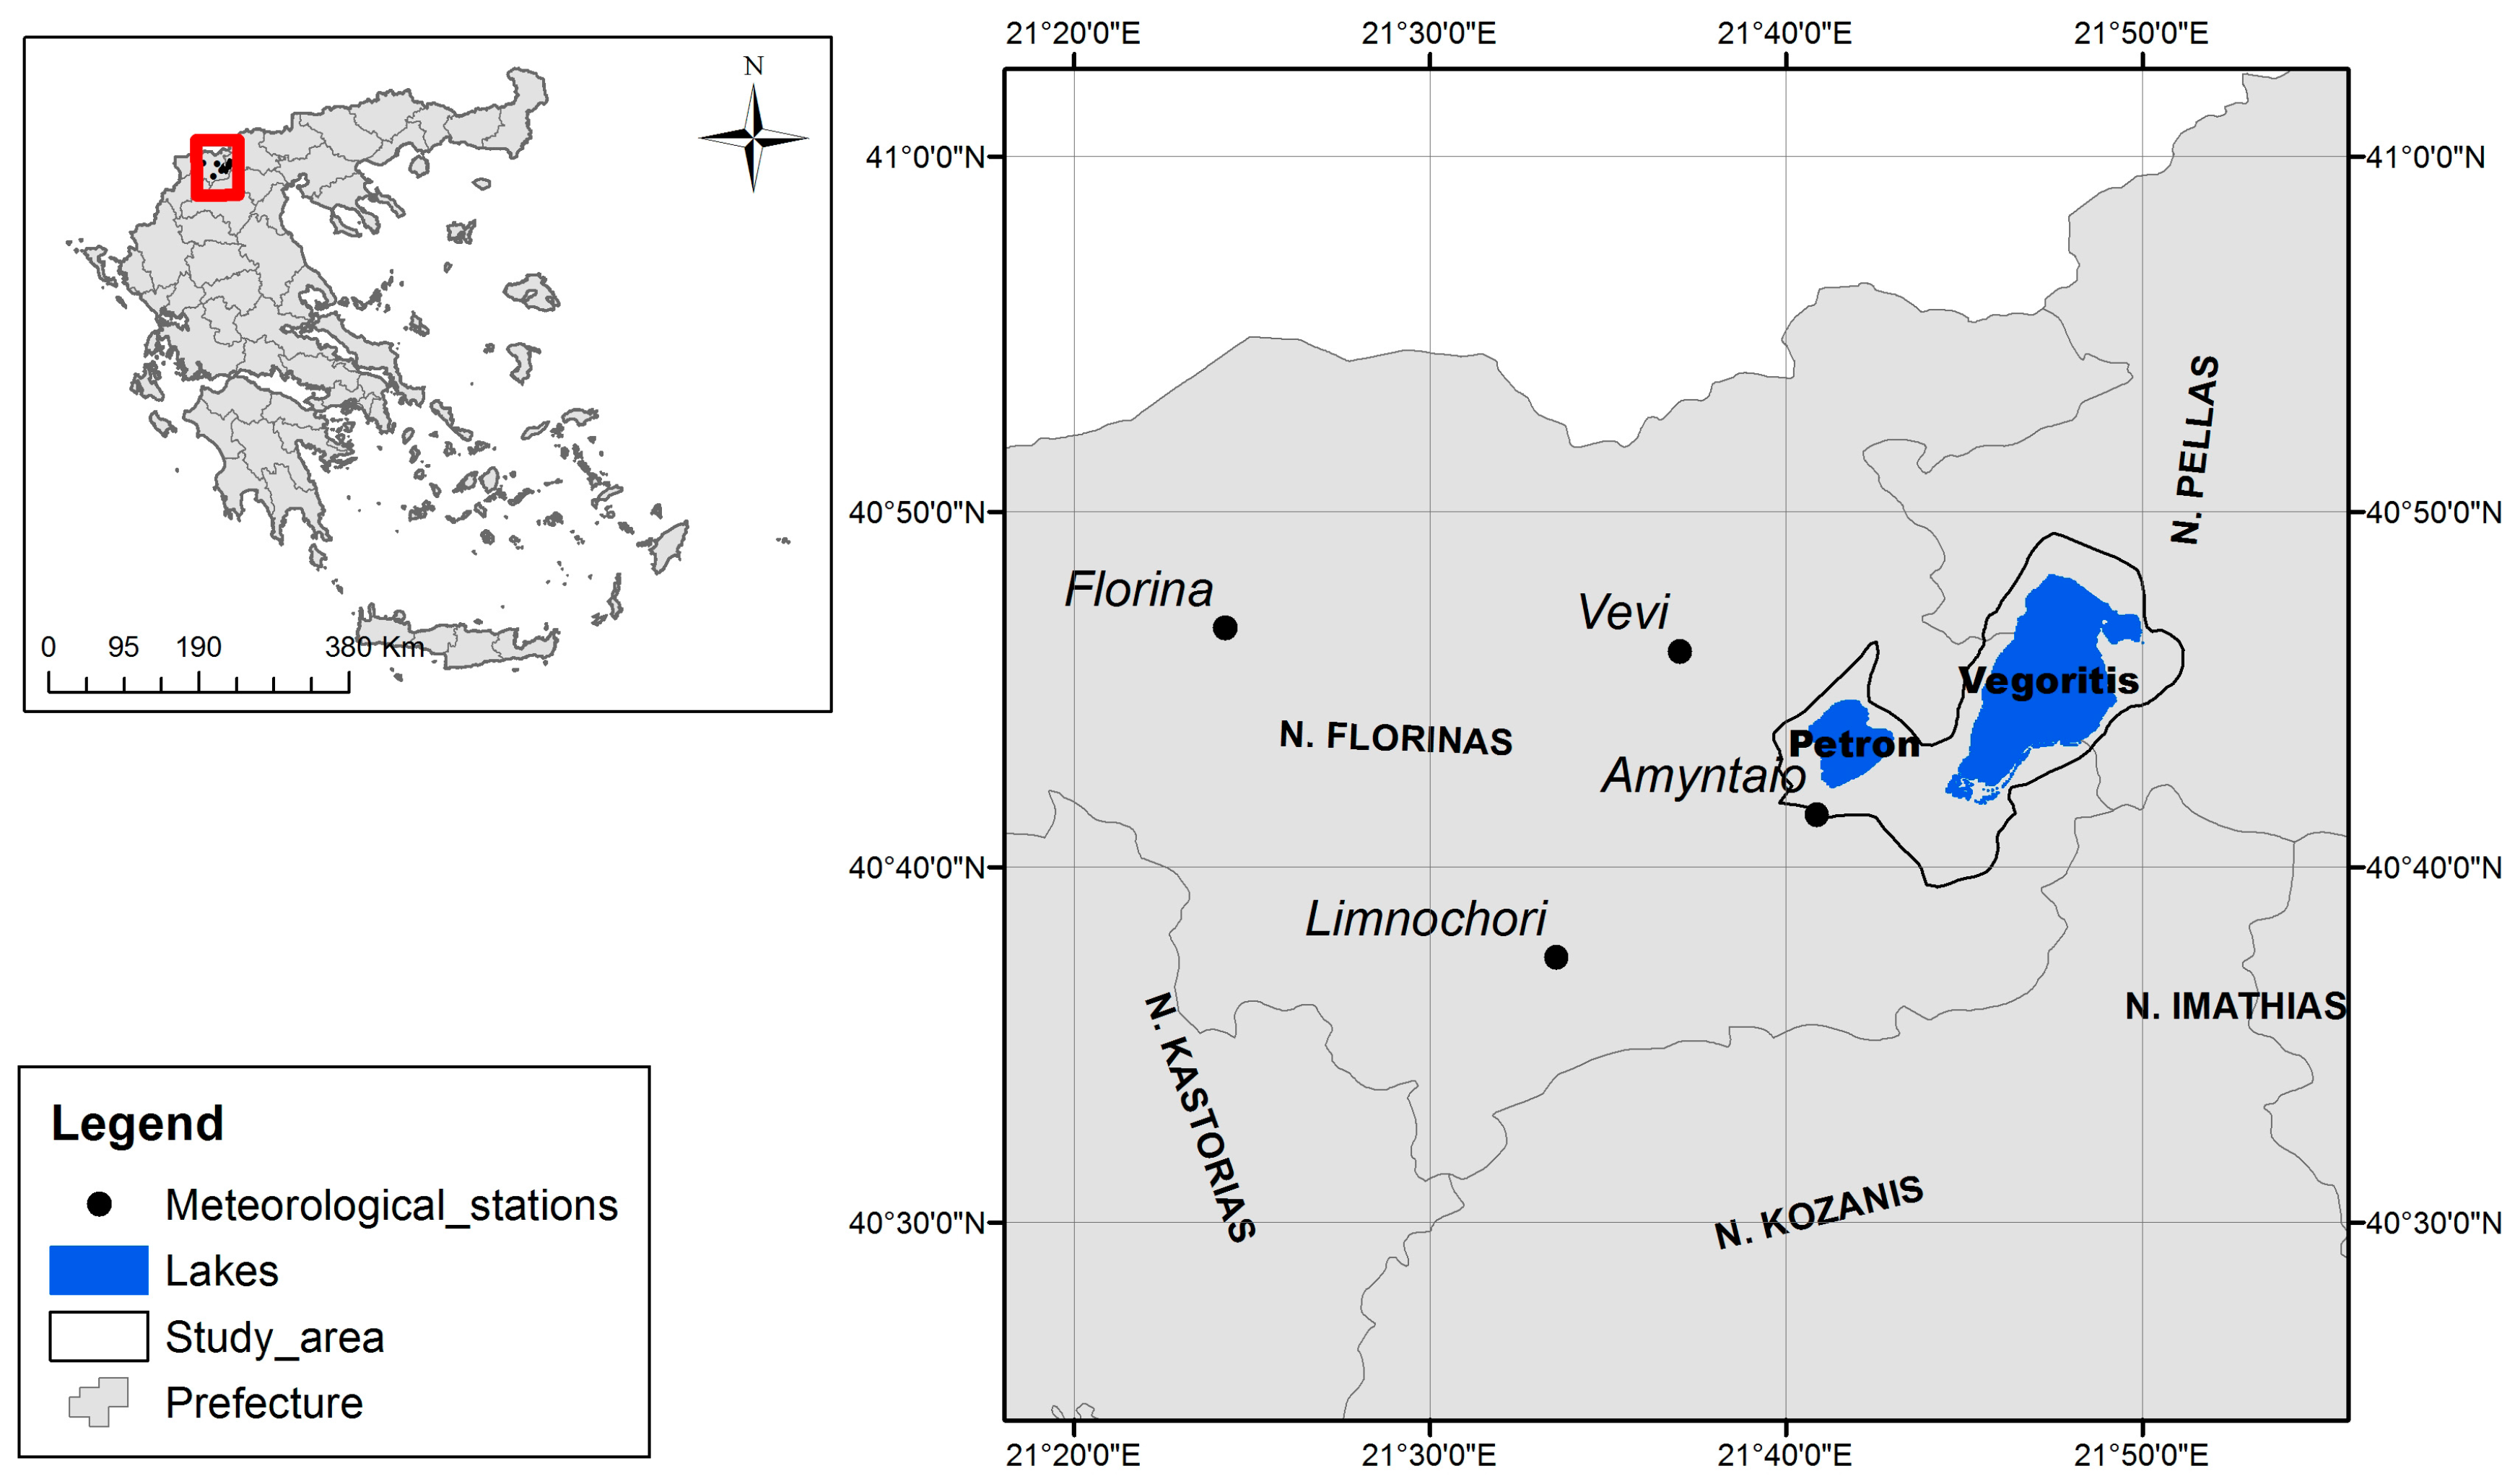
2.1. Description of the Study Area
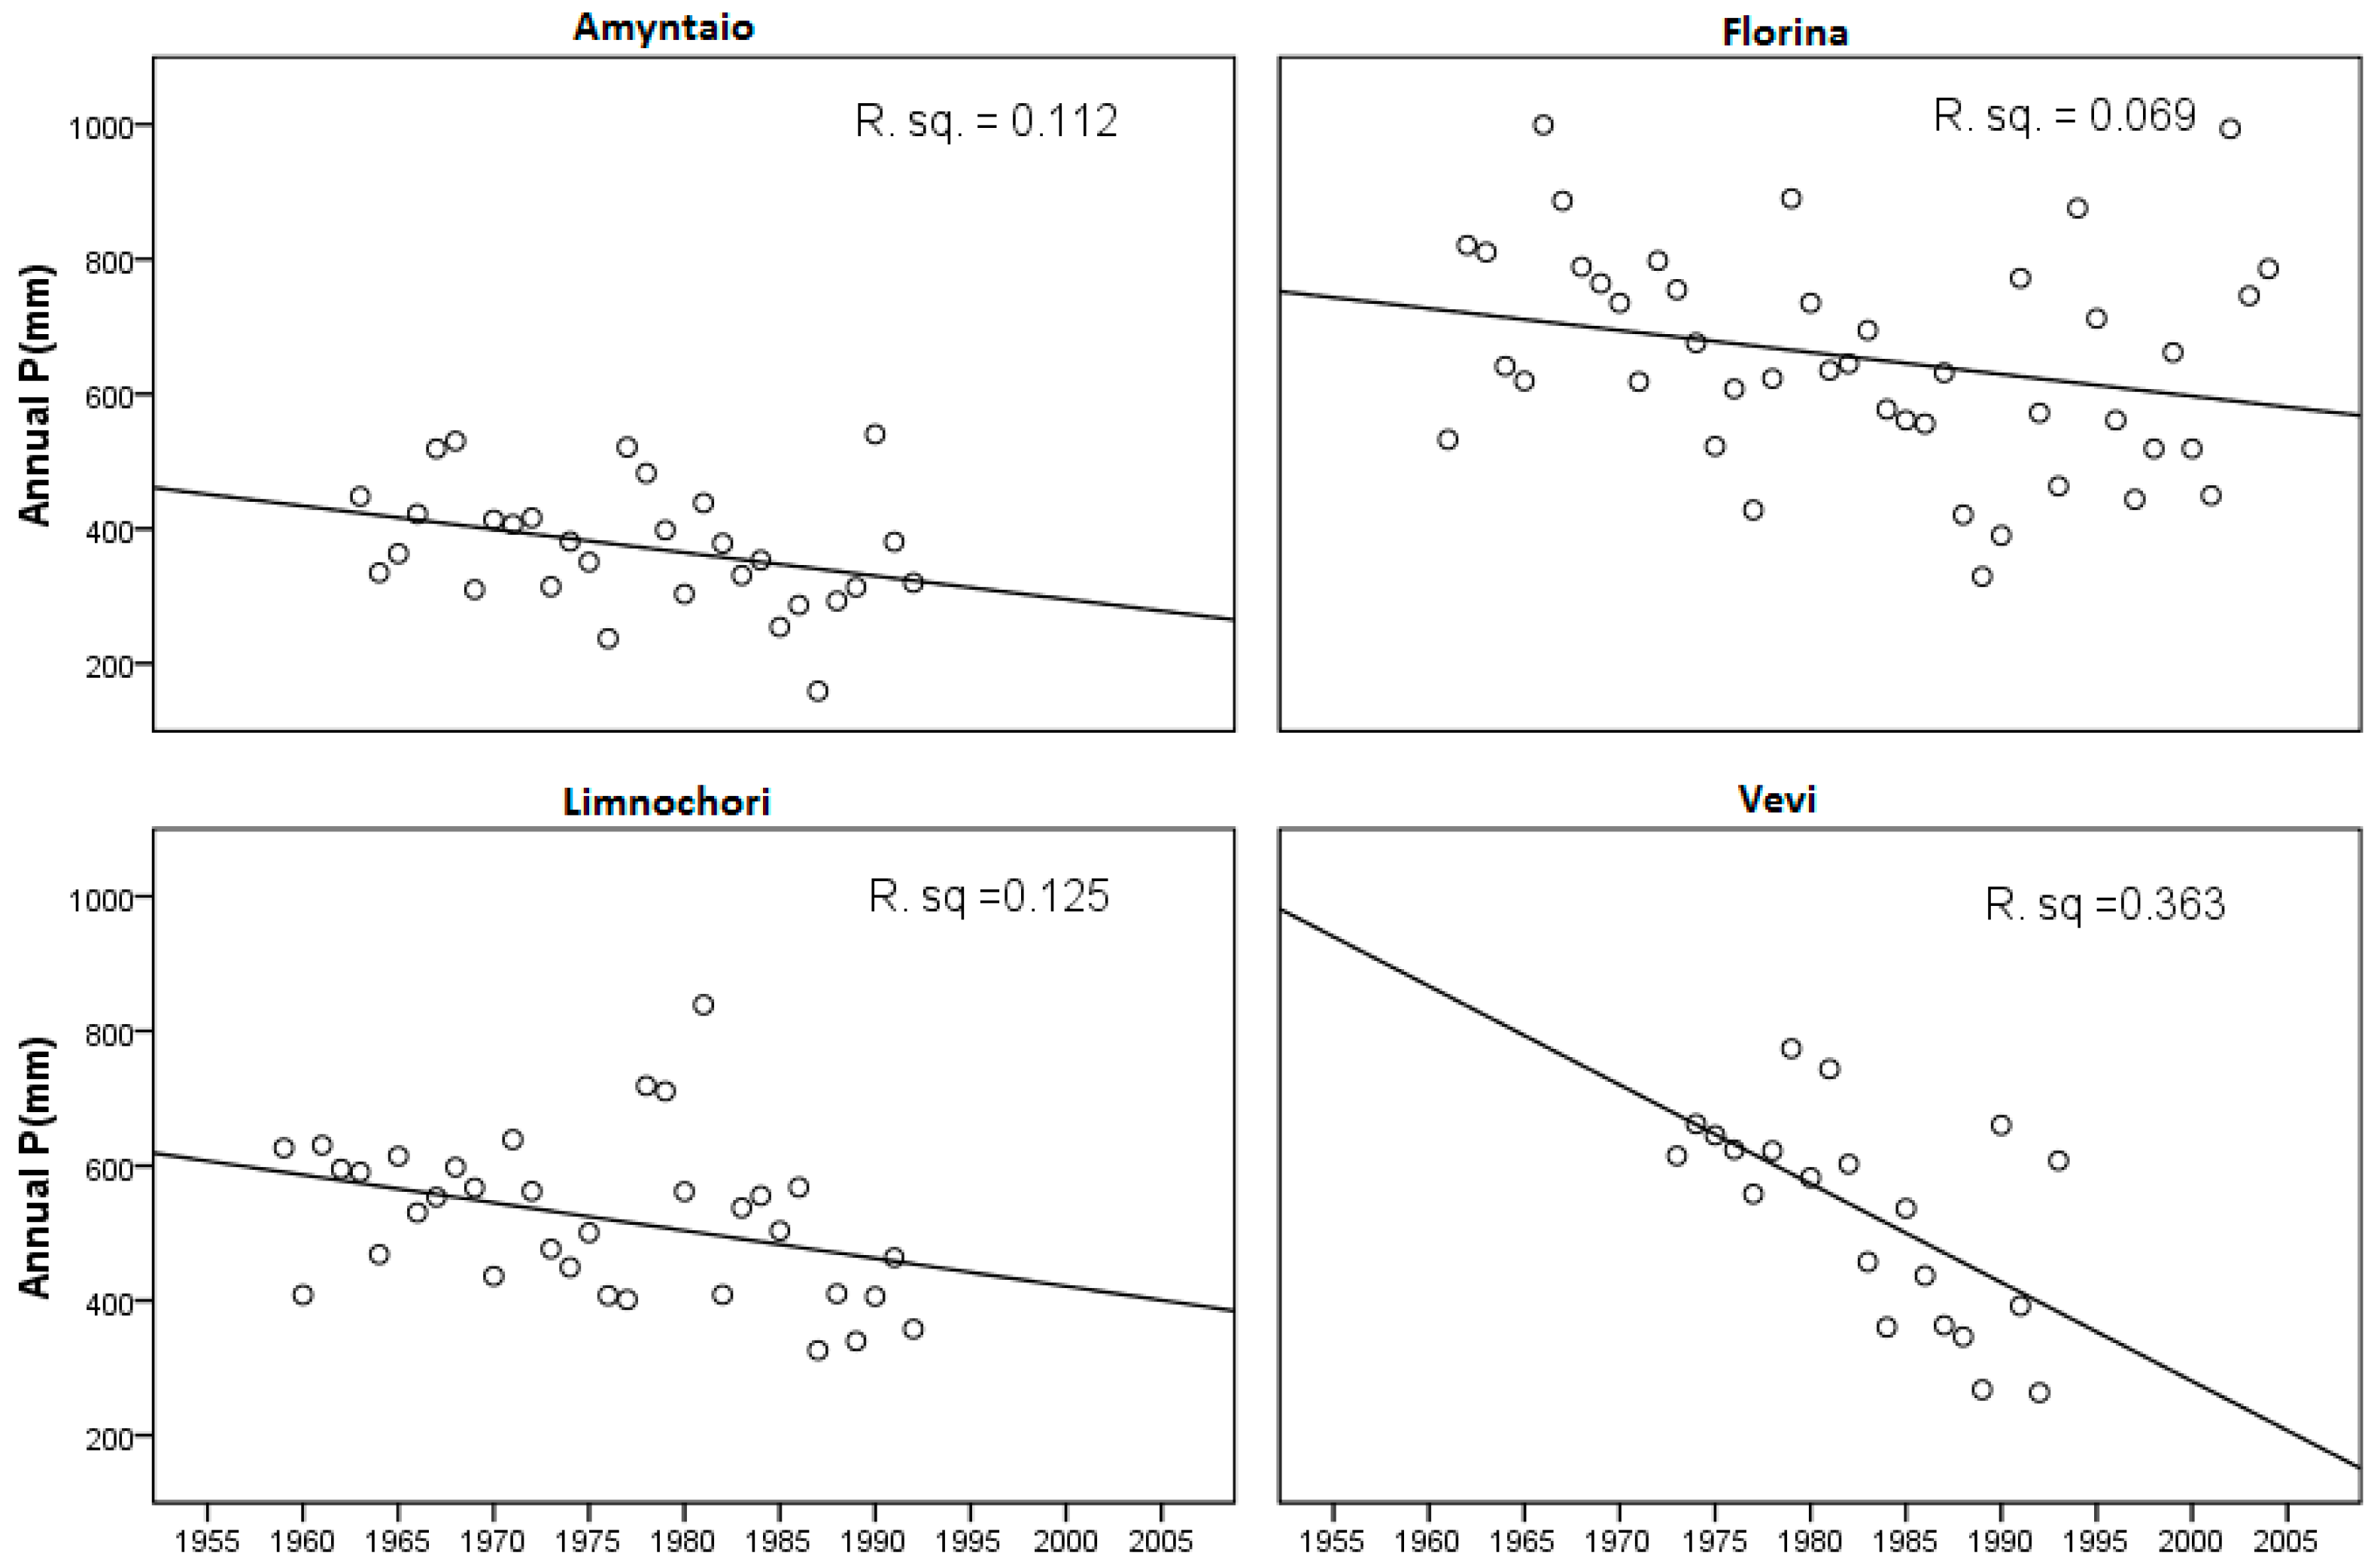
Vegoritis and Petron are two Mediterranean karstic lakes located in the northern part of Greece (Macedonia region) and are listed in the protected areas of the Natura 2000 network (Figure 1). The whole Natura 2000 site is surrounded by high mountains at the northeastern and northwestern boundaries, while in the southern flat part a large plain area extends [18]. Agricultural activity and urban development are mainly located within the southern part of the basin. The important geological formations of the area include mostly metamorphic siliceous rocks and calcareous formations [18]. The climate of the area is semi-dry, Mediterranean, with two distinct, warm-dry and cold-wet, periods.
Lake Vegoritis is an ice-free lake [19], with a surface area of approximately 40 km2 and a mean depth of 28.9 m and a maximum depth of approximately 40 m. For the last five decades, the lake has suffered from various environmental pressures, such as agricultural and industrial driven pollution. The water volume of the lake has decreased dramatically, causing a water level drop of approximately 32 m, from 542 m a.s.l. in 1956 to 510 m a.s.l. in 2002. This water level change has coincided with a gradual change of the trophic state from oligotrophic at the beginning of the 1980s to mesotrophic during the 1990s [18,19]. Lake Vegoritis receives inflow from the smaller and shallower Lake Petron that is situated a few kilometers away. Lake Petron has a surface area of 8 km2, a mean depth of 2.6 m and a maximum depth of 5 m. The lake used to be deeper with a maximum depth of around 10 m, but due to changes of the hydrological regime in the area the water volume has decreased, causing reed beds to expand in the shallower part of the lake.

2.2. Climate Data

In order to investigate the trends of precipitation and air temperature of the studied area, we used all available data from four meteorological stations from 1959 to 1994. We then calculated the potential evapotranspiration (PET) based on the Thornthwaite method [20] according to the following equations:
P E T i = 1.6 × ( 10 T i / I ) × a
where Ti is the mean monthly temperature and I is an empirical factor calculated from the sum of the twelve mean air temperatures
I = ( T i / 5 )
The factor a is given by the following formula:
a = (6.75 × 10⁻⁷)I3 − (7.71 × 10⁻⁵)I2 + (1.792 × 10⁻²)I + 0.49239
The PET values were used in order to calculate the Aridity Index [21] according to the following equation:
A I = P / P E T
where P is the annual precipitation and PET is the evapotranspiration.
The AI is a climatic index that can be used to quantify the precipitation availability over the atmospheric water demand [21]. According to the classification limits of AI (Table 1), the AI can be used to identify the wet and the dry years.

2.3. Water Level and Chemistry Data

In addition to the climate data, we acquired long-term water level data from the Department of Environment, Region of Western Macedonia for the period 1896 to 2002. We also used time series of electrical conductivity and chloride concentration measurements ranging from 1983 to 2011. Chloride concentration and conductivity have been used in several studies as indicators for salinization process and water quality deterioration related to climate change [22,23].

2.4. Satellite Image Pre-Processing and Interpretation of Satellite Image Time Series

Four series of LANDSAT images (1972, 1984, 2002 and 2011) were acquired from the Global Orthorectified Landsat Data via FTP [24]. The most remarkable differences between Landsat MSS and TM sensors are recognized in spatial resolution (60 m and 30 m, respectively) and spectral properties [25]. Based on the selected MSS and TM dataset, a series of pre-processing has to be performed prior to the classification and change detection procedures. These steps include: (1) co-registration; and (2) radiometric calibration. In fact, change detection requires that image extracts pairs for the evaluation period have to be as comparable as possible in terms of geometric and radiometric qualities [25].
Regarding first step, all TM images were geometrically corrected to that of 2011; the MSS imagery MMS (1972) was also resampled to the TM (30 m) imagery resolution. Rectification resulted in the images having a root mean square error (RMSE) of <0.5 pixel. Radiometric correction was achieved by converting raw Digital Numbers (DN) into at-sensor spectral radiance and subsequently converted into top-of-atmosphere reflectance. Next, atmospheric correction was applied using the Dark Object Subtraction method (also known as the Darkest Pixel) [26,27].
Supervised classification was performed to extract land cover/use classes and the maximum likelihood classification algorithm was selected. Standard convolution ENVI’s Median filter was applied to enhance images by removing certain spatial frequencies. The method replaces each center pixel with the median value within the neighborhood specified by the filter size. In our case the default 3 × 3 Kernel was used [28]. A classification system of land cover/use types was developed (Table 2) and six classes were defined. A sufficient number of ROIs were selected in every image for different land cover/land use types. In order to evaluate the users and the producer’s accuracy, confusion matrices and kappa statistics were derived [29]. The kappa coefficient (k), which is a measure of the accuracy of the classification, was estimated from 91% for the image of 2002 to 98% for the image of 1972.
Land surveys of the area during the summer period of 2006, 2007 and 2008 were used for the ground truth of the image interpretation results. The accuracy of the older land cover maps was estimated using as reference data the Corine Land Cover 1990 and 2000 inventory. The performed classification resulted in four land cover/use maps. The images were converted into a vector format and data analysis was conducted using ArcGis 10.1 software (Environmental Systems Research Institute, Redlands, CA, USA). A spatio-temporal quantification of the land cover/use changes within the studied area was performed and a series of thematic maps was produced. Over the period covered by the four images, six land cover/use classes were identified in the study area. For each of the land cover/use classes, the extent and the total area were calculated.
Moreover, in order to quantify the inter-annual change in the water body area of the studied lakes, the traditional normalized difference water index (NDWI) method was applied. The NDWI is expressed as follows [30]:
N D W I = G R E E N N I R G R E E N + N I R
where GREEN is a green band such as TM band 2 and NIR is a near-infrared band such as TM band 4. This index is designed to maximize reflectance of water by using green wavelengths, minimize the low reflectance of NIR by water features, and take advantage of the high reflectance of NIR by vegetation and soil features. As a result, water features have positive values and thus are enhanced, while vegetation and soil usually have 0 or negative values and therefore are suppressed [31].
Changes at the landscape level were assessed using the landscape structure analysis program FRAGSTATS 4.1 software [32]. The number of patches (NP), the patch density (PD), the edge density (ED) and the largest patch index (LPI) for each year were computed using FRAGSTATS software (Oregon State University, Corvallis, OR, USA) [32].

2.5. Relationships between Climate, Water Level, Water Chemistry, Land Cover/Uses and Landscape Changes

In order to identify statistically significant relationships between the calculated PET and AI for each meteorological station and the water level of Lake Vegoritis we ran Spearman rank correlations (SPSS v 21). Similarly, Spearman correlations were run between water chemistry (electrical conductivity and chloride concentration) and water level data to highlight possible effects of the water level change on the chloride levels and the conductivity.
The assessment of the land cover/uses changes was based on a thematic overlay of the classifications performed for each image. Possible relationships between the temporal changes in the land cover/uses, the landscape metrics and the water level and climate data were qualitatively assessed.

3. Results

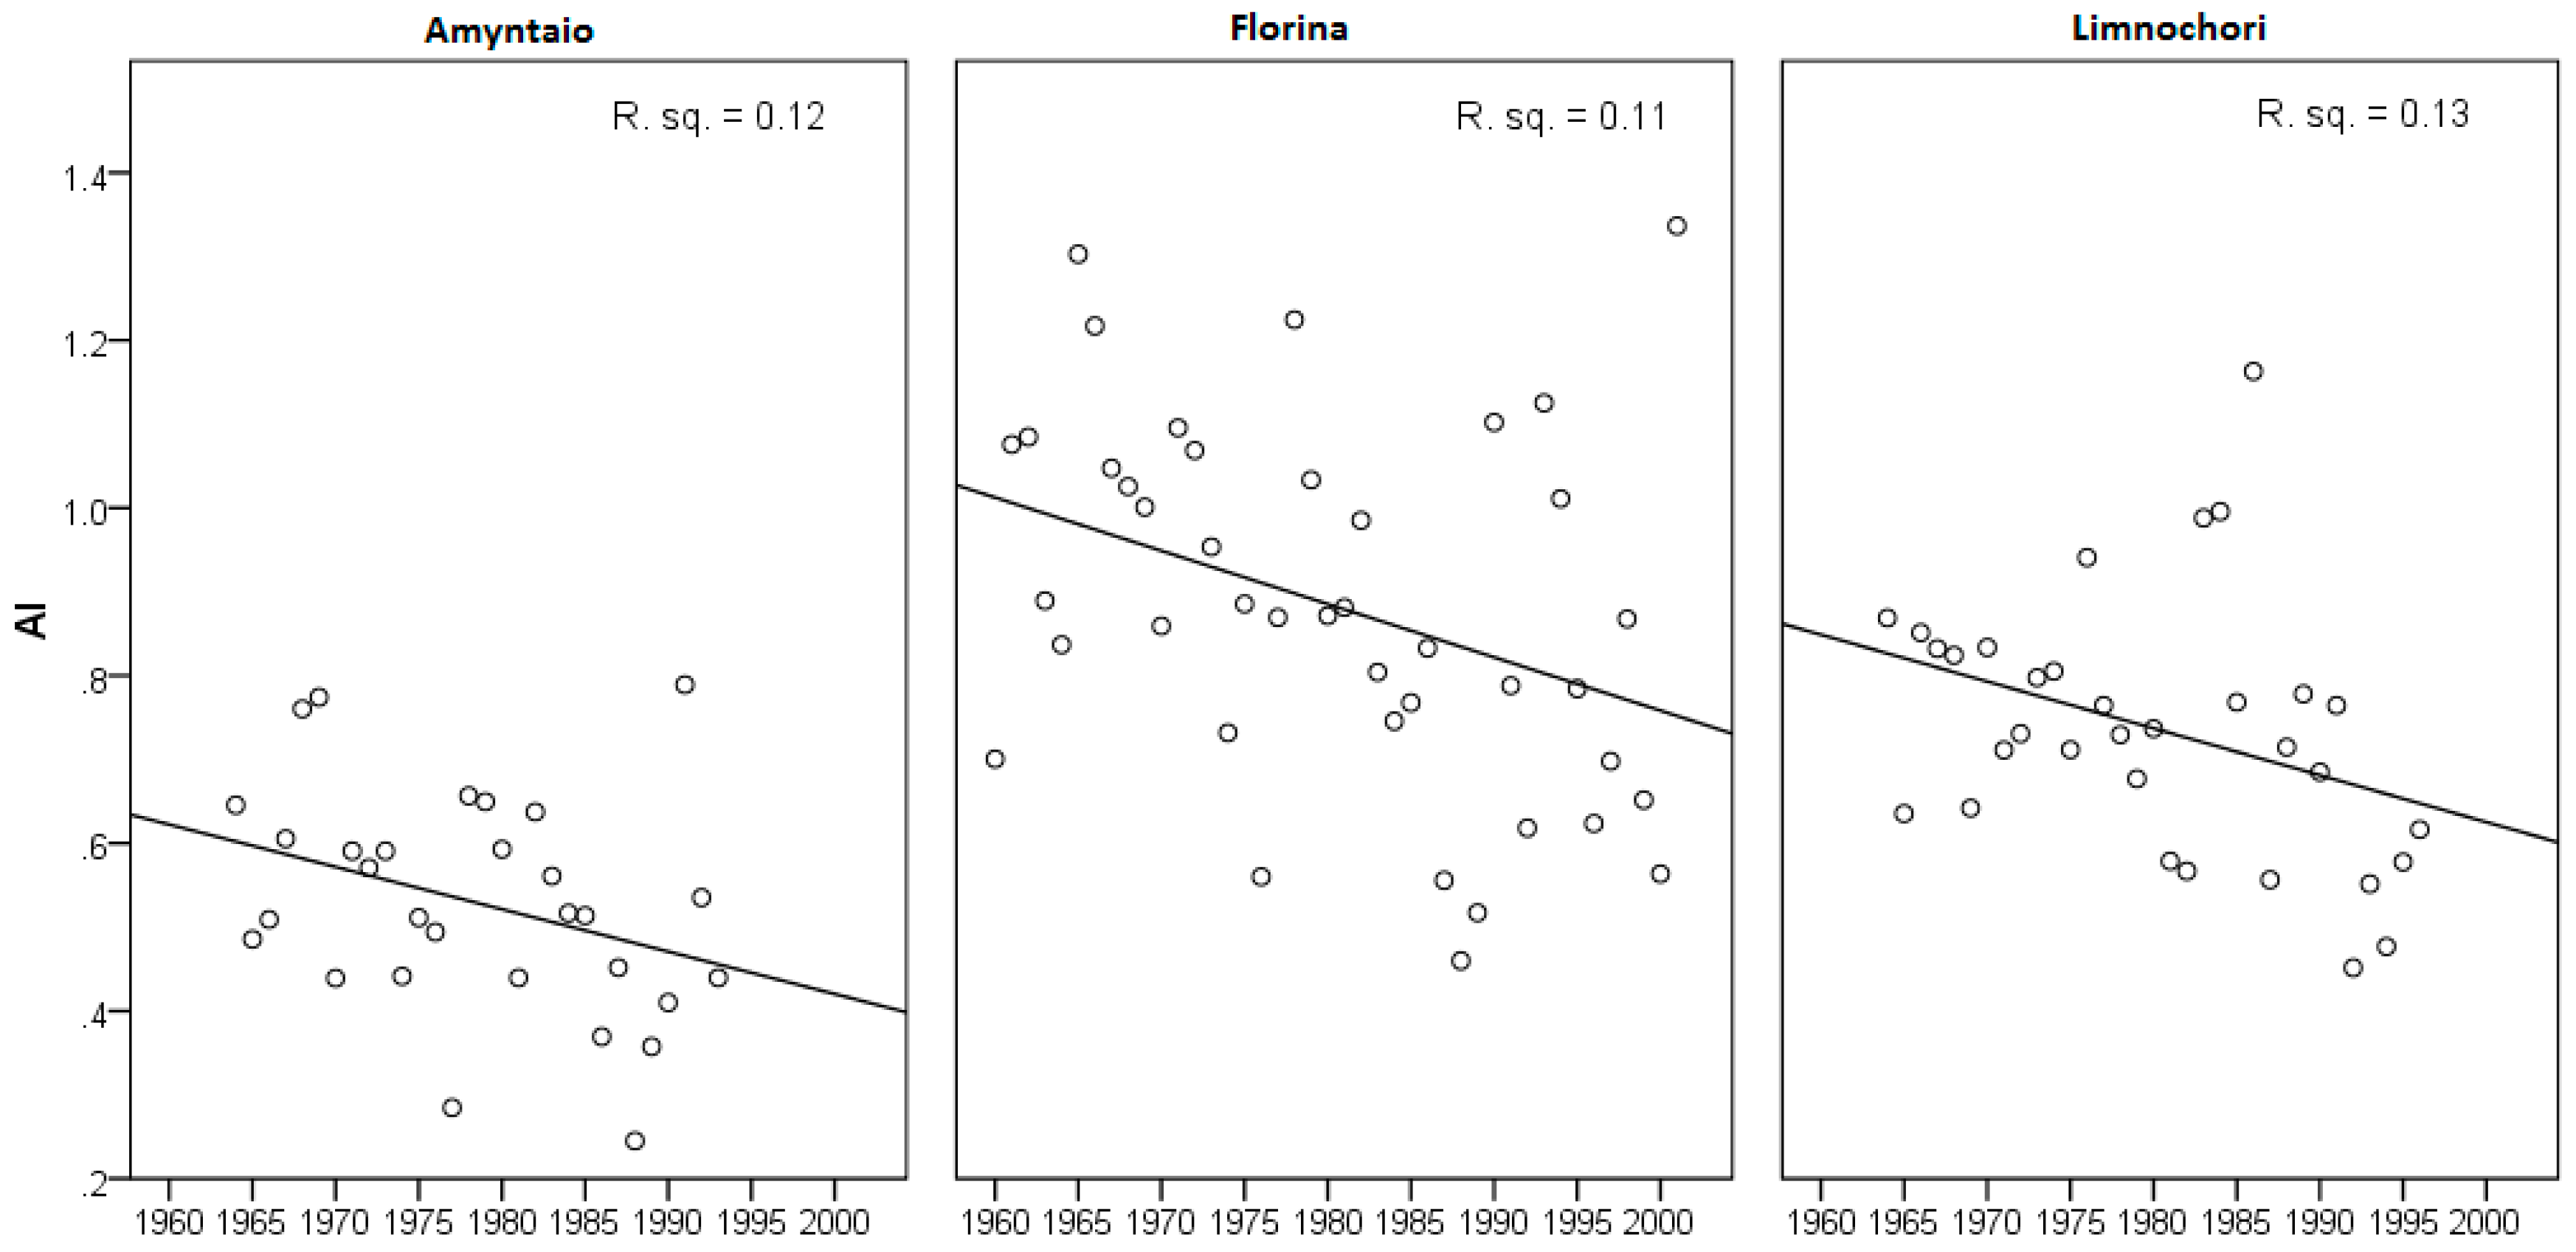
3.1. Impact of Climate Variability on the Water Level

The analyses of the climate data provided by the four separate meteorological stations clearly reveal a decreasing trend of precipitation from 1960 to the mid-1990s (Figure 2). Air temperature, on the other hand, showed practically zero changing trends. The general pattern within Greece and the eastern Mediterranean is decreasing precipitation and increasing air temperature [33,34].
The calculation of the Aridity Index (AI) firstly provides the advantage of identifying the dry and wet years in the studied area. The AI that was calculated based on air temperature and precipitation data from the closer meteorological station of Amyntaio and ranged from 0.25 (1988) to 0.78 (1991). The average value of AI for a thirty-year period (1963–1993) is 0.52, which marginally classifies the studied area as sub-humid (Table 1). However, there are several occasions where AI was below 0.5, corresponding to semi-arid drought conditions. Secondly, the temporal variation of the AI shows a decreasing trend (Figure 3); that is, the climate is becoming drier within the studied area and in the wider region.
In our investigation of whether there is an effect of climate trends on the water level reduction of the Lake Vegoritis, we identified clear positive correlations (Spearman rank) between the water level, aridity index and annual precipitation from two meteorological stations (Table 3). Specifically, the mean annual water level correlated significantly (p < 0.05) with the aridity index and the annual precipitation measured at the Florina station as well as with the aridity index and precipitation at the Limnochori station (p < 0.005 and 0.05, respectively).

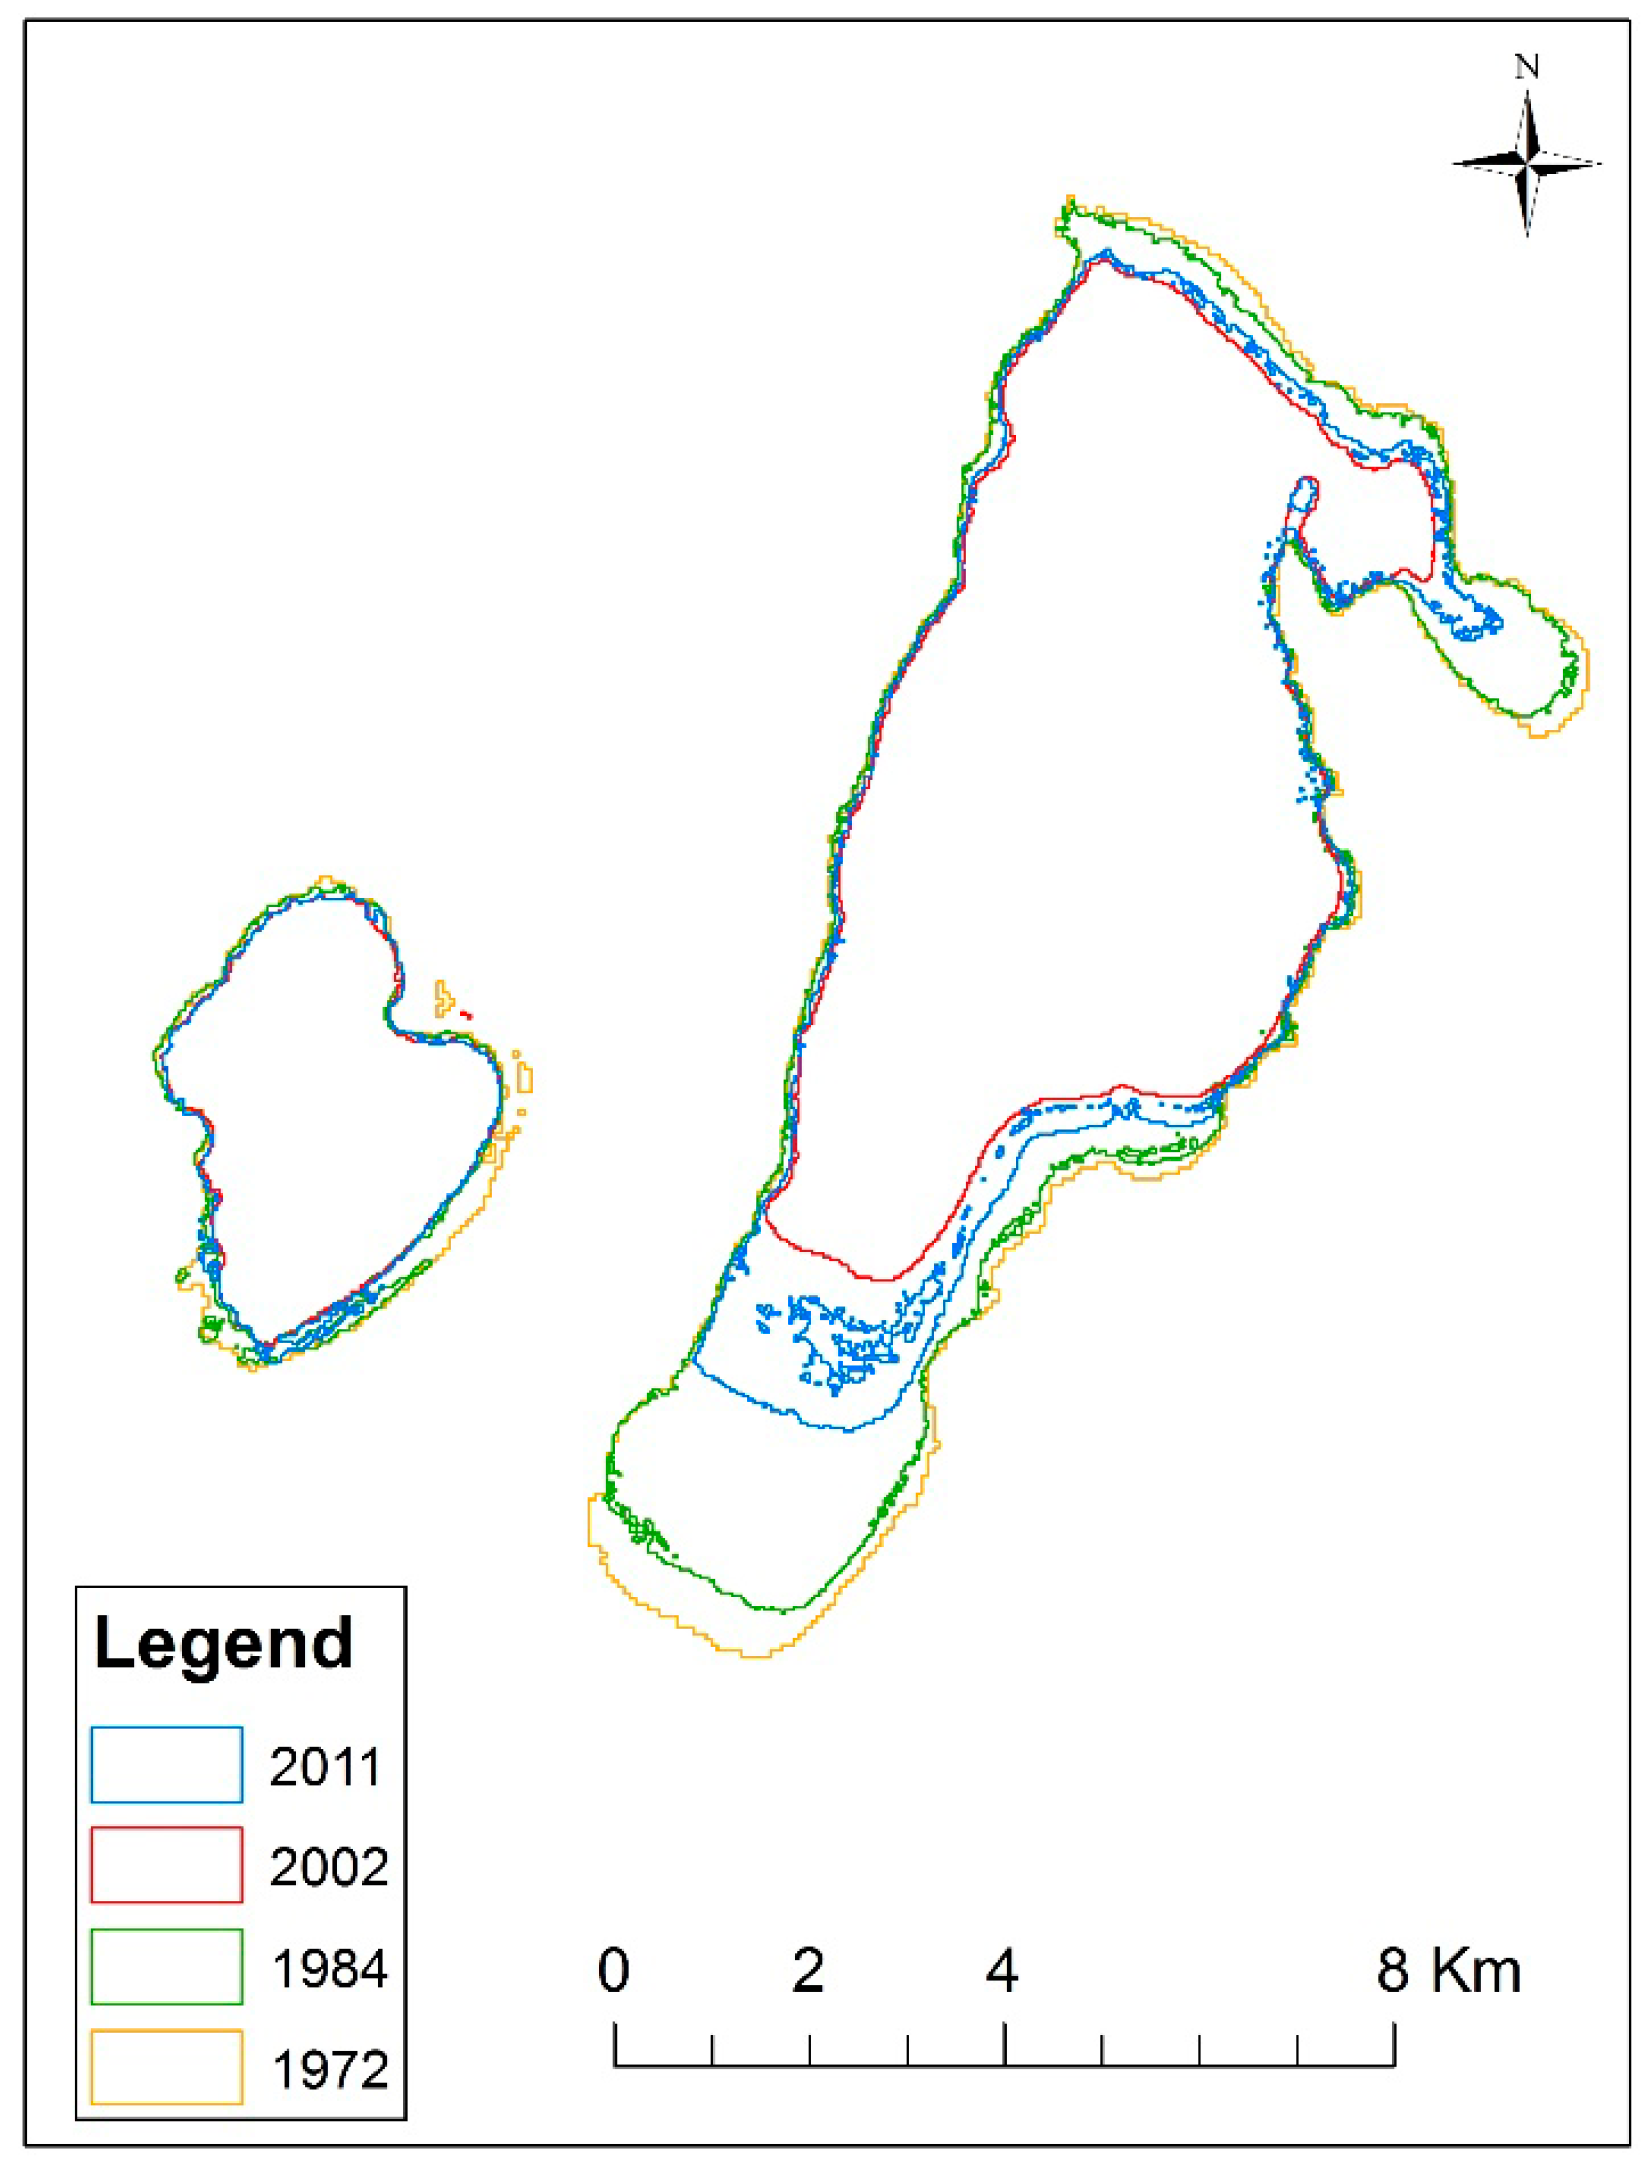
3.2. Change in Lake Area and Reed Beds

Table 4 presents the extent and the percentage (%) of the total area while Table 5 summarizes the successive percentage changes and the annual rate of change for each land cover/use class. Figure 4 illustrates a series of land use/cover maps for the studied area. The most significant and profound alteration that has taken place during the last forty years is the reduction of the open water area by 28.4% for Vegoritis and 12.7% for Petron (Table 5, Figure 4). From 1972 to 2002, there was a significant shrinkage of Lake Vegoritis by 1932 ha (Table 4). However, between 2002 and 2011, the results reveal a small but encouraging increase in the area of Lake Vegoritis by 9.2%, exhibiting some promising signs of recovery. What is crucial is that over the period covered by the four images, the reduction of water area is consistent with an increase of the irrigated cultivations in the studied area as a whole.
Figure 5 shows the inter-annual changes in the outline of both lakes from 1972 to 2011. A significant decline in the area of Lake Vegoritis is noted for the period 1972–1984. However, the biggest change occurred from 1984 to 2002 when a large part at the southern part dried. Between 2002 and 2011, the lake surface started to increase, flooding the dried areas. It is worth mentioning that from the overlay outline for 2011 we can distinguish small patches in the southern part of the lake that correspond to reeds and aquatic macrophytic vegetation. Regarding the Lake Petron, the largest change occurred from 1972 to 1984, as shown in Figure 5. The same conclusions can be drawn when examining the results presented in Table 4.

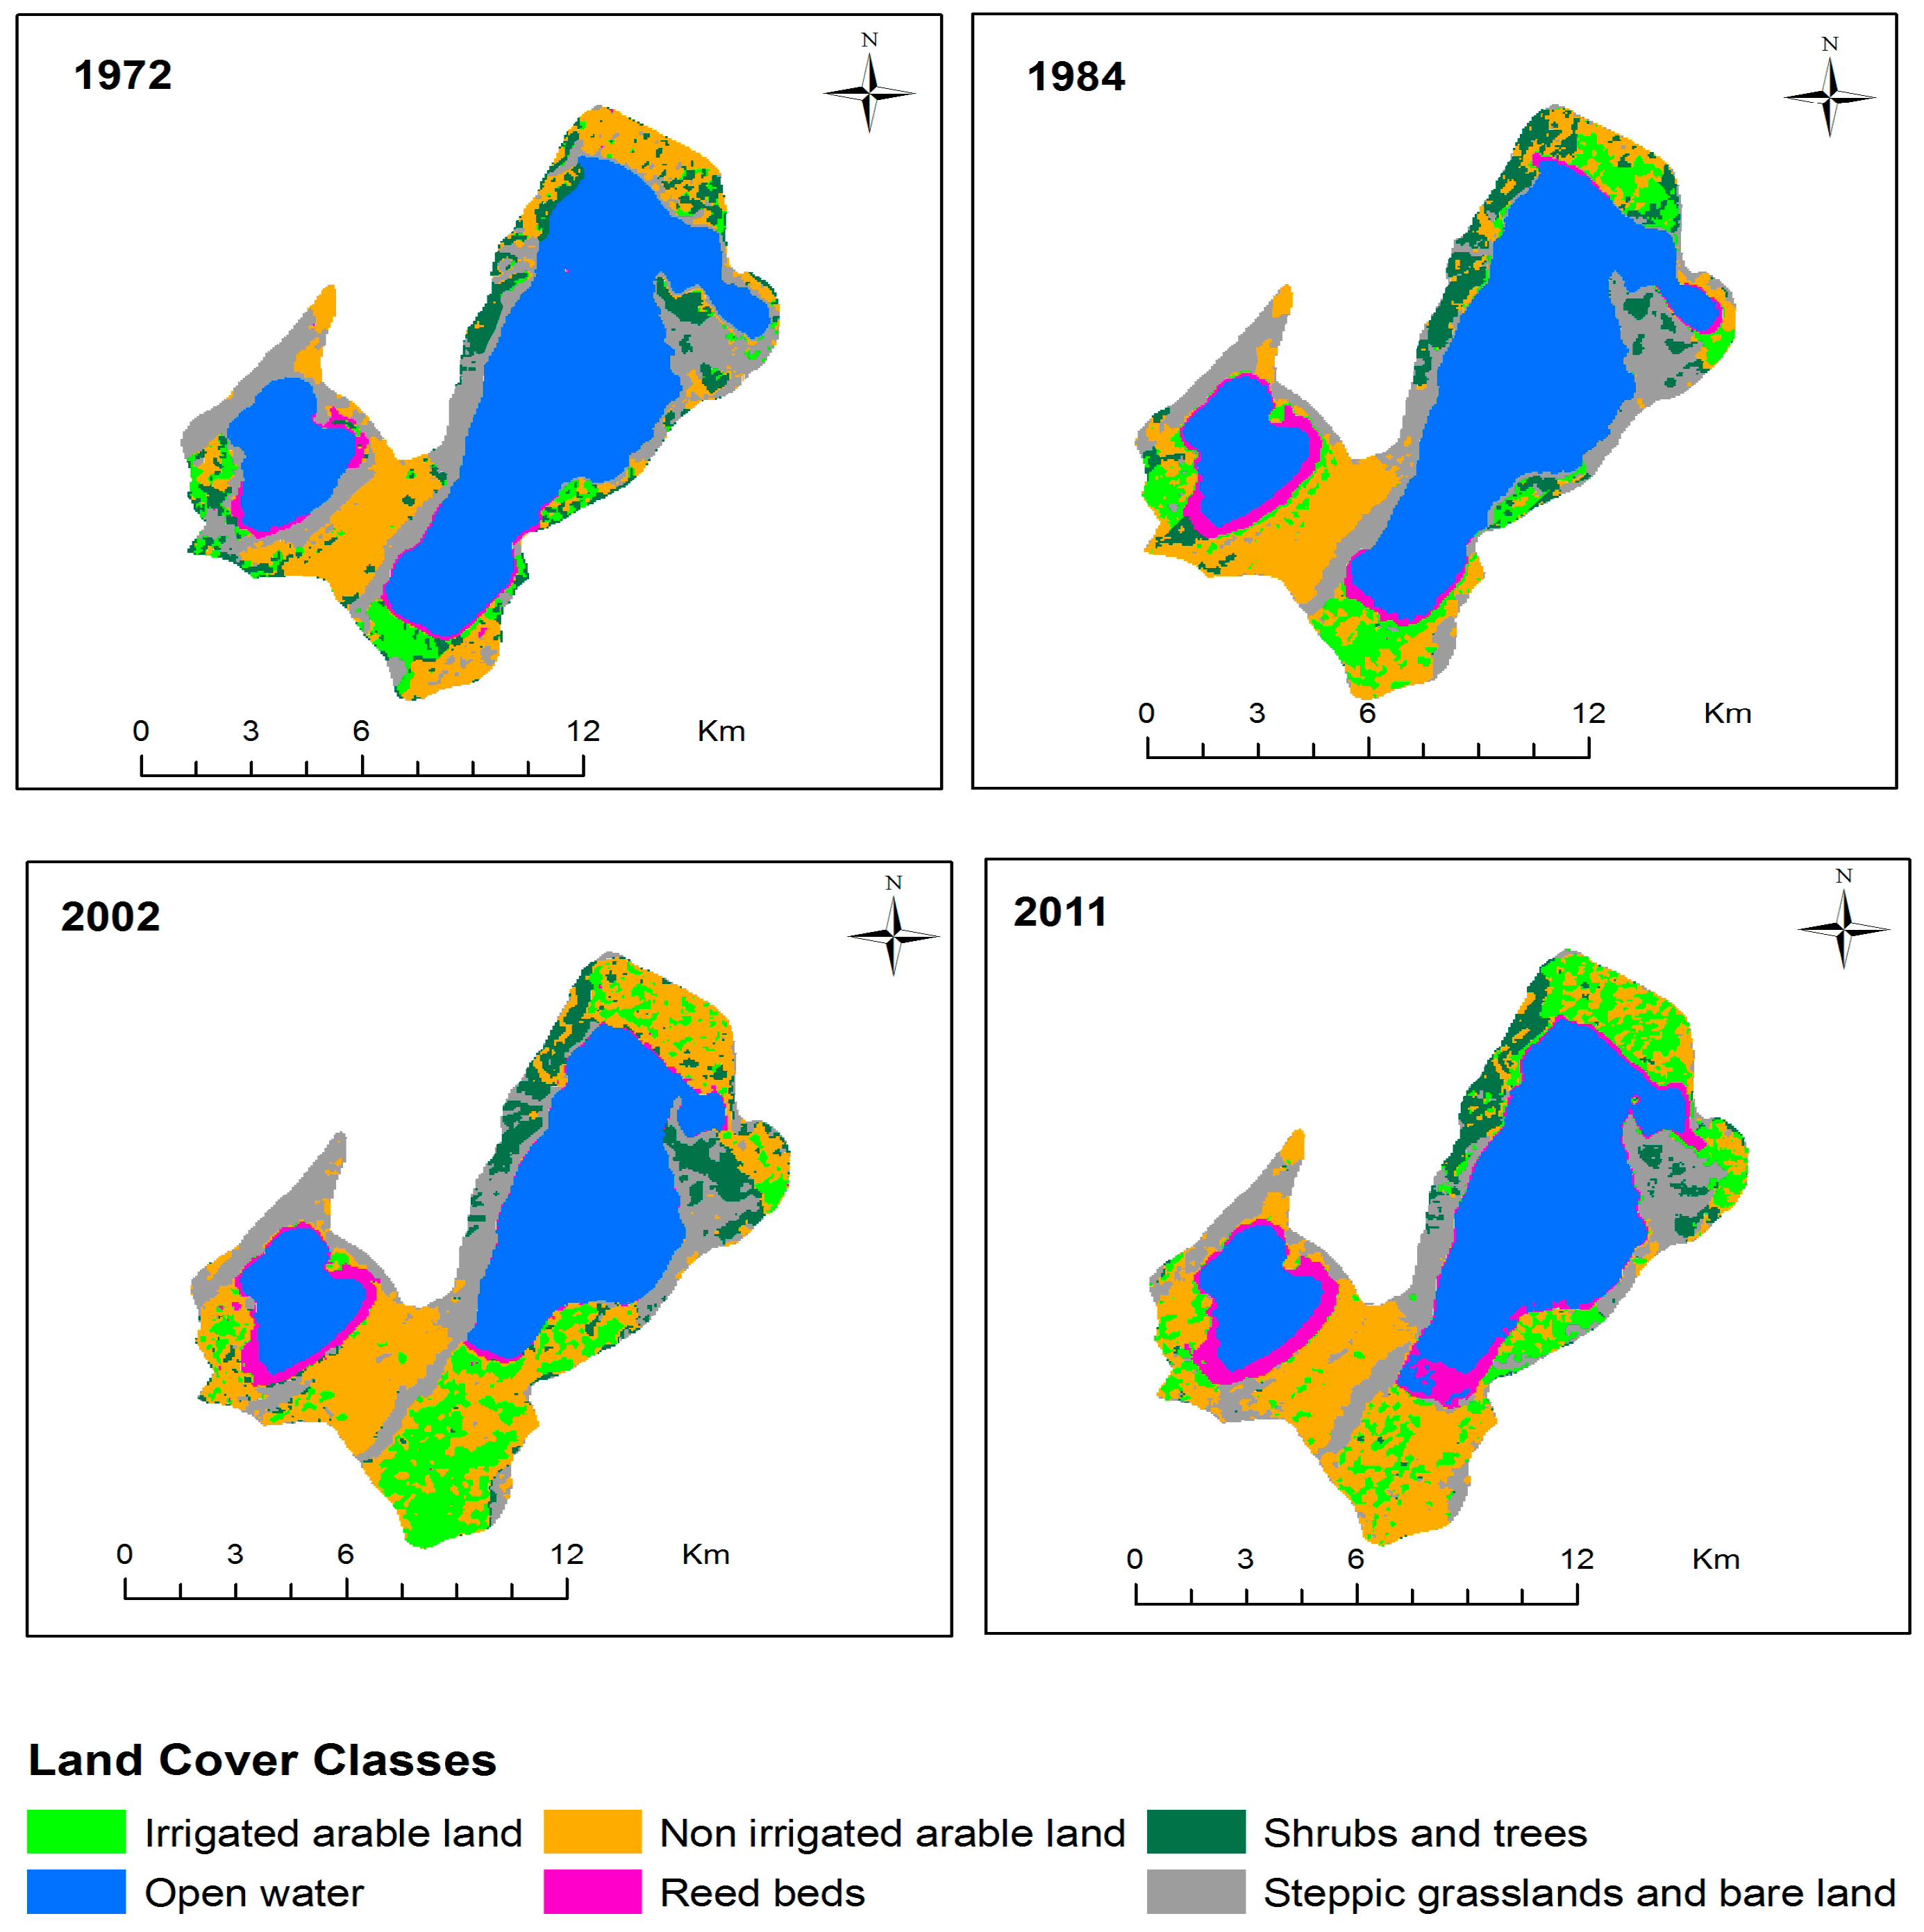
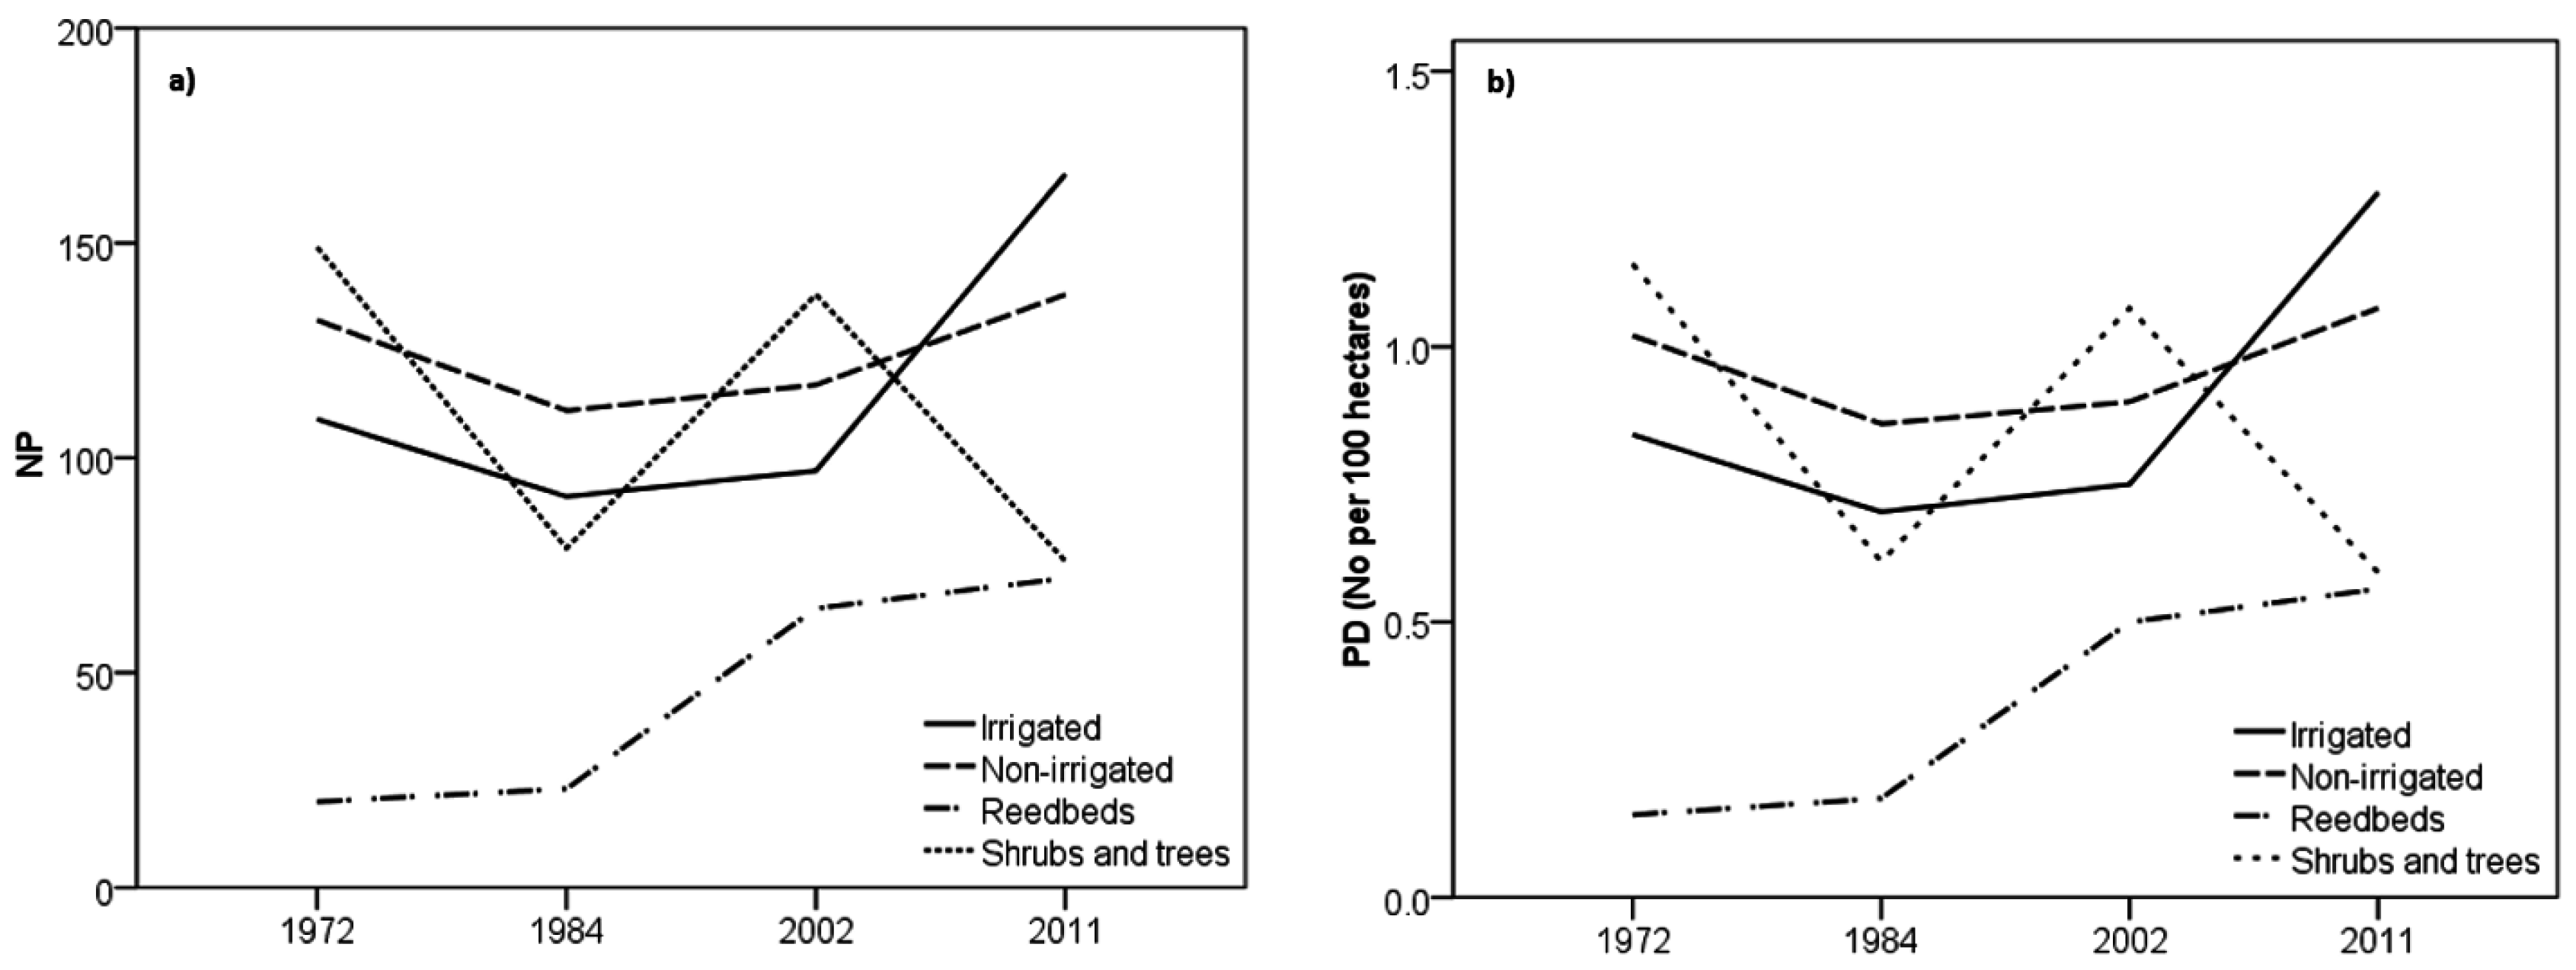
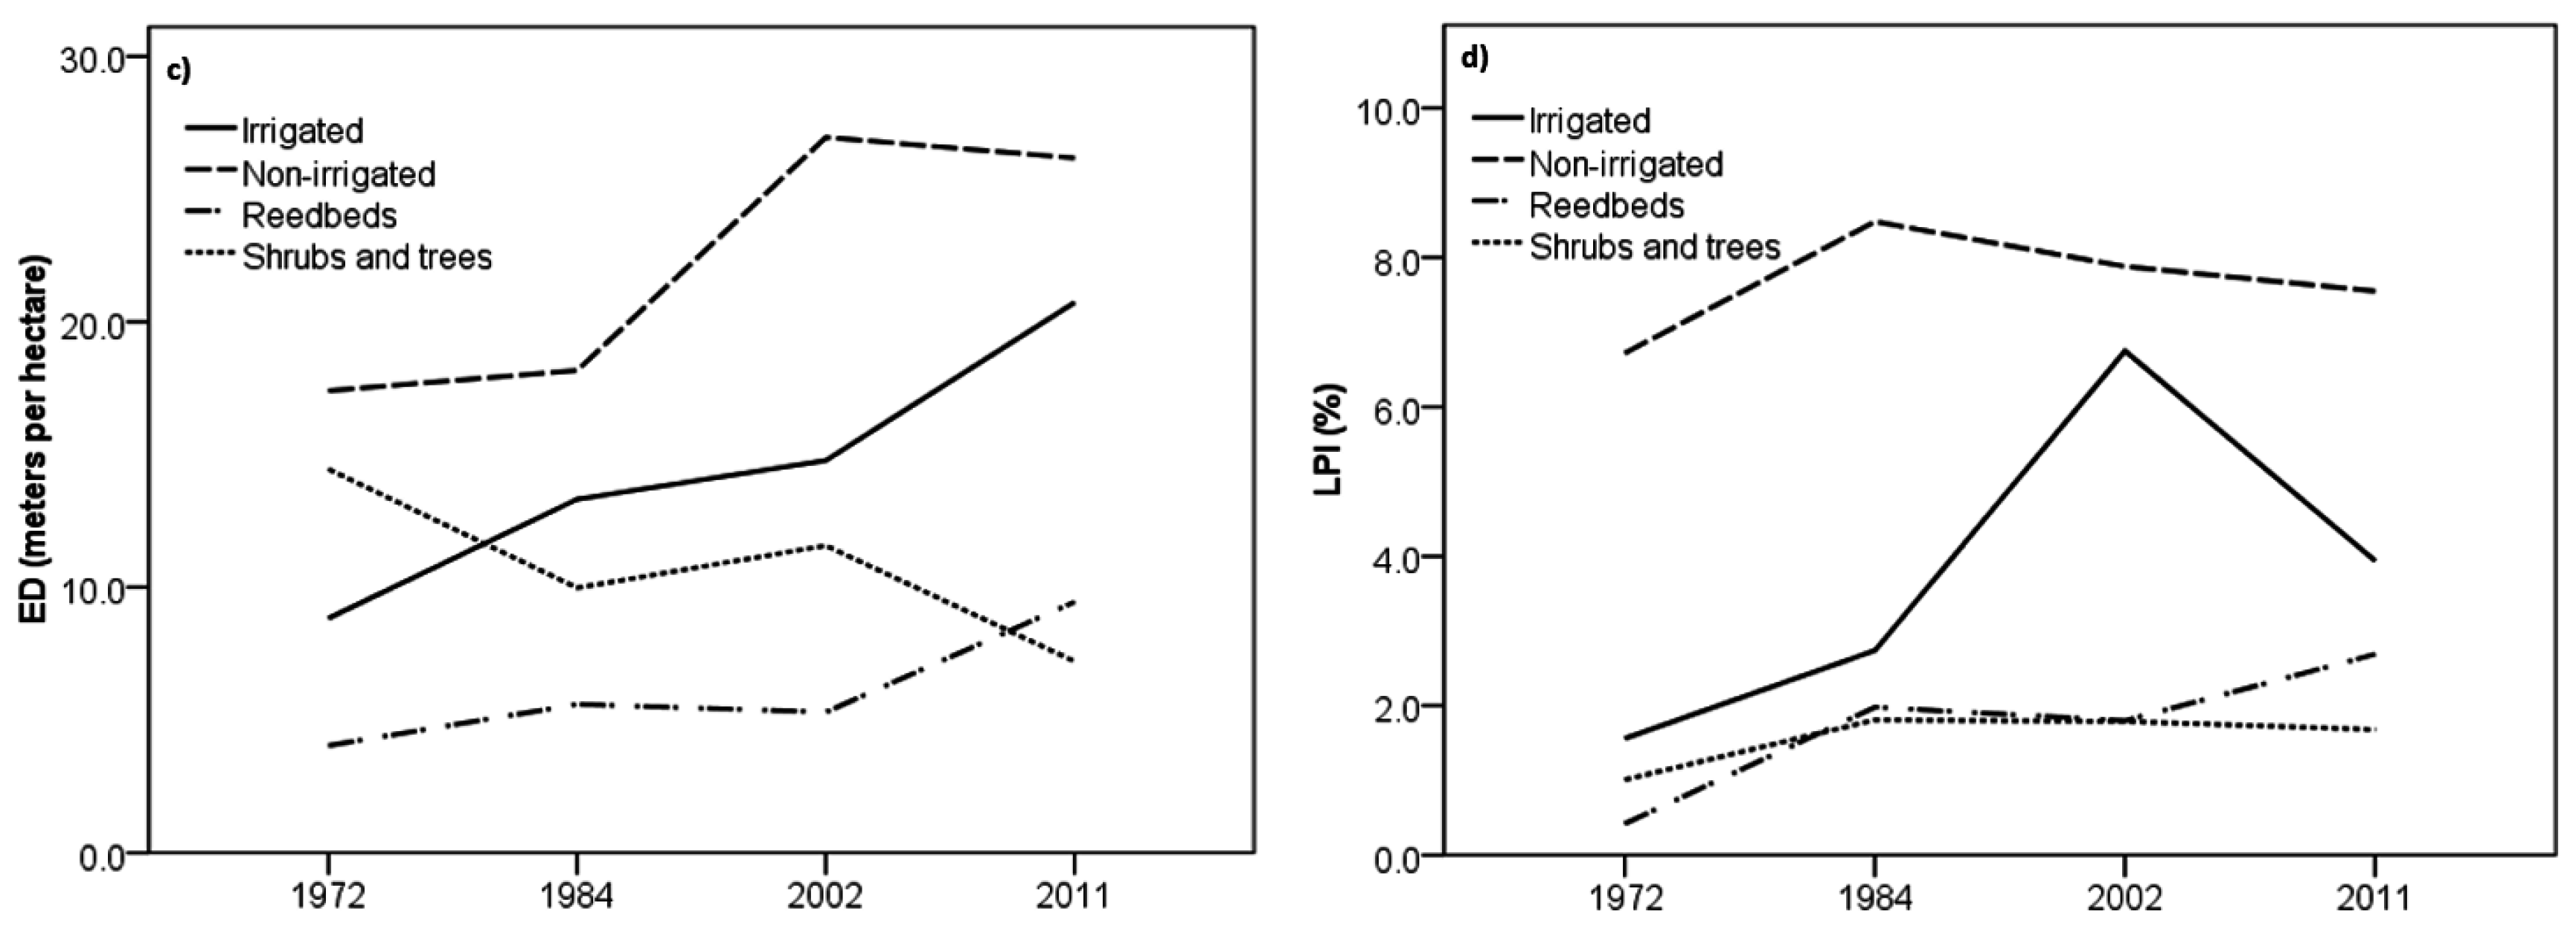
3.3. Landscape Changes

Changes in landscape structure over the four-point time series are presented in Figure 6. The results indicate the dynamics of the spatial pattern of the landscape from 1972 to 2011. One of the most significant characteristics of the landscape structure in the area is the high fragmentation, especially for the irrigated and non-irrigated arable land. Moreover, the inter-annual change of PD for the reed-beds followed the water level changes, as from Figure 6 it seems that PD increased. Additionally, for the irrigated arable land a decline of PD occurred with a simultaneous increase of LPI, meaning that patches of irrigated arable land became fewer but larger (Figure 6).

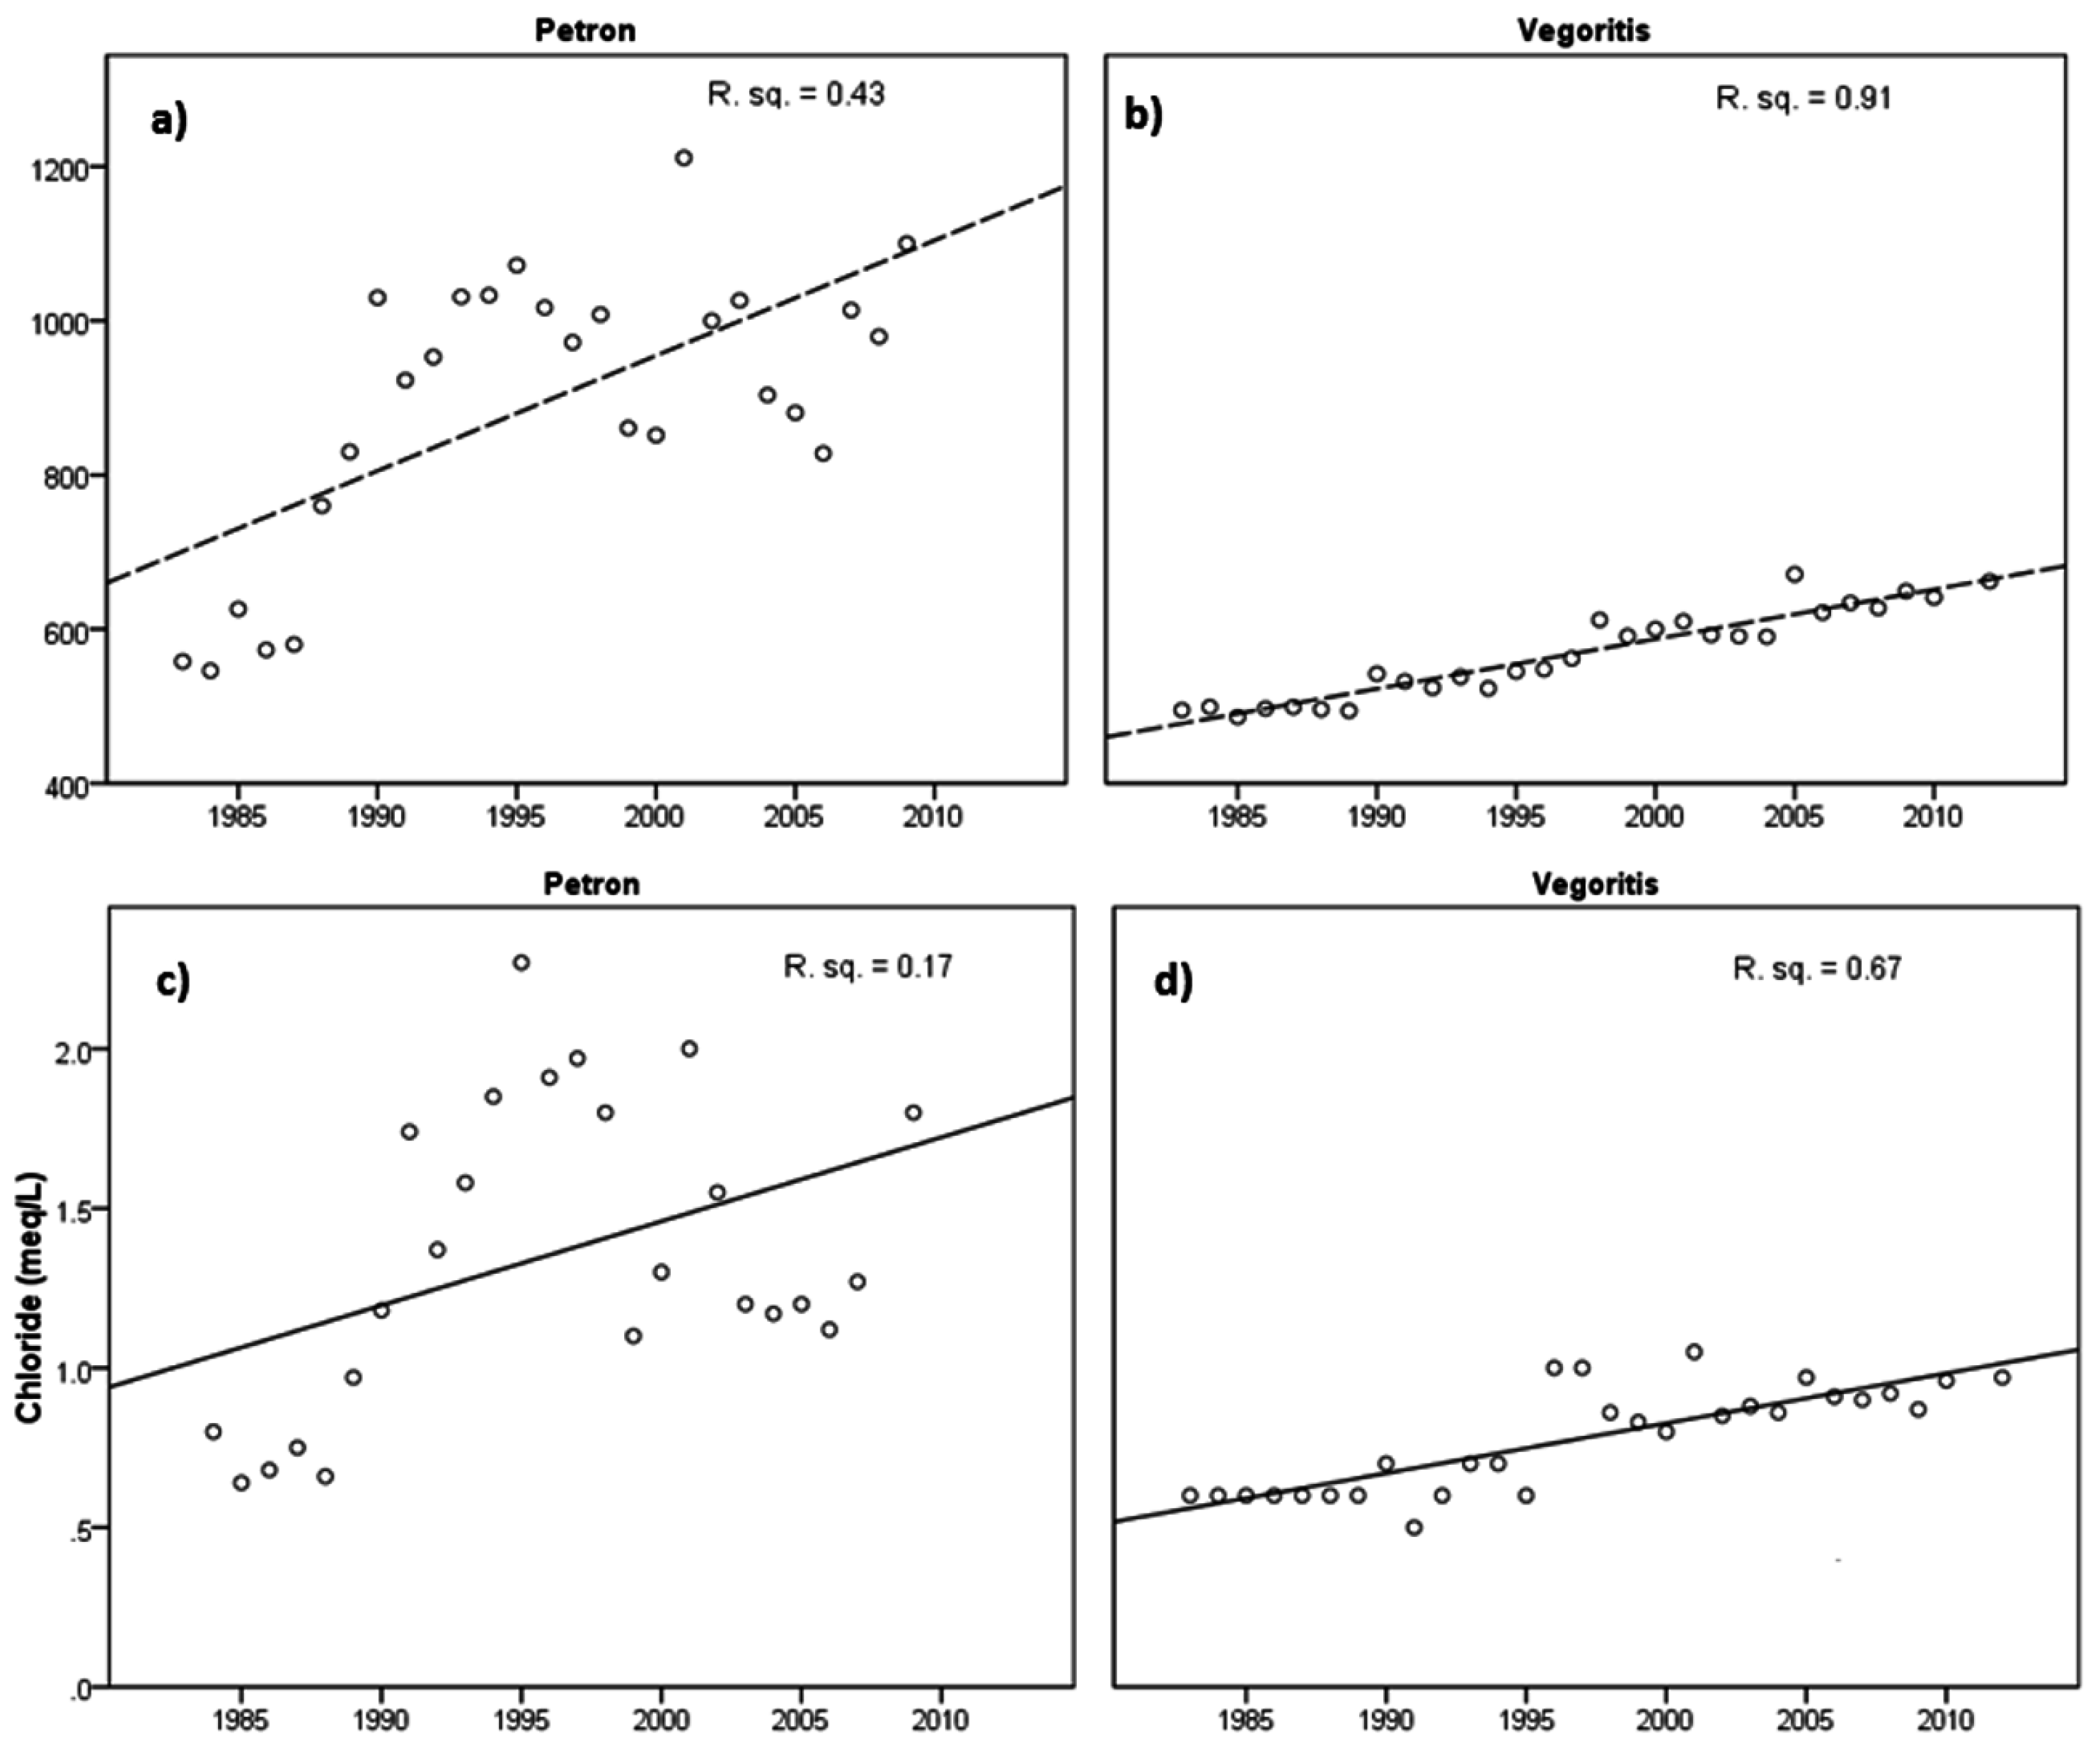
3.4. Inter-Annual Changes of Water Chemistry Parameters

Our results showed increasing trends of conductivity and chloride concentration for both lakes (Figure 7). Specifically, mean annual conductivity in Lake Vegoritis has increased from 495 to 662 μS/cm during 1983–2012, while in Lake Petron an even sharper increase from 558 to 1100 μS/cm was recorded for 1983–2009. Similarly, chloride concentration has also increased in Vegoritis from 0.6 meq/L in 1983 to 0.97 meq/L in 2012 and for Lake Petron from 0.8 meq/L in 1983 to 1.8 meq/L in 2009. An important finding is the significant (p ≤ 0.001) Spearman rank correlations identified between water level measurements and conductivity and chloride concentration for Lake Vegoritis.

4. Discussion

Lakes in Mediterranean regions with high seasonality in rainfall have experienced a drastic shift in land cover/use over the last 50 years [14]. Monitoring of changes in the land cover/use in the catchments of the lakes, and the subsequent environmental responses is essential for water resources management and water quality assessment [4,6]. Our results showed that the hydrology, the landscape and the water quality of the studied lakes have changed dramatically due to the combined effects of the land cover/use changes and climate variability. The clear positive correlations among water level reduction, Aridity Index, and annual precipitation appear to imply two things. First, a decreasing trend in precipitation is expected to directly affect the inflow and the hydrological regime of all water bodies in the area. Second, the reduction of precipitation will possibly increase the need for irrigation water, which inevitably will lead to increased water abstraction from the adjacent lakes and standing waters. The above results are supported by the predictions of Nastos et al. [33], which have shown that the climate is progressively shifting from humid to sub-humid and even semi-arid in several regions of Greece. Particularly, in the region of Macedonia, climate change scenarios have predicted that, in the near future (2021–2050), precipitation will decrease by almost 10%. Such predictions are likely to enhance the frequency and magnitude of drought episodes with adverse effects for the ecology, water level fluctuations, and water quality of the freshwaters in the area.
In this work a post-comparison classification was applied to detect temporal changes in land cover/uses over a period of 39 years (1972–2011). The issue with such approaches is the difficulty to produce consistent classifications for each image [35]. There will always be an error in change detection especially when the errors in each classification are not correlated [35]. Therefore, the accuracy of the change detection is highly dependent on the accuracy of the classification.
Moreover, pixel-based classification procedures are in general limited by the spatial resolution of the images [36]. This practically means that objects smaller than the size of the pixel is not detected. In our case, the comparison made between land cover maps obtained from images with different spatial resolution (1972 MMS and 1984, 2002 and 2011 TM), contain an extra amount of uncertainty due to such limitations. Therefore, it is not unlikely that some of the observed differences between the land cover/uses are due to misclassification issues. For example, continuous transitions between two classes of land cover/uses when there is not a profound explanation could be attributed to mapping errors. Consequently, it is very possible that the assessment of the landscape changes is affected especially when comparing metrics calculated for classifications based on different spatial resolutions.
Nevertheless, regarding the changes in land cover/use most pronounced changes were the extent of irrigated cultivations, as well as a significant increase of 38.7% from 1972 to 2011 of reed beds, but a more thorough examination of the results reveals that this change mainly occurred over the period between 2002 and 2011 (Table 4 and Table 5). A small expansion of the reed beds occurred from 1972 to 1983 due the water level drop that enabled the formation of large zones of reed beds in the shallower parts of the lakes. From 1984 to 2002, the reduction of the water level (by almost 16 m) caused a partial replacement of the reed beds by cultivations. While the extent of the surface of Lake Vegoritis increased during 2002–2011, the reed beds expanded again in the southern part of the lake due to flooding of former cultivated areas (Figure 4 and Figure 5). These changes were confirmed by field observations during 2006–2008 where, apart from the reed bed a diverse submerged macrophytic community was identified [37,38].
The increase of irrigated cultivations within the studied area from 1972 to 2002 by 1092 ha corresponds to almost 186% of its original extent (Table 4 and Table 5). Our findings indicate that the increase of cultivations combined intensified irrigation due to possibly decreasing precipitation and AI have contributed further to the water level decline, especially after 1985 when the hydro-electrical demand was minimized [19]. However, there are studies that have shown that the effect of land use changes on the irrigation water demand is larger than the climate effect at a Pan-European scale [39]. This practically means that the impact of the socio-economic driver is higher than the impact of the climate change. Moreover, although the climate change will affect the growth conditions of the crops, the impact on the demand for irrigation water depends on the capability of the farmers to adapt their crop production to the changing climate conditions. Nevertheless, in Greece, many lakes that serve as a source of irrigation water [40,41] are likely to be subjected to seasonal water level fluctuations or other hydrologic alterations. From 1972 to 2011, the extent of shrubs and trees in the studied area showed a decrease of 37.5% along with significant changes in patch and edge density (Table 5, Figure 6), as well as, steppic grasslands and bare lands presented an increased fragmentation and patch density. These findings indicate signs of degradation of semi-natural and natural habitats with negative consequences for the local biodiversity [42,43].
The LPI for the irrigated arable land showed a rising trend from 1972 to 2002, which indicates patch aggregation for the particular class. Similarly, the results for the class of reed beds reveal an increasing trend of LPI from 1972 to 2011, suggesting that the reed beds have expanded and now cover a significant area consisting of larger and larger patches. Regarding the edge complexity of both irrigated and non-irrigated arable land, the ED values increased greatly from 1972 to 2002 (Figure 6), indicating that the boundaries of agricultural lands have become more complex and irregular over the years. It is very likely that the cultivations have expanded against the open water in a disorderly manner, which would cause an enhancement of the edge complexity. The expansion of arable land in many aquatic ecosystems in Greece is quite common, and particularly for the natural lakes the arable land is the most common habitat with a high fragmentation [41].
These changes in the land uses were expected to have a significant impact on the water quality and the ecology of the studied lakes. It is well known that human pressures strongly influence the nutrient input in lakes [4,43,44]. For example, an increase of agricultural land in the watershed will probably lead to higher lake concentrations of total nitrogen, total phosphorus and chlorophyll-a with implications for the aquatic communities [4]. In our case, the water quality of Lakes Vegoritis and Petron has shown strong signs of deterioration during the last thirty years [12,38]. Recently, it has been suggested by us that a shift from mesotrophic to eutrophic conditions might have triggered a decline of charophytes and dominance of nutrient-tolerant angiosperms [38]. Similarly, a shift of the fish community towards zoobenthivorous dominance has been noted, which also reflects the increased eutrophication conditions [38]. Although the eutrophication process was not assessed in this work, our results suggested that the increasing trends of conductivity and chloride concentrations could be related to the increased concentrations of total dissolved solids and nutrients of the agricultural runoff. Another important finding was the identification of strong correlations between the water level and the mean annual conductivity and chloride concentration of Lake Vegoritis. These results suggest a possible connection between water regime and water quality changes.
In general, hydrological regime alterations, such as a huge water level decrease, are known to affect the water quality, including conductivity, of the freshwater ecosystems in arid and semi-arid areas of the world [45]. However, in our case, apart from the water level drop, we consider an additional driver as responsible for the observed changes. It is likely that the increase of irrigated arable land could have contributed to the rise of chloride and conductivity levels through extensive irrigation via groundwater wells (Figure 7). Thus, through leaching and drainage, salts would eventually move from soils into rivers and lakes, affecting the water quality [46], which would account for the high recorded values of chloride and conductivity. The increase in conductivity, chloride and nutrients and partially the hydrological alteration are disturbances related to the replacement of a significant part of the lakes’ surface by agricultural land and probably the subsequent intensification of irrigation. Water abstraction from surface water bodies enhances water level fluctuations, while the use of ground water for irrigation affects the conductivity levels, causing salinity problems over a prolonged period. At the same time, it is possible that excessive use of fertilizers increased the nutrient loading, shifting the lakes from a trophic to a eutrophic state.
Finally, the results from the remote sensing analysis suggested that the water level alterations are important for the composition of the littoral macrophyte communities. Not only the extent of the water level fluctuations [14] but also the morphometry and the bathymetry of the lake determine the extent of the littoral zone [47]. This is obvious for Lake Vegoritis where the expansion of the reed beds was limited only to the shallower southern part (Figure 4). Lake Petron, on the other hand, is a shallow lake, allowing progressive expansion of the reed beds over the whole littoral area as shown by the results of the remote sensing analysis.

5. Conclusions—Implications for Restoration

The results showed that the expansion of the reed beds against the lakes’ open water is associated with the intensification of the agricultural activity that occurred the last decades. Moreover, apart from the increase in phosphorus and nitrogen loading, the agriculture activity is likely to have affected the hydrology and water chemistry of surface water bodies through the application of non-sustainable irrigation practices. The possible use of groundwater as irrigation water, without any kind of limitation or control, is very likely to ultimately cause water logging and water quality problems and, eventually, affect the aquatic communities [46]. The climate, however, appears to also play a key role in controlling land cover/use dynamics and hydrological processes. The findings of this work suggest that the climate trend of precipitation within the studied area may have affected the hydrology and indirectly the water quality of the lake ecosystems.
As these are ongoing procedures strongly related to the spatio-temporal dynamics of the land cover/use, the development of an effective management plan is vital for reducing further the adverse implications for the ecosystem. Any restoration effort should be made within the context of a land management strategy in accordance with environmental policies. Furthermore, the management and restoration measures should be implemented taking into consideration the future impacts of the climate change. Clearly, the increase in agricultural land use poses a significant threat to the water quality and ecological balance of the studied lakes. Therefore, water management schemes should implement practices that are consistent with sustainable irrigation [48,49]. Monitoring and controlling the amount of applied water, both from surface and ground water, should be considered as a main priority for public agencies. Irrigation water pricing and/or allocation are practices that can motivate the farmers to use water efficiently [49]. Additionally, the extensive use of agricultural drainage water should be avoided or at least the water should be reused for irrigation of salt tolerant crops when this is possible.
All the above recommendations combined with an effective reduction of nutrient loading can provide a baseline strategy for mitigating the impacts of eutrophication, salinization and water level fluctuations on the aquatic communities. The results of this study underline the importance of the implementation of a water management plan including specific actions targeted on the development and implementation of sustainable agriculture policies.

Acknowledgments

Funding for this research has been provided by the REFRESH (Adaptive strategies to mitigate the impacts of Climate Change on European Freshwater Ecosystems, contract No. 244121) project within the EU FP7th framework program and Patras University funds. We wish to thank Adrianos Retalis for his invaluable assistance with the image pre-processing and classification techniques and for his comments that have greatly improved the manuscript. We also wish to thank Vasiliki Rizomilioti, EAP Tutor of Patras University, for the linguistic revision of the manuscript.

Author Contributions

Then manuscript was primarily written by Kostas Stefanidis, with Aikaterini Kostara contributing with her expertise on GIS and remote sensing analysis. Eva Papastergiadou supervised the research and contributed with her expertise and insights by supporting the writing of the final manuscript.

Conflicts of Interest

The authors declare no conflicts of interest.

References

  1. Shi, P.; Ma, X.; Hou, Y.; Li, Q.; Zhang, Z.; Qu, S.; Chen, C.; Cai, T.; Fang, X. Effects of Land-Use and Climate Change on Hydrological Processes in the Upstream of Huai River, China. Water Resour. Manag. 2013, 27, 1263–1278. [Google Scholar] [CrossRef]
  2. Russell, J.M.; McCoy, S.J.; Verschuren, D.; Bessems, I.; Huan, Y.G. Human impacts, climate change, and aquatic ecosystem response during the past 2000 yr at Lake Wandakara, Uganda. Quat. Res. 2009, 72, 315–324. [Google Scholar] [CrossRef]
  3. Waters, M.N.; Piehler, M.F.; Rodriguez, A.B.; Smoak, J.M.; Bianchi, T.S. Shallow lake trophic status linked to late Holocene climate and human impacts. J. Paleolimnol. 2009, 42, 51–64. [Google Scholar] [CrossRef]
  4. Nielsen, A.; Trolle, D.; Sǿndergaard, M.; Lauridsen, T.; Bjerring, R.; Olensen, J.E.; Jeppesen, E. Watershed land use effects on lake water quality in Denmark. Ecol. Appl. 2012, 22, 1187–1200. [Google Scholar] [CrossRef] [PubMed]
  5. Nikouei, A.; Zibael, M.; Ward, F. Incentives to adopt irrigation water saving measures for wetlands preservation: An integrated basin scale analysis. J. Hydrol. 2012, 464–465, 216–232. [Google Scholar] [CrossRef]
  6. Fraterrigo, J.M.; Downing, J.A. The Influence of Land Use on Lake Nutrients Varies with Watershed Transport Capacity. Ecosystems 2008, 11, 1021–1034. [Google Scholar] [CrossRef]
  7. Pulido-Velasquez, M.; Peña-Haro, S.; Morcholi-Almudever, A.F.; Henriquez-Dole, L.; Macian-Sorribes, H.; Lopez-Nicolas, A. Integrated assessment of the impact of climate and land use changes of groundwater quantity and quality in the Mancha Oriental system (Spain). Hydrol. Earth Syst. Sci. 2015, 19, 1677–1693. [Google Scholar] [CrossRef]
  8. Kløve, B.; Ala-Aho, P.; Bertrand, G.; Gurdak, J.J.; Kupfersberger, H.; Kvoerner, J.; Muotka, T.; Mykrä, H.; Preda, E.; Rossi, P.; et al. Climate Change Impacts on Groundwater and Dependent Ecosystems. J. Hydrol. 2014, 518, 250–266. [Google Scholar] [CrossRef]
  9. Papastergiadou, E.; Retalis, A.; Kalliris, P.; Georgiadis, T. Land use changes and associated environmental impacts on the Mediterranean shallow lake Stymfalia, Greece. Hydrobiologia 2007, 584, 361–372. [Google Scholar] [CrossRef]
  10. Papastergiadou, E.S.; Retalis, A.; Apostolakis, A.; Georgiadis, T. Environmental Monitoring of Spatio-temporal Changes Using Remote Sensing GIS in a Mediterranean Wetland of Northern Greece. Water Resour. Manag. 2008, 22, 579–594. [Google Scholar] [CrossRef]
  11. Papastergiadou, E.; Kagalou, I.; Stefanidis, K.; Retalis, A.; Leonardos, I. Effects of Anthropogenic Influence on the Trophic State, Land Use and Aquatic Vegetation in a Shallow Mediterranean Lake: Implications for Restoration. Water Resour. Manag. 2010, 24, 415–435. [Google Scholar] [CrossRef]
  12. Jeppesen, E.; Brucet, S.; Naselli-Flores, L.; Papastergiadou, E.; Stefanidis, K.; Nõges, T.; Nõges, P.; Attayde, J.L.; Zohary, T.; Coppens, J.; et al. Ecological impacts of global warming and water abstraction on lakes and reservoirs due to changes in water level and related changes in salinity. Hydrobiologia 2015, 750, 201–227. [Google Scholar] [CrossRef]
  13. Coops, H.; Beklioglu, M.; Crisman, T.L. The role of water-level fluctuations in shallow lake ecosystems–workshop conlusions. Hydrobiologia 2003, 506–509, 23–27. [Google Scholar] [CrossRef]
  14. Beklioglu, M.; Romo, S.; Kagalou, I.; Quintana, X.; Bѐcares, E. State of the art in the functioning of shallow Mediterranean lakes: Workshop conclusions. Hydrobiologia 2007, 584, 317–326. [Google Scholar] [CrossRef]
  15. Pilgrim, C.M.; Mikhailova, E.A.; Post, C.J.; Hains, J.J. Spatial and Temporal analysis of land cover changes and water quality in the Lake Issaqueena watershed, South Carolina. Environ. Monit. Assess. 2014, 186, 7617–7630. [Google Scholar] [CrossRef] [PubMed]
  16. Zhang, F.; Tiyip, T.; Johnson, V.C.; Kung, H.; Ding, J.; Sun, Q.; Zhou, M.; Kelimu, A.; Nurmuhammat, I.; Chan, N.W. The influence of natural and human factors in the shrinking of the Ebinur Lake, Xinjiang, China, during the 1972–2013 period. Environ. Monit. Assess. 2015, 187, 4128. [Google Scholar] [CrossRef] [PubMed]
  17. Otáhelová, H.; Oahe, J.; Pazúr, J.; Hrivnák, R.; Valachovič, M. Spatio-temporal changes in land cover and aquatic macrophytes of the Danube floodplain lake. Limnologica 2011, 41, 316–324. [Google Scholar] [CrossRef]
  18. Skoulikidis, N.; Kaberi, H.; Sakellariou, D. Patterns, origin, and possible effects of sediment pollution in a Mediterranean lake. Hydrobiologia 2008, 613, 71–83. [Google Scholar] [CrossRef]
  19. Gianniou, S.K.; Antonopoulos, V.Z. Evaporation and energy budget in Lake Vegoritis, Greece. J. Hydrol. 2007, 345, 212–223. [Google Scholar] [CrossRef]
  20. Thornthwaite, C.W. An approach toward a rational classification of climate. Geogr. Rev. 1948, 38, 55–94. [Google Scholar] [CrossRef]
  21. United Nations Environment Programme. World Atlas of Desertification; Edward Arnold: London, UK, 1992. [Google Scholar]
  22. Bonte, M.; Zwolsman, J.G. Climate change induced salinisation of artificial lakes in the Netherlands and consequences for drinking water production. Water Res. 2010, 44, 4411–4424. [Google Scholar] [CrossRef] [PubMed]
  23. Müller, B.; Gächter, R. Increasing chloride concentrations in Lake Constance: Characterization of sources and estimation of loads. Aquat. Sci. 2012, 74, 101–112. [Google Scholar] [CrossRef]
  24. U.S. Geological Survey. Landsat Imagery; U.S. Geological Survey, Earth Resources Observation & Science Center (EROS): Sioux Falls, SD, USA, 2009.
  25. Vittek, M.; Brink, A.; Donnay, F.; Simonetti, D.; Desclée, B. Land cover change monitoring using Landsat MSS/TM Satellite Image Data over West Africa between 1975 and 1990. Remote Sens. 2014, 6, 658–676. [Google Scholar] [CrossRef] [Green Version]
  26. Hadjimitsis, D.G.; Clayton, C.R.I.; Retalis, A. Darkest pixel atmospheric correction algorithm: A revised procedure for environmental applications of satellite remotely sensed imagery. In Proceedings of the 10th International Symposium on Remote Sensing, Barcelona, Spain, 8 September 2003.
  27. Hadjimitsis, D.G.; Papadavid, G.; Agapiou, A.; Themistocleous, K.; Hadjimitsis, M.G.; Retalis, A.; Michaelides, S.; Chrysoulakis, N.; Toulios, L.; Clayton, C.R.I. Atmospheric correction for satellite remotely sensed data intended for agricultural applications: Impact on vegetation indices. Nat. Hazards Earth Syst. Sci. 2010, 10, 89–95. [Google Scholar] [CrossRef]
  28. ENVI Software, version 4.7; ITT Corporation: Westchester, NY, USA, 2009.
  29. ERDAS Imagine 9.2, Leica Geosystems Geospatial Imaging: Norcross, GA, USA, 2008.
  30. McFeeters, S.K. The use of the Normalized Difference Water Index (NDWI) in the delineation of open water features. Int. J. Remote Sens. 1996, 17, 1425–1432. [Google Scholar] [CrossRef]
  31. Wang, J.D.; Sheng, Y.W.; Tong, T.S.D. Monitoring decadal lake dynamics across the Yangtze Basin downstream of Three Gorges Dam. Remote Sens. Environ. 2014, 152, 251–269. [Google Scholar] [CrossRef]
  32. McGarigal, K.; Marks, B.J. FRAGSTATS: Spatial Pattern Analysis Program for Quantifying Landscape Structure; U.S. Forest Service General Technical Report; Oregon State University: Corvallis, OR, USA, 1995. [Google Scholar]
  33. Feidas, H.; Noulopoulou, C.; Makrogiannis, T.; Bora-Senta, E. Trend analysis of precipitation time series in Greece and their relationship with circulation using surface and satellite data: 1955–2001. Theor. Appl. Climatol. 2007, 87, 155–177. [Google Scholar] [CrossRef]
  34. Nastos, P.T.; Politi, N.; Kapsomenakis, J. Spatial and temporal variability of the Aridity Index in Greece. Atmos. Res. 2013, 119, 140–152. [Google Scholar] [CrossRef]
  35. Almutairi, A.; Warner, A.T. Change detection accuracy and image properties: A study using simulated data. Remote Sens. 2010, 2, 1508–1529. [Google Scholar] [CrossRef]
  36. Serra, P.; Pons, X.; Sauri, D. Post-classification change detection with data from different sources: Some accuracy considerations. Int. J. Remote Sens. 2003, 24, 3311–3340. [Google Scholar] [CrossRef]
  37. Stefanidis, K.; Papastergiadou, E. Influence of hydrophyte abundance on the spatial distribution of zooplankton in selected lakes of Greece. Hydrobiologia 2010, 656, 55–65. [Google Scholar] [CrossRef]
  38. Stefanidis, K.; Papastergiadou, E. Effects of a long term water level reduction on the ecology and water quality in an eastern Mediterranean lake. Knowl. Manag. Aquat. Ecosyst. 2013, 411, 05. [Google Scholar] [CrossRef]
  39. Schaldach, R.; Koch, J.; der Beek, T.A.; Kynast, E.; Flörke, M. Current and future irrigation water requirements in pan-Europe: An integrated analysis of socio-economic and climate scenarios. Glob. Planet. Chang. 2011, 94, 33–45. [Google Scholar] [CrossRef]
  40. Kagalou, I.; Leonardos, I. Typology, classification and management issues of Greek lakes: Implication of the water framework directive (2000/60/EC). Environ. Monit. Assess. 2009, 150, 469–484. [Google Scholar] [CrossRef] [PubMed]
  41. Drakou, E.G.; Kallimanis, A.S.; Sgardelis, S.P.; Pantis, J.D. Landscape structure and habitat composition in reservoirs, lakes and rivers. Lake Reserv. Manag. 2008, 24, 244–260. [Google Scholar] [CrossRef]
  42. Kruess, A.; Tscharntke, T. Habitat fragmentation, species loss, and biological control. Science 1994, 264, 1581–1584. [Google Scholar] [CrossRef] [PubMed]
  43. Downing, J.A.; McCauley, E. The nitrogen: Phosphorus relationship in lakes. Limnol. Oceanogr. 1992, 37, 936–945. [Google Scholar] [CrossRef]
  44. Haidary, A.; Bahman, J.A.; Adamowski, A.; Fohrer, N.; Nakane, K. Assessing the impacts of four land use types on the water quality of wetlands in Japan. Water Resour. Manag. 2013, 27, 2217–2229. [Google Scholar] [CrossRef]
  45. Nielsen, D.L.; Brock, M.A. Modified water regime and salinity as a consequence of climate change: Prospects for wetlands of Southern Australia. Clim. Chang. 2009, 95, 523–533. [Google Scholar] [CrossRef]
  46. Wichelns, D.; Oster, J.D. Sustainable irrigation is necessary and achievable, but direct costs and environmental impacts can be substantial. Agric. Water Manag. 2006, 86, 114–127. [Google Scholar] [CrossRef]
  47. Beklioglu, M.; Altinayar, G.; Tan, C.O. Water level control over submerged macrophyte development in five shallow lakes of Mediterranean Turkey. Arch. Hydrobiol. 2006, 166, 535–556. [Google Scholar] [CrossRef]
  48. Datta, K.K.; Tewari, L.; Toshi, P.K. Impact of subsurface drainage on improvement of crop production and farm income in northwest India. Irrig. Drain. Syst. 2004, 18, 43–55. [Google Scholar] [CrossRef]
  49. Latinopoulos, D. Estimating the Potential Impacts of Irrigation Water Pricing Using Multicriteria Decision Making Modelling. An Application to Northern Greece. Water Resour. Manag. 2008, 22, 1761–1782. [Google Scholar] [CrossRef]
Figure 1. Location of the studied area in north Greece.
Water 08 00483 g001
Figure 2. Precipitation trends in the studied area (data available from four separate meteorological stations from 1959 to 2004).
Water 08 00483 g002
Figure 3. Aridity Index (AI) trends in the studied area (AI calculated using data from three meteorological stations).
Water 08 00483 g003
Figure 4. Land cover/land use maps of the studied area for the four point time series (1972, 1984, 2002, and 2011).
Water 08 00483 g004
Figure 5. The overlay outlines of the studies lakes delineated from 1972 to 2011.
Water 08 00483 g005
Figure 6. Lines represent changes of landscape metrics for four land cover/use classes (Irrigated, Non-irrigated arable land, Reed beds, Steppic grasslands and Shrubs and trees) from 1972 to 2011. NP stands for Number of patches (a); PD stands for Patch density (b); ED stands for Edge density (c); and LPI stands for Largest Patch Index (d).
Water 08 00483 g006aWater 08 00483 g006b
Figure 7. Conductivity (a,b) and chloride concentration (c,d) rising trends for the two studied lakes over a period of 18 consecutive years (1983–2001).
Water 08 00483 g007
Table 1. Classification limits of the Aridity Index according to the UNEP (1992).
Climatic ZoneP/PET (Thornthwaite Method)
Hyper-arid<0.05
Arid0.05–0.2
Semi-arid0.2–0.5
Sub-humid0.5–0.65
Humid>0.65
Table 2. Land cover/land use classification system for the studied area.
Land Cover/Land Use TypesDescription
Open waterOpen water area of lakes, possibly containing submerged macrophytes close to the littoral zone
Irrigated arable landAgricultural land mostly cultivated by crops irrigated by the lakes (e.g., vineyards)
Non irrigated arable landAgricultural land containing crops that are not irrigated
Reed bedsReeds dominated by associations of Phragmitetalia and small patches of calcareous fens with Cladium mariscus and Carex spp.
Shrubs and treesMostly class of Quercetea pubescentis including associations consisting of Quercus trojana, Carpinus orientalis and Juniperus oxycedrus
Steppic grasslands and bare landBare land, hills, rocks, and dry calcreous grassland vegetation dominated by the class Festuco-Brometea
Table 3. Spearman rank correlations between annual mean water level (WL) of Lake Vegoritis, annual precipitation (P), potential evaportranspiration (PET) and Aridity Index (AI) from three meteorological stations (* indicates p ≤ 0.05, ** indicates p ≤ 0.001).
Parameterr Coef. and p Significance LevelP (Amyntaio)PET (Amyntaio)AI (Amyntaio)P (Florina)PET (Florina)AI (Florina)P (Limnochori)PET (Limnochori)AI (Limnochori)WL
P (Amyntaio)Cor. Coef.10.448 *0.1290.3210.2880.647 **0.3140.028–0.0430.249
Sig. 0.0150.5050.0830.12300.0910.8850.8250.185
PET (Amyntaio)Cor. Coef. 1−0.229−0.2110.0020.345−0.138−0.064−0.127−0.115
Sig. 0.2230.2640.9920.0620.4740.7360.5040.543
AI (Amyntaio)Cor. Coef. 10.674 **−0.3140.3110.426 *−0.162−0.0220.258
Sig. 00.0910.0940.0210.3920.9080.169
P (Florina)Cor. Coef. 1−0.0450.2930.370 *−0.0680.0930.333 *
Sig. 0.7780.0630.0370.7070.6080.029
PET (Florina)Cor. Coef. 10.3070.0520.26−0.284−0.036
Sig. 0.0510.7770.1430.1090.823
AI (Florina)Cor. Coef. 10.645 **−0.065−0.1540.374 *
Sig. 00.7190.3920.016
P (Limnochori)Cor. Coef. 1−0.2770.0130.398 *
Sig. 0.1450.9470.024
PET (Limnochori)Cor. Coef. 10.035−0.031
Sig. 0.8450.864
AI (Limnochori)Cor. Coef. 10.506 **
Sig.
Table 4. Area extent (ha and %) of the land cover/land use classes as derived from the classification of the satellite images.
Land Use/Class1972198420022011
Area (ha)%Area (ha)%Area (ha)%Area (ha)%
Open water/Lake Petron10468959792479137
Open water/Vegoritis560843526641367628401431
Open water/Total665451622548460036492738
Irrigated arable land557411499167213157012
Non irrigated arable land218517223317324825306024
Reed beds2062468435237856
Shrubs and trees9457904795175915
Steppic grasslands and bare land239819197015212716201516
Table 5. Changes (%) of the land cover/land use classes and annual rate of change for the studied period.
Land Use/Class1972–19841984–20022002–20111972–2011
% ChangeAnnual Change (ha/Year)% ChangeAnnual Change (ha/Year)% ChangeAnnual Change (ha/Year)% ChangeAnnual Change (ha/Year)
Open water/Lake Petron−8.3−10.9−3.6−1.9−1.2−1.2−12.7−3.4
Open water/Vegoritis−6.1−42.8−30.2−88.39.237.6−28.4−40.9
Open water/Total−6.4−53.6−26.1−90.37.136.3−26.0−44.3
Irrigated arable land106.374.045.529.1−6.1−11.3181.926.0
Non irrigated arable land2.26.045.556.4−5.8−20.940.022.4
Reed beds127.232.8−24.8−6.4123.048.1281.114.8
Shrubs and trees−4.3−5.15.22.6−37.9−40.0−37.5−9.1
Steppic grasslands and bare land−17.8−53.58.08.7−5.3−12.4−16.0−9.8

