Article

Species-Specific Variations in the Nutritional Quality of Southern Ocean Phytoplankton in Response to Elevated pCO2

1
Institute for Marine and Antarctic Studies, University of Tasmania, Private Bag 129, Hobart, Tasmania 7001, Australia
2
Antarctic Climate & Ecosystems Cooperative Research Centre, University of Tasmania, Private Bag 80, Hobart, Tasmania 7001, Australia
3
CSIRO Wealth from Oceans Flagship, Division of Marine and Atmospheric Research, GPO Box 1538, Hobart, Tasmania 7000, Australia
4
Australian Antarctic Division, 203 Channel Hwy, Kingston Tas 7050, Australia
*
Author to whom correspondence should be addressed.
Water 2014, 6(6), 1840-1859; https://doi.org/10.3390/w6061840
Submission received: 6 February 2014 / Revised: 12 May 2014 / Accepted: 4 June 2014 / Published: 17 June 2014

Abstract

:
Increased seawater pCO2 has the potential to alter phytoplankton biochemistry, which in turn may negatively affect the nutritional quality of phytoplankton as food for grazers. Our aim was to identify how Antarctic phytoplankton, Pyramimonas gelidicola, Phaeocystis antarctica, and Gymnodinium sp., respond to increased pCO2. Cultures were maintained in a continuous culture setup to ensure stable CO2 concentrations. Cells were subjected to a range of pCO2 from ambient to 993 µatm. We measured phytoplankton response in terms of cell size, cellular carbohydrate content, and elemental, pigment and fatty acid composition and content. We observed few changes in phytoplankton biochemistry with increasing CO2 concentration which were species-specific and predominantly included differences in the fatty acid composition. The C:N ratio was unaffected by CO2 concentration in the three species, while carbohydrate content decreased in Pyramimonas gelidicola, but increased in Phaeocystis antarctica. We found a significant reduction in the content of nutritionally important polyunsaturated fatty acids in Pyramimonas gelidicola cultures under high CO2 treatment, while cellular levels of the polyunsaturated fatty acid 20:5ω3, EPA, in Gymnodinium sp. increased. These changes in fatty acid profile could affect the nutritional quality of phytoplankton as food for grazers, however, further research is needed to identify the mechanisms for the observed species-specific changes and to improve our ability to extrapolate laboratory-based experiments on individual species to natural communities.

1. Introduction

Human activities have led to an increase in atmospheric CO2 concentration of which an estimated 30% have been absorbed by the oceans, causing global average surface seawater pH to drop by 0.1 units [1,2,3], a process termed ocean acidification [4,5]. High latitudes will be particularly vulnerable due to their capacity to store more CO2, and upwelling and subsequent entrainment of CO2-rich deep waters during winter [6,7,8,9,10], rendering its inhabitants among the first to be affected by ocean acidification. Yet, little is known presently about the susceptibility of polar organisms to increased pCO2, and this is particularly true for Antarctic phytoplankton [11,12].
Ocean acidification has the potential to alter phytoplankton biochemistry. Elevated CO2 concentration has been shown to influence the ratio of carbon to nutrient uptake rates in phytoplankton [13,14,15,16] and consequently an increase in C:N:P ratio [17,18,19]. A reduction in the percentage of polyunsaturated fatty acids (PUFA) in the diatom Thalassiosira pseudonana has also been reported [20].
Phytoplankton response to elevated CO2 concentrations and lowered pH has been found to be species-specific and can lead to shifts in the species composition and bulk biochemical parameters of natural phytoplankton communities [8,21,22,23]. Predicting how phytoplankton will respond to ocean acidification has therefore been a difficult task. Contrary to the hypothesis that climate change will fertilize the oceans via increased availability of CO2 and thereby stimulate primary productivity, on a global scale ocean primary productivity has declined since the early 1980’s [24] and might continue to do so due to ocean warming [25].
Alterations to the composition of phytoplankton communities, as well as individual species’ nutritional quality and availability, could have major ramifications for higher trophic levels [26,27,28,29]. The fatty acid profile of phytoplankton is of particular interest as an indicator of their nutritional quality for grazers. Fatty acids are divided into PUFA, monounsaturated fatty acids (MUFA) and saturated fatty acids (SFA). The composition of PUFA and the ratio of PUFA to MUFA and SFA are critically important for grazer development, reproduction and hatch rates, as has been well researched by the aquaculture and other industries [30,31,32,33,34,35].
To understand why and how phytoplankton communities change under the influence of ocean acidification, we need to understand the nature and implications of individual species’ changes and what the common and species-specific changes are. Therefore, the aim of this research was to establish whether the biochemistry of Antarctic phytoplankton responds to elevated CO2 concentrations and if so, to identify similarities or differences in this response amongst species. Based on literature reports our hypothesis was to find an increase in C:N ratio, a decrease in PUFA and a decrease in cellular carbohydrate contents [36] with increasing pCO2.

2. Materials and Methods

We conducted two experiments in which three Antarctic phytoplankton species were exposed to CO2 concentrations ranging from ambient to 993 µatm following recommendations by Barry et al. [37]. The species chosen were the prasinophyte, Pyramimonas gelidicola, a single cell strain of the haptophyte Phaeocystis antarctica, and the dinoflagellate Gymnodinium sp. We chose these species to represent a mixture of phytoplankton types, commonly found in the waters off Davis Station, Antarctica, where these species were isolated from. We measured their pigment and fatty acid profiles, particulate carbohydrate content and carbon to nitrogen ratio immediately after acclimation to the experimental conditions. In agreement with recommendations in best practice guides [38], we used a continuous culture system with CO2-enriched gas aeration to achieve stable carbonate chemistry that mimics the natural changes occurring due to ocean acidification. For a better understanding of how individual species will respond under natural conditions, we conducted our experiments at macronutrient concentrations reported for the area from which our strains were isolated (near shore coastal waters off Davis Station, Antarctica) and set the light intensity to a similarly high level, as light intensity can greatly alter the CO2-induced response of phytoplankton [39,40,41]. Furthermore, we chose to expose all species to continuous light to minimize diurnal variations which can mask CO2-induced changes [42].
We used a continuous culture system with CO2-enriched gas aeration to achieve a stable carbonate chemistry that mimics the natural changes occurring due to ocean acidification, following the recommendations by Andersson et al. [38]. The main advantages of a continuous culture system with automatic constant dilution are: (1) the reduced labour intensity compared to semi-continuous culturing, that require regular manual dilutions; and (2) the possibility to use low nutrient concentrations that are approximating natural conditions compared to artificially high nutrient concentrations, such as in the commonly used full-strength f/2 medium. We chose a base recipe of f/2 medium [43,44] as it lacks any buffer that could affect the carbonate chemistry and trace metal speciation in the growth medium, which would thereby affect medium pH and phytoplankton growth [45]. Iron concentrations were not adjusted to the realistically low concentrations of the Southern Ocean since iron limitation has been found to influence phytoplankton response to elevated CO2 concentrations [46]; such changes would add a further level of complexity in interpreting our results. Nitrate and phosphate were adjusted to concentrations reported around O’Gorman Rocks, off Davis Station, Antarctica [47,48]. Silicate concentrations were lower than around O’Gorman Rocks but not limiting [49,50]. To achieve the target pCO2, we bubbled the phytoplankton bag cultures with air containing predetermined CO2 concentrations. Bubbling is a simple and effective way of altering the carbonate chemistry in agreement with natural changes [51]. The culture system is described in detail elsewhere [52] and will be summarized briefly below.
The system housed 24 × 2.3 L custom-made, transparent plastic bags (polyethylene, Entapack, Australia) thereby allowing two phytoplankton species to be studied simultaneously; each species was examined with triplicate bags exposed to four CO2 treatments (three CO2 enriched treatments and an ambient control). For each of the four target CO2 concentrations, two 28 L media reservoirs were bubbled with 0.2 μm filtered air. The reservoirs were used to supply fresh, sterile (0.2 μm filtered) medium by two 12-channel peristaltic pumps (Masterflex, John Morris Scientific Pty Ltd, Chatswood, NSW, Australia) to the culture bags corresponding to that pCO2 treatment in order to maintain the cells in exponential growth (Figure 1). Each culture bag was inoculated with a clonal phytoplankton culture of the same parent population and randomly attributed to the treatments. Initial cell density for Pyramimonas gelidicola cultures was ~8000 cells/mL, ~9500 cells/mL for Phaeocystis antarctica cultures and only ~80 cells/mL for Gymnodinium sp. cultures. The peristaltic pumps flushed the culture bags with sterile nutrient medium at a rate equivalent to the species’ growth rate once each species had reached exponential growth and sufficient cell density (Figure 2). Gymnodinium sp. was not constantly diluted before reaching the goal of 6–7 generations of acclimation at the end of the experiment, due to its slow growth rate.
Figure 1. Overview schematic diagram of the ocean acidification continuous culture system. For simplicity only one CO2 treatment and culture bag is shown. (a) Eight 28 L media reservoirs supplied the cultures with media of the respective pCO2. The reservoirs were continuously bubbled with CO2-enriched air of the respective concentration; (b) Air bubbling through the reservoirs and all culture bags and overflow bottles was first dehumidified by passing through a silica-gel filled cylinder fitted with an activated charcoal stage at the end to remove any organic contaminants; (c) Peristaltic pumps delivered the media from the reservoirs to each culture bag at a rate equivalent to the growth rate of the culture; (d) Culture bags and overflow bottles were continuously bubbled to maintain stable carbonate chemistry. At the same rate as media was pumped in, culture overflowed into a sterile overflow bottle, which was sampled for subsequent biochemical and other analyses.
Water 06 01840 g001
Figure 2. Daily cell densities with standard errors of Pyramimonas gelidicola (orange), Phaeocystis antarctica (green) and Gymnodinium sp. (black) cultures under the different CO2 treatments.
Water 06 01840 g002
The out-flowing culture was collected in sterile 1 L glass overflow bottles, providing culture material for subsequent analyses (Figure 1), as has been performed elsewhere [17]. Use of an overflow vessel to collect surplus culture allowed us to measure a suite of biochemical parameters for which large volumes of culture were required (up to 700 mL). By using the out-flowing culture rather than sample from within the culture bag, we avoided the possibility of contamination and also avoided any disturbances to the culture physiology by removing more than 10% of the culture volume [53]. Due to the slow growth rate of our three phytoplankton species and thus the slow dilution rate, surplus culture was left to accumulate for up to 2 days to provide the large volumes needed for the biochemical assays. These overflow bottles were located adjacent to the culture to ensure that the overflow bottles received the same light levels and temperatures as the cultures. Furthermore, the overflow bottles were bubbled with the same CO2-air mix until sampling occurred. Thus the only property in the overflow bottles that potentially differed from conditions within the continuous system was the nutrient concentration. We cannot rule out the possibility that nutrient concentrations in the overflow bottles decreased over the 2 day period. However, it has been shown that diatoms have the ability to store nitrogen within the cells ([54] and references therein) and given the slow doubling time (~2 days) of our selected phytoplankton species, only those cells entering the overflow bottle at the start of the 2 day period would have undergone a maximum of one generation outside of the continuous culture system versus at least five generations of acclimation within the continuous culture system. Further, cell densities within the overflow bottles never exceeded the carrying capacity associated with our culture medium, as established prior to the experiments. Based on this, we have assumed that samples taken from the overflow bottles are representative of the culture within the continuous culture system. However, this uncertainty could be addressed in future experiments by monitoring nutrient concentrations in the overflow bottle as well as increasing culture bag volumes to shorten the timeframe required to accumulate enough culture volume for biochemical analyses.

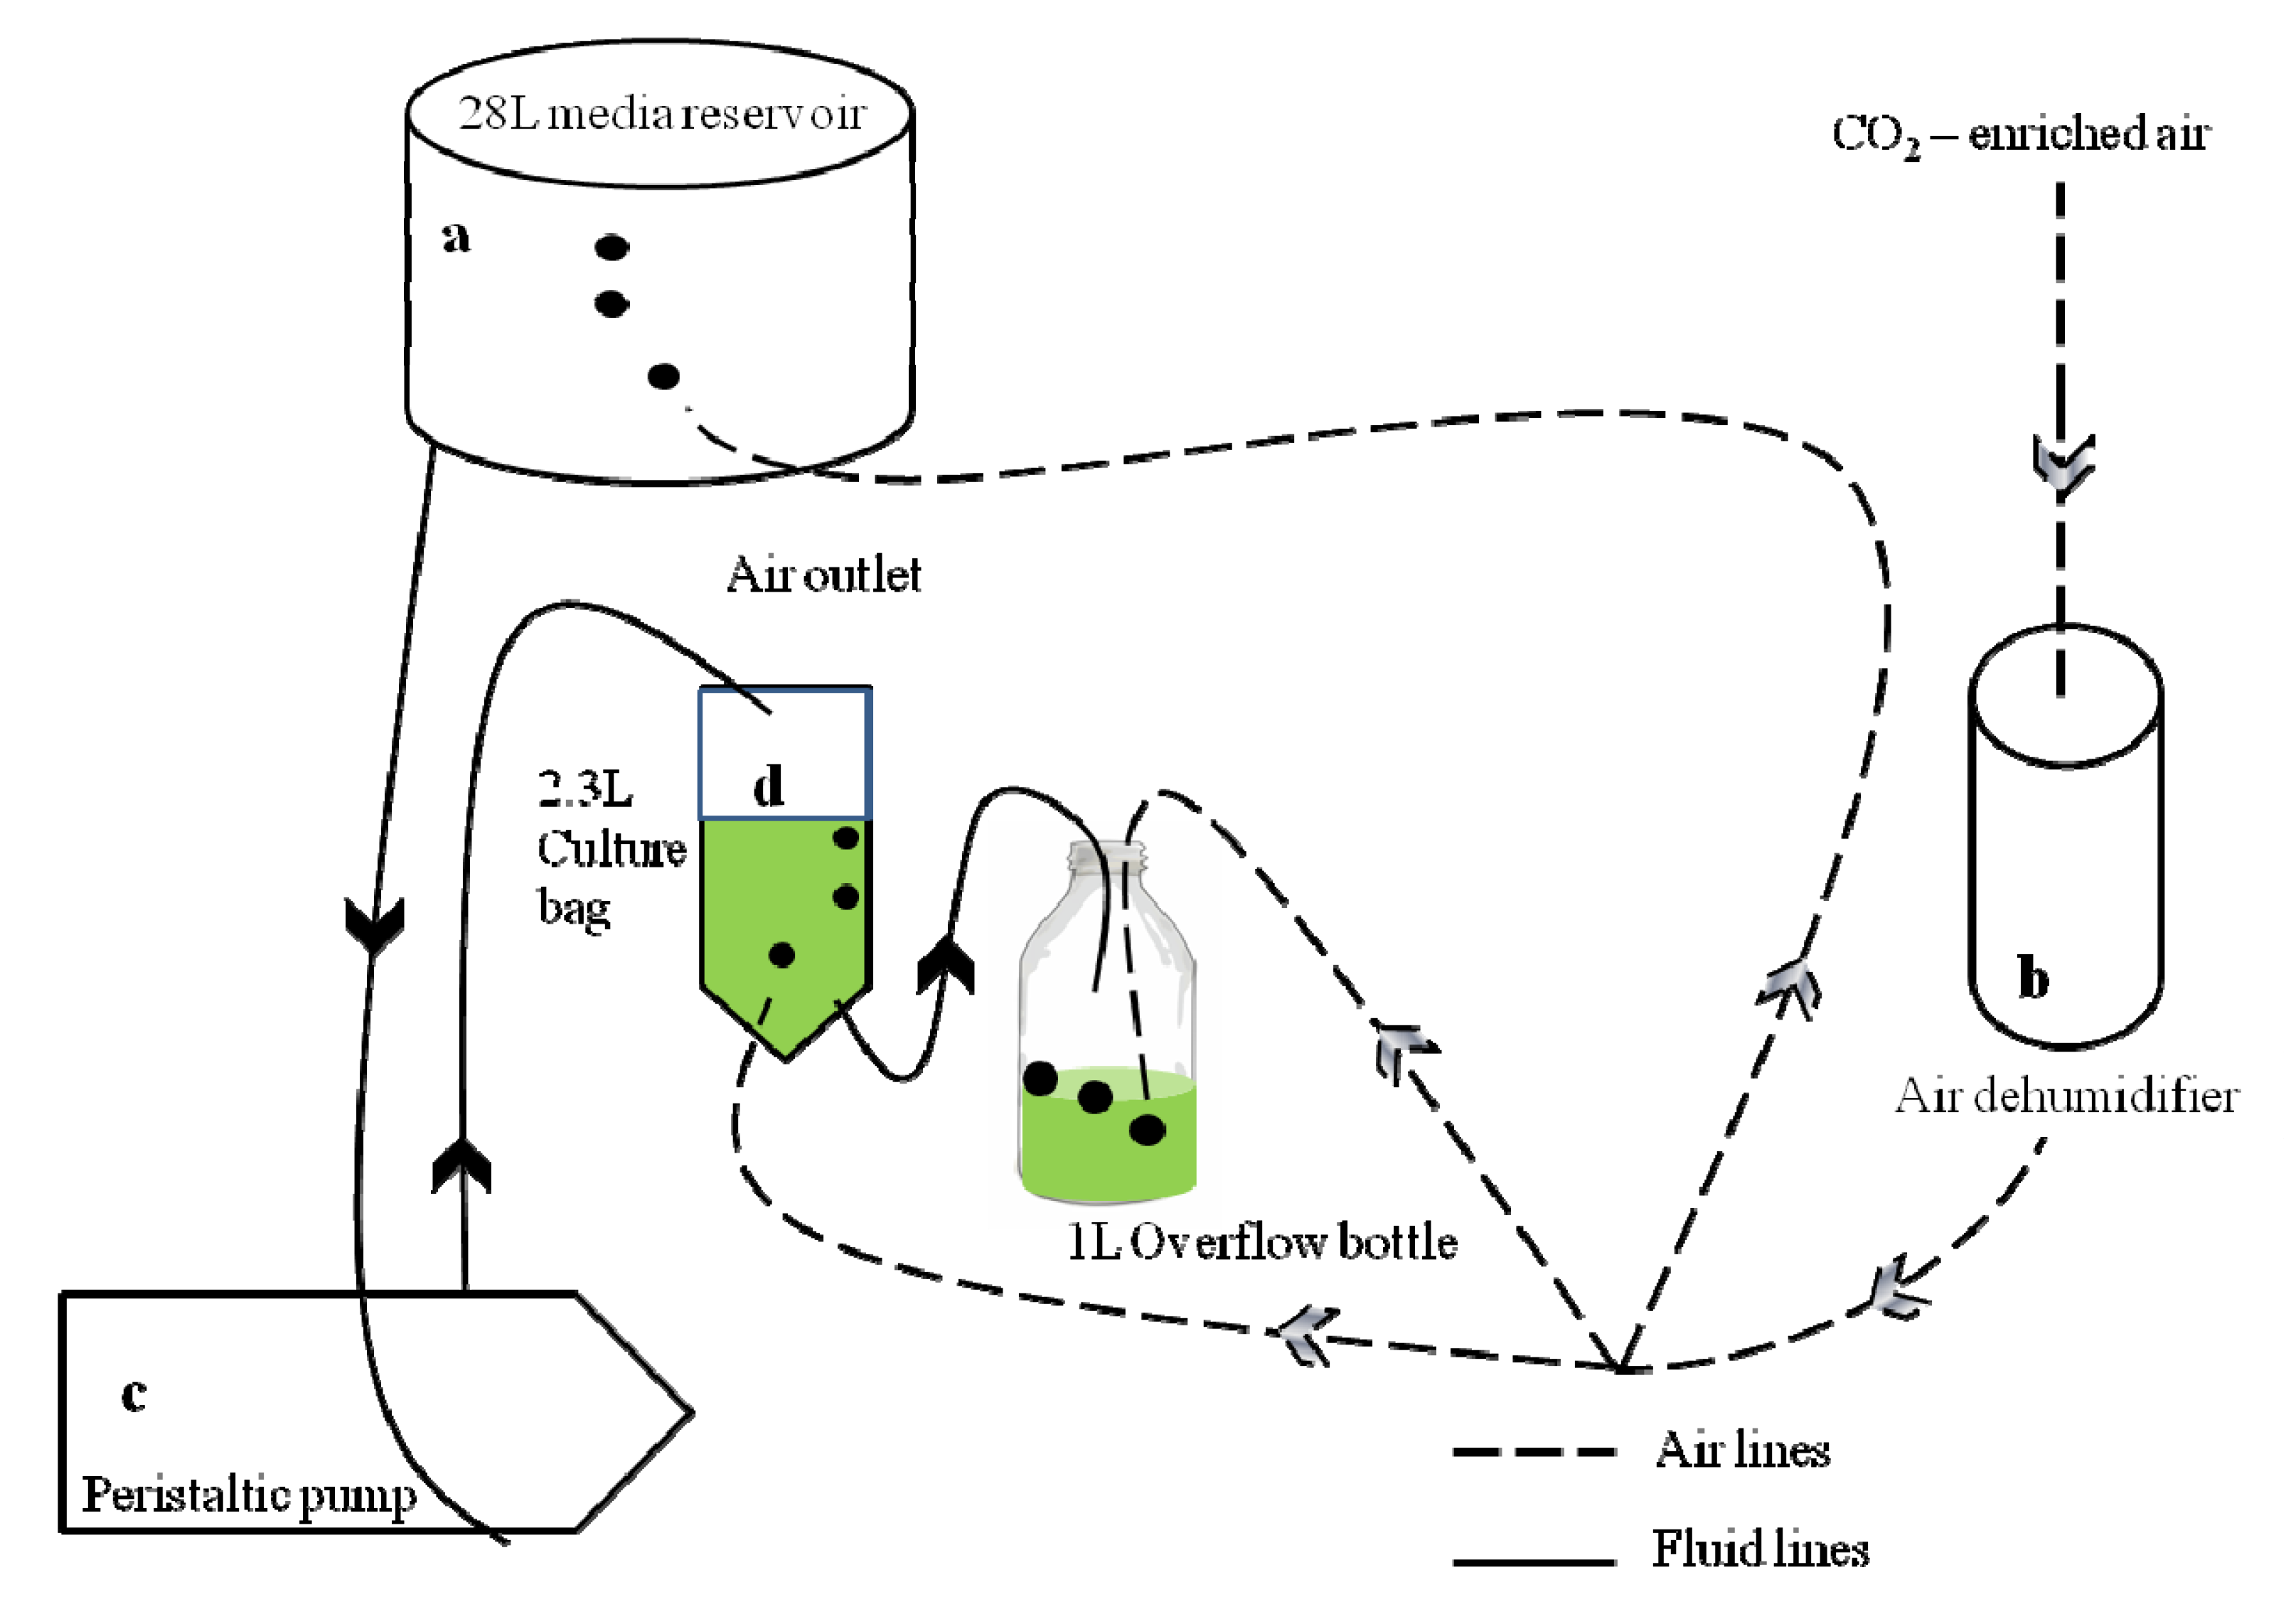
2.1. Experimental Conditions

The cultures, overflow bottles and media reservoirs were kept in a temperature controlled refrigerator, maintained at an average 2.9 °C. The culture bags were positioned in front of fluorescent lights with an irradiance of 267 ± 6.9 µmol m−2 s−1, approximating the light intensities at 5 m water depth around Davis Station, East Antarctica, from where most of these species were isolated [55]. Each culture, medium reservoir and overflow bottle was continuously bubbled with CO2-regulated air, using mass flow controllers (Horiba STEC SEC-E-40), which mixed pure food grade CO2 (BOC, Hobart, TAS, Australia) with ambient air to achieve specific CO2 concentrations for the treatments. The resulting gas was passed through silica gel, activated charcoal, and a 0.2 μm filter to remove any contaminants before being used to adjust the CO2 content of the culture bags, reservoirs and overflow bottles. Experimental conditions are listed in Table 1.
Table 1. Experimental conditions for all phytoplankton species. Values are averages with standard deviations, SD, in brackets. NOx includes NO3 and NO2.
SpeciesAcclimation in generationsNutrient concentrations (μM)CO2 concentration (µatm)
NOxSiPAmbient1.5×2.5×
Pyramimonas gelidicola~517.5
(±4.5)
24.4
(±5.2)
5.7
(±1.3)
400
(±41)
612
(±54)
806
(±80)
977
(±106)
pH ± SD 8.04
(±0.04)
7.87
(±0.03)
7.75
(±0.04)
7.67
(±0.04)
Phaeocystis antarctica~617.5
(±4.5)
24.4
(±5.2)
5.7
(±1.3)
413
(±31)
644
(±62)
-993
(±83)
pH ± SD 8.02
(±0.03)
7.86
(±0.04)
-7.67
(±0.03)
Gymnodinium sp.~620.9
(±1.8)
17.6
(±0.5)
1.5
(±0.2)
458
(±48)
580
(±49)
797
(±79)
973
(±82)
pH ± SD 8.02
(±0.04)
7.89
(±0.03)
7.75
(±0.04)
7.70
(±0.03)

2.2. Carbonate Chemistry

Carbonate chemistry in the culture bags was monitored daily by measuring pH with a Mettler Toledo Multi Seven pH meter (Mettler Toledo, Melbourne, Australia). The pH meter was calibrated daily using freshly prepared tris- and aminopyridine buffers made in artificial seawater according to the SOP 6a in “Guide to best practices for ocean CO2 measurements” [56]. Alkalinity samples (50 mL) were taken at regular intervals, poisoned with 25 μL saturated mercuric chloride solution and stored refrigerated in the dark until analysis in a closed cell using a Total Alkalinity Titrator ATT-05 (Kimoto, Osaka, Japan). A temperature probe logged the air temperature inside the refrigerator every 30 min (data not shown). CO2 concentrations were calculated with the CO2SYS.BAS Excel programme [57] based on total alkalinity, pH, temperature, salinity and nutrient concentrations using the constants after Mehrbach et al. [58] as refitted after Dickson and Millero [59].

2.3. Physiological and Biochemical Analyses

After acclimation of the cultures of each phytoplankton species to the four CO2 treatments, cultures in the overflow bottles were filtered to provide samples for fatty acid, pigment and C:N composition, and particulate carbohydrate content. Problems with the Phaeocystis antarctica cultures of the 2× ambient CO2 treatment lead to their exclusion from the data set and the 1.5× and 2.5× CO2 treatments were only comprised of two replicates each.

2.3.1. Cell Abundance

Daily cell abundance samples were taken to monitor exponential growth and relate measurements to a per cell basis. Samples were analysed using a BD FACSCalibur cytometer (Becton Dickson, San Diego, CA, USA) equipped with a 488 nm argon laser and cell concentrations were calculated by dividing event counts from bivariate scatter plots by the volume of culture analysed. PeakFlow Green 2.5 μm beads (Molecular Probes, Invitrogen, Mulgrave VIC, Australia) were added to each sample to monitor fluorescent signal strength.

2.3.2. Cell Dimensions

Cell dimensions were measured on Field Emission Scanning Electron Microscope images (JEOL JSM6701F, Frenchs Forest, NSW, Australia). For cells of Gymnodinium sp. and Pyramimonas gelidicola length and width were measured. Cell dimensions of Phaeocystis antarctica cells were not measured.

2.3.3. Pigments

Samples of each culture were vacuum filtered onto 13 mm GF/F filters (Whatman, GE Healthcare Life Sciences, Rydalmere, NSW, Australia), blotted dry and immediately frozen in liquid N2 in cryovials. The samples were stored at −135 °C until analysis using a modified method [60]. Pigments were extracted with 300 µL dimethylformamide with 50 µL methanol containing 140 ng of apo-8’-carotenal (Fluka) internal standard and analysed by high pressure liquid chromatography (HPLC) [61] using a Waters 626 pump, Gilson 233 XL autoinjector, Waters Symmetry C8 column, a Waters 996 diode array detector and a Hitachi FT1000 fluorescence detector. Pigments were identified by comparison of their retention times and spectra with a sample of mixed standards from known cultures [62] injected at the start of each daily sample queue. Peaks were integrated using Waters Empower software, manually checked and corrected where necessary and quantified using an internal standard method [63]. Further details on the procedures are in [64].

2.3.4. Cellular Carbohydrates and C:N Ratio

Each culture was filtered onto a muffled quartz filter (Sartorius, Goettingen, Germany) and ¼ was used for C:N ratio analysis and the remaining ¾ for carbohydrate analysis. Cell distribution across the filters was even, but to minimize bias between the analyses through possible uneven filtration, the filters were cut symmetrically into eight pieces and opposite ⅛ pieces of the filter were used to amount to the ¼ used for elemental analysis.
Phytoplankton particulate organic carbohydrates were first denatured into monosaccharides (adapted from [65]) and the carbohydrate content determined via a standard colorimetric analysis [66] on a GBC UV-Vis 916 spectrophotometer (GBC Scientific Equipment, Braeside, VIC, Australia).
Prior to C:N analysis, inorganic carbon was removed with 2 molar HCl. C:N composition was determined via a Thermo Finnigan EA 1112 Elemental Analyser (CEInstruments Ltd, Lancashire, UK).

2.3.5. Fatty Acid Analysis

Culture was filtered on pre-extracted (1:1 v/v chloroform:methanol) 25 mm GF/F (Whatman, GE Healthcare Life Sciences, Rydalmere, NSW, Australia) filters. Filters were trans-methylated to produce fatty acid methyl esters (FAME) by heating in methanol:chloroform:concentrated hydrochloric acid (3 mL, 10:1:1 v/v/v) at 80 °C for 2 h [67]. FAME were extracted into hexane:chloroform (4:1 v/v) and concentrated under a stream of nitrogen. An internal injection standard (19:0 FAME) was added and the fatty acid composition analysed by gas chromatography using an Agilent Technologies 7890A gas chromatography (Palo Alto, CA, USA) fitted with an Equity −1 fused silica capillary column (15 m × 0.1 mm internal diameter, 0.1 μm film thickness), a flame ionization detector, a split/splitless injector and an Agilent Technologies 7683B Series auto sampler and injector. Helium was used as carrier gas. Operating conditions were as described in [30].
Peaks were quantified with Agilent Technologies ChemStation software (Palo Alto, CA, USA) and individual components were identified using mass spectral data and comparison of retention time data with those obtained for authentic and laboratory standards. Gas chromatography-mass spectrometric analyses were performed on a Finnigan Thermoquest GCQ gas chromatography-mass spectrometer fitted with an on-column injector using Thermoquest Xcalibur software (Austin, TX, USA) and a capillary column of similar polarity to that described above.

2.3.6. Statistical Analysis

Biochemical results were analysed with a linear mixed effects model, including the interaction of culture bag and culture position in the three rows as nested random effects. Significant differences between treatment cultures and control cultures in all tests were accepted at p ≤ 0.05. Calculations were performed with the R software environment 2.14.2 [68].

3. Results and Discussion

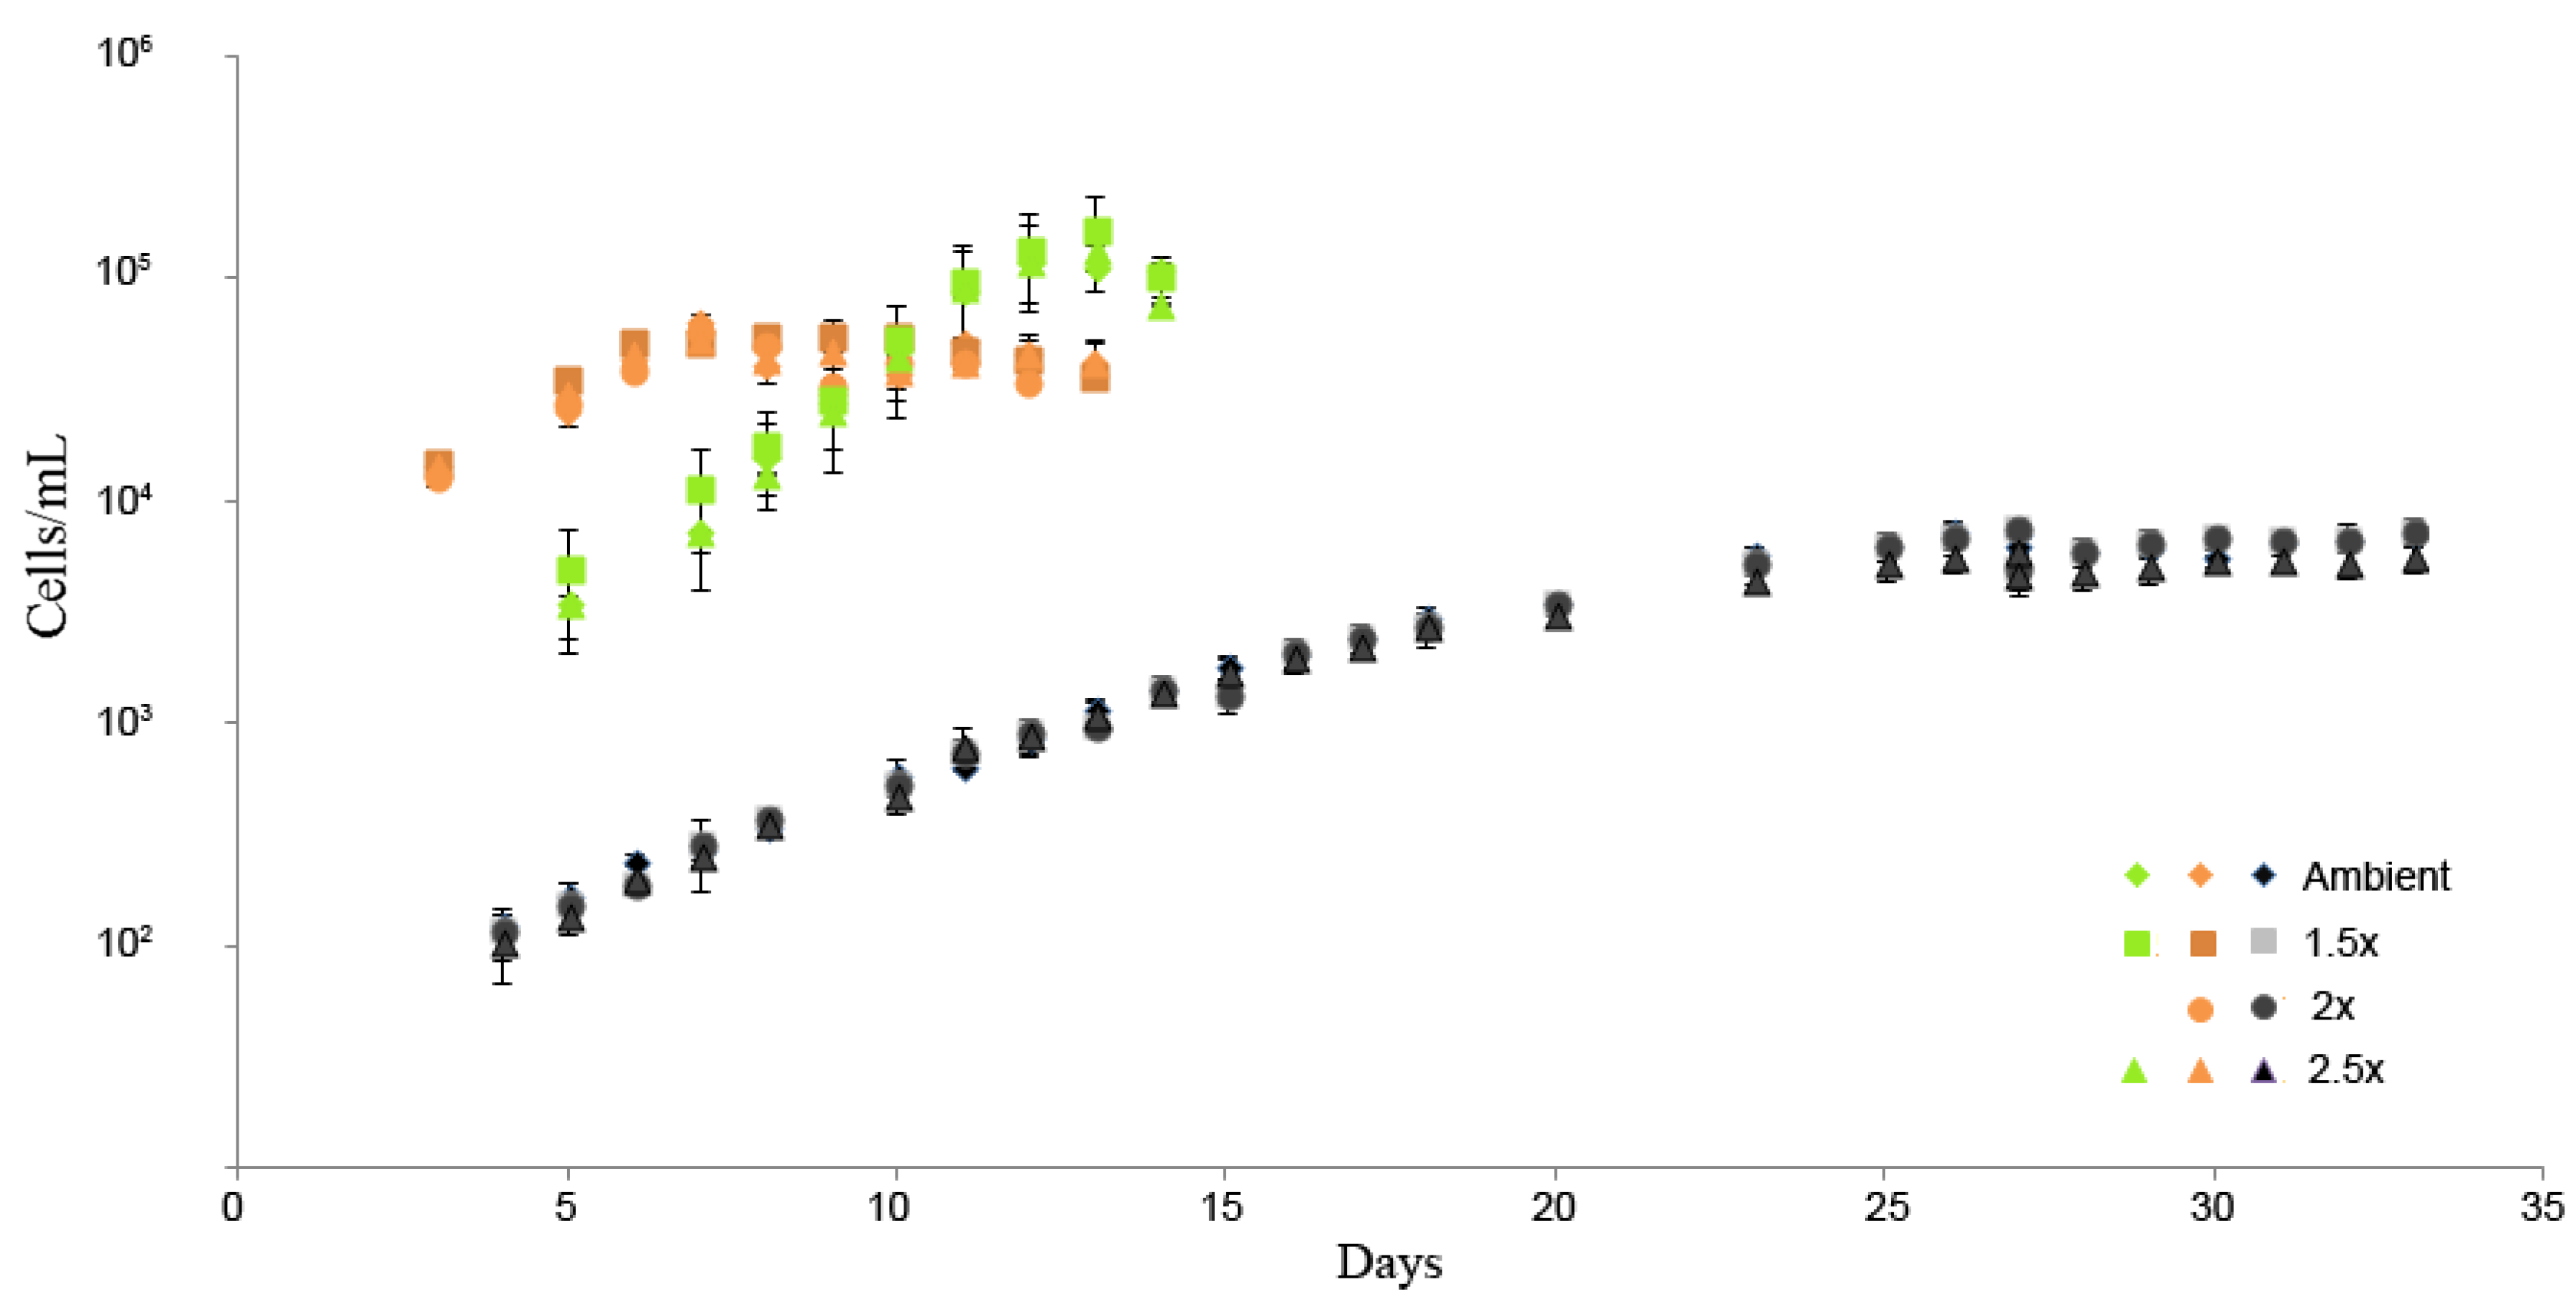
3.1. Cell Dimensions and Growth Rates

Pyramimonas gelidicola cells, grown at elevated CO2 concentrations, were not significantly different from their respective control cultures. Gymnodinium sp. cell dimensions were not affected by CO2 concentration (Table 2).
Growth rates were not affected by CO2 concentrations in any of the three species (Figure 2). Based on the exponential growth phase prior to culture dilutions, growth rates of our cultures were:
Pyramimonas gelidicola 0.38 d−1, SE ± 0.03
Phaeocystis antarctica 0.53 d−1, SE ± 0.03
Gymnodinium sp. 0.24 d−1, SE ± 0.01
Table 2. Pyramimonas gelidicola and Gymnodinium sp. cell dimensions of the respective CO2 treatments. SD in brackets, n = number of samples.
CO2 treatmentAmbient1.5×2.5×
Pyramimonas gelidicola
Length (µm)6.72 (±1.01) 7.04 (±1.23)6.82 (±1.03)7.01 (±1.37)
Width (µm)5.58 (±0.59)5.80 (±0.64)5.73 (±0.55)5.70 (±0.72)
n = 60n = 60n = 60n = 60
Gymnodinium sp.
Length (µm)16.62 (±2.60)17.21 (±2.65)17.24 (±2.44)16.54 (±2.42)
Width (µm)8.16 (±1.08)8.59 (±1.49)8.97 (±1.63)8.07 (±1.37)
n = 45n = 45n = 58n = 57

3.2. Pigments

There were no significant changes in pigment contents and ratios with increasing CO2 levels in the three phytoplankton species (Table 3).
Table 3. Phytoplankton pigment ratios and contents in pg cell−1 of the respective CO2 treatments. Chl = Chlorophyll, ant = antheraxanthin, violax = violaxanthin, zea = zeaxanthin, Ddx = diadinoxanthin, dtx = diatoxanthin, SD in brackets, n = number of samples.
CO2 treatmentAmbient1.5×2.5×
Pyramimonas gelidicola
Chl a0.62 (±0.18)0.47 (±0.11)0.53 (±0.14)0.70 (±0.06)
Chl a + b0.75 (±0.22)0.58 (±0.14)0.66 (±0.18)0.86 (±0.07)
(ant + violax + zea)/Chl a0.32 (±0.02)0.32 (±0.03)0.36 (±0.01)0.32 (±0.01)
γ-carotene/Chl a0.04 (±0.004)0.04 (±0.001)0.04 (±0.002)0.04 (±0.001)
Lutein/Chl a0.12 (±0.01)0.14 (±0.03)0.16 (±0.01)0.12 (±0.001)
n = 3n = 3n = 3n = 3
Phaeocystis antarctica
Chl a0.15 (±0.06)0.10 (±0.02)-0.08 (±0.02)
Chl a + c2 + c30.17 (±0.08)0.12 (±0.03)-0.09 (±0.03)
(Ddx + dtx)/Chl a0.49 (±0.18)0.68 (±0.18)-0.86 (±0.01)
n = 3n = 2-n = 2
Gymnodinium sp.
Chl a1.71 (±0.84)2.32 (±0.06)2.07 (±0.22)1.95 (±0.71)
Chl a + c21.80 (±0.89)2.43 (±0.06)2.19 (±0.23)2.04 (±0.74)
(Ddx + dtx)/Chl a0.82 (±0.12)0.77 (±0.07)0.77 (±0.11)0.84 (±0.09)
β-carotene/Chl a0.07 (±0.01)0.06 (±0.02)0.04 (±0.02)0.04 (±0.04)
n = 3n = 3n = 3n = 3

3.3. Elemental Composition

There was no significant change in elemental composition of the three phytoplankton species cells under the different CO2 treatments (Table 4), although all cultures had lower %C and C:N ratios compared to control cultures at the highest CO2 concentration.
Table 4. Phytoplankton elemental composition of the respective CO2 treatments. Percentages of dry mass, SD in brackets, n = number of samples.
CO2 treatmentAmbient1.5×2.5×
Pyramimonas gelidicola
%C10.7 (±2.2)6.0 (±2.6)8.1 (±9.8)7.7 (±3.3)
%N1.1 (±0.1)0.7 (±0.0)0.9 (±0.6)0.9 (±0.1)
C:N9.9 (±2.4)8.6 (±4.1)6.6 (±5.6)8.5 (±3.9)
n = 3n = 3n = 3n = 3
Phaeocystis antarctica
%C11.8 (±5.4)13.0 (±5.4)-9.4 (±5.3)
%N1.2 (±0.03)1.1 (±0.1)-1.4 (±0.6)
C:N9.4 (±4.1)11.6 (±4.1)-6.7 (±1.0)
n = 3n = 2-n = 2
Gymnodinium sp.
%C14.1 (±2.6)14.2 (±2.8)15.6 (±4.5)10.5 (±2.5)
%N2.0 (±0.2)2.2 (±0.6)2.0 (±0.3)1.8 (±0.4)
C:N6.9 (±0.9)6.8 (±1.5)7.6 (±1.1)5.7 (±0.3)
n = 3n = 3n = 3n = 3

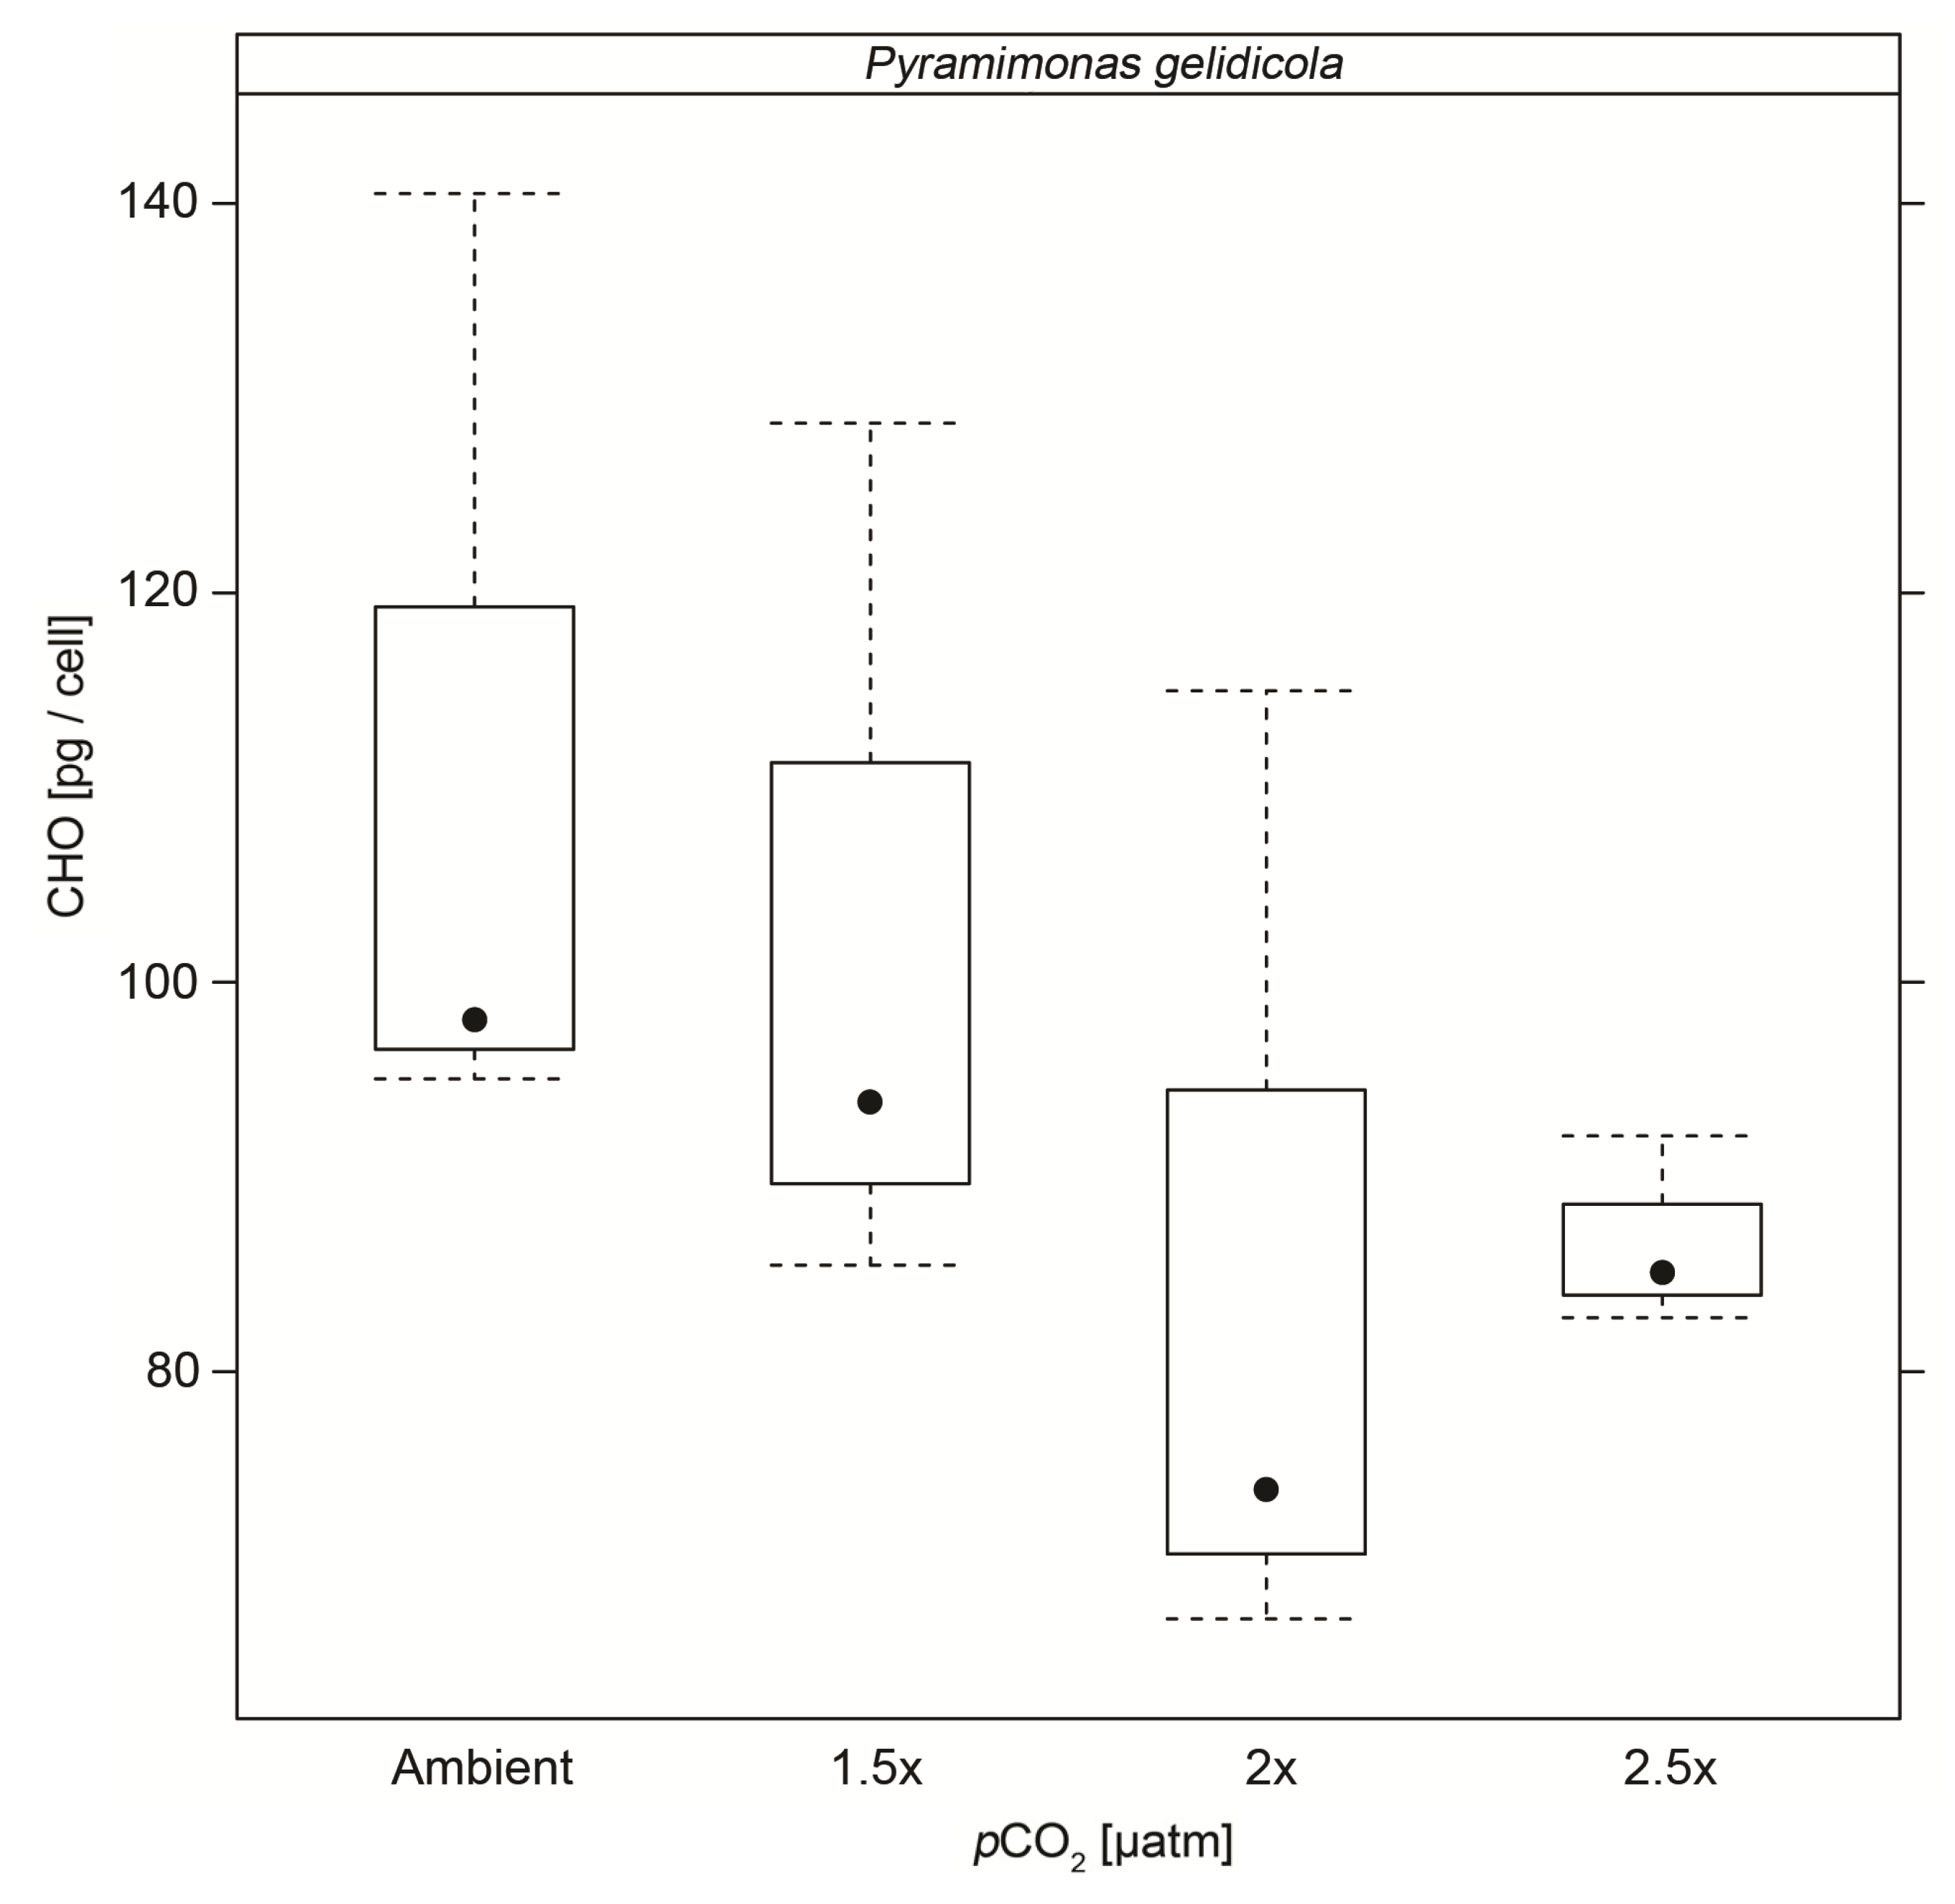
3.4. Particulate Carbohydrates
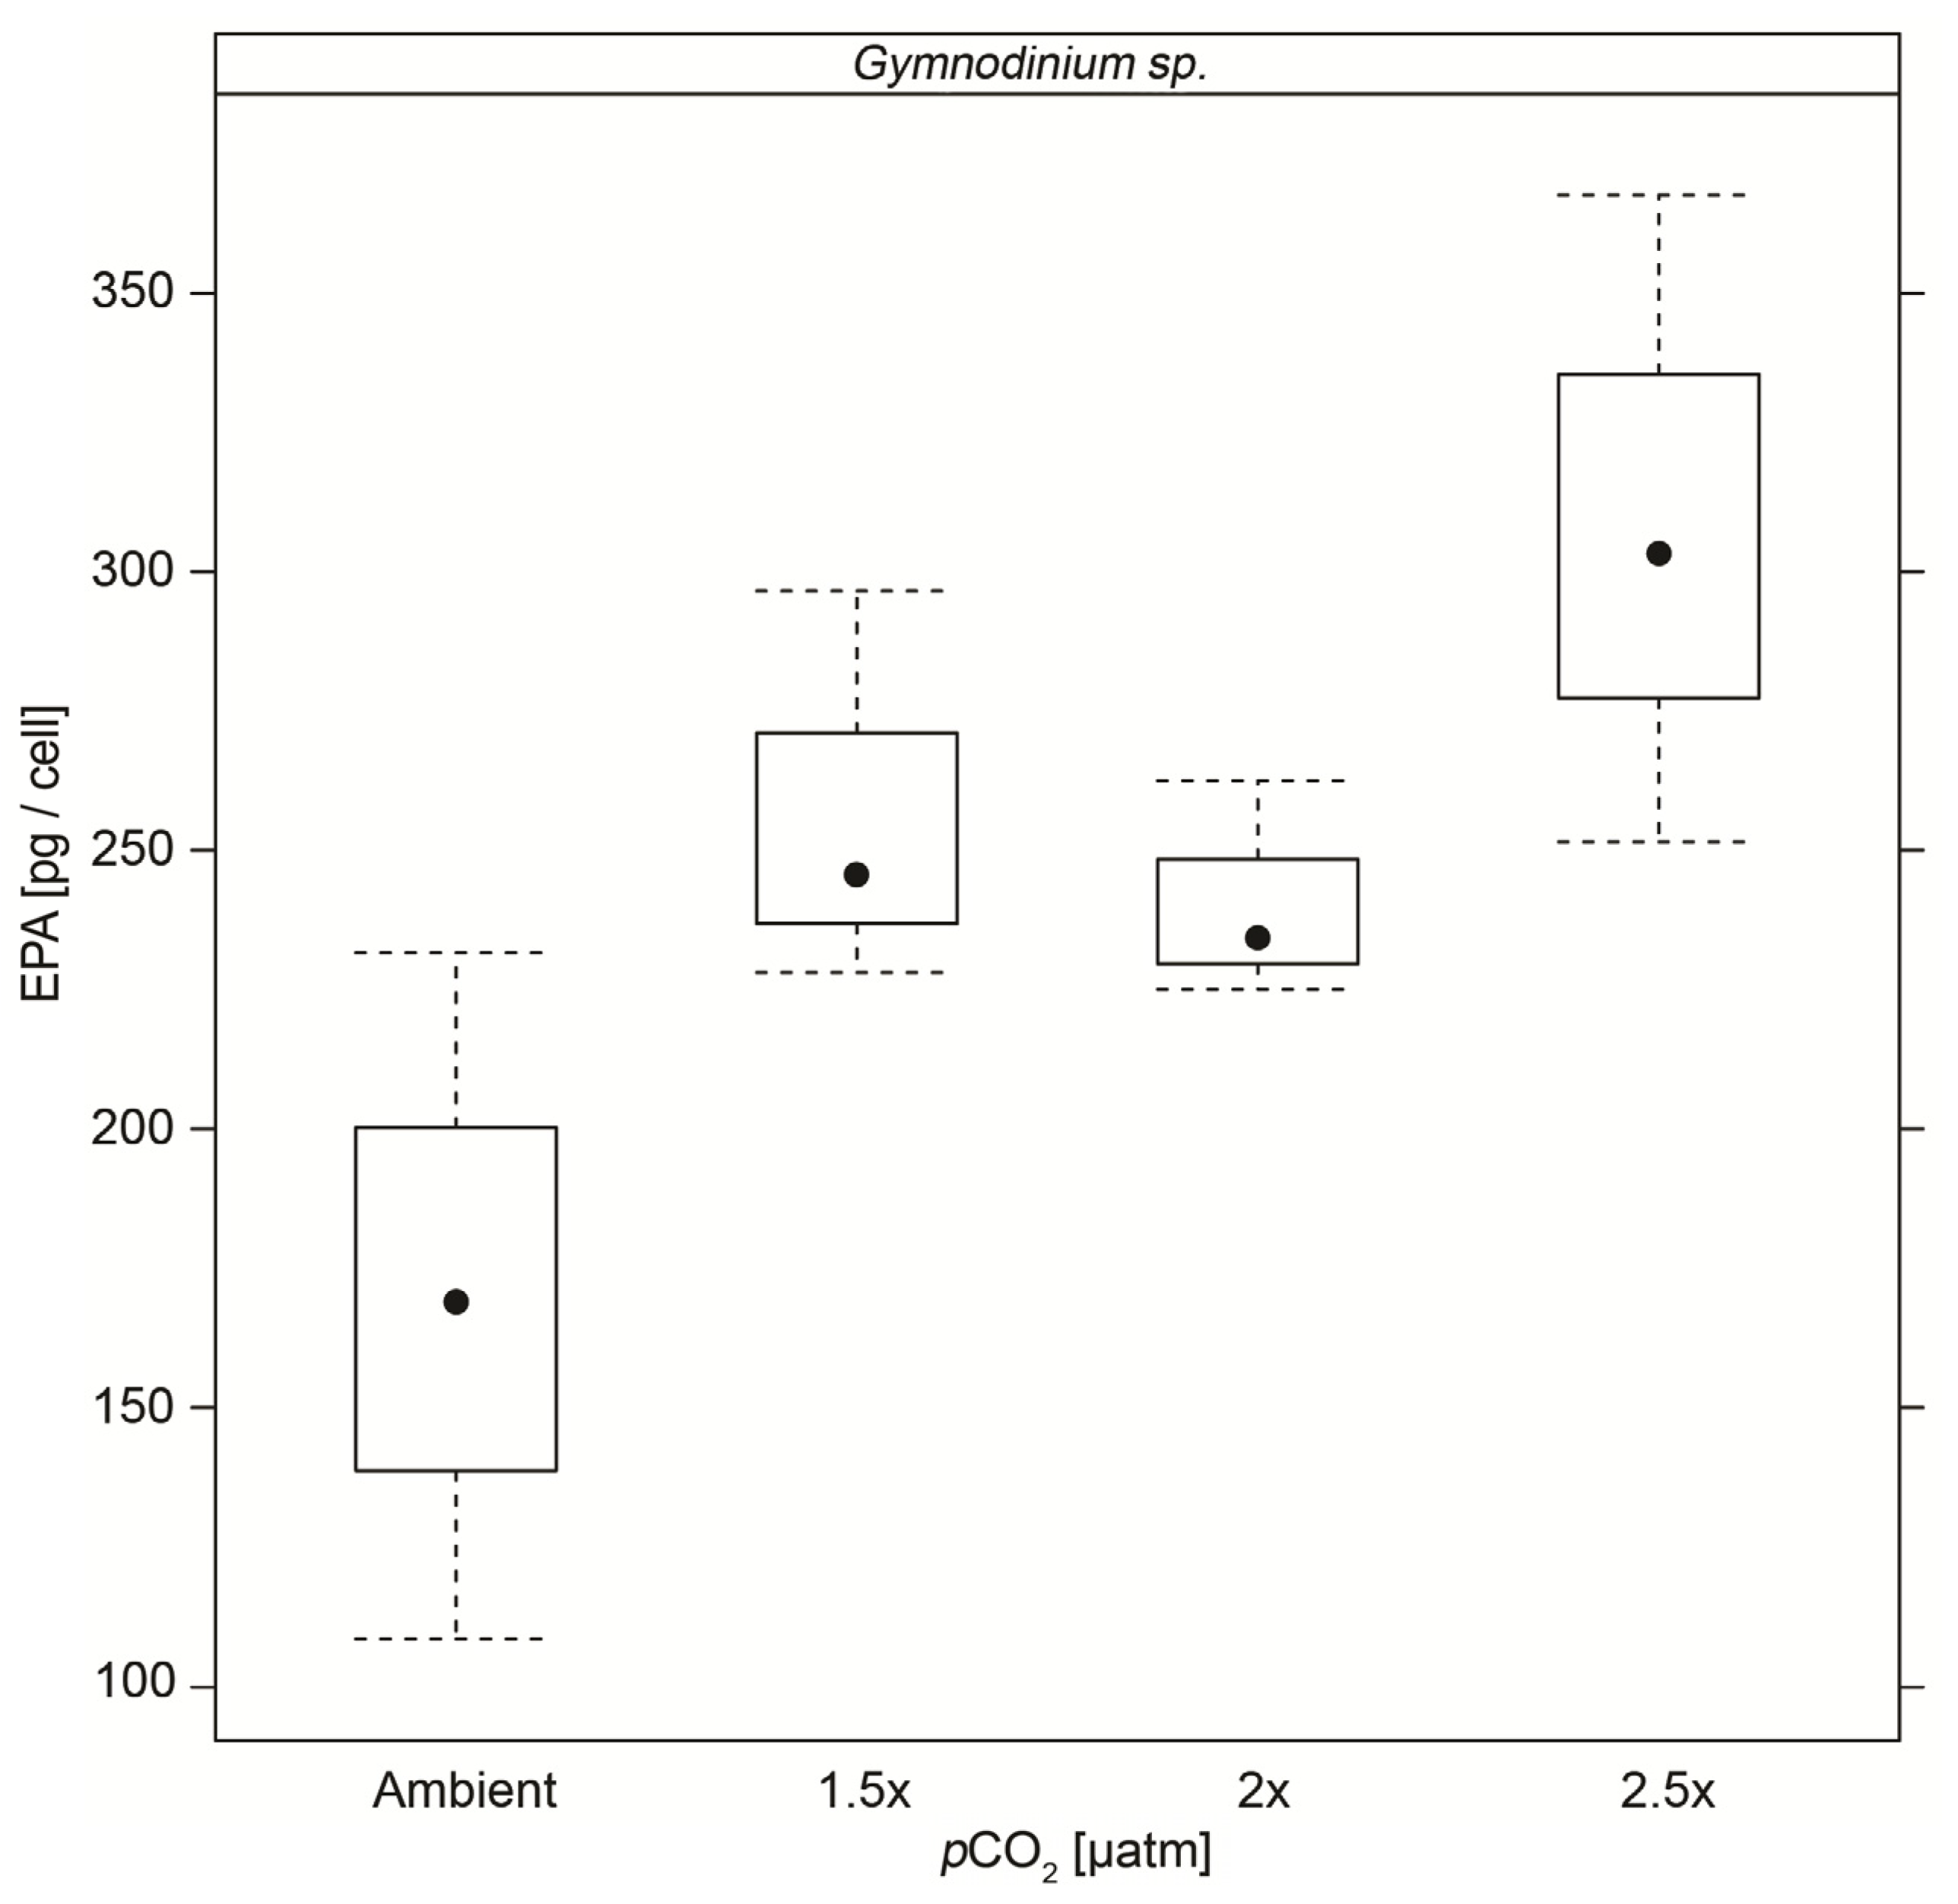
Particulate organic carbohydrate (CHO) content per cell in Pyramimonas gelidicola cultures were significantly lower at 2× and 2.5× pCO2 than in control cells (p < 0.05) (Figure 3 and Table 5). In Phaeocystis antarctica cultures, CHO content were significantly higher in the highest CO2 treatments than in control cultures (p < 0.05). CHO content per cell in Gymnodinium sp. cultures were not affected by elevated CO2 concentrations.

3.5. Fatty Acids

Phaeocystis antarctica cultures showed no changes in the total amount of fatty acids per cell, the sum of monounsaturated fatty acids (MUFA), saturated fatty acids (SFA) and polyunsaturated fatty acids (PUFA), nor the sum of ω3 and ω6 PUFA, particularly DHA and EPA (Table 6). Pyramimonas gelidicola cultures showed decreased PUFA, ω3 and ω6 PUFA, DHA and total fatty acid content per cell at 2.5× pCO2 (Table 6), but did not differ from control cultures in SFA and EPA content.
The cellular PUFA, MUFA, SFA, ω3 and ω6 PUFA and total fatty acid content of Gymnodinium sp. cultures were unaffected by CO2. EPA contents per cell were significantly elevated at all high CO2 treatments compared to control cultures (Figure 4 and Table 6).
Figure 3. Cellular carbohydrate (CHO) content (pg/cell) with standard deviation of Pyramimonas gelidicola cultures under the different CO2 concentrations.
Water 06 01840 g003
Table 5. Phytoplankton particulate organic carbohydrate (CHO) content in pg cell−1 of the respective CO2 treatments. SD in brackets, n = number of samples. * p < 0.05.
CO2 treatmentAmbient1.5×2.5×
Pyramimonas gelidicola
CHO111.2 (±25.5)102.7 (±22.9)85.4 (±25.8) *86.7 (±4.9) *
n = 3n = 3n = 3n = 3
Phaeocystis antarctica
CHO7.6 (±0.5)8.3 (±0.7)-9.9 (±0.5) *
n = 3n = 2-n = 2
Gymnodinium sp.
CHO93.4 (±30.3)92.1 (±12.3)110.4 (±26.5)91.9 (±16.5)
n = 3n = 3n = 3n = 3
Based on literature reports, our hypothesis was that an increase in C:N ratio, a decrease in PUFA and a decrease in cellular carbohydrate contents may occur with increasing pCO2. Between the three Antarctic phytoplankton species examined here, we found subtle but highly variable responses under elevated CO2 concentrations, with opposite changes observed in cellular carbohydrate contents as well as in fatty acid profiles.
Contrary to our hypothesis we found no changes in C:N ratio in the three phytoplankton species examined. This is consistent with some literature results [14,42], which showed only minor responses of C:N ratios in a range of species under CO2 concentrations above present day levels, but it is in contrast to other studies that have shown increased C:N ratios under elevated pCO2 [17,18,19]. A species-specific and even life stage-specific response of C:N ratio to elevated pCO2 has been reported elsewhere [69].
Table 6. Fatty acid content in pg/cell for all three phytoplankton species at the respective CO2 treatments. SD in brackets, n = number of samples. * p < 0.05; ** p < 0.01.
CO2 treatmentAmbient1.5×2.5×
Pyramimonas gelidicola
SFA0.3 (±0.08)0.4 (±0.12)0.4 (±0.12)0.3 (±0.21)
MUFA3.0 (±0.36)4.6 (±0.92) *3.8 (±0.72)2.2 (±0.85)
PUFA9.9 (±1.10)9.4 (±0.90)9.5 (±1.38)6.5 (±2.72) *
ω34.9 (±0.67)4.3 (±0.36)4.7 (±0.63)3.4 (±1.29) *
ω62.5 (±0.31)2.7 (±0.34)2.6 (±0.47)1.5 (±1.00) *
DHA1.2 (±0.19)1.1 (±0.10)1.2 (±0.15)0.8 (±0.36) *
EPA0.1 (±0.01)0.1 (±0.02)0.1 (±0.01)0.1 (±0.03)
Total FA14.9 (±1.5)16.3 (±2.3)15.4 (±2.2)10.2 (±3.9) *
n = 3n = 3n = 3n = 3
Phaeocystis antarctica
SFA0.2 (±0.15)0.2 (±0.03)-0.3 (±0.06)
MUFA0.7 (±0.58)0.5 (±0.17)-0.7 (±0.11)
PUFA1.9 (±1.42)1.4 (±0.04)-1.6 (±0.25)
ω31.1 (±0.81)0.8 (±0.00)-0.9 (±0.13)
ω60.8 (±0.61)0.6 (±0.04)-0.7 (±0.11)
DHA0.5 (±0.37)0.4 (±0.02)-0.5 (±0.08)
EPA0.1 (±0.09)0.1 (±0.00)-0.1 (±0.01)
Total FA3.1 (±2.37)2.3 (±0.28)-2.9 (±0.48)
n = 3n = 2-n = 2
Gymnodinium sp.
SFA28.0 (±16.47)26.4 (±3.93)35.4 (±30.07)20.0 (±9.40)
MUFA27.0 (±8.65)27.0 (±2.86) 37.0 (±7.98) *31.2 (±5.31)
PUFA80.6 (±38.52)96.8 (±7.58)117.1 (±52.75)94.1 (±27.36)
ω333.7 (±12.41)39.7 (±2.55)44.7 (±14.12)38.2 (±10.79)
ω647.0 (±26.42)57.2 (±5.14)72.6 (±38.80)55.7 (±16.60)
DHA18.0 (±7.75)22.0 (±1.92)25.3 (±9.77)22.6 (±5.13)
EPA0.17 (±0.061)0.26 (±0.036) **0.24 (±0.020) **0.31 (±0.058) **
Total FA153.6 (±72.45)170.5 (±11.91)216.2 (±104.09)164.9 (±44.92)
n = 3n = 3n = 3n = 3
Cellular carbohydrate content of the prasinophyte, Pyramimonas gelidicola, and the haptophyte, Phaeocystis antarctica, cultures showed significant changes under elevated CO2 concentrations. In agreement with the findings of Thornton [36], who studied the marine diatom Chaetoceros muelleri, cellular carbohydrate contents of Pyramimonas gelidicola, cultures decreased about 22% under 2× (pH = 7.75) and 2.5× (pH = 7.67) ambient CO2 concentrations, compared to a ~20% decrease at pH 7.9 reported by Thornton [36]. Extracellular carbohydrate content was not measured in our experiment, thus we cannot exclude the possibility of excess carbon being accumulated and excreted as transparent exopolymers or low molecular weight carbohydrates in Pyramimonas gelidicola cultures, as suggested by Engel [70] and Thornton [36]. Cellular carbohydrate content increased by ~30% in Phaeocystis antarctica cultures at 2.5× ambient pCO2 (pH = 7.67). This is a larger increase than the 23% increase in cellular glucan content, a storage carbohydrate, reported in the marine diatom Skeletonema costatum grown at pH 7.5 [71]. Taraldsvik and Myklestad [71] manipulated the pH of the growth medium via addition of acid/base in contrast to the use of CO2 as occurred here, which might explain the difference in the magnitude between our result and theirs. This opposing trend in cellular carbohydrate contents between our two species highlights the importance of analysing the changes in both particulate and dissolved carbohydrates in future studies to identify the fate of C in the cellular and extracellular C pool. It also highlights the possibility that different phytoplankton types respond differently to increased CO2 concentrations. However, as the results by Thornton [36] and Taraldsvik and Myklestad [71] show, even within the same phytoplankton types, in this case diatoms, opposing response to CO2 has been found.
Figure 4. EPA content (pg/cell) with standard deviation of Gymnodinium sp. cultures under the different CO2 concentrations.
Water 06 01840 g004
Equally, no universal response in fatty acid content to increased pCO2 was found in the three phytoplankton species investigated here. However, the changes in fatty acid profiles found in Pyramimonas gelidicola are of particular interest with regards to the availability of essential fatty acids for grazers. A decrease in PUFA content could constitute deterioration in the nutritional quality of phytoplankton for grazers, while an increase in these essential fatty acids such as EPA in Gymnodinium sp. could improve their quality as food. The effects of ocean acidification on the nutritional quality of phytoplankton are still mostly unknown with only a few studies conducted to date. While Leu et al. [72] could not find any deterioration in a natural plankton community in the Arctic, Rossoll et al. [20] reported that Thalassiosira pseudonana grown at high pCO2 negatively affected growth and reproduction of the copepod Acartia tonsa. Similarly Wynn-Edwards et al. [73] found negative effects of Pseudonitzschia subcurvata grown at high pCO2 on Antarctic krill, Euphausia superba, larval mortality rates. The PUFA content in Pyramimonas gelidicola cultures under elevated CO2 was about 34% lower than under ambient conditions and this agrees well with the 36% decrease in PUFA content in the diatom Thalassiosira pseudonana under 761 µatm pCO2 reported by Rossoll et al. [20]. Detailed studies of the mechanisms and pathways of lipid and fatty acid production in other organisms suggest that external and internal pH influence lipid and fatty acid production. A decrease in external pH can translate into a decrease in internal pH [74]. Decreased internal pH in turn was reported to suppress phospholipid metabolic genes in yeasts [75] and a lower degree of unsaturation of fatty acids in CO2-enriched cultures of Chlorella kessleri compared to ambient CO2 concentrations was at least partially attributed to suppressed fatty acid synthesis and thus the promotion of desaturation of pre-existing fatty acids [76]. A higher degree of membrane lipid fatty acid saturation could be a mechanism to maintain internal pH, since a higher degree of fatty acid saturation leads to lowered fluidity and lower CO2-permeability of cell membranes [20].
Ocean acidification experiments generally aim to allow the prediction of the test organisms’ future response to elevated pCO2 A recent study by Tortensson et al. [77] highlighted the need of conducting ocean acidification experiments under as close to natural conditions as possible, i.e., nutrient concentrations, temperature, light intensities, etc. In the latter study the authors exposed the Antarctic diatom Nitzschia lecointei to 390 and 960 µatm CO2 for 14 days under −1.8 and 2.5 °C temperature. They only found a significant difference in PUFA levels between the two CO2 treatments at −1.8 °C. Increased temperature affected the PUFA levels more drastically than CO2 concentrations. If this temperature dependency of the CO2 response is universal for Antarctic phytoplankton, then this could explain why we saw very little significant differences in PUFA levels across our three species which were grown at approximately 2.9 °C. Furthermore, if the CO2-induced response of phytoplankton biochemistry is greatly reduced under warmer temperatures, it is possible that a CO2-signal was not detected under the noise of the data. Since ocean acidification experiments are often resource intensive, use of a large number of replicates is not always practical, which can make the detection of subtle differences difficult. While we performed every treatment in triplicate in our experiments, a larger number of replicates would improve our statistical power and ability to detect subtle differences between treatments. To facilitate increased replication the number of CO2 treatments can be reduced in favor of more replicates per treatment. However, this reduces the resolution of a possible CO2 dose-response-curve and the ability to detect any potential tipping points.
Except for EPA contents in Gymnodinium sp. and carbohydrate content in Pyramimonas gelidicola, we could not detect a CO2 signal across all CO2 concentrations, and often only found significantly different biochemical contents in the highest pCO2 cultures compared to control cultures. As noted above, this could be due to noise in the data due to low replication, which only allows strong differences to be statistically significant. However, the chance of false positive results also increases with the number of parameters that are tested for. Increased replication and possibly reduced experimental temperatures are therefore recommended for future research.

4. Conclusions

In this study we have shown that an elevated CO2 concentration has, at most, only modest effects on the biochemistry of three Antarctic phytoplankton species, although the responses were species-specific. It is unlikely that any phytoplankton species will be completely unaffected by changes in CO2 concentration; however, the degree to which different species will be capable of tolerating ocean acidification, while simultaneously exposed to other climate-induced stressors, will determine which species will be the “winners and losers” in the future [39,78,79,80]. While some of the species studied here showed responses in line with current literature, some of the results were contradictory. Laboratory experiments are not able to include all phytoplankton species of the oceans. Thus, to improve our ability to predict future changes of mixed phytoplankton communities, we need to increase our understanding of the underlying mechanisms by which pH and CO2 availability affect phytoplankton physiology. An enhanced understanding will help explain the differences in species-specific responses and thereby improve our ability to extrapolate laboratory based results of individual species to natural communities. Our study suggests that increases in pCO2 have the potential to alter the nutritional quality of individual phytoplankton species available for grazers via species-specific changes in their biochemistry, particularly the fatty acid profiles as emphasized by examination of the essential long-chain PUFA, and this adds to the importance of understanding how phytoplankton will change in a high-CO2 ocean.

Acknowledgments

We thank Tasha Waller for technical support and guidance, Rick van den Enden for technical support in preparation and imaging of microalgal samples with FESEM and Dan Holdsworth for managing the CSIRO GC and GC-MS facility. We thank the staff at the Australian Antarctic Division Workshop for constructing integral parts of the continuous culture system. We thank Philip Boyd for valuable feedback on an earlier draft, and three anonymous journal reviewers for their valuable and helpful comments. C Wynn-Edwards was supported by an Endeavour International Postgraduate Research scholarship at UTAS and a CSIRO Wealth from Oceans top-up scholarship. This work was supported by Holsworth Wildlife Research Endowment [V0018333] and the Australian Antarctic Science Program Project No. 4037 and 4026.

Author Contributions

The first author was responsible for all experimental work and sample analysis. The first and second authors were responsible for the concept and design of the experimental facilities. The third, fourth and fifth authors provided guidance during the experimental and analytical work and together with the seventh and eighth authors helped with the writing and presentation of the manuscript. The sixth author provided guidance with statistical analysis of the data.

Conflicts of Interest

The authors declare no conflict of interest.

References

  1. Zeebe, R.E.; Zachos, J.C.; Caldeira, K.; Tyrrell, T. Carbon Emissions and Acidification. Science 2008, 321, 51–52. [Google Scholar] [CrossRef]
  2. Sabine, C.L.; Feely, R.A.; Gruber, N.; Key, R.M.; Lee, K.; Bullister, J.L.; Wanninkhof, R.; Wong, C.S.; Wallace, D.W.R.; Tilbrook, B.; et al. The oceanic sink for anthropogenic CO2. Science 2004, 305, 367–371. [Google Scholar] [CrossRef] [Green Version]
  3. IPCC. Summary for Policymakers. In Climate Change 2007: The Physical Science Basis. Contribution of Working Group I to the Fourth Assessment Report of the Intergovernmental Panel on Climate Change; Solomon, S., Qin, D., Manning, M., Chem, Z., Marquis, M., Averyt, K.B., Tignor, M., Miller, H.L., Eds.; Cambridge University Press: Cambridge, UK; New York, NY, USA, 2007; p. 18. [Google Scholar]
  4. The Royal Society. Ocean Acidification Due to Increasing Atmospheric Carbon Dioxide. Policy Document 12/05; The Royal Society: Cardiff, UK, 2005; p. 57. [Google Scholar]
  5. Caldeira, K.; Wickett, M.E. Oceanography: Anthropogenic carbon and ocean pH. Nature 2003, 425, 365. [Google Scholar] [CrossRef]
  6. Fabry, V.J.; Seibel, B.A.; Feely, R.A.; Orr, J.C. Impacts of ocean acidification on marine fauna and ecosystem processes. ICES J. Mar. Sci. 2008, 65, 414–432. [Google Scholar] [CrossRef]
  7. IPCC. Working Group I Report “The physical basis”, 2007. Available online: http://ipcc.ch/publications_and_data/ar4/wg1/en/contents.html (accessed on 10 June 2014).
  8. Tortell, P.D.; Payne, C.D.; Li, Y.; Trimborn, S.; Rost, B.; Smith, W.O.; Riesselman, C.; Dunbar, R.B.; Sedwick, P.; DiTullio, G.R. CO2 sensitivity of Southern Ocean phytoplankton. Geophys. Res. Lett. 2008, 35, 1–5. [Google Scholar]
  9. McNeil, B.I.; Matear, R.J. Southern Ocean acidification: A tipping point at 450-ppm atmospheric CO2. Proc. Natl. Acad. Sci. USA 2008, 104, 18860–18864. [Google Scholar] [CrossRef]
  10. Fabry, V.J.; McClintock, J.B.; Mathis, J.T.; Grebmeier, J.M. Ocean acidification at high latitudes: The bellwether. Oceanography 2009, 22, 160–171. [Google Scholar]
  11. Riebesell, U. Effects of CO2 enrichment on marine phytoplankton. J. Oceanogr. 2004, 60, 719–729. [Google Scholar] [CrossRef]
  12. Montes-Hugo, M.; Doney, S.C.; Ducklow, H.W.; Fraser, W.; Martinson, D.; Stammerjohn, S.E.; Schofield, O. Recent changes in phytoplankton communities associated with rapid regional climate change along the Western Antarctic Peninsula. Science 2009, 323, 1470–1473. [Google Scholar] [CrossRef]
  13. Riebesell, U.; Schulz, K.G.; Bellerby, R.G.J.; Botros, M.; Fritsche, P.; Meyerhoefer, M.; Neill, C.; Nondal, G.; Oschlies, A.; Wohlers, J.; et al. Enhanced biological carbon consumption in a high CO2 ocean. Nature 2007, 450, 545–549. [Google Scholar] [CrossRef] [Green Version]
  14. Burkhardt, S.; Riebesell, U. CO2 availability affects elemental composition (C:N:P) of the marine diatom Skeletonema costatum. Mar. Ecol. Prog. Ser. 1997, 155, 67–76. [Google Scholar] [CrossRef]
  15. Bellerby, R.G.J.; Schulz, K.G.; Riebesell, U.; Neill, C.; Nondal, G.; Heegaard, E.; Johannessen, T.; Brown, K.R. Marine ecosystem community carbon and nutrient uptake stoichiometry under varying ocean acidification during the PeECE III experiment. Biogeosciences 2008, 5, 1517–1527. [Google Scholar] [CrossRef] [Green Version]
  16. Paulino, A.I.; Egge, J.K.; Larsen, A. Effects of increased atmospheric CO2 on small and intermediate sized osmotrophs during a nutrient induced phytoplankton bloom. Biogeosciences 2008, 5, 739–748. [Google Scholar] [CrossRef]
  17. Schoo, K.L.; Malzahn, A.M.; Krause, E.; Boersma, M. Increased carbon dioxide availability alters phytoplankton stoichiometry and affects carbon cycling and growth of a marine planktonic herbivore. Mar. Biol. 2013, 160, 2145–2155. [Google Scholar] [CrossRef]
  18. Iglesias-Rodriguez, M.D.; Halloran, P.R.; Rickaby, R.E.M.; Hall, I.R.; Colmenero-Hidalgo, E.; Gittins, J.R.; Green, D.R.H.; Tyrrell, T.; Gibbs, S.J.; von Dassow, P.; et al. Phytoplankton calcification in a high-CO2 world. Science 2008, 320, 336–340. [Google Scholar] [CrossRef]
  19. Hoogstraten, A.; Timmermans, K.R. Morphological and physiological effects in Proboscia alata (Bacillariophyceae) grown under different light and CO2 conditions of the modern Southern Ocean. J. Phycol. 2012, 48, 559–568. [Google Scholar] [CrossRef]
  20. Rossoll, D.; Bermudez, R.; Hauss, H.; Schulz, K.G.; Riebesell, U.; Sommer, U.; Winder, M. Ocean acidification-induced food quality deterioration constrains trophic transfer. PLoS One 2012, 7, e34737. [Google Scholar]
  21. Hinga, K.R. Effects of pH on coastal marine phytoplankton. Mar. Ecol. Prog. Ser. 2002, 238, 281–300. [Google Scholar] [CrossRef]
  22. Tortell, P.D.; DiTullio, G.R.; Sigman, D.M.; Morel, F.M.M. CO2 effects on taxonomic compositionand nutrient utilization in an Equatorial Pacific phytoplankton assemblage. Mar. Ecol. Prog. Ser. 2002, 236, 37–43. [Google Scholar] [CrossRef]
  23. Kim, J.-M.; Lee, K.; Shin, K.; Kang, J.-H.; Lee, H.-W.; Kim, M.; Jang, P.-G.; Jang, M.-C. The effect of seawater CO2 concentration on growth of a natural phytoplankton assemblage in a controlled mesocosm experiment. Limnol. Oceanogr. 2006, 51, 1629–1636. [Google Scholar] [CrossRef]
  24. Gregg, W.W.; Conkright, M.E.; Ginoux, P.; O’Reilly, J.E.; Casey, N.W. Ocean primary production and climate: Global decadal changes. Geophys. Res. Lett. 2003, 30, 1809–18012. [Google Scholar] [CrossRef]
  25. Boyce, D.G.; Lewis, M.R.; Worm, B. Global phytoplankton decline over the past century. Nature 2010, 466, 591–596. [Google Scholar] [CrossRef]
  26. Hauri, C.; Gruber, N.; Plattner, G.-K.; Alin, S.; Feely, R.A.; Hales, B.; Wheeler, P.A. Ocean acidification in the California Current System. Oceanography 2009, 22, 60–71. [Google Scholar] [CrossRef]
  27. Urabe, J.; Togari, J.; Elser, J.J. Stoichiometric impacts of increased carbon dioxide on a planktonic herbivore. Glob. Chang. Biol. 2003, 9, 818–825. [Google Scholar] [CrossRef]
  28. Carotenuto, Y.; Putzeys, S.; Simonelli, P.; Paulino, A.; Meyerhoefer, M.; Suffrian, K.; Antia, A.; Nejstgaards, J.C. Copepod feeding and reproduction in relation to phytoplankton development during the PeECE III mesocosm experiment. Biogeosci. Discuss. 2007, 4, 3913–3936. [Google Scholar] [CrossRef]
  29. Urabe, J.; Waki, N. Mitigation of adverse effects of rising CO2 on a planktonic herbivore by mixed algal diets. Glob. Chang. Biol. 2009, 15, 523–531. [Google Scholar] [CrossRef]
  30. Yoshida, T.; Virtue, P.; Kawaguchi, S.; Nichols, P.D. Factors determining the hatching success of Antarctic krill Euphausia superba embryo: Lipid and fatty acid composition. Mar. Biol. 2011, 158, 2313–2325. [Google Scholar] [CrossRef]
  31. Chen, M.; Liu, H.; Chen, B. Effects of dietary essential fatty acids on reproduction rates of a subtropical calanoid copepod, Acartia erythraea. Mar. Ecol. Prog. Ser. 2012, 455, 95–110. [Google Scholar] [CrossRef]
  32. Harrison, P.J.; Thompson, P.A.; Calderwood, G.S. Effects of nutrient and light limitation on the biochemical composition of phytoplankton. J. Appl. Phycol. 1990, 2, 45–56. [Google Scholar] [CrossRef]
  33. Bell, M.V.; Dick, J.R.; Anderson, T.R.; Pond, D. Application of liposome and stable isotope tracer techniques to study polyunsaturated fatty acid biosynthesis in marine zooplankton. J. Plankton Res. 2007, 29, 417–422. [Google Scholar] [CrossRef]
  34. Carvalho, A.; Malcata, F. Optimization of W-3 fatty acid production by microalgae: Crossover effects of CO2 and light intensity under batch and continuous cultivation modes. J. Mar. Biotechnol. 2005, 7, 381–388. [Google Scholar] [CrossRef]
  35. Koven, W.M.; Kissil, G.W.; Tandler, A. Lipid and n-3 requirement of Sparus aurata larvae during starvation and feeding. Aquaculture 1989, 79, 185–191. [Google Scholar] [CrossRef]
  36. Thornton, D.C.O. Effect of low pH on carbohydrate production by a marine planktonic diatom (Chaetoceros muelleri). Res. Lett. Ecol. 2009, 2009. [Google Scholar] [CrossRef]
  37. Barry, J.P.; Tyrrell, T.; Hansson, L.; Plattner, G.; Gattuso, J.P. Atmospheric CO2 targets for ocean acidification perturbation experiments. In Guide to Best Practices in Ocean Acidification Research and Data Reporting; Riebesell, U., Fabry, V.J., Hansson, L., Gattuso, J., Eds.; Publications Office of the European Union: Luxembourg, 2010; pp. 53–64. [Google Scholar]
  38. Riebesell, U.; Fabry, V.J.; Hansson, L.; Gattuso, J.-P. (Eds.) Guide to Best Practices for Ocean Acidification Research and Data Reporting; Publications Office of the European Union: Luxembourg, 2010; p. 260.
  39. Chen, S.; Gao, K. Solar ultraviolet radiation and CO2-induced ocean acidification interacts to influence the photosynthetic performance of the red tide alga Phaeocystis globosa (Prymnesiophycea). Hydrobiologia 2011, 675, 105–117. [Google Scholar] [CrossRef]
  40. Gao, K.; Xu, J.; Gao, G.; Li, Y.; Hutchins, D.A.; Huang, B.; Wang, L.; Zheng, Y.; Jin, P.; Cai, X.; et al. Rising CO2 and increased light exposure synergistically reduce marine primary production. Nat. Clim. Chang. 2012, 2, 519–523. [Google Scholar]
  41. Li, G.; Campbell, D.A. Rising CO2 interacts with growth light and growth rate to alter photosystem II photoinactivation of the coastal diatom Thalassiosira pseudonana. PLoS One 2013, 8, e55562. [Google Scholar]
  42. Burkhardt, S.; Zondervan, I.; Riebesell, U. Effect of CO2 concentration on C:N:P ratio in marine phytoplankton: A species comparison. Limnol. Oceanogr. 1999, 44, 683–690. [Google Scholar] [CrossRef]
  43. Guillard, R.R.L.; Ryther, J.H. Studies of marine planktonic diatoms. I. Cyclotella nana Hustedt and Detonula confervacae Cleve. Can. J. Microbiol. 1962, 8, 229–239. [Google Scholar] [CrossRef]
  44. Guillard, R.R.L. Culture of phyoplankton for feeding marine invertebrates. In Culture of Marine Invertebrate Animals; Smith, W.L., Chanley, M.H., Eds.; Plenum Press: New York, NY, USA, 1975; pp. 26–60. [Google Scholar]
  45. Shi, D.; Xu, Y.; Morel, F.M.M. Effects of the pH/pCO2 control method on medium chemistry and phytoplankton growth. Biogeosciences 2009, 6, 1199–1207. [Google Scholar] [CrossRef]
  46. Sugie, K.; Yoshimura, T. Effects of pCO2 and iron on the elemental composition and cell geometry of the marine diatom Pseudo-nitzschia pseudodelicatissima (Bacillariophyceae). J. Phycol. 2013, 49, 475–488. [Google Scholar] [CrossRef]
  47. Gibson, J.A. Carbon Flow through Marine Environments of the Vestfold Hills, East Antarctica; ANARE Reports 139; Australian Antarctic Division, Hobart: Kingston, Australia, 1998; pp. 174–178. [Google Scholar]
  48. Roden, N.P.; Shadwick, E.H.; Tilbrook, B.; Trull, T.W. Annual cycle of carbonate chemistry and decadal change in coastal Prydz Bay, East Antarctica. Mar. Chem. 2013, 155, 135–147. [Google Scholar] [CrossRef]
  49. Egge, J.K.; Aksnes, D.L. Silicate as regulating nutrient in phytoplankton competition. Mar. Ecol. Prog. Ser. 1992, 83, 281–289. [Google Scholar] [CrossRef]
  50. Harrison, P.J.; Conway, H.L.; Holmes, R.W.; Davis, C.O. Marine diatoms grown in chemostats under silicate or ammonium limitation. III. Cellular composition and morphology of Chaetoceros debilis, Skeletonema costatum, and Thalassiosira gravida. Mar. Biol. 1977, 43, 19–31. [Google Scholar] [CrossRef]
  51. Gattuso, J.-P.; Lavigne, H. Technical Note: Approaches and software tools to investigate the impact of ocean acidification. Biogeosciences 2009, 6, 2121–2133. [Google Scholar] [CrossRef]
  52. Wynn-Edwards, C.; King, R.; Kawaguchi, S.; Davidson, A.T.; Wright, S.W.; Virtue, P. Development of a continuous phytoplankton culture system for ocean acidification experiments. Water 2014, 6. in press. [Google Scholar]
  53. Feng, Y.; Hare, C.E.; Leblanc, K.; Rose, J.M.; Zhang, Y.; DiTullio, G.R.; Lee, P.A.; Wilhelm, S.W.; Rowe, J.M.; Sun, J.; et al. Effects of increased pCO2 and temperature on the North Atlantic spring bloom. I. The phytoplankton community and biogeochemical response. Mar. Ecol. Prog. Ser. 2009, 388, 13–25. [Google Scholar] [CrossRef]
  54. Lomas, M.W.; Gilbert, P.M. Comparisons of nitrate uptake, storage, and reduction in marine diatoms and flagellates. J. Phycol. 2000, 36, 903–913. [Google Scholar] [CrossRef]
  55. Thomson, P.G.; Davidson, A.T.; Cadman, N. Seasonal changes in effects of ambient UVR on natural communities of Antarctic marine protists. Aquat. Microb. Ecol. 2008, 52, 131–147. [Google Scholar] [CrossRef]
  56. Dickson, A.G.; Sabine, C.L.; Christian, J.R. (Eds.) Guide to Best Practices for Ocean CO2 Measurements. PICES Special Publication 3. Available online: http://cdiac.ornl.gov/oceans/Handbook_2007.html (acessed on 12 June 2014).
  57. Lewis, E.; Wallace, D.W.R. Program Developed for CO2 System Calculations; Oak Ridge National Laboratory, U.S. Department of Energy: Oak Ridge, TN, USA, 1998. [Google Scholar]
  58. Mehrbach, C.; Culberson, C.; Hawley, J.; Pytkowicz, R. Measurement of the apparent dissociation constants of carbonic acid in seawater at atmospheric pressure. Limnol. Oceanogr. 1973, 18, 897–907. [Google Scholar] [CrossRef]
  59. Dickson, A.G.; Millero, F.J. A comparison of the equilibrium constants for the dissociation of carbonic acid in seawater media. Deep Sea Res. A 1987, 34, 1733–1743. [Google Scholar] [CrossRef]
  60. Mock, T.; Hoch, N. Long-term temperature acclimation of photosynthesis in steady-state cultures of the polar dioatm Fragilariopsis cylindrus. Photosynth. Res. 2005, 85, 307–317. [Google Scholar] [CrossRef]
  61. Zapata, M.; Rodriguez, F.; Garrido, J.L. Separation of chlorophylls and carotenoids from marine phytoplankton: A new HPLC method using a reversed phase C8 column and pyridine-containing mobile phases. Mar. Ecol. Prog. Ser. 2000, 195, 29–45. [Google Scholar]
  62. Wright, S.W.; Jeffrey, S.W. High resolution system for chlorophylls and carotenoids of marine phytoplankton. In Phytoplankton Pigments in Oceanography: Guidelines to Modern Methods; Jeffrey, S.W., Mantoura, R.F.C., Wright, S.W., Eds.; UNESCO: Paris, France, 1997; pp. 327–341. [Google Scholar]
  63. Mantoura, R.F.C.; Repeta, D.J. Calibration methods for HPLC. In Phytoplankton Pigments in Oceanography: Guidelines to Modern Methods; Jeffrey, S.W., Mantoura, R.F.C., Wright, S.W., Eds.; UNESCO: Paris, France, 1997; pp. 407–428. [Google Scholar]
  64. Wright, S.W.; van den Enden, R.L.; Pearce, I.; Davidson, A.T.; Scott, F.J.; Westwood, K.J. Phytoplankton community structure and stocks in the Southern Ocean (30–80° E) determined by CHEMTAX analysis of HPLC pigment signatures. Deep Sea Res. II 2010, 57, 758–778. [Google Scholar] [CrossRef]
  65. Brown, M.R.; McClausland, M.A.; Kowalski, K. The nutritional valule of four Australian microalgal strains fed to Pacific oyster Crassostrea gigas spat. Aquaculture 1998, 165, 281–293. [Google Scholar] [CrossRef]
  66. Dubois, M.; Gilles, K.A.; Hamilton, J.K.; Rebers, P.A.; Smith, F. Colometric method for determination of sugars and related substances. Anal. Chem. 1956, 28, 350–356. [Google Scholar] [CrossRef]
  67. Christie, W.W. A simple procedure for rapid transmethylation of glycerolipids and cholesteryl esters. J. Lipid Res. 1982, 23, 1072–1075. [Google Scholar]
  68. R Project for Statistical Computing, 2012. Available online: http://www.r-project.org/index.html (accessed on 6 February 2014).
  69. Fiorini, S.; Gattuso, J.-P.; van Rijswijk, P.; Middelburg, J. Coccolithophores lipid and carbon isotope composition and their variability related to changes in seawater carbonate chemistry. J. Exp. Mar. Biol. Ecol. 2010, 394, 74–85. [Google Scholar] [CrossRef]
  70. Engel, A. Direct relationship between CO2 uptake and transparent exopolymer particles production in natural phtyoplankton. J. Plankton Res. 2002, 24, 49–53. [Google Scholar] [CrossRef]
  71. Taraldsvik, M.; Myklestad, S.M. The effect of pH on growth rate, biochemical composition and extracellular carbohydrate production of the marine diatom Skeletonema costatum. Eur. J. Phycol. 2000, 35, 189–194. [Google Scholar] [CrossRef]
  72. Leu, E.; Daase, M.; Schulz, K.G.; Stuhr, A.; Riebesell, U. Effect of ocean acidification on the fatty acid composition of a natural plankton community. Biogeosciences 2013, 10, 1143–1153. [Google Scholar] [CrossRef] [Green Version]
  73. Wynn-Edwards, C.; Kawaguchi, S.; King, R.; Davidson, A.T.; Wright, S.W.; Nichols, D.P.; Candy, S.; Wotherspoon, S.; Virtue, P. Can increased pCO2 alter the biochemistry of Antarctic phytoplankton and thus affect the survival of Antarctic krill larvae? Polar Biol. 2014. submitted. [Google Scholar]
  74. Lane, A.E.; Burris, J.E. Effects of environmental pH on the internal pH of Chlorella pyrenoidosa, Scenedesmus quadricauda, and Euglena mutabilis. Plant Physiol. 1981, 68, 439–442. [Google Scholar] [CrossRef]
  75. Young, B.P.; Shin, J.J.H.; Orij, R.; Chao, J.T.; Li, S.C.; Guan, X.L.; Khong, A.; Jan, E.; Wenk, M.R.; Prinz, W.A.; et al. Phosphatidic acid is a pH biosensor that links membrane biogenesis to metabolism. Science 2010, 329, 1085–1088. [Google Scholar] [CrossRef]
  76. Sato, N.; Tsuzuki, M.; Kawaguchi, A. Glycerolipid synthesis in Chlorellakessleri 11 h: Effect of CO2 concentration during growth. Biochim. Biophys. Acta Mol. Cell Biol. Lipids 2003, 1633, 35–42. [Google Scholar] [CrossRef]
  77. Torstensson, A.; Hedblom, M.; Andersson, J.; Andersson, M.X.; Wulff, A. Synergism between elevated pCO2 and temperature on the Antarctic sea ice diatom Nitzschia lecointei. Biogeosciences 2013, 10, 6391–6401. [Google Scholar] [CrossRef]
  78. Arnold, H.E.; Kerrison, P.; Steinke, M. Interacting effects of ocean acidification and warming on growth and DMS-production in the haptophyte coccolithophore Emiliania huxleyi. Glob. Chang. Biol. 2013, 19, 1007–1016. [Google Scholar] [CrossRef]
  79. Sobrino, C.; Ward, M.L.; Neale, P.J. Acclimation to elevated CO2 and ultraviolet radiation in the diatom Thalassiosira pseudonana: Effects on growth, photosynthesis and spectral sensitivity of photoinhibition. Limnol. Oceanogr. 2008, 53, 494–505. [Google Scholar] [CrossRef]
  80. Gervais, F.; Riebesell, U. Effect of phosphorus limitation on elemental composition and stable carbon isotope fractionation in a marine diatom growing under different CO2 concentrations. Limnol. Oceanogr. 2001, 46, 497–504. [Google Scholar] [CrossRef]

