Article

SPE-LC-MS/MS Analysis of Chiral and Achiral Fungicides in Drinking Water

by
Beatriz Suordem
1,2,3,
Joaquín A. Marrero
1,
Marta O. Barbosa
1,
Ana M. Gorito
1,
Maria Elizabeth Tiritan
3,4,5,
Cláudia Ribeiro
3,6,* and
Ana Rita L. Ribeiro
1,*
1
LSRE-LCM, ALiCE, Faculty of Engineering, University of Porto, Rua Dr. Roberto Frias, 4200-465 Porto, Portugal
2
Department of Public Health and Forensic Sciences, and Medical Education, Faculty of Medicine, University of Porto, 4200-319 Porto, Portugal
3
Associate Laboratory i4HB—Institute for Health and Bioeconomy, University Institute of Health Sciences—CESPU, 4585-116 Gandra, Portugal
4
Laboratory of Organic and Pharmaceutical Chemistry, Department of Chemical Sciences, Faculty of Pharmacy, University of Porto, Rua de Jorge Viterbo Ferreira, 4050-313 Porto, Portugal
5
CIIMAR/CIMAR LA, Interdisciplinary Centre of Marine and Environmental Research, University of Porto, 4450-208 Matosinhos, Portugal
6
UCIBIO—Applied Molecular Biosciences Unit, Translational Toxicology Research Laboratory, University Institute of Health Sciences (1H-TOXRUN, IUCS-CESPU), 4585-116 Gandra, Portugal
*
Authors to whom correspondence should be addressed.
Water 2026, 18(6), 680; https://doi.org/10.3390/w18060680
Submission received: 22 January 2026 / Revised: 28 February 2026 / Accepted: 10 March 2026 / Published: 14 March 2026
(This article belongs to the Section Water Quality and Contamination)

Abstract

Fungicide contamination is an increasing global environmental concern, due to the harm they may pose to non-target organisms, their contribution to antimicrobial resistance, and the potential risks to human health when drinking water (DW) sources are impacted. Many fungicides used in agriculture are chiral and may exist as racemates, or a combination of diastereoisomers and/or enantiomers. Since enantiomers can differ in environmental fate, distribution, and toxicity, enantioselective analysis of chiral fungicides is crucial. The aim of this study was to develop and validate an analytical method for the determination of azole chiral and achiral fungicides in DW using solid-phase extraction followed by liquid chromatography-tandem mass spectrometry (SPE-LC-MS/MS). Chromatographic separation of one achiral fungicide and five chiral fungicides was achieved using a polysaccharide chromatographic column under reverse elution mode. The validated method demonstrated high sensitivity with method detection limits (MDL) below 0.86 ng L−1 and was successfully applied to 13 DW samples collected from various supply networks across Portugal. Seven out of the 15 targeted analytes were found at trace concentrations (>MDL). Fluconazole was the most frequently detected (~87% of the samples). The hazard quotients (HQs) for individual compounds for each individual fungicide (sum of the enantiomers for those chiral) and the hazard index (HI, sum of the individual HQ values) were calculated in each DW sample, indicating no significant health risks to consumers, since it is well below 0.1 for all compounds.

1. Introduction

In recent years, growing attention has been given to contaminants of emerging concern (CECs) in aquatic environments (e.g., pesticides, pharmaceuticals and personal care products, steroid hormones, and industrial compounds), typically detected at ng L−1 to μg L−1 [1,2,3,4]. Conventional wastewater treatment plants (WWTPs) are generally ineffective in completely removing most of these substances. As a result, their effluents are one of the main sources of CECs in surface waters, groundwaters, and consequently soils, ultimately affecting ecosystems and human health [1,3,4,5]. Freshwater bodies, such as rivers and lakes, often serve as sources for drinking water treatment plants (DWTPs). These facilities also lack the capacity to eliminate trace levels of most CECs, thereby increasing the likelihood of their presence in drinking water (DW) and representing a relevant public health concern [2,5,6]. The application of pesticides in agriculture further contributes to this contamination, mainly through runoff, which disseminates CECs across various environmental compartments [7].
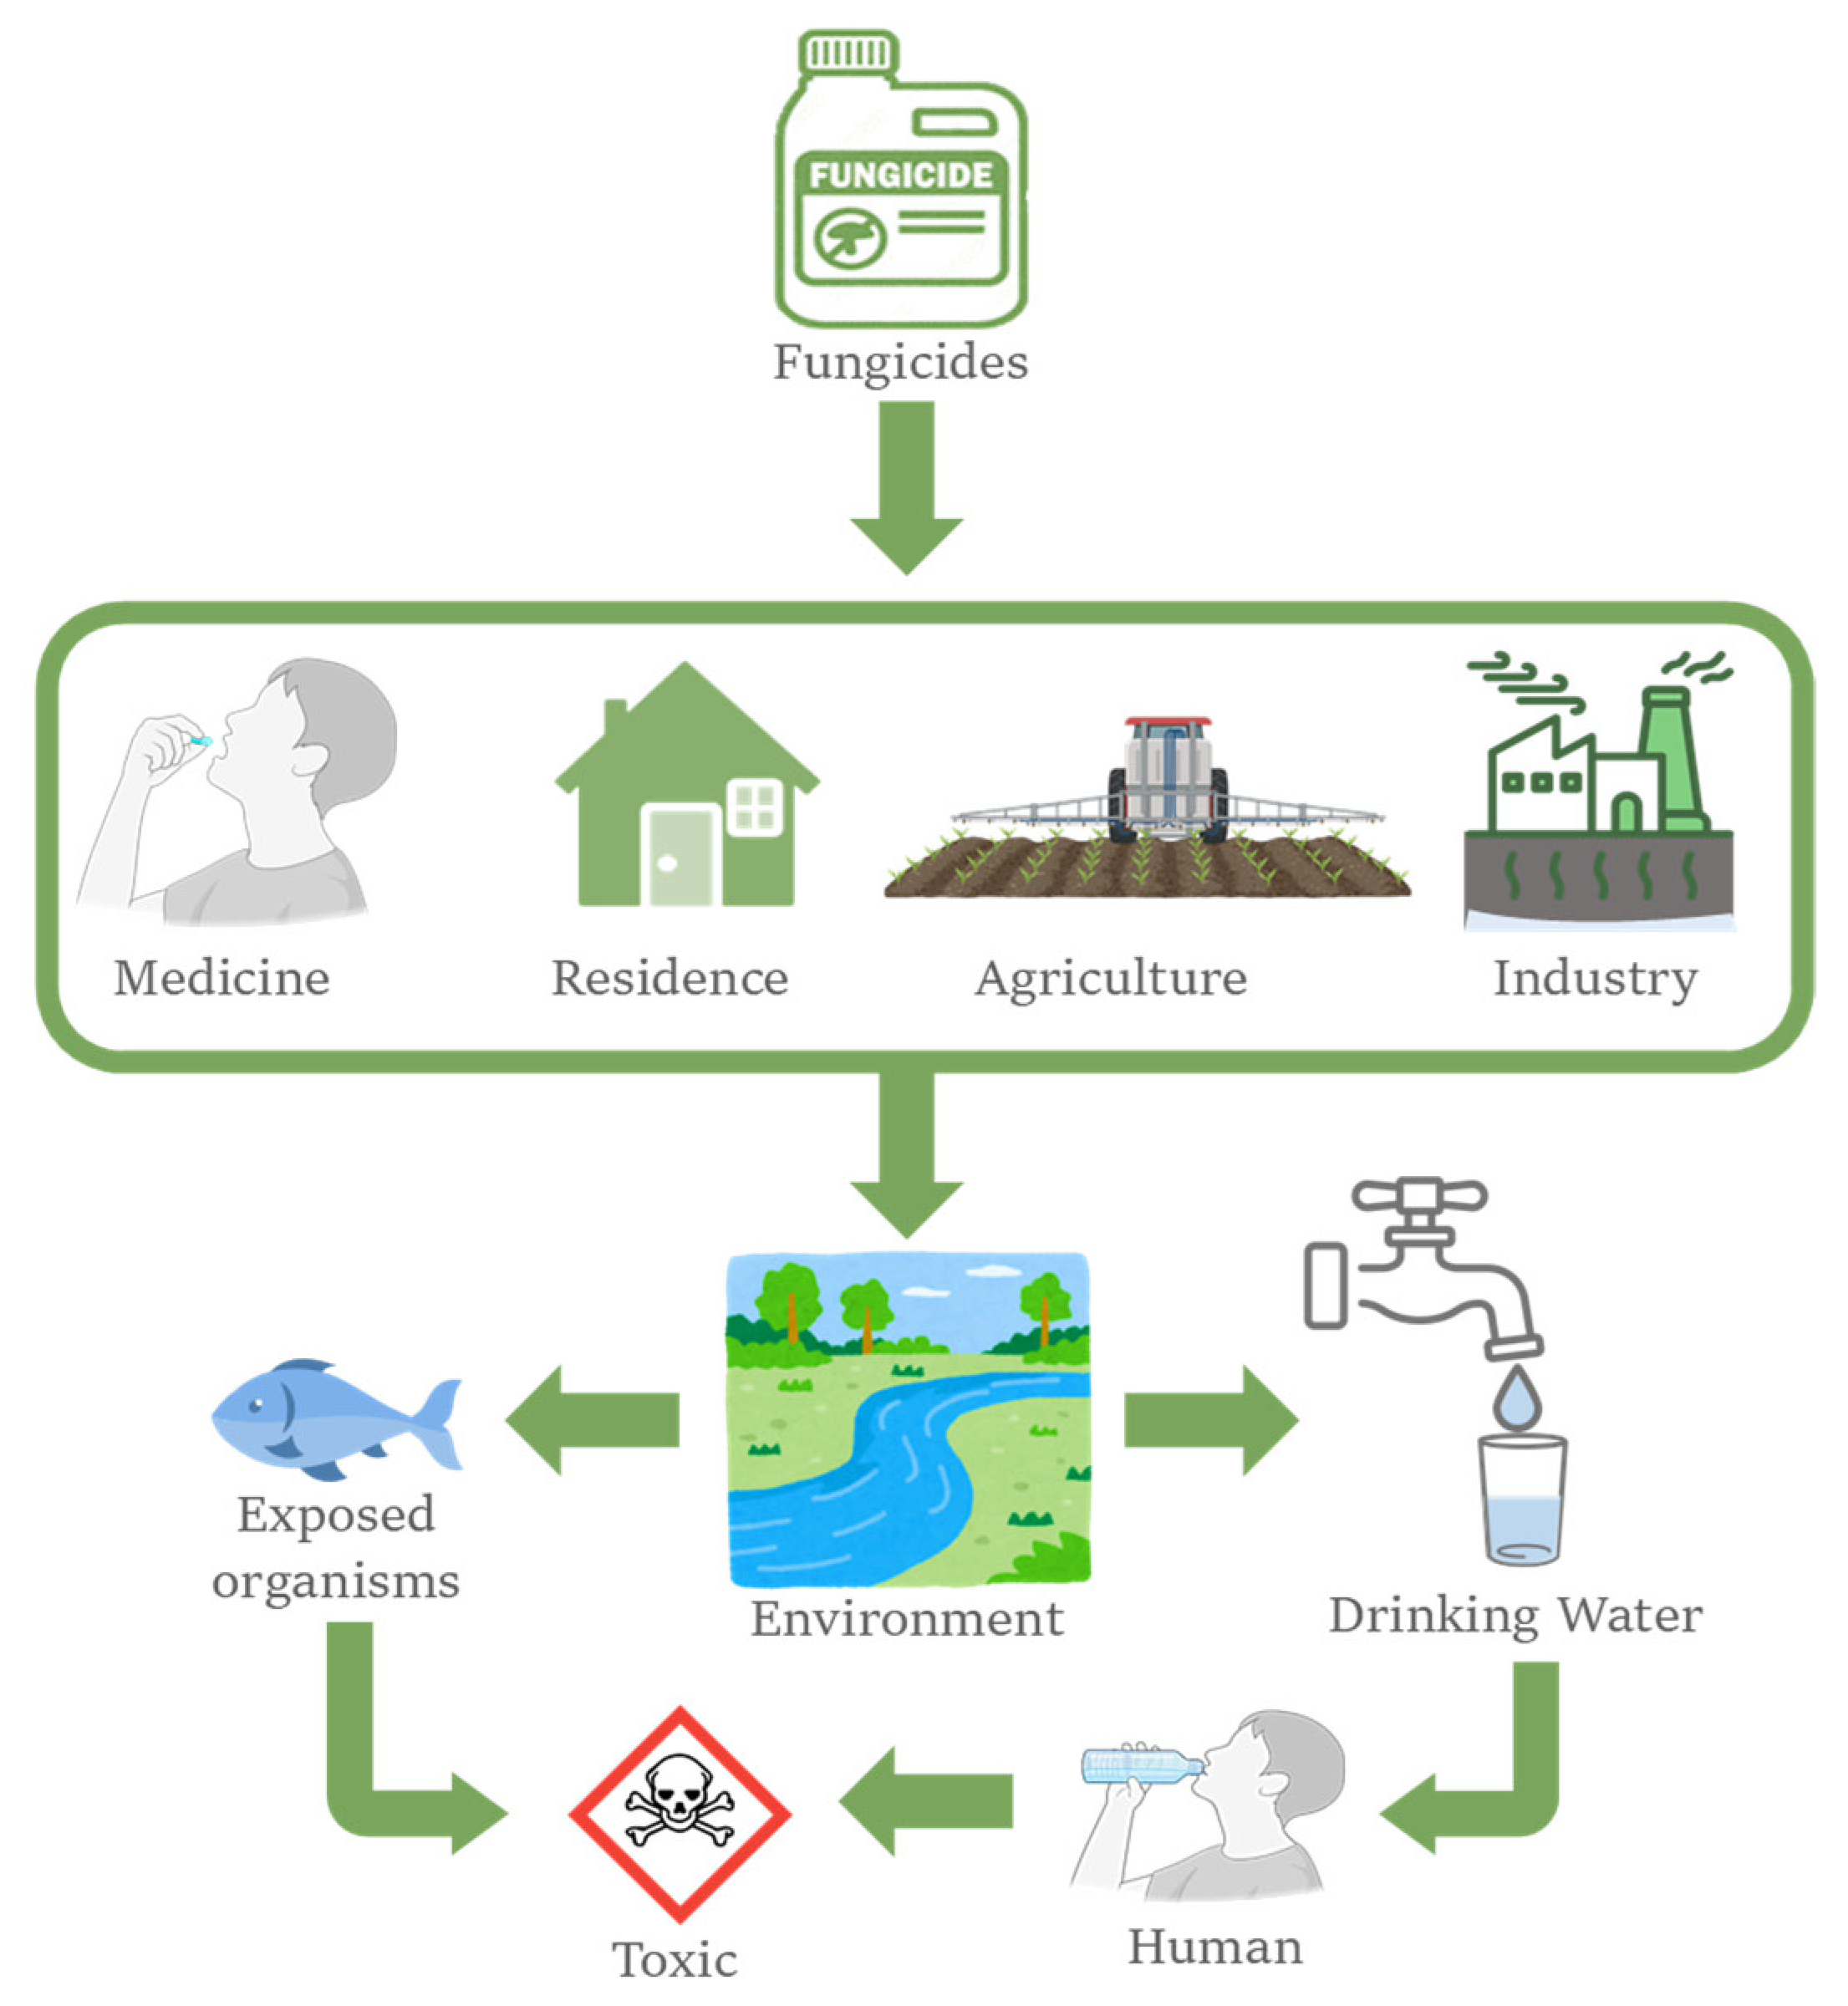
Among CECs, fungicides are of particular concern. Due to their biological properties, fungicides are applied in multiple contexts: (i) pharmaceuticals in medicine either human or veterinary; (ii) plant protection products; (iii) biocides for preserving fruits and vegetables; (iv) anti-icing agents; (v) corrosion inhibitors [8]; (vi) ingredients in laundry detergents [9]; and (vii) personal care products (e.g., shampoos, creams, foams, toothpastes) [10]. Therefore, their increasing application has resulted in continuous environmental release [3,11,12]. In agriculture, the main classes are strobilurins and triazoles, while azoles are more prevalent in medicines for treating and preventing mycoses. Fungicides entering the aquatic environment are subjected to transformation and transport processes that are impacted by many environmental factors (e.g., wind, precipitation, temperature, evapotranspiration) [12]. These factors can either accelerate their dissipation or enhance their persistence, influencing their distribution, accumulation, and overall risk to both aquatic and terrestrial ecosystems [12] (Figure 1).
Consequently, fungicides are classified as CECs, and several azole fungicides are listed in the European Commission’s fourth and fifth Watch Lists aiming surface water monitoring (Decisions 2022/1307 and 2025/439), highlighting regulatory concerns about their ecological and health impacts [13,14]. Reported effects include endocrine disruption in non-target organisms [15] and the development of fungal resistance [16], with implications for human health, including potential infections linked to Candida auris and Aspergillus fumigatus. In this context, evidence on the potential of azole fungicides to interfere with endocrine function, as well as an understanding of their structure–activity relationship and inhibition mechanisms, is fundamental to support risk assessment and regulatory decision-making [17]. Although the contribution of fungicides to antimicrobial resistance is not fully understood, their intensive agricultural use and the over-the-counter availability of azoles for minor infections raise concerns about cross-resistance [18]. Therefore, the understanding of the global evolution and spread of resistance, as well as the resistance mechanisms due to the presence of fungicides in the environment are of utmost relevance [19].
Many fungicides are chiral, containing one or more stereogenic centers and thus, enantiomers (mirror images) or diastereomers (non-mirror images) may occur [20,21,22,23]. Although enantiomers share similar chemical and physical properties in achiral environments, they may exhibit different behaviors in chiral environments as biological systems [20,22,23]. Like many other chiral compounds, these substances are generally applied or administered as racemates instead of enantiomerically pure compounds, although the biological activity is often associated with only one enantiomer [24,25], the other being less active or inactive, having a different activity, or causing adverse effects [24,25,26]. In the environment, chiral pharmaceuticals and agrochemicals can occur as racemates, or in mixtures of diastereoisomers and/or enantiomers [21]. For an accurate assessment of environmental impact and ecological risk, understanding the environmental behavior of each individual enantiomer is essential [26]. Indeed, enantioselective monitoring provides essential information on environmental distribution, persistence, and legacy effects, supporting mitigation and preventive strategies [26]. Thus, chiral separation techniques are fundamental for the discrimination of fungicide stereoisomers in complex matrices.
Despite their widespread detection in multiple environmental compartments, studies on fungicide occurrence in DW are still limited, and even scarcer for enantioselective analyses. Given their extensive use and recognized relevance for antimicrobial resistance, assessing their presence and frequency in DW is essential, as humans may be subject to chronic exposure through consumption. For chiral fungicides, such studies should also include the determination of enantiomeric fractions (EF), as enantiomers may differ in toxicity. However, there are currently no reports of enantioselective monitoring of these compounds in DW. A recent comprehensive review of chiral chromatographic approaches for azole fungicides further shows that enantiomeric investigations have focused exclusively on surface water, wastewater, soil, and biota matrices [27]. Against this background, this study aimed to investigate, for the first time, the occurrence of five chiral azole fungicides (tebuconazole, tetraconazole, metconazole, penconazole, ipconazole) and one achiral azole fungicide (fluconazole), all included in the Watch List Decision 2022/1307 [14] in DW. For this purpose, (i) an enantioselective method using solid-phase extraction (SPE) followed by liquid chromatography-tandem mass spectrometry (LC-MS/MS) was developed and validated, (ii) which was applied to monitor Portuguese DW samples; and (iii) a preliminary risk assessment was performed for human health.

2. Materials and Methods

2.1. Chemicals and Materials

Tetraconazole, penconazole and metconazole were acquired from Sigma-Aldrich (Steinhein, Germany), fluconazole was acquired from Acros Organics (Geel, Belgium), tebuconazole was acquired from TCI Europe N.V. (Zwijndrecht, Belgium), whereas ipconazole, fluconazole-d4 (FLZ-d4) and penconazole-d7 (PEN-d7) were acquired from LGC Standards (Teddington, Middlesex, UK). All standards were of over 98% purity. Stock solutions of individual standards were prepared by dissolving accurately weighed amounts of each in acetonitrile (ACN) at concentrations between 240 and 1000 mg L−1. A mixture of the target six fungicides was prepared at a concentration of 10 mg L−1 (as racemate in the case of chiral compounds) in ultrapure water (UPW)/ACN, in different proportions according to the composition of the mobile phase tested, this proportion being set at 65/35 (v/v) after method optimization. MS grade methanol (MeOH) and ACN, HPLC grade ethanol (EtOH) and acetic acid (glacial 99.8% purity) were acquired from VWR International (Fontenay-sous-Bois, France). Ammonia solution 25%, ammonium hydrogen carbonate and formic acid (99% purity) were supplied by Merck (Darmstadt, Germany). UPW was supplied by a Milli-Q® SQ 2Series apparatus from Millipore (Burlington, MA, USA).
Oasis ® HLB cartridges (150 mg, 6 cc) acquired from Waters (Milford, MA, USA) were used as SPE cartridges. Hydrophilic polytetrafluoroethylene (PTFE) 0.22 µm syringe filters, both with a diameter of 13 mm, acquired respectively from VWR and from Labfil, ALWSCI Corporation (Hangzhou, China), were used.

2.2. LC-MS/MS

For LC-MS/MS analyses, an integrated Shimadzu Corporation apparatus that combines LC and tandem MS detection was used, comprising a Nexera LC system and two LC-30AD pumps, a DGU-20A 5R degasser, a SIL-30AC autosampler, a CTO-20AC oven, and a CBM-20A system controller. The LC Solution Version 5.41SP1 software was used for data processing. A triple quadrupole mass spectrometer, LCMS-8040, was coupled to the LC system. A total of 6 fungicides were investigated: fluconazole, ipconazole, metconazole, penconazole, tebuconazole, and tetraconazole. For ipconazole and metconazole, 4 stereoisomers were determined, whereas for penconazole, tebuconazole, and tetraconazole, two enantiomers were determined, resulting in a total of 14 stereoisomers. Including fluconazole, a total of 15 analytes were monitored. The initial method comprises a Lux® 3 μm i-Cellulose 5 chromatographic column [cellulose tris(3,5-dichlorophenylcarbamate 150 × 2.0 mm, i.d.)], 25/75 (v/v) of UPW/ACN as the mobile phase, the column oven set at 30 °C, a flow rate of 0.20 mL min−1 and an injection volume of 10 μL. Electrospray ionization in positive ionization (PI) mode was used. The nebulizing and drying gas flows were set at 2.5 and 14 dm3 min−1, respectively. The heat block and desolvation line temperatures were 400 °C and 250 °C. Argon gas at 230 kPa was employed as the collision-induced dissociation gas. For quantification, the most abundant fragment (selected reaction monitoring, SRM1) was used, whereas the identity confirmation was performed by including also the analysis of the second most abundant fragment (SRM2). A third fragment was used to confirm the identity of tebuconazole (SRM3). The MS conditions of the 6 standards and the 2 surrogate standards (FLZ-d4 and PEN-d7), were optimized by injecting 0.2 µL of the individual stock solutions (1 mg L−1) into the mobile phase stream with the chromatographic column bypassed (flow injection mode) to choose the precursor ion by full scan mode, to select the most abundant fragments and to optimize the mass spectrometer parameters (Table S1). The ion ratio was calculated for the different analytes (Table S1).

2.3. Solid-Phase Extraction Method

A SPE procedure was optimized based on a methodology published elsewhere [28] for achiral analysis of azole pesticides in wastewater. A manifold supplied by Waters (Milford, MA, USA), coupled to a Vacuubrand (VWR), Oasis ® HLB cartridges (150 mg, 6 cc) and the Centrivap (CentriVap® Concentrator (LABCONCO, Kansas City, MO, USA) were used for sample pretreatment. Sample volume and pH, as well as conditioning, washing, and elution solvents and volumes, were optimized based on previously published SPE procedures [28]. Briefly, tap waters spiked with 250 μL of target compound mixture at 200 ng mL−1 and at different pH levels were evaluated. Acetic acid and ammonia solution were used, respectively, to acidify or to alkalinize. The maximum retention capacity of the cartridges (breakthrough volume) was tested with different volumes of tap water samples. Solvent volumes for conditioning, washing and elution steps were also evaluated. Besides varying the volumes, the following attempts were performed: replacement of MeOH by EtOH in the conditioning step; the elimination of 5% MeOH in UPW in the washing solvent; and the replacement of MeOH by EtOH in the elution step. Reconstitution was always performed with 250 µL of a solution of UPW with ACN (65:35, v/v).

2.4. Method Validation

The SPE-LC-MS/MS method was validated in accordance with internationally recognized guidelines [29] and another study on the subject [30], with respect to the following analytical parameters: selectivity, linearity, range, precision, accuracy, absolute recovery (AR), extraction efficiency (EE), matrix effect (ME), and detection and quantification limits of the method (MDL and MQL).
Selectivity was assessed by comparing a blank tap water sample chromatogram with a spiked sample at the lowest concentration used for quality control (QC). Linearity was assessed through determination of the coefficient of determination (r2) from the calibration curves constructed between 0.20 and 400 µg L−1, depending on the analyte, and using 7 concentration levels and a fixed concentration of 20 µg L−1 of fluconazole-d4 and 10 µg L−1 of each enantiomer of penconazole-d7.
Precision was evaluated as the relative standard deviation (RSD) derived from triplicate determinations of the QCs prepared by spiking blank tap water samples at 3 different levels (lowest, intermediate and highest level (Table 1)), within a single day (intra-day precision) or between 3 separate days (inter-day precision). Accuracy was evaluated as the relative agreement between the concentrations determined in QC extracts and their nominal values.
AR reflects the overall performance of the complete analytical workflow. It evaluated the overall efficiency of the SPE-LC-MS/MS method for each compound by accounting for both the SPE recovery (i.e., EE) and ME. To determine AR, the peak areas of analytes determined in the reconstituted SPE extracts from spiked samples (after subtraction of the corresponding peak areas obtained in blank samples) were compared with those obtained for analytes dissolved in the mobile phase solvent, i.e., a UPW/ACN (65/35, v/v) solution containing the analytes at a concentration theoretically equivalent to those present in the reconstituted SPE extracts (Equation (1)).
A R % = A r e a p r e s p i k e d   D W   e x t r a c t A r e a b l a n k   D W   e x t r a c t A r e a s t a n d a r d   s o l u t i o n × 100
The ME of the analytes was evaluated by comparing the peak areas of the analytes in the reconstituted SPE blank extracts that were spiked after extraction (post-spiked, after subtraction of signals detected in blank samples) with the peak areas obtained from analytes dissolved in a UPW/ACN (65/35, v/v) solution at a concentration theoretically equivalent to that of the reconstituted SPE extracts, to which the value 100 is subtracted (Equation (2)). Thus, ME values equal to zero indicate no matrix effect, while those above or below 0 indicate enhancement or suppression of the signal intensity, respectively. This parameter describes the influence of compounds naturally present in the sample matrix on the ionization process.
M E % = A r e a p o s t s p i k e d   D W   e x t r a c t A r e a b l a n k   D W   e x t r a c t A r e a s t a n d a r d   s o l u t i o n × 100 100
The EE of the analytes through the SPE process was estimated by subtracting the ME from the AR (Equation (3)).
E E % = A R M E
The instrumental detection and quantification limits (IDL and IQL) were obtained directly using LabSolutions™ LCMS software (Version 5.41SP1), considering S/N of 3 and 10, respectively, while the MDL and MQL were calculated by dividing the IDL or IQL by the product of the preconcentration factor (f) and the AR/100 (Equations (4) and (5), respectively).
M D L = I D L f * A R ( % ) 100
M Q L = I Q L f * A R ( % ) 100
A solution in UPW/ACN (65/35, v/v) containing the mixture of fungicides at 200 µg L−1 was regularly analyzed as a control standard during the study to check possible deviations. In addition, injections of solvent (UPW/ACN (65/35, v/v)) were performed between each sample injection to assess possible carryover.

2.5. Tap Water Collection

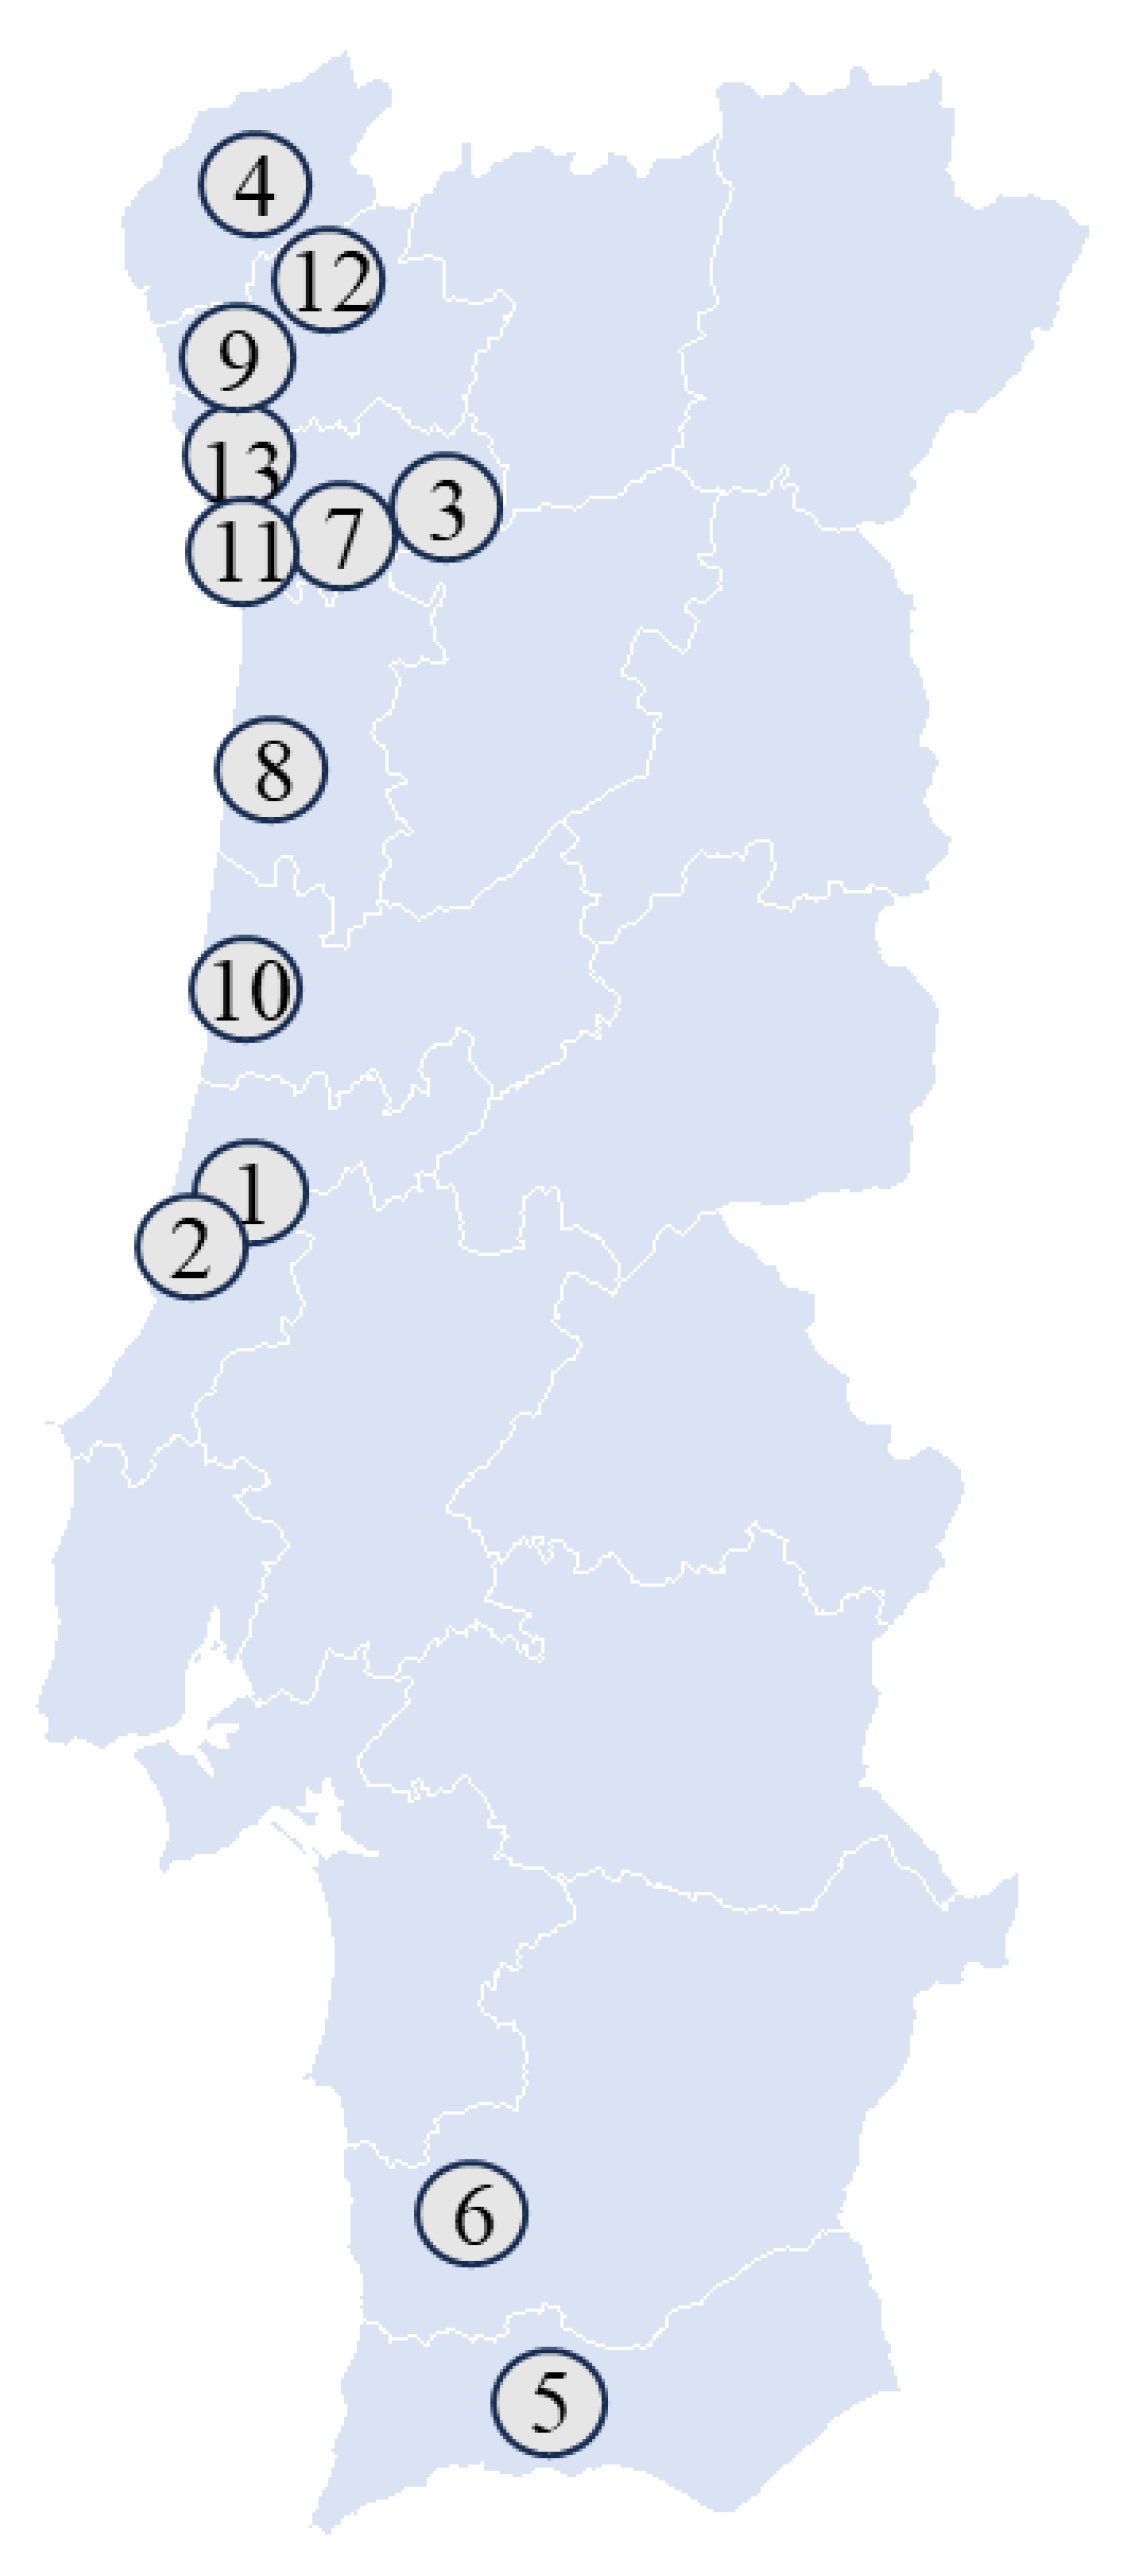
After full validation, the SPE-LC-MS/MS analytical method was applied to monitor tap water samples that were collected at various locations in Portugal during August 2025, to demonstrate the applicability of the method to DW samples. A total of 13 samples, 8 from the northern region and 5 from the central and southern regions of the country, were collected between 11 August and 22 August, directly from the taps into pre-washed glass bottles, stored and refrigerated (4 °C) during transport and in the laboratory before processing. Figure 2 shows the approximate sampling locations numbered from 1 to 13 according to the order of collection.

2.6. Human Health Risk Assessment

A preliminary human health risk assessment was done for the compounds measured in DW, by estimating a hazard quotient (HQ) for each individual substance (concentration considered as the sum of the enantiomers for those chiral) in each DW sample, based on a study published elsewhere [31]. The HQ was calculated by dividing the estimated weekly intake (EWI, mg/kg BW/week) by the reference dose (RfD) expressed on a weekly basis (Table 2) (Equation (6)). This prediction provides information on the assessment of risk to human health by evaluating the probability of adverse effects: HQ values below 0.1 suggest no expected adverse effects; potential for adverse effects should be considered for HQ between 0.1 and 1.0, regardless of the low risk; adverse effects or slight risk are associated with HQ values between 1.0 and 10; only HQ values above 10 are assumed to pose a high risk [31].
H Q = E W I R f D
The EWI was calculated assuming that the concentration of each target analyte present in each of the 13 DW samples remained constant throughout the week. Two exposure groups were considered: adults and children. An average body weight (BW) of 70 kg for adults and 18 kg for children was assumed. A daily water intake (represented by the DW volume, V D W ) of 2 L day−1 for adults and 1.2 L day−1 for children was considered [31]. The EWI was calculated according to Equation (7).
E W I = C L B   o r   U B × V D W × 7   d a y s B W
Additionally, two different scenarios were considered: (i) a lower bound (LB) scenario, in which concentrations of non-detected analytes were assumed to be zero; and (ii) an upper bound (UB) scenario, in which concentrations below the MQL were assumed to be equal to the MQL value. CLB and CUB represent the analyte concentration (mg/L) under the LB or UB scenario.
The potential combined effects of multiple substances were evaluated by calculating the hazard index (HI) as the sum of the individual HQi values for each sample (Equation (8)), assuming dose additivity among compounds sharing similar toxicological endpoints.
H I = H Q i
An HI value < 1 denotes no significant risk of adverse non-carcinogenic effects, whereas HI ≥ 1 suggests a potential health concern due to combined exposure [35].

3. Results and Discussion

3.1. Chiral Separation (LC-MS/MS)

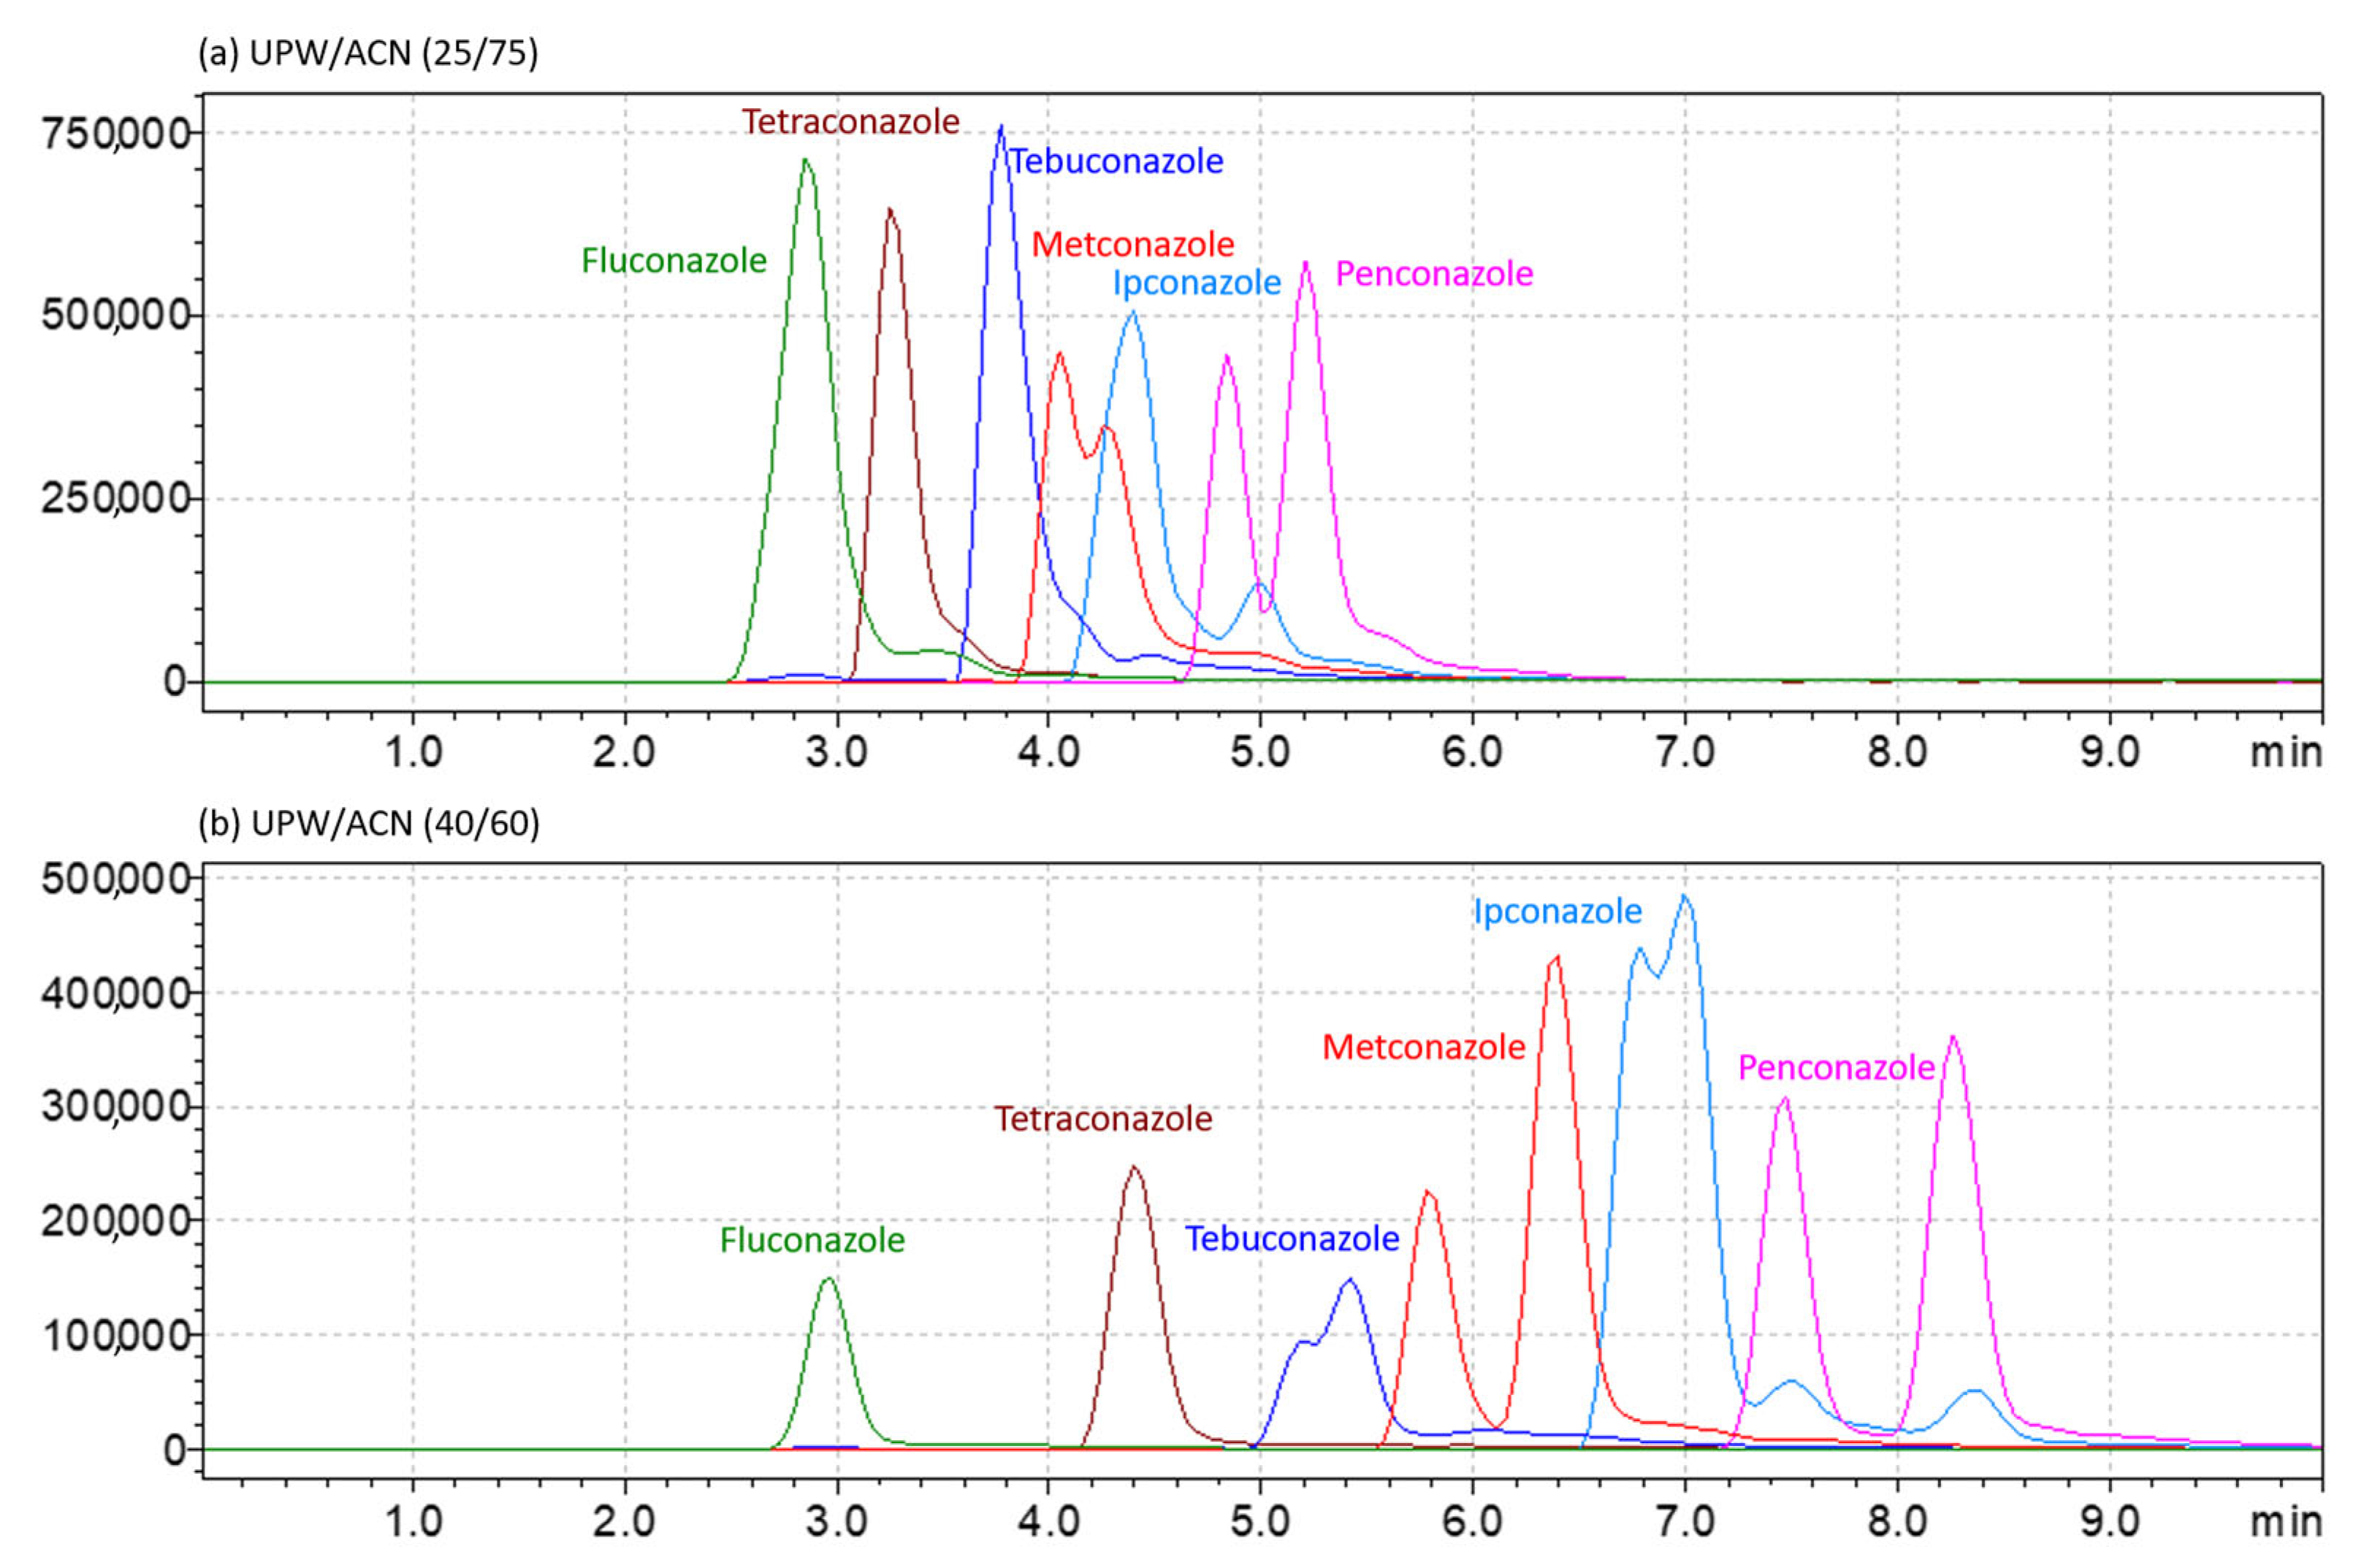
The chromatographic separation of the six fungicides was optimized by LC-MS/MS, using a Lux® 3 µm i-Cellulose 5 chromatographic column (150 × 2.0 mm, i.d.) and UPW and ACN as the mobile phase, a flow rate of 0.2 mL min−1, the column temperature set to 30 °C, and an injection volume of 10 µL. Enantioresolution was not achieved when using either 25/75 or 40/60 (v/v) of UPW/ACN (Figure 3).
Considering that, under the conditions initially tested, the enantiomeric separations were far from ideal, significant changes were made to the chromatographic method: the percentage of the aqueous phase was raised (60/40 (v/v) of UPW/ACN), as were the flow rate (0.25 mL min−1) and temperature (45 °C) (Figure S1a). Since these changes improved the enantiomeric separations of some fungicides but were still far from optimal, tests were performed with two organic modifiers in the aqueous phase: a salt, ammonium bicarbonate, and formic acid, since enantiomeric separations by LC-MS/MS can be impaired by difficult ionization when using the aqueous phase without additives. The same chiral stationary phase was used (Lux® 3 µm i-Cellulose 5, 150 × 2.0 mm, i.d.) with UPW (without and with modifiers) and ACN as the mobile phase, but with a flow rate of 0.25 mL min−1 and the column temperature set to 45 °C. Through the analysis of each chromatogram (Figure S1) and the chromatographic parameters depicted in Table S2, the aqueous phase modified with 5 mM ammonium hydrogen carbonate (Rs 0.72–11.6) was selected due to higher enantioresolutions and sensitivity.
With this mobile phase composed of 60/40 (v/v) of aqueous 5 mM ammonium hydrogen carbonate/ACN, the best resolution values (Table S3) for metconazole (Rs 1.83–10.0) and ipconazole (0.82–2.36), whose enantioseparation was not good before, were obtained. After this initial optimization of the mobile phase composition with the addition of ammonium hydrogen carbonate to the aqueous phase, all other chromatographic conditions of the method were maintained, such as column oven temperature (45 °C), the flow rate (0.25 mL min−1), and the injection volume (10 µL), and different proportions of the aqueous and organic phases were tested. The following were tested: 55/45, 60/40, 65/35, and 70/30 (v/v) of aqueous 5 mM ammonium hydrogen carbonate/ACN (Figure S2).
After analyzing the data presented in Table S3 and the chromatograms in Figure S2, together with the run time, the mobile phase selected consisted of 60/40 (v/v) of aqueous 5 mM ammonium hydrogen carbonate/ACN, when maintaining the other chromatographic conditions.
With the mobile phase conditions optimized, the temperature of the column was further optimized. To evaluate the effects of lower temperatures, three different temperatures were tested in addition to 45 °C: 22 °C, 25 °C, and 35 °C.
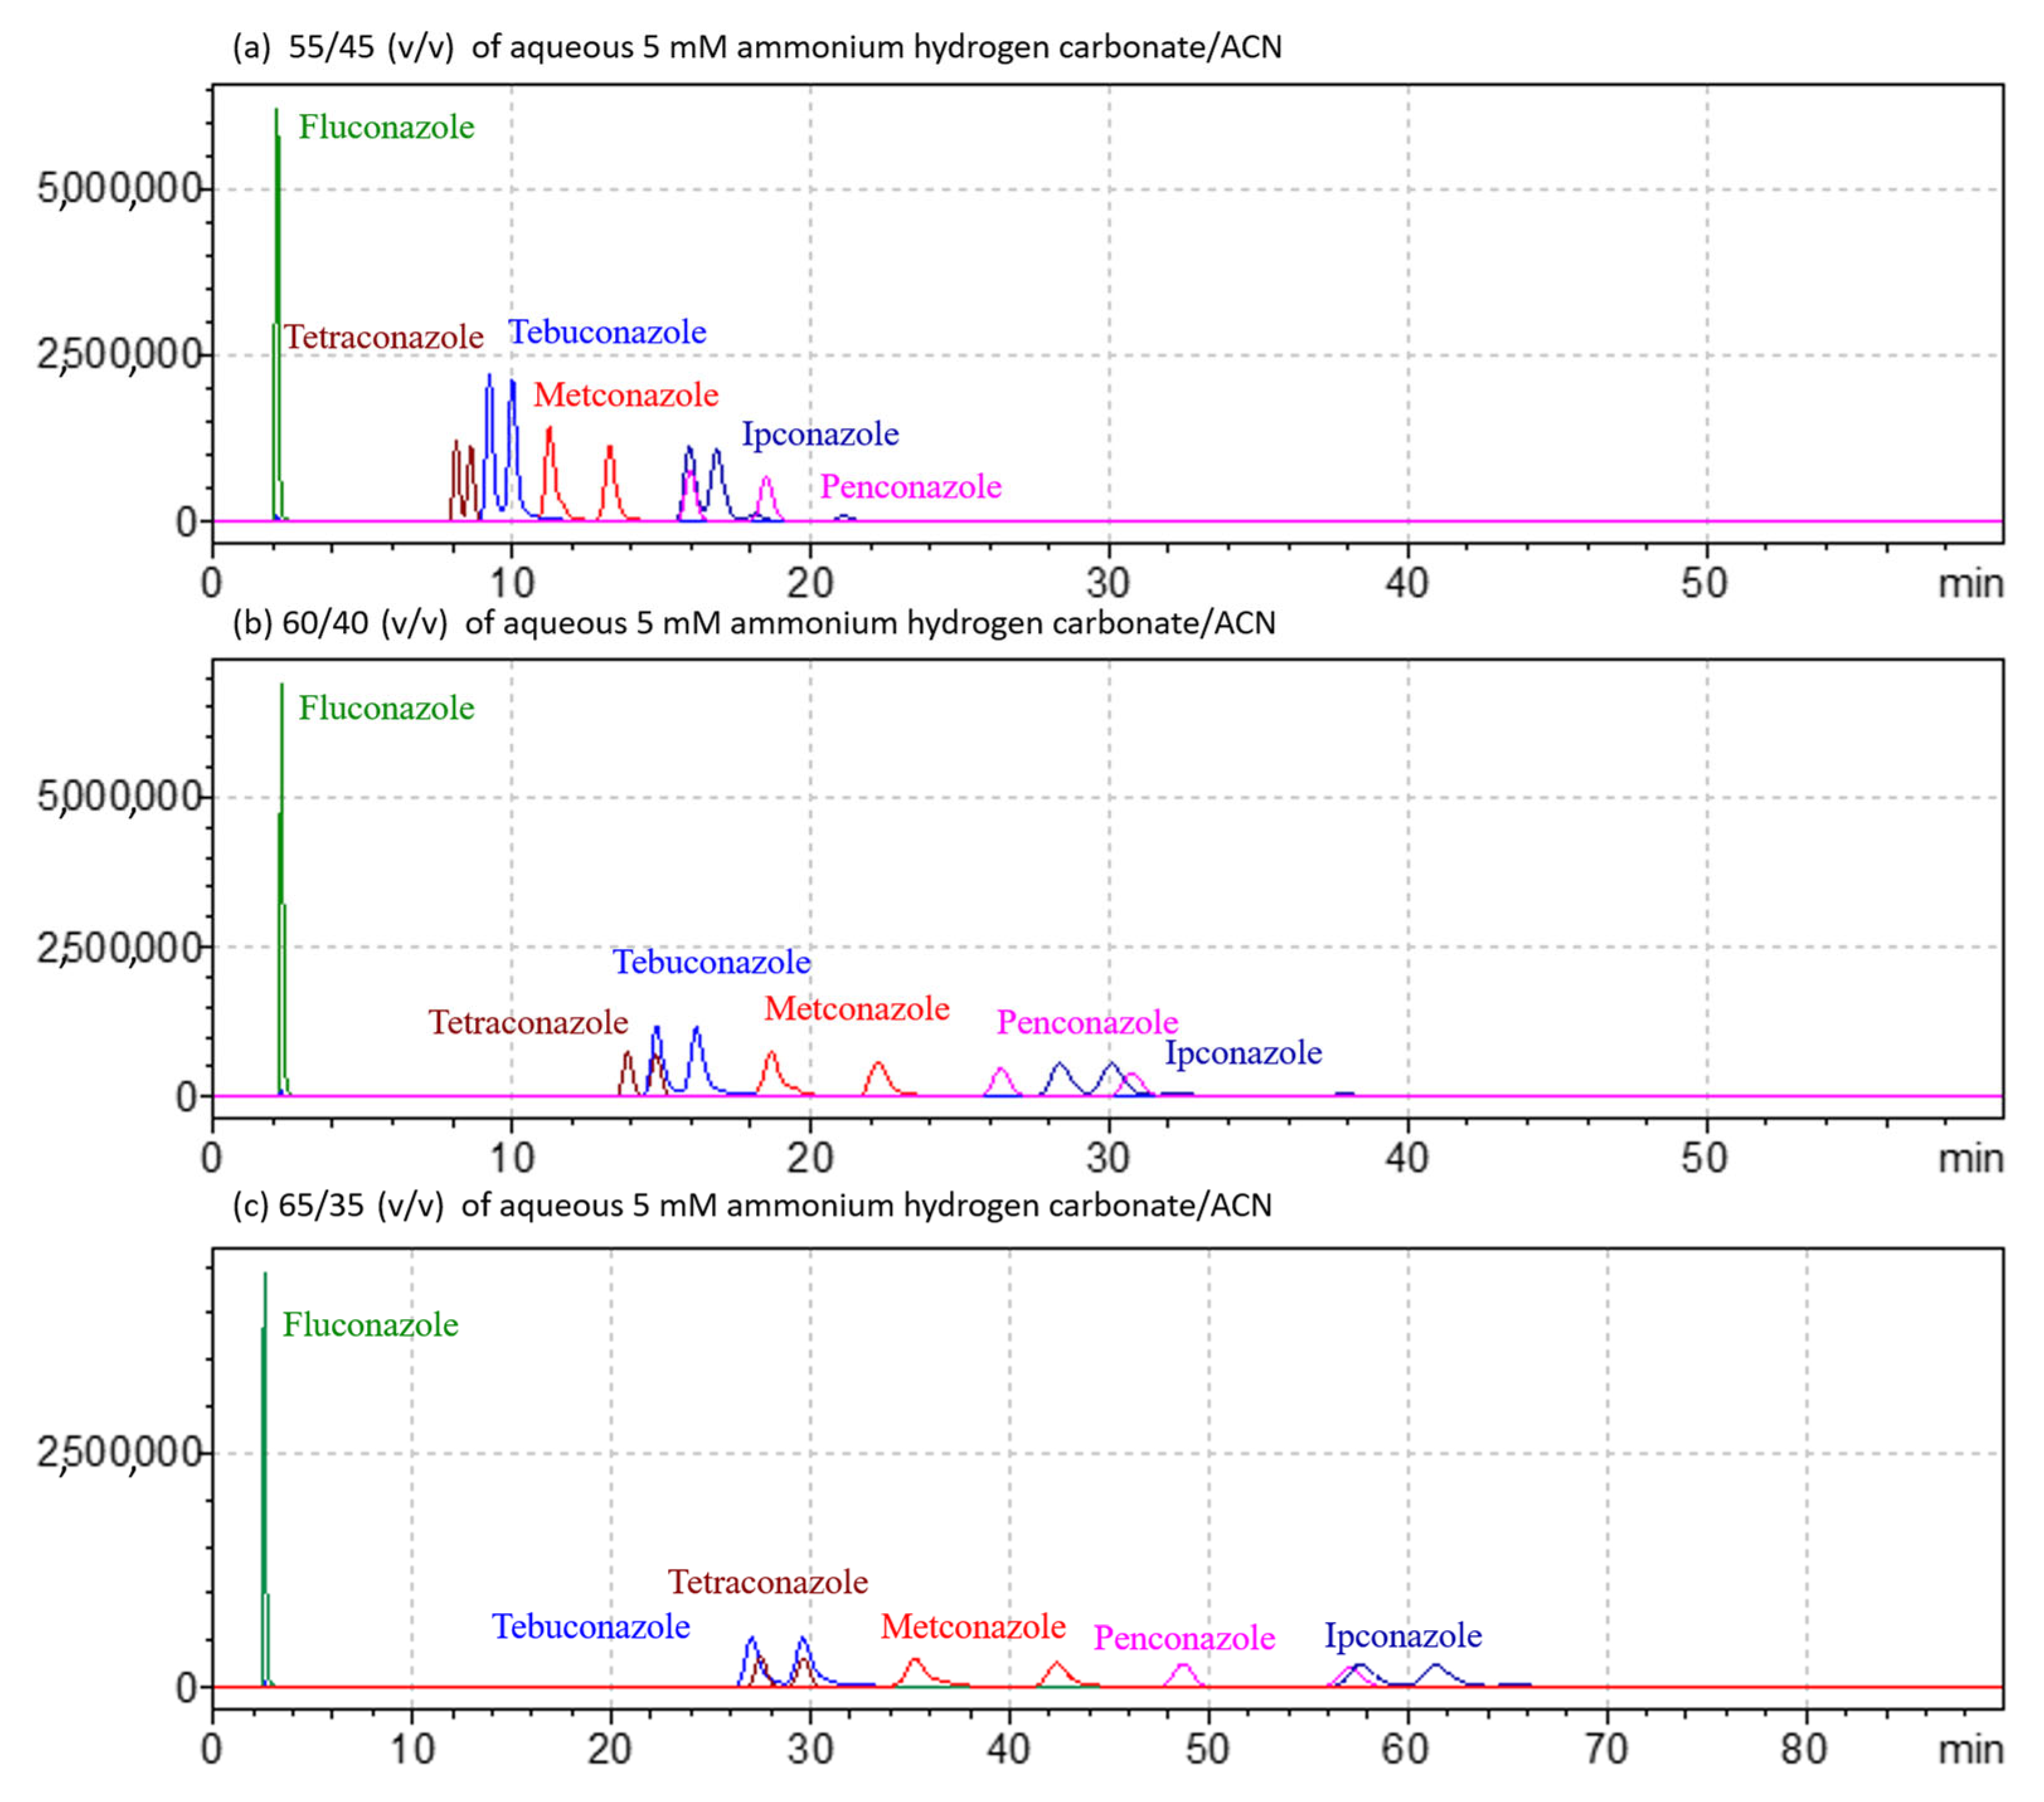
Considering that LC-MS/MS does not imply a complete separation of all the target compounds that have different m/z, the selected column oven temperature was 25 °C (Table S4 and Figure S3), allowing for a good enantioseparation, peak shape and signal intensity of each chromatographic peak within a reasonable run time. It is important to stress that both temperatures of 22 °C and 25 °C present similar values; however, setting the temperature column at 22 °C is difficult to stabilize during warm seasons, such as summer. At this point, the proportion of the mobile phase ratio was 60% aqueous phase and 40% organic phase (60/40 (v/v) of aqueous 5 mM ammonium hydrogen carbonate/ACN). Considering the large variation in temperature, decreasing from 45 °C to 25 °C, justified by the good enantioseparation and peak shape, it was necessary to test the proportions of the solvents in the mobile phase again before adjusting the flow rate, in order to try to improve the separation of the compounds and their respective enantiomers. A 5% variation in this proportion was tested, i.e., from 55% of aqueous phase and 45% of organic phase (Rs 1.17–8.86) to 65% aqueous phase with 35% organic phase (Table S5 and Figure 4), and the results obtained by raising the aqueous phase to 65% (v/v) led to an improvement in the resolutions of the pairs of enantiomers (Rs 1.44–13.1), except for the resolution between the second and third eluted diastereomer of ipconazole (Rs 1.67).
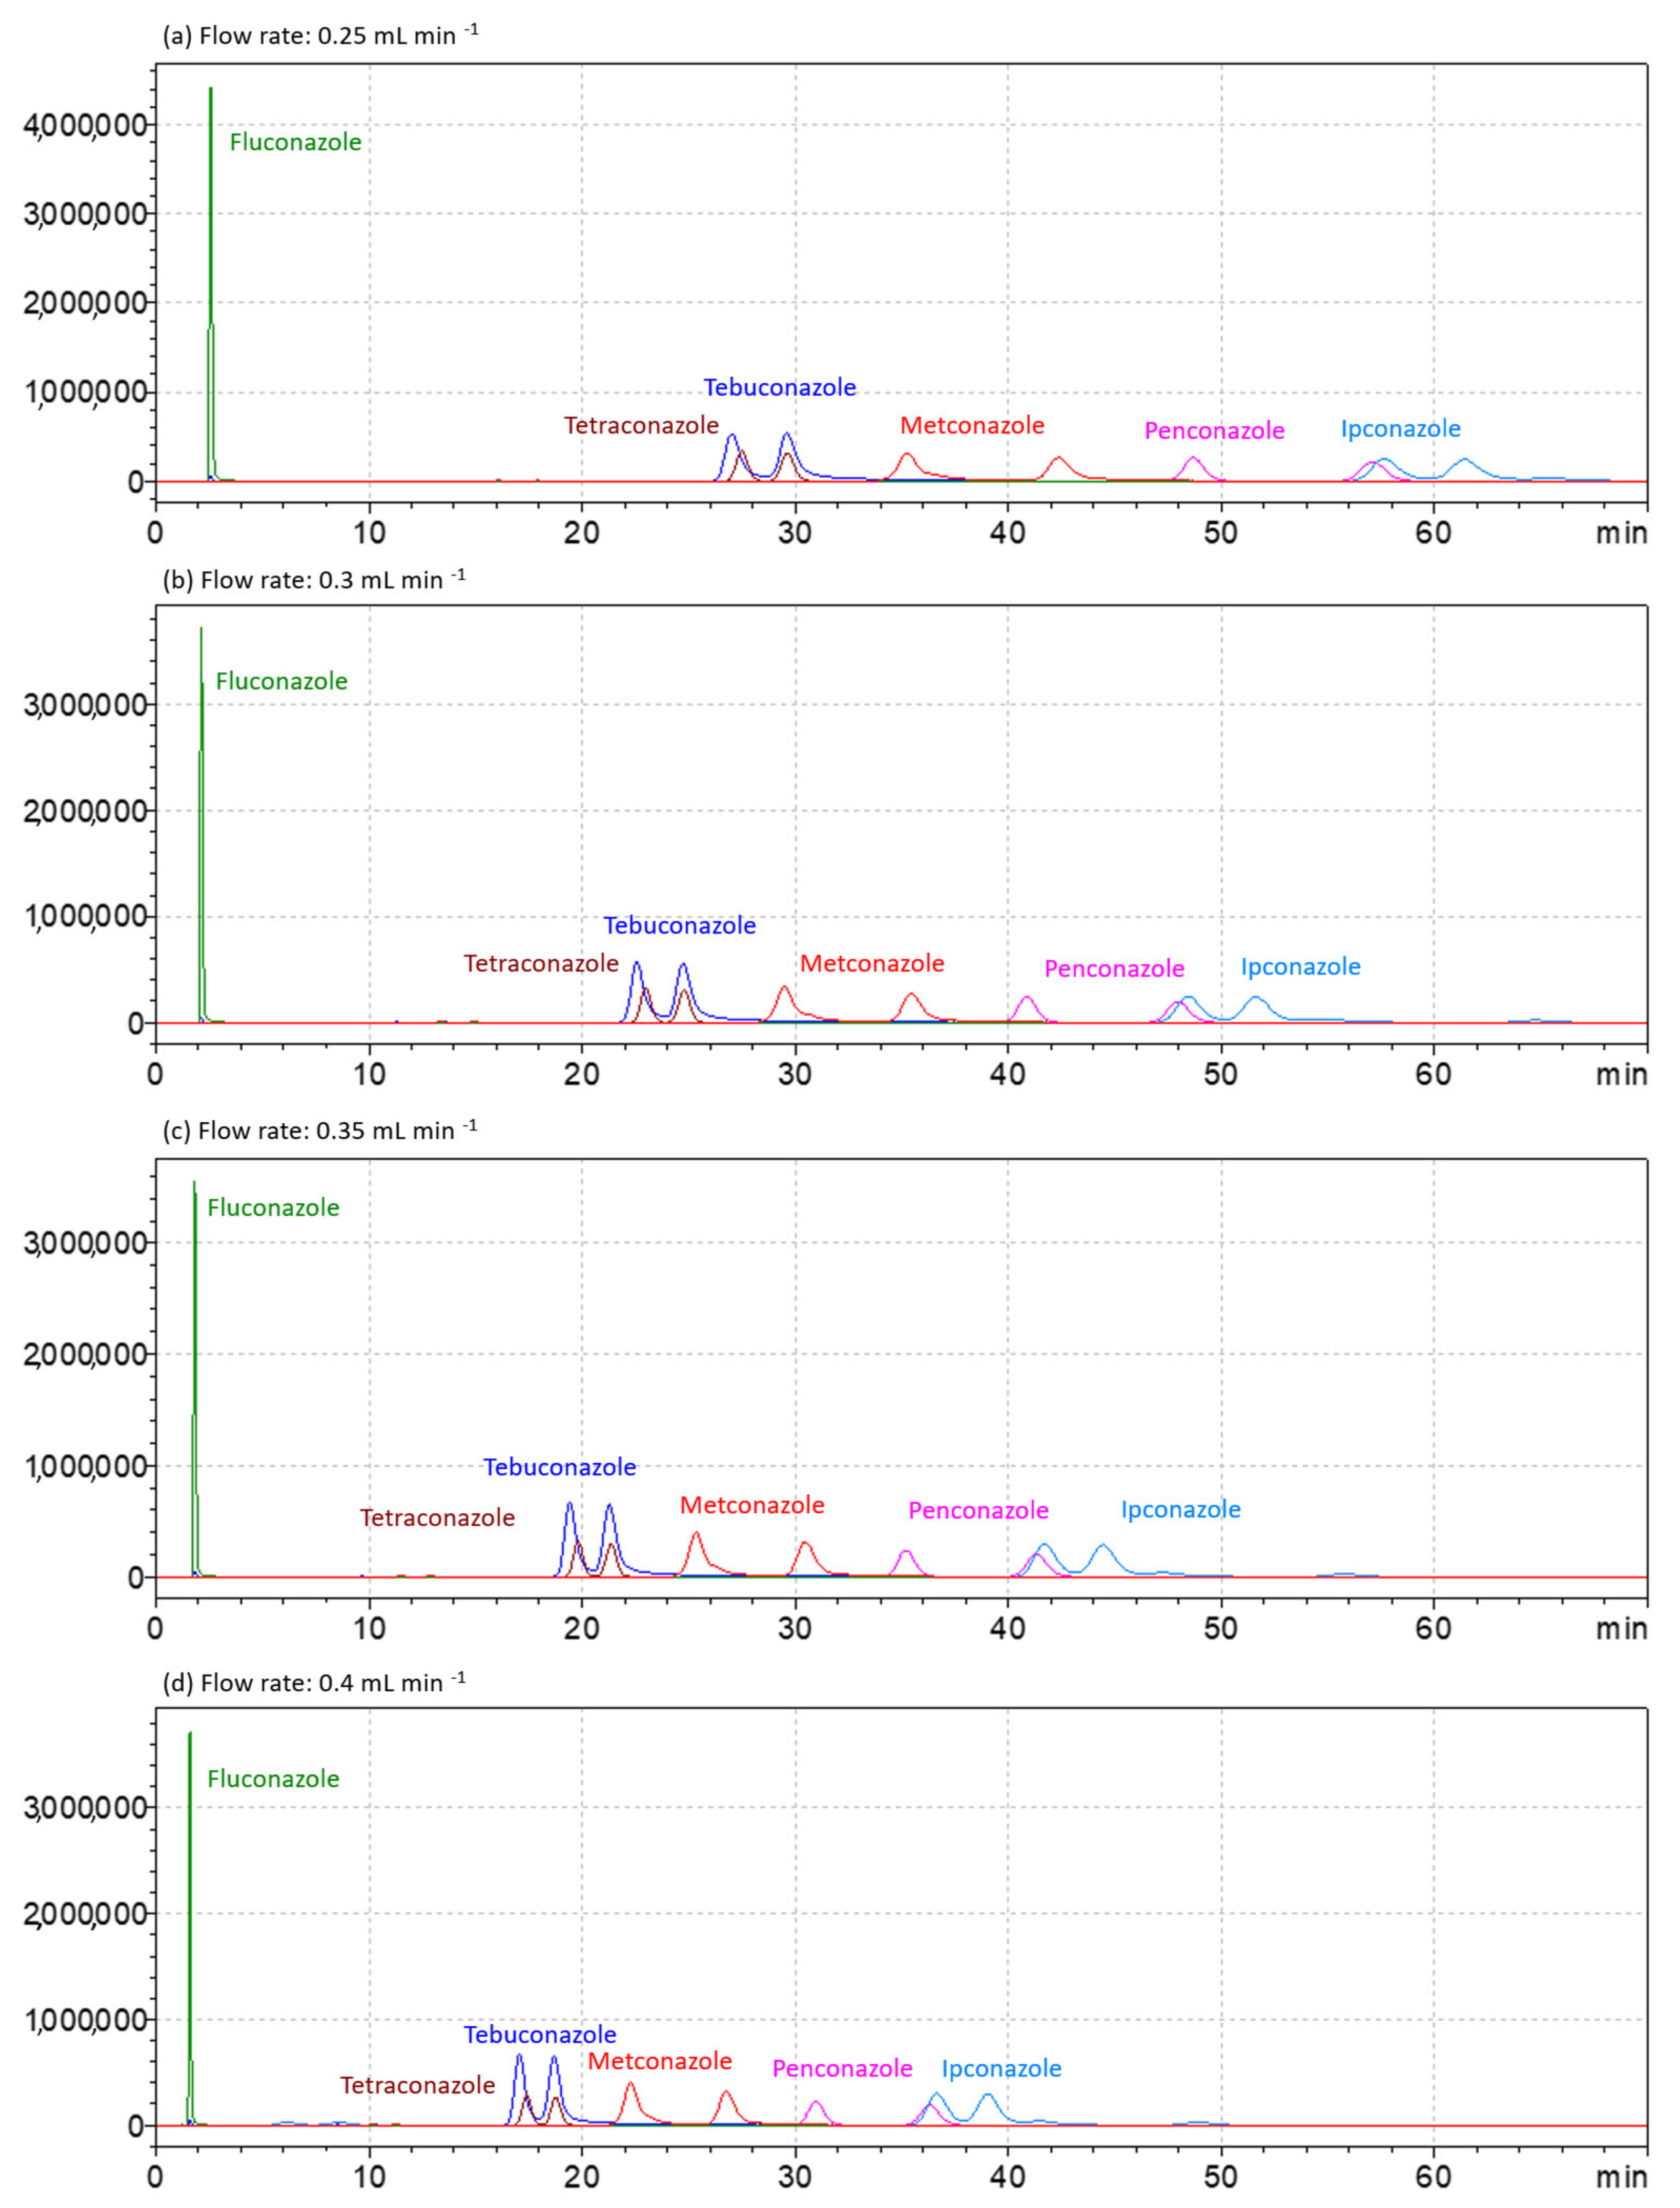
Finally, the flow was optimized to lower the run time and improve the enantioseparation of the compounds and their enantiomers, as under the current conditions, the run time was 90 min. In addition to the current flow rate of 0.25 mL min−1, three flow rates were tested: 0.3, 0.35, and 0.4 mL min−1. By raising the flow rate to 0.40 mL min−1, the separation for all compounds (Figure 5) and their respective enantiomers was maintained with good resolutions, at the same time reducing the run time to 60 min (Rs 1.39–11.6) (Table S6).
The optimized method allows the separation of 15 analytes: fluconazole, four stereoisomers of ipconazole and metconazole, and two enantiomers of penconazole, tebuconazole, and tetraconazole.

3.2. Solid-Phase Extraction Protocol Optimization

Based on a SPE protocol published elsewhere [28], the SPE was further optimized for the set of target analytes selected in this work. Sample pH (acidic ~3, natural, and alkaline ~10) was first evaluated using Oasis® HLB cartridges (150 mg) (Table S7). These pH values tested in DW were chosen based on previous SPE studies and to cover relevant extraction conditions using Oasis HLB, which is stable over a wide pH range. Acidic conditions may partially protonate weakly basic azole fungicides, affecting their polarity and retention. Basic pH was evaluated to assess extraction robustness and matrix effects. Natural pH reflects drinking water conditions, where these compounds are mainly neutral and retained primarily through reversed-phase interactions. Although acceptable recoveries were obtained under all tested conditions, alkaline pH (10) provided the best overall performance for all compounds and their respective enantiomers and was therefore selected (Figure S4a).
After pH selection, the cartridge retention capacity was subsequently assessed by increasing the sample volume. While most analytes showed consistently high recoveries, fluconazole exhibited a significant decrease with larger volumes, indicating limited retention under the selected conditions (Figure S4b). A sample volume of 500 mL was therefore established as the optimal compromise between analyte enrichment and recovery.
The conditioning and washing steps were subsequently investigated in detail to evaluate their influence on analyte retention and method robustness (Figure S5). The complete removal of the conditioning step resulted in a pronounced decrease in fluconazole recovery, demonstrating its critical role in cartridge activation and analyte retention. Reduction in conditioning and washing solvent volumes did not significantly affect most target compounds; however, maintaining the original conditioning conditions ensured greater consistency and reproducibility. Additionally, modification of the washing solvent composition (Figure S6b) revealed that the presence of MeOH contributed to analyte losses, particularly for fluconazole. Its exclusion led to slightly improved recoveries, confirming that losses predominantly occurred during percolation and washing rather than during elution.
Elution conditions were further examined to determine whether increasing solvent volume could compensate for fluconazole losses (Figure S6a). Only marginal improvements were observed, supporting the conclusion that reduced recovery was not related to strong sorbent retention but to earlier extraction steps.
Finally, substitution of MeOH with EtOH in the conditioning and elution steps (Table S7, Figure S7) was assessed to enhance method greenness. Although environmentally preferable, EtOH resulted in slightly lower recoveries and reduced reproducibility (Figure S7). Therefore, MeOH was kept in both conditioning and elution steps. Detailed optimization data are provided in Table S7 and Figures S4–S7.
The optimized SPE protocol uses Oasis® HLB cartridges (150 mg of sorbent and a capacity of 6 mL), conditioned by 10 mL of UPW and 10 mL of MeOH, loaded with a sample volume of 500 mL (pH 10, adjusted using ammonia solution), washed using 10 mL of UPW and eluted by 6 mL of MeOH.

3.3. Method Validation

The method was validated for DW analysis, using the internal standard calibration method (Section 2.4). In principle, the quantification of each CEC would be performed using its corresponding internal standard. Nevertheless, the elevated costs associated with internal standards limit the feasibility of this approach for routine monitoring. In addition, identifying appropriate internal standards for every compound can be difficult, since some compounds do not have respective surrogate standards marketed. Accordingly, the target analytes were categorized into groups according to their physicochemical characteristics (Table S1). Similar grouping approaches have been reported in studies on multi-class organic micropollutants [2,6,36], typically based on parameters such as polarity, molecular weight, or acid-base properties.
Table S8 details the retention times (tR), calibration range, coefficient of determination (r2), instrumental (IDL and IQL) and method (MDL and MQL) limits for fluconazole and the enantiomers/stereoisomers of the chiral target fungicides. The contribution of each metconazole and ipconazole stereoisomer was assessed by determining the ratio between the areas of each stereoisomer and the sum of the areas of the four stereoisomers (Table S9). The E1 and E2 of metconazole were not fully validated, since the metconazole standard contains the four stereoisomers at different proportions, with E1 and E2 at much lower proportions, and it was decided to keep E3 and E4 as targets, since E1 and E2 were never detected in any blank sample during method optimization. Therefore, only a qualitative analysis was applied to metconazole E1 and E2. In turn, ipconazole E3 and E4 were validated at the intermediate and highest levels, for a similar reason. In fact, ipconazole standard contains the four stereoisomers at different proportions, with E3 and E4 at much lower proportions. However, such a difference in comparison to metconazole is slightly less pronounced, allowing us to validate the method for these two enantiomers. The method demonstrated a linear response over a concentration range of 0.20 and 400 ng L−1 (concentration values considering the preconcentration factor of 2000 applied during the SPE procedure), depending on the analyte. The values of the coefficient of determination (r2) vary between 0.998 and 0.999. The instrumental limits, IDL and IQL, ranged from 0.06 to 1.46 µg L−1 and from 0.18 to 4.43 µg L−1, respectively. Regarding the limits of the method that considers the whole SPE-LC-MS/MS method, including the losses due to recovery or matrix effects and the potential gains due to matrix effects, the MDL and MQL ranged from 0.01 to 0.86 ng L−1 and from 0.04 to 2.60 ng L−1, respectively.
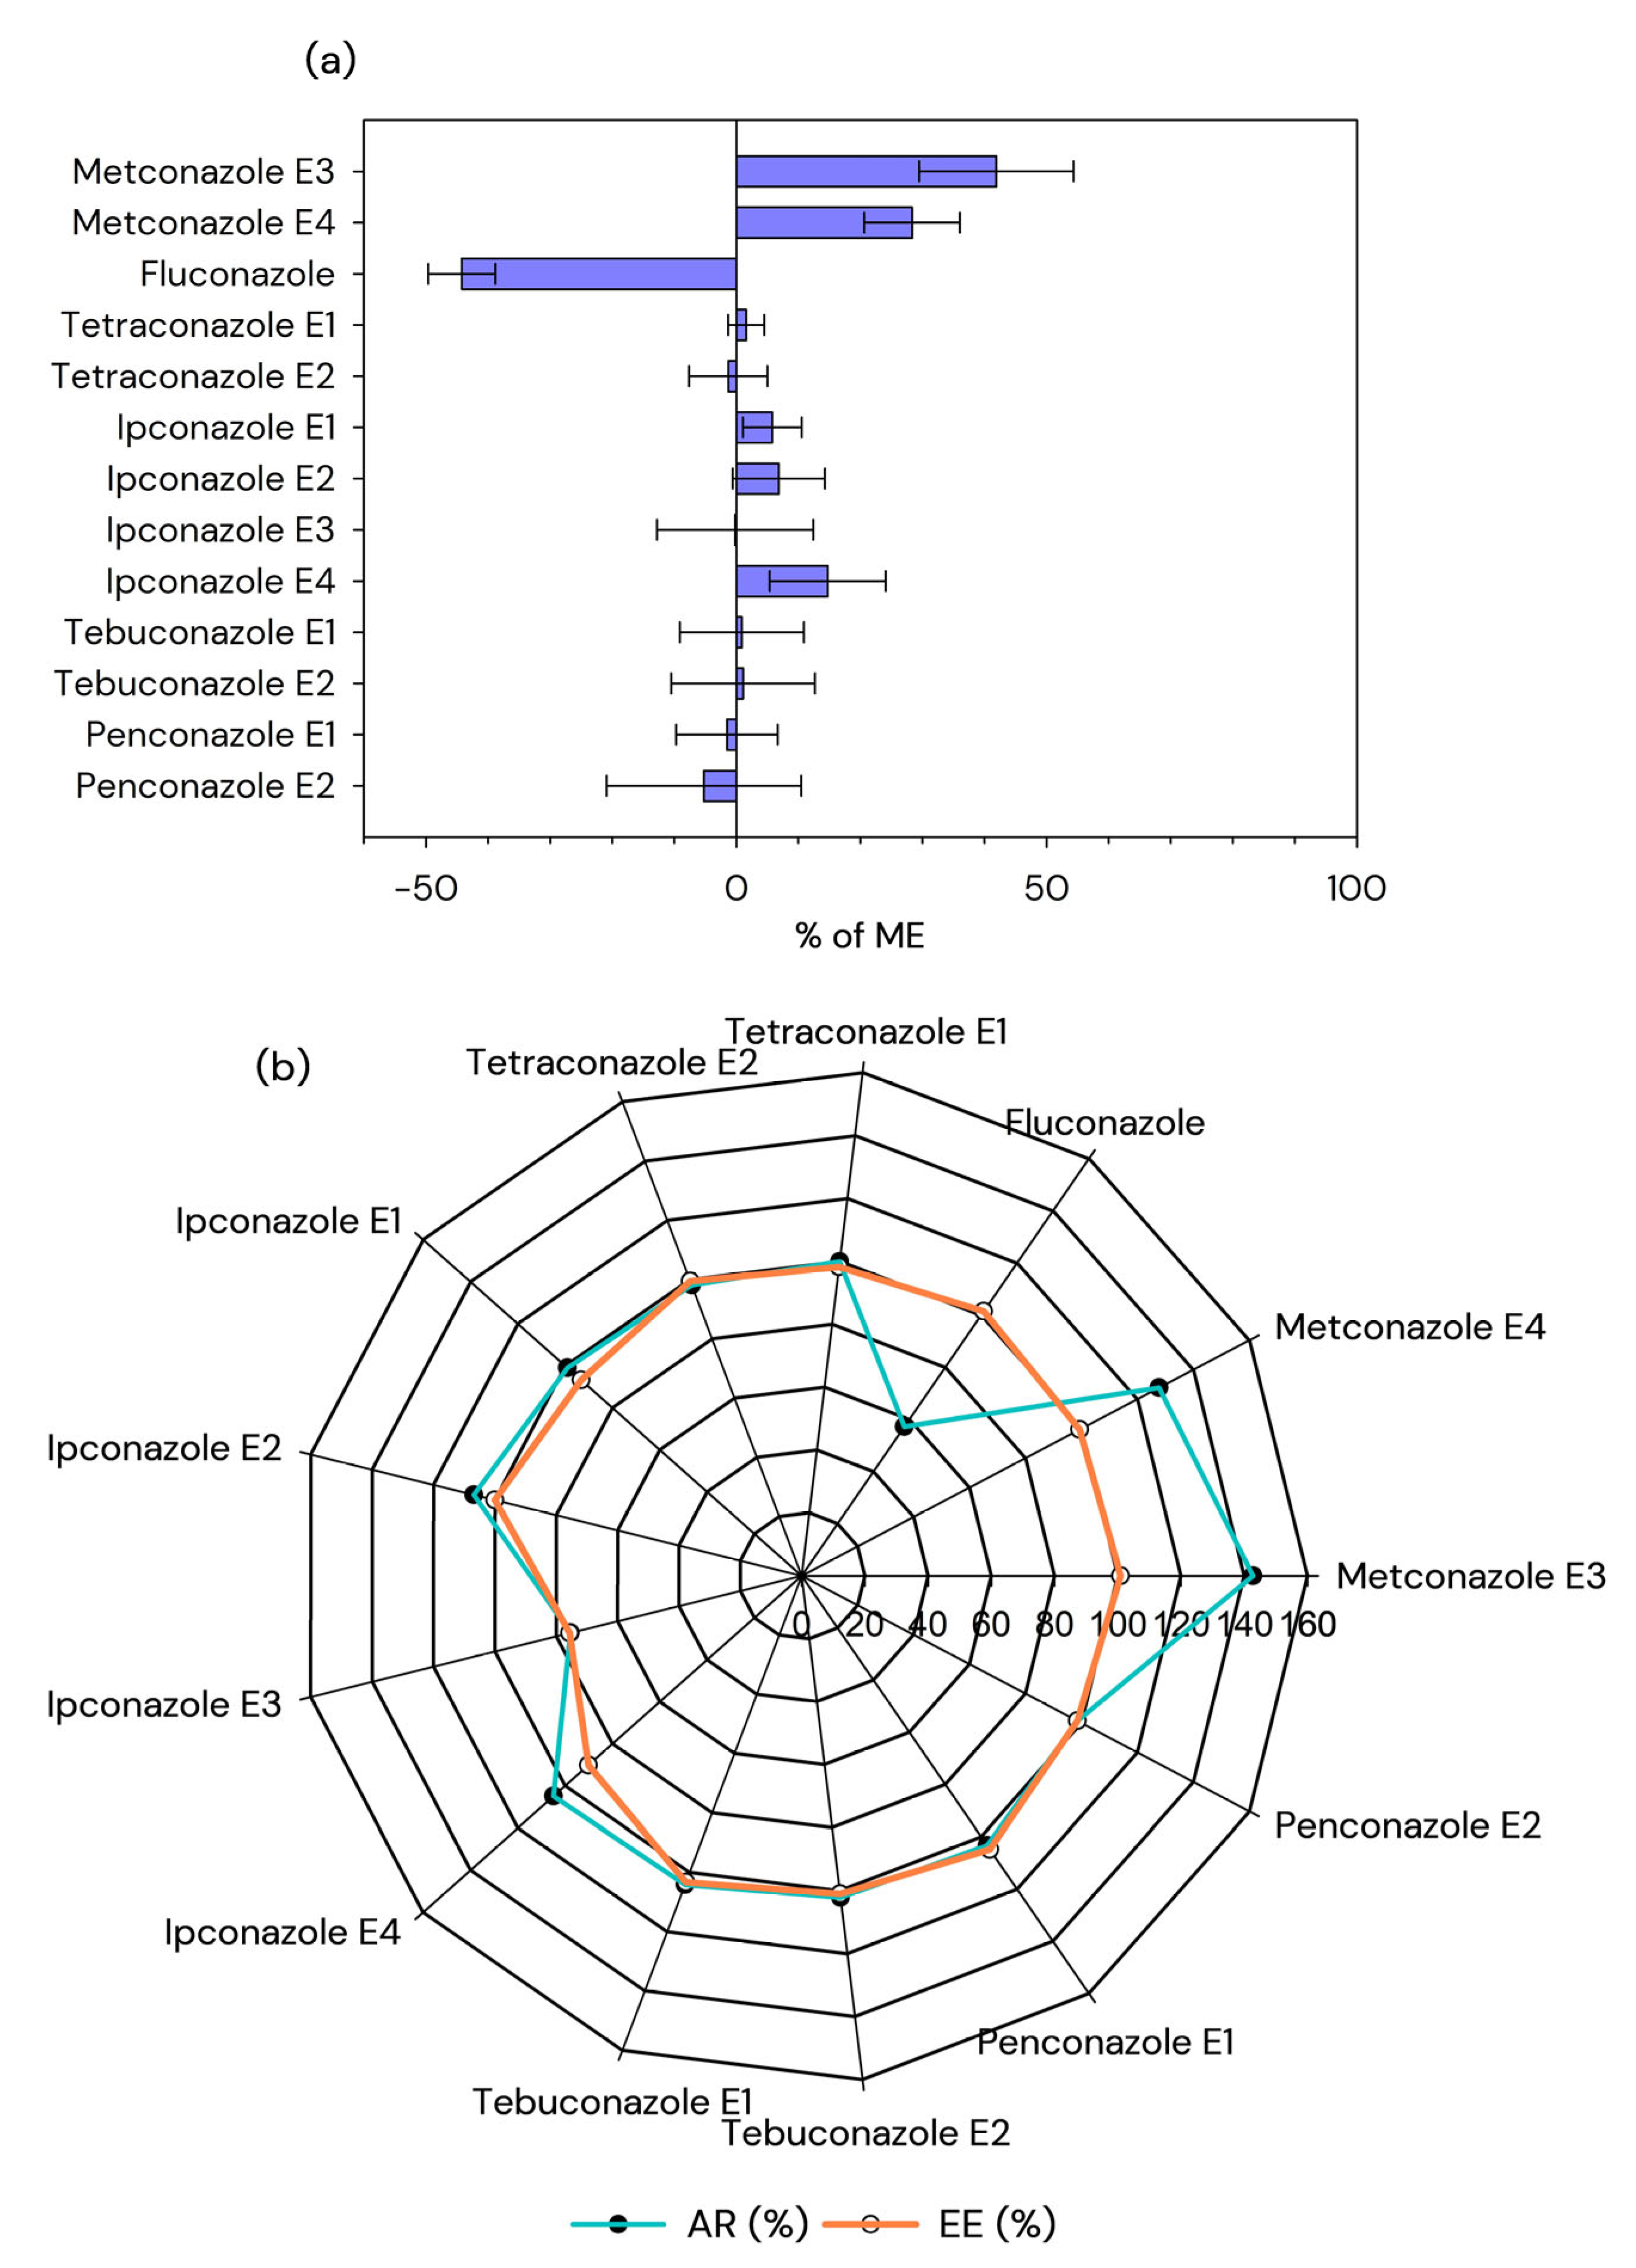
The EEs, MEs, ARs, and intra- and inter-batch precision were also calculated for fluconazole and each enantiomer/stereoisomer of the chiral target fungicides (Table S10). Figure 6a illustrates the MEs of fluconazole and each enantiomer/stereoisomer of the chiral target fungicides. Regarding positive ME, the average was 12.7%, with values ranging from 0.9% (tebuconazole E1) to 41.9% (metconazole E3). The average for negative MEs was −10.5%, ranging from −44.2% (fluconazole) to −0.2% (ipconazole E3).
From 13 analytes, 10 showed low ME, namely tetraconazole E1, tetraconazole E2, ipconazole E1, ipconazole E2, ipconazole E3, ipconazole E4, tebuconazole E1, tebuconazole E2, penconazole E1 and penconazole E2. In these cases, as expected, the AR was similar to the EE (Figure 6b) of the analyte. However, the ME must be carefully assessed, as it may lead to misleading interpretations. For example, a compound showing a very high AR does not necessarily reflect high EE during SPE; in some cases, matrix-induced signal enhancement may compensate for poor EE, whereas signal suppression may conceal an otherwise high AR. In this study, the ionization of three analytes was significantly influenced by matrix components. For example, EE of fluconazole was 101.4% and its AR was 57.2% (Figure 6b), which is attributed to the very pronounced negative ME (−44.2%) that is observed in Figure 6a. Despite the lower AR of fluconazole due to the high matrix suppression, the use of fluconazole-d4 as an isotopically labeled internal standard added prior to SPE compensated for matrix effects and eventual losses during extraction, enabling reliable quantification. In fact, lower ARs do not necessarily correspond to low EEs (Figure 6b). The opposite occurred, for example, with metconazole E3, where the EE was 100.9% and its AR was 142.8 (Figure 6b), which is attributed to the very pronounced positive ME (41.9%) that is observed in Figure 6a.
The average EE was 97.8%, with penconazole E2 being the compound with the highest EE (105%) and ipconazole E3 with the lowest EE (75.6%). In turn, the average AR obtained was 104%, with metconazole E3 having the highest AR (143%) and fluconazole the lowest (57.2%). The similar AR and EE of tetraconazole E1 and E2, ipconazole E1, E2, E3 and E4, tebuconazole E1 and E2, and penconazole E1 and E2 show the low ME for these analytes. Since the AR considers the efficiency of the whole analytical process, it should be interpreted together with the EE and ME. A general examination of Figure 6 clearly shows that EE values for each pair of enantiomers do not differ.
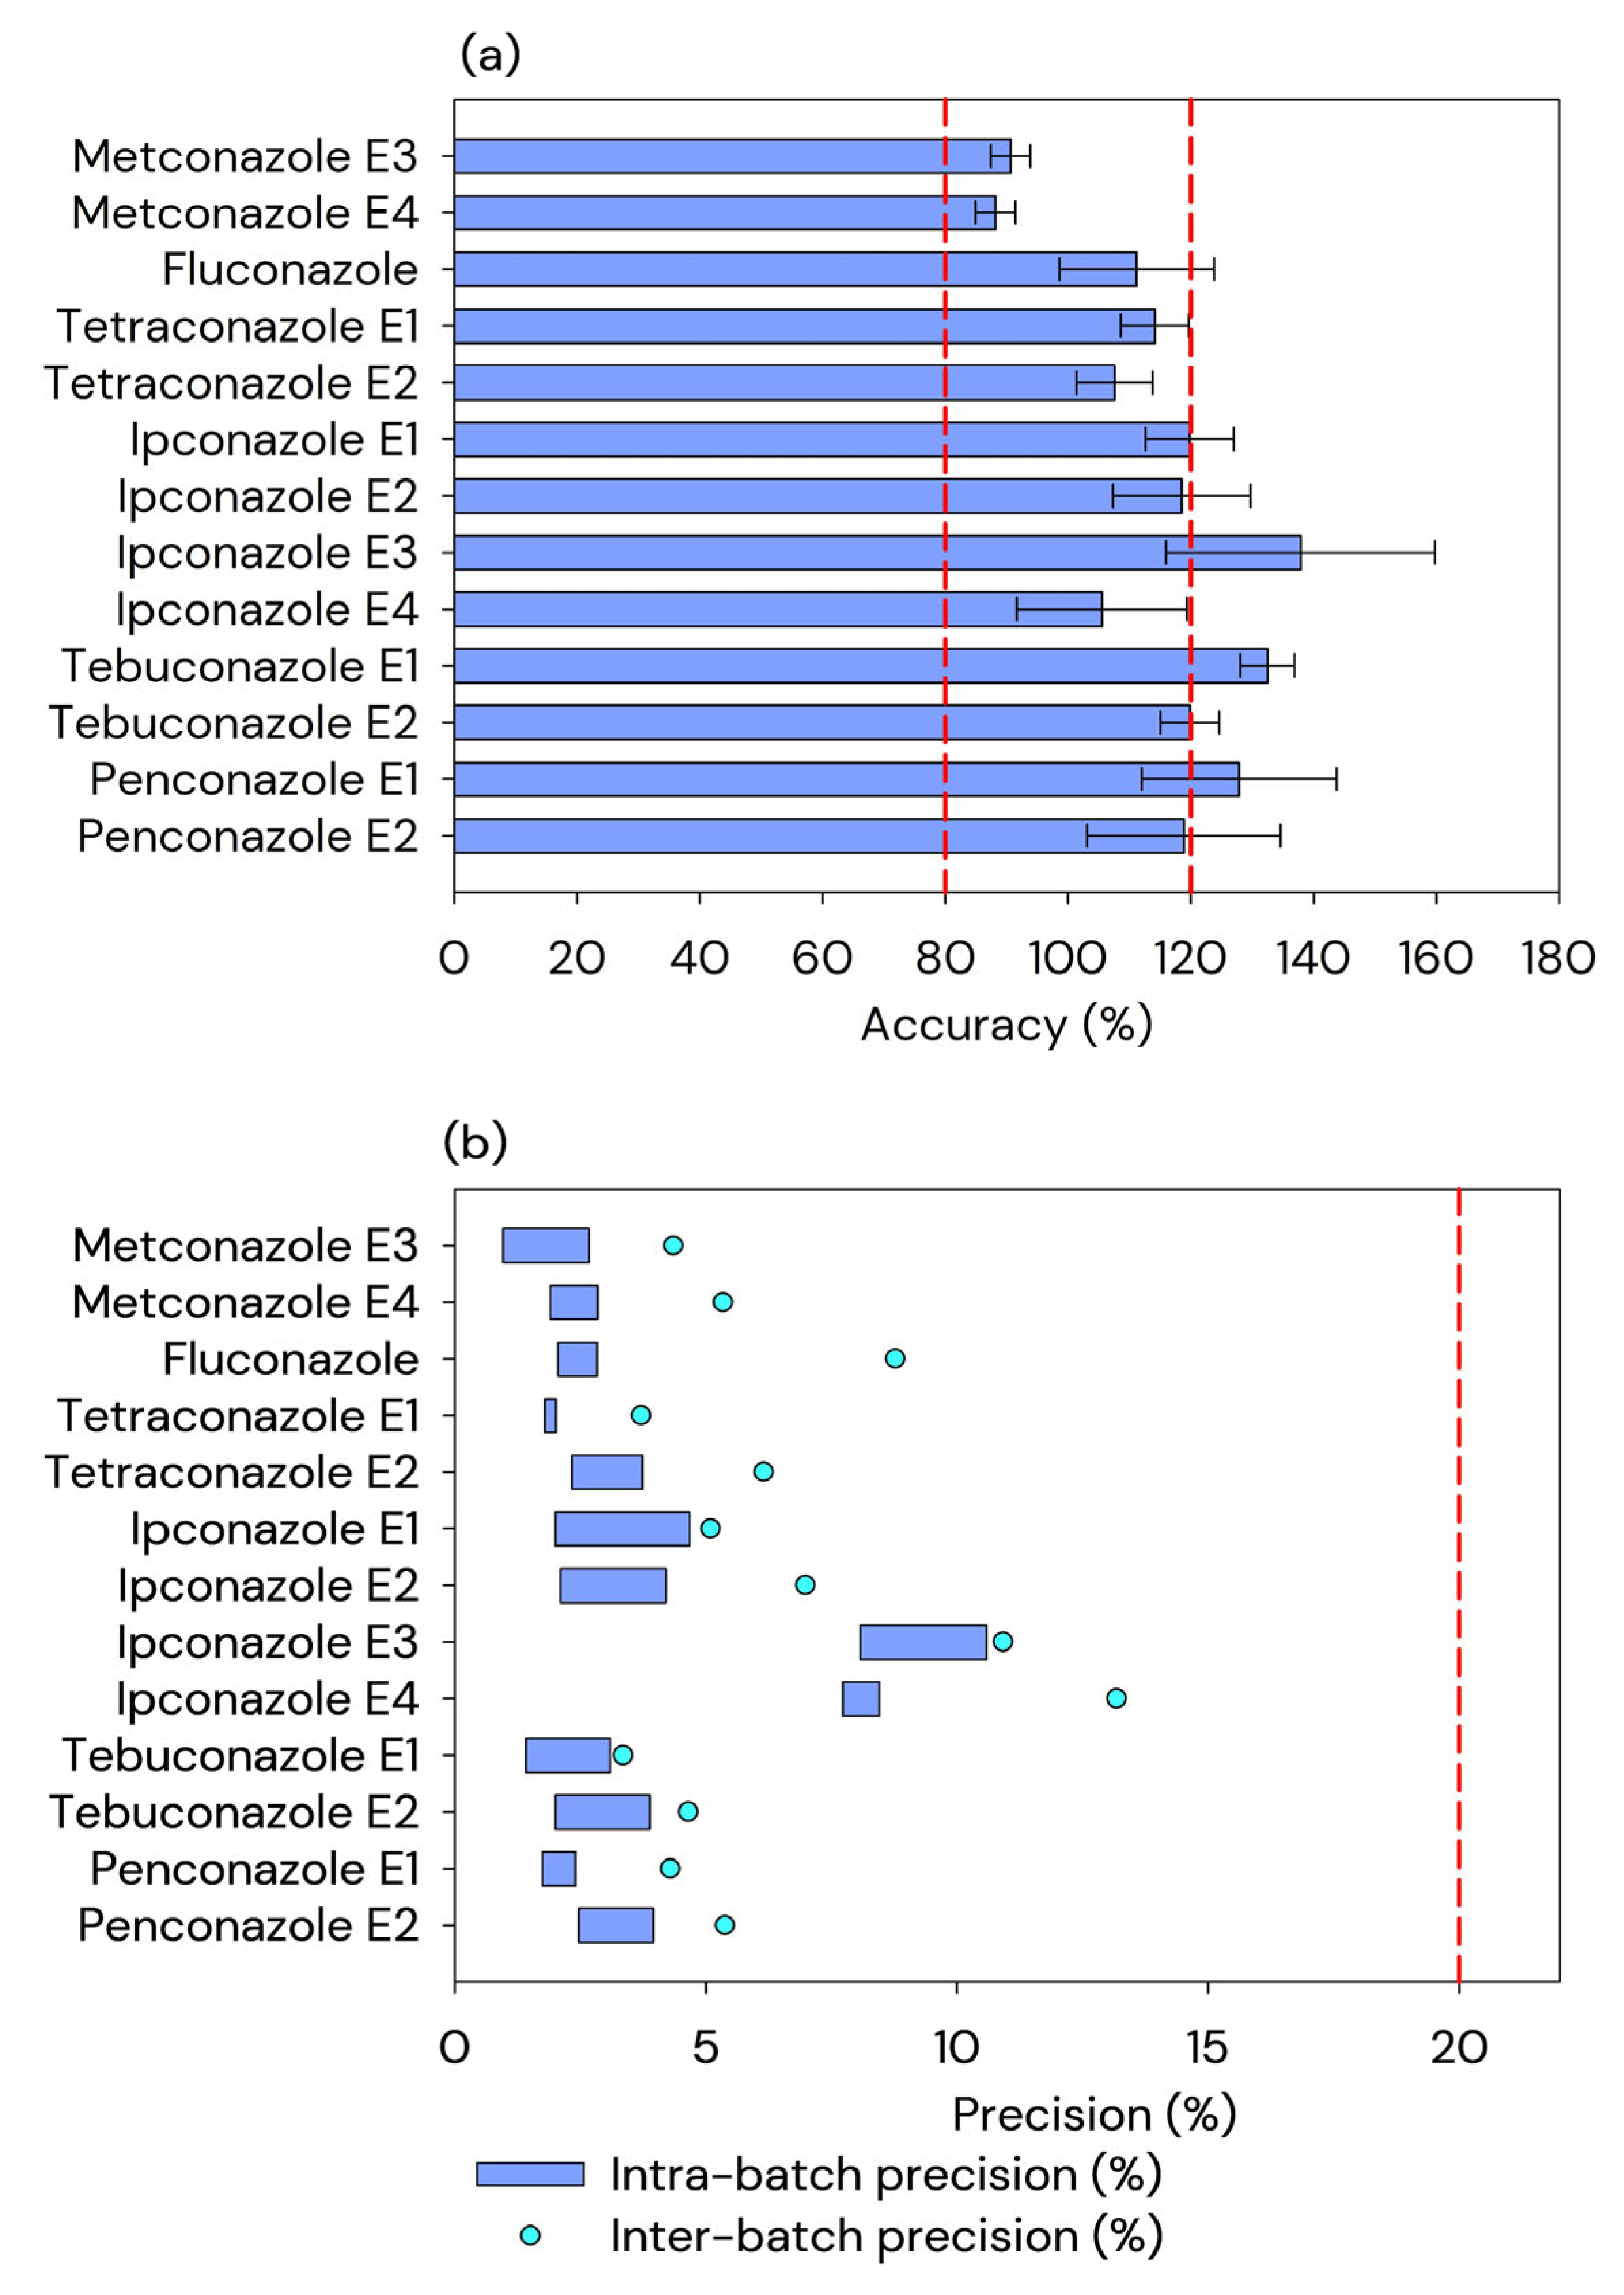
Figure 7a shows the accuracy results. According to European guidelines [29], the accuracy values are recommended to be within the range of 80 to 120%, indicating agreement between the QC results obtained and the theoretical values. This criterion was not met by three of the target compounds, ipconazole E3, tebuconazole E1, and penconazole E1 (Table S10). In addition, the precision of the method was estimated through intra- and inter-batch precision. According to recent international standards [29], the RSD should be lower than 20%, which was successfully reached for all analytes, as shown in Figure 7b (detailed in Table S10).

3.4. Portuguese DW Samples Analysis

After optimization and validation, the SPE-LC-MS/MS method was employed to monitor target fungicides in 13 DW samples collected from various water supply networks in Portugal. Of the 13 samples, 8 were collected in the northern region and 5 in the central and southern regions, providing a somewhat general and representative overview of different areas and possible influencing factors. The concentration range determined for fluconazole and stereoisomers of five chiral fungicides, as well as the frequency of detection, is presented in Table 3. Some of the stereoisomers studied (metconazole E3 and E4; and penconazole E1 and E2) were only detected in 1 of the 13 samples, above the MDL but below MQL (1.44, 1.50, 1.12, and 1.45 ng L−1, respectively), making quantification impossible (Table S11). Tebuconazole enantiomers, in turn, exceeded the quantification limits in six samples, being detected at concentrations up to 71.4 ng L−1 for E1 and up to 65.6 ng L−1 for E2, thus allowing the estimation of its EF, which ranged from 0.51 to 0.55 (Table 3), indicating an almost racemic composition. These EF results emphasize the importance of an enantioselective approach, as stereochemistry can influence environmental fate, toxicity, and provide insights into transformation processes from consumption to environmental occurrence. Regarding the remaining chiral fungicides, the two enantiomers of penconazole were detected at concentrations below 1.12 ng L−1 for E1 and below 1.45 ng L−1 for E2; while metconazole was detected at concentrations below 1.44 ng L−1 for E3 and below 1.50 ng L−1 for E4. Therefore, the EFs were not possible to estimate in these two cases. The ipconazole and tetraconazole enantiomers were always below the MDLs, meaning that the analytes may be absent or even present below the MDLs of the validated method. In any case, the values of the MQLs and MDLs are quite low. The only target achiral fungicide, fluconazole, was the analyte detected most frequently, occurring in 10 of the 13 samples (~87%) and at concentrations from 0.6 up to 4.0 ng L−1, followed by tebuconazole, which was detected in 6 of the 13 samples.
To the authors’ knowledge, no previous studies have examined the presence of these compounds in DW matrices. Their occurrence in DW can be attributed to multiple environmental sources, primarily agricultural runoff, wastewater discharge, and subsequent infiltration into surface and groundwater systems (Figure 1). Although there is no enantioselective monitoring of these compounds in DW to date, a recent review on chiral chromatographic methods for fungicide analysis in environmental matrices highlighted that existing enantiomeric investigations are restricted to surface water, wastewater, soil, and biota matrices [27]. Specifically, tebuconazole has been studied under enantioselective conditions in surface water and wastewater, where deviations from racemic composition have been reported, indicating stereoselective transformation processes in aquatic environments [37,38,39]. Penconazole has also been evaluated in surface water [38], whereas metconazole [40,41,42], tetraconazole [43,44,45], and ipconazole [46] have only been investigated in soil and soil-related organisms. Although direct comparisons between DW and environmental matrices such as surface water or wastewater must be interpreted cautiously due to differences in matrix composition and water treatment processes, these studies provide valuable context for understanding the environmental fate and stereoselective behavior of chiral fungicides. Nevertheless, the absence of enantioselective data in DW highlights the novelty of our study. Non-enantioselective studies of our target chiral fungicides in DW are also scarce. Indeed, tebuconazole was monitored in three studies and it was always detected up to 828 ng L−1 in surface water [47,48] and up to 20 ng L−1 in DW [47,49].

3.5. Human Health Risk Assessment

The HQ for adults and children was used as a preliminary, screening-level approach commonly applied in DW monitoring studies to identify substances requiring further evaluation. It provides a conservative initial indication of potential human health concern rather than a comprehensive risk characterization. The highest values of each fungicide in DW were applied to calculate the respective HQ. The concentrations found in all DW samples, targeting individual fungicides, do not suggest relevant health risks, since the concentrations detected are at residual levels and the HQs are well below 0.1 for both adults (Table S12) and children (Table S13). The range of HQs for each fungicide detected in at least one DW sample is summarized in Table 4. Nevertheless, it is important to emphasize that HQs values were calculated separately for each substance in each sample, which does not fully represent real exposure scenarios, since more than one target fungicide was detected in some samples. To account for potential cumulative effects, the HI was calculated for each sample by summing the HQ values of all detected fungicides. The resulting HI values remained well below 0.1 for both adults and children, confirming that combined exposure to the detected fungicides is not expected to pose a significant health risk.
These HQ and HI results consider exposure to the sum of enantiomeric concentrations, using reference values based on racemates, in line with current regulatory practice, since RfD values are currently only available for racemates of these fungicides, and not for individual enantiomers. Although HQs and HIs are quite low, potential cocktail effects resulting from the concurrent occurrence of multiple contaminants in a given sample are not considered in this approach. In turn, HI are simple cumulative indices that provide a qualitative screening of combined exposure; however, their application is limited by the assumption of dose additivity and does not consider potential synergistic or antagonistic interactions among compounds. The present model also has limitations, as it does not consider uncertainties in toxicity, exposure, and the possible synergistic or antagonistic effects [31]. This limitation can only be addressed through the development of more advanced risk assessment models, which are currently unavailable, particularly for predicting the long-term health effects associated with exposure to multiple contaminants.

4. Conclusions

A SPE-LC-MS/MS method using a cellulose tris(3,5-dichlorophenylcarbamate) chiral stationary phase under reversed elution mode was successfully validated for the analysis of fluconazole and enantioselective analysis of five chiral fungicides in DW. The ME showed a slight increase or suppression of the signal for most analytes, except for metconazole E3, which had a strong positive matrix effect (41.9%), and for fluconazole with a strong suppression (44.2%). The analysis of 13 DW samples collected from various regions in Portugal using the established SPE-LC-MS/MS method resulted in the detection of seven out of the 15 target analytes in at least one sample, supporting the broad presence of these fungicides in the national DW supply. Fluconazole and tebuconazole were the only compounds analyzed that were present above the MQLs, with tebuconazole being detected at higher concentrations, exceeding 65 ng L−1 for both enantiomers. The EF of this compound varied between 0.51 and 0.55 for the different samples, which shows that there are variations in the proportions of these enantiomers in the environment. Lastly, HQs were calculated for each individual fungicide in each sample, suggesting no significant health risk for either adults or children. All HQ and HI values remained well below levels of concern. Overall, our study reinforces the relevance of enantioselective analysis for understanding the environmental behavior, toxicity, and transformation pathways of chiral compounds.
This work contributed to the generation of reliable data for fungicide monitoring in DW, as encouraged by the EU, addressing existing research gaps, particularly in the Portuguese context, where such information is scarce. Moreover, this is the first report on the enantioselective analysis of CECs in DW in Portugal. The results underscore the urgent need for additional monitoring programs that also include the assessment of EF, aiming to develop solutions and preventive measures concerning fungicides and other CECs in water intended for human consumption.

Supplementary Materials

The following supporting information can be downloaded at: https://www.mdpi.com/article/10.3390/w18060680/s1, Figure S1. LC-MS/MS chromatograms of a solution of 10 mg L−1 of each target analyte, obtained in a column Lux® 3 µm i-Cellulose 5 chromatographic column (150 × 2.0 mm, i.d.), using different mobile phases (60/40, v/v of UPW/ACN (a); 60/40 (v/v) of aqueous 5 mM ammonium hydrogen carbonate/ACN (b); 60/40 (v/v) of 0.1% formic acid UPW/ACN (c)), the column oven temperature set at 45 °C, a flow rate of 0.25 mL min−1 and an injection volume of 10 µL.; Figure S2. LC-MS/MS chromatograms of a solution of 10 mg L−1 of each target analyte, obtained in a column Lux® 3 µm i-Cellulose 5 chromatographic column (150 × 2.0 mm, i.d.), using different proportions (v/v) of aqueous 5 mM ammonium hydrogen carbonate/ACN in the mobile phase (55/45 (a); 60/40 (b); 65/35 (c); 70/30 (d)), the column oven temperature set at 45 °C, a flow rate of 0.25 mL min−1 and an injection volume of 10 µL.; Figure S3. LC-MS/MS chromatograms of a solution of 10 mg L−1 of each target analyte, obtained in a column Lux® 3 µm i-Cellulose 5 chromatographic column (150 × 2.0 mm, i.d.) using a mobile phase composed by 60/40 (v/v) of aqueous 5 mM ammonium hydrogen carbonate/ACN, a flow rate of 0.25 mL min−1, an injection volume of 10 µL, and the following oven column temperatures: 22 °C (a); 25 °C (b); 35 °C (c), and 45 °C (d).; Figure S4. Recovery (%) of the target analytes from DW containing each at 100 ng L−1, using different pH (3, 6.5 (without adjustment) and 10) a); or using different DW samples volumes (500, 1000, 1500, 2000 mL) (b).; Figure S5. Recovery (%) of the target analytes from DW containing each at 100 ng L−1, using different conditioning and washing volumes: with and without conditioning with 10 mL washing (a); with and without conditioning with 6 mL washing (b).; Figure S6. Recovery (%) of the target analytes from DW containing each at 100 ng L−1, when using different elution volumes (6 mL or 10 mL) (a); using different washing solvents: UPW with 5% MeOH and UPW without 5% MeOH (b).; Figure S7. Recovery (%) of the target analytes from DW containing each at 100 ng L−1, using MeOH in conditioning (10 mL UPW and 10 mL MeOH) and elution (6 mL MeOH) and with EtOH in conditioning (10 mL UPW and 10 mL EtOH) and elution (6 mL EtOH).; Table S1. Selected reaction monitoring (SRM) parameters for tandem mass spectrometry analysis of target analytes, after Electrospray Ionization under positive mode (DP is the declustering potential; CE is the collision energy; CXP is the collision cell exit potential).; Table S2. Chromatographic parameters (retention time (tR), min), capacity (k) and selectivity factors (α) and resolution (Rs)) obtained for the (enantio)separation of the target fungicides in a solution of 10 mg L−1 of each, by LC-MS/MS on a Lux® 3 μm i-Cellulose 5 chromatographic column (150 × 2.0 mm, i.d.), under the reverse-elution mode, using different mobile phases (60/40 (v/v) of UPW/ACN (a); 60/40 (v/v) of aqueous 5 mM ammonium hydrogen carbonate/ACN (b); 60/40 (v/v) of UPW/ACN with 0.1% formic acid (c)), the column oven temperature set at 45 °C, a flow rate of 0.25 mL min−1 and an injection volume of 10 µL.; Table S3. Chromatographic parameters (retention time (tR), min), capacity (k) and selectivity factors (α) and resolution (Rs)) obtained for the (enantio)separation of the target fungicides in a solution of 10 mg L−1 of each, by LC-MS/MS on a Lux® 3 μm i-Cellulose 5 chromatographic column (150 × 2.0 mm, i.d.), under the reverse-elution mode, using different proportions (v/v) of aqueous 5 mM ammonium hydrogen carbonate and ACN (v/v) the in mobile phase (55/45 (a); 60/40 (b); 65/45 (c); 70/30 (d)), the column oven temperature set at 45 °C, a flow rate of 0.25 mL min−1 and an injection volume of 10 µL.; Table S4. Chromatographic parameters (retention time (tR), min), capacity (k) and selectivity factors (α) and resolution (Rs)) obtained for the (enantio)separation of the target fungicides in a solution of 10 mg L−1 of each, by LC-MS/MS on a Lux® 3 μm i-Cellulose 5 chromatographic column (150 × 2.0 mm, i.d.), under the reverse-elution mode, using a mobile phase composed of 60/40 (v/v) of aqueous 5 mM ammonium hydrogen carbonate/ACN, a flow rate of 0.25 mL min−1, an injection volume of 10 µL, and the following oven column temperatures: 22 °C (a); 25 °C (b); 35 °C (c), and 45 °C (d).; Table S5. Chromatographic parameters (retention time (tR), min), capacity (k) and selectivity factors (α) and resolution (Rs)) obtained for the (enantio)separation of the target fungicides in a solution of 10 mg L−1 of each, by LC-MS/MS on a Lux® 3 μm i-Cellulose 5 chromatographic column (150 × 2.0 mm, i.d.), under the reverse-elution mode, using different proportions (v/v) of aqueous 5 mM ammonium hydrogen carbonate/ACN (55/45 (a); 60/40 (b); 65/45 (c)), the column oven temperature set at 25 °C, a flow rate of 0.25 mL min−1 and an injection volume of 10 µL.; Table S6. Chromatographic parameters (retention time (tR) (min), capacity (k) and selectivity factors (α) and resolution (Rs)) obtained for the (enantio)separation of the target fungicides in a solution of 10 mg L−1 of each, by LC-MS/MS on a Lux® 3 μm i-Cellulose 5 chromatographic column (150 × 2.0 mm, i.d.), under the reverse-elution mode, using a mobile phase composed by 65/35 (v/v) of aqueous 5 mM ammonium hydrogen carbonate/ACN, the column oven temperature set at 25 °C, an injection volume of 10 µL, under different flow rates: 0.25 mL min−1 (a); 0.30 mL min−1 (b); 0.35 mL min−1 (c) and 0.40 mL min−1 (d).; Table S7. Experimental conditions applied in the solid-phase extraction (SPE) procedure, indicating the solvents and volumes used in each step (sample pH, column conditioning, washing, and elution).; Table S8. Retention time, range, coefficient of determination (r2), instrumental (IDL and IQL) and method (MDL and MQL) limits for fluconazole and the enantiomers/stereoisomers of the chiral 5 target fungicides.; Table S9. Diastereoisomeric fraction of metconazole and ipconazole.; Table S10. Absolute recovery, extraction efficiency, matrix effect, accuracy, and intra- and inter-batch precision for fluconazole and each enantiomer of the chiral target fungicides.; Table S11. Concentration of each compound in each sample (numbered from 1 to 13), with those not detected referred as ND.; Table S12. Hazard quotient of each compound for adults in each sample (numbered from 1 to 13), with those not detected referred as ND, without expected risk. HQs for the 6 target fungicides (for chiral fungicides, HQ was estimated for the sum of stereoisomeric concentrations) are represented for those compounds detected, where HQ values below 0.1 indicate no expected adverse effect (green). Hazard index (HI) of each sample, sum of the HQs of each compound present in each sample.; Table S13. Hazard quotient of each compound for children in each sample (numbered from 1 to 13), with those not detected referred as ND, without expected risk. HQs for the 6 target fungicides (for chiral fungicides, HQ was estimated for the sum of stereoisomeric concentrations) are represented for those compounds detected, where HQ values below 0.1 indicate no expected adverse effect (green). Hazard index (HI) of each sample, sum of the HQs of each compound present in each sample.

Author Contributions

B.S.: Writing—original draft, data curation, visualization, investigation, formal analysis; J.A.M.: Investigation; M.O.B.: Writing—review and editing, methodology, visualization, conceptualization; A.M.G.: Writing—review and editing, methodology, visualization, conceptualization; M.E.T.: Writing—review and editing, validation, funding acquisition; C.R.: Writing—review and editing, validation, supervision, project administration, funding acquisition, conceptualization; A.R.L.R.: Writing—review and editing, validation, supervision, project administration, funding acquisition, conceptualization. All authors have read and agreed to the published version of the manuscript.

Funding

This work was supported by Project ERA-ARE (ERC-2021-STG) funded by the European Commission under the Grant Agreement 101039270 of European Research Council Executive Agency. Views and opinions expressed are however those of the author(s) only and do not necessarily reflect those of the European Union or ERC Executive Agency. Neither the European Union nor the granting authority can be held responsible for them. This work was also supported by national funds through the Fundação para a Ciência e a Tecnologia (FCT), I.P. MECI(PIDDAC), under the project 2022.02842.PTDC—STAR—STereoselective environmental processes in Antibiotics: role for Resistance, with DOI 10.54499/2022.02842.PTDC (https://doi.org/10.54499/2022.02842.PTDC). This research was also supported by FCT I.P./MECI through national funds: LSRE-LCM, UID/50020/2025 (DOI: 10.54499/UID/50020/2025); ALiCE, LA/P/0045/2020 (DOI: 10.54499/LA/P/0045/2020); UID/04378/2025 (DOI: 10.54499/UID/04378/2025), and UID/PRR/04378/2025 (DOI: 10.54499/UID/PRR/04378/2025), of the Research Unit on Applied Molecular Biosciences—UCIBIO and the project LA/P/0140/2020 (DOI: 10.54499/LA/P/0140/2020)—i4HB. This work was also supported through the annual funding of 1H-TOXRUN (IUCS-CESPU). ARLR and MOB acknowledge the FCT funding 2022.00184.CEECIND, with DOI 10.54499/2022.00184.CEECIND/CP1733/CT0001 and 2023.07147.CEECIND, with DOI 10.54499/2023.07147.CEECIND/CP2834/CT0003, respectively.

Data Availability Statement

The original contributions presented in this study are included in the article/Supplementary Material. Further inquiries can be directed to the corresponding authors.

Conflicts of Interest

The authors declare no conflicts of interest.

Abbreviations and Acronyms List

ACN—Acetonitrile; AR—Absolute recovery; BW—Body weight; CEC—Contaminant of Emerging Concern; DW—Drinking water; DWTPs—Drinking water treatment plants; EWI—Estimated weekly intake; EE—Extraction efficiency; EF—Enantiomeric fraction; EtOH—Ethanol; f—preconcentration factor; FLZ-d4—Fluconazole-d4; HI—Hazard index; HQ—Hazard quotient; IDL—Instrumental detection limit; IQL—Instrumental quantification limit; LB—Lower bound; LC –Liquid Chromatography; MDL—Method detection limit; ME—Matrix effect; MeOH—Methanol; MQL—Method quantification limit; MS—Mass Spectrometry; PEN-d7—Penconazole-d7; PTFE—Polytetrafluoroethylene; QC—Quality control; RfD—Reference dose considered; RSD—Relative standard deviation; SPE—Solid-Phase Extraction; UB—Upper bound; UPW—Ultrapure water; WWTPs—Wastewater Treatment Plants.

References

  1. Dong, Z.; Cui, K.; Liang, J.; Guan, S.; Fang, L.; Ding, R.; Wang, J.; Li, T.; Zhao, S.; Wang, Z. The widespread presence of triazole fungicides in greenhouse soils in Shandong Province, China: A systematic study on human health and ecological risk assessments. Environ. Pollut. 2023, 328, 121637. [Google Scholar] [CrossRef]
  2. Gorito, A.M.; Mota, B.R.; Silva, A.M.T.; Ribeiro, A.R.L. SPE-LC-MS/MS optimisation using response surface methodology for quantification of pharmaceuticals, pesticides and organic UV filters included in water protection guidelines. J. Chromatogr. A 2025, 1756, 466052. [Google Scholar] [CrossRef]
  3. Wang, Y.; Wan, Y.; Li, S.; He, Z.; Xu, S.; Xia, W. Occurrence, spatial variation, seasonal difference, and risk assessment of neonicotinoid insecticides, selected agriculture fungicides, and their transformation products in the Yangtze River, China: From the upper to lower reaches. Water Res. 2023, 247, 120724. [Google Scholar] [CrossRef]
  4. Zhang, H.; Shen, N.; Li, Y.; Hu, C.; Yuan, P. Source, transport, and toxicity of emerging contaminants in aquatic environments: A review on recent studies. Environ. Sci. Pollut. Res. Int. 2023, 30, 121420–121437. [Google Scholar] [CrossRef]
  5. Liu, J.; Xia, W.; Wan, Y.; Xu, S. Azole and strobilurin fungicides in source, treated, and tap water from Wuhan, central China: Assessment of human exposure potential. Sci. Total Environ. 2021, 801, 149733. [Google Scholar] [CrossRef]
  6. Barbosa, M.O.; Ribeiro, A.R.; Pereira, M.F.R.; Silva, A.M.T. Eco-friendly LC–MS/MS method for analysis of multi-class micropollutants in tap, fountain, and well water from northern Portugal. Anal. Bioanal. Chem. 2016, 408, 8355–8367. [Google Scholar] [CrossRef]
  7. Wada, O.Z.; Olawade, D.B. Recent occurrence of pharmaceuticals in freshwater, emerging treatment technologies, and future considerations: A review. Chemosphere 2025, 374, 144153. [Google Scholar] [CrossRef] [PubMed]
  8. McNeill, K.S.; Cancilla, D.A. Detection of triazole deicing additives in soil samples from airports with low, mid, and large volume aircraft deicing activities. Bull. Environ. Contam. Toxicol. 2009, 82, 265–269. [Google Scholar] [CrossRef] [PubMed]
  9. Janna, H.; Scrimshaw, M.D.; Williams, R.J.; Churchley, J.; Sumpter, J.P. From dishwasher to tap? Xenobiotic substances benzotriazole and tolyltriazole in the environment. Environ. Sci. Technol. 2011, 45, 3858–3864. [Google Scholar] [CrossRef] [PubMed]
  10. Bhagat, J.; Singh, N.; Nishimura, N.; Shimada, Y. A comprehensive review on environmental toxicity of azole compounds to fish. Chemosphere 2021, 262, 128335. [Google Scholar] [CrossRef]
  11. Ji, C.; Song, Z.; Tian, Z.; Feng, Z.; Fan, L.; Shou, C.; Zhao, M. Enantioselectivity in the toxicological effects of chiral pesticides: A review. Sci. Total Environ. 2023, 857, 159656. [Google Scholar] [CrossRef]
  12. Zhu, J.; Ouyang, W.; Guo, Z.; Liu, X.; He, M.; Li, Q.; Liu, H.; Lin, C. Occurrence, spatiotemporal dynamics, and ecological risk of fungicides in a reservoir-regulated basin. Environ. Int. 2023, 171, 107697. [Google Scholar] [CrossRef]
  13. EU. COMMISSION IMPLEMENTING DECISION (EU) 2025/439 of 28 February 2025 establishing a watch list of substances for Union-wide monitoring in the field of water policy pursuant to Directive 2008/105/EC of the European Parliament and of the Council. Off. J. Eur. Union 2025. Available online: https://eurlex.europa.eu/eli/dec_impl/2025/439/oj (accessed on 28 January 2025).
  14. EU. COMMISSION IMPLEMENTING DECISION (EU) 2022/1307 of 22 July 2022 establishing a watch list of substances for Union-wide monitoring in the field of water policy pursuant to Directive 2008/105/EC of the European Parliament and of the Council. Off. J. Eur. Union 2022. Available online: http://data.europa.eu/eli/dec_impl/2022/1307/oj (accessed on 28 January 2025).
  15. Draskau, M.K.; Svingen, T. Azole Fungicides and Their Endocrine Disrupting Properties: Perspectives on Sex Hormone-Dependent Reproductive Development. Front. Toxicol. 2022, 4, 883254. [Google Scholar] [CrossRef]
  16. 16; European Food Safety Authority (EFSA); European Centre for Disease Prevention and Control (ECDC); European Chemicals Agency (ECHA); European Environment Agency (EEA); European Medicines Agency (EMA); European Commission’s Joint Research Centre (JRC). Impact of the use of azole fungicides, other than as human medicines, on the development of azole-resistant Aspergillus spp. EFSA J. 2025, 23, e9200. [Google Scholar] [CrossRef]
  17. Yan, J.; Chen, H.; Ji, Z.; Tang, Y.; Wang, S.; Zheng, J.; Li, H.; Li, L.; Ge, R.-S.; Dong, Y. Azole fungicides: Potential endocrine disrupting effects and impact on placental steroidogenesis via inhibiting human and rat 3β-hydroxysteroid dehydrogenase. Ecotoxicol. Environ. Saf. 2025, 300, 118471. [Google Scholar] [CrossRef]
  18. Kane, A.; Carter, D.A. Augmenting Azoles with Drug Synergy to Expand the Antifungal Toolbox. Pharmaceuticals 2022, 15, 482. [Google Scholar] [CrossRef] [PubMed]
  19. van Rhijn, N.; Rhodes, J. Evolution of antifungal resistance in the environment. Nat. Microbiol. 2025, 10, 1804–1815. [Google Scholar] [CrossRef]
  20. Bielská, L.; Hale, S.E.; Škulcová, L. A review on the stereospecific fate and effects of chiral conazole fungicides. Sci. Total Environ. 2021, 750, 141600. [Google Scholar] [CrossRef]
  21. Cui, N.; Xu, H.; Yao, S.; He, Y.; Zhang, H.; Yu, Y. Chiral triazole fungicide tebuconazole: Enantioselective bioaccumulation, bioactivity, acute toxicity, and dissipation in soils. Environ. Sci. Pollut. Res. Int. 2018, 25, 25468–25475. [Google Scholar] [CrossRef] [PubMed]
  22. Deng, Y.; Liu, R.; Wu, D.; Chen, L.; Zhang, W.; Wang, Z.; He, R.; Diao, J.; Zhou, Z. Stereoselective Physiological Effects of Metconazole on Seed Germination and Seedling Growth of Wheat. J. Agric. Food Chem. 2020, 68, 11672–11683. [Google Scholar] [CrossRef]
  23. Liu, H.; Liu, D.; Shen, Z.; Sun, M.; Zhou, Z.; Wang, P. Chiral separation and enantioselective degradation of vinclozolin in soils. Chirality 2014, 26, 155–159. [Google Scholar] [CrossRef]
  24. Chang, W.; Liu, M.; Ren, Q.; Shi, Z.; Wang, W.; Nie, J.; Cai, Z. Enantioselective behavior and bioactivity of chiral tebuconazole in apples. Food Control 2023, 153, 109941. [Google Scholar] [CrossRef]
  25. Li, L.; Huang, P.; Li, J. Enantioselective effects of the fungicide metconazole on photosynthetic activity in Microcystis flos-aquae. Ecotoxicol. Environ. Saf. 2021, 211, 111894. [Google Scholar] [CrossRef]
  26. Ribeiro, C.; Ribeiro, A.R.; Maia, A.S.; Tiritan, M.E. Occurrence of Chiral Bioactive Compounds in the Aquatic Environment: A Review. Symmetry 2017, 9, 215. [Google Scholar] [CrossRef]
  27. Suordem, B.; Gorito, A.M.; Barbosa, M.O.; Tiritan, M.E.; Ribeiro, C.; Ribeiro, A.R.L. Enantioselective Chromatographic Methods for Detection of Fungicides in Complex Environmental Matrices: Advances and Applications. Environments 2026, 13, 109. [Google Scholar] [CrossRef]
  28. Iancu, V.-I.; Chiriac, L.-F.; Paun, I.; Pirvu, F.; Dinu, C.; Kim, L.; Pascu, L.F.; Niculescu, M. Occurrence and distribution of azole antifungal agents in eight urban Romanian waste water treatment plants. Sci. Total Environ. 2024, 920, 170898. [Google Scholar] [CrossRef] [PubMed]
  29. European Medicines Agency. ICH Q2(R2) Guideline on Validation of Analytical Procedures; European Medicines Agency: Amsterdam, The Netherlands, 2024. [Google Scholar]
  30. Nieto-Juárez, J.I.; Sarzosa-Cano, N.R.; Serna-Galvis, E.A.; Torres-Palma, R.A.; Fabregat-Safont, D.; Botero-Coy, A.M.; Hernández, F. Evaluation of contaminants of emerging concern in surface waters (rivers and lake) from Peru: Occurrence and environmental risk assessment. Environ. Int. 2025, 200, 109522. [Google Scholar] [CrossRef] [PubMed]
  31. Dvorakova, D.; Jurikova, M.; Svobodova, V.; Parizek, O.; Kozisek, F.; Kotal, F.; Jeligova, H.; Mayerova, L.; Pulkrabova, J. Complex monitoring of perfluoroalkyl substances (PFAS) from tap drinking water in the Czech Republic. Water Res. 2023, 247, 120764. [Google Scholar] [CrossRef]
  32. European Commission. EU Pesticides Database—Active Substances. European Commission—Directorate-General for Health and Food Safety. 2025. Available online: https://ec.europa.eu/food/plant/pesticides/eu-pesticides-database/start/screen/active-substances (accessed on 20 December 2025).
  33. Khan, U.; Nicell, J. Human Health Relevance of Pharmaceutically Active Compounds in Drinking Water. AAPS J. 2015, 17, 558–585. [Google Scholar] [CrossRef]
  34. Yang, T.; Ge, F.; Hong, Y.; Wang, Y.; Zhou, G.; Chen, H.; Song, N.; Li, P. Fate and risk of pesticides in drinking water: From source to tap using a comprehensive analysis and prioritization approach. J. Environ. Sci. 2026, 161, 320–329. [Google Scholar] [CrossRef] [PubMed]
  35. Cai, Y.; Tian, T.; Huang, Y.; Yao, H.; Qi, X.; Fan, J.; Kuang, Y.; Chen, J.; Li, X.; Kadokami, K. Occurrence and Health Risks of Organic Micropollutants in Tap Water in Dalian. Chem. Res. Toxicol. 2023, 36, 1938–1946. [Google Scholar] [CrossRef] [PubMed]
  36. Maia, A.S.; Paíga, P.; Delerue-Matos, C.; Castro, P.M.L.; Tiritan, M.E. Quantification of fluoroquinolones in wastewaters by liquid chromatography-tandem mass spectrometry. Environ. Pollut. 2020, 259, 113927. [Google Scholar] [CrossRef]
  37. Luo, M.; Liu, D.; Zhou, Z.; Wang, P. A new chiral residue analysis method for triazole fungicides in water using dispersive liquid-liquid microextraction (DLLME). Chirality 2013, 25, 567–574. [Google Scholar] [CrossRef]
  38. Wang, Z.; Wang, X.; Li, S.; Jiang, Z.; Guo, X. Magnetic solid-phase extraction based on carbon nanosphere@Fe3O4 for enantioselective determination of eight triazole fungicides in water samples. Electrophoresis 2019, 40, 1306–1313. [Google Scholar] [CrossRef]
  39. Wattanayon, R.; Kasprzyk-Hordern, B. A multi-residue chiral liquid chromatography coupled with tandem mass spectrometry method for analysis of antifungal agents and their metabolites in aqueous environmental matrices. Anal. Methods 2021, 13, 2466–2477. [Google Scholar] [CrossRef] [PubMed]
  40. He, R.; Fan, J.; Tan, Q.; Lai, Y.; Chen, X.; Wang, T.; Jiang, Y.; Zhang, Y.; Zhang, W. Enantioselective determination of metconazole in multi matrices by high-performance liquid chromatography. Talanta 2018, 178, 980–986. [Google Scholar] [CrossRef]
  41. Shen, Y.; Yao, X.; Jin, S.; Yang, F. Enantiomer/stereoisomer-specific residues of metalaxyl, napropamide, triticonazole, and metconazole in agricultural soils across China. Environ. Monit. Assess. 2021, 193, 773. [Google Scholar] [CrossRef]
  42. Yao, X.; Yang, F.; Liu, W.; Jin, S. Determination of Four Chiral Pesticides in Soil by QuEChERS-Ultra Performance Liquid Chromatography-Tandem Mass Spectrometry. Wuhan Univ. J. Nat. Sci. 2018, 23, 369–375. [Google Scholar] [CrossRef]
  43. Chen, J.H.; Wang, H.L.; Guo, B.Y.; Li, J.Z. LC-MS/MS method for simultaneous determination of myclobutanil, hexaconazole, diniconazole, epoxiconazole and tetraconazole enantiomers in soil and earthworms. Int. J. Environ. Anal. Chem. 2014, 94, 791–800. [Google Scholar] [CrossRef][Green Version]
  44. Li, J.; Dong, F.; Xu, J.; Liu, X.; Li, Y.; Shan, W.; Zheng, Y. Enantioselective determination of triazole fungice tetraconazole by chiral high-performance liquid chromatography and its application to pharmacokinetic study in cucumber, muskmelon, and soils. Chirality 2012, 24, 294–302. [Google Scholar] [CrossRef] [PubMed]
  45. Tong, Z.; Dong, X.; Yang, S.; Sun, M.; Gao, T.; Duan, J.; Cao, H. Enantioselective effects of the chiral fungicide tetraconazole in wheat: Fungicidal activity and degradation behavior. Environ. Pollut. 2019, 247, 1–8. [Google Scholar] [CrossRef]
  46. Fan, J.; Li, P.; Zhao, F.; Zheng, L.; Wang, P.; Liu, D.; Zhou, Z.; Liu, X. Enantioseparation, bioactivity, environmental fate and toxicity of chiral triazole fungicide ipconazole in soil and earthworm. J. Hazard. Mater. 2025, 485, 136921. [Google Scholar] [CrossRef]
  47. Montagner, C.C.; Vidal, C.; Acayaba, R.D.; Jardim, W.F.; Jardim, I.C.S.F.; Umbuzeiro, G.A. Trace analysis of pesticides and an assessment of their occurrence in surface and drinking waters from the State of São Paulo (Brazil). Anal. Methods 2014, 6, 6668–6677. [Google Scholar] [CrossRef]
  48. Whitten, J.; Mahmood, T.H.; Jeannotte, T.L. Pesticide presence and distribution in a cold region agricultural basin. Sci. Total Environ. 2025, 1000, 180477. [Google Scholar] [CrossRef]
  49. von Ameln Lovison, O.; Jank, L.; de Souza, W.M.; Ramalho Guerra, R.; Lamas, A.E.; da Costa Ballestrin, R.A.; da Silva Morais Hein, C.; da Silva, T.C.B.; Corção, G.; Martins, A.F. Identification of pesticides in water samples by solid-phase extraction and liquid chromatography–electrospray ionization mass spectrometry. Water Environ. Res. 2021, 93, 2670–2680. [Google Scholar] [CrossRef] [PubMed]
Figure 1. Uses, distribution and potential impact of fungicides in the environment.
Water 18 00680 g001
Figure 2. Approximate sampling sites in Portugal (numbered 1–13 in the order of collection).
Water 18 00680 g002
Figure 3. LC-MS/MS chromatograms of a solution of 10 mg L−1 of each target analyte, obtained in a column Lux® 3 µm i-Cellulose 5 chromatographic column (150 × 2.0 mm, i.d.), using a mobile phase composed of 25/75 (v/v) of UPW/ACN (a), or 40/60 (v/v) of UPW/ACN (b), the column temperature set at 30 °C, a flow rate of 0.20 mL min−1 and an injection volume of 10 µL.
Water 18 00680 g003
Figure 4. LC-MS/MS chromatograms of a solution of 10 mg L−1 of each target analyte, obtained in a column Lux® 3 µm i-Cellulose 5 chromatographic column (150 × 2.0 mm, i.d.), using different proportions (v/v) of aqueous 5 mM ammonium hydrogen carbonate/ACN in the mobile phase (55/45 (a); 60/40 (b); or 65/35 (c)), the column temperature set at 25 °C, a flow rate of 0.25 mL min−1 and an injection volume of 10 µL (details in Table S5).
Water 18 00680 g004
Figure 5. LC-MS/MS chromatograms of a solution of 10 mg L−1 of each target analyte, obtained in a column Lux® 3 µm i-Cellulose 5 chromatographic column (150 × 2.0 mm, i.d.), using a mobile phase composed of 65/35 (v/v) of aqueous 5 mM ammonium hydrogen carbonate/ACN, the column temperature set at 25 °C, an injection volume of 10 µL, under different flow rates: 0.25 mL min−1 (a); 0.30 mL min−1 (b); 0.35 mL min−1 (c); and 0.40 mL min−1 (d) (details in Table S6).
Water 18 00680 g005
Figure 6. Matrix effect (ME%) of fluconazole and each enantiomer of the chiral target fungicides, with the corresponding standard deviations illustrated as error bars (a); absolute recovery (AR%), and extraction efficiency (EE%) for fluconazole and each enantiomer of the chiral target fungicides (b) (details in Table S10).
Water 18 00680 g006
Figure 7. Accuracy with corresponding RSD for fluconazole and each enantiomer of the chiral target fungicides (a); intra- and inter-batch precision for each of fluconazole and each enantiomer of the chiral target fungicides (b) (details in Table S10). The red dotted lines are the limit values defined by international guidelines.
Water 18 00680 g007
Table 1. Nominal concentration in µg L−1 of the different target compounds and their respective enantiomers in the QC extracts, according to the 3 QC levels, considering the enantiomeric or diastereomeric fraction (n.a.—not applicable since the proportion in the commercial standards was too low).
AnalyteLowest LevelIntermediateHighest Level
Metconazole E1n.a.n.a.n.a.
Metconazole E2n.a.n.a.n.a.
Metconazole E35.3832.575.0
Metconazole E44.6226.963.7
Fluconazole10.060.0140
Tetraconazole E15.0030.070.0
Tetraconazole E25.0030.070.0
Ipconazole E14.2226.159.9
Ipconazole E24.2026.762.5
Ipconazole E3n.a.3.829.99
Ipconazole E4n.a.3.377.56
Tebuconazole E15.0030.070.0
Tebuconazole E25.0030.070.0
Penconazole E15.0030.070.0
Penconazole E25.0030.070.0
Table 2. Reference dose is considered for each substance.
AnalyteRfD (mg/kg BW/week)Reference
Metconazole0.07[32]
Fluconazole2.03[33]
Tetraconazole0.028[32]
Ipconazole0.105[32]
Tebuconazole0.21[34]
Penconazole0.21[32]
Table 3. Concentrations and detection frequencies of the six target fungicides in 13 DW samples collected from various water supply networks in Portugal.
AnalyteConcentration (ng L−1)EFFrequency
Metconazole E3<1.44 (MQL)-1/13
Metconazole E4<1.50 (MQL)-1/13
Fluconazole<0.05 (MQL)–4.03-10/13
Tetraconazole E1ND-0/13
Tetraconazole E2ND-0/13
Ipconazole E1ND-0/13
Ipconazole E2ND-0/13
Ipconazole E3ND-0/13
Ipconazole E4ND-0/13
Tebuconazole E1<1.67 (MQL)–71.40.51–0.556/13
Tebuconazole E2<1.69 (MQL)–65.7 6/13
Penconazole E1<1.12 (MQL)- 1/13
Penconazole E2<1.45 (MQL)-1/13
Table 4. HQs of the six fungicides detected in at least one DW sample.
AnalyteHQ (Adult)HQ (Children)
Metconazole0 to <<<0.10 to <<<0.1
Fluconazole0 to <<<0.10 to <<<0.1
Tetraconazole Not detected Not detected
Ipconazole Not detected Not detected
Tebuconazole 0 to <<<0.10 to <<<0.1
Penconazole0 to <<<0.10 to <<<0.1
Disclaimer/Publisher’s Note: The statements, opinions and data contained in all publications are solely those of the individual author(s) and contributor(s) and not of MDPI and/or the editor(s). MDPI and/or the editor(s) disclaim responsibility for any injury to people or property resulting from any ideas, methods, instructions or products referred to in the content.