


Abstract
Global urbanization is driving a rising demand for sand and gravel, which has intensified riverbed mining. This threatens fluvial stability, flood safety, and ecological integrity. Although previous studies have documented localized geomorphic and hydrological impacts, systematic assessments that integrate long-term incision trends, embankment stability mechanisms, and resource optimization under multiple objectives remain limited. In this study, we investigate the Wengang section of the Fu River (Jiangxi, China), a sediment-deficient river reach subjected to decades of intensive mining. Through the application of hydrosediment analysis, hydrodynamic modeling, geotechnical–hydrological–mechanical (GHM) simulations, and a dynamic optimization model, the sustained impacts of mining are quantified, and science-based management strategies are proposed. The results indicate that extensive excavation has resulted in irreversible riverbed incision, with a net volume increase of 12.97 × 10⁶ m3 between 2003 and 2023, far exceeding the natural sediment deposition volume (0.853 × 10⁶ m3). Although the overall longitudinal profile remains stable, localized flow velocities in the primary mining area are increased by 0.22–0.39 m/s. A GHM analysis identifies a critical safe distance of 13–14 m between pit edge and embankment toe and demonstrates that wide-shallow pit morphology is associated with reduced stability risk compared to narrow-deep pits. Based on these constraints, an economic optimization model incorporating flood safety and market demand is developed, yielding an optimal extraction plan for 2024–2028 with a total volume of 4.4848 million tons and an estimated revenue of 50.03 million USD. This study provides an integrated framework for assessing mining impacts and offers actionable strategies to support sustainable sediment management in vulnerable river systems.
1. Introduction
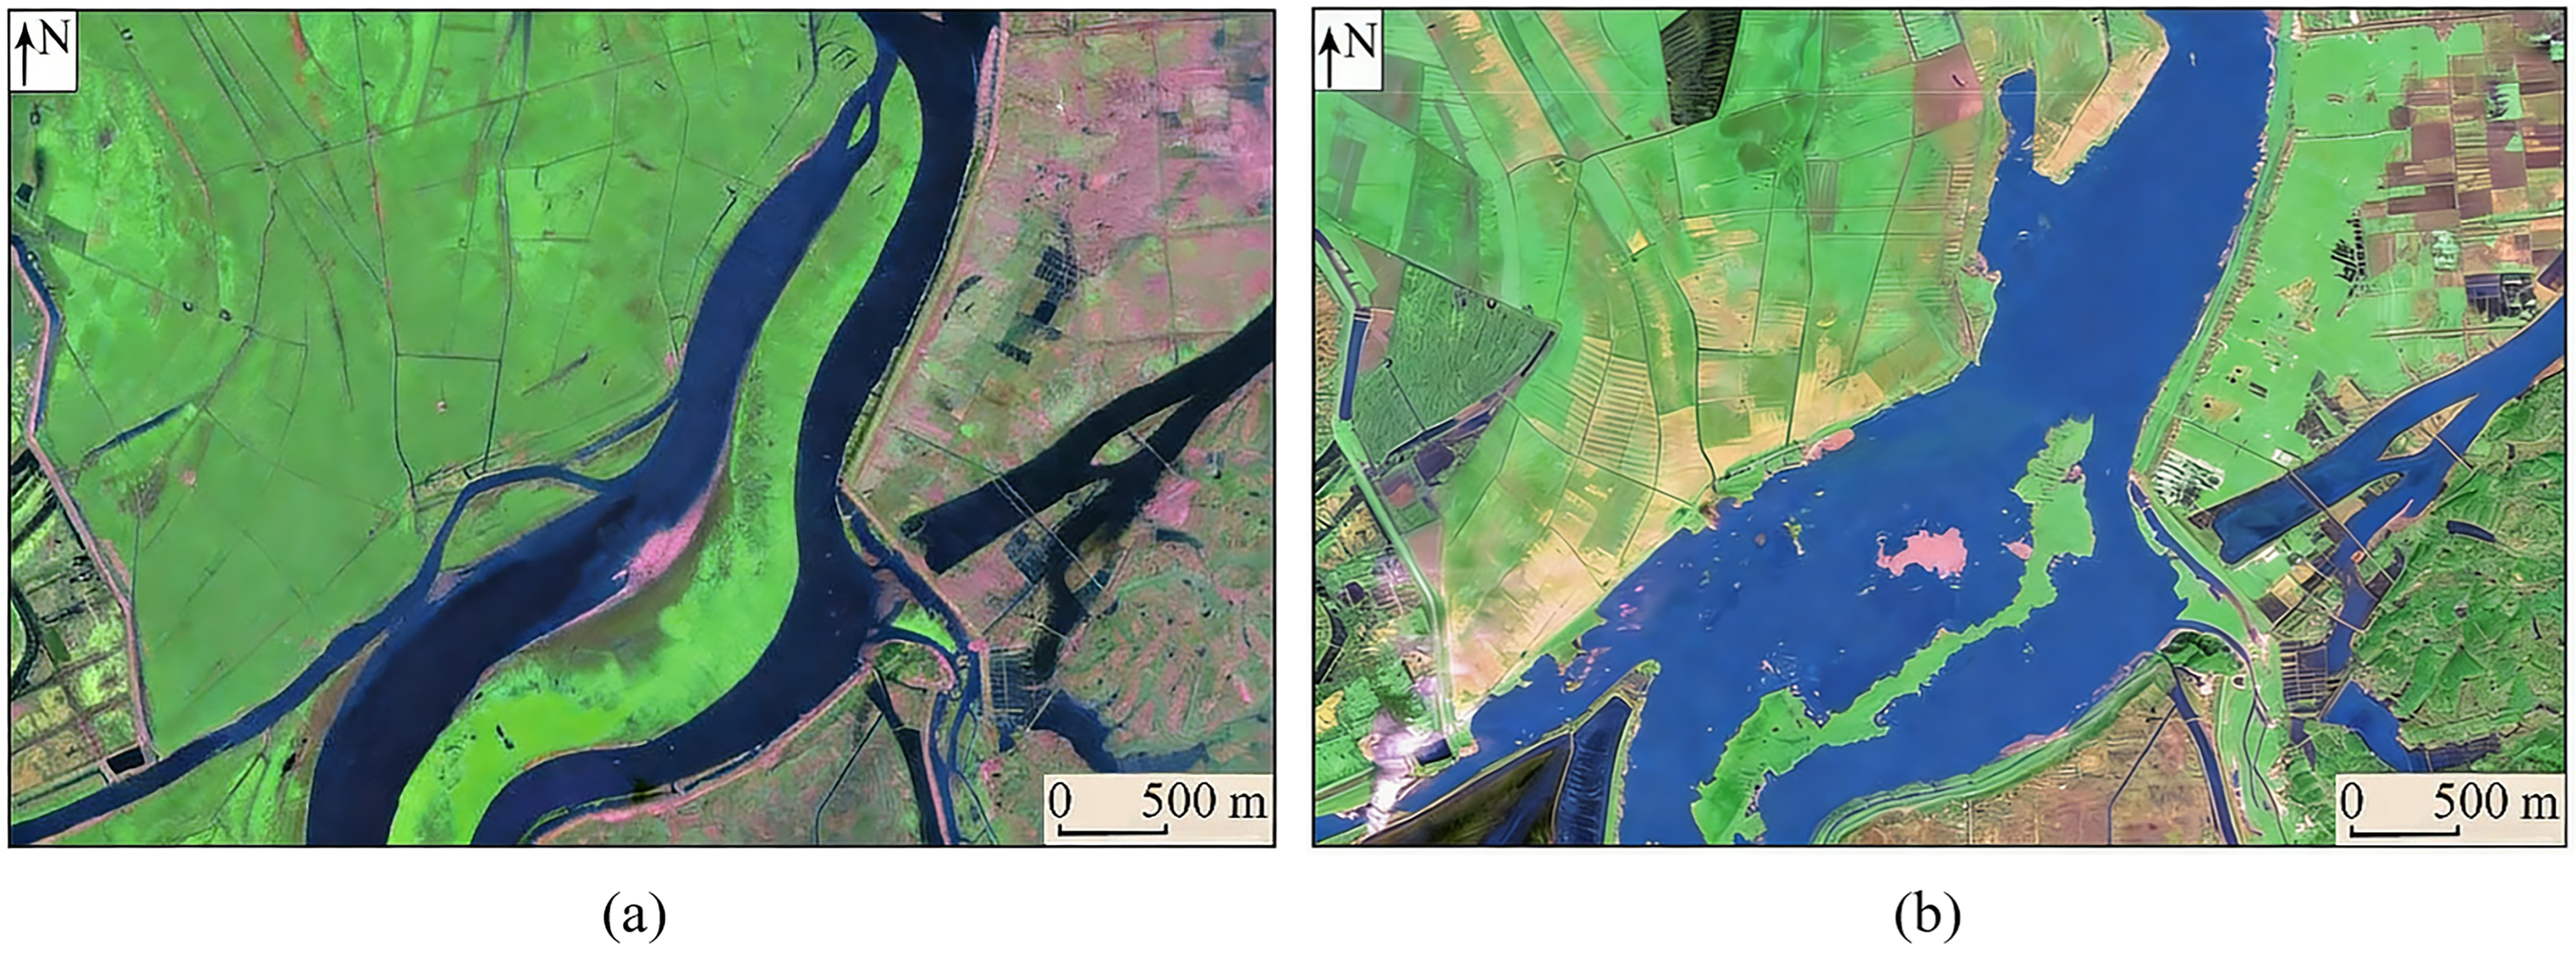
Urbanization and infrastructure expansion have driven a substantial increase in demand for sand and gravel resources. Rivers, a primary source of construction sand, are increasingly subjected to intensive and often inadequately regulated mining activities [1,2]. As shown in Figure 1, a striking quantitative case from Dongting Lake illustrates that illegal mining over a decade resulted in the extraction of approximately 73.31 million tons of sand and a consequent loss of 22.22 km2 of sandbar area [3]. This phenomenon has been documented globally, including major river systems such as the Mekong in Asia [4,5], rivers along the southwestern coast of India [6,7], multiple systems in China [8,9,10,11], and inland rivers [12,13,14,15]. Extensive extraction has been shown to fundamentally alter river morphology and fluvial processes, thereby triggering cascading risks to environmental degradation, ecological disruption, and engineering safety failures [16,17,18].
Figure 1.
Remote sensing images of the Piaoweizhou sandbar in Dongting Lake, China. (a) October 2006; (b) December 2016.
In-channel sand mining rapidly alters river systems by inducing riverbed incision and morphological change. Studies on the Fuchun River have shown that large-scale, unregulated extraction produced an excessively concave longitudinal bed profile [19], while investigations in the Huaihe River reported incision depths of up to 15 m [14]. In the Mekong Delta, mining activities in the Tien River were found to exacerbate bed erosion, with extraction pits exhibiting negligible natural recovery after mining cessation [4]. The combined influence of multiple drivers can further amplify these impacts; for example, reservoir operations and sand mining together have been shown to drive incision in the lower Minjiang River [15]. Such bed deformation extends beyond the main channel, disrupting sedimentary equilibrium in floodplains and deep pools, diverting thalwegs, and reshaping cross-sectional morphology, thereby perturbing hydrological regimes and local hydrodynamics. The hydrodynamic consequences of sand mining include reduced water levels, altered surface slopes, and modified flow distributions. In the lower Dongjiang River, substantial bed lowering induced by intensive mining has been linked to enhanced tidal dynamics and increased saltwater intrusion [9], while similar alterations in flow partitioning were identified in the Pearl River Delta [8]. In Poyang Lake, multi-year sand mining has been shown to exert cumulative effects on flow fields, water residence times, and outflow processes [10]. Numerical simulations in the Xiangjiang River have demonstrated that mining redistributes flow velocities, reduces flood levels, and alters distributary bifurcation ratios [13,20].
Among the various consequences of sand mining, threats to embankment and riverbank stability constitute the most direct and critical engineering concern for flood control systems. Recent studies have increasingly sought to quantify these risks. Laboratory experiments by Iqbal and Tanaka [21] demonstrated that a combined permeable dike with streamlined tapered piles reduced scour depth at critical locations by 43–65% compared with an impermeable structure, thus demonstrating the efficacy of specific design modifications in mitigating instability. Orthogonal experimental analyses by Wang et al. [22] demonstrated that the distance between mining pits and the embankment toe, together with pit depth, constitutes the dominant controlling factors for embankment stability. Numerical experiments by Yu et al. [23] have shown that, for equivalent extraction volumes, narrow and deep pits induce greater riverbed incision than wide, shallow configurations. From a sediment budget perspective, large-scale riverbank instability is likely to become inevitable when extraction volumes substantially exceed natural sediment supply, as documented in the Mekong River [24].
In light of the extensive negative impacts of sand mining, the development of sustainable management strategies has emerged as an international priority. Early research focused primarily on impact assessment and problem identification [6,7]. In recent years, the scholarly focus has progressively shifted toward the development of management frameworks and optimization methodologies. Ding et al. [25] and Yu et al. [26] have examined the foundational challenges and theoretical underpinnings of sustainable in-channel sand mining. Ojha and Choudhary [27] have proposed an environmentally sustainable extraction method based on GIS-supported sediment estimation, while Tran et al. [28] have developed a GPU-accelerated sediment transport model to evaluate the long-term effects of mining on riverbed evolution. At the policy and management level, Ali et al. [29] proposed a management framework comprising six strategic pillars. Leal Filho et al. [1] have systematically documented the unsustainable use of sand resources and called for enhanced regulation, monitoring, and international cooperation. Based on a thorough review of environmental impacts, Rentier and Cammeraat [18] outlined programmatic guidelines for achieving sustainable sand extraction at the global scale.
Unlike prior studies that often examine impacts in isolation, this study presents an integrated assessment and management framework for sand mining. It integrates analysis of river background characterization, multidimensional impact assessments of sand mining, and optimized management strategies. Specifically, this study investigates the Wengang section of the Fu River (WGR) in Jiangxi Province, China, as a representative sediment-deficient reach. By integrating water–sediment balance analysis, hydrodynamic numerical modeling, a geotechnical–hydrological–mechanical (GHM) framework, and a multi-constraint optimization model, this study aims to: (1) quantify the mechanisms and cumulative magnitude of long-term sand mining impacts on riverbed evolution, localized hydrodynamics, and embankment stability; (2) elucidate the roles of mining pit morphology and spatial proximity in governing riverbank stability; and (3) develop an economics-informed, dynamically optimized sand–gravel extraction strategy constrained by flood control safety and market demand, thereby providing actionable and quantitatively grounded guidance for sustainable river sediment management.
2. Materials and Methods
2.1. Study Area
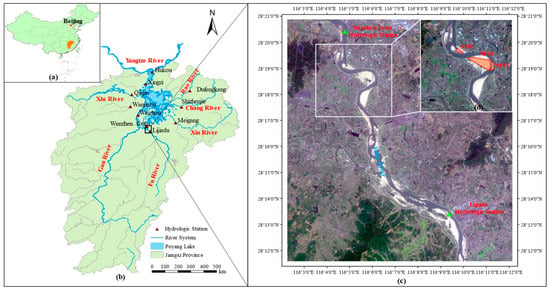
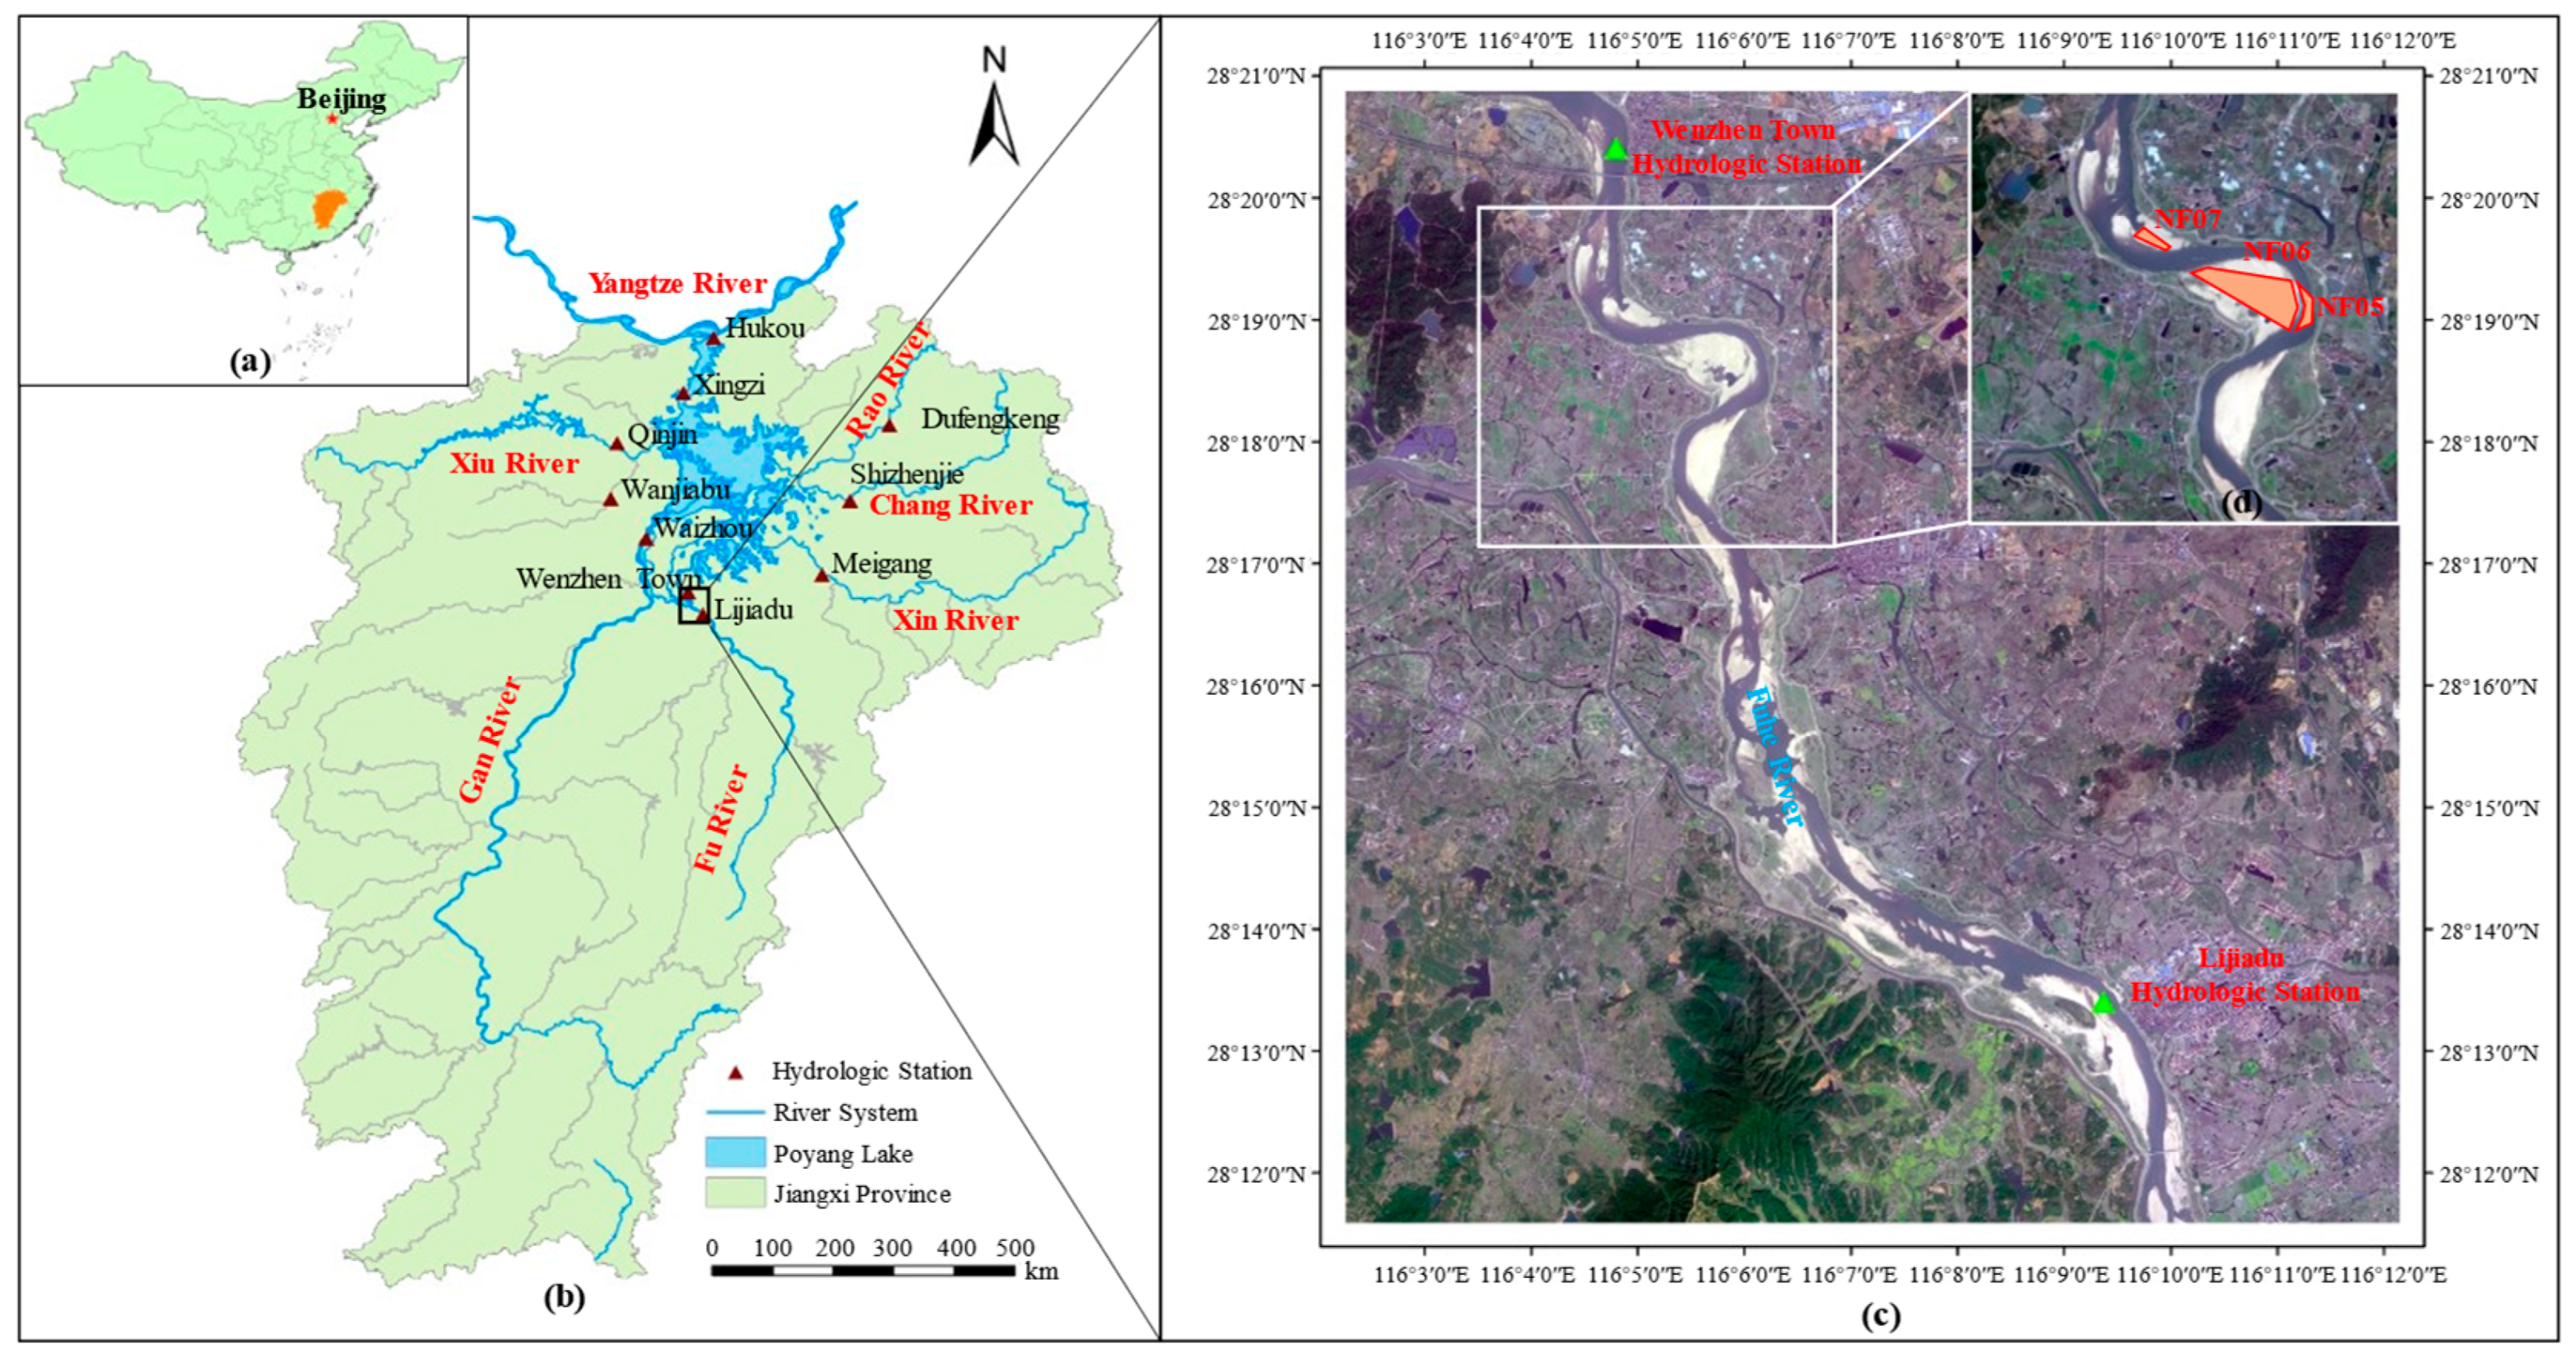
The Fu River is a major tributary of the Poyang Lake basin and one of the five principal rivers in Jiangxi Province, together with the Gan, Xin, Rao, and Xiu Rivers [30]. It is approximately 348 km in length and drains a catchment area of about 17,200 km2 (Figure 2a,b). This study focuses on the downstream Wengang section of the Fu River (28°17′ N–28°20′ N, 116°04′ E–116°07′ E), encompassing a 9.55 km-long channel reach (Figure 2c). The hydrological regime of this reach is monitored by the Lijiadu Hydrological Station (LHS) and Wenzhen Town Hydrological Station (WTHS), located approximately 7.91 km upstream and 2.03 km downstream of the study area, respectively. Hydrological and sediment data from these stations were used to define the inflow and sediment boundary conditions for the WGR [31]. Within the study area, three designated sand mining areas are present: Nanfu 05 (NF05), Nanfu 06 (NF06), and Nanfu 07 (NF07) (Figure 2d) [32]. Since the 1980s, intensive and often poorly regulated sand mining along the Fu River has induced profound alterations in riverbed morphology and local channel geometry. These changes pose persistent threats to channel stability, embankment integrity, and regional flood control capacity.
Figure 2.
(a) Geographical location of Jiangxi Province. (b) Geographical location of the WGR. (c) Satellite image of the WGR. (d) Distribution map of the sand mining areas in the WGR.
2.2. Data and Analysis
Hydrological and sediment records from the LHS and WTHS, measured topographic data of the WGR for 2003 and 2023, and historical records describing the relationship between sand-gravel extraction volumes and sales prices were obtained by the Jiangxi Academy of Water Science and Engineering.
2.2.1. Flow and Sediment Regime
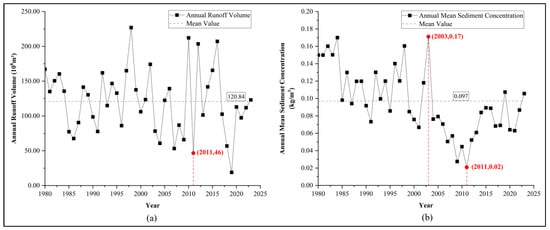
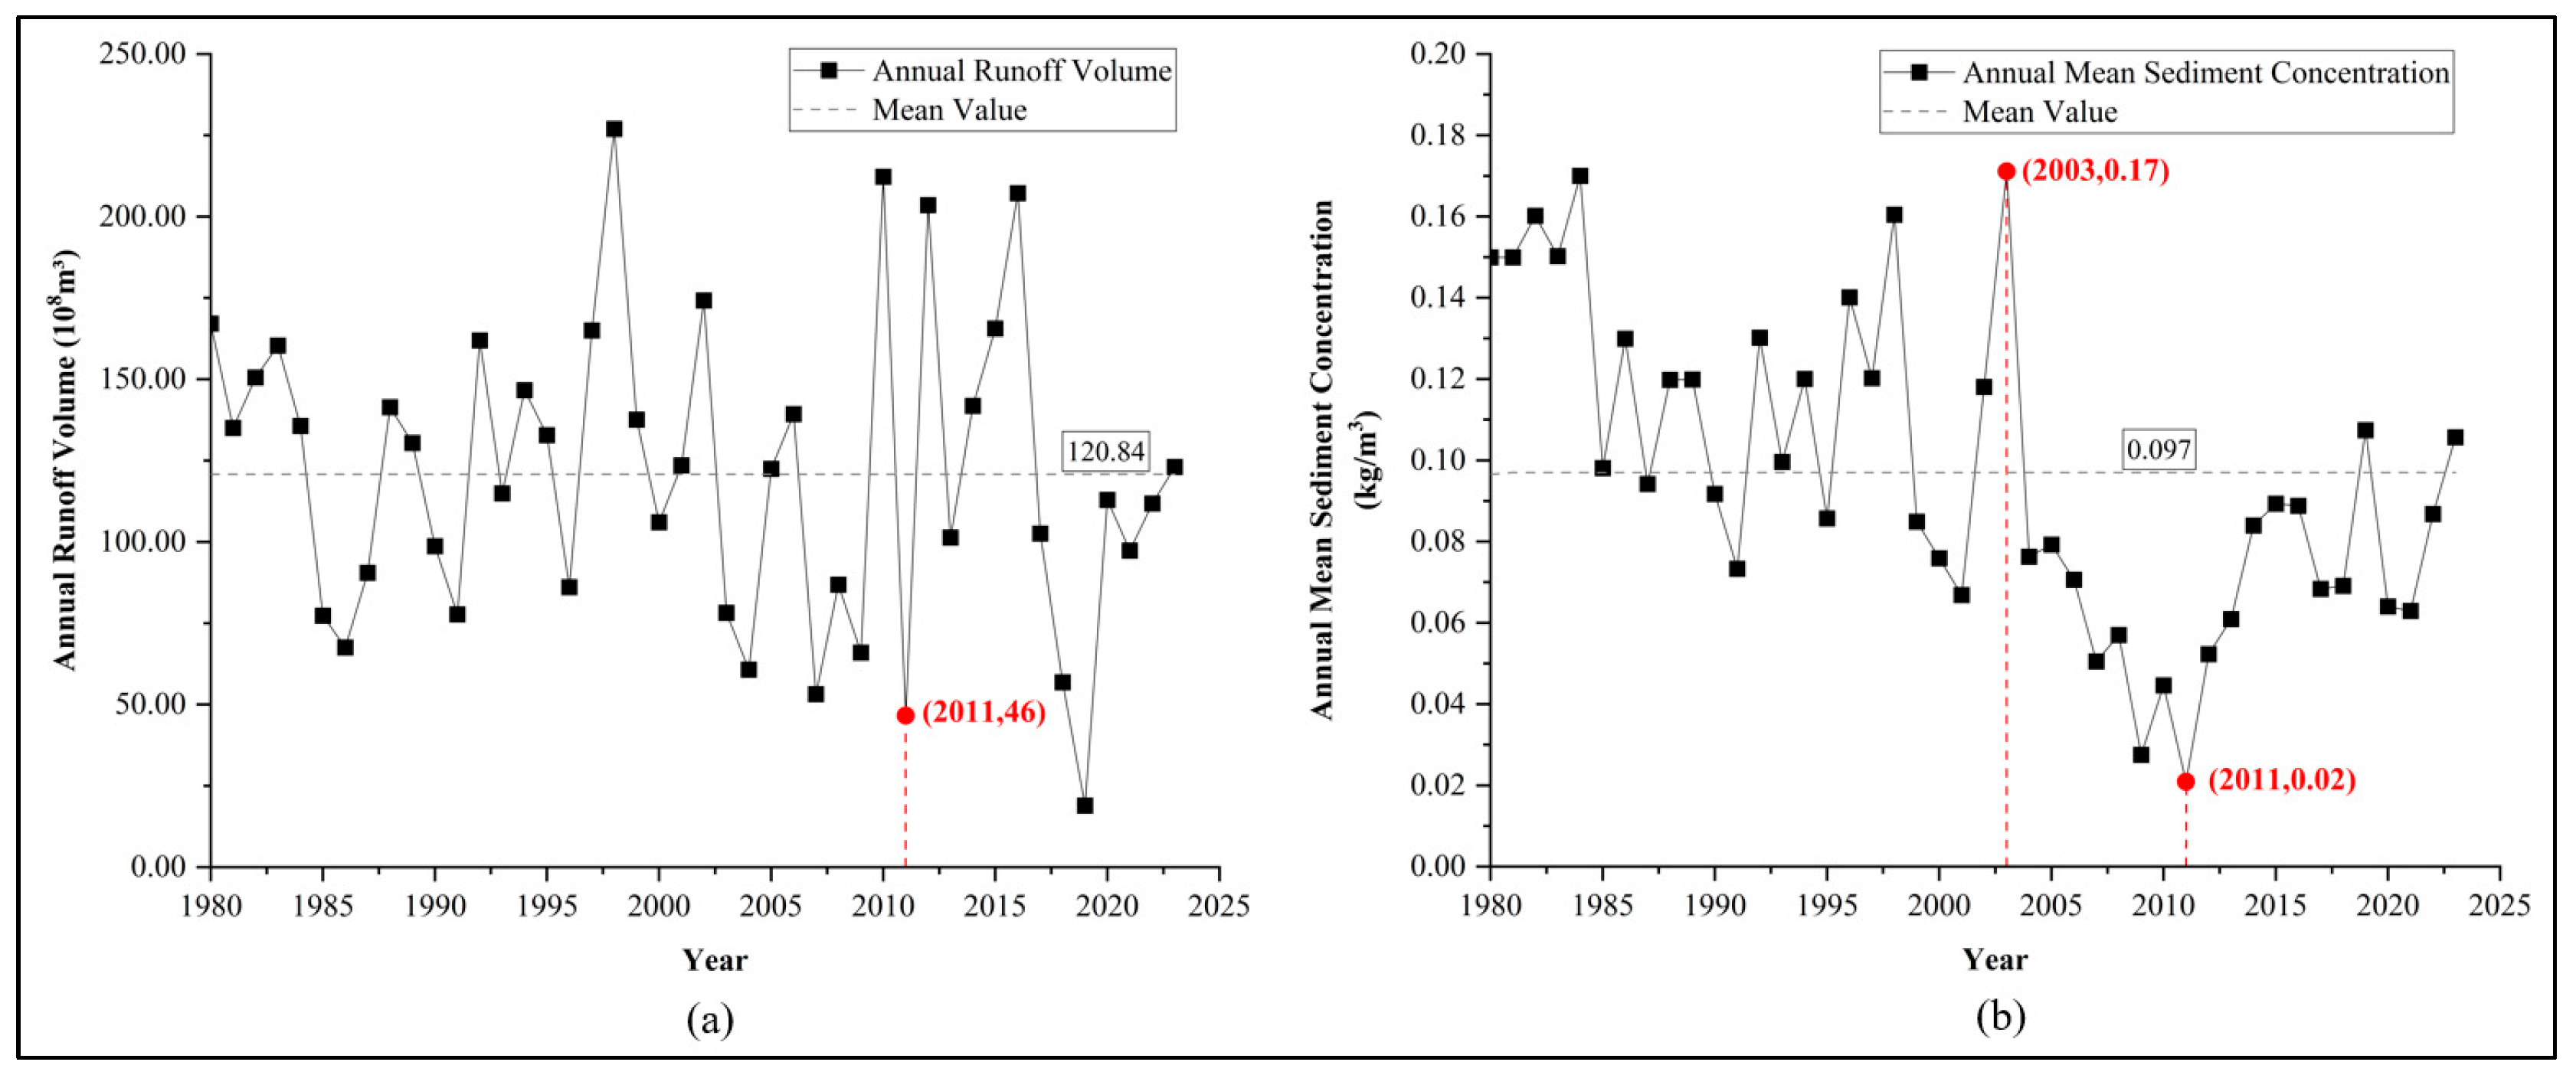
Hydrological and sediment data characterizing inflow conditions were obtained from the LHS, located approximately 7.91 km upstream of the WGR. Figure 3 shows temporal variations in annual runoff volume (ARV) and annual mean sediment concentration (AMSC) at LHS over the period 1980–2023. The long-term mean ARV was 12.084 billion m3, with a maximum of 22.697 billion m3 recorded in 1998 and a minimum of 1.897 billion m3 in 2019. Overall, interannual variability in ARV was characterized by stochastic fluctuations without a significant long-term trend. A pronounced decline in ARV was observed in 2011, primarily attributable to a severe regional drought in Jiangxi Province that resulted in historically low water levels in the Fu River and adjacent river systems. The long-term mean AMSC was 0.097 kg/m3. A pronounced decreasing trend in AMSC was observed after 2003, reaching a minimum value of 0.02 kg/m3 in 2011. This minimum was attributed to the combined effects of extreme drought conditions and intensive anthropogenic sand mining. Following the implementation of strengthened and standardized river sand mining regulations after 2012, the AMSC exhibited a clear recovery trend.
Figure 3.
(a) Changes in ARV at LHS from 1980 to 2023. (b) Changes in AMSC at LHS from 1980 to 2023.
Situated approximately 2.03 km downstream of the WGR, the WTHS provides hydrological and sediment data characterizing outflow conditions from the WGR. To analyze sediment transport within the WGR, a sediment budget analysis was conducted using observational data from 2003 to 2023. This analysis applied a simplified mass balance model. The model inherently assumes the absence of significant ungauged sediment sources or sinks between the two stations. For the studied reach, this assumption is supported by the absence of tributaries and the lack of documented large-scale bank collapse based on historical records. The measurement uncertainties associated with estimating annual sediment loads from discrete samples were not quantified herein. The results of the sediment budget calculations are presented in Table 1.
Table 1.
Time Series of ARV and AMSC at LHS and WTHS (2003–2023).
As summarized in Table 1, sediment budget calculations for the period 2003–2023 indicate a clear imbalance between the upstream and downstream control stations. At the LHS, the mean ARV was 10.971 billion m3, the mean AMSC was 0.0732 kg/m3, and the cumulative sediment load totaled 16.811 million tons. In comparison, the corresponding values at the WTHS were 10.551 billion m3, 0.070 kg/m3, and 15.526 million tons, respectively. Sediment inputs at the LHS exceeded outputs at the WTHS over the study period. Accordingly, the WGR was expected to experience a cumulative net sediment deposition of approximately 1.285 million tons, equivalent to about 0.853 million m3.
2.2.2. Topographic and Bathymetric Data
Based on measured topographic and bathymetric data acquired in 2003 and 2023, the evolution of the river regime and riverbed morphology in the WGR over two decades of sand mining was analyzed. The bathymetric data for 2003 originated from a field-surveyed 1:2000 scale topographic map (April 2003), while the 2023 data were derived from a 30-m resolution digital elevation model. All elevation data were unified to the National 1985 Height Datum to ensure vertical consistency. To construct the riverbed models, the Inverse Distance Weighting interpolation method was applied to interpolate elevation values onto the computational mesh. The reliability of the interpolated terrain was verified by cross-checking against a subset of original measured points, and any anomalies were corrected. To further enhance the accuracy of subsequent hydrodynamic modeling, field surveys were conducted within the simulation domain to precisely geolocate and determine the elevations of bridges and embankments. All topographic data were preprocessed, and features were extracted using ArcGIS 10.8 and AutoCAD 2021, providing reliable topographic inputs for constructing riverbed models representing pre- and post-mining conditions.
2.2.3. Current Status and Planning of Sand Mining
The riverbed within the WGR is predominantly composed of medium to coarse sand. Historically, sand mining has been concentrated within the floodplain areas of this reach. In recent years, rapid urbanization and infrastructure development have driven sustained market demand for sand and gravel, resulting in intensified mining activity. Excessive and inadequately regulated extraction has compromised riverbed stability and altered channel morphology. Field surveys indicate that slope gradients in parts of the NF05 have steepened to ratios as high as 1:5, posing a substantial threat to flood control safety. Accordingly, the scientific formulation and implementation of a rational extraction plan are of critical importance.
In response, the Jiangxi Provincial Government has implemented regulatory measures to standardize sand mining operations and promote sustainable use of riverine resources. The specific regulatory parameters governing extraction in the NF05, NF06, and NF07 within the WGR are summarized in Table 2 [33].
Table 2.
Regulatory Indicators for the Sand Mining Areas of WGR, 2024–2028.
As detailed in Table 2, the regulatory framework defines a total permissible sand extraction cap of 4.901 million tons across the three mining areas (NF05, NF06, NF07) within the WGR for the period 2024–2028, with an annual extraction limit of 1.0424 million tons. Among these, NF06 has the largest spatial extent, and its allocated extraction quota is substantially higher than those of NF05 and NF07.
2.3. Research Method
2.3.1. WGR Hydrodynamic Model for Analyzing Sand Mining Impacts on River Regime Evolution
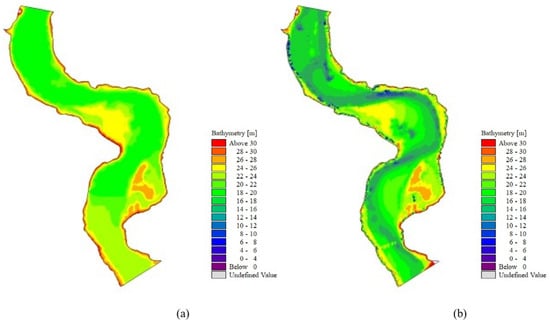
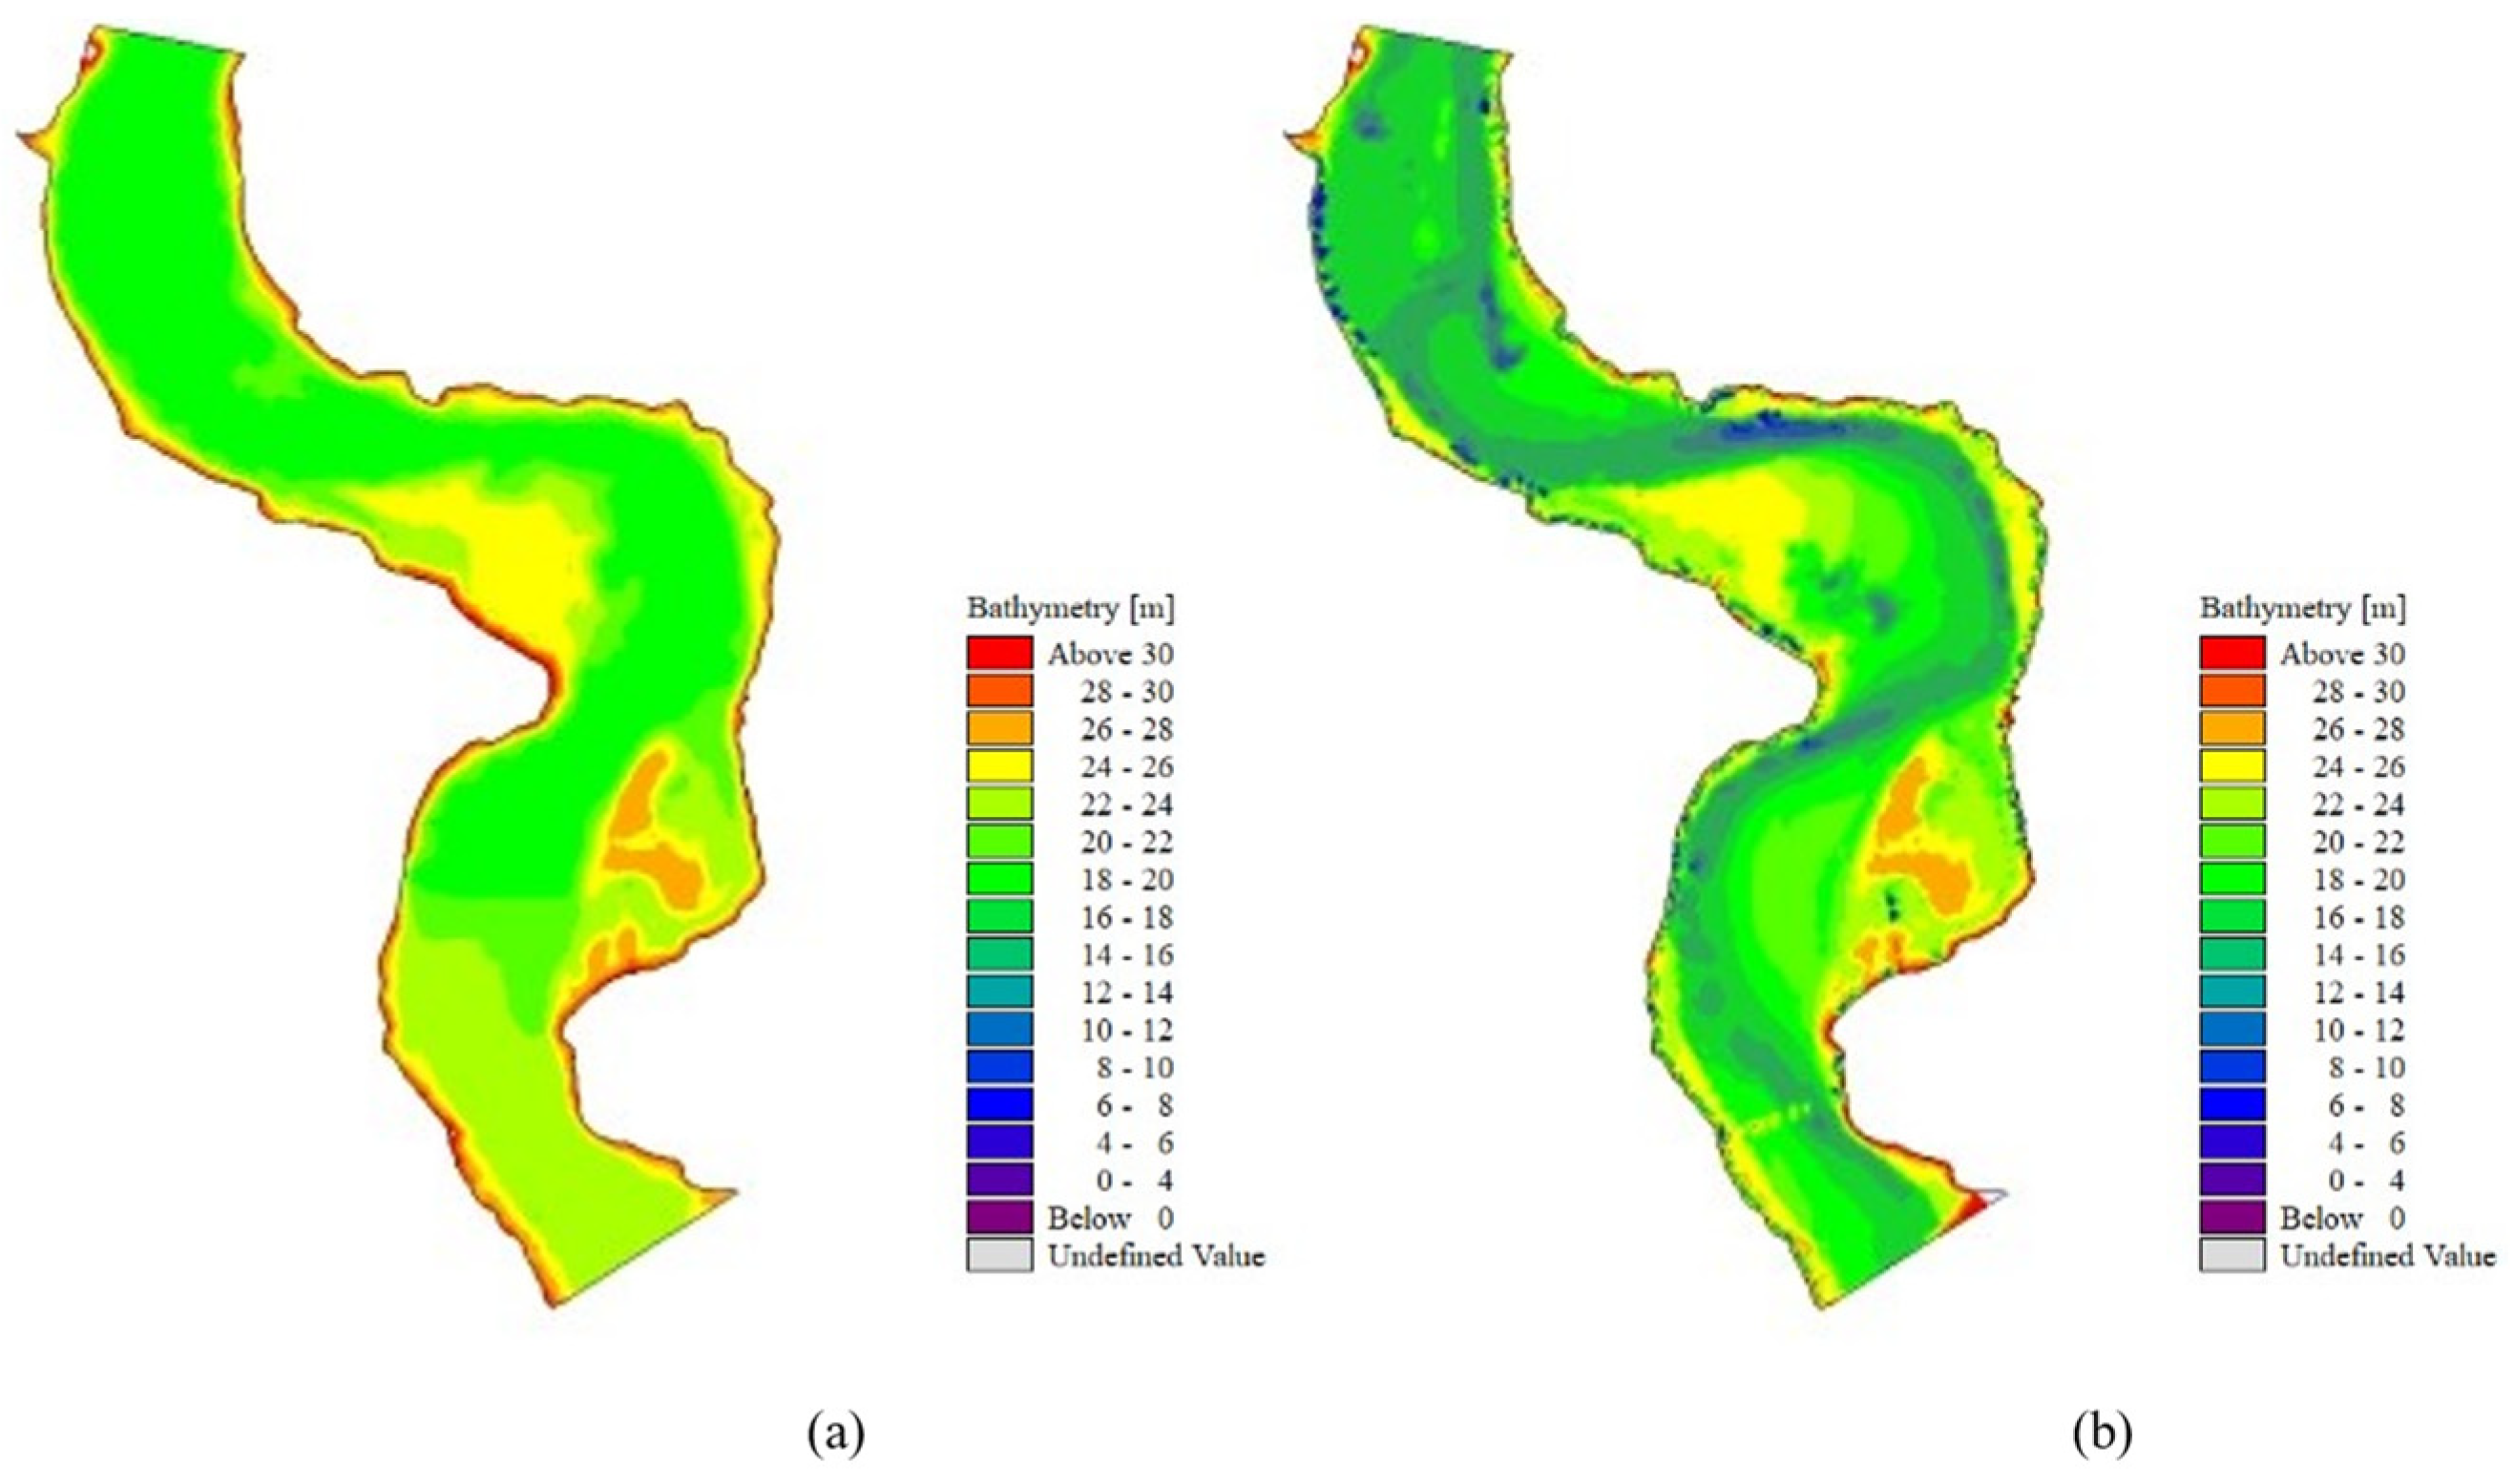
A two-dimensional hydrodynamic model of the WGR was developed using the DHI MIKE software suite 2014 to simulate river regime evolution under pre- and post-mining conditions. The model domain was discretized using an unstructured triangular mesh, with local refinement applied in areas of pronounced topographic variation. The final computational grid comprised 18,539 cells, with cell areas ranging from 16.4 to 3154 m2. Using preprocessed channel topographic data acquired in 2003 and 2023, terrain interpolation onto the hydrodynamic model grid was performed using the Inverse Distance Weighting interpolation method. The interpolated riverbed elevations were compared with measured bathymetric data, and unreasonable values were corrected to ensure consistency and accuracy. Based on the corrected terrain datasets, two hydrodynamic model configurations were established, representing pre-mining (WGRM-2003) and post-mining (WGRM-2023) conditions, as shown in Figure 4.
Figure 4.
(a) Hydrodynamic model of WGR based on terrain interpolation from 2003 (WGRM-2003). (b) Hydrodynamic model of WGR based on terrain interpolation from 2023 (WGRM-2023).
In the parameter configuration of the hydrodynamic model, parameters such as eddy viscosity, wind forcing, and tidal effects were either assigned default values or neglected [34]. The parameters adopted for the hydrodynamic model are summarized in Table 3. The Manning roughness coefficient ranged from 0.025 to 0.055 for the main channel and from 0.04 to 0.10 for the floodplain. One upstream monitoring point, one downstream monitoring point, and five internal monitoring points within the NF05, NF06, and NF07 areas were selected. Model performance was evaluated by comparing simulated water levels with measured values at these monitoring points during the July 2023 flood. The validation results are presented in Table 4, demonstrating the high accuracy and reliability of the model.
Table 3.
Model parameters.
Table 4.
Water Level Verification Metrics for the Hydrodynamic Model.
2.3.2. Methods for the Impact of Sand Mining on Riverbed Evolution Analysis
Based on the WGRM-2003 and WGRM-2023 models, the volume changes in WGR from 2003 to 2023 were analyzed by subtracting the elevation values for identical grid cells. The specific calculation formula is as follows.
where represents the volume changes in WGR; is the total number of grid cells, with = 18,539; is the area of the -th grid cell; is the elevation value of the -th grid cell for the year 2003; is the elevation value of the -th grid cell for the year 2023.
2.3.3. GHM Model for Assessing Sand Mining Impacts on Embankment Stability
To assess the impact of sand mining on embankment stability, a typical embankment cross-section within the WGR was selected for detailed geotechnical analysis. A GHM model was implemented using the Slope/W module of the Geo-Studio software suite 2018 [35]. This model was established to systematically evaluate the influence of two key sand mining parameters on embankment stability: (1) the horizontal distance between the excavation pit and the embankment toe, and (2) the morphological characteristics of the excavation pit.
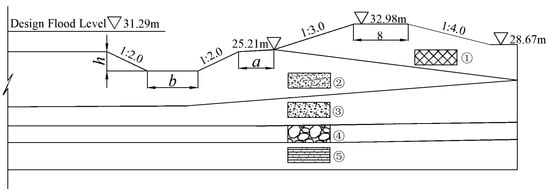
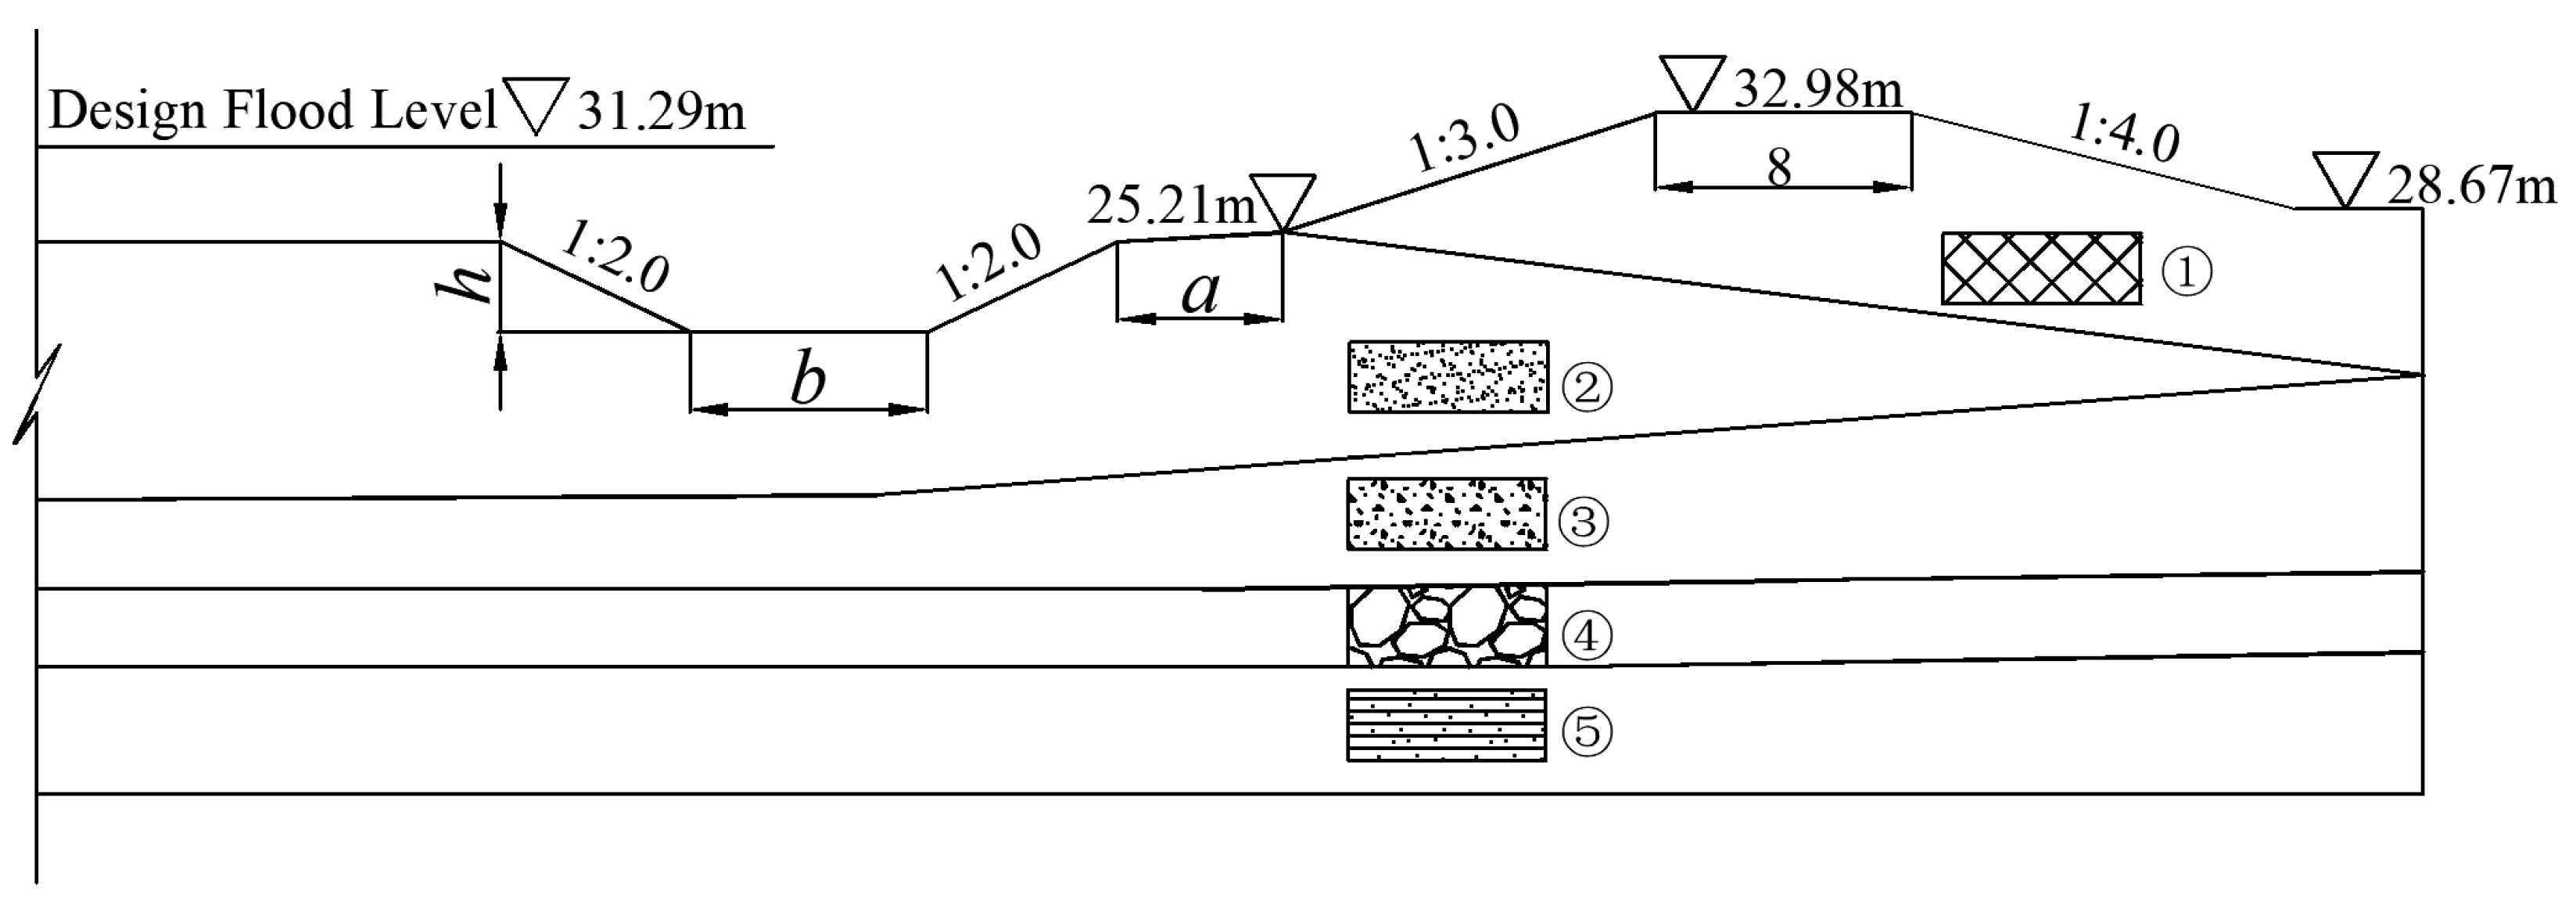
Model construction was conducted as follows. River flow was assumed to be steady-state, with the water level prescribed as the 50-year return period stage of 31.29 m. Based on available geotechnical survey data for the river channel and embankment materials, a generalized numerical cross-section was developed, as shown in Figure 5. The key geometric parameters characterizing the excavation pit relative to the embankment include: a, the horizontal distance from the pit edge to the embankment toe; h, the depth of the excavation pit; and b, the width of the pit.
Figure 5.
Schematic diagram of the model calculation cross-section.
The soil in each geological layer of the river channel and embankment was assumed to be homogeneous; thus, all materials within the same stratum were assigned identical mechanical properties. The corresponding mechanical parameters for each soil layer are summarized in Table 5 below.
Table 5.
Mechanical Property Parameters of Soil Layers.
In this study, mining pit morphology was categorized into two types: deep–narrow pits and shallow–wide pits. To ensure an identical extracted sediment volume for both morphologies, the deep–narrow pit was defined with a depth of 9 m and a width of 10 m, whereas the shallow–wide pit was defined with a depth of 6 m and a width of 30 m. For each pit morphology, the sliding stability safety factor of the embankment was calculated by systematically varying the horizontal distance between the excavation pit and the embankment toe.
2.3.4. Optimization Model for Sustainable Sand Mining
To promote the sustainable utilization of riverine sand and gravel resources, an economically oriented dynamic optimization model for sand–gravel extraction was developed, subject to strict constraints related to river flood control safety and market demand.
where represents the total revenue; denotes the actual extraction volume in the i-th year; represents the linear functional relationship between sales price and extraction volume; is the estimated extraction volume for the i-th year; is the extraction coefficient for the i-th year; the constraint indicates that the total extraction volume over the -year planning period must not exceed the permissible total extraction volume . The constraint specifies that the extraction volume in any single year within the -year planning period must fall between the annual maximum extraction volume and the annual minimum extraction volume . is a restriction coefficient; the constraint states that the combined extraction volume of two consecutive years within the planning period -year cannot exceed .
The model parameters and constraints were established based on officially released river sand mining planning documents, historical data describing the relationship between sand–gravel prices and extraction volumes, and the analytical results of this study regarding the impacts of sand mining on embankment safety.
2.3.5. Overall Technical Research Framework
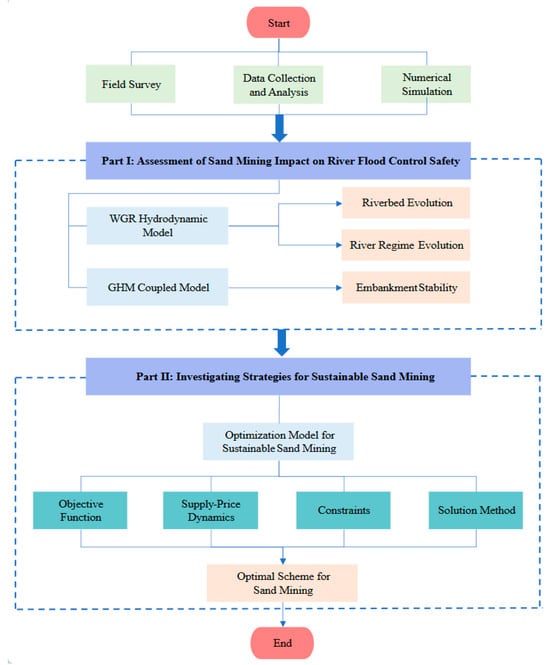
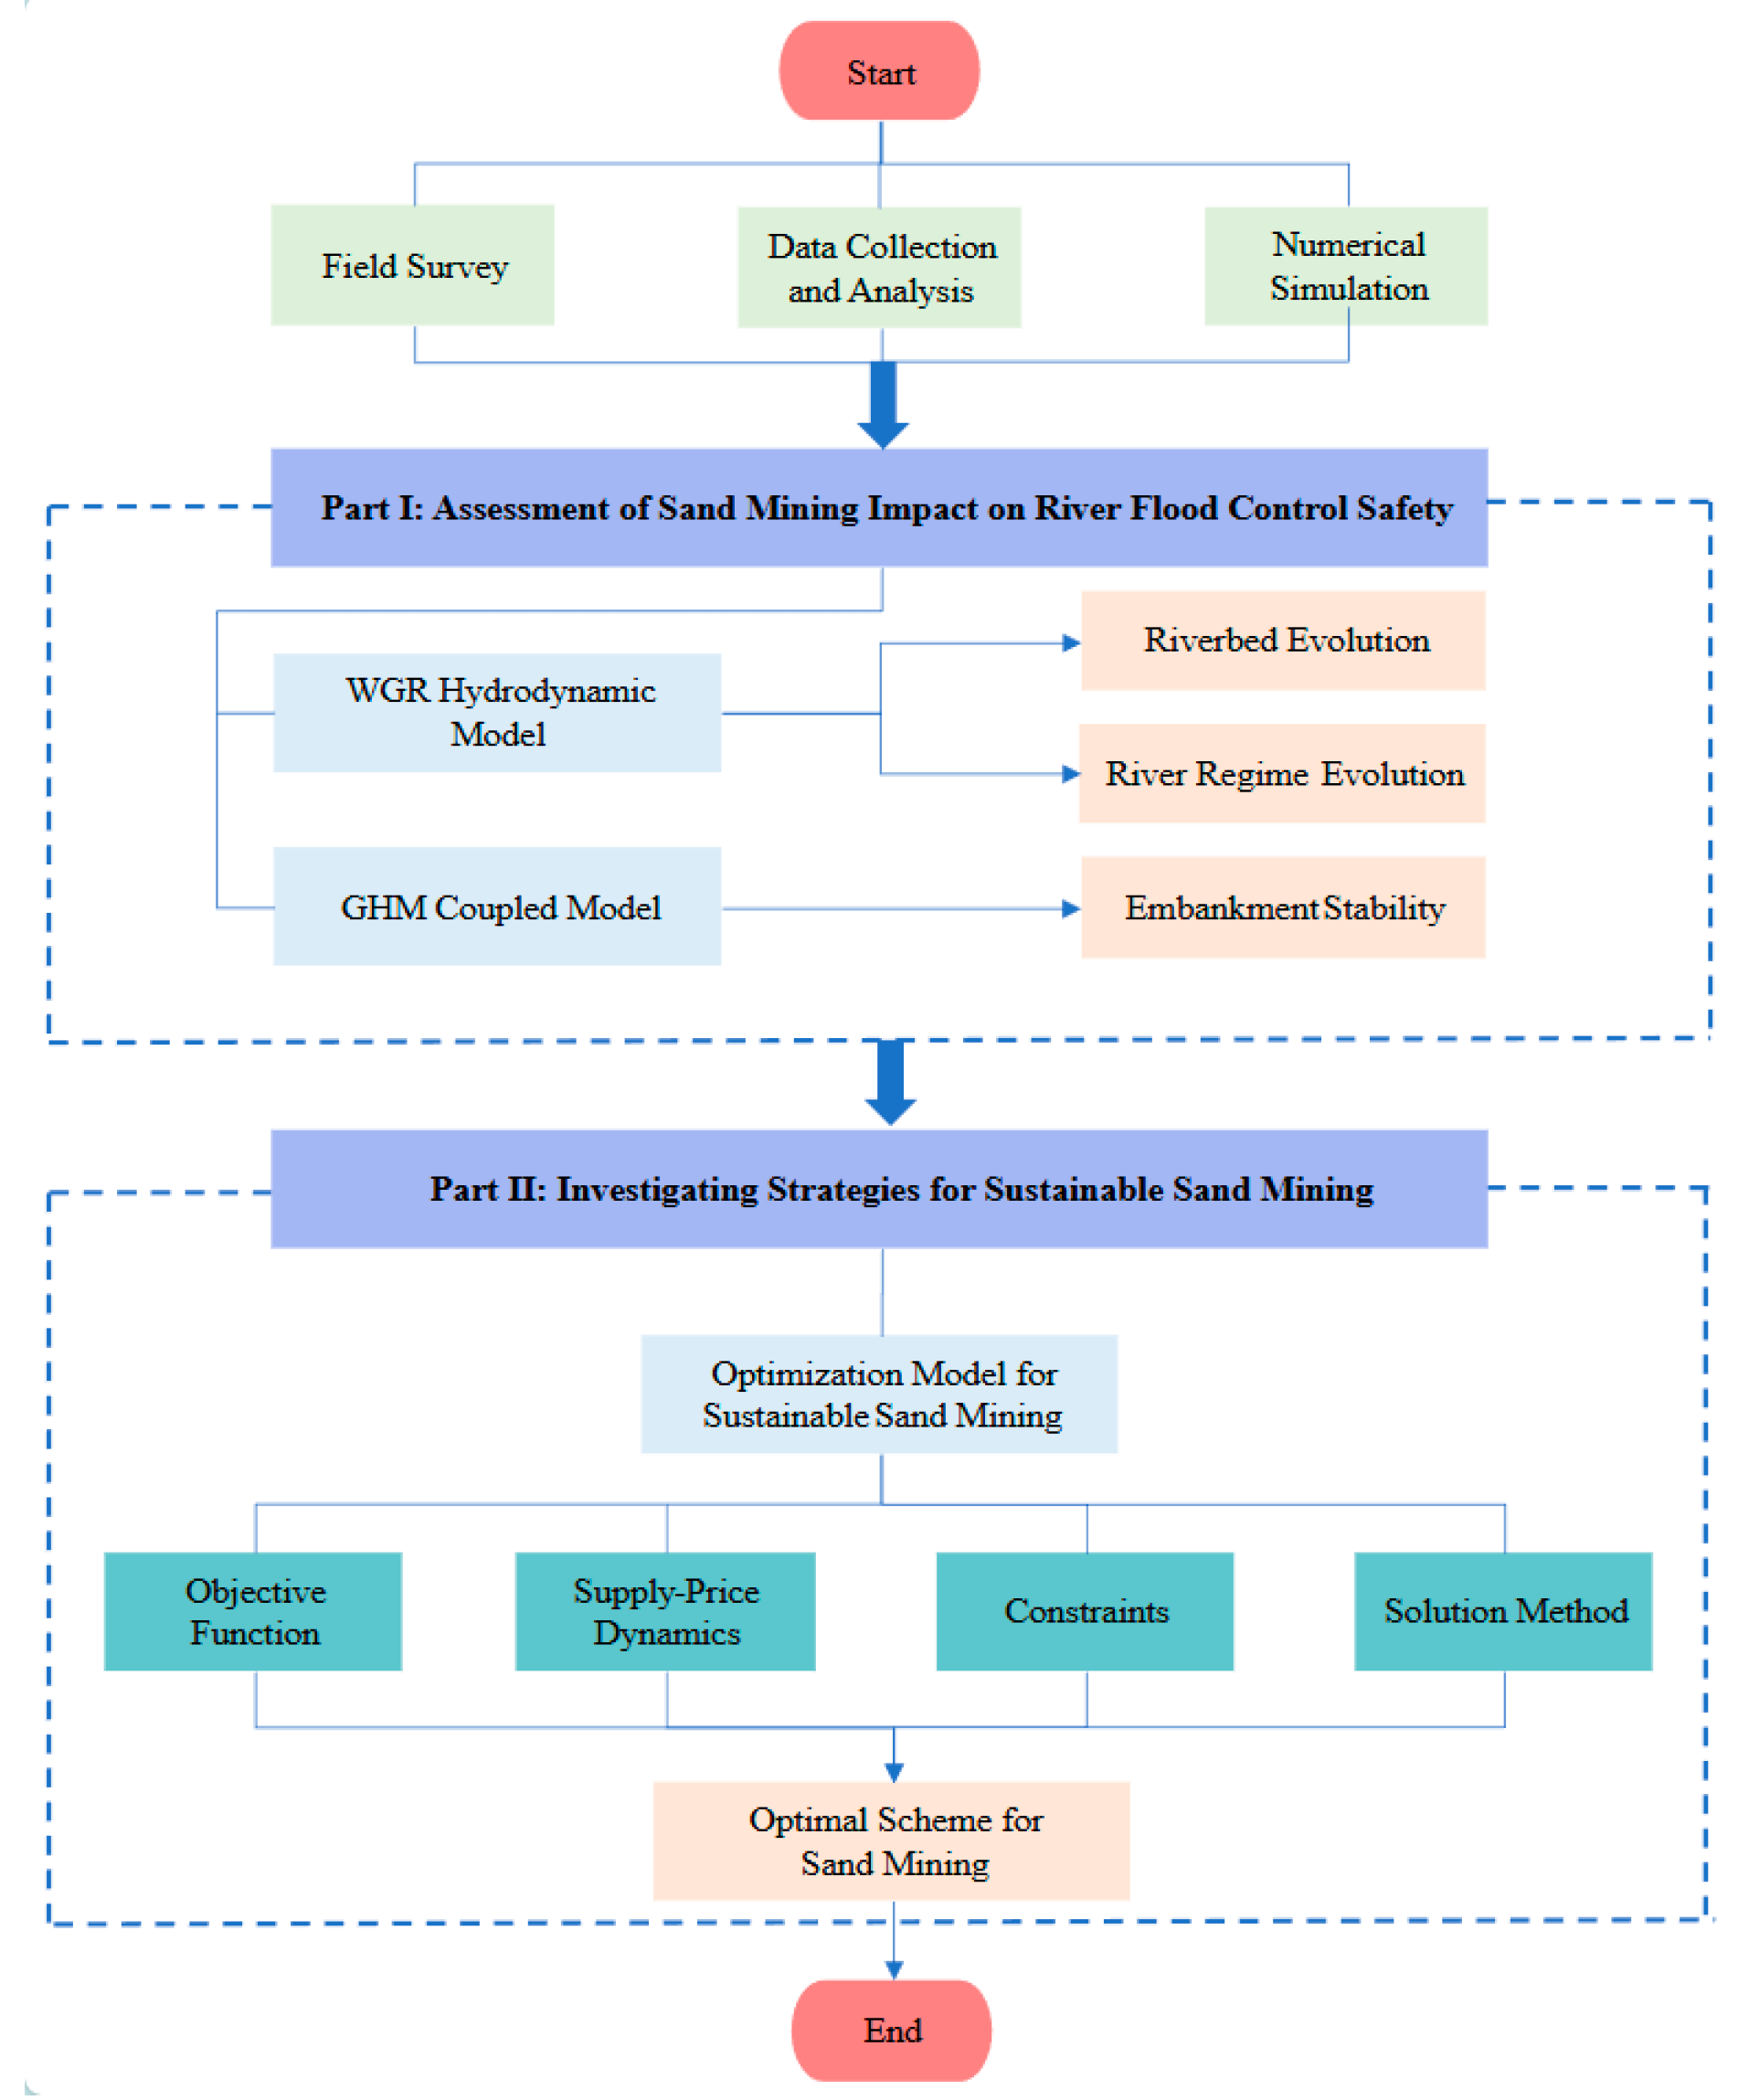
The overall technical research framework adopted in this study is illustrated in Figure 6, comprising four key stages: (1) collection and analysis of baseline data for the WGR; (2) multi-dimensional assessment of the impacts of sand mining on the WGR; (3) development of a sand-gravel extraction optimization model and specification of its constraints; (4) generation of results and formulation of an optimized extraction scheme.
Figure 6.
Overall Technical Research Framework.
Specifically, foundational data for the WGR, including hydrology, topography, historical records of sand mining, and regulatory plans, were systematically compiled. Subsequently, the impacts of sand mining on river regime stability, riverbed evolution, and embankment safety were comprehensively evaluated using methods such as hydrological observation, field surveys, data analysis, and numerical modeling. Building on these analyses, an optimization model for sand-gravel extraction was developed under the premise of sustainable utilization of riverine resources, with the objective of maximizing economic benefits. Finally, by incorporating the historical relationship between market price and extraction volume, and aligning with regulatory documents such as the Sand Mining Plan for the Mainstream of the Middle and Lower Fu River in Jiangxi Province (2024–2028) [33], the model parameters and constraints were defined to derive an optimal extraction scheme for the planning period.
3. Results
3.1. Impacts of Sand Mining on Flood Control Safety in the WGR
3.1.1. Analysis of the Impact of Sand Mining on Riverbed Evolution
Sand mining in the WGR can be divided into two distinct phases: a largely unregulated period with high extraction volumes from 2003 to 2011, followed by a more regulated phase with reduced mining activity from 2011 to 2023. To assess the cumulative impact of mining over this period, the riverbed volumetric change between 2003 and 2023 was quantified using the hydrodynamic models WGRM-2003 and WGRM-2023 in accordance with Formula (1).
The spatial distribution of net riverbed elevation change is shown in Figure 7, obtained by subtracting the 2003 bed elevations from those measured in 2023. The elevation changes were classified into incision-depth intervals, and the number of computational grid cells corresponding to volumetric changes for each interval are summarized in Table 6.
Figure 7.
Differences in channel elevation between 2003 and 2023 for the WGR.
Table 6.
Number of grid cells and volumetric change corresponding to different incision-depth intervals.
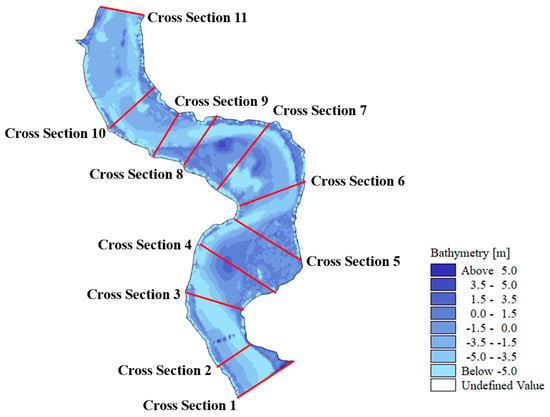
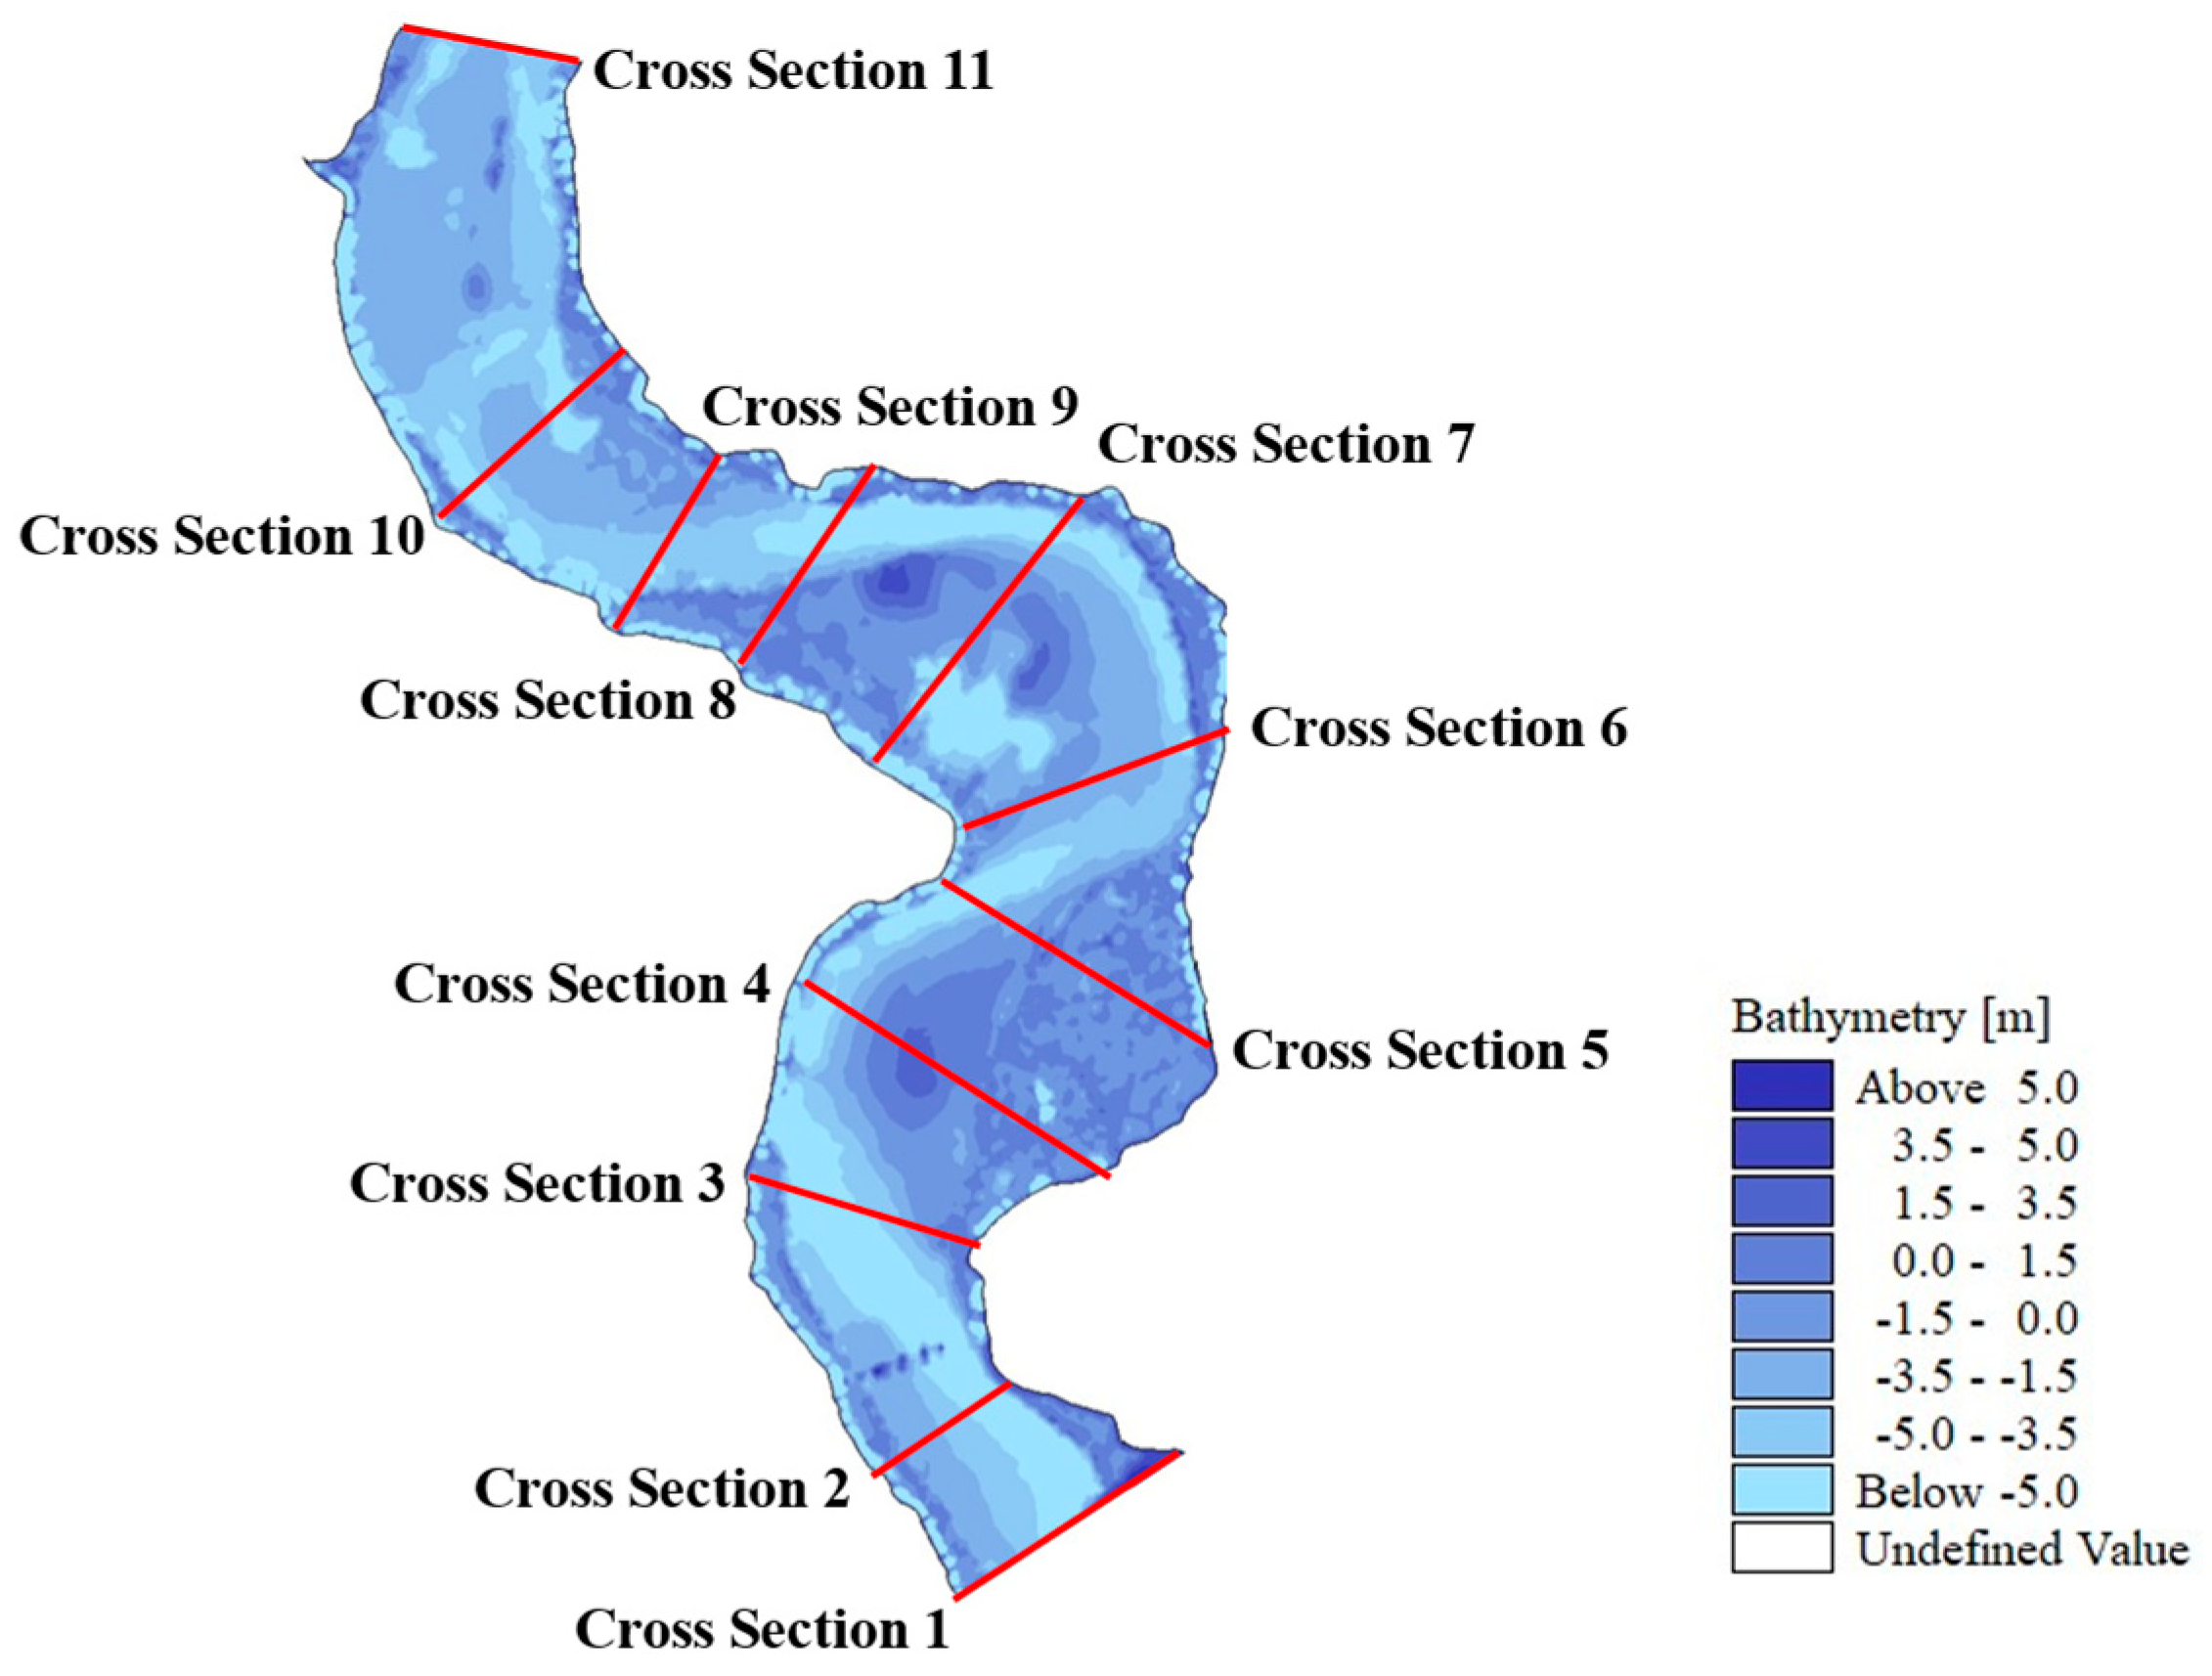
(1) Within the 9.55 km study reach, segments with riverbed incision exceeding 5 m collectively extend approximately 6.3 km, accounting for about two-thirds of the total channel length. Localized minor siltation was observed on the floodplain between cross sections 3 and 4, as well as between cross sections 7 and 8.
(2) The primary sand mining zones were concentrated between cross sections 6 and 10. Incision depths in NF05 ranged from 5 to 10 m. In NF06, incision depths were predominantly between 5 and 10 m, with localized areas exceeding 10 m. The most severe incision was observed in NF07, where incision depths generally exceeded 10 m.
(3) Integration of volumetric changes across different incision intervals indicates that sand mining over the past two decades resulted in a cumulative increase in river volume of approximately 12.97 × 10⁶ m3. Comparison with the total sediment transport volume over the same period (0.8827 × 10⁶ m3), calculated using the water–sediment budget method described in Section 2.2.1, indicates that under the current flow and sediment regime, mining-induced riverbed deformation is unlikely to undergo natural recovery over long timescales.
3.1.2. Analysis of the Impact of Sand Mining on River Regime Evolution
To assess the long-term cumulative effects of sand mining on the river regime of the WGR, numerical simulations of a 20-year return period flood were performed using the previously established WGRM-2003 and WGRM-2023 models. A comparative analysis was conducted to quantify mining-induced changes in water level and flow velocity. The simulation scenarios are summarized in Table 7, and the corresponding results are presented in Figure 8 and Figure 9.
Table 7.
Simulation Scenarios.
(1) Changes in river water level before and after sand mining are shown in Figure 8 below.
Figure 8.
Changes in river water level before and after sand mining.
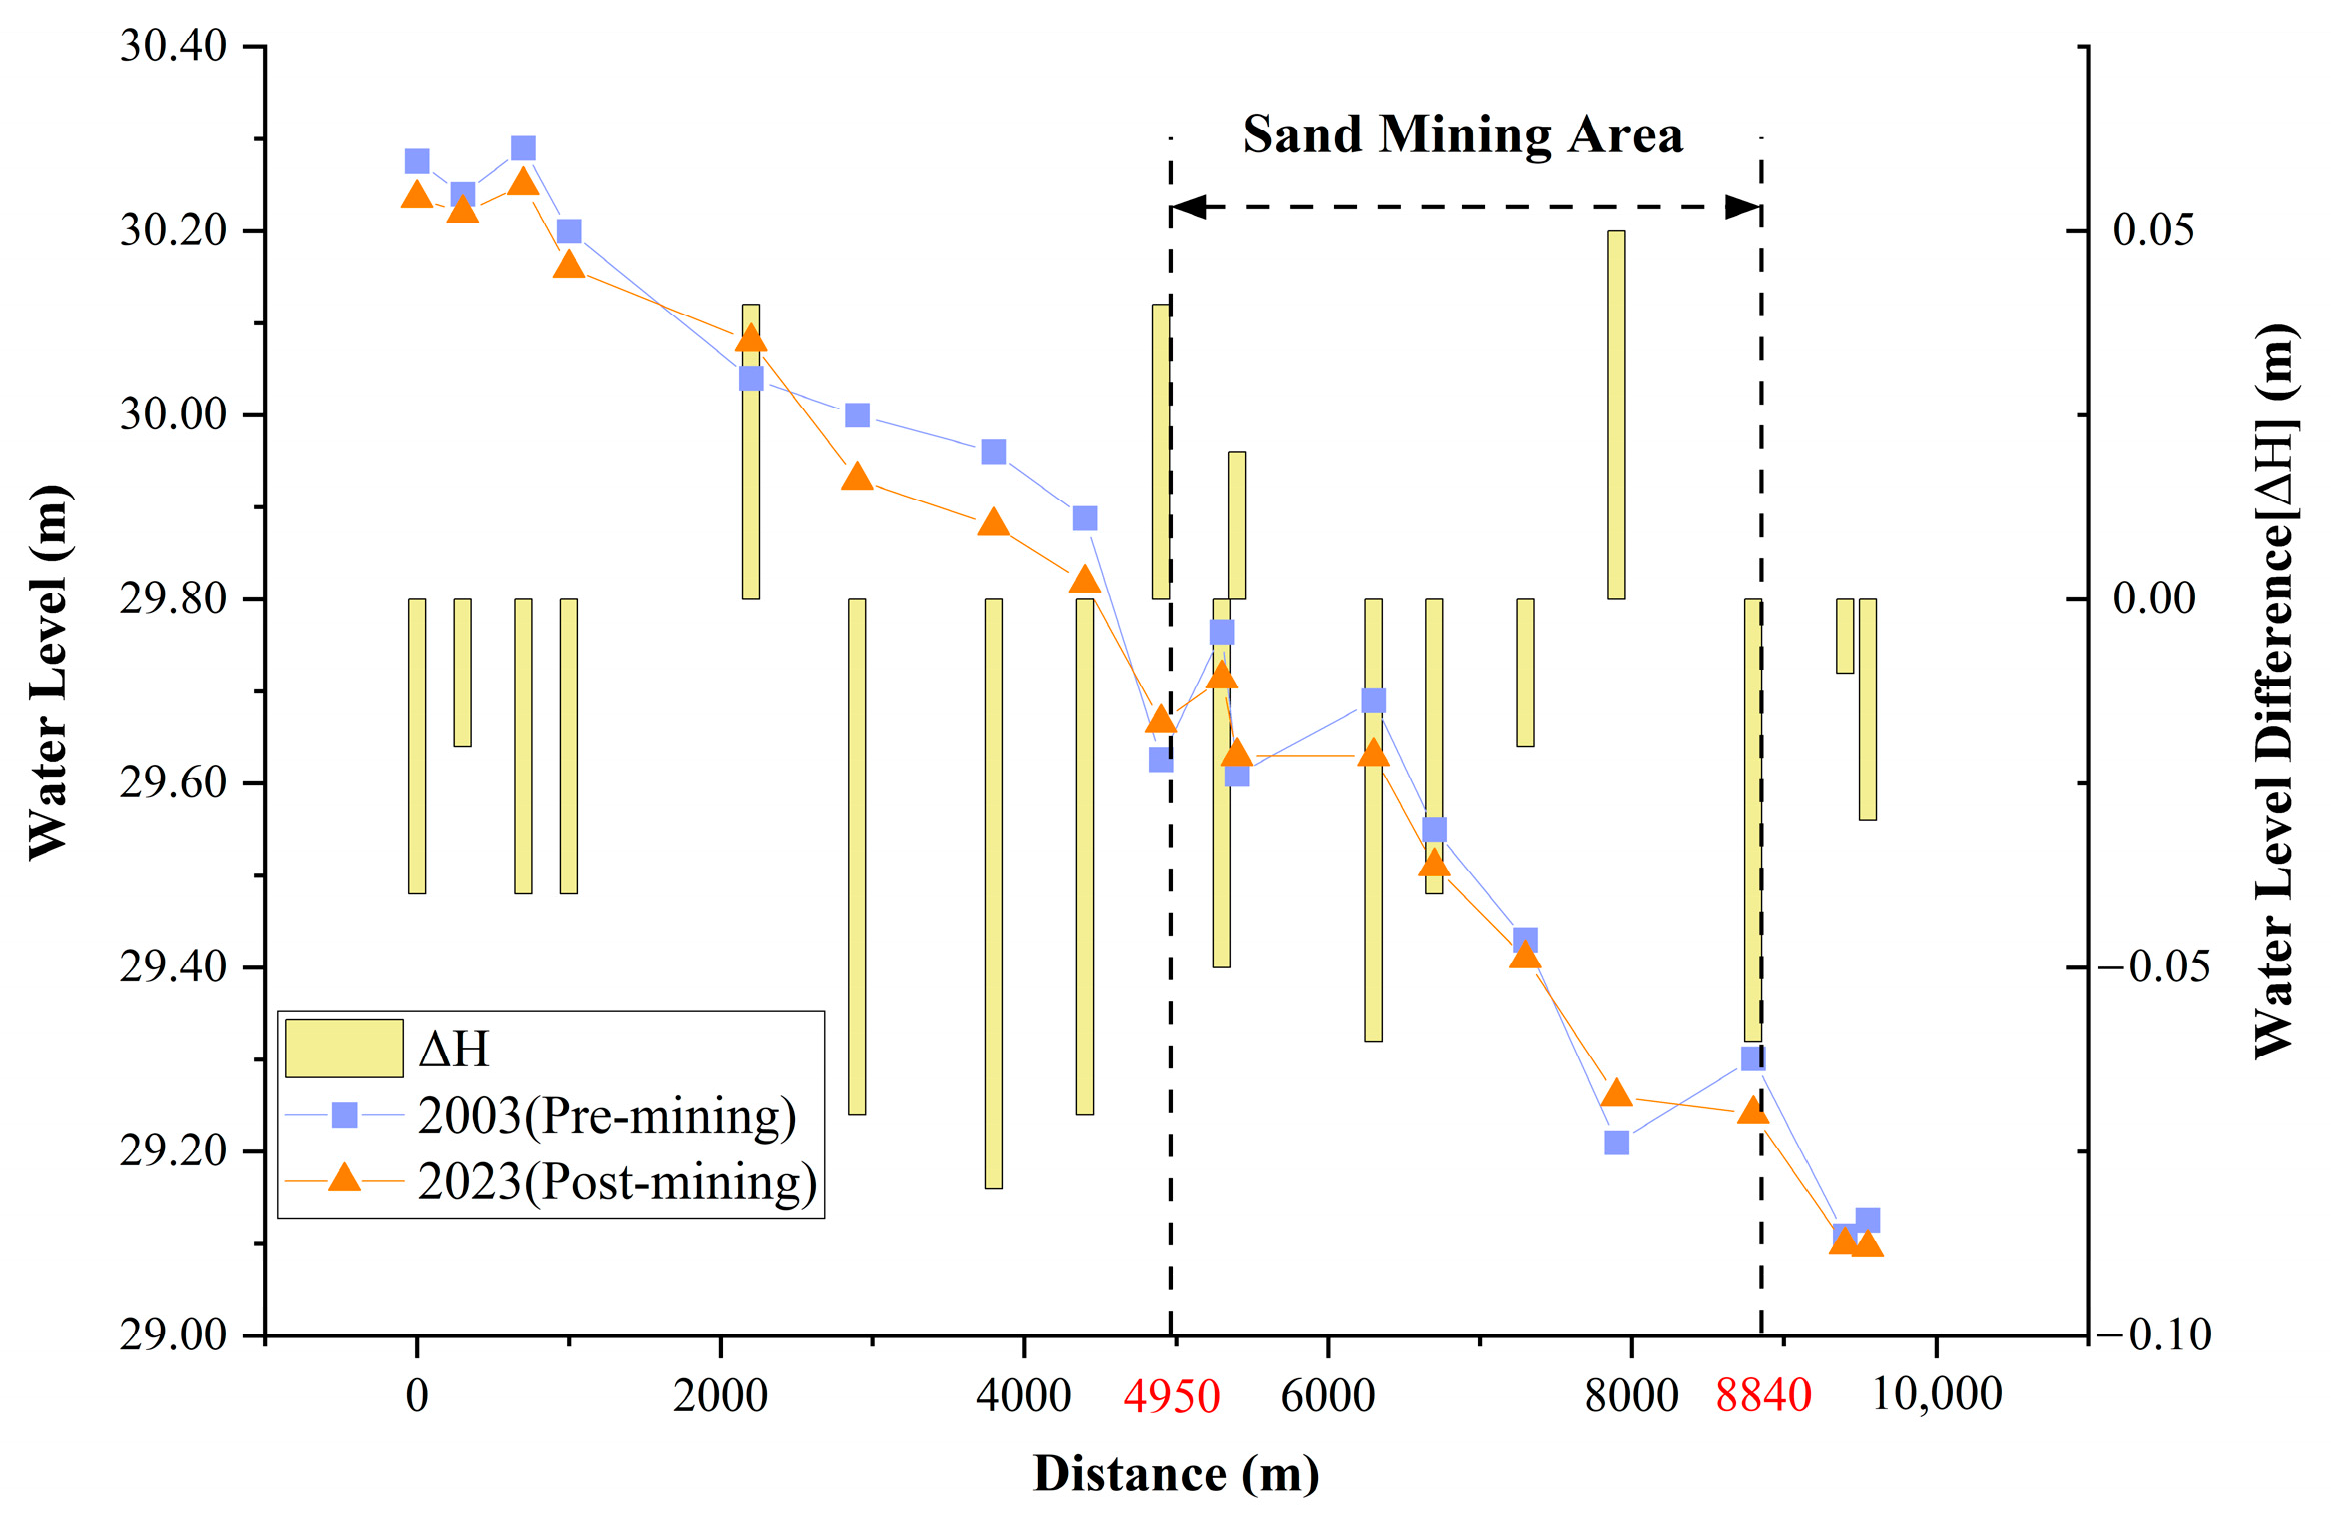
As shown in Figure 8, the overall pattern of water level variation in the WGR remains consistent before and after sand mining, with the water surface slope remaining approximately 1/5000. This indicates that the longitudinal profile of the channel was not fundamentally altered by the sand mining. Following extraction, water level variations ranged from −0.08 m to 0.05 m, exhibiting an overall net decline. Increases in channel cross-sectional area and modifications to local boundary conditions after extraction resulted in corresponding adjustments in water level, leading to generally lower water levels in the upstream reach relative to pre-mining conditions.
The mining areas were concentrated between 4.95 km and 8.84 km downstream of the upstream model boundary. Within this reach, alternating water level increases and decreases reflect localized scour–fill dynamics associated with bed incision and subsequent sediment replenishment from upstream. These relatively small water level adjustments indicate that the hydraulic impacts of sand mining were predominantly localized, particularly in the vicinity of excavation pits. Overall, although sand mining induced measurable water level changes, the large-scale flow regime of the river remained largely unchanged.
(2) Changes in river flow velocity before and after sand mining are shown in Figure 9 below.
Figure 9.
(a) Flow velocity distribution in the sand mining areas of the WGR, pre-mining. (b) Flow velocity distribution in the sand mining areas of the WGR, post-mining.
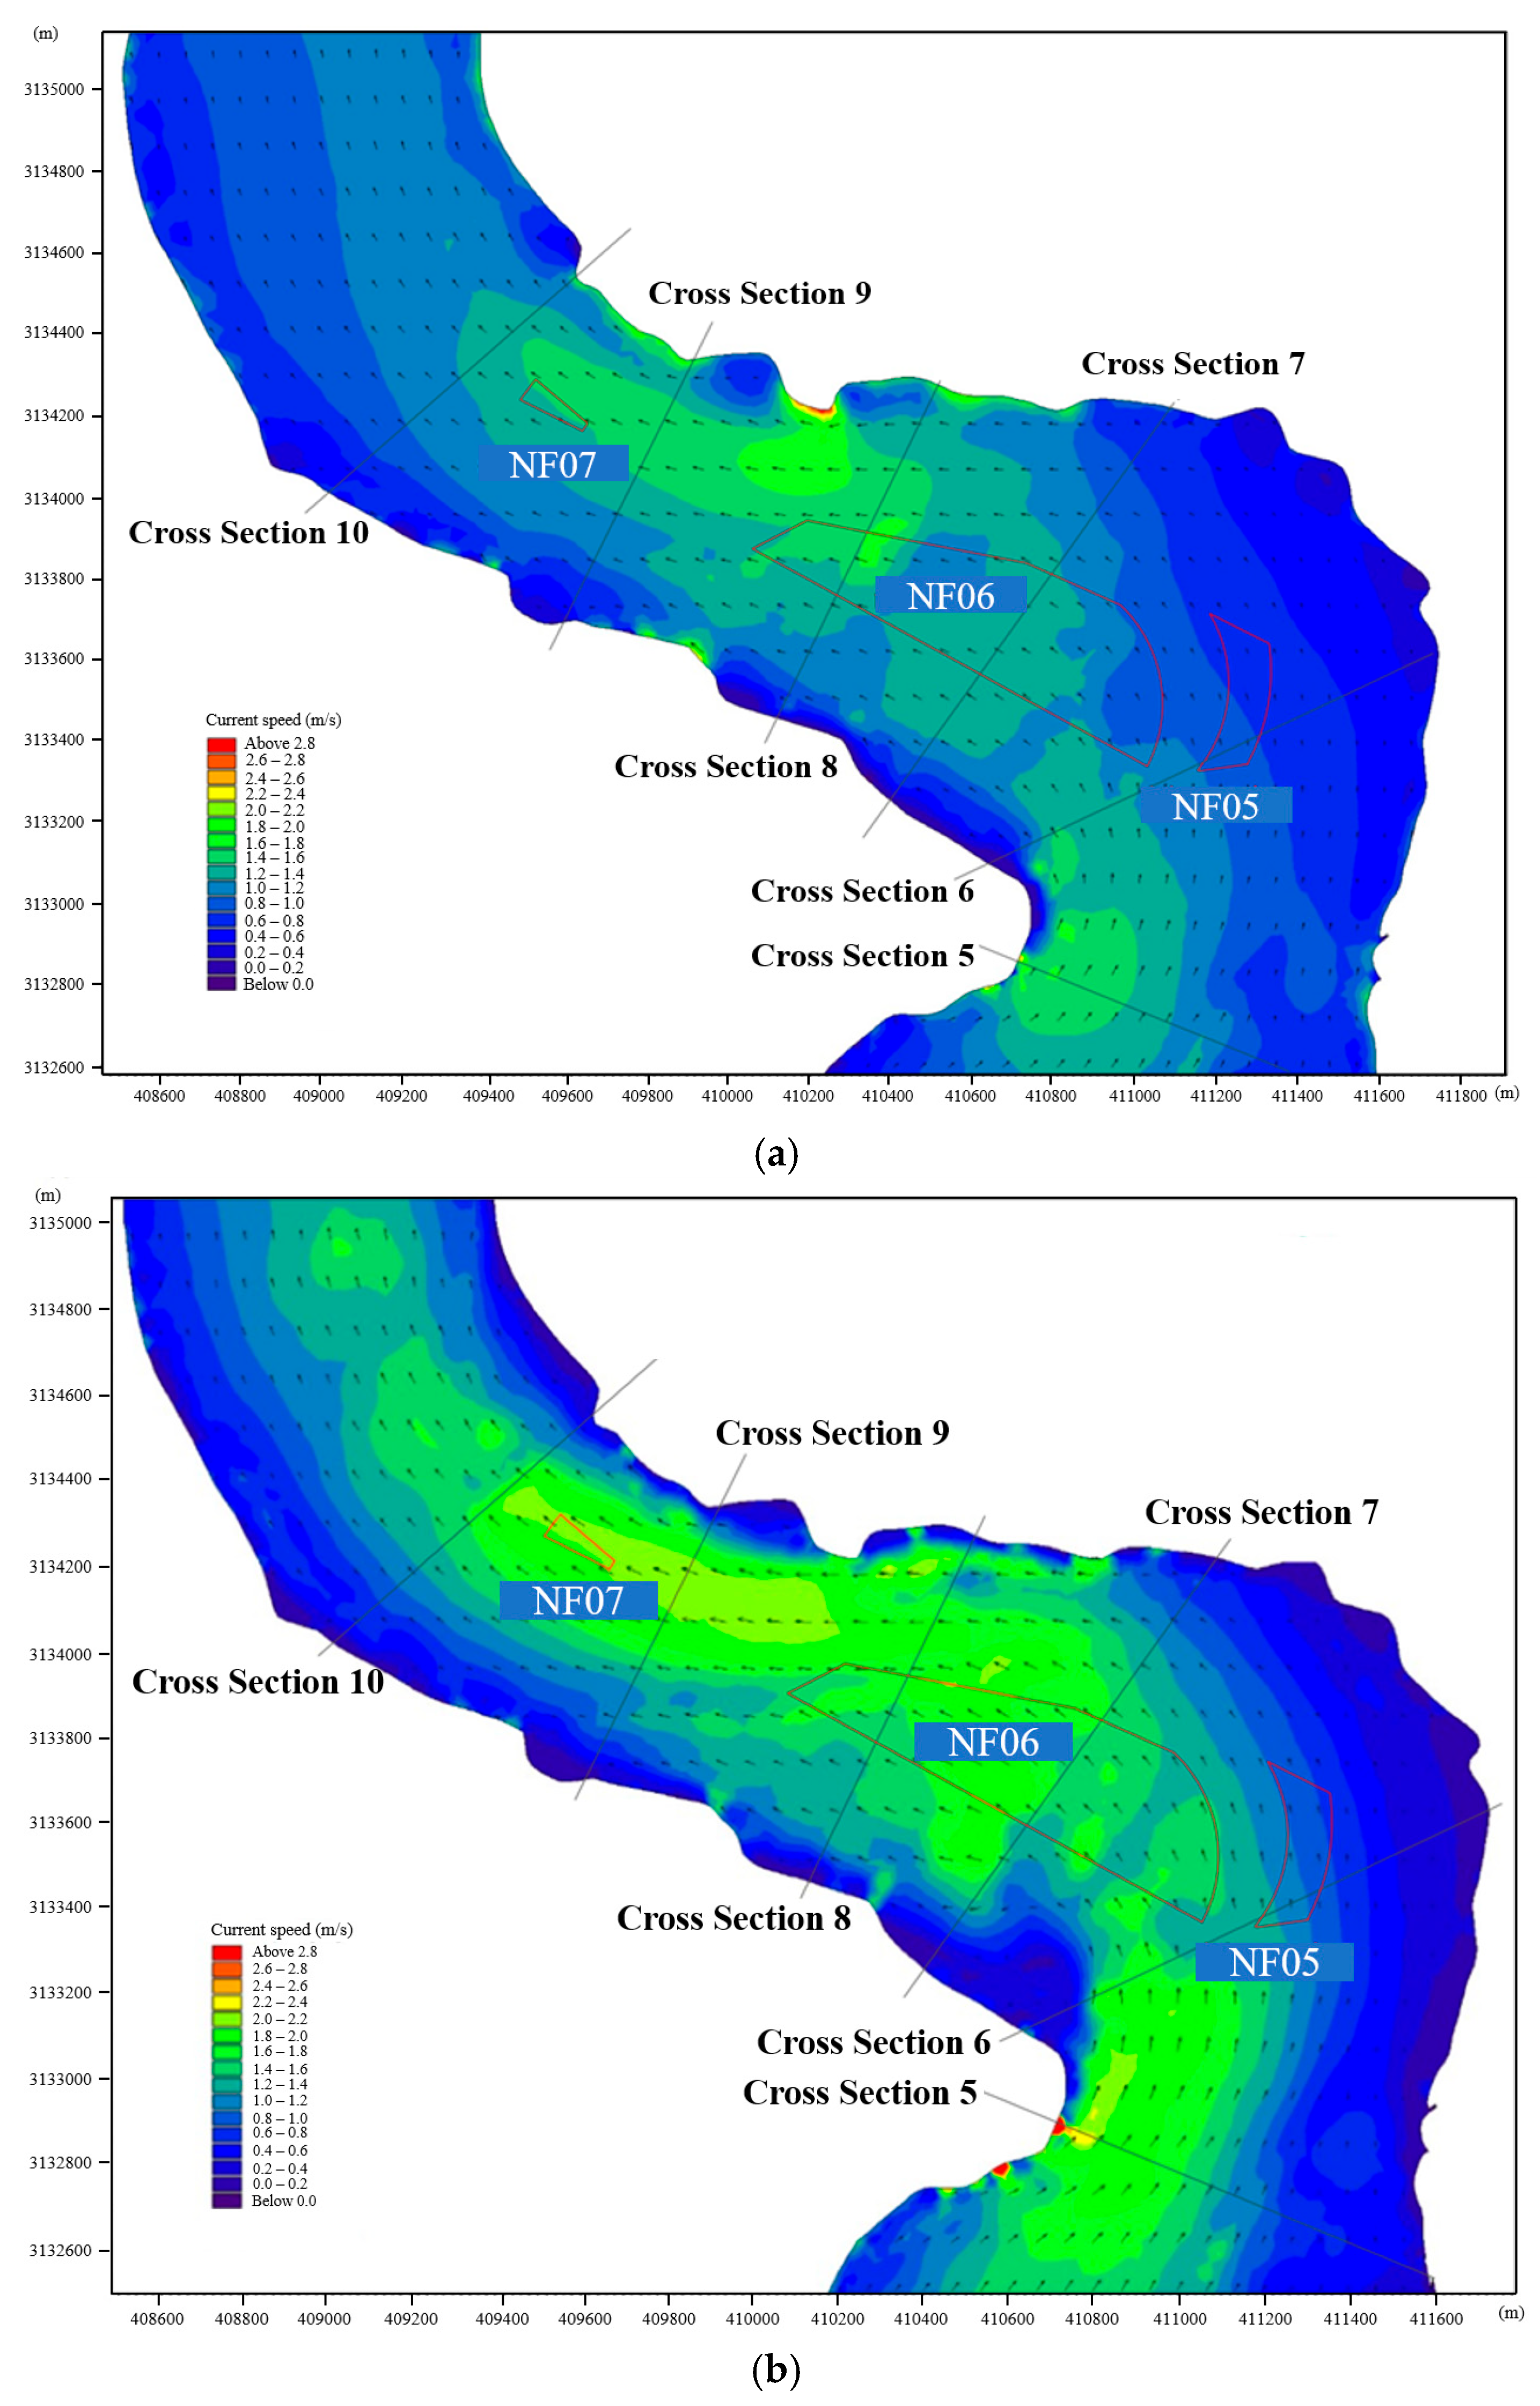
Based on Figure 9, the spatial distribution and variation in flow velocity under the 20-year return period flood before and after sand mining are summarized as follows.
(1) Before sand mining, flood flow was primarily concentrated within the main channel, with velocities generally ranging from 1.2 to 2.0 m/s. The maximum velocity was observed near the right bank at cross-section 8–9, reaching 2.65 m/s. Relatively high velocities were also observed in the bend area around cross-section 5, where values were approximately 2.0 m/s. Distinct velocity distributions were observed among the three mining areas: velocities in NF05 were relatively low (0.4–0.8 m/s); velocities in NF06 ranged from 1.0 to 1.6 m/s; and velocities in NF07 were between 0.6 and 1.0 m/s.
(2) After sand mining, velocity changes were mainly concentrated in the central channel, while velocities near the embankments remained generally stable. Specifically, velocities in NF05 exhibited a slight decrease, whereas velocities in NF06 generally increased by 0.22–0.39 m/s; velocity changes in NF07 were not pronounced. Velocities along both lateral margins of the mining areas decreased, and the main flow axis exhibited a slight shift from the right bank toward the channel center. A more evident velocity increase occurred near cross-section 5, with increments of approximately 0.24–0.41 m/s. In addition, more pronounced local velocity fluctuations were observed near the embankment, with local increases of 0.63–0.80 m/s.
3.1.3. Analysis of the Impact of Sand Mining on Embankment Stability
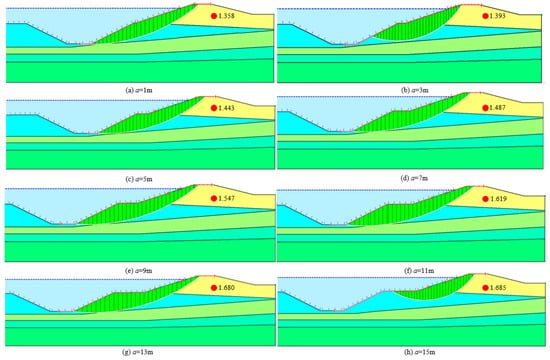
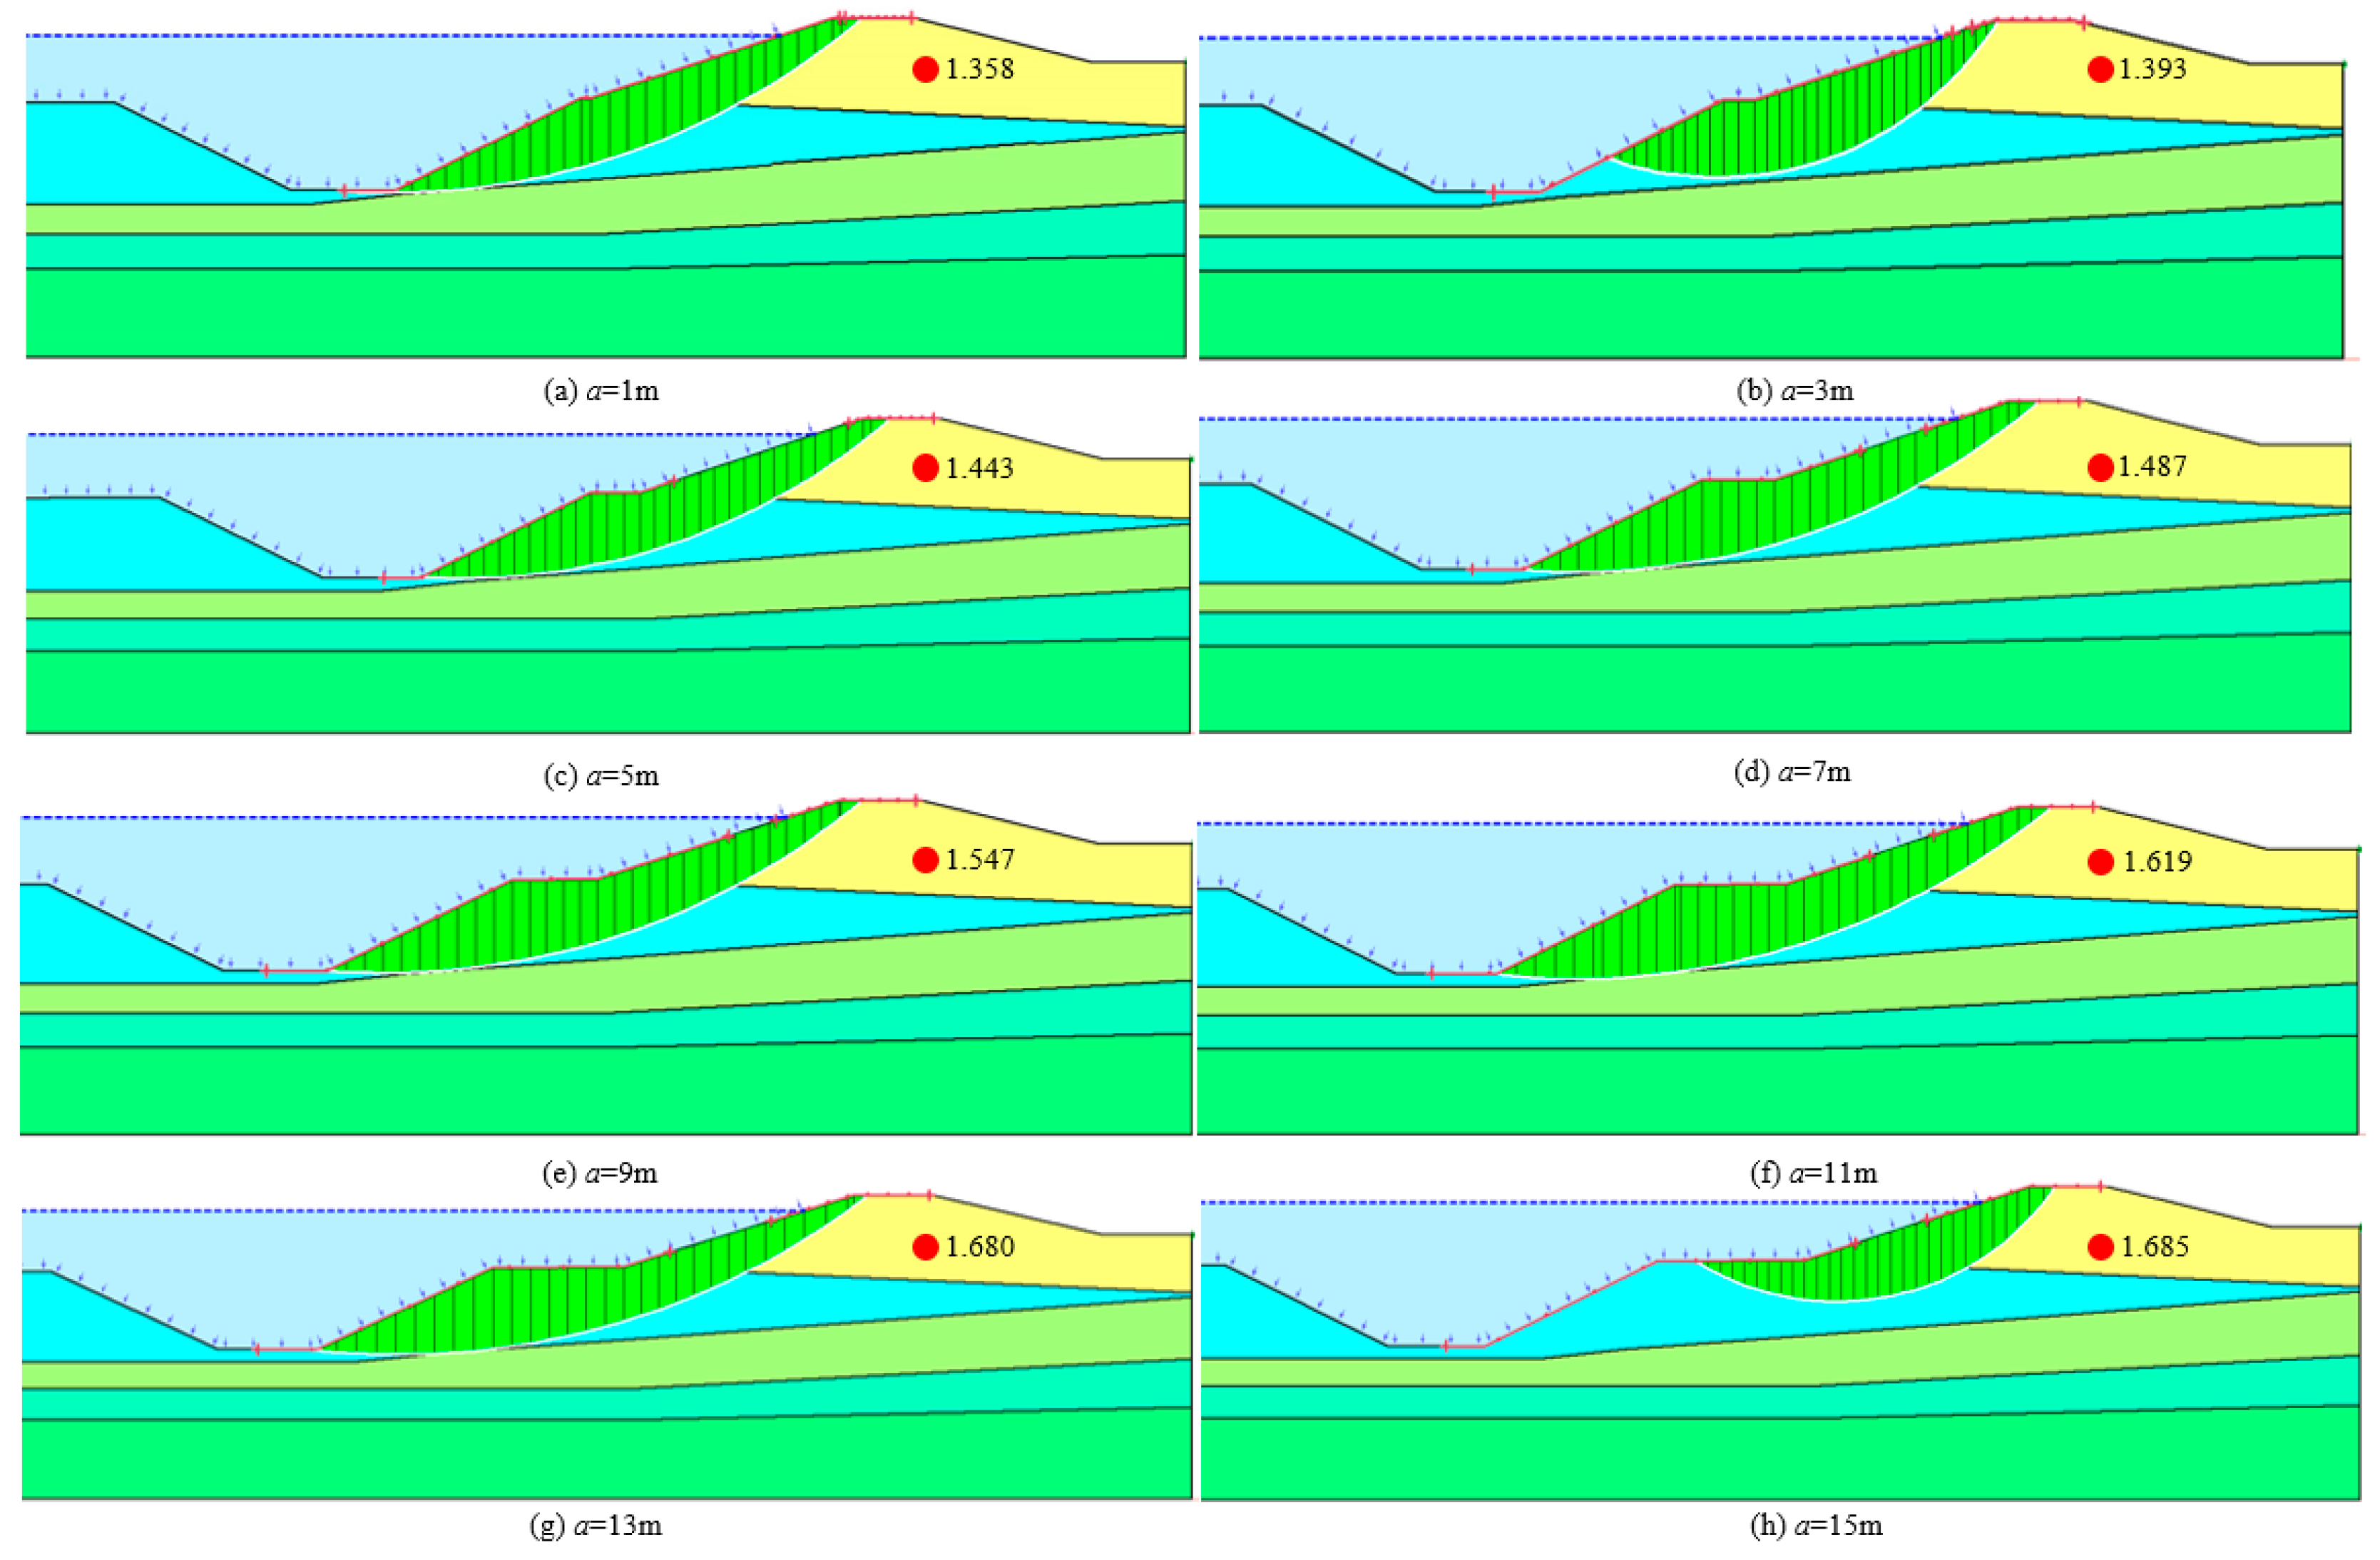
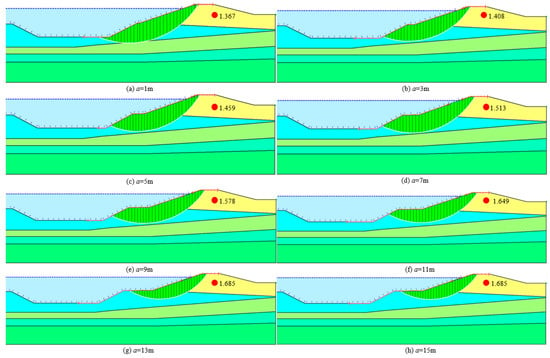
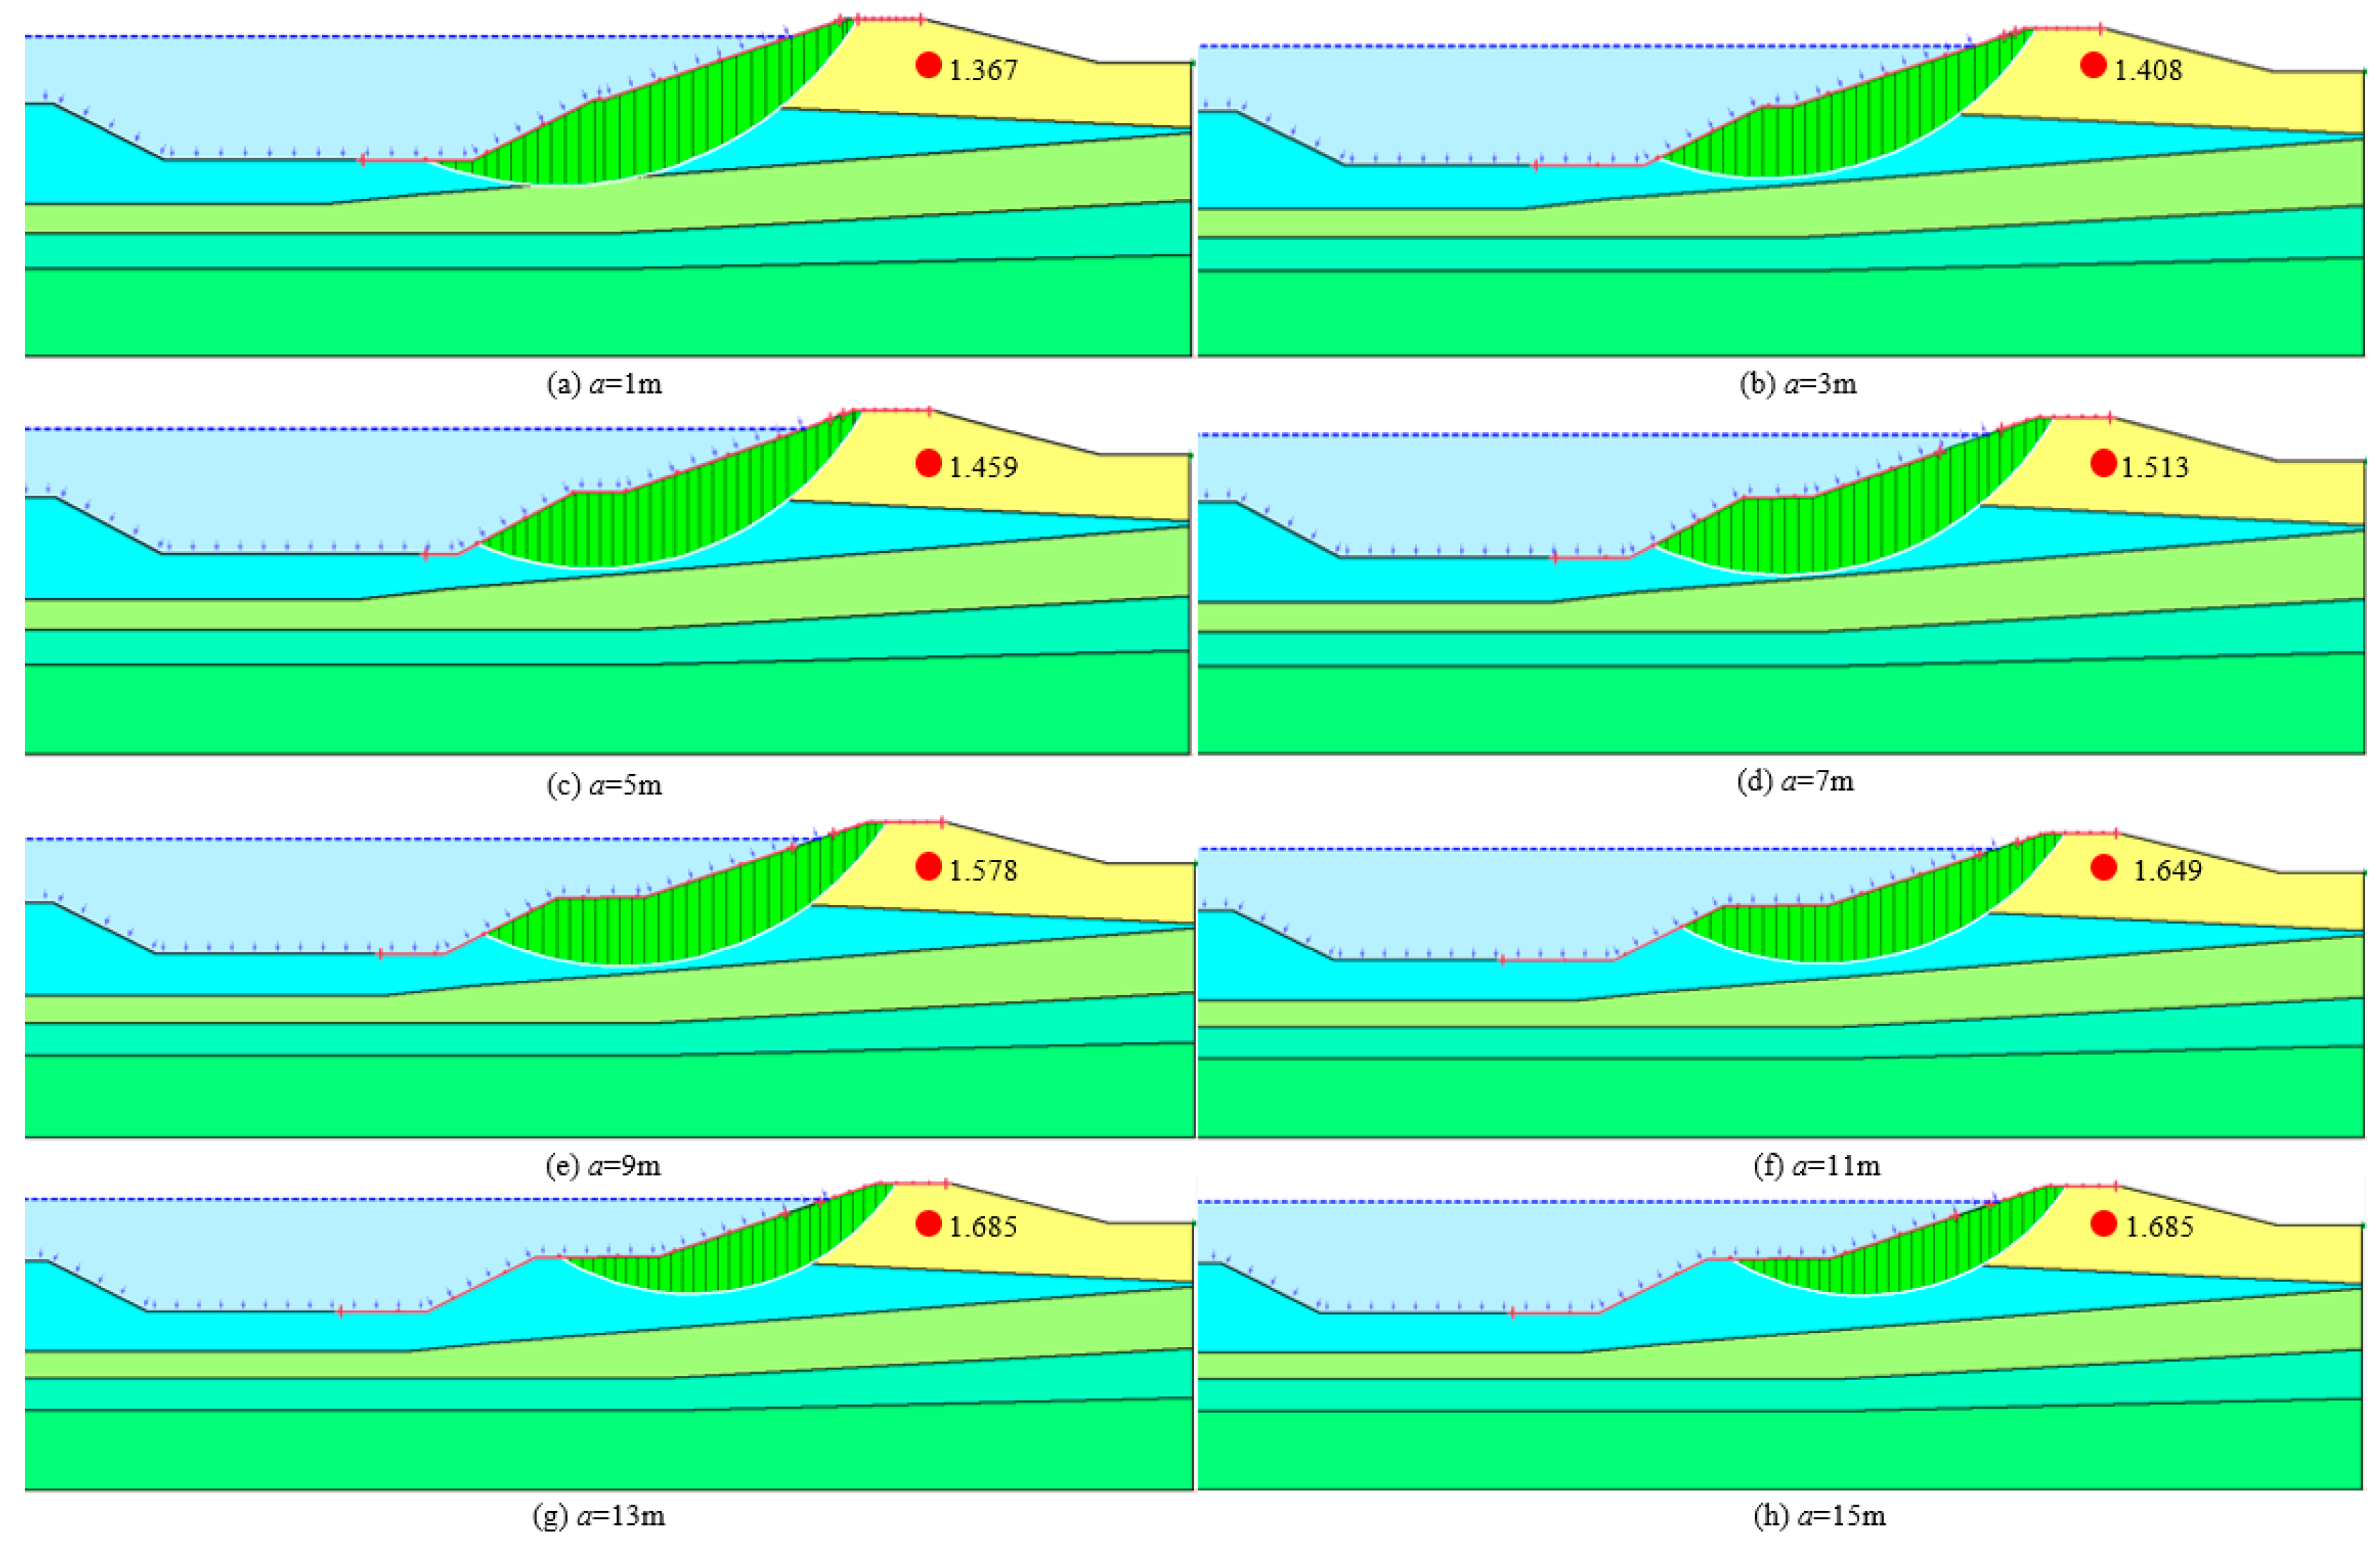
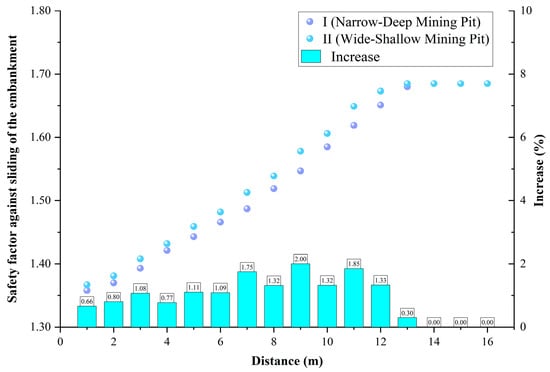
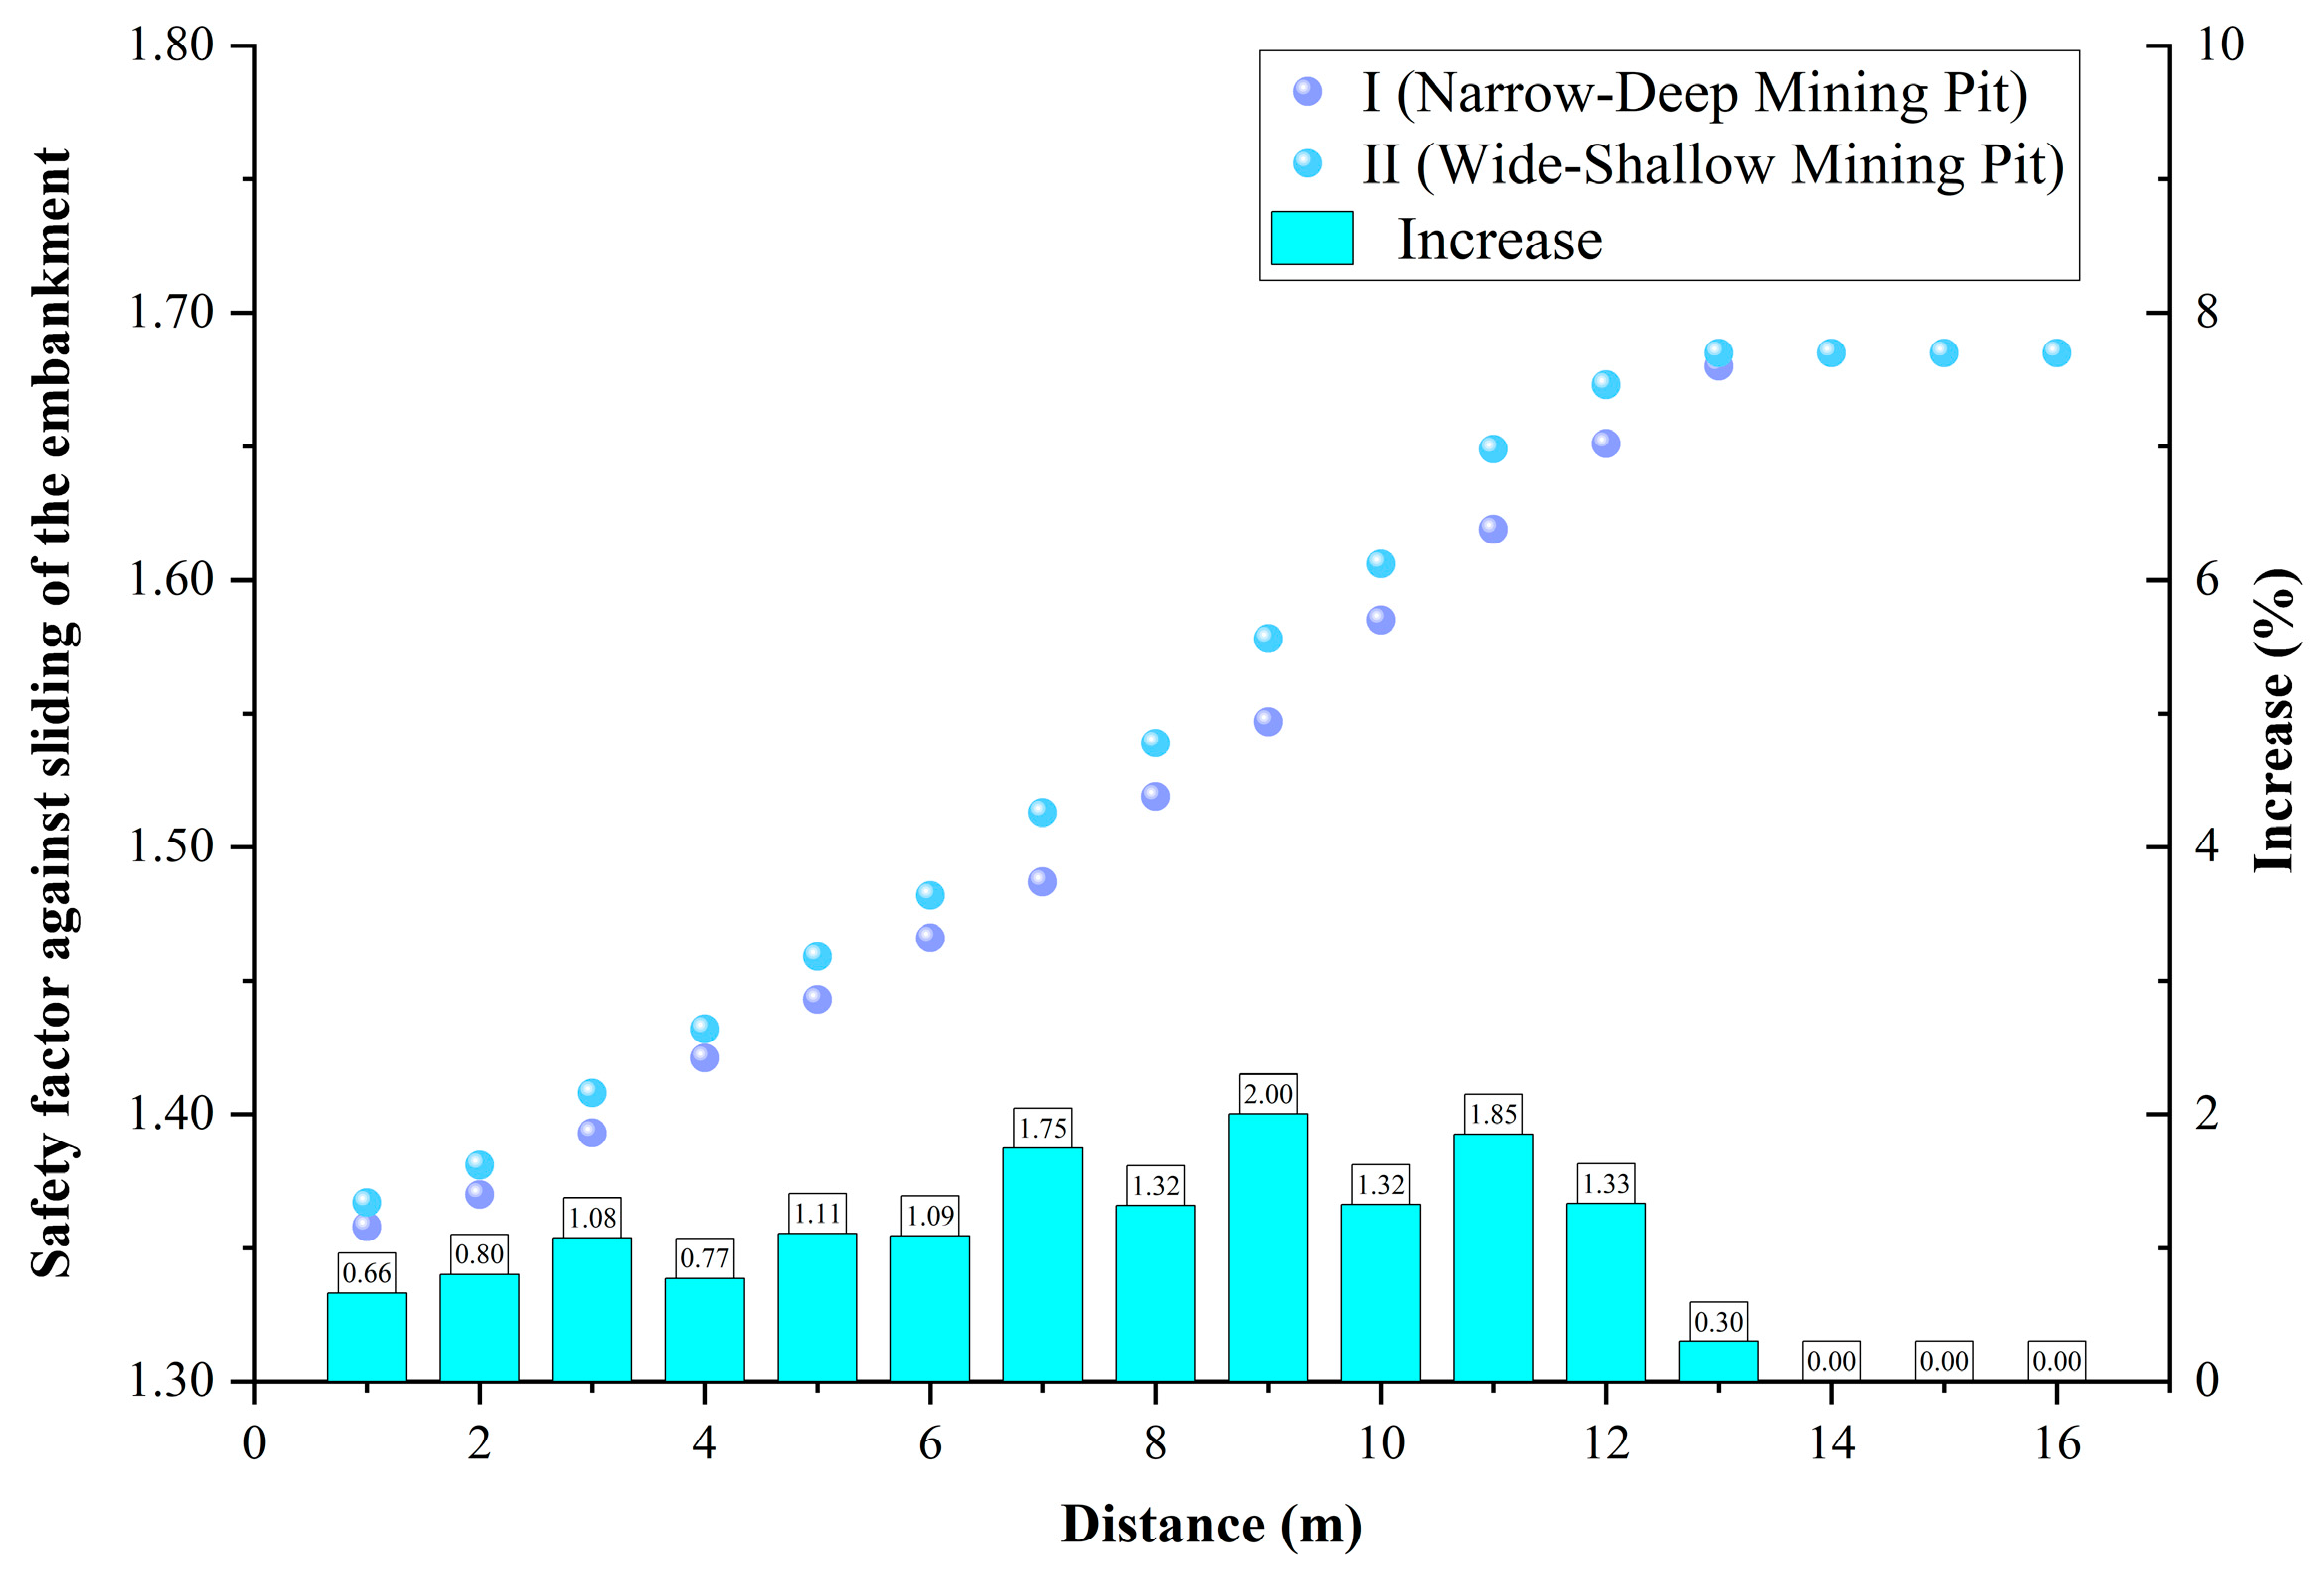
To quantitatively evaluate the effects of sand mining on embankment stability, the GHM model described in Section 2.3.3 was applied to examine the combined influence of two key factors: (1) the horizontal distance between the mining pit and the embankment toe, and (2) the morphology of the excavation pit. For each pit configuration, the distance from the pit edge to the embankment toe was systematically varied, and the corresponding sliding stability safety factor of the embankment was calculated. The resulting relationships between mining pit geometry, pit–embankment distance, and embankment safety factor are illustrated in Figure 10, Figure 11 and Figure 12, with the key numerical results summarized in Table 8.
Figure 10.
Safety factor against sliding of the embankment for the narrow-deep mining pit.
Figure 11.
Safety factor against sliding of the embankment for the wide-shallow mining pit.
Figure 12.
Safety factor against sliding of the embankment for the different mining pits.
Table 8.
Safety factor against sliding of the embankment for the different mining pits.
As shown in Figure 12 and Table 8, the distance between the sand mining pit and the embankment toe is identified as a critical controlling for embankment stability. With increasing the distance, the destabilizing influence induced by excavation progressively diminishes, resulting in a corresponding increase in the sliding stability safety factor. Once the distance exceeds approximately 14 m, mining-induced effects on embankment stability become negligible, and the safety factor asymptotically converges to a stable value of 1.685. This value provides a substantial safety margin compared to standard engineering requirements [36]. For identical pit-toe distances, embankments adjacent to the wide-shallow pit configuration (Scheme II) consistently exhibit higher sliding stability safety factors than those associated with the narrow-deep configuration (Scheme I), with a mean increase of approximately 1.19%. Accordingly, the wide-shallow pit morphology is recommended as the preferred excavation strategy to mitigate embankment stability risks during sand mining operations.
3.2. Optimization Analysis of Sand Mining for the WGR
Building upon the optimization framework established in Section 2.3.4 and incorporating the regulatory constraints outlined in Table 2, this section conducts an optimization analysis of the sand mining scheme for the WGR over the planning period 2024–2028.
- (1)
- Determination of the Total Extraction Control Volume, Q
Based on the regulatory cap specified in Table 2, the total extraction control volume Q was set to 4.901 million tons.
- (2)
- Determination of the Annual Minimum Extraction Volume,
Investigations indicate that there is currently virtually no passenger or cargo vessel traffic on the Fu River. Consequently, the annual minimum extraction volume for river sand and gravel, , was set to 0.
- (3)
- Determination of the Annual Maximum Extraction Volume,
To ensure flood control safety, the annual maximum extraction volume was set to 1.0424 million tons, which equals the sum of the annual controlled extraction limits for the NF05, NF06, and NF07 as specified in Table 2.
- (4)
- Determination of the Consecutive Extraction Restriction Coefficient,
In Section 3.1.3 of this paper, the sensitivity analysis results regarding the influence of mining pit morphology and its distance from the embankment on bank safety indicate that the sliding stability safety factor of the embankment has a maximum value of 1.685. To ensure the river channel possesses sufficient self-adjustment capacity during consecutive extraction periods, this maximum value of 1.685 was adopted as the consecutive extraction restriction coefficient, . Accordingly, the maximum total extraction volume over any two consecutive years within the planning period is restricted to 1.685 times the annual maximum extraction volume (1.685).
- (5)
- Determination of the Supply-Price Dynamics Relationship,
Based on an analysis of market data related to sand and gravel in this river reach [37], the Supply-Price dynamics relationship was determined to be .
- (6)
- Estimation of Market Demand for Sand and Gravel,
Based on historical data on planned and actual extraction volumes of sand and gravel in the WGR, the estimated market demand for sand and gravel for each year of the planning period, denoted as , was 2.10, 1.82, 1.54, 1.26, and 0.98 million tons, respectively.
Using the above data, the sustainable sand and gravel extraction optimization model for the WGR was established based on Equations (2)–(4), as shown below. This model was then solved to determine the optimal annual extraction volume for each year within the 2024–2028 planning period.
Using Python software 2022.3, the computations converged after 14 iterations, yielding the optimal annual extraction volumes for the WGR. The results are presented in Table 9.
Table 9.
Optimal annual sand extraction volumes for the WGR during the planning period (2024–2028).
As shown in Table 9, the optimized annual maximum extraction volume for the WGR during the planning period (2024–2028) is estimated at 0.9802 million tons, which is lower than the regulated annual cap of 1.0424 million tons. This outcome is primarily attributable to the constraint imposed by the consecutive extraction restriction coefficient in the multi-year optimization framework. The results further indicate that the cumulative planned extraction volume over the planning period is 4.4848 million tons, which is lower than the allowable total extraction limit of 4.901 million tons. Meanwhile, the corresponding maximum economic revenue generated from sand and gravel extraction over the planning period is estimated at 50.03 million USD.
4. Discussion
(1) In this study, the impacts of sand mining in the WGR were systematically evaluated, and optimized management strategies were proposed. The results indicate that sediment supply to the WGR is severely deficient, and the magnitude of mining-induced riverbed incision far exceeds the natural recovery capacity, rendering the incision largely irreversible. These findings are consistent with previous studies by Jiang et al. [19] and Yang et al. [14]. Although the overall longitudinal profile remained stable, sand mining induced pronounced localized hydrodynamic effects, increasing flow velocity in NF06 by 0.22–0.39 m/s. With respect to embankment safety, this study corroborates the conclusion reached by Wang et al. [22]. GHM analysis identifies a critical safe distance of 13–14 m between the pit edge and the embankment toe and demonstrates that wide-shallow pit morphologies are more favorable than narrow-deep configurations. The proposed optimization model recommends limiting total extraction volume during 2024–2028 to 4.4848 million tons. An alternating high-volume–low-volume allocation scheme can achieve an estimated total revenue of approximately 50.03 million USD while maintaining flood control safety. Compared with purely economic optimization approaches (e.g., Wang et al. [38]), the present model integrates safety constraints derived from GHM analysis and consecutive extraction limits, thereby shifting the optimization objective from a purely economic focus to a dual safety–economic framework.
(2) The mechanisms underlying these conclusions can be summarized at three levels. First, irreversible riverbed incision is fundamentally driven by a severe imbalance in the sediment budget. Limited sediment supply to the WGR implies that sand mining directly removes historically stored bed material, resulting in extraction volumes that far exceed natural replenishment, a mechanism analogous to that reported for the Mekong River [24]. Second, localized changes in the flow field arise from abrupt alterations in boundary conditions caused by mining pits. These pits create topographic depressions and roughness contrasts, inducing flow contraction, acceleration, and enhanced turbulence, which collectively redistribute velocities within the main channel. Finally, the impact of mining pits on embankment stability is mechanically attributable to disturbances in the soil stress field. Excavation in close proximity to the embankment disrupts static equilibrium and promotes the development of potential slip surfaces. Due to their greater depth, narrow-deep pits induce deeper and more intense stress disturbances, resulting in lower overall stability.
(3) While this study provides integrated insights into the impacts and management of sand mining, several limitations should be acknowledged. Firstly, the modeling frameworks necessarily involve simplifications. The geotechnical stability analysis adopts a homogeneous assumption, assigning constant parameters to each identified soil layer. This classical deterministic approach fails to capture spatial variability within individual soil layers, potentially compromising the accuracy of calculated safety factors. Future work should utilize probabilistic reliability analyses to quantify parameter uncertainties. Secondly, the economic optimization relies on a historical linear price-demand relationship, which may not fully capture future market volatility or policy shifts. Lastly, the study focuses primarily on flood safety and economic benefits, leaving other critical dimensions—such as the ecological impacts of riverbed incision on aquatic habitats—for subsequent investigation.
5. Conclusions
(1) In sediment-deficient rivers, riverbed incision induced by sand mining is difficult to recover naturally and poses substantial threats to local flow fields and embankment stability. Comprehensive analysis of the WGR reveals a pronounced discrepancy between deposition volumes estimated using the water–sediment balance method (0.853 million m3) and the topographic evolution method (12.9707 million m3), confirming the severely limited self-recovery capacity of this reach. Although the overall longitudinal profile remained largely unchanged, sand mining significantly redistributed flow velocities within the main channel, increasing velocities in NF06 by 0.22–0.39 m/s. In addition, GHM modeling quantified a critical safe distance between mining pits and embankments and demonstrated the significant influence of pit morphology on embankment stability.
(2) Formulating a quantitative extraction plan under multi-objective constraints is essential for achieving both sustainable sand-gravel utilization and flood control safety. Accordingly, a sand-gravel extraction optimization model was developed to maximize economic benefits while strictly satisfying flood control safety and market demand constraints. Based on the model results, an optimized extraction plan for the WGR during 2024–2028 is proposed, in which the total extraction volume is limited to 4.4848 million tons. Annual extraction volumes are optimally allocated, with approximately 0.9802 million tons in 2024, 2026, and 2028, and 0.7722 million tons in 2025 and 2027. This scheme satisfies total volume and consecutive extraction constraints, yielding an estimated total economic revenue of approximately 50.03 million USD.
(3) Implementing a refined sand mining management strategy that integrates total volume control, spatial regulation, and dynamic optimization is critical. Based on these findings, the following recommendations are proposed. First, dual-control indicators, including total extraction volume and annual extraction caps, should be strictly enforced. Second, operational regulations should mandate a minimum safe distance between mining pits and embankment toes, and wide-shallow pit morphologies should be prioritized to minimize disturbances to embankment stability. Finally, management authorities can adopt the optimization framework developed in this study to establish a dynamically adjustable sand mining management mechanism. By integrating key monitoring data, such as annual bathymetric surveys and market information, model parameters and constraints can be regularly updated, creating a responsive “monitor-model-optimize” cycle. Implementing such a practice facilitates a shift in river sand mining governance from static, passive constraint to proactive management, thereby enhancing long-term precision and sustainability.
Author Contributions
Writing—original draft preparation, S.D.; writing—review and editing, T.W. and Q.H.; supervision, Q.H. and W.X.; funding acquisition, W.Y. and J.Y. All authors have read and agreed to the published version of the manuscript.
Funding
This research was funded by the National Key R&D Program of China (Grant No. 2023YFC3012200), and the Science and Technology Project of the Water Resources Department of Jiangxi Province (Grant No. 202325ZDKT21).
Data Availability Statement
All data of the model used in this research can be requested from the corresponding author through the indicated e-mail.
Conflicts of Interest
The authors declare no conflicts of interest.
Abbreviations
The following abbreviations are used in this manuscript:
| WGR | Wengang Section of the Fu River |
| NF05 | Nanfu 05 Sand Mining Area |
| NF06 | Nanfu 06 Sand Mining Area |
| NF07 | Nanfu 07 Sand Mining Area |
| LHS | Lijiadu Hydrologic Station |
| WTHS | Wenzhen Town Hydrologic Station |
| ARV | Annual Runoff Volume |
| AMSC | Annual Mean Sediment Concentration |
| WGRM-2003 | Hydrodynamic model of WGR based on terrain interpolation from 2003 |
| WGRM-2023 | Hydrodynamic model of WGR based on terrain interpolation from 2023 |
| GHM Model | Geotechnical-Hydrological-Mechanical Model |
References
- Leal Filho, W.; Hunt, J.; Lingos, A.; Platje, J.; Vieira, L.W.; Will, M.; Gavriletea, M.D. The Unsustainable Use of Sand: Reporting on a Global Problem. Sustainability 2021, 13, 3356. [Google Scholar] [CrossRef] [Scilit]
- Cao, Z.; Chu, C.; Liu, J.; Su, X.; Zhong, X.; Behrens, P. Closing the global sand circularity gap needs a systems approach. One Earth 2025, 8, 101199. [Google Scholar] [CrossRef] [Scilit]
- Tang, H.; Zou, J.; Yin, X.; Yu, S.; He, Q.; Zhao, D.; Zou, C.; Luo, J. River and lake sand mining in the Dongting Lake area: Supervision based on high-resolution remote sensing images and typical case analysis. Remote Sens. Nat. Resour. 2023, 35, 302–309. [Google Scholar]
- Tran, T.K.; Nga, T.N.Q.; Huy, N.D.Q.; Phung, N.K.; Hoai, H.C.; Bay, N.T. The impact of sand mining on the bed morphology of the Tien River, Mekong Delta, Vietnam. Environ. Earth Sci. 2025, 84, 108. [Google Scholar] [CrossRef] [Scilit]
- NG, W.X.; Park, E. Shrinking Tonlé Sap and the recent intensification of sand mining in the Cambodian Mekong River. Sci. Total Environ. 2021, 777, 146180. [Google Scholar] [CrossRef] [Scilit] [PubMed]
- Sreebha, S.; Padmalal, D. Environmental impact assessment of sand mining from the small catchment rivers in the southwestern coast of India: A case study. Environ. Manag. 2011, 47, 130–140. [Google Scholar] [CrossRef] [Scilit]
- Padmalal, D.; Maya, K.; Sreebha, S.; Sreeja, R. Environmental effects of river sand mining: A case from the river catchments of Vembanad lake, Southwest coast of India. Environ. Geol. 2007, 54, 879–889. [Google Scholar] [CrossRef] [Scilit]
- Luo, X.; Zeng, E.; Ji, R.; Wang, C. Effects of in-channel sand excavation on the hydrology of the Pearl River Delta, China. J. Hydrol. 2007, 343, 230–239. [Google Scholar] [CrossRef] [Scilit]
- Jia, L.; Luo, Z.; Yang, Q.; Ou, S.; Lei, Y. Impacts of the large amount of sand mining on riverbed morphology and tidal dynamics in lower reaches and delta of the Dongjiang River. J. Geogr. Sci. 2007, 17, 197–211. [Google Scholar] [CrossRef] [Scilit]
- Yao, J.; Zhang, D.; Li, Y.; Zhang, Q.; Gao, J. Quantifying the hydrodynamic impacts of cumulative sand mining on a large river-connected floodplain lake: Poyang Lake. J. Hydrol. 2019, 579, 124156. [Google Scholar] [CrossRef] [Scilit]
- de Leeuw, J. Strategic assessment of the magnitude and impacts of sand mining in Poyang Lake, China. Regional. Environ. Change 2010, 10, 95–102. [Google Scholar] [CrossRef] [Scilit]
- Zhong, Y.; Yue, H.; Yao, S.; Zhu, S.; Zhao, Z. Influence of sand mining on river regime in typical river channel of Xiangjiang River. Yangtze River 2021, 52, 10–15. [Google Scholar] [CrossRef]
- Fan, L.; Yu, Z.; Zhang, Y.; Wang, X.; Li, J. Influence analysis of sand mining on flow condition of local channel in tail-streams of Xiangjiang River. Yangtze River 2015, 46, 20–22+33. [Google Scholar] [CrossRef]
- Yang, X.; Hei, P. Effect of Artificial Sand Excavation on Fluvial Process of Huaihe River Bengbu to Fushan Reach. J. Basic Sci. Eng. 2011, 19, 78–84. [Google Scholar]
- Hu, Z.; Wang, E.; Wang, X. Analysis of channel evolution under combined action of reservoir and channel sand excavation. J. Water Resour. Water Eng. 2015, 26, 178–183. [Google Scholar]
- Park, E. Sand mining in the Mekong Delta: Extent and compounded impacts. Sci. Total Environ. 2024, 924, 171620. [Google Scholar] [CrossRef] [Scilit] [PubMed]
- Ahmed, M.F.; Binh, D.V.; Kantoush, S.A.; Park, E.; Doan, N.L.P.; Tuan, L.A.; Dinh, V.N.; Vu, T.H.; Nguyen, B.Q.; Ngoc, T.A.; et al. Intensified susceptibility to riverbed incisions under sand mining impacts in the Vietnamese Mekong Delta: A long-term spatiotemporal analysis. Geomorphology 2025, 470, 109535. [Google Scholar] [CrossRef] [Scilit]
- Rentier, E.S.; Cammeraat, L.H. The environmental impacts of river sand mining. Sci. Total Environ. 2022, 838, 155877. [Google Scholar] [CrossRef] [Scilit] [PubMed]
- Jiang, H.; Lu, X.; Yu, Q.; Wu, Z.; Yang, X. Fluvial Process of Fuyang Reach of Fuchun River after Exploiting Sand in A Large Scale. J. Sediment. Res. 2002, 27, 64–68. [Google Scholar] [CrossRef]
- Liu, B.; Ma, X.; Wang, J. Effects evaluation of river sand mining on flood control safety based on MIKE21 model. Hydro Sci. Cold Zone Eng. 2023, 6, 145–148. [Google Scholar]
- Iqbal, S.; Tanaka, N. An Experimental Investigation on Dike Stabilization against Floods. Geosciences 2023, 13, 307. [Google Scholar] [CrossRef] [Scilit]
- Wang, G.; Qian, P.; Zou, Y. Analysis of the Impact of River Sand Mining on Embankment Safety. Yangtze River 2004, 35, 27–28. [Google Scholar]
- Yu, H.; Xia, Y.; Wang, Z.; Peng, Q. Numerical Simulation Study on Effect of Different Longitudinal Profile Dimensions of Sandpit on Riverbed Evolution of Pebble Channel: A Case of Shuangsheng Section of Shiting River. Adv. Eng. Sci. 2017, 49, 83–91. [Google Scholar] [CrossRef]
- Hackney, C.; Darby, S.E.; Parsons, D.R.; Leyland, J.; Best, J.L.; Aalto, R.; Nicholas, A.P. River bank instability from unsustainable sand mining in the lower Mekong River. Nat. Sustain. 2020, 3, 217–225. [Google Scholar] [CrossRef] [Scilit]
- Ding, J.; Lin, X.; Lu, X.; Ding, L.; Yang, Z. Problems and research progress of river sand mining management. Adv. Sci. Technol. Water Resour. 2021, 41, 81–88. [Google Scholar]
- Yu, Z.; Song, Y.; Luo, C.; Wu, Q.; Fan, L. Basic framework for sustainable development of sand excavation in river courses. China Water Resour. 2015, 27–30. Available online: https://kns.cnki.net/kcms2/article/abstract?v=A-1EuXenf_qpneTtHoW3nLfYrTVdzZpB411Dtn3tKirIn0yA2FZziAkLK1eJR5MMLdoS6p1GVAsp8LOvqnO6SEFkAmZhpjZz7Su_0D2wfdE7NfILOWMqAPDiI86_5BZKoZkDhTStzV5gYTq_wYsmlF50yuRRUrKaSSXxxRrlkt9d4QcsYUhjrQ==&uniplatform=NZKPT&language=CHS (accessed on 17 December 2025).
- Ojha, S.; Choudhary, S. Environmentally Sustainable Sand Mining Based on GIS based Sediment Yield Estimation. Eng. Technol. India 2017, 8, 49–57. [Google Scholar] [CrossRef] [Scilit]
- Tran, T.K.; Huong, N.T.M.; Huy, N.D.Q.; Tai, P.A.; Hong, S.; Quan, T.M.; Bay, N.T.; Jeong, W.; Phung, N.K. Assessment of the Impact of Sand Mining on Bottom Morphology in the Mekong River in An Giang Province, Vietnam, Using a Hydro-Morphological Model with GPU Computing. Water 2020, 12, 2912. [Google Scholar] [CrossRef] [Scilit]
- Ali, P.F.; Gan, G.G.G.; Asmawi, A. Strategies for Achieving Sustainable Management of Offshore Sand Mining in Malaysia. Sustainability 2025, 17, 1679. [Google Scholar] [CrossRef] [Scilit]
- Mo, L.; Zhang, Z.; Yao, J.; Ma, Z.; Cong, X.; Yu, X. Analysis of Hydrological Changes in the Fuhe River Basin in the Context of Climate Change. Sustainability 2024, 16, 7418. [Google Scholar] [CrossRef] [Scilit]
- Ge, H.; Deng, C. Analysis of changes of relationship between water level and discharge and its causes at the tail of Fuhe River in recent 70 years. E3S Web Conf. 2020, 206, 03030. [Google Scholar] [CrossRef] [Scilit]
- Hu, Q.; Xu, G.; Yuan, J. Influence of sand mining on river stability in Wengang section of Fuhe River. Jiangxi Hydraul. Sci. Technol. 2025, 51, 279–284. [Google Scholar]
- Pearl River Water Resources Commission of the Ministry of Water Resources. Available online: https://www.pearlwater.gov.cn/xwzxcs/lysscs/202401/t20240118_123920.html (accessed on 17 December 2025).
- Deng, S.; Wang, Z.; Wu, L.; Wu, T.; Xia, Y.; Liu, Y. Research on Joint Operation of Flood Diversion and Storage Measures: A Case Study of Poyang Lake. Sustainability 2025, 17, 1522. [Google Scholar] [CrossRef] [Scilit]
- Tan, Y.; Cao, J.; Xiang, W.; Xu, W.; Tian, J.; Gou, Y. Slope Stability Analysis of Saturated-Unsaturated Based on the GEO-Studio: A Case Study of Xinchang Slope in Lanping County, Yunnan Province, China. Environ. Earth Sci. 2023, 82, 322. [Google Scholar] [CrossRef] [Scilit]
- National Digital Library of Standards. Available online: https://www.ndls.org.cn/standard/detail/090f42860d89a75e1fc159332af18b2f (accessed on 21 January 2026).
- Department of Housing and Urban-Rural Development of Jiangxi Province. Available online: https://zjt.jiangxi.gov.cn/jxszfhcxjst/gqcyc/pc/list.html (accessed on 17 December 2025).
- Wang, Z.; Yang, G.; Chen, D.; Zhang, K. Optimal Model for River Sand Resource Utilization Based on River Safety. J. Hydraul. Eng. 2013, 44, 958–965. [Google Scholar] [CrossRef]

Disclaimer/Publisher’s Note: The statements, opinions and data contained in all publications are solely those of the individual author(s) and contributor(s) and not of MDPI and/or the editor(s). MDPI and/or the editor(s) disclaim responsibility for any injury to people or property resulting from any ideas, methods, instructions or products referred to in the content. |
© 2026 by the authors. Licensee MDPI, Basel, Switzerland. This article is an open access article distributed under the terms and conditions of the Creative Commons Attribution (CC BY) license.