


Abstract
Indian metropolitan cities such as Mumbai grapple with rapid urbanisation, extreme urban density, high built-up areas, loss of green cover, and shrinking open spaces, resulting in increased impermeable surfaces, urban heat island effects, and frequent flooding occurrences. Modern stormwater management has increasingly been characterised by integrated grey-green approaches; however, cities in the Global North benefit from established policies, technical expertise, and financial resources that enable the systematic and large-scale integration of Blue-Green Infrastructure (BGI) through district-wide geospatial assessment frameworks, unlike many cities in the Global South. Despite growing interest in nature-based stormwater solutions, there remains a dearth of geospatial empirical research from India examining the placement, distribution, performance, and functionality of BGI integrated with existing stormwater management systems in cities such as Mumbai. Furthermore, hydrological modelling using tools such as the Storm Water Management Model (SWMM) for the design, planning, and implementation of BGI in Indian cities remains largely unexplored. This study explores the role of BGI strategies in improving urban stormwater management within high-density Indian cities under a 25-year return period extreme rainfall scenario. Using an integrated approach that combines QGIS-based spatial analysis with EPA-SWMM hydrologic-hydraulic modelling, the research examines runoff behaviour, identifies flooding hotspots, and evaluates the effectiveness of Low Impact Development (LID)-based BGI measures such as permeable pavements, infiltration trenches, and green roofs applied at the ward level in Mumbai’s F/North and G/North Wards. Detailed land use classification, spatial mapping, and rainfall simulation corresponding specifically to a 25-year return period rainfall event was used to assess pre- and post-intervention conditions. The findings indicate that the applied BGI measures led to a 12.6% reduction in peak runoff (137.6 m3/s to 120.2 m3/s) and a 5.5% decrease in total runoff volume (783,510 m3 to 740,410 m3). More importantly, the peak flooding flow rate decreased by 45% (94.1 m3/s to 51.7 m3/s), demonstrating that BGI measures can efficiently reduce peak flooding flows by extending runoff hydrographs during extreme rainfall events. These findings are specifically applicable to the simulated 25-year return period extreme rainfall scenario and may vary under different rainfall intensities or return periods. Less extreme events could potentially experience even greater relative reductions or prevent flooding altogether, while also easing downstream hydraulic loads. Overall, strategically placed BGI interventions can significantly reduce surface runoff and peak flow, thereby enhancing stormwater resilience within spatially constrained urban environments. This study provides a replicable, data-driven framework for catchment-scale stormwater planning in dense Indian cities under extreme rainfall conditions, offering practical insights into methods, local contextual considerations, and spatial planning strategies for policymakers and urban planners seeking to retrofit and adapt existing infrastructure under increasing hydrologic stress and climate variability.
1. Introduction
Urbanisation is one of the defining demographic trends of the twenty-first century, with the global urban population projected to increase from 55% to 68% by 2050 [1]. Much of this growth is expected to occur in Asia and Africa, which together are projected to account for nearly 90% of the future increase in urban population [2]. Among these regions, India, China, and Nigeria are expected to contribute approximately 35% of global urban growth, with India alone projected to add around 416 million urban residents. Despite this rapid expansion, urbanisation patterns in India differ from those observed in many other countries. As of 2025, approximately 35% of India’s population resides in urban areas, projected to increase to 50% by 2050, while China’s urbanisation rate exceeded 61% in 2021 and is projected to reach approximately 70% by 2035 [3]. In contrast, countries in the Global North such as the United States, the United Kingdom, and several European Union states have maintained urbanisation levels exceeding 80% for several decades.
Urban growth in India is spatially uneven, with megacities such as Mumbai, Delhi, Bengaluru, Chennai, and Kolkata accommodating a large share of the expanding urban population. Secondary metropolitan centres such as Pune, Hyderabad, and Ahmedabad are also experiencing significant growth, while smaller cities remain comparatively underutilised in absorbing urban migration. Large disparities also exist between states: Maharashtra, Gujarat, Tamil Nadu, and Kerala have urbanisation levels exceeding 40%, whereas states such as Uttar Pradesh, Bihar, and Rajasthan remain substantially less urbanised. Rapid and frequently unplanned urban expansion has intensified several environmental and infrastructural challenges, including ageing and inadequate stormwater management infrastructure, urban flooding, air pollution, congestion, urban heat island effects, and increasing vulnerability to climate-related hazards.
In response to these challenges, Blue-Green Infrastructure (BGI) has emerged as a promising approach for integrating stormwater management with ecological restoration and urban green space planning. BGI interventions including permeable pavements, green roofs, rain gardens, wetlands, and bio-retention systems combine hydrological and ecological functions within urban environments. Numerous studies demonstrate that BGI can improve stormwater management by reducing runoff volumes, delaying peak flows, and enhancing urban resilience to flooding.
Recent studies indicate a growing global shift from conventional grey infrastructure toward integrated grey–green stormwater management systems. Hydrological modelling and empirical analyses show that BGI elements such as permeable pavements, swales, bio-retention basins, and green roofs can significantly reduce peak runoff and improve stormwater retention compared with conventional drainage systems [4]. In many urban settings, BGI has been shown to reduce runoff volumes by 20–40% when implemented at sufficient scales [5]. In Southeast Asian contexts, studies report peak flow reductions of up to 95% under certain conditions, while also demonstrating reductions in inundated areas and associated disaster losses [6]. Nevertheless, the effectiveness of BGI depends on local climatic conditions, soil properties, rainfall intensity, and urban morphology. Several studies have also evaluated BGI and LID performance under high-intensity and extreme rainfall scenarios to assess urban flood resilience, drainage system stress, and climate adaptation capacity in densely urbanised environments [7].
Despite this growing body of global evidence, most research and implementation efforts have been concentrated in countries of the Global North, where institutional frameworks, technical expertise, and financial resources facilitate systematic adoption of BGI approaches. A global review of 797 studies on BGI planning and implementation found that only 26% addressed developing-country contexts, with the majority focusing on China and very few examining the Indian context [8]. Consequently, the applicability of existing BGI knowledge to Indian cities remains limited, as urban conditions differ significantly from those of many Global North contexts where these concepts were originally developed. Rapid urbanisation, infrastructure deficits, and environmental degradation place additional pressures on Indian urban systems [7]. Although some studies suggest that spatial patterns of urban green infrastructure can influence flood risk and hydrological performance in rapidly urbanising cities such as Pune and Bengaluru [9], the available literature remains fragmented and rarely integrates hydrological modelling, spatial analysis, and urban infrastructure data at detailed spatial scales. In particular, there is limited research examining the spatial distribution, placement, and design feasibility of BGI interventions within high-density urban environments typical of Indian megacities.
These research gaps are particularly evident in Mumbai, one of India’s largest and most densely populated metropolitan areas. Located on the western coast of India, the Mumbai Metropolitan Region covers approximately 6328 km2 and includes nine municipal corporations. The Greater Mumbai municipal area alone covers approximately 437 km2 and comprises 24 administrative wards. Rapid urban expansion following India’s economic liberalisation reforms in 1991 accelerated industrial growth, foreign investment, and urban development across major metropolitan regions [10]. As a result, Mumbai has experienced substantial increases in built-up areas and urban density. In several wards of the city, population densities exceed 30,000 persons per square kilometre, and more than half of the city’s population resides in informal settlements [11]. Current estimates suggest that approximately 50–60% of Mumbai’s residents live in informal settlements occupying only 15–20% of the city’s land area [12].
Urbanisation and land use change have significantly altered Mumbai’s environmental and hydrological conditions. Between 1988 and 2018, the city lost approximately 45.2% of its green cover, with the proportion of green spaces declining from 46.7% to 26.67% of the total urban area [13]. This reduction in vegetated surfaces, combined with extensive construction activity and increasing impermeable surfaces, has contributed to rising urban temperatures and increased surface runoff. Municipal assessments indicate that runoff coefficients in certain catchments have increased from approximately 0.5 prior to rapid urban expansion to values approaching 1.0 in highly built-up areas [14]. These conditions significantly increase the likelihood of urban flooding, particularly during intense monsoon rainfall events.
Mumbai receives an average monsoon rainfall of approximately 2300 mm between June and September each year. Extreme rainfall events frequently overwhelm the city’s drainage infrastructure, as illustrated by the severe flooding of 26 July 2005, when approximately 900 mm of rainfall occurred within a 24 h period. Such events highlight the limitations of conventional drainage systems, which rely primarily on grey infrastructure such as drains, pumping stations, and floodgates. Major initiatives such as the Brihanmumbai Stormwater Disposal System (BRIMSTOWAD) were introduced to enhance the capacity of the city’s drainage system and reduce flood risk [14,15]. However, ongoing urban expansion and increasing rainfall variability associated with climate change continue to challenge the effectiveness of these conventional systems.
Integrating BGI with existing stormwater infrastructure has therefore been increasingly recognised as a promising strategy for enhancing urban flood resilience while delivering additional environmental and social benefits. Effective implementation of BGI requires detailed spatial assessment of urban morphology, drainage networks, land use patterns, and hydrological characteristics. Hydrological modelling tools such as the EPA Stormwater Management Model (SWMM) provide robust capabilities for simulating urban runoff processes and evaluating potential stormwater management interventions under different scenarios. SWMM enables spatial representation of urban catchments, integration of rainfall data and drainage infrastructure, and simulation of runoff dynamics within complex urban environments.
Despite the widespread application of hydrological modelling and BGI strategies internationally, their combined application in Indian megacities remains limited. Most existing studies focus on metropolitan-scale analyses rather than detailed catchment-level or ward-level assessments. There is therefore a need for spatially explicit and data-driven research that evaluates the feasibility of integrating BGI within existing urban drainage systems in rapidly urbanising cities such as Mumbai. Addressing this gap, this study investigates the role of BGI strategies in improving urban stormwater management within high-density Indian cities such as Mumbai by integrating QGIS-based spatial analysis with EPA-SWMM hydrologic-hydraulic modelling.
Objectives
Accordingly, this study evaluates the planning, placement, and design potential of Blue-Green Infrastructure (BGI) for urban stormwater management in the F-North and G-North wards of Greater Mumbai under a simulated 25-year return period extreme rainfall scenario using hydrological modelling and geospatial analysis.
Specifically, the study aims to:
- Develop a baseline hydrological model of the selected catchments using rainfall data corresponding to a 25-year return period event, drainage network information, and spatial datasets to simulate existing runoff conditions and identify flood-prone areas.
- Calibrate and validate the hydrological model to estimate runoff volumes and delineate flood hotspots within the study area under the simulated 25-year return period rainfall scenario.
- Assess the spatial suitability, placement, and design feasibility of BGI interventions by integrating land use, soil characteristics, groundwater conditions, and urban surface features within the context of extreme rainfall-driven urban flooding.
- Simulate BGI/LID scenarios using the SWMM framework to evaluate their effectiveness in reducing runoff volumes, peak flows, and flooding impacts under the 25-year return period extreme rainfall scenario while complementing existing grey stormwater infrastructure.
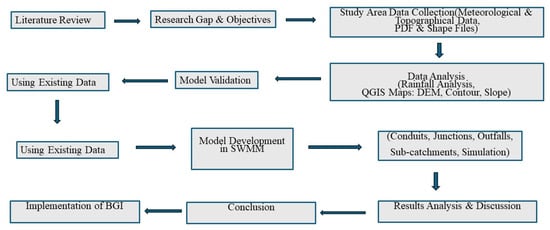
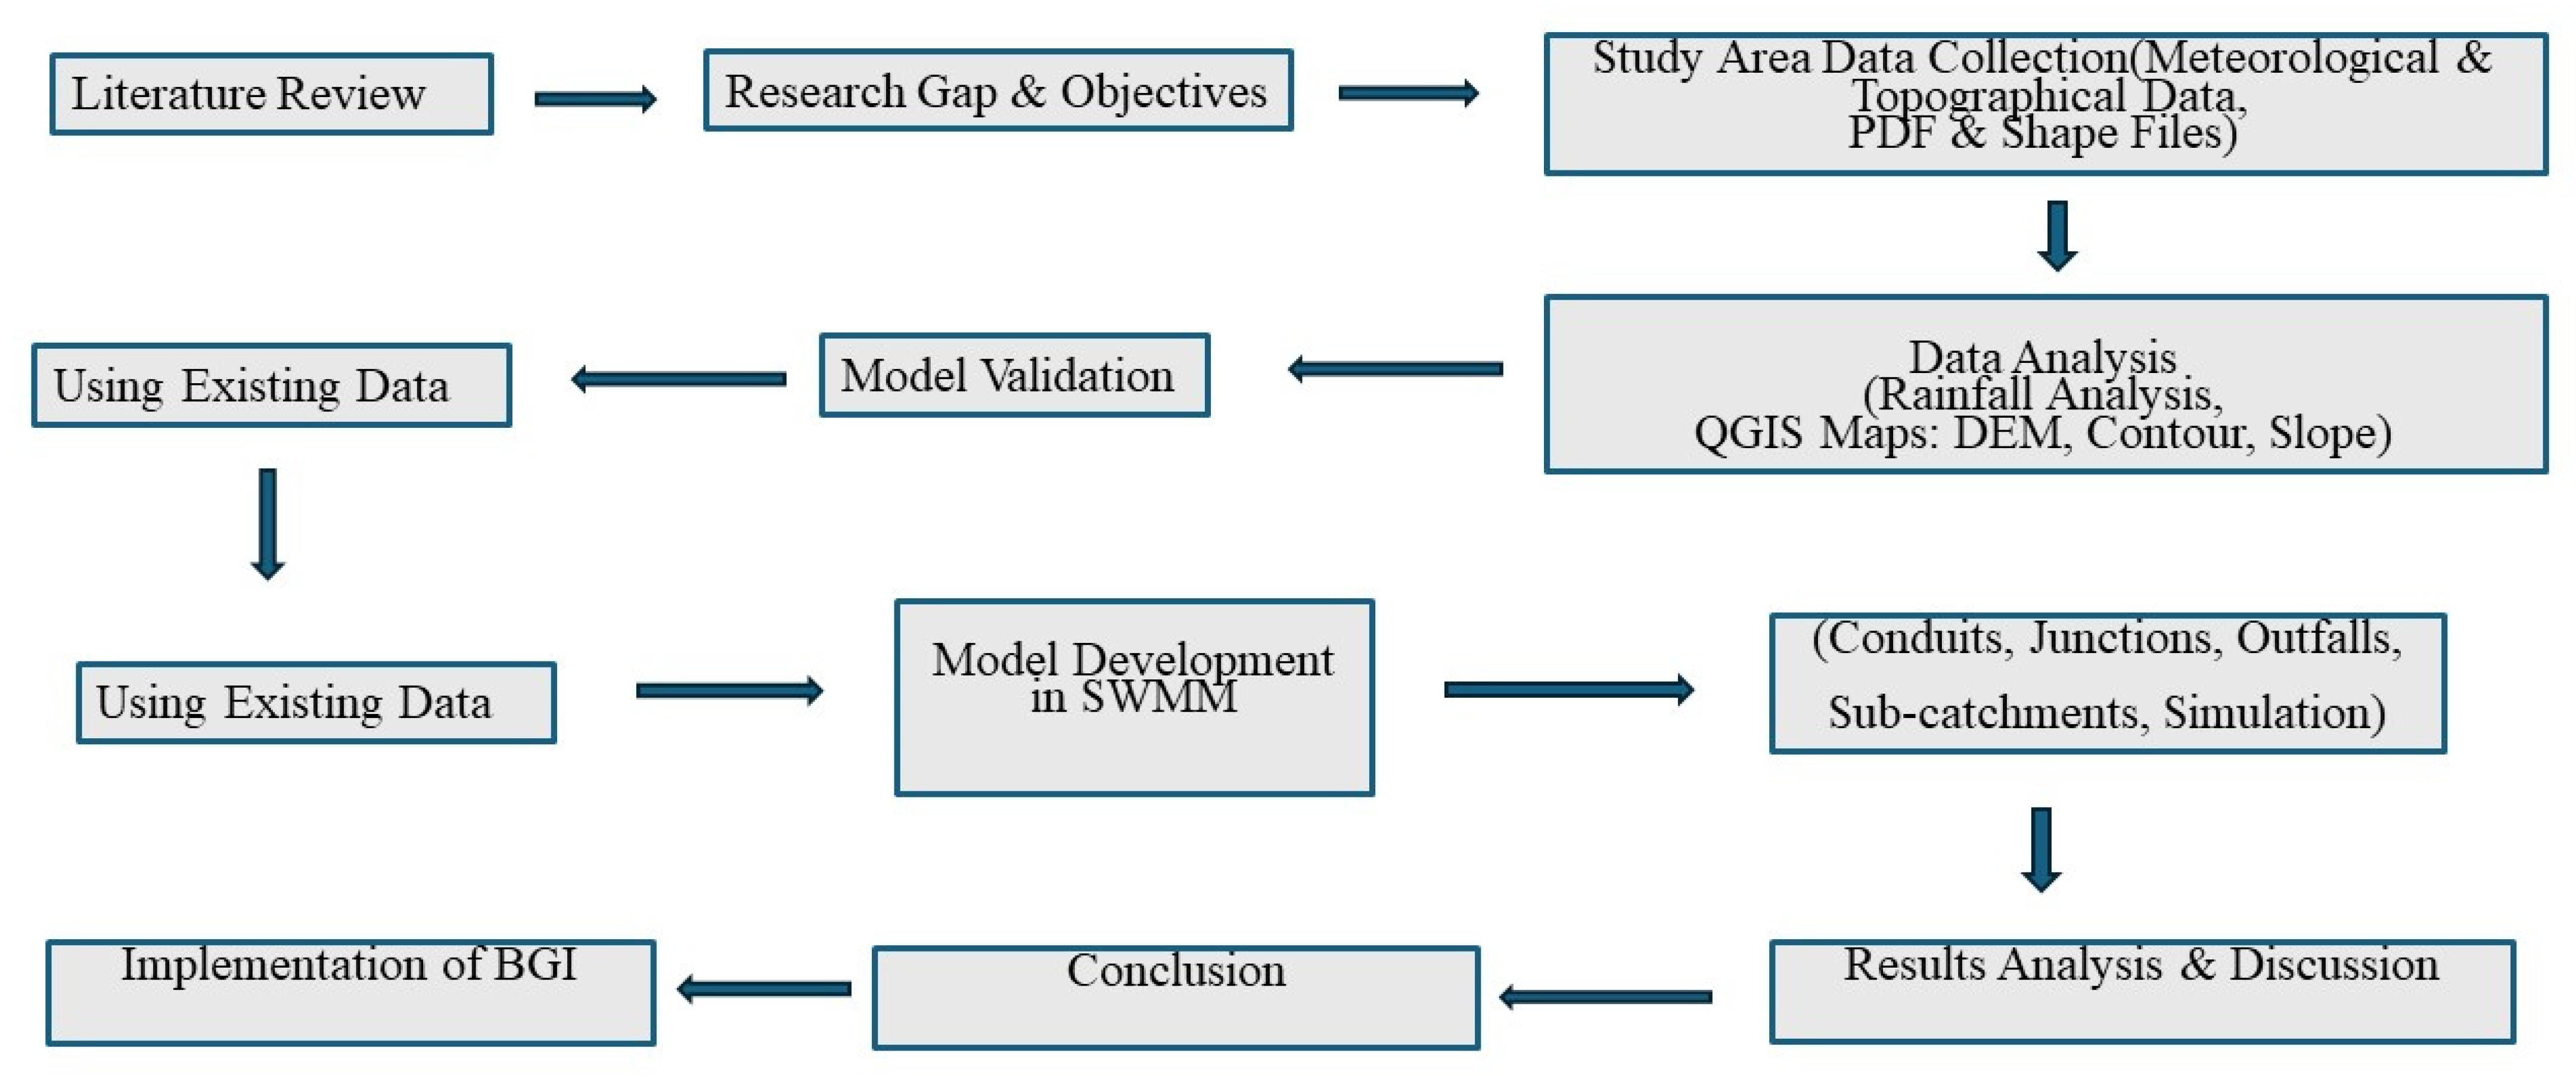
Figure 1 depicts the conceptual framework employed to undertake this study.
Figure 1.
Illustrates the conceptual framework adopted in this study.
2. Materials and Methods
2.1. Study Area Description
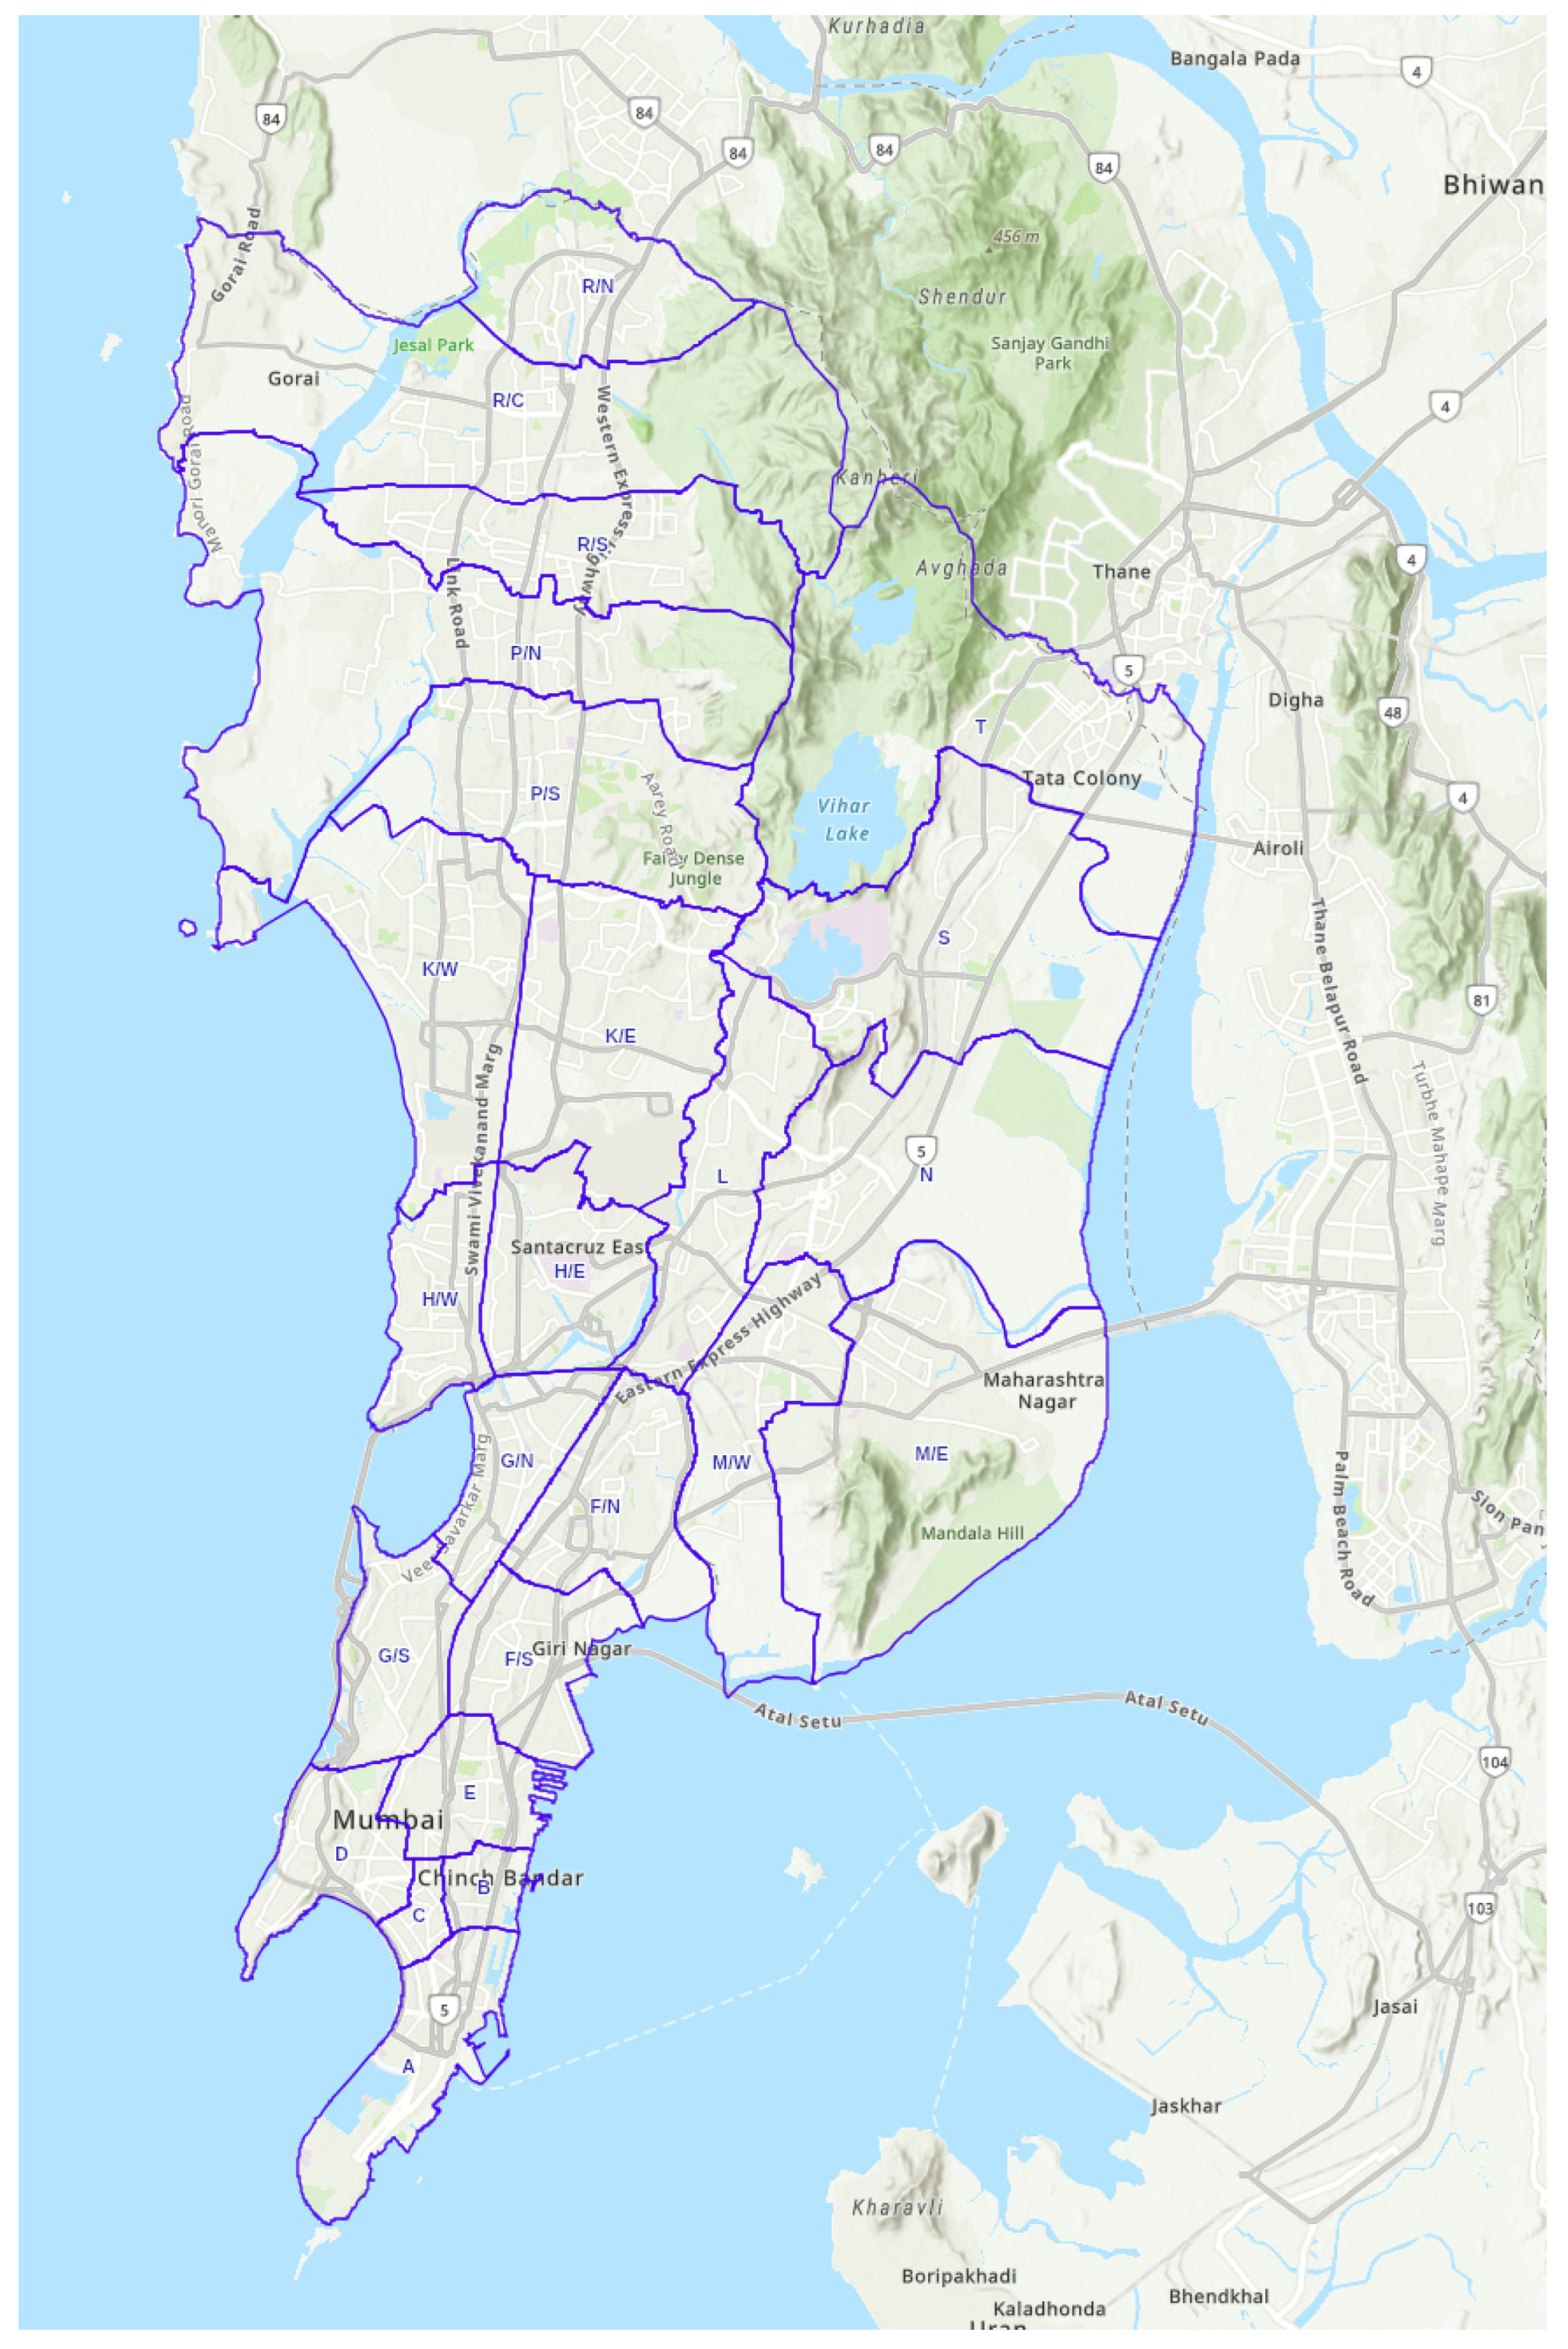
The study focuses on Ward F/N (F-North) and Ward G/N (G-North) of Mumbai, both administered by the Municipal Corporation of Greater Mumbai (MCGM) as shown in Figure 2. These centrally located wards represent highly urbanised areas characterised by a mixture of residential, commercial, industrial, and informal settlements.
Figure 2.
MCGM Ward boundaries, Source: Mumbai Wards, BMC GIS, Map, https://portal.mcgm.gov.in/irj/portal/anonymous/BMC-on-Map-NearMe-Amenities-Facilities (accessed on 19 May 2026).
Ward F/N includes neighbourhoods such as Sion, Matunga, Antop Hill, Pratiksha Nagar, Sangam Nagar, and Wadala East. Ward G/N comprises major areas including Dadar, Mahim, and Dharavi, one of the largest informal settlements in Asia. According to the 2011 Census, Ward F/N covers approximately 12.98 km2 with a population of 529,034, while Ward G/N covers 9.07 km2 with a population of 537,032 [16].
Based on the BRIMSTOWAD II Master Plan prepared by the Municipal Corporation of Greater Mumbai [14] three drainage catchments, 506 and 507 in Ward F/N (F North) and 410 in Ward G/N (G North), were selected for this study as shown in Figure 2. Catchments 506 and 507 include neighbourhoods such as King Circle, Five Gardens, Antop Hill, and parts of Matunga and Wadala East. Catchment 410 includes areas around Matunga Railway Station, Sion, and the Dharavi settlement.
These wards represent highly urbanised central areas of Mumbai characterised by a complex mix of formal and informal settlements, dense built-up environments, and critical drainage infrastructure. Catchment 410 includes parts of Dharavi, one of the largest informal settlements in Asia, while surrounding areas such as Matunga and King Circle consist largely of planned formal neighbourhoods with organised street layouts and open spaces. This combination provides an appropriate context for evaluating the spatial feasibility of BGI interventions in dense metropolitan environments.
The selected catchments were chosen due to the presence of gardens, open spaces, and relatively planned urban layouts, particularly in areas such as Five Gardens and Matunga, which provide potential locations for BGI interventions. In addition, these neighbourhoods were recommended by senior engineers of the MCGM Stormwater Drains Department due to their chronic annual flooding patterns, making them suitable locations for evaluating stormwater management strategies using hydrological modelling.
The study area is strategically located within Mumbai’s transport network, with major suburban railway stations at Dadar, Matunga, Sion, and Mahim. Road connectivity is provided by the Eastern Express Highway and Western Express Highway, which form the primary North–South corridors of the city. The Chhatrapati Shivaji Maharaj International Airport lies approximately 10 to 12 km from the study area.
Despite their economic and transport significance, these wards are highly vulnerable to flooding due to their low-lying topography and proximity to coastal drainage systems, including Mahim Creek and the Mithi River basin. During the extreme rainfall event of 26 July 2005, these areas experienced severe flooding, highlighting the limitations of existing stormwater drainage infrastructure.
Although both wards contain substantial informal settlements, this study focuses on formal settlement areas within the selected catchments to evaluate the potential integration of BGI within planned urban environments where drainage networks and land use patterns can be more reliably represented in hydrological models.
Mumbai is currently undergoing extensive urban redevelopment and slum rehabilitation processes, which are gradually transforming both formal and informal urban areas. Evaluating BGI planning potential within these catchments therefore provides insights into how nature-based stormwater management solutions can be integrated with existing grey infrastructure and scaled across other wards of the city.
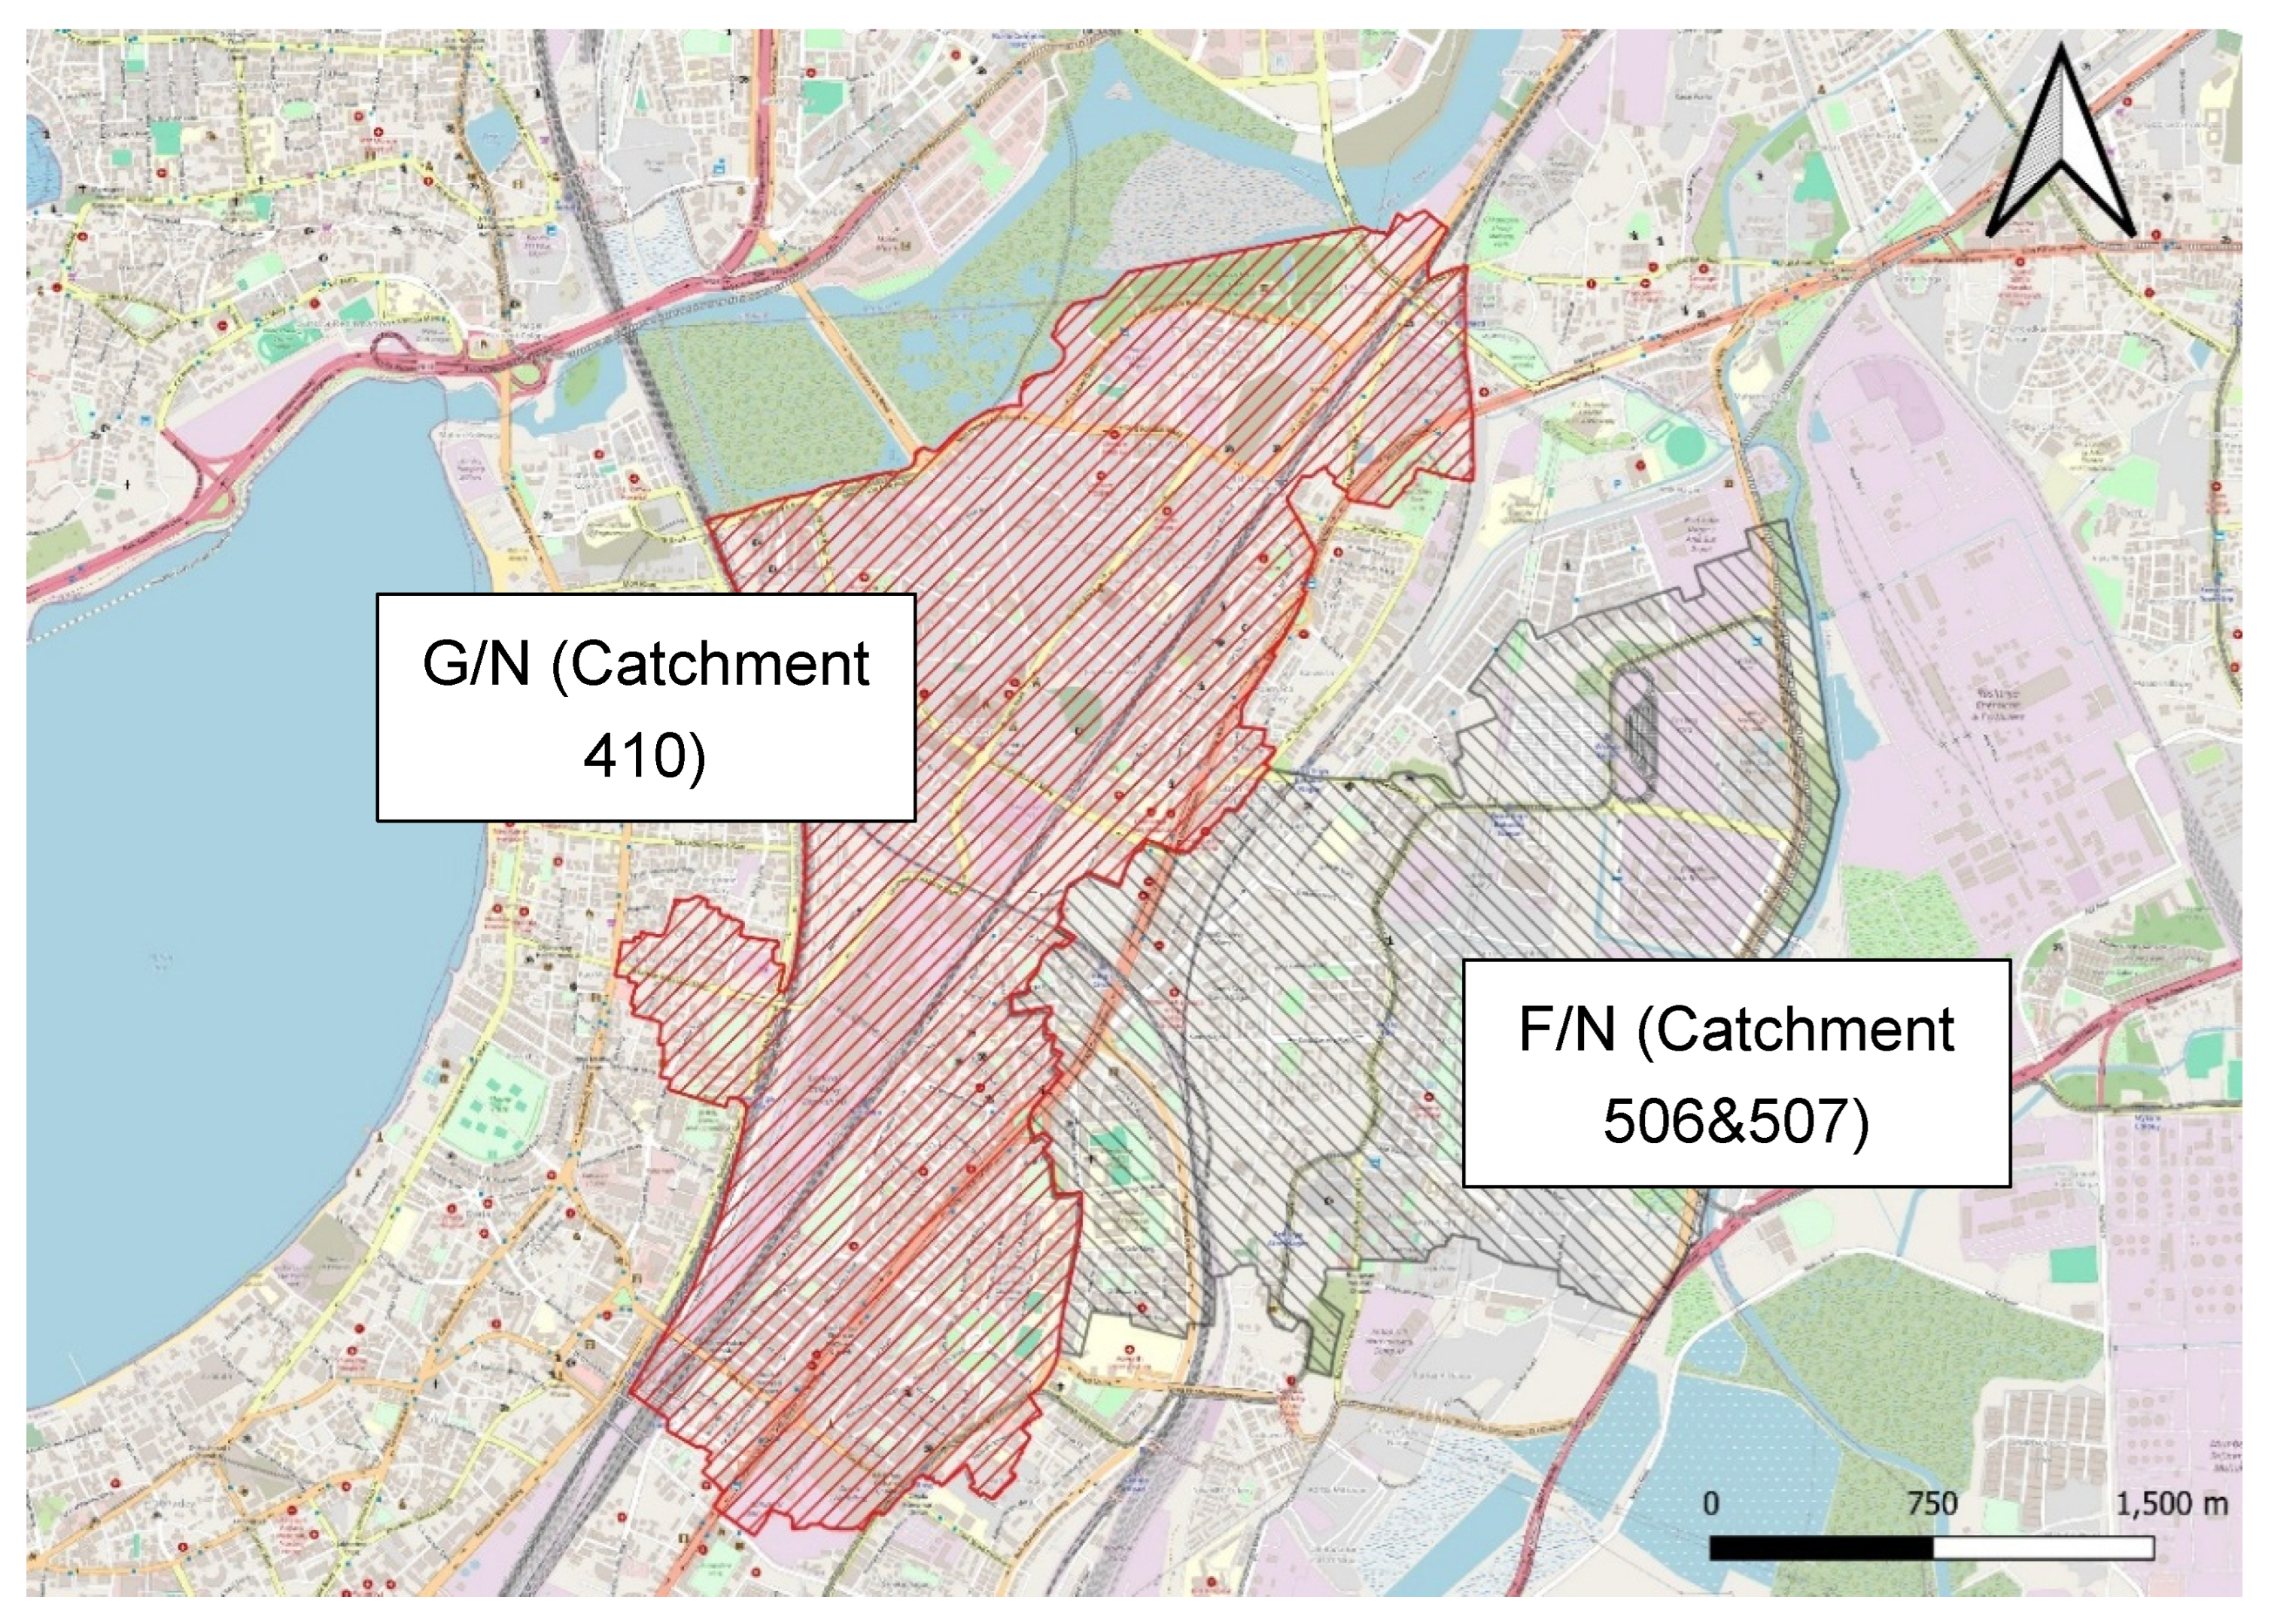
The study area experiences a tropical monsoon climate characterised by hot summers with temperatures ranging from 30 °C to 35 °C, a heavy monsoon season from June to September, and mild winters with temperatures between 15 °C and 30 °C. Monthly rainfall during the monsoon often exceeds 600 mm, making stormwater management a critical urban infrastructure challenge (India Meteorological Department). Figure 3 shows the ward level boundaries of the F/N and G/N wards of Mumbai.
Figure 3.
Ward F/N and G/N boundary, Source: Open Street Map.
2.2. Rainfall Monitoring Network
Mumbai’s rainfall monitoring system is operated by the MCGM through a network of 26 automatic rain gauge stations located across the city, primarily installed at fire stations. These gauges transmit hourly rainfall data to a central monitoring facility and are used for early flood warning when rainfall intensities exceed approximately 20 mm/hr [17].
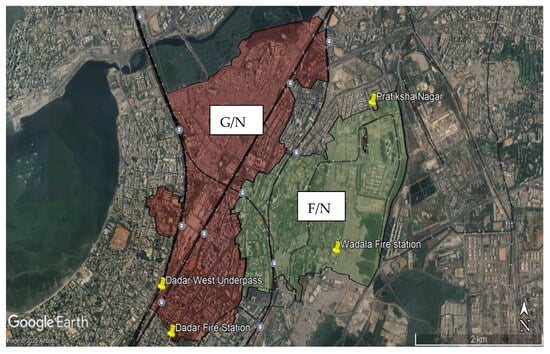
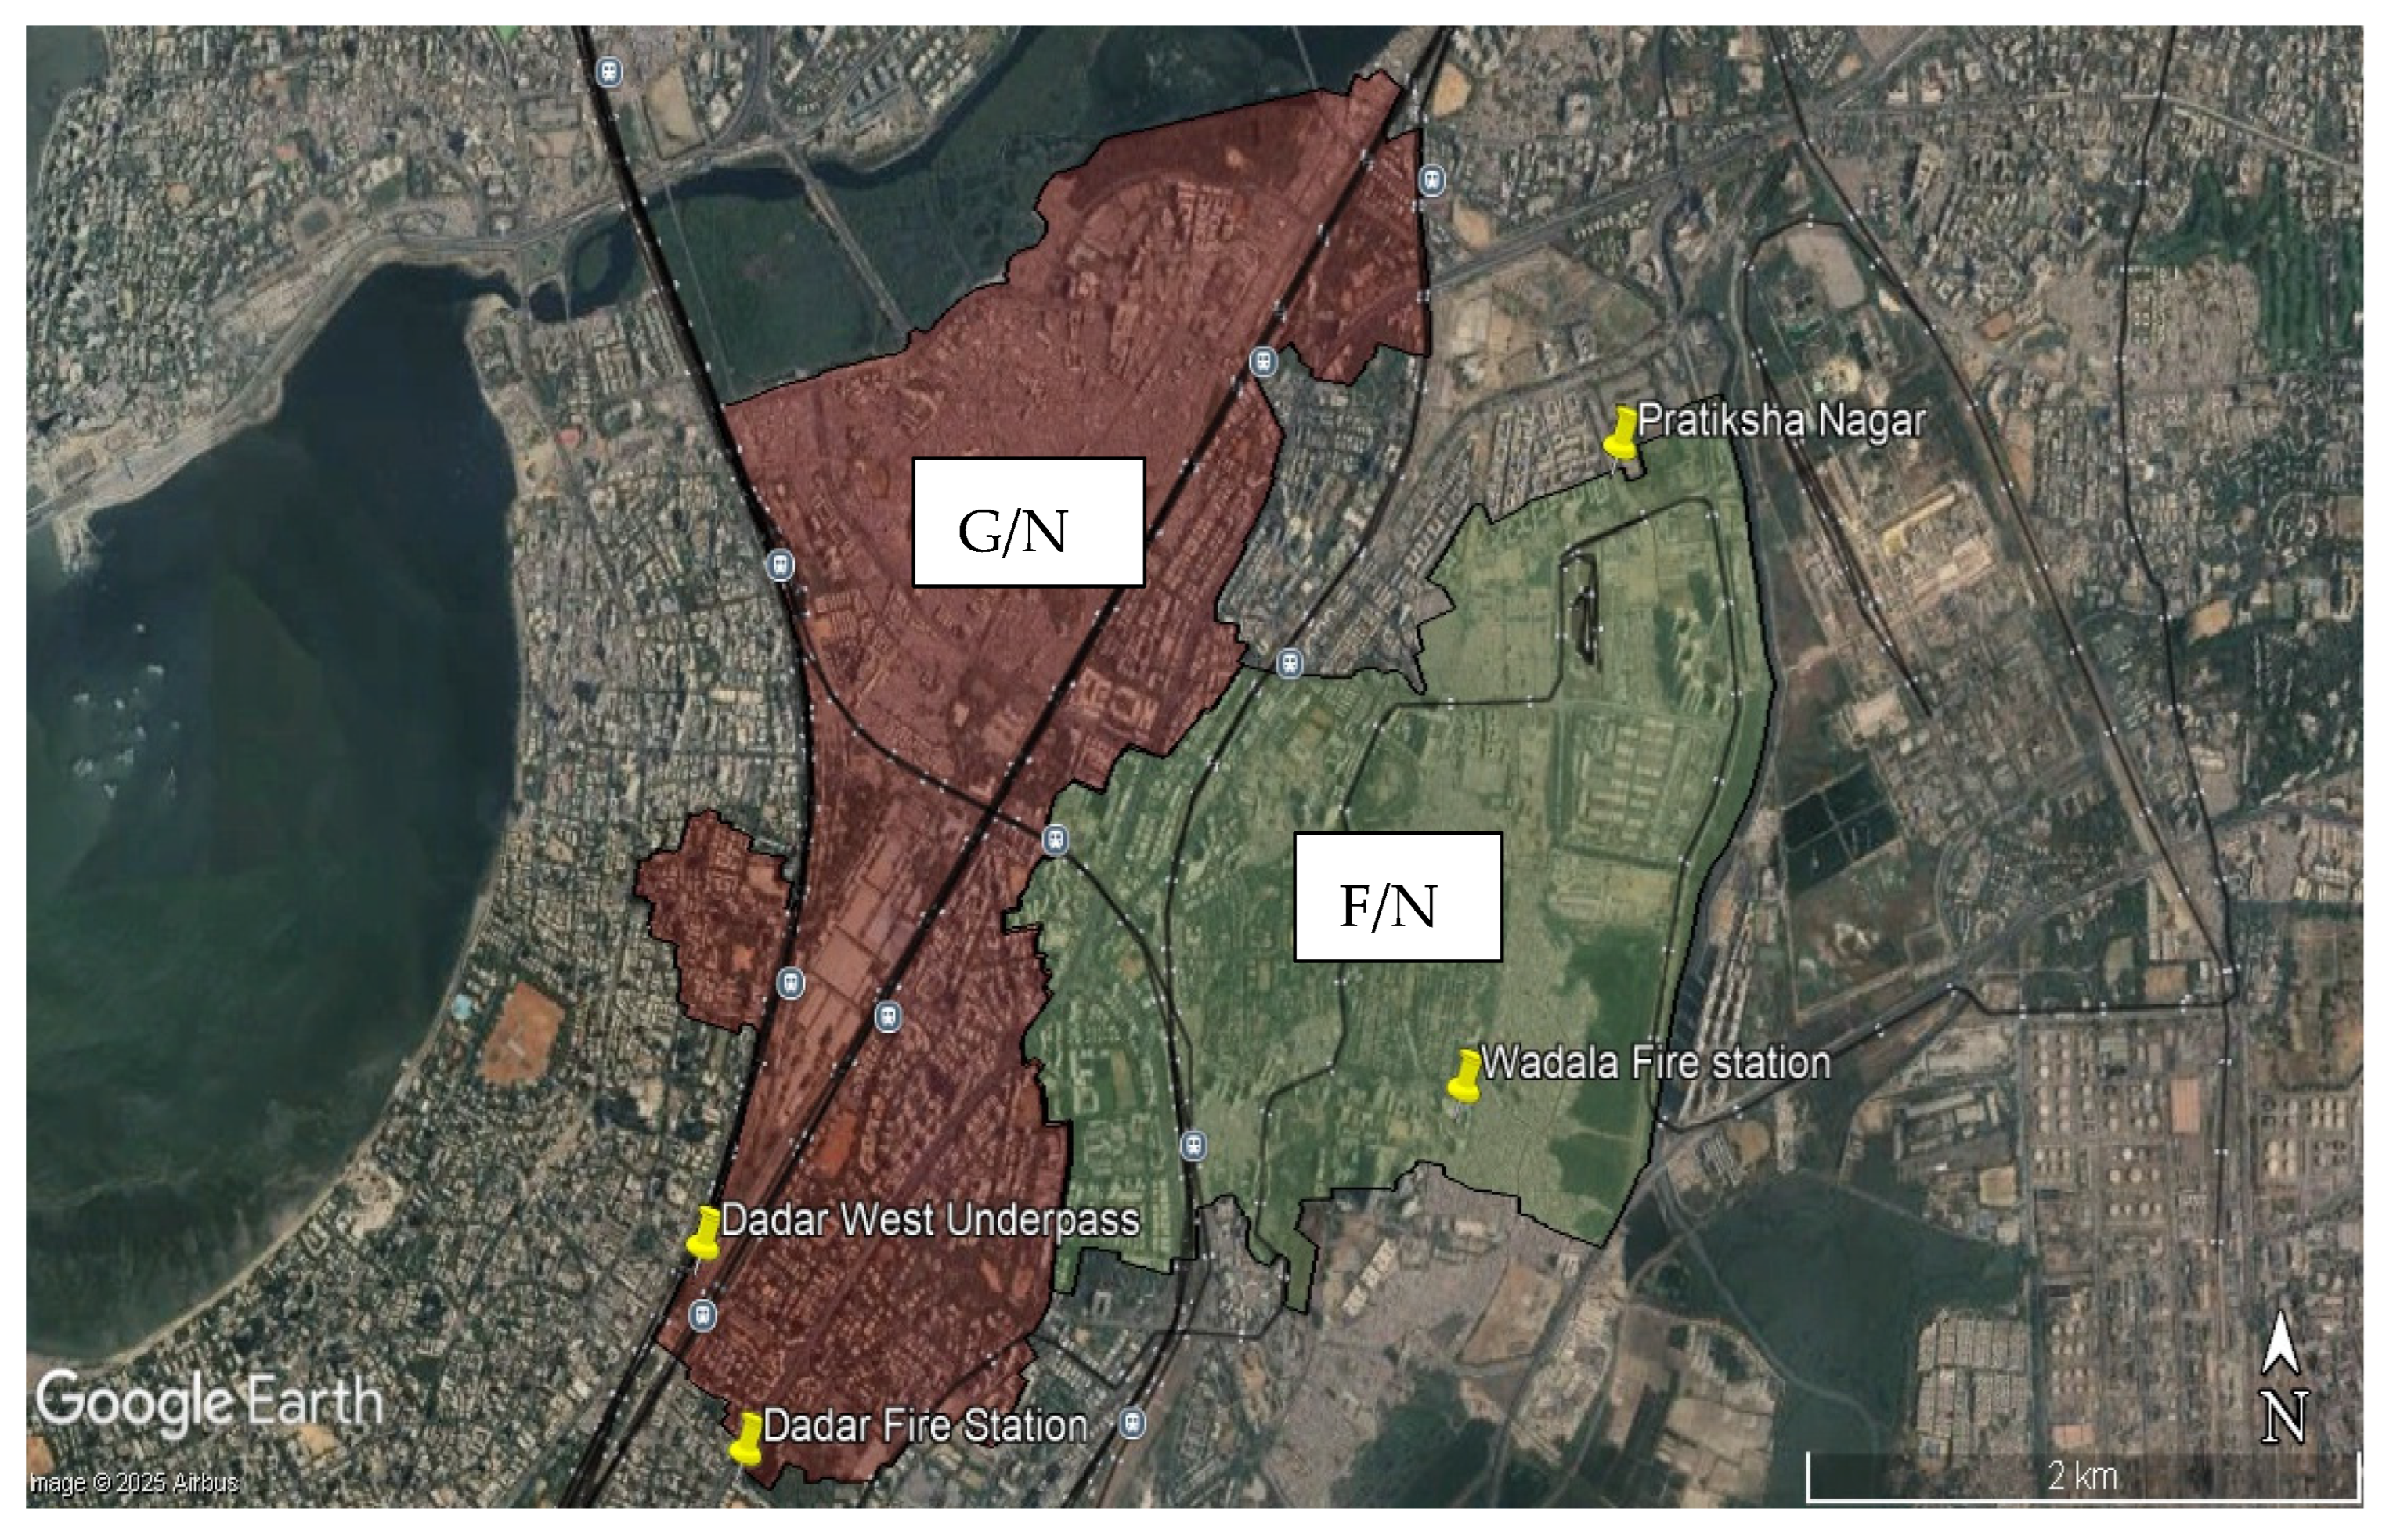
Within the study area, rainfall observations are obtained from nearby rain gauge stations located at:
- Wadala Fire Station (serving Ward F/N)
- Dadar Fire Station (serving Ward G/N)
Figure 4 shows the rain-gauge locations within the two wards.
Figure 4.
Rain gauge location within the wards of F-North and G-North.
These stations provide local rainfall intensity measurements that are monitored during monsoon periods. Additional rainfall monitoring is supported through automatic weather stations and IoT-enabled rain sensors installed in flood-prone areas such as Pratiksha Nagar and the Dadar West underpass. These sensors record rainfall at 15 min intervals, providing high-resolution data for flood monitoring and modelling.
2.3. Data Collection, Preparation and Sources
The BRIMSTOWAD II Master Plan Report (Brihanmumbai Stormwater Disposal System) prepared by the Municipal Corporation of Greater Mumbai (MCGM) serves as the primary dataset for this study. The report represents an updated and expanded version of the earlier BRIMSTOWAD I project and provides comprehensive information on Mumbai’s stormwater drainage system, including updated rainfall records, land use data, and the existing drainage network. The system is designed as a separate stormwater drainage network independent of the sewerage system to manage surface runoff during rainfall events.
The BRIMSTOWAD II dataset includes critical hydraulic and spatial information such as catchment boundaries, conduit paths, node locations, invert levels, drainage capacities, and discharge points. It also identifies flood-prone areas and drainage sections that are currently under capacity or prioritised for intervention by the MCGM. For this study, BRIMSTOWAD II data for Catchments 410, 506, and 507 within Wards G/N and F/N were used to construct the SWMM hydrological model. These datasets were obtained directly from the MCGM Stormwater Drains Department.
To simulate wet-weather flow conditions in SWMM, short-duration rainfall data were used to estimate design storm intensities. Additional input parameters required for runoff estimation included drainage basin characteristics such as catchment geometry, topography, impervious surface coverage, drainage network capacity, and receiving water body characteristics. Spatial datasets were processed in GIS to generate thematic maps including slope and contour maps derived from a Digital Elevation Model (DEM). Details of data collected for the present study is presented in Table 1.
Table 1.
Datasets used in this study and their respective sources.
2.4. Natural Watercourses (Open Drains)
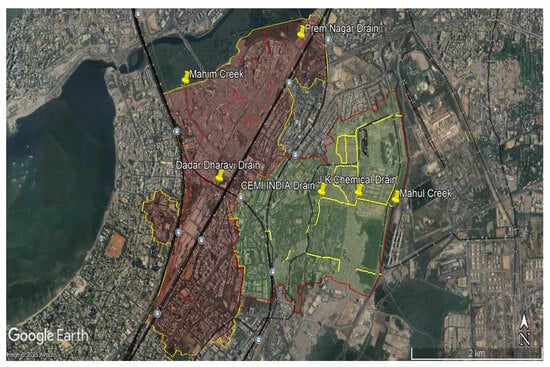
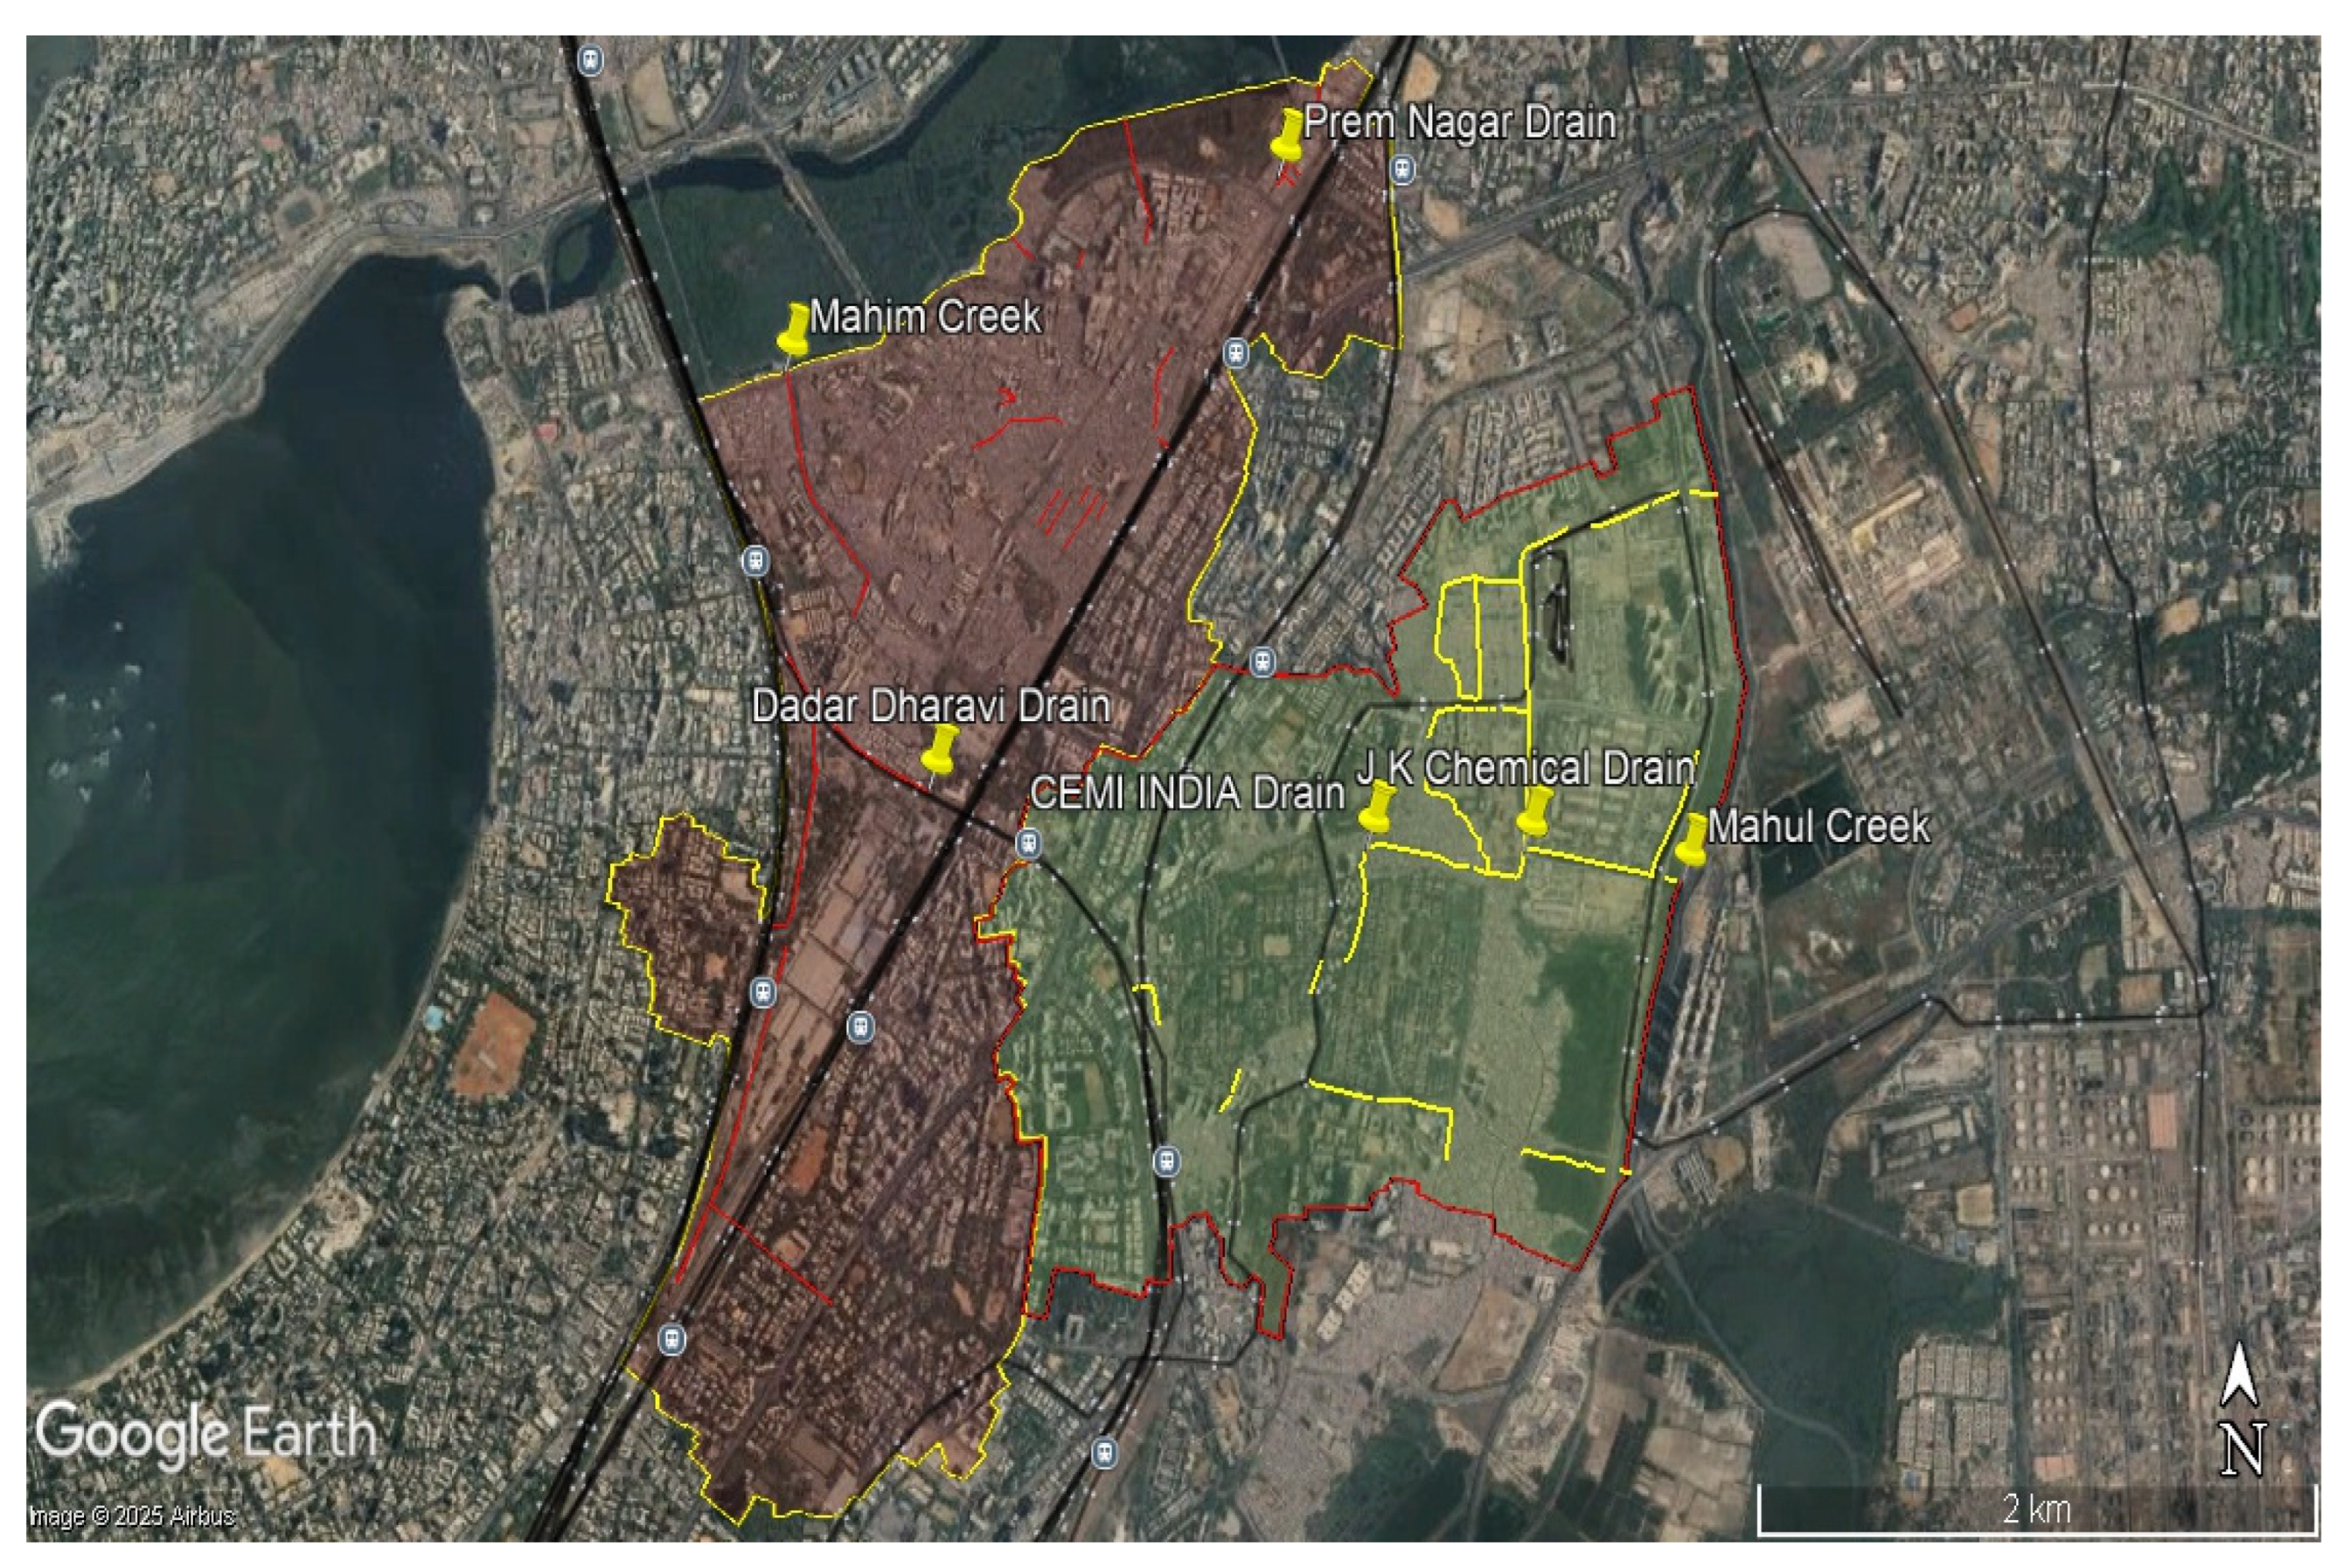
The study area within Wards F/N and G/N includes several natural watercourses that form an important component of the stormwater drainage system. In Ward F/N, the J.K. Chemicals Drain and the Cemindia Drain are the primary drainage channels, both discharging into Mahul Creek (Figure 5). These drains act as major runoff carriers during monsoon rainfall events and are particularly important for draining low-lying areas. Under the BRIMSTOWAD II Master Plan, capacity improvements have been proposed, including widening of the Cemindia Drain to 4.0 m × 3.0 m and expansion of the lower section of the J.K. Chemicals Drain to 8.0–10.5 m width and 4.5 m depth to enhance conveyance capacity [19]. In Ward G/N, Catchment 410 is primarily drained by the Dadar Dharavi Drain and the Prem Nagar Drain, which discharge into Mahim Creek (Figure 5). These drains pass through densely urbanised areas including Dharavi, Sion, and Dadar, conveying stormwater runoff and, in some sections, untreated domestic flows.
Figure 5.
Open Drain and Discharge Location.
The hydraulic efficiency of drains in Ward G/N is often reduced by siltation, tidal backflow, and encroachments along drainage corridors. These constraints significantly limit their performance during peak rainfall events. Historical flood events, particularly the 2005 Mumbai floods, have highlighted the inadequacy of these drainage channels under extreme rainfall conditions [18]. These events demonstrate the vulnerability of the existing system to high-intensity rainfall and combined urban pressures. In the subsequent modelling and simulations of this study, the 2005 extreme flood event, i.e., a 25-year return period rainfall was used to simulate without and with BGI scenarios as well as Pre and Post BGI effects.
Overall, these natural drains form the backbone of the local stormwater drainage system but are increasingly stressed by rapid urbanisation and maintenance challenges. The BRIMSTOWAD II Master Plan proposes a range of interventions, including channel widening, deepening, desilting, pumping stations, and micro-tunnelling, to improve drainage capacity and enhance flood resilience.
2.5. Existing Stormwater Drainage System in Study Area
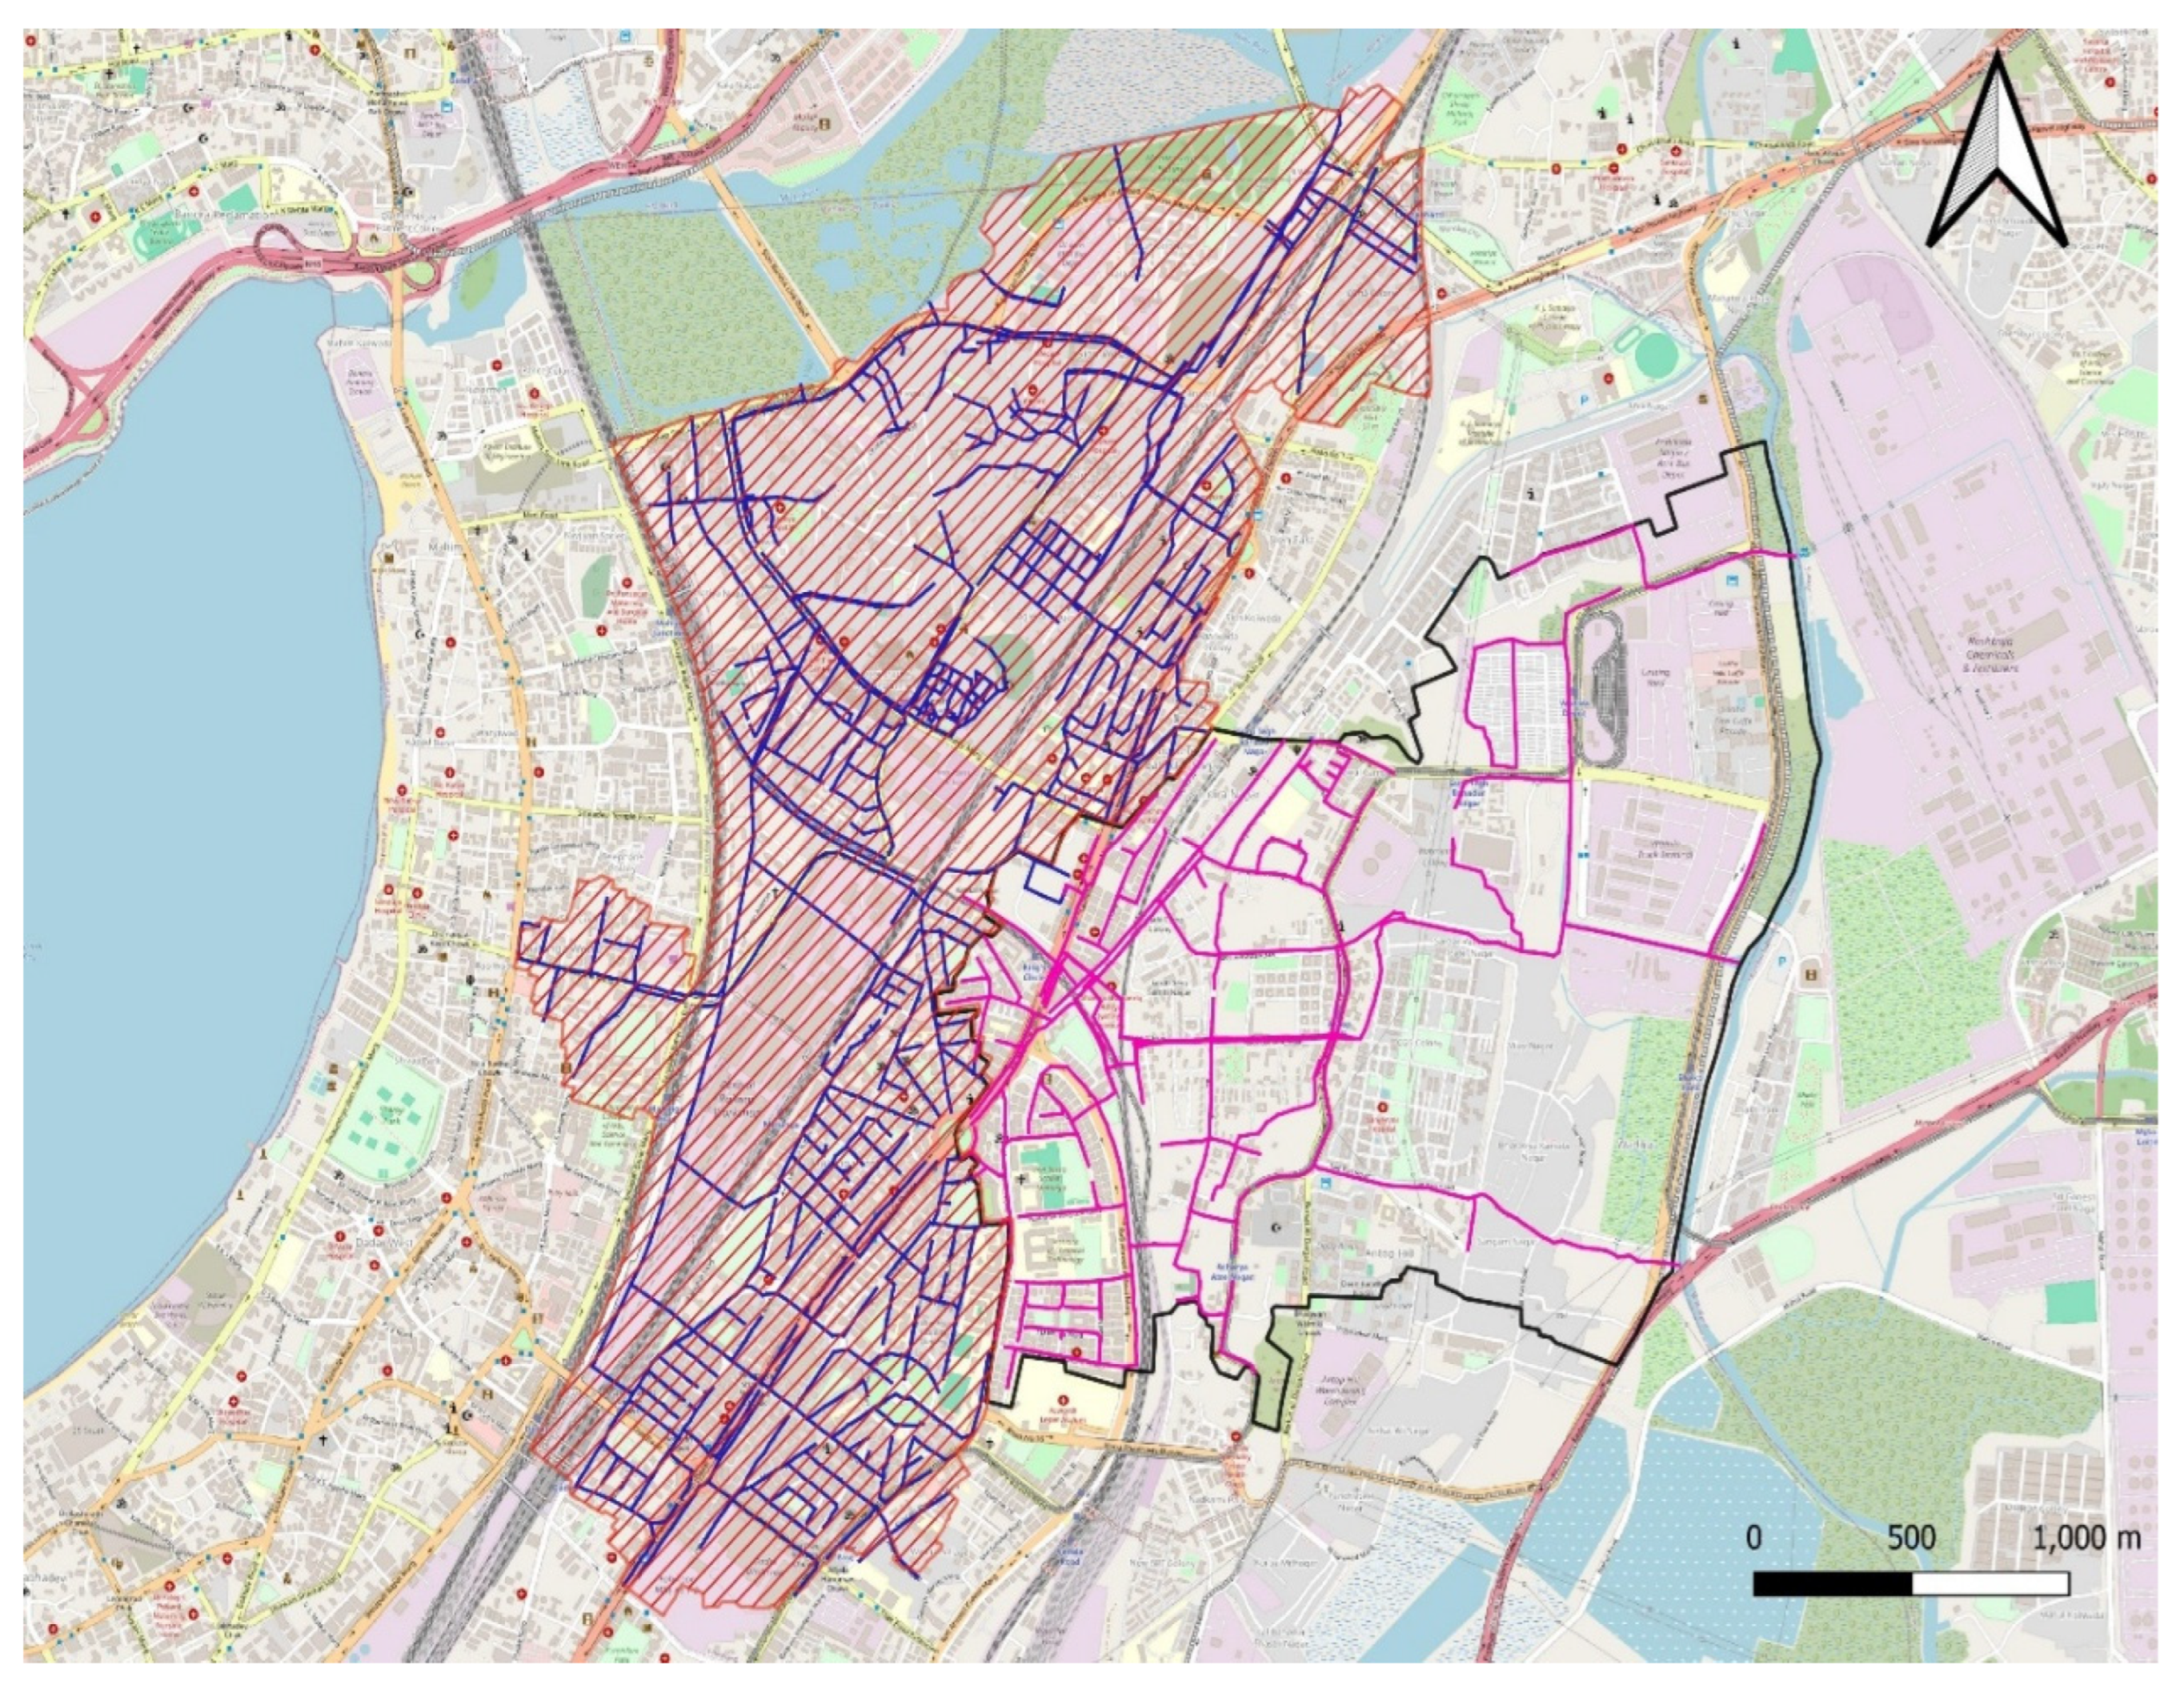
The stormwater drainage system in Wards F/N and G/N forms part of the city-wide BRIMSTOWAD II network and consists of open and underground drains. In Ward F/N, drainage is managed through Catchments 506 and 507, which discharge into Mahul Creek (Figure 5). Key channels include the J.K. Chemicals Drain and Cemindia Drain, supported by a network of drains with diameters ranging from 0.30 m to 12.00 m and a total length of approximately 32.9 km as shown in Figure 6. Upgrades such as widening and deepening of major channels have been implemented to improve drainage capacity [19].
Figure 6.
Existing Stormwater Network in Ward G/N and F/N.
In Ward G/N, Catchment 410 drains from the southern shore of Mahim Creek through the Dadar Dharavi Drain and Prem Nagar Drain, extending over 72 km with conduit sizes ranging from 0.30 m to 18.00 m as shown in Figure 6. Hydraulic performance is constrained by inadequate culverts, particularly beneath railway lines, and heavy siltation. These conditions have resulted in recurring flooding at locations such as Lal Bahadur Shastri Road, 90 Feet Road in Dharavi, and Dadar T.T. during multiple flood events between 1993 and 2011 [19].
The BRIMSTOWAD II Master Plan proposes upgrades including pumping stations at Mahim Nature Park and King Circle and micro-tunnelling to improve flow conveyance. However, implementation remains constrained by dense urban development and informal settlements. Overall, the drainage systems in both wards face increasing stress from ageing infrastructure, rapid urbanisation, and extreme rainfall events [14].
2.6. Model Setup and Calibration
2.6.1. Sub-Catchment Delineation
Sub-catchment Delineation in SWMM is the process of dividing the study area into smaller, hydrologically homogeneous units called sub-catchments to simulate runoff generation and routing. Each sub-catchment represents a portion of land that drains to a single outlet point, such as an inlet, manhole, or channel segment (United States Environmental Protection Agency, Stormwater Management Model).
The methods of delineation are as follows:
- i.
- Manual Delineation: Based on engineering judgement, local drainage patterns, and physical boundaries like roads or land use types.
- ii.
- GIS-Based Delineation: Uses Digital Elevation Models (DEMs) and hydrologic tools (e.g., ArcGIS, QGIS) to automate and refine the process.
2.6.2. Key Parameters for Delineation
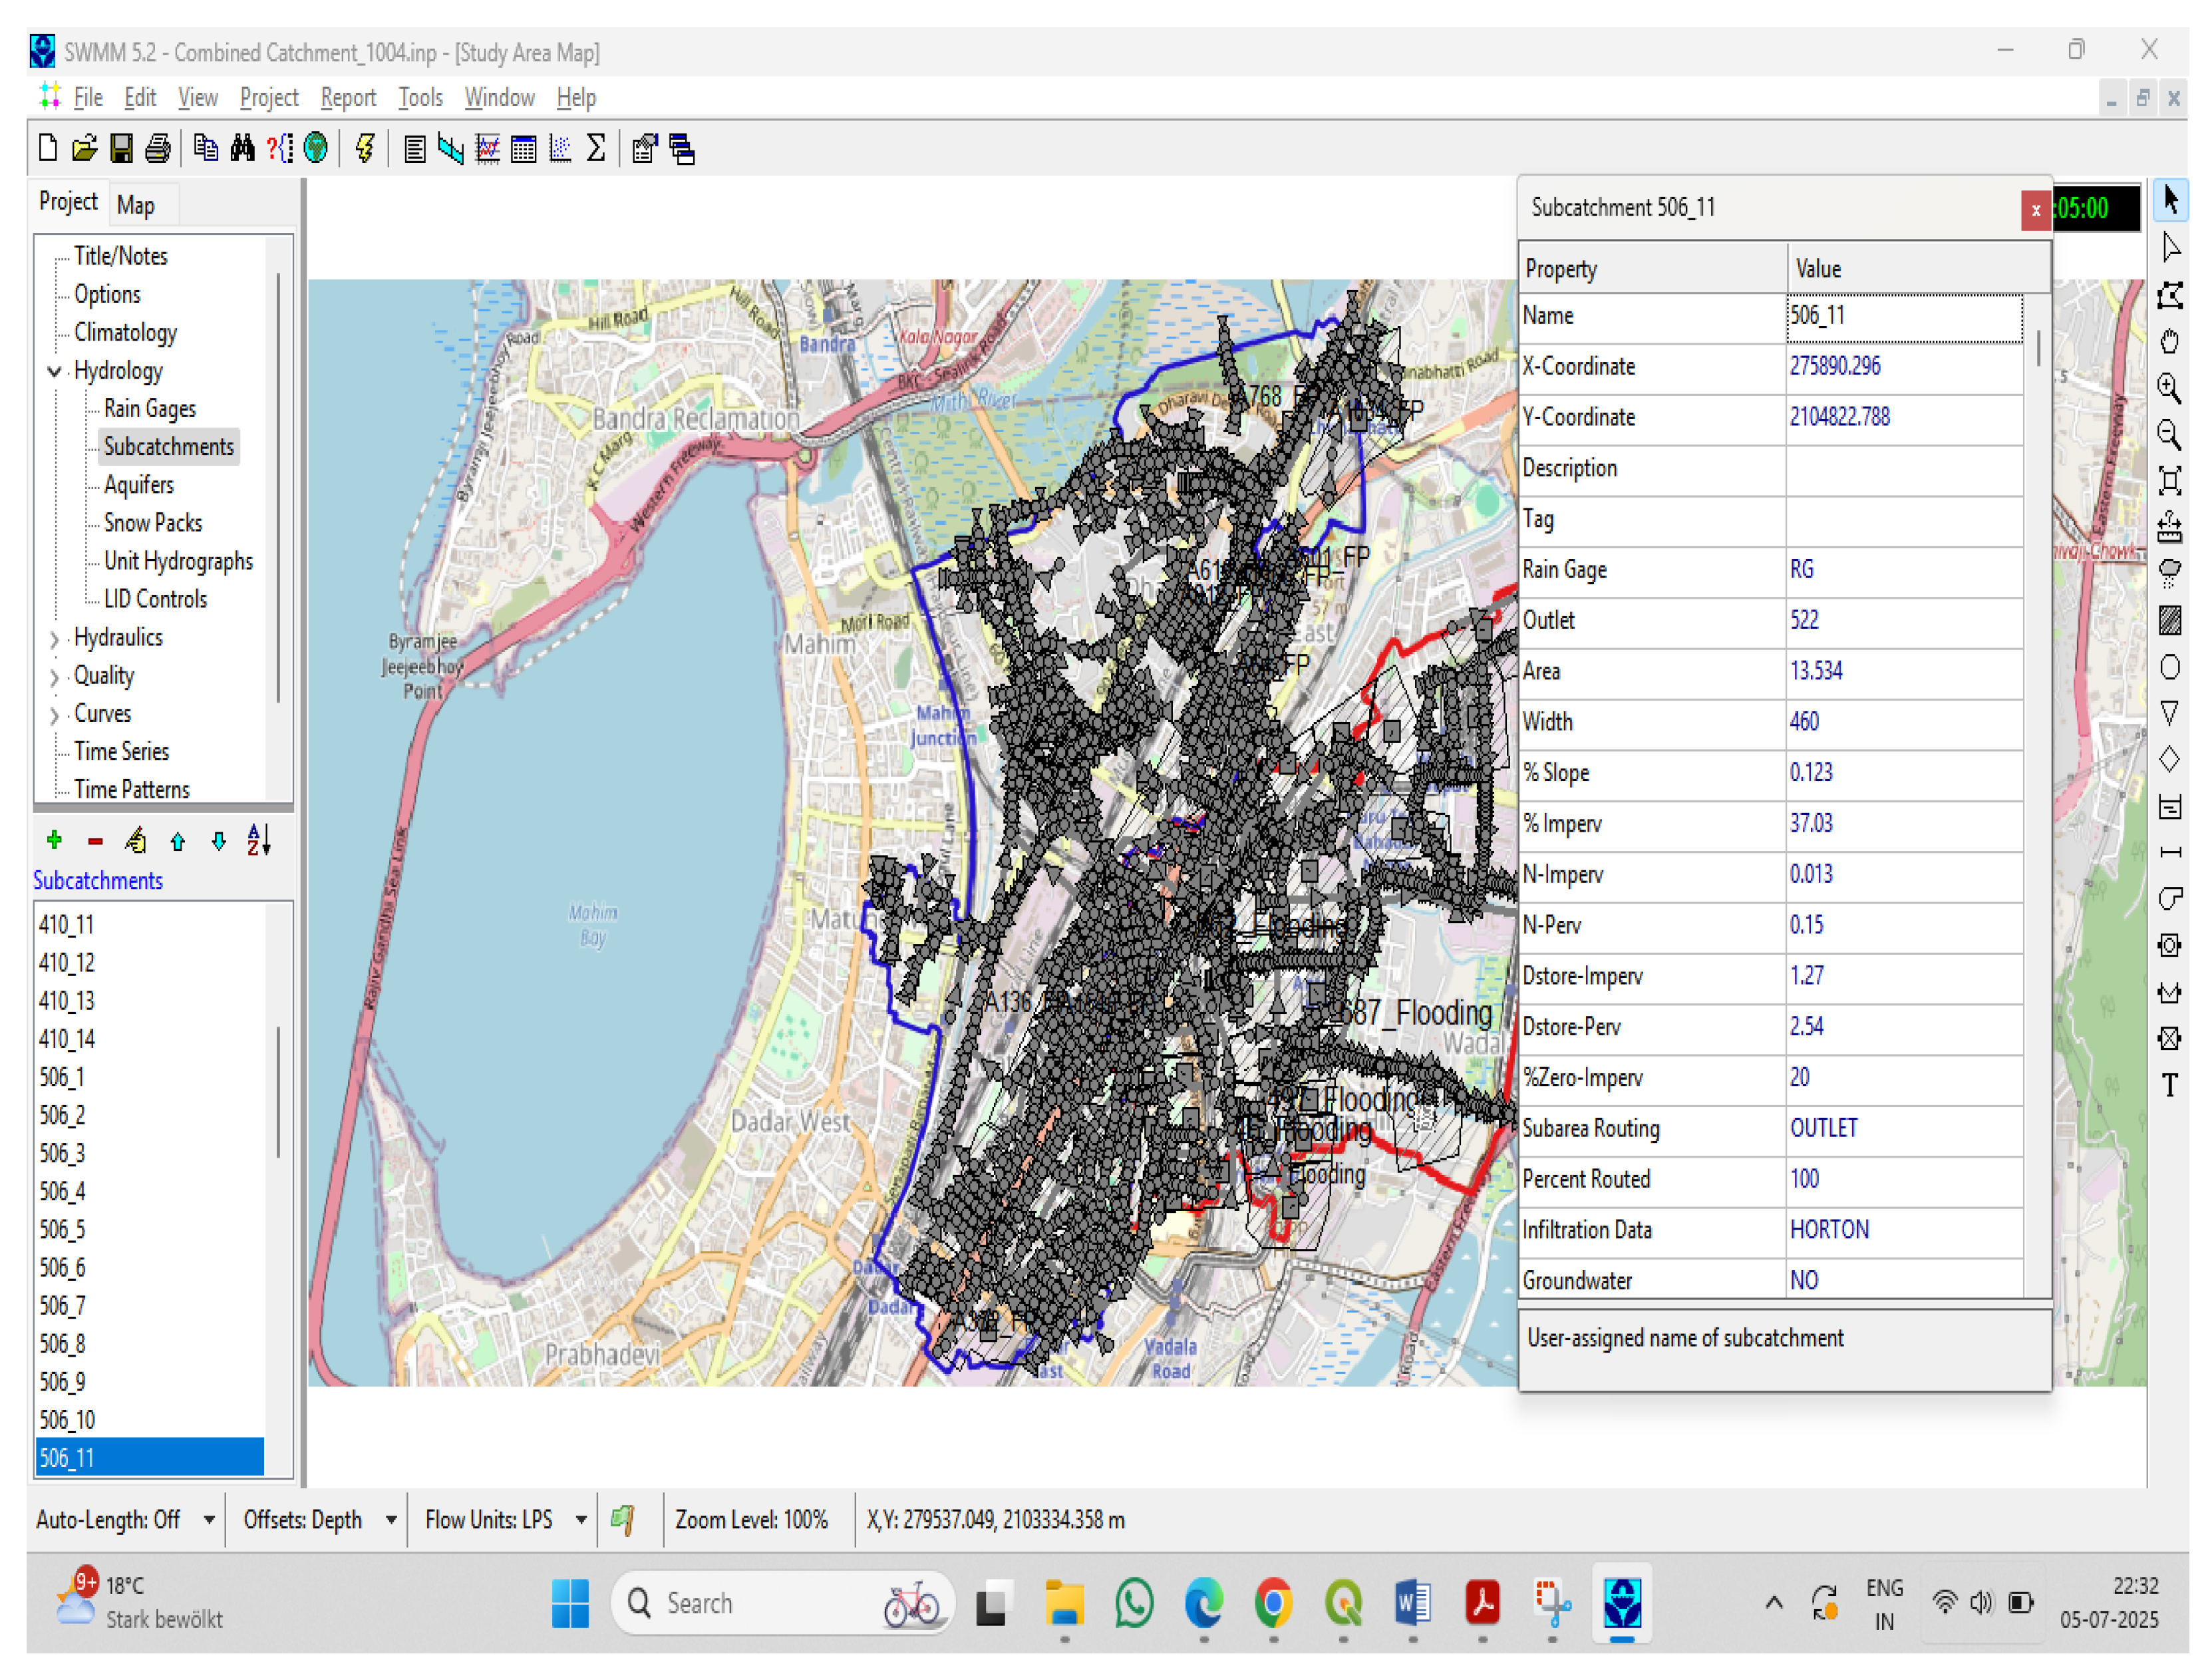
When delineating sub-catchments in SWMM, several physical and hydrologic characteristics were defined as shown in Figure 7.
Figure 7.
SWMM Sub catchment properties editor window.
- Area (ha or ac): The surface area of the sub catchment, which directly influences the volume and flow of runoff.
- Width (m or ft): An idealised flow path width that affects the timing of runoff; it is not the physical width but a parameter used to compute overland flow.
- Slope (%): Average slope of the sub catchment, which impacts velocity and flow rate of surface runoff.
- Imperviousness (%): The percentage of the area covered by impervious surfaces (like roads, roofs), influencing runoff quantity and delay.
- Roughness (Manning’s n): Separate values for surface categories (e.g., pervious and impervious areas) that affect flow resistance, runoff velocity and timing.
- Depression Storage (mm or in): Storage depth that must be filled before runoff begins, representing surface ponding and interception.
- Infiltration Parameters: Values based on the selected infiltration method [22,23] used to estimate infiltration losses.
Supplementary Material contains the section on thematic mapping using QGIS (version 4.0) comprising figures from Figures S1–S11.
2.7. Flood Point Analysis and Identification of Hotspots
Flooding in the study area, covering Catchments 410, 506, and 507 within Wards F/N and G/N, is a recurring problem caused by inadequate drainage capacity, siltation, low-lying terrain, and tidal influence [18,19]. Historical flood records from the BRIMSTOWAD II Master Plan were used to validate model outputs and identify flood-prone locations.
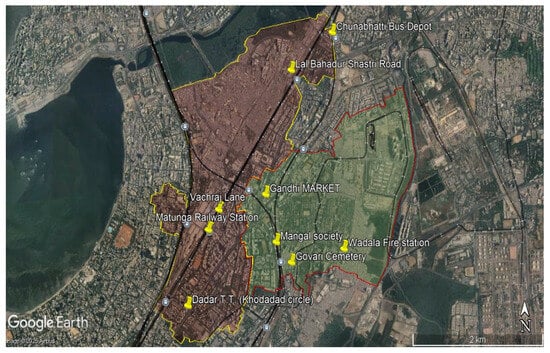
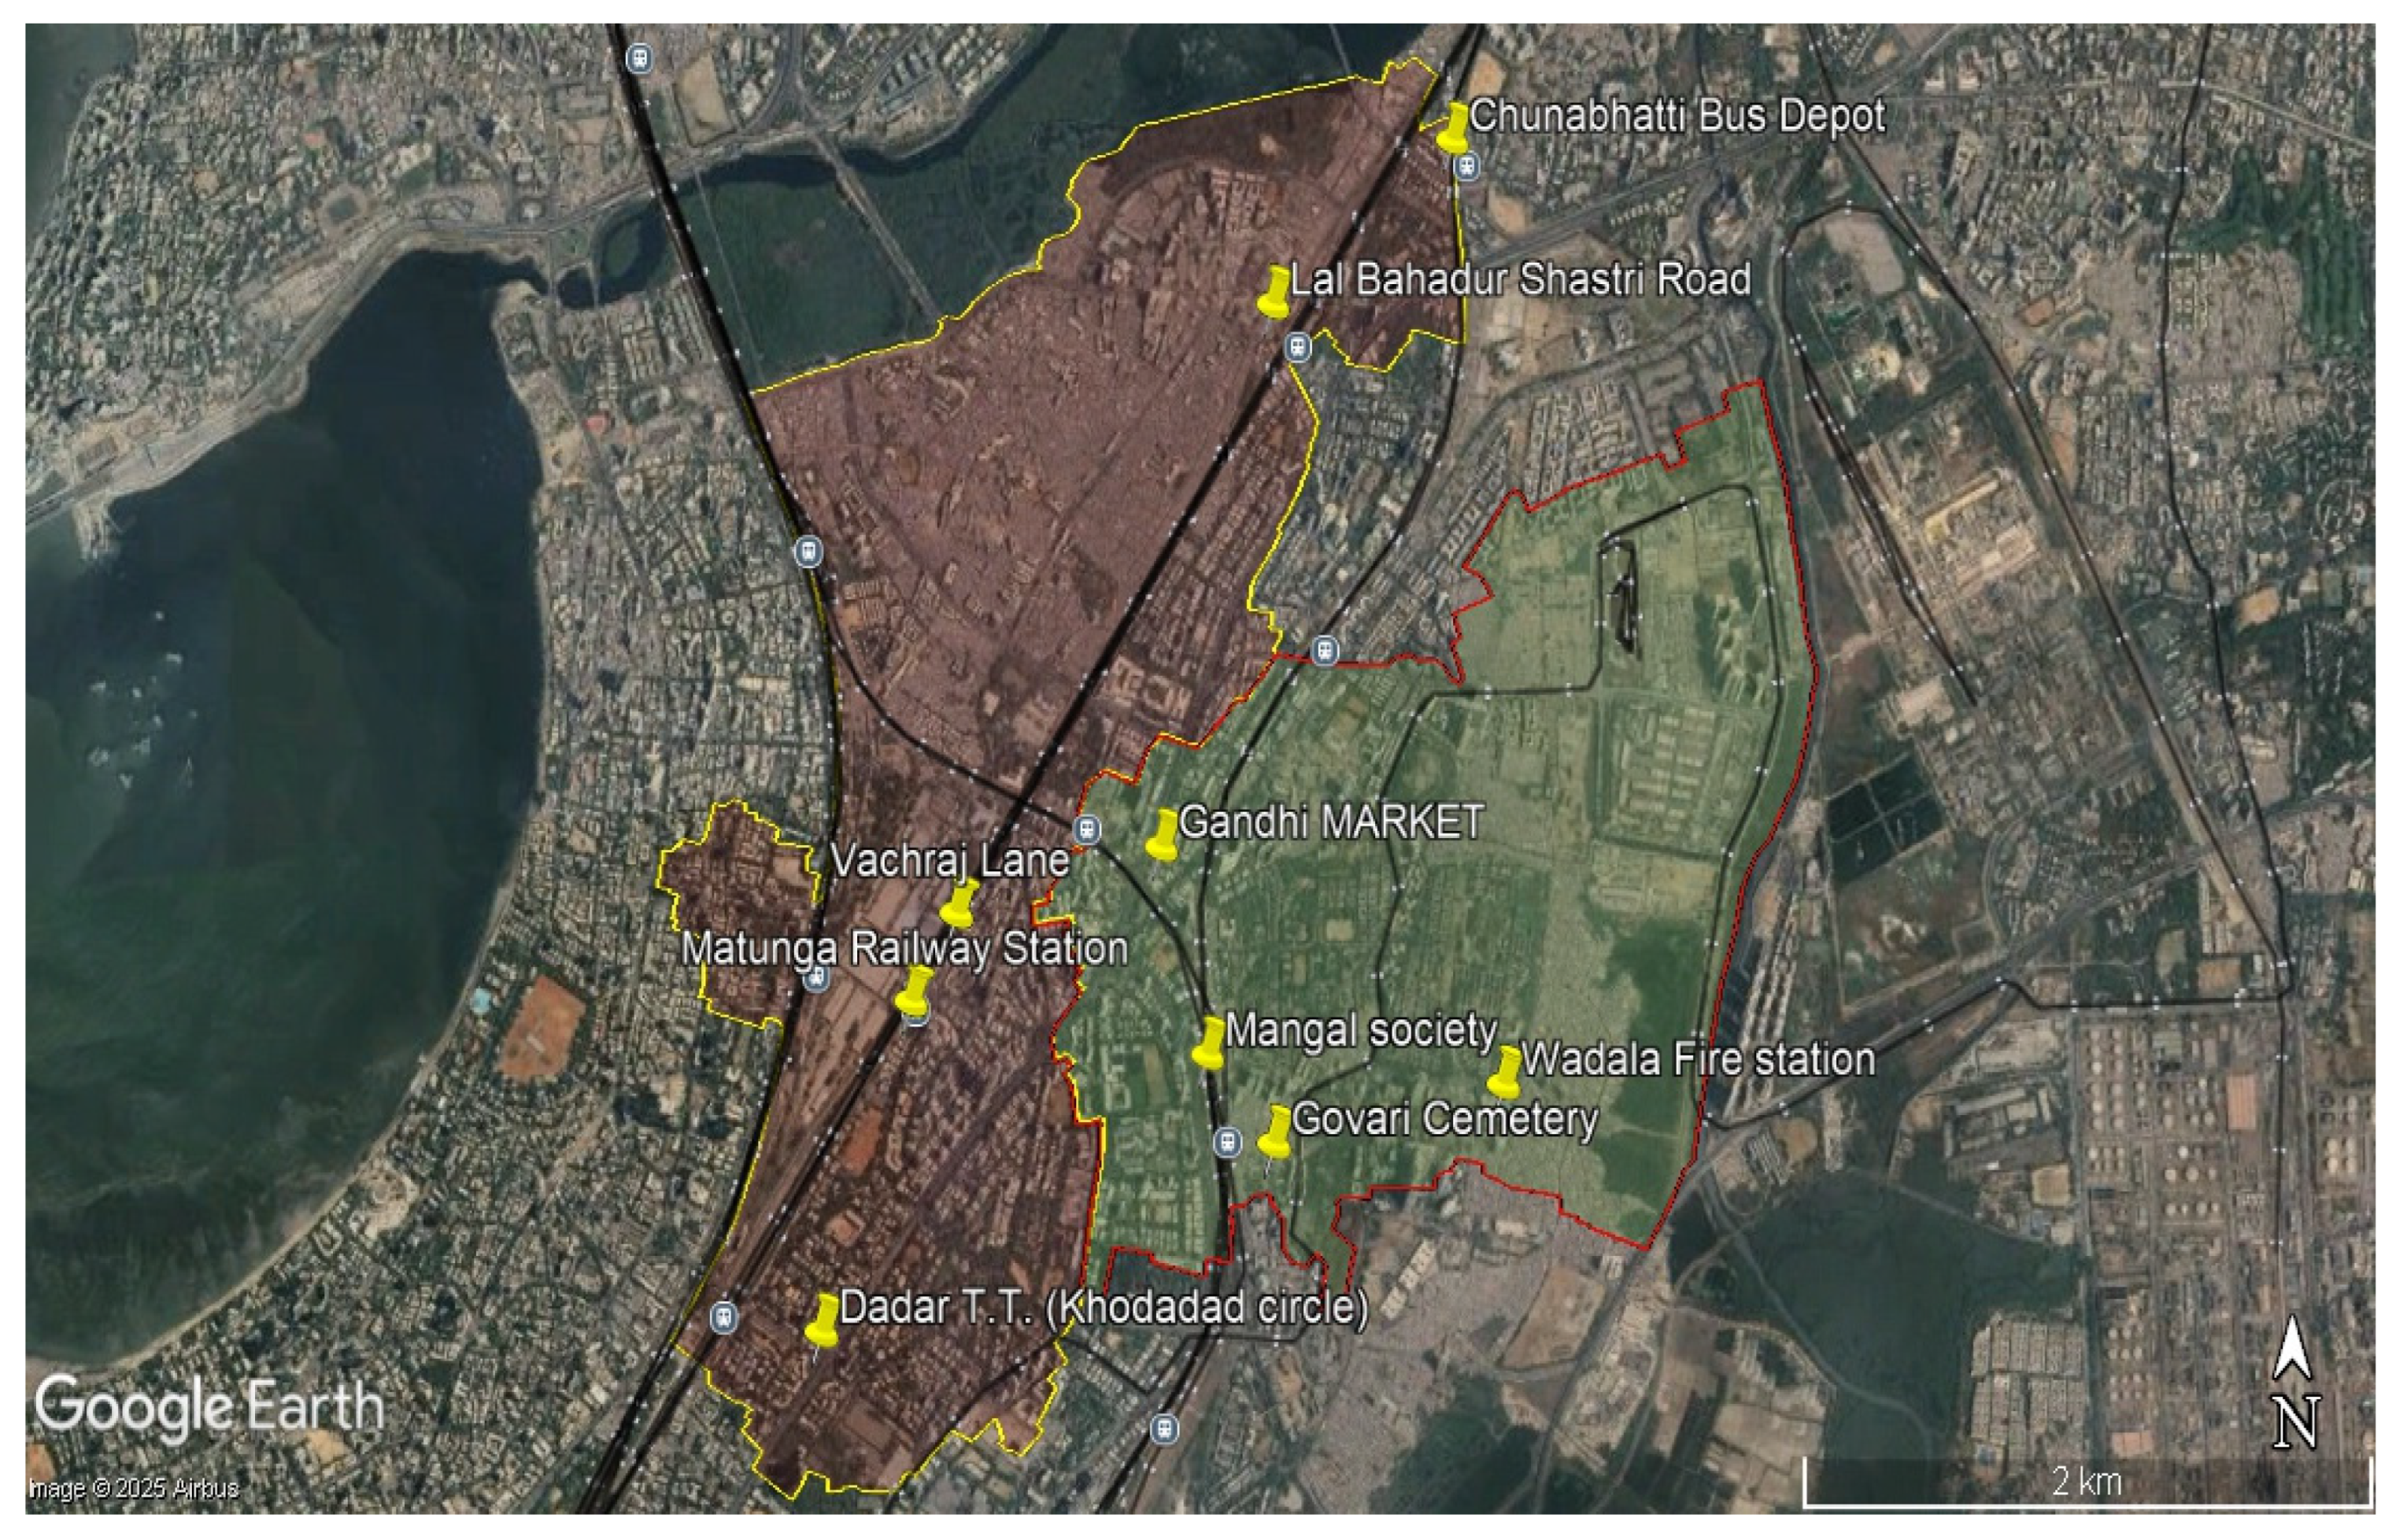
In Catchment 410 (Ward G/N), severe waterlogging has been reported at Lal Bahadur Shastri Road near Dharavi, 90 Feet Road, Dadar T.T. (Khodadad Circle), and Guru Nanak School, with documented flood events from 1993 to 2011 as shown in Figure 8. These hotspots are associated with hydraulically inadequate culverts, tidal backflow from Mahim Creek, and encroachments along the Dadar Dharavi Drain [18].
Figure 8.
Location of recorded flooding hotspot.
In Catchments 506 and 507 (Ward F/N), flooding frequently occurs at Gandhi Market, Mangal Society, Govari Cemetery, and Suleman Compound, largely due to limited capacity and untrained sections of the J.K. Chemicals Drain and Cemindia Drain as shown in Figure 8 [19].
Despite proposed upgrades such as channel widening and realignment under the BRIMSTOWAD II Master Plan, several locations remain vulnerable during high-intensity rainfall and high-tide conditions. These mapped flood hotspots were therefore incorporated into the hydraulic modelling and analysis.
2.8. BGI Scenario Modelling
Integration of Blue-Green Infrastructure (BGI) Features
In this study, BGI interventions were simulated using the Low-Impact Development (LID) controls in SWMM, which represent decentralised stormwater management practices within urban drainage systems. LID approaches manage runoff through natural or nature-based processes and are widely used as part of BGI strategies. Common BGI practices include green roofs (GR), vegetative swales (VS), infiltration trenches (IT), and permeable pavements (PP). For this study, selected BGI interventions were proposed for implementation within Wards F/N and G/N based on spatial feasibility.
Permeable Pavement (PP): Permeable pavements were proposed along existing pedestrian footpaths and sidewalk networks, allowing stormwater to infiltrate through permeable surface layers and reducing surface runoff. This intervention is suitable for the well-developed sidewalk infrastructure in the study area and can be implemented with minimal disruption to traffic or urban services. The design parameters used for permeable pavements in the SWMM simulations are presented in Table 2.
Table 2.
Permeable pavement proposed dimensions.
Green Roof (GR): Green roofs were proposed on flat rooftops of public buildings such as schools, government offices, and institutional buildings. They retain rainfall at the source, delay runoff peaks, improve urban thermal conditions, and increase green cover in densely built environments. The design parameters used for green roofs in the SWMM simulations are presented in Table 3.
Table 3.
Green roof proposed dimensions.
Infiltration Trench (IT): Infiltration trenches were proposed along road dividers, where existing median strips were modified into infiltration trenches based on subsurface suitability. These shallow gravel-filled trenches intercept and infiltrate runoff from adjacent impervious road surfaces. The design parameters used in the SWMM simulations are presented in Table 4.
Table 4.
Infiltration trench proposed dimensions.
These targeted BGI sub-catchment wise strategies as shown in Table 6 aim to enhance the stormwater management capacity of the existing drainage system, especially in areas where conventional infrastructure improvements are challenging due to space constraints. Table S1 in the Supplementary Materials presents the sub-catchment-wise areas allocated to the proposed BGI interventions.
2.9. Model Building
Relevant base data, including drainage layouts, road networks, land use patterns, and natural drainage paths, were obtained from BRIMSTOWAD II project drawings and other MCGM sources. These datasets, originally in PDF and CAD formats, were georeferenced and converted into .shp and. map formats for integration into the SWMM. The model-building workflow is presented in Figure S7 (Supplementary Material), while details on importing nodes, links, outfalls, and sub-catchment delineation are also provided in the Supplementary Material.
Rainfall Intensity Series Generation for SWMM Simulation
Rainfall intensities used in the SWMM simulations were derived from Intensity–Duration–Frequency (IDF) data for a 25-year return period storm event. The IDF curve was used to generate a synthetic rainfall hyetograph with 10 min time intervals, which was converted into a rainfall time series for SWMM input. The 25-year return period event was selected to evaluate the performance of the existing stormwater drainage system under extreme rainfall conditions and to assess the effectiveness of proposed BGI interventions in reducing urban flood risk. Similar high return-period scenarios have been adopted in previous SWMM-based urban flood resilience and BGI assessment studies to evaluate infrastructure performance under severe hydrologic stress conditions [7]. The computed rainfall intensities for each time interval are presented in Table S2, forming the design storm used in the hydrologic–hydraulic simulation. Table S2 can be referred to in the Supplementary Materials.
3. Results
3.1. Stormwater Drainage Model Outputs
The existing stormwater drainage network was simulated in SWMM to evaluate its hydrological and hydraulic performance under selected rainfall events. Runoff generation was computed at the sub-catchment level based on surface characteristics such as area, slope, imperviousness, and infiltration. A rainfall time series from the nearest rain gauge station was used as the primary input to simulate wet-weather conditions and reproduce system behaviour during storm events.
The rainfall time series was formatted and input into SWMM, which routed the generated runoff through the drainage network to evaluate system performance, identify surcharged nodes, and locate potential flooding points. This simulation framework enables assessment of the adequacy of the existing infrastructure and supports identification of priority locations for intervention.
In SWMM, flooding at a node occurs when the simulated water surface elevation exceeds the ground elevation (node rim). However, very short flooding events may represent temporary surcharge or numerical instability rather than observable surface flooding. Therefore, a minimum flooding duration threshold of 15 min was applied, and shorter events were excluded from analysis [7].
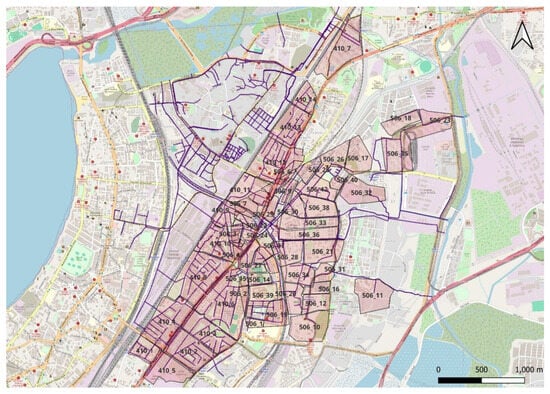
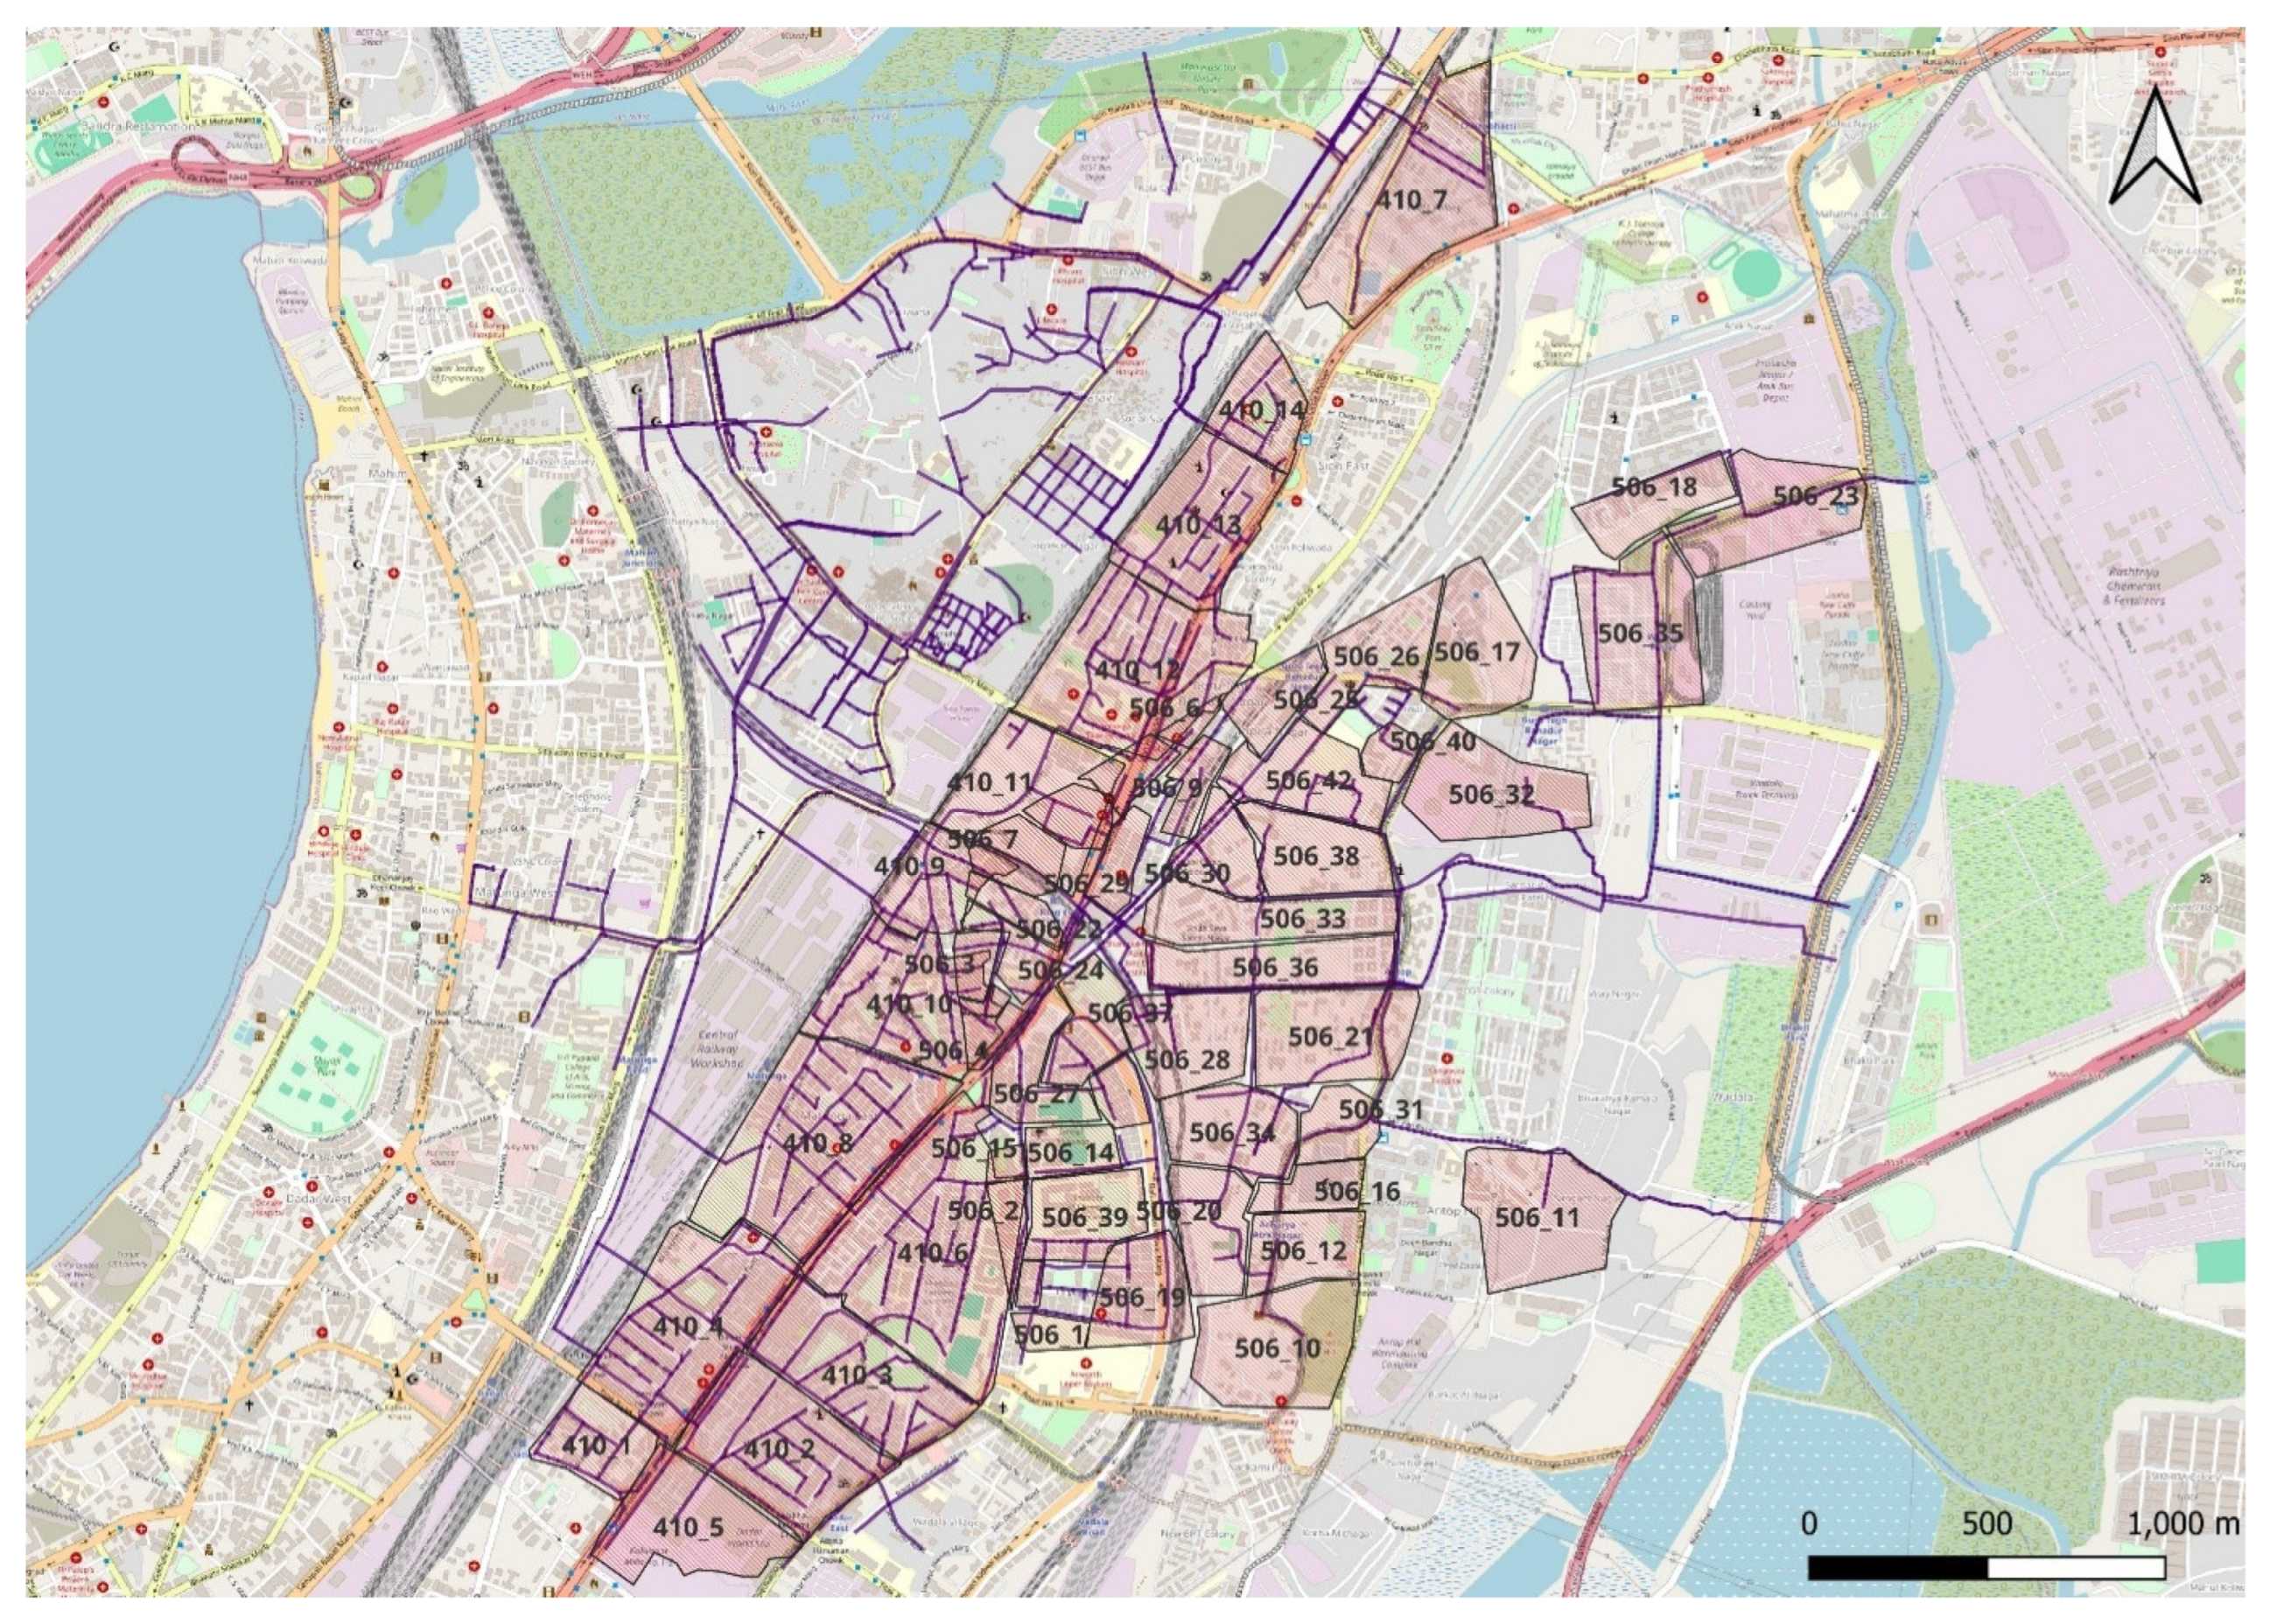
The simulation estimated a total runoff volume of approximately 783,510 m3 from all sub-catchments, with the largest contribution from Sub-catchment 410_6 (see Figure 9).
Figure 9.
Sub catchment IDs as per SWMM.
3.1.1. Flooding Nodes Recorded After Simulation
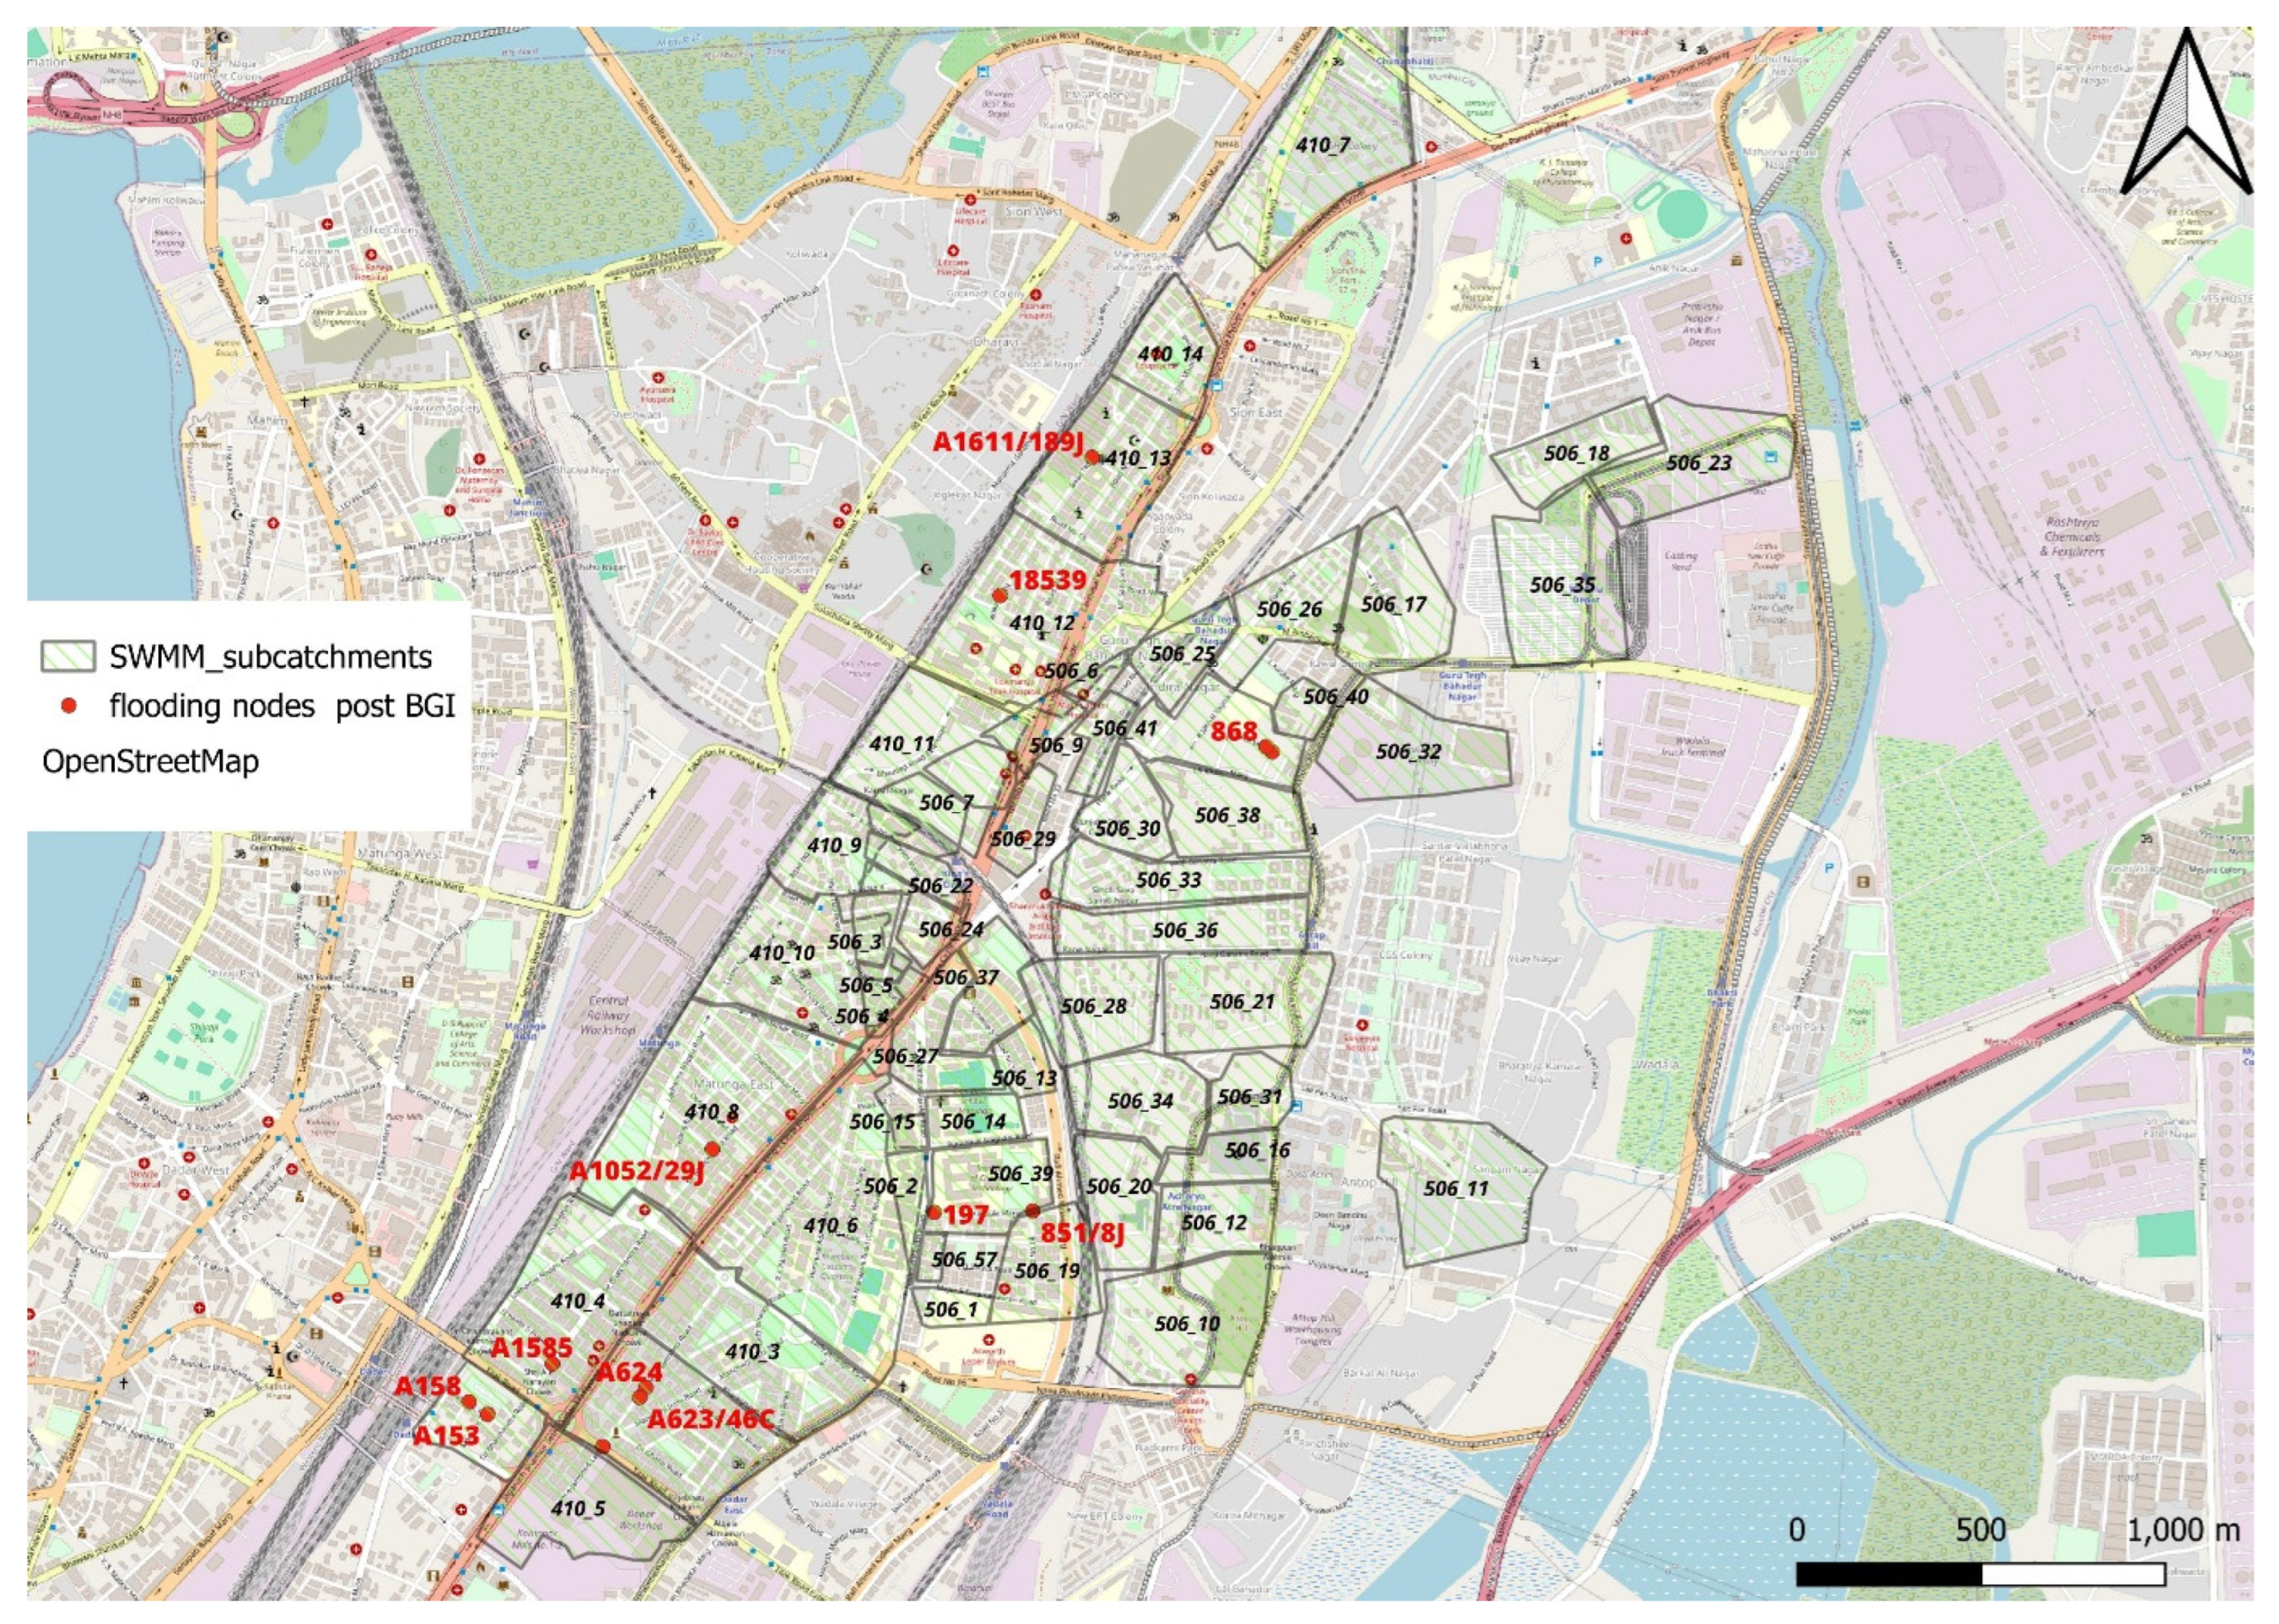
Flooding nodes were primarily located within sub-catchments of Wards F/N and G/N, showing strong spatial agreement with previously mapped flood hotspots under the 25-year return period rainfall hyetograph as shown in Figure 13. The longest flooding duration occurred at Node 1082, which remained inundated for 1.98 h (119 min). The highest peak runoff rate was recorded at Node A1052/29J, reaching 6.13 m3/s during the simulation as shown in Table 5.
Table 5.
Flooding Nodes After Simulation.
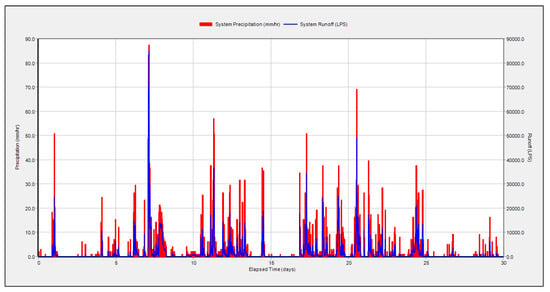
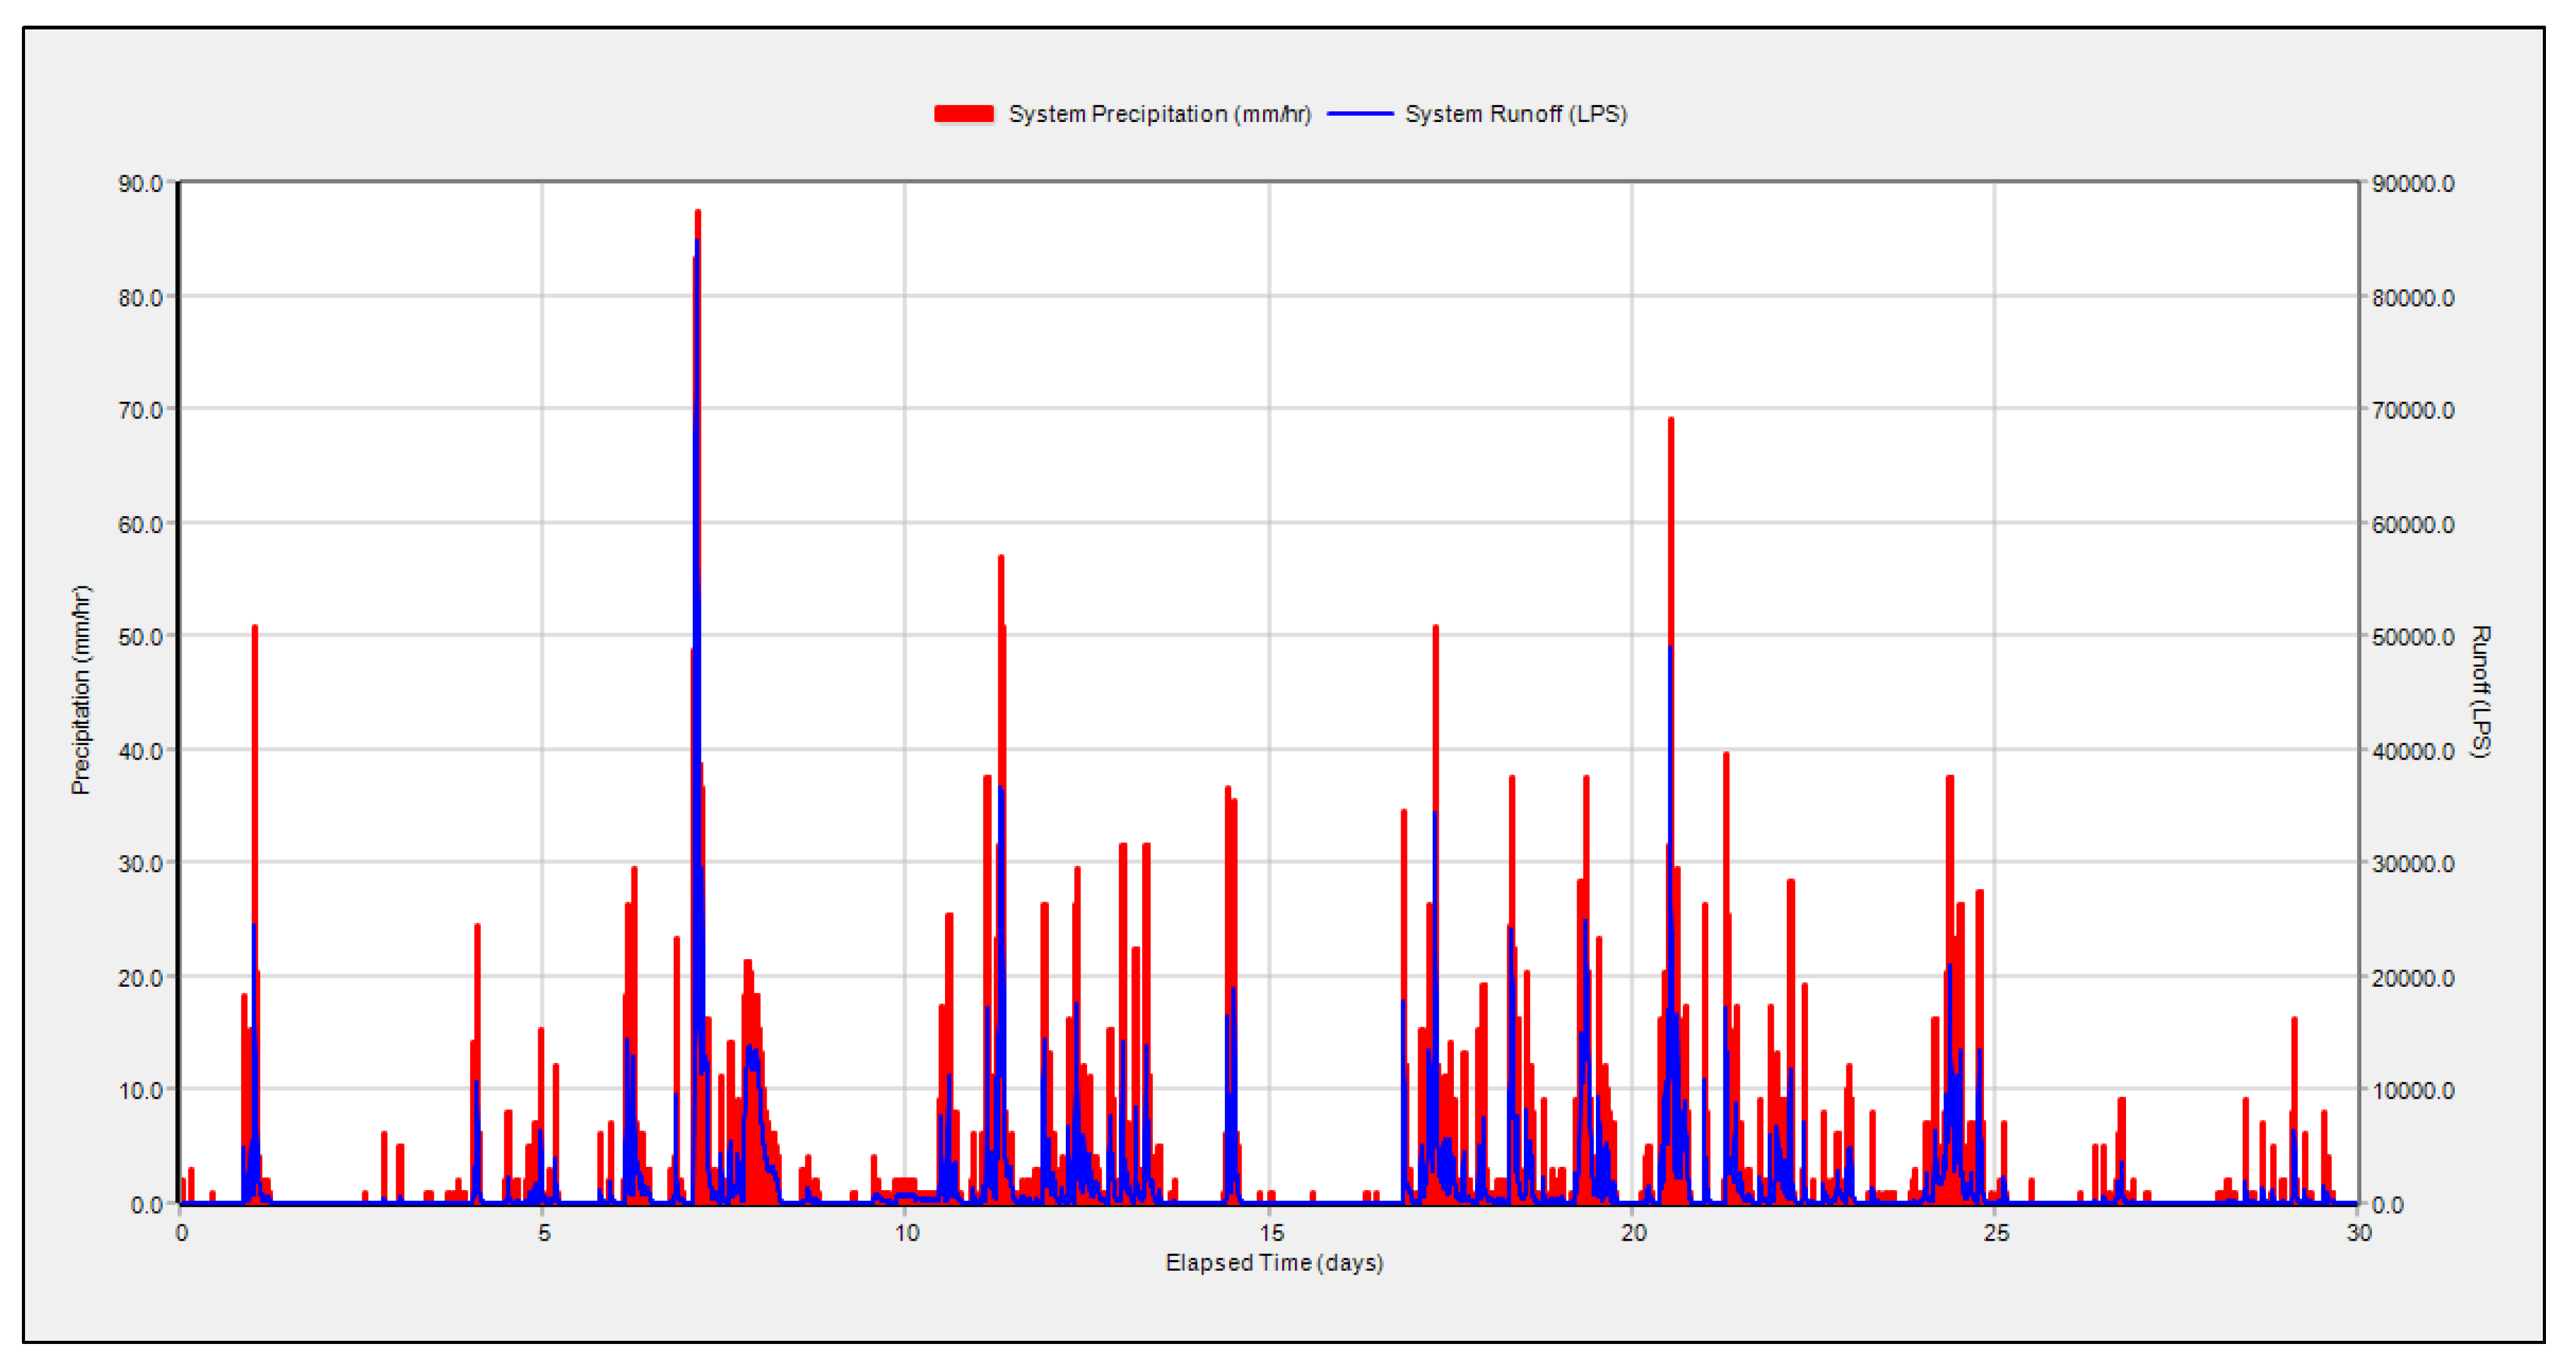
Figure 10 presents the rainfall intensity (mm/hr) and runoff discharge (LPS) for the study area between 1 July 2024 and 31 July 2024. Major rainfall events on 5 July, 11 July, and 20 July corresponded with significant runoff peaks, with maximum flows approaching 80,000 LPS. The temporal alignment between rainfall intensity and runoff peaks indicates the high responsiveness of the drainage system to intense rainfall events. This July 2024 event was used to determine and validate flooding locations in comparison to recorded historic flooding positions that are mentioned in the BRIMSTOWAD II report’s 410, 506/507 catchments for calibration and validation of flood locations.
Figure 10.
Precipitation and Runoff Hydrograph for July 2024.
3.1.2. Validation of Stormwater Model
Actual outfall discharge data were not available from the Municipal Corporation of Greater Mumbai (MCGM) or the BRIMSTOWAD II project, therefore model validation was conducted by comparing SWMM-simulated flooding nodes with historically observed flood hotspots from high-intensity rainfall events between 2009 and 2011.
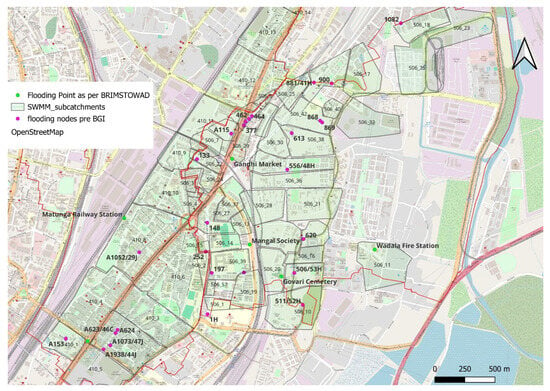
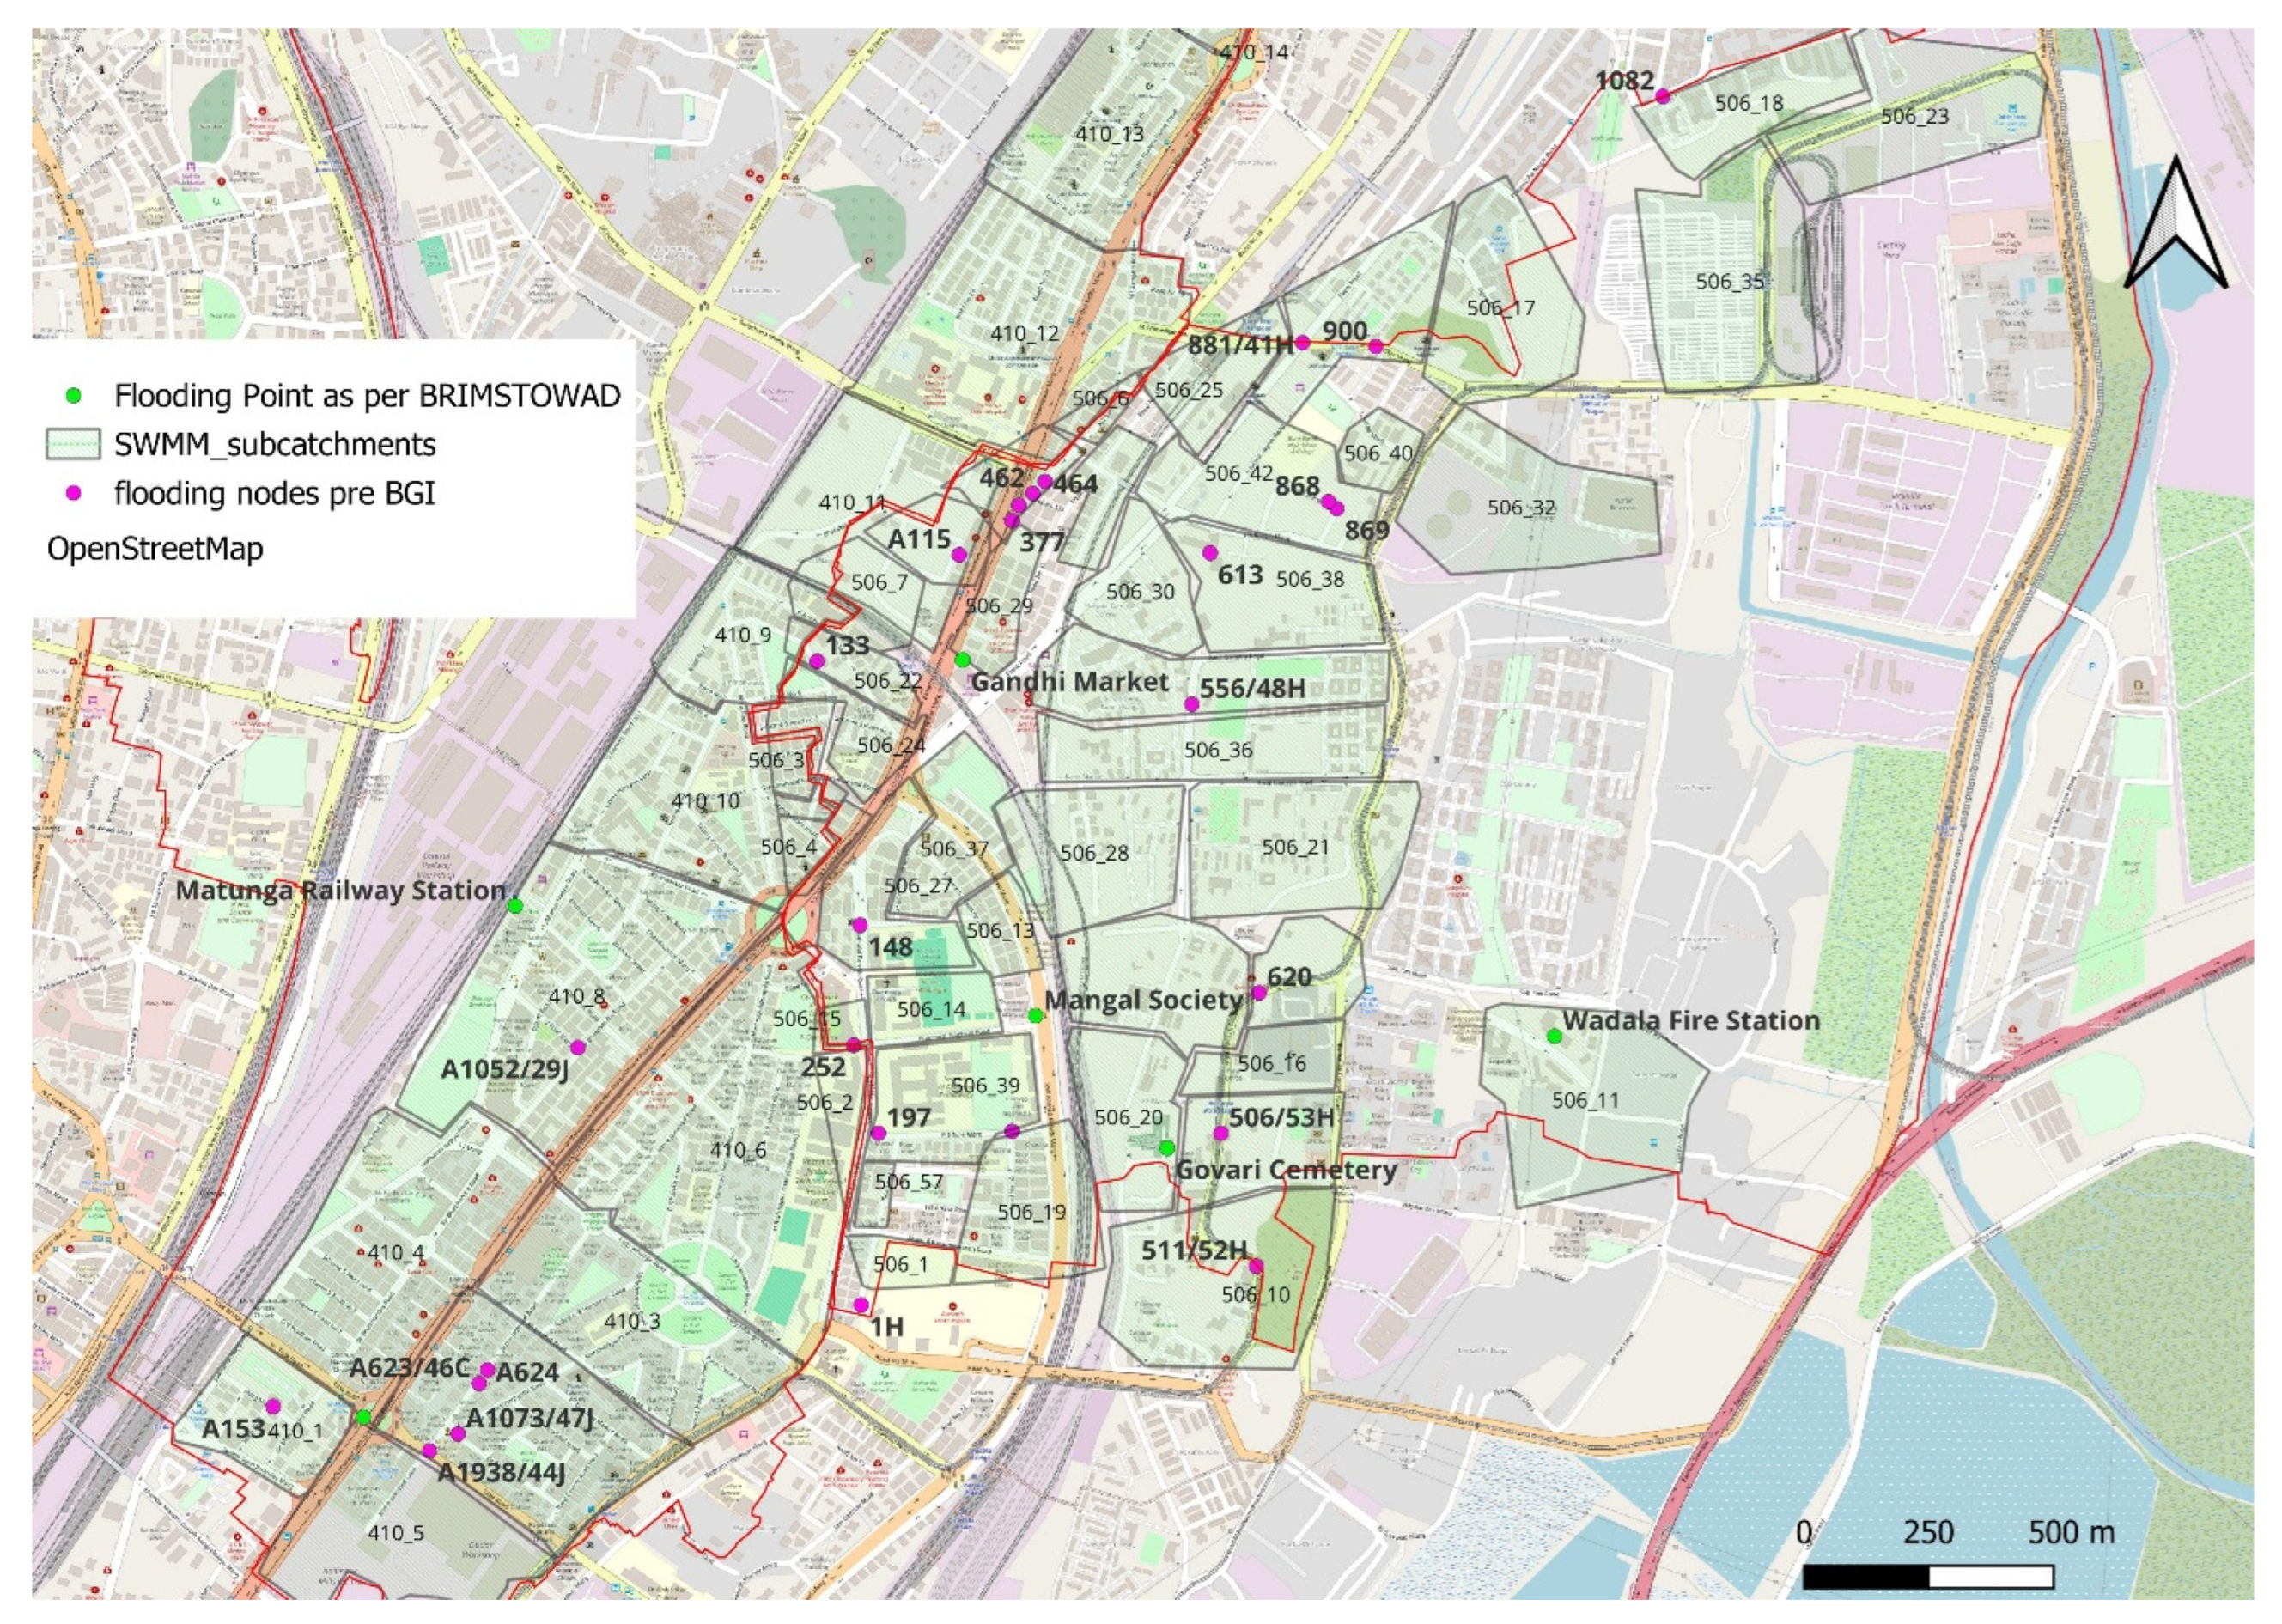
The model was initially run using the maximum recorded rainfall of 270.96 mm on 1 July 2024, followed by a sensitivity analysis to identify key parameters influencing model outputs. The analysis showed that impervious area (25–43%) and surface slope (2–4%) had the greatest impact on runoff generation and node flooding. Calibration was performed by adjusting these parameters within realistic ranges, resulting in a model configuration that correctly predicted flooding at 5 of the 7 observed flood-prone locations as shown in Figure 8. Key hotspots identified included Node IDs A153 and A1052/29J in Ward G/N, and A115, 851/8J, 506/53H, and 620 in Ward F/N, which correspond closely with flood nodes reported in the BRIMSTOWAD II Master Plan as shown in Figure 11.
Figure 11.
Recorded vs. Simulated flooding hotspot.
3.1.3. Impact of Blue-Green Infrastructure (BGI) Features
Simulation results indicate that several junction nodes within the stormwater drainage network experience surcharging and flooding during high-intensity rainfall events. To address these issues, BGI in the form of LID practices is proposed. Extensive urban development in Wards F/N and G/N has increased impervious surface coverage, intensifying runoff generation. However, large informal settlements and limited available space restrict BGI implementation in several areas. In addition, redevelopment of informal settlements under Mumbai’s Development Plan 2030–2034 makes immediate BGI interventions less feasible in those locations. Consequently, Ward G/N was identified as the primary focus for BGI implementation due to better spatial configuration, available right-of-way, and a well-developed road and footpath network.
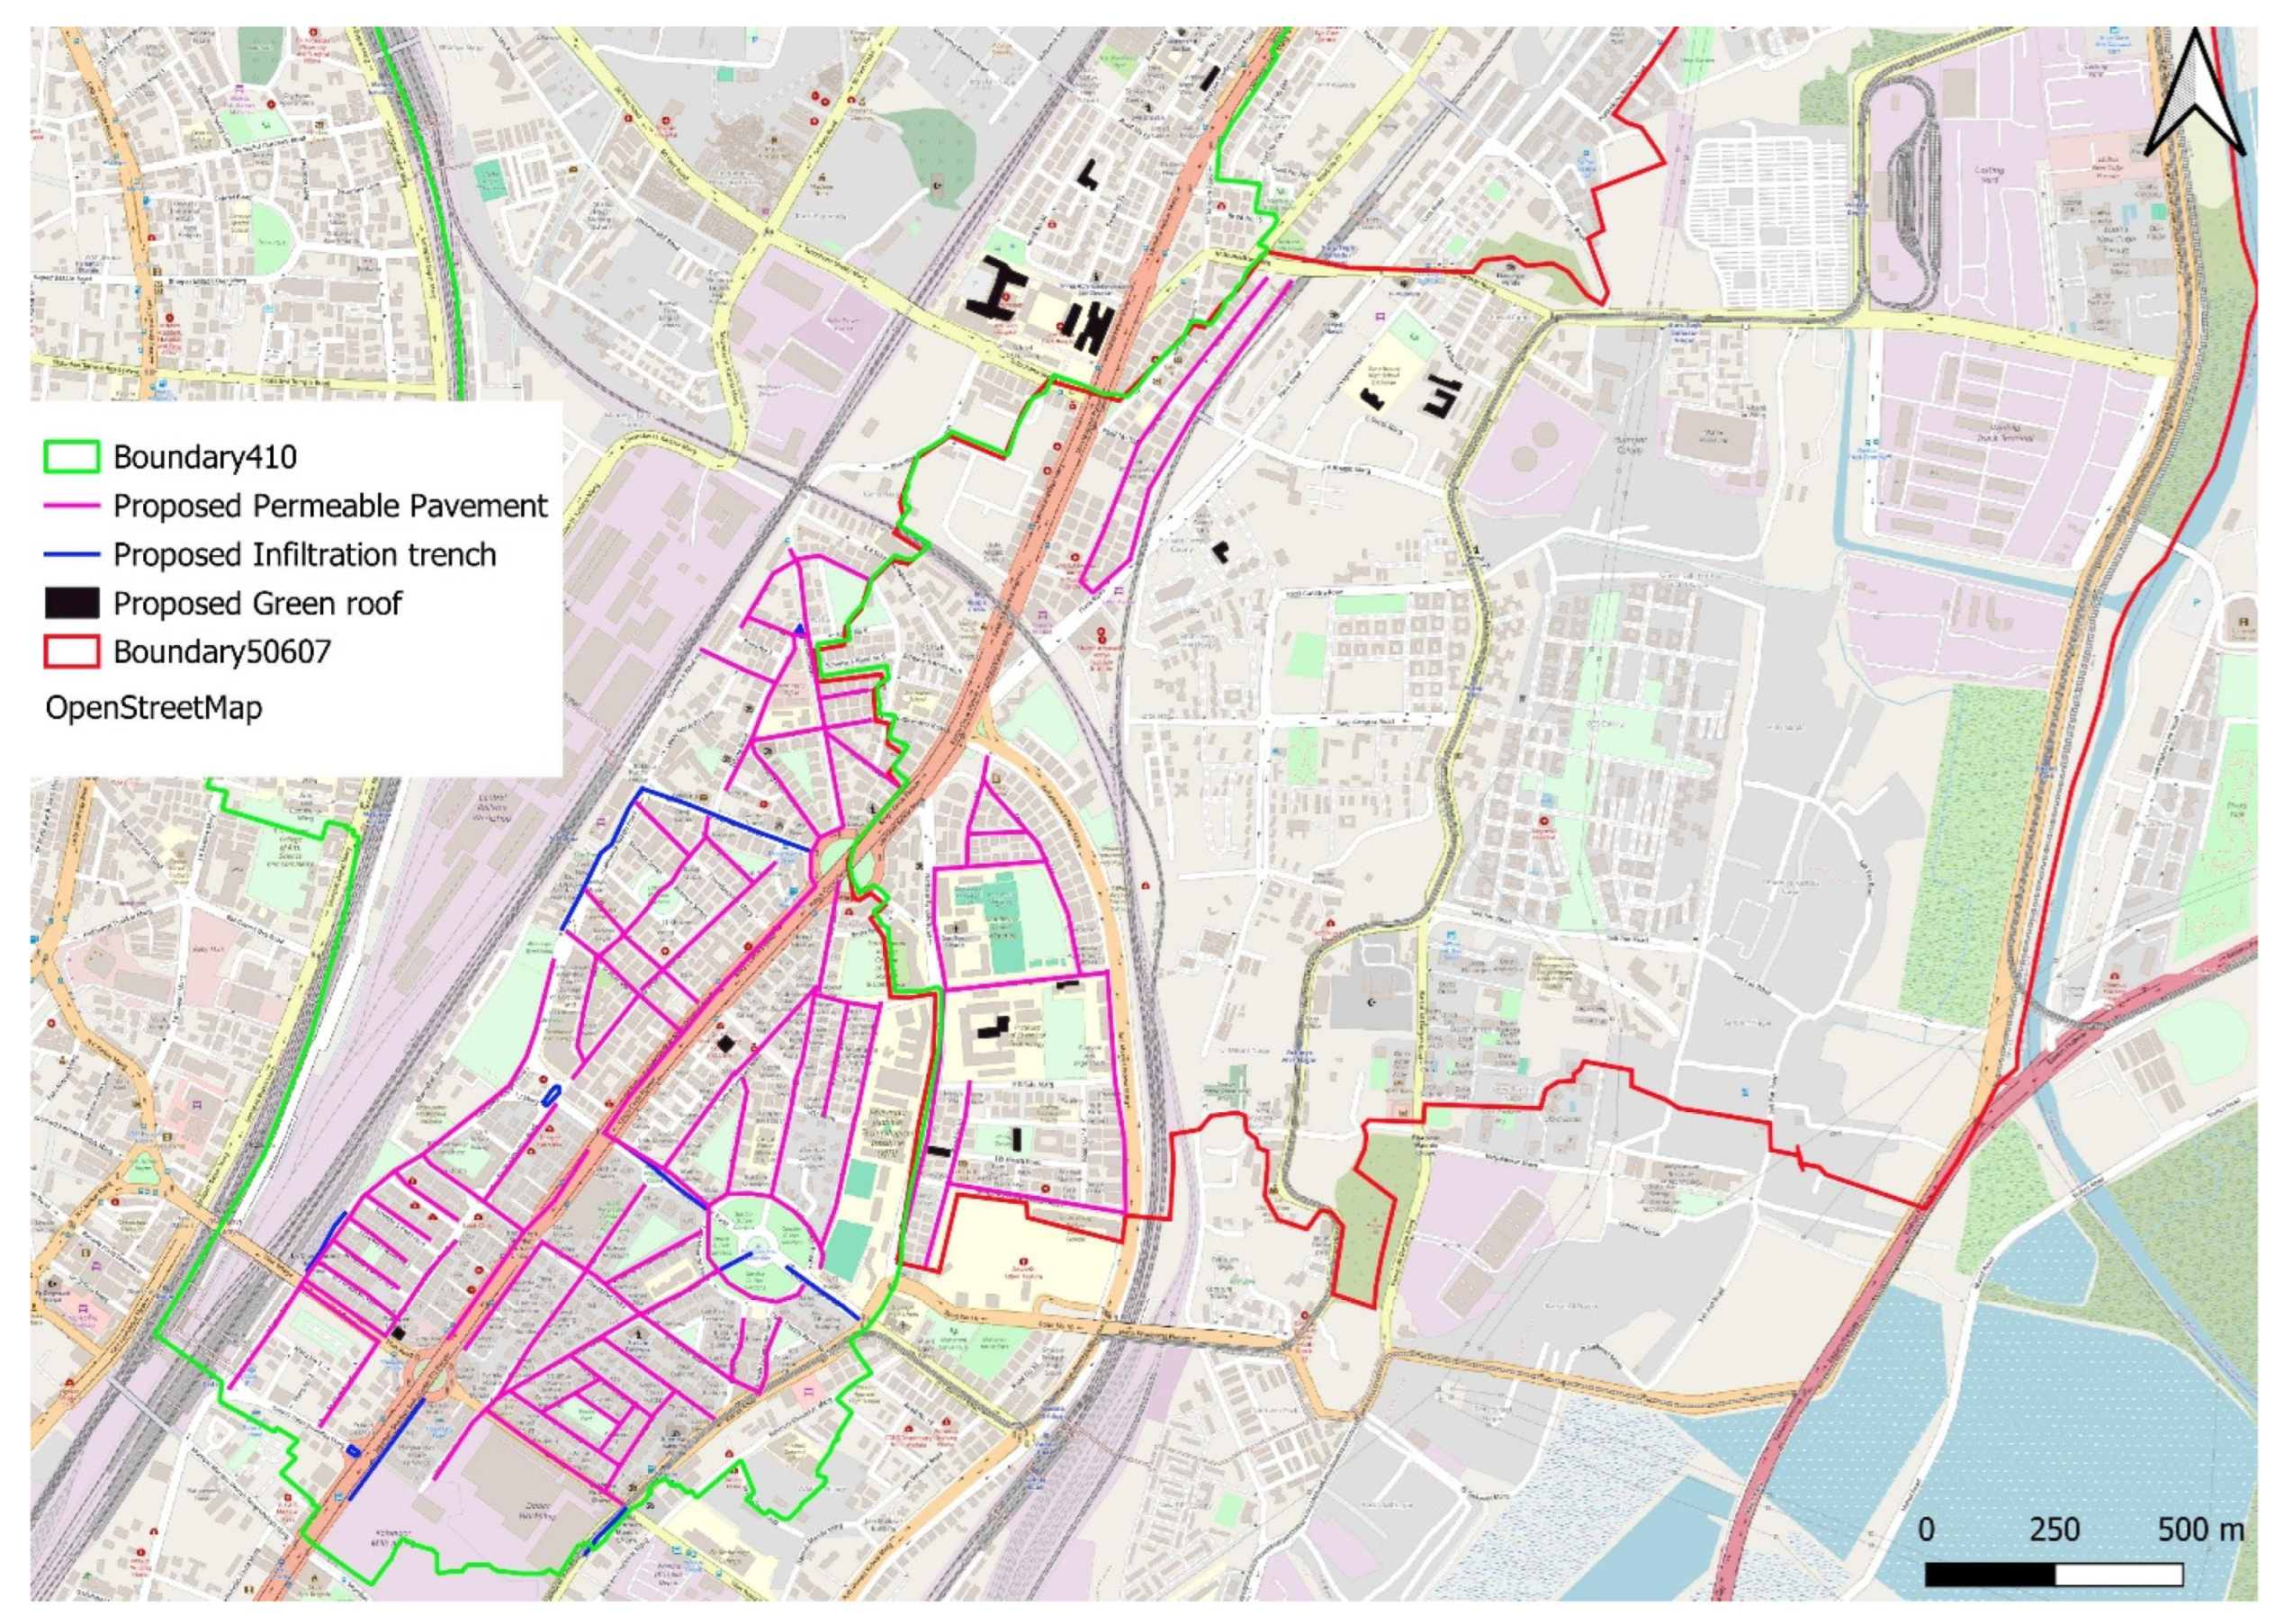
Three LID measures were proposed: PP, IT, and GR. In Catchment 410 (Ward G/N), the well-developed footpath network with widths ranging from 1.0 to 2.5 m provides suitable locations for PP installation, as shown in Figure 12. Selected areas within Catchments 506 and 507 (Ward F/N) were also considered where footpath networks are available.
Figure 12.
Layout for Proposed PP, IT and GR.
Although most buildings in the study area have flat rooftops, the application of GR is limited due to structural constraints in older buildings, where slab strength may not be sufficient to support additional loads. In newer redeveloped buildings, rooftops may also be allocated for solar panel installations in accordance with municipal building regulations of the MCGM. Therefore, GR were proposed only on selected government and commercial buildings with structurally suitable and unobstructed rooftops, as shown in Figure 12.
IT were primarily proposed in Ward G/N where wider road medians and central dividers provide suitable locations for decentralised stormwater management. These locations include Five Gardens, Dadar T.T. Circle Bridge, Lakshmi Napoo Road, and Bhandarkar Road, as shown in Figure 12, where road geometry allows implementation with minimal disruption to traffic or pedestrian movement.
BGI interventions were applied selectively to sub-catchments based on spatial feasibility, land use, and available public right-of-way, and therefore were not implemented across all sub-catchments in the study area.
The SWMM simulation was re-run after incorporating the proposed BGI features, resulting in a noticeable reduction in total runoff volume. Several nodes that previously experienced flooding showed reduced peak runoff and flood volume, and the overall number of flooded nodes decreased compared to the baseline scenario.
However, some downstream nodes located in sub-catchments without BGI interventions showed little or no change in peak runoff, flood volume, or inundation depth. These nodes maintained similar runoff responses due to the absence of upstream hydrologic modification. This highlights the spatially localised benefits of BGI, where runoff mitigation occurs primarily in areas directly treated with infiltration or detention-based measures, emphasising the need for strategic placement and broader coverage to achieve system-wide improvements.
The results of flooding nodes before and after BGI implementation are presented in Table 6 and Figure 14. Most interventions resulted in reduced peak flow rates and flood volumes, while nodes in areas where BGI implementation was not feasible showed no significant change.
Table 6.
Comparison of Pre- and Post-BGI Flooding Nodes. Max Rate in m3/s and Total Flood Volume in m3.
Among the nodes causing flooding under post-BGI conditions, the two nodes 18539 and A1611/189J (see Figure 13) exhibit special behaviour, inasmuch as they produce substantially higher flooding volumes under post BGI than under pre-BGI conditions. The explanation for this effect can be found in the characteristics of the slope pattern, the drainage system structure, and even more influential in the predominating BGI measure. These two flooding nodes are located in sub-catchments 410_12 and 410_13 (neighbouring north of 410_12, see Figure 9). The topography shows a distinct slope from south to north, i.e., from sub-catchment 410_12 to 410_13 (see contour lines in Figure S11, Supplementary Materials). This is also embodied in the drainage system structure. Three main drainage pipes are guiding the runoff from 410_12 to 410_13 (Figure 9). In sub-catchment 410_12, large roof areas with a potential for green roof implementation were identified on three hospital buildings (Figure 12). While permeable pavement and infiltration trenches reduce the runoff via infiltration, green roofs are the only of these three measures that have a retention function. They are not significantly reducing the runoff volume, but altering the hydrograph towards reducing peak runoff and prolonging runoff duration.
Figure 13.
Chart showing the pre- and post-BGI Max Rate LPS.
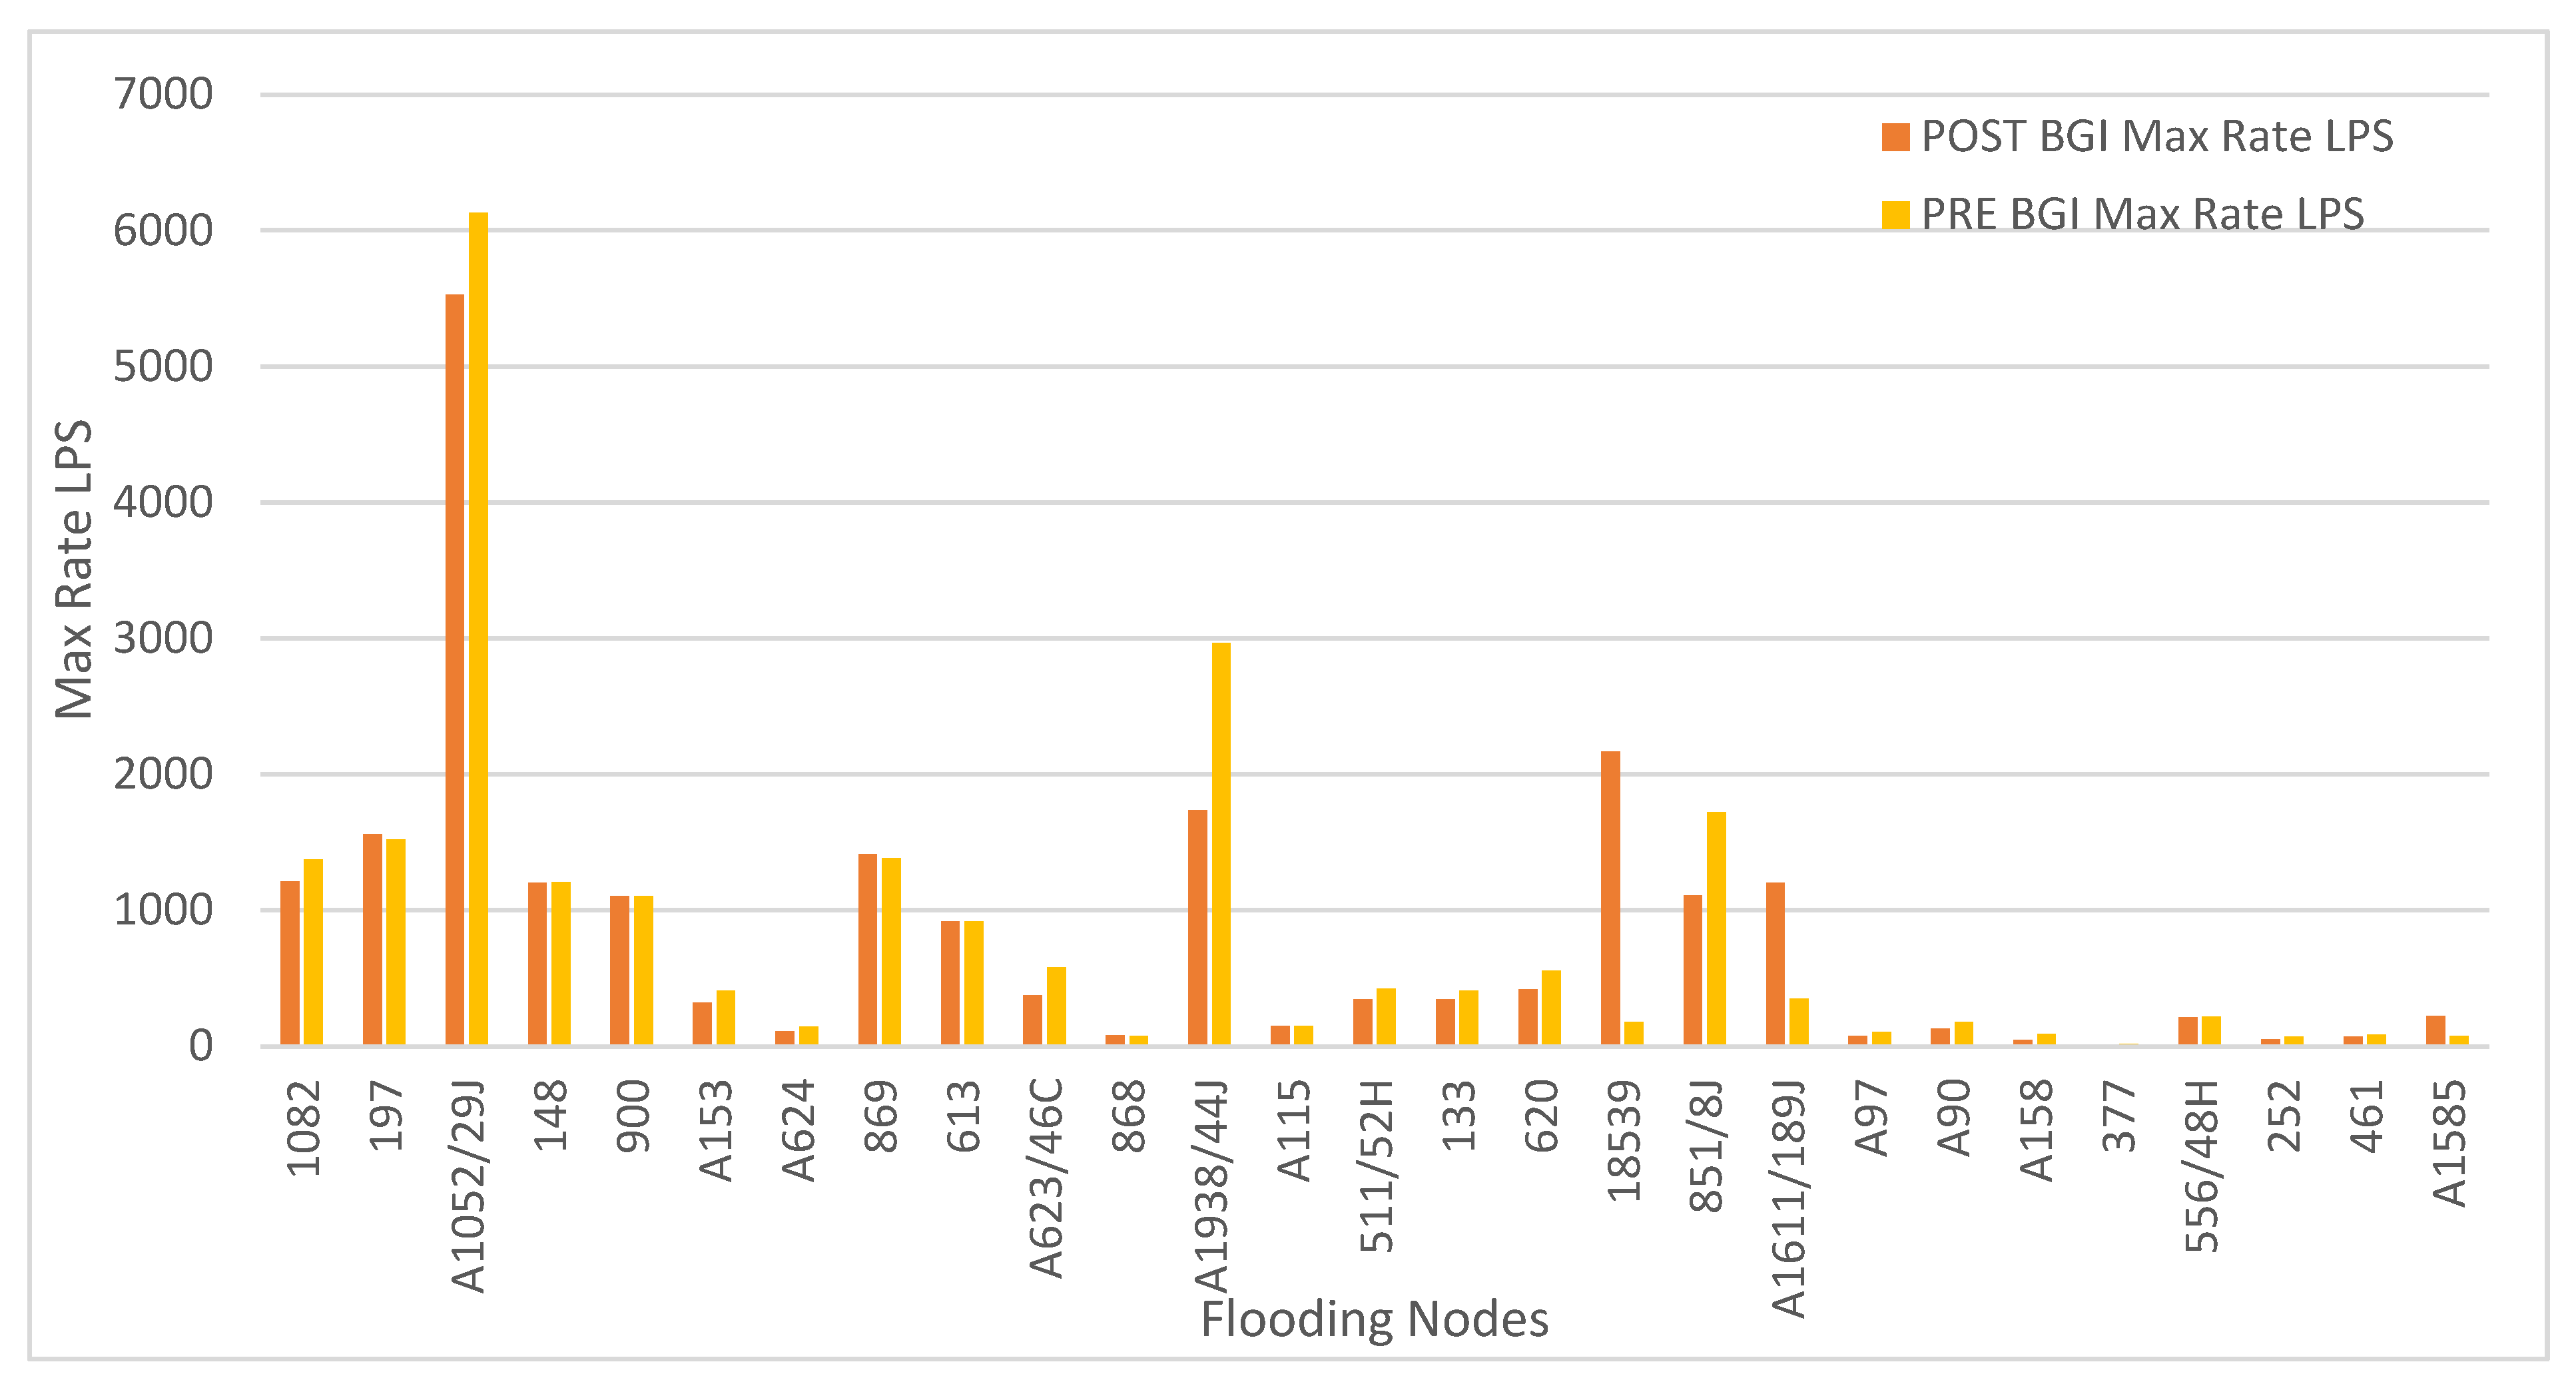
Under pre BGI conditions the runoff hydrograph in 410_12 is short, while its peak is not high enough to surcharge node 18539, and the peak runoff from the upstream catchment does not arrive simultaneously, but after the peak created in 410_12 has already passed the critical node. Under post BGI conditions, the green roofs cause a decelerated and a prolonged runoff, such that there is still substantial runoff from the large green roof area when the peak runoff from the upstream sub-catchment arrives, leading to surcharge of node 18539, located immediately downstream of the hospital buildings with green roofs. This effect still holds in the downstream sub-catchment 410_13 in which the high runoff from 410_12 last for a longer duration and now coincides with the peak created in 410_13. Moreover, in 410_13, no major BGI potential could be identified, and thus, downstream of a joint bringing together the local runoff peak with the prolonged runoff from 410_12, node A1611/189J is surcharged and subject to an increased flooding volume compared to pre BGI condition, although somewhat less pronounced than at node 18539.
Such effects of synchronising hydrographs have to be considered in drainage system planning. They can be omitted by appropriate network structure causing different runoff pathways for potentially corresponding peak runoffs, by creating a spatially more homogenised retention, if necessary, through implementation of grey infrastructure, or by provision of save surface runoff pathways or retention at the predefined critical nodes, where possible. Extreme-event hydrologic assessments are particularly relevant in highly urbanised and flood-prone coastal cities where drainage exceedance and infrastructure surcharge occur during severe monsoon event.
Table 7 compares sub-catchment runoff characteristics before and after BGI implementation. The total peak runoff decreased from 137.6 m3/s (pre-BGI) to 120.2 m3/s (post-BGI), indicating an overall reduction in peak flows. In some sub-catchments the reduction was more pronounced; for example, Sub-catchment 410_2 showed a decrease from 7.40 m3/s to 3.59 m3/s, representing a 51.5% reduction. In addition, the total runoff volume decreased from 783,510 m3 to 740,410 m3, demonstrating the effectiveness of the proposed BGI strategies in reducing stormwater discharge volume.
Table 7.
Sub catchment runoff comparison for PRE and POST BGI.
Figure 14 shows the locations of flooding nodes after incorporating BGI features within the respective sub-catchments. These nodes are mainly located at the downstream ends of contributing sub-catchments and are directly influenced by the implemented interventions. As shown in Table 6, BGI implementation resulted in reductions in key hydraulic parameters, particularly maximum flooding rate and total flood volume at affected nodes.
The BGI performance summary in Table 8 presents hydrologic metrics including inflow, outflow, evaporation, and infiltration losses for each intervention, allowing quantitative evaluation of runoff reduction. Infiltration trenches (IT) showed the highest infiltration losses, with sub-catchments such as 410_3 and 410_4 exceeding 1000 mm, indicating strong subsurface infiltration under high inflow conditions. Permeable pavements (PP) contributed to runoff reduction but generally showed lower infiltration values (<40 mm) due to limited coverage or hydraulic conductivity. Green roofs (GR), implemented in sub-catchments with limited suitable roof area, exhibited negligible infiltration losses. Variations in surface outflow further indicate that BGI performance depends on intervention type, spatial placement, and local hydrological conditions, with combined measures (e.g., IT and PP in 410_1) showing improved performance compared to single interventions.
Table 8.
BGI-Performance summary.
Figure 14.
Flooding Nodes POST BGI.
Flood reduction was quantified using node-level flooding statistics by aggregating the total flood volume across all flooded nodes under the BGI scenario. As presented in Table S3 (see Supplementary Materials), most nodes exhibited negligible or zero flood volumes and no ponding depth, while a limited number of nodes showed measurable flooding.
The sum of maximum flooding discharges across nodes decreased from 94.1 m3/s to 51.7 m3/s, representing an overall reduction of approximately 45%. Although peak flows at individual nodes do not occur simultaneously and therefore this sum does not represent an actual combined discharge, it provides an indicative metric of relative changes in flood flow magnitude across the network. These results suggest that, under the simulated conditions, BGI measures are more effective in reducing peak flooding flow intensity than total flooding volume, which reduced from 56,878 m3 to 53,522 m3, corresponding to a reduction of 5.9%.
This reduction in node-level flooding is broadly consistent with the sub-catchment water balance results, which indicate decreased surface outflow associated with increased storage and infiltration from BGI measures such as infiltration trenches (IT), permeable pavements (PP), and green roofs (GR). However, localised increases in flooding were observed at certain nodes, indicating that BGI interventions may also lead to spatial redistribution of flows within the drainage network.
Overall, the results demonstrate that distributed hydrological benefits at the sub-catchment scale can propagate through the drainage system and contribute to a reduction in overall flood intensity. At the same time, they highlight the importance of accounting for site-specific hydraulic responses, as localised adverse effects may arise due to network interactions and flow redistribution.
4. Discussion
Mumbai’s urban landscape is characterised by a complex combination of highly dense formal and informal settlements. Formal neighbourhoods typically follow organised planning frameworks and have access to municipal infrastructure such as water supply, sewage systems, and electricity. These areas include both older residential buildings and newer housing developments within structured layouts. In contrast, informal settlements have developed outside the formal planning system and are characterised by high population density, limited open space, and restricted access to public services [24]. More than 40% of Mumbai’s population resides in informal settlements occupying only about 11% of the city’s land area [25]. These spatial conditions increase vulnerability to flooding and environmental risks.
Although Mumbai is undergoing large-scale informal settlement redevelopment, existing informal settlement areas offer limited opportunities for immediate BGI implementation due to spatial constraints and complex socio-political conditions. Consequently, formal neighbourhoods with identifiable flooding problems, structured layouts, and available open spaces provide more feasible pilot locations for testing BGI interventions.
Based on these considerations, this study selected Catchments 506–507 and 410 within Wards F/N and G/N as pilot areas. These neighbourhoods are centrally located and function as important residential, commercial, and transportation hubs while also containing notable open spaces such as Five Gardens and King Circle. Their recurring flooding problems, spatial configuration, and public open spaces provide suitable conditions to test the integration of BGI within existing urban infrastructure.
However, Mumbai’s extreme urban density significantly limits the feasibility of large-scale BGI elements such as detention ponds or retention basins because open spaces are already heavily contested for recreational and public use. Similarly, land scarcity restricts the implementation of infiltration-based systems, although opportunities exist along road dividers, sidewalks, and existing drainage corridors. In addition, high groundwater levels constrain infiltration capacity and highlight the need to maintain sufficient stormwater drainage infrastructure for effective discharge during intense rainfall events.
To evaluate BGI feasibility within these constraints, this study developed a hydrological flood risk model using municipal datasets supplemented with satellite imagery where spatial information was incomplete. The modelling framework combined QGIS-based spatial analysis with EPA-SWMM hydrologic–hydraulic simulations, enabling the identification of flood-prone nodes and runoff patterns across the selected catchments.
Flood reduction was assessed using node-level flooding statistics by aggregating the total flood volume across all flooded nodes under the BGI scenario. As presented in Table S3 (see Supplementary Materials), most nodes exhibited negligible or zero flood volumes and no ponding depth, with flooding concentrated at a limited number of locations.
The sum of maximum flooding discharges across nodes decreased from 94.1 m3/s to 51.7 m3/s, corresponding to an overall reduction of approximately 45%. Although peak flows at individual nodes are not temporally coincident and therefore this sum does not represent an actual combined discharge, it provides a useful comparative indicator of changes in flood flow magnitude across the system. These results suggest that, under the simulated conditions, BGI measures are more effective in attenuating peak flows than in substantially reducing total runoff volumes.
This system-level reduction in peak flooding is broadly consistent with sub-catchment water balance responses, where increased storage and infiltration associated with infiltration trenches (IT), permeable pavements (PP), and green roofs (GR) reduce surface outflow. However, localised increases in flooding were observed at specific nodes, indicating that BGI interventions may also lead to spatial redistribution of flows within the drainage network.
Among the nodes causing flooding under post BGI conditions, the two nodes 18539 and A1611/189J (see Table 5 and Table 6) exhibit special behaviour, in as much as they produce substantially higher flooding volumes under post BGI than under pre BGI conditions. The explanation for this effect can be found in the characteristics of the slope pattern, the drainage system structure, and even more influential in the predominating BGI measure. These two flooding nodes are located in sub-catchments 410_12 and 410_13 (neighbouring north of 410_12, see Figure 9). The topography shows a distinct slope from south to north, i.e., from sub-catchment 410_12 to 410_13 (see contour lines in Figure S11, Supplementary Materials). This is also embodied in the drainage system structure. Three main drainage pipes are guiding the runoff from 410_12 to 410_13 (Figure 9). In sub-catchment 410_12, large roof areas with a potential for green roof implementation were identified on three hospital buildings (Figure 12). While permeable pavement and infiltration trenches reduce the runoff via infiltration, green roofs are the only of these three measures that have a retention function. They are not significantly reducing the runoff volume, but altering the hydrograph towards reducing peak runoff and prolonging runoff duration.
Under pre BGI conditions the runoff hydrograph in 410_12 is short, while its peak is not high enough to surcharge node 18539, and the peak runoff from the upstream catchment does not arrive simultaneously, but after the peak created in 410_12 has already passed the critical node. Under post BGI conditions, the greens roofs cause a decelerated and a prolonged runoff, such that there is still substantial runoff from the large green roof area when the peak runoff from the upstream sub-catchment arrives, leading to surcharge of node 18539, located immediately downstream of the hospital buildings with green roofs. This effect still holds in the downstream sub-catchment 410_13 in which the high runoff from 410_12 last for a longer duration and now coincides with the peak created in 410_13. Moreover, in 410_13, no major BGI potential could be identified, and thus, downstream of a joint bringing together the local runoff peak with the prolonged runoff from 410_12, node A1611/189J is surcharged and subject to an increased flooding volume compared to pre BGI condition, although somewhat less pronounced than at node 18539. However, due to the absence of detailed hydraulic validation data and limited access to model configuration, this mechanism cannot be conclusively verified and should be interpreted with cautions.
Such effects of synchronising hydrographs have to be considered in drainage system planning. They can be omitted by appropriate network structure causing different runoff pathways for potentially corresponding peak runoffs, by creating a spatially more homogenised retention, if necessary, through implementation of grey infrastructure, or by provision of save surface runoff pathways or retention at the predefined critical nodes, where possible.
Overall, the results demonstrate that distributed hydrological benefits at the sub-catchment scale can contribute to reductions in overall flood intensity, while also highlighting the importance of accounting for site-specific hydraulic responses and potential localised adverse effects.
Among the tested measures, infiltration trenches demonstrated the highest infiltration performance, particularly where space was available along road medians and dividers. Permeable pavements proved effective along continuous footpath networks, while green roofs contributed less significantly due to structural constraints and rooftop conditions in older buildings. These findings indicate that the spatial distribution and coverage of BGI interventions strongly influence runoff reduction performance.
Despite these improvements, some nodes continued to flood due to hydraulic limitations such as undersized pipes, limited spatial coverage of BGI interventions, and untreated upstream catchments. Additionally, intense rainfall events may exceed the storage capacity of BGI systems, particularly in areas with shallow groundwater.
The shallow groundwater conditions observed in the study area (approximately 2 m below ground level) suggest that infiltration-based BGI systems may also contribute to local groundwater recharge, particularly during monsoon periods. However, careful design is required to prevent groundwater mounding or prolonged soil saturation.
An important contextual factor influencing stormwater management in Mumbai is the ongoing road concretization programme initiated by the MCGM. Historically, most roads in the city were surfaced with asphalt, but current plans aim to concretize approximately 800 km of roads by 2027 to reduce pothole formation during monsoon seasons. While this initiative improves road durability, research indicates that cement concrete pavements generate extremely high runoff coefficients (0.94–0.99), meaning that almost all rainfall becomes surface runoff. This transformation may therefore increase urban flood risk.
The flood reduction results obtained in this study were based on non-concretized road conditions. Under fully concretized road networks, permeable sidewalks alone may achieve only limited runoff reduction during high-intensity rainfall events. To maintain flood mitigation performance, additional engineering measures should be integrated into BGI systems, including curb cuts connecting road runoff to permeable sidewalks, increased subsurface storage beneath sidewalks, integration of tree trenches, and controlled overflow connections to storm drains.
These hybrid design approaches allow permeable sidewalks to function as linear infiltration systems within the urban drainage network. Therefore, while road concretization may improve transportation infrastructure, it should be implemented alongside flood-resilient design strategies that treat roads as components of the broader urban water management system.
5. Conclusions, Policy Recommendations, Limitations and Future Research
This study demonstrates the applicability of BGI strategies for urban stormwater management in highly dense metropolitan environments under a simulated 25-year return period extreme rainfall scenario. By integrating QGIS-based spatial analysis with EPA-SWMM hydrologic–hydraulic modelling, the research developed a framework for identifying flooding hotspots, analysing runoff patterns, and evaluating the performance of LID measures within existing drainage systems during extreme rainfall conditions.
The combined modelling approach provides a replicable methodology for catchment-scale stormwater planning, enabling decision-makers to assess the potential effectiveness of BGI interventions in dense urban areas. Through detailed spatial analysis and hydrologic simulations, the study identified critical flood-prone nodes within Wards F/N and G/N and demonstrated that targeted BGI interventions such as permeable pavements along pedestrian corridors, infiltration trenches in road dividers, and green roofs on selected public buildings can significantly reduce peak runoff and improve drainage performance.
These findings are particularly important in the context of Mumbai’s rapid urbanisation. Between 1988 and 2018, the city lost approximately 45.2% of its green cover, while impervious surfaces expanded significantly, increasing runoff coefficients from approximately 0.5 to nearly 1.0. Catchment areas contributing to stormwater drainage have increased from 20% to as high as 70–90%, intensifying flood risk during monsoon rainfall events.
Addressing these challenges requires a hybrid grey–green stormwater management strategy. Traditional drainage infrastructure such as pumping stations, stormwater tunnels, and upgraded drainage networks must be complemented by ecological interventions including BGI integration, mangrove conservation, and restoration of natural drainage systems.
From a planning perspective, the modelling framework developed in this study provides a scalable tool for municipal planning and policy development. The results from Wards F/N and G/N can serve as pilot examples for integrating permeable pavements, infiltration trenches, and green roofs across other wards of Mumbai. This approach can also be adapted for other rapidly urbanising and highly dense metropolitan cities across India.
Municipal initiatives such as the BRIMSTOWAD I and II programmes already form the foundation of Mumbai’s stormwater drainage planning. As the city continues upgrading its drainage infrastructure, BGI integration should become a mandatory component of the stormwater management strategy. The modelling approach developed in this study could inform municipal guidelines for BGI design, enabling evidence-based planning and evaluation of drainage performance before and after interventions.
Mumbai’s Development Plan 2030–2034 includes references to expanding BGI across the city. However, these policies remain largely conceptual. The modelling framework presented in this research provides a practical pathway for translating these objectives into design standards, planning regulations, and municipal investment strategies.
An important policy consideration highlighted by this study is Mumbai’s ongoing road concretization programme. While concrete roads may reduce maintenance costs and improve durability, fully impermeable surfaces can significantly increase runoff and exacerbate flooding during monsoon storms. Road upgrades should therefore be treated not only as transportation improvements but also as hydrological design interventions. Integrating permeable edges, infiltration systems, and hybrid drainage solutions into road infrastructure can help maintain flood resilience while achieving road durability goals.
Despite the promising findings, this study is subject to several limitations. Incomplete drainage network datasets, including missing infrastructure elements such as inlets and culverts, as well as the absence of measured discharge data, constrained the extent of model calibration and validation. Impervious surface estimates derived from satellite imagery may also differ from actual ground conditions, while SWMM outfall representations may not fully capture tidal influences affecting Mumbai’s coastal drainage systems.
In addition, the BGI performance parameters used in the simulations assume ideal conditions and do not account for long-term operational challenges such as clogging, sediment accumulation, or inadequate maintenance. These uncertainties highlight the need for improved stormwater monitoring systems, higher-resolution spatial datasets, and more robust infrastructure management frameworks.
Due to the absence of measured flow and discharge data, the model could not be comprehensively calibrated against key hydraulic performance indicators such as peak discharge and runoff volumes. As a result, the model outcomes should be interpreted as indicative of relative system behaviour under different scenarios, rather than precise quantitative predictions.
Future research should focus on expanding field-based hydrological measurements, improving drainage network datasets, and evaluating the long-term performance of BGI systems under real urban conditions. Ward-level modelling approaches such as the one developed in this study can support more robust, data-informed urban flood management, particularly as more comprehensive validation data become available. However, the methodology introduced in this paper, shows a promising approach to bring forward planning under the constraints described above.
Overall, integrating SWMM–QGIS modelling with spatial planning analysis provides a powerful framework for evaluating BGI feasibility in dense urban environments. By incorporating such data-driven approaches into municipal planning systems, cities like Mumbai can strengthen stormwater resilience and support sustainable urban development under increasing climate and urbanisation pressures.
Supplementary Materials
The following supporting information can be downloaded at: https://www.mdpi.com/article/10.3390/w18131542/s1.
Author Contributions
Conceptualization, V.K.; methodology, V.K. and V.S.; software, V.S.; validation, V.S. and P.K.; formal analysis, V.K. and V.S.; investigation, V.K., V.S. and P.K.; resources, V.K. and P.K.; data curation, V.K. and V.S.; writing—original draft preparation, V.K. and V.S.; writing—review and editing, V.K., V.S. and P.K.; visualisation, V.K., V.S. and P.K.; supervision, P.K.; project administration, V.K.; funding acquisition, V.K. and P.K. All authors have read and agreed to the published version of the manuscript.
Funding
The lead author gratefully acknowledges the Maria Reiche Doctoral Fellowship of the TUD Dresden University of Technology, funded by the Federal Ministry of Research, Technology and Space (BMFTR) and the Free State of Saxony as part of the Excellence Strategy of the Federal and State Government, for the financial support that resulted in the production of this publication as part of her doctoral project.
Data Availability Statement
We thank the Municipal Corporation of Greater Mumbai; its commissioners and chief engineers of the Stormwater Drain Department and Disaster Cell to provide municipal data such as the BRIMSTOWAD-II report and its supplementary data along with rainfall data from the Indian Meteorological Department. However, the data presented in this study are available on request from the corresponding author due to the data cannot be publicly shared and was provided to the authors of this work in official, confidential capacity.
Acknowledgments
We acknowledge the contribution of Robin Singh and Diego Novoa Vazquez in undertaking certain mathematical and technical verifications of the paper.
Conflicts of Interest
The authors declare no conflicts of interest.
References
- Kookana, R.S.; Drechsel, P.; Jamwal, P.; Vanderzalm, J. Urbanisation and emerging economies: Issues and potential solutions for water and food security. Sci. Total Environ. 2020, 732, 139057. [Google Scholar] [CrossRef] [Scilit] [PubMed]
- United Nations Department of Economic and Social Affairs. 2018 Revision of World Urbanization Prospects. Available online: https://www.un.org/development/desa/en/news/population/2018-revision-of-world-urbanization-prospects.html (accessed on 19 May 2026).
- Dobbs, R.; Sankhe, S. Comparing Urbanization in China and India; McKinsey & Company: Minato City, Japan, 2010; Available online: https://www.mckinsey.com/featured-insights/urbanization/comparing-urbanization-in-china-and-india (accessed on 19 May 2026).
- Kelkar, V.; Helm, B.; Krebs, P. A semi-systematic global review to understand the key components essential for advancing the actual design, planning, and implementation of blue–green infrastructure in Indian cities. Land 2025, 14, 2287. [Google Scholar] [CrossRef] [Scilit]
- Liu, N.; Zhang, F. Urban green spaces and flood disaster management: Toward sustainable urban design. Front. Public Health 2025, 13, 1583978. [Google Scholar] [CrossRef] [Scilit] [PubMed]
- Hamel, P.; Tan, L. Blue–green infrastructure for flood and water quality management in Southeast Asia: Evidence and knowledge gaps. Environ. Manag. 2022, 69, 699–718. [Google Scholar] [CrossRef] [Scilit] [PubMed]
- Vivekanandan, N. Probabilistic modelling of hourly rainfall data for development of intensity-duration-frequency relationships. Bonfring Int. J. Data Min. 2012, 2, 16. [Google Scholar] [CrossRef] [Scilit]
- Almaaitah, T.M.A. The potential of blue-green infrastructure as a climate change adaptation strategy: A systematic literature review. Blue-Green Syst. 2021, 3, 223–244. [Google Scholar] [CrossRef] [Scilit]
- Gangawar, D.; Bansal, A. Navigating urban floods: Spatio-temporal analysis of blue-green infrastructure and urban densification in Indian cities. In Proceedings of the EGU General Assembly 2025, Vienna, Austria, 27 April–2 May 2025. [Google Scholar] [CrossRef] [Scilit]
- Chadchan, R.J. Analysis of urban growth trends in the post-economic reforms period in India. Int. J. Sustain. Built Environ. 2012, 1, 36–49. [Google Scholar] [CrossRef] [Scilit]
- Jha, M.K.; Chaskin, R.J.; Vyas, M. Slum resettlement, built environment, and socio-spatial dynamics: Lived experiences in Mumbai’s resettlement colonies. J. Urban Aff. 2025. [Google Scholar] [CrossRef] [Scilit]
- Goyal, A.; de Mesquita Lima, J. Finding space for water in informal settlements in Dharavi and Dili. Urbanisation 2024, 9, 167–185. [Google Scholar] [CrossRef] [Scilit]
- Shantaram, P.; Pushparaj, A.; Rajasekaran, A. Spatial analysis of green cover change in Mumbai City, India. Arboric. Res. Educ. Acad. 2020, 15, 5–8. [Google Scholar]
- Municipal Corporation of Greater Mumbai. BRIMSTOWAD II Master Plan Report; Municipal Corporation of Greater Mumbai: Mumbai, India, 2017. [Google Scholar]
- Municipal Corporation of Greater Mumbai. Stormwater Drain Department Report; Municipal Corporation of Greater Mumbai: Mumbai, India. Available online: https://www.mcgm.gov.in/irj/go/km/docs/documents/Tenders/ETH/ETH_8000055743_221123.pdf (accessed on 19 May 2026).
- Municipal Corporation of Greater Mumbai. Greater Mumbai Report on Draft Development Plan 2034; Municipal Corporation of Greater Mumbai: Mumbai, India. Available online: https://portal.mcgm.gov.in/irj/go/km/docs/documents/MCGM%20Department%20List/Chief%20Engineer%20(Development%20Plan)/Docs/Draft%20DP%202034/DATA%20RELATED%20TO%20DRAFT%20DP2034/5.%20Draft%20DP%20Report/DRAFT%20DP%20REPORT%20-%202034%20Final.pdf (accessed on 19 May 2026).
- Singh, J.; Sekharan, S.; Karmakar, S.; Ghosh, S.; Zope, P.E.; Eldho, T.I. Spatio-temporal analysis of sub-hourly rainfall over Mumbai, India: Is statistical forecasting futile? J. Earth Syst. Sci. 2017, 126, 38. [Google Scholar]
- MWH India Pvt. Ltd. BRIMSTOWAD-II Master Plan Report for Catchment 410; MWH India Pvt. Ltd.: Mumbai, India, 2017. [Google Scholar]
- MWH India Pvt. Ltd. BRIMSTOWAD-II Master Plan Report for Catchment 506–507; MWH India Pvt. Ltd.: Mumbai, India, 2017. [Google Scholar]
- Mhaske, S.Y.; Choudhury, D. GIS–GPS based map of soil index properties for Mumbai. In Geo-Frontiers 2011: Advances in Geotechnical Engineering; American Society of Civil Engineers: Dallas, TX, USA, 2012. [Google Scholar]
- Lee, K.T.; Chien, T.-C.; Yu, W.-S.; Chen, N.-K.; Huang, P.-C.; Lin, Y.-T.; Hsu, Y.-H.; Liao, Y.-H.; Chen, H.-Y.; Hsu, C.-W.; et al. Evaluating design rainstorm durations for urban flood control. Earth 2025, 6, 53. [Google Scholar] [CrossRef] [Scilit]
- Green, W.H.; Ampt, G.A. Studies on soil physics. I. The flow of air and water through soils. J. Agric. Sci. 1911, 4, 1–24. [Google Scholar] [CrossRef] [Scilit]
- Horton, R.E. An approach toward physical interpretation of infiltration capacity. Proc. Soil Sci. Soc. Am. 1940, 5, 399–417. [Google Scholar]
- O’Hare, G.; Abbott, D. A review of slum housing policies in Mumbai. Cities 1998, 15, 269–283. [Google Scholar] [CrossRef] [Scilit]
- Deshmukh, M.S. Conditions of Slum Population of Major Sub-Urban Wards of Mumbai in Maharashtra. Voice Res. 2013, 2, 37–42. Available online: https://voiceofresearch.org/doc/sep-2013/sep-2013_9.pdf (accessed on 19 May 2026).

Disclaimer/Publisher’s Note: The statements, opinions and data contained in all publications are solely those of the individual author(s) and contributor(s) and not of MDPI and/or the editor(s). MDPI and/or the editor(s) disclaim responsibility for any injury to people or property resulting from any ideas, methods, instructions or products referred to in the content. |
© 2026 by the authors. Licensee MDPI, Basel, Switzerland. This article is an open access article distributed under the terms and conditions of the Creative Commons Attribution (CC BY) license.