


Abstract
Snow disasters are severe natural hazards in Jilin Province, China. This research formulated a holistic risk assessment framework which integrates the factors of hazardousness, sensitivity, vulnerability, and disaster prevention and mitigation capacity. Using multi-source data and Geographic Information System (GIS), we evaluated snow disaster risks through 15 selected indicators weighted by the entropy method. Results show high-risk areas primarily concentrated in southeastern mountainous regions, including Jingyu, Fusong, Changbai, and Linjiang. Disaster sensitivity decreases from southeast to northwest, while high-vulnerability zones appear in central urban areas like Changchun. The comprehensive risk generally declines from the southeastern mountains to the northwestern plains. This assessment model effectively reflects snow disaster formation mechanisms and spatial patterns, providing scientific support for disaster prevention and emergency management in Jilin Province.
1. Introduction
Snow disasters, resulting from widespread or persistent snowfall, significantly disrupt transportation, agriculture, energy supply, and daily life [1]. While seasonal snow accumulation is vital for replenishing water resources and maintaining ecological balance, excessive snowfall can trigger severe disasters, including avalanches, which threaten socio-economic development and ecosystem stability through road blockages, crop destruction, livestock loss, and infrastructure damage, posing a severe threat to socio-economic development and ecosystem stability [2,3]. Characterized by sudden onset, broad impact, and high destructive potential, these events present significant challenges for prevention and emergency management [4]. With its temperate continental monsoon climate featuring long winters and frequent snowfall, Jilin Province in Northeast China is a high-risk area for such disasters. Given the realities of climate change and the growing frequency of extreme weather events, a systematic assessment of snow disaster risks in Jilin Province is imperative to formulate scientific strategies for regional disaster prevention and to underpin sustainable socio-economic development. Researchers have conducted extensive studies using various methodologies to mitigate losses from snow disasters. Traditional approaches primarily relied on meteorological observations and historical disaster records. For instance, Germain, D. et al. (2016) employed historical data to assess snow disaster risk in northern Quebec [5], while Delegerima et al. (2020) established a risk assessment system for the Xilingol Pastoral Area using meteorological station data from 1980 to 2015 [6]. Similar methodologies were applied in Anhui Province [7], the Qinghai–Tibet Plateau [8,9,10], and Heilongjiang Province [11]. However, meteorological stations are unevenly distributed and particularly sparse across plateaus, mountainous areas, and remote regions. Furthermore, their data is not updated in real time, failing to capture fine-scale local variations. This limitation has made the integration of multi-source data, fueled by the rapid advancement of Geographic Information Systems (GIS) and remote sensing, a crucial method to enhance the precision of risk assessments.
Remote sensing provides critical snow parameters—including snow cover area [12,13], snow depth [14,15], and snow water equivalent [15,16], which enhance the real-time capability and coverage of snow disaster evaluation. For example, Vydra et al. (2024) utilized MODIS snow cover products and hydrological station data to analyze how snow cover changes affect runoff timing and water resource management in Central Asia’s Syr Darya basin [17]. Similarly, the work of Zhang et al. (2010) utilized MODIS snow cover products for monitoring the dynamics of winter snow cover in China’s Liaoning Province [18]. Sun et al. (2024) further incorporated long-term remote sensing snow depth data to construct a multi-indicator risk assessment framework based on historical disaster frequency, blizzard days, maximum snow depth, and related variables [19]. Nevertheless, a full integration of remote sensing data with other influencing factors is often absent in many existing studies. This shortcoming hinders the advancement of comprehensive risk assessment models and compromises the objectivity and applicability of the evaluation results.
GIS provides a powerful platform for integrating multi-dimensional data, such as terrain, meteorology, land use, and socio-economic information, enabling spatially explicit risk modeling and visualization. This capability significantly enhances the data foundation for snow disaster assessment and supports regional disaster zoning. Numerous studies have demonstrated its application: Zhao et al. (2021) developed a low-temperature freezing disaster warning model in Guizhou Province using the Analytic Hierarchy Process (AHP) [20]. Liu et al. (2011) constructed a comprehensive risk index for the Xilingol Prairie by incorporating hazard, exposure, vulnerability, disaster prevention and mitigation capacity [21]. Wang et al. (2013) built a county-level snow disaster early warning model on the Tibetan Plateau by integrating remote sensing, meteorological, and socio-economic data [22]. And Gao et al. (2008) combined MODIS snow indices with DEM to monitor grassland snow disasters in Tibet [23]. Despite these advances, most existing models fail to systematically incorporate the four core dimensions of disaster risk: hazardousness, sensitivity, vulnerability, and mitigation capacity. As a result, assessments tend to overemphasize natural factors while underrepresenting socio-economic drivers and the moderating role of emergency response capability. Moreover, regional-scale studies are often constrained by coarse data resolution or subjective weighting methods, such as expert scoring, which limit the objective quantification of indicator contributions and reduce the reliability of evaluation outcomes.
As a key agricultural and ecological region in China, Jilin Province exhibits snow disaster risk patterns shaped by complex interactions among topography, climate, and socio-economic factors. However, existing research lacks a systematic integration of multi-source data with objective weighting methods within a comprehensive disaster risk assessment framework. The theoretical model of natural disaster risk has not been fully incorporated, limiting the ability of local governments to develop differentiated prevention strategies and hindering evidence-based decisions for regional resilience building. To address these gaps, this study develops a GIS-based comprehensive snow disaster risk assessment model grounded in disaster risk theory, with empirical validation in Jilin Province. The research aims to: (1) construct a four-dimensional evaluation framework encompassing hazard, sensitivity, vulnerability, and mitigation capacity based on multi-source data; (2) analyze spatial patterns of snow disaster risk via spatial analysis and classification techniques; and (3) provide scientific support for regional disaster prevention planning and emergency resource allocation
2. Materials and Methods
2.1. Study Area
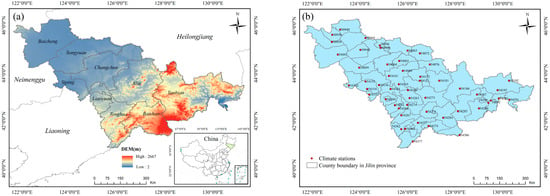
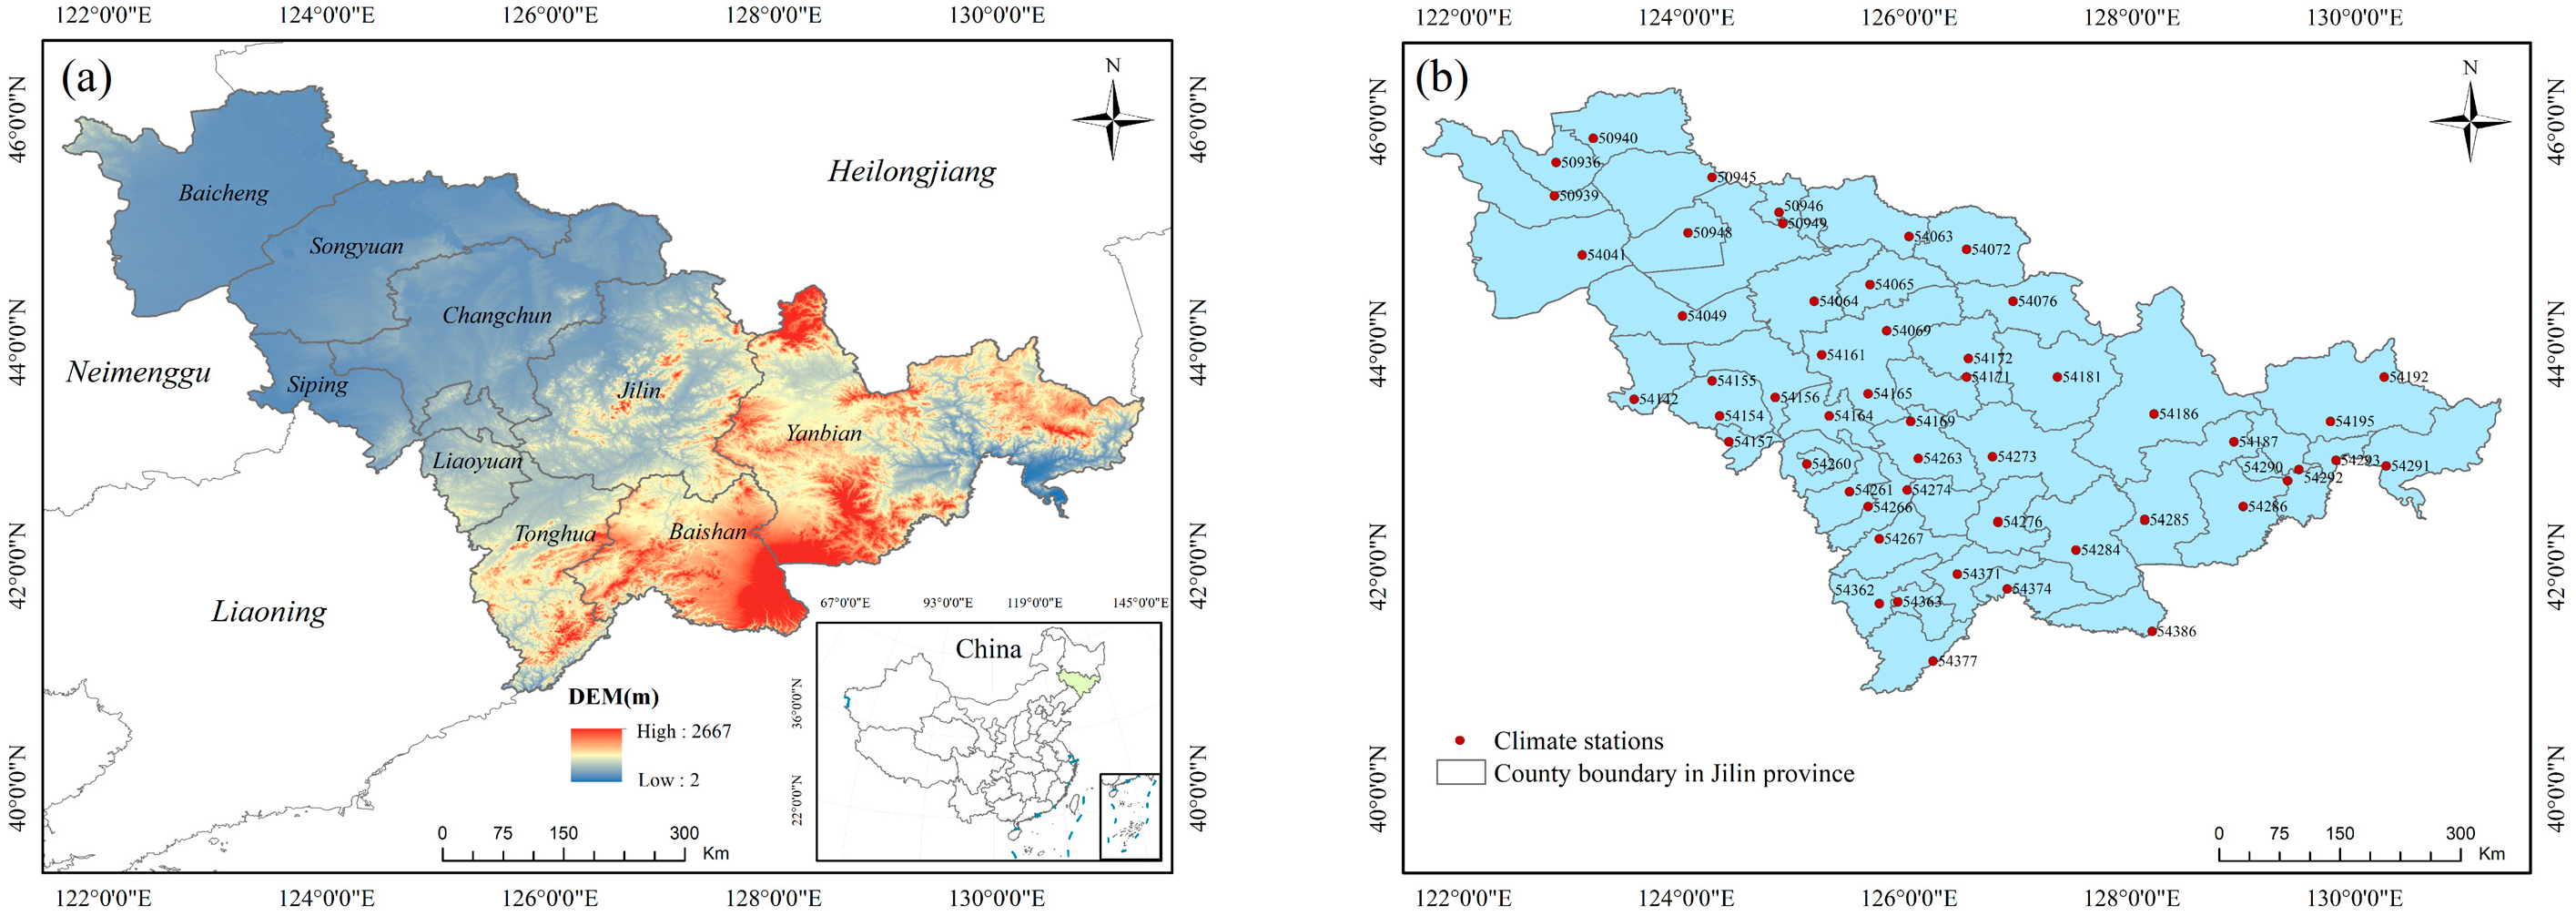
Jilin Province is situated in central Northeast China (121°38′–131°19′ E, 40°50′–46°18′ N), as shown in Figure 1. It borders Heilongjiang Province to the north, Liaoning Province to the south, the Inner Mongolia Autonomous Region to the west, Russia to the east, and the Democratic People’s Republic of Korea to the southeast, serving as a key geographic gateway linking Northeast China with Northeast Asia [24].
Figure 1.
Overview of the study area: (a) the geographic map; (b) climate stations. The DEM in (a) is provided by the SRTM.
Topographically, the province descends from the higher southeastern regions to the lower northwestern areas, with elevations spanning from 2 m up to 2667 m at Baiyun Peak, the summit of the Changbai Mountains. Climatically, it falls within a temperate continental monsoon zone, distinguished by prolonged cold winters followed by warm, humid summers. The mean annual temperature ranges from 2 °C to 6 °C [25], with extreme minima below −40 °C. Additionally, temperature inversion is a characteristic phenomenon in winter, particularly in mountainous areas, resulting in an inverted vertical temperature distribution where under stable atmospheric conditions, valley areas become colder than higher elevations [26]. The province spans a total area of approximately 187,400 km2 and is administratively divided into eight prefecture-level cities, such as Changchun, Jilin, and Siping, in addition to the Yanbian Korean Autonomous Prefecture [25].
As a significant grain production base in China, Jilin possesses fertile black soils and primarily cultivates corn, rice, and soybeans [27]. The eastern Changbai Mountains also form an essential forestry region with extensive forest coverage. Despite its agricultural and ecological significance, the province’s ecosystems face increasing challenges under global climate change [28]. Jilin’s winters are marked by persistent cold and snow cover. Yet, the region has recently exhibited a trend towards warmer and drier conditions. This warming has been accompanied by a rise in the frequency and intensity of extreme weather events, including intense snowfall, winter rainstorms (freezing rain), and cold waves [29].
2.2. Data Sources
2.2.1. Climate Data
Meteorological data were obtained from 52 climate stations in Jilin Province (Figure 1b) from 1 January 2000, to 31 December 2020. The China Meteorological Data Sharing Service Network (http://data.cma.cn, accessed on 21 August 2025) provided the daily snow depth data in CSV format. The raw snow depth data were further processed to obtain two subsequent meteorological indicators: snow depth and the number of days with snow depth greater than 10 cm. Table S1 summarizes the data source used in this study.
2.2.2. Remote Sensing Data
Remote sensing snow data were sourced from the National Glacier, Frozen Soil, and Desert Scientific Data Center (https://www.ncdc.ac.cn, accessed on 30 August 2025), which released the 2000–2020 MODIS China Snow Phenology dataset [30]. The spatial resolution is 500 m, with a temporal resolution of one year. The multi-year mean values of snow cover days for Jilin Province from 2000 to 2020 were calculated for further work.
2.2.3. Topographic Data
The Digital Elevation Model (DEM) elevation data used in this study originates from the Shuttle Radar Topography Mission (SRTM) system [31], which was carried by NASA’s Endeavour Space Shuttle on 11 February 2000. This system covers 80% of the earth’s land area, with a latitude range from 60° N to 60° S. The spatial resolution of the SRTM data is 90 m [32], offering relatively high accuracy. This dataset was primarily used to derive the elevation, slope, and aspect of Jilin Province.
2.2.4. Land Cover Data
The land use type data comes from the 30 m resolution product provided by the Resource and Environmental Science Data Center of the Chinese Academy of Sciences [33] (http://www.resdc.cn, accessed on 7 September 2025). This data is based mainly on remote sensing images from the U.S. Landsat satellites, and it was generated using manual visual interpretation methods. The land use data is classified into three levels: the first level categorizes the land into six types, including cultivated land, forest land, and others, based on land resources and usage attributes; the second level further subdivides the land based on natural characteristics into 20 types, such as paddy fields, dry land, and shrubland, which is used in this work.
2.2.5. The Socio-Economic Data
To obtain data on the population, economy, transportation, public fiscal expenditures, healthcare, and agriculture in Jilin Province, this study downloaded the 2020 Jilin Provincial Statistical Yearbook from the Jilin Provincial Bureau of Statistics (https://tjj.jl.gov.cn, accessed on 15 August 2025). After organizing the data, eight key indicators were selected for analysis. We organized the data at the municipal level and ultimately selected eight key indicators, which include: total population (10,000 people), crop planting area (hectares), total road mileage (km), number of industrial enterprises (units), public fiscal expenditure (100 million yuan), number of hospital beds (beds), per capita GDP (yuan) and number of large livestock (heads).
2.3. Research Methods
2.3.1. Method Framework
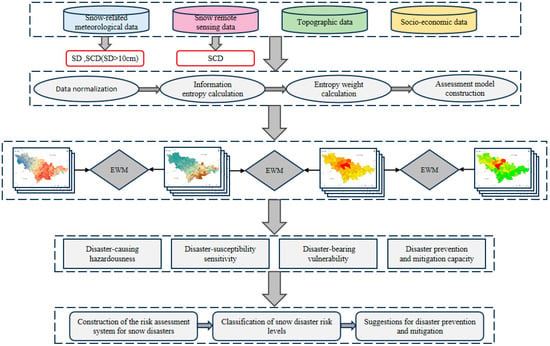
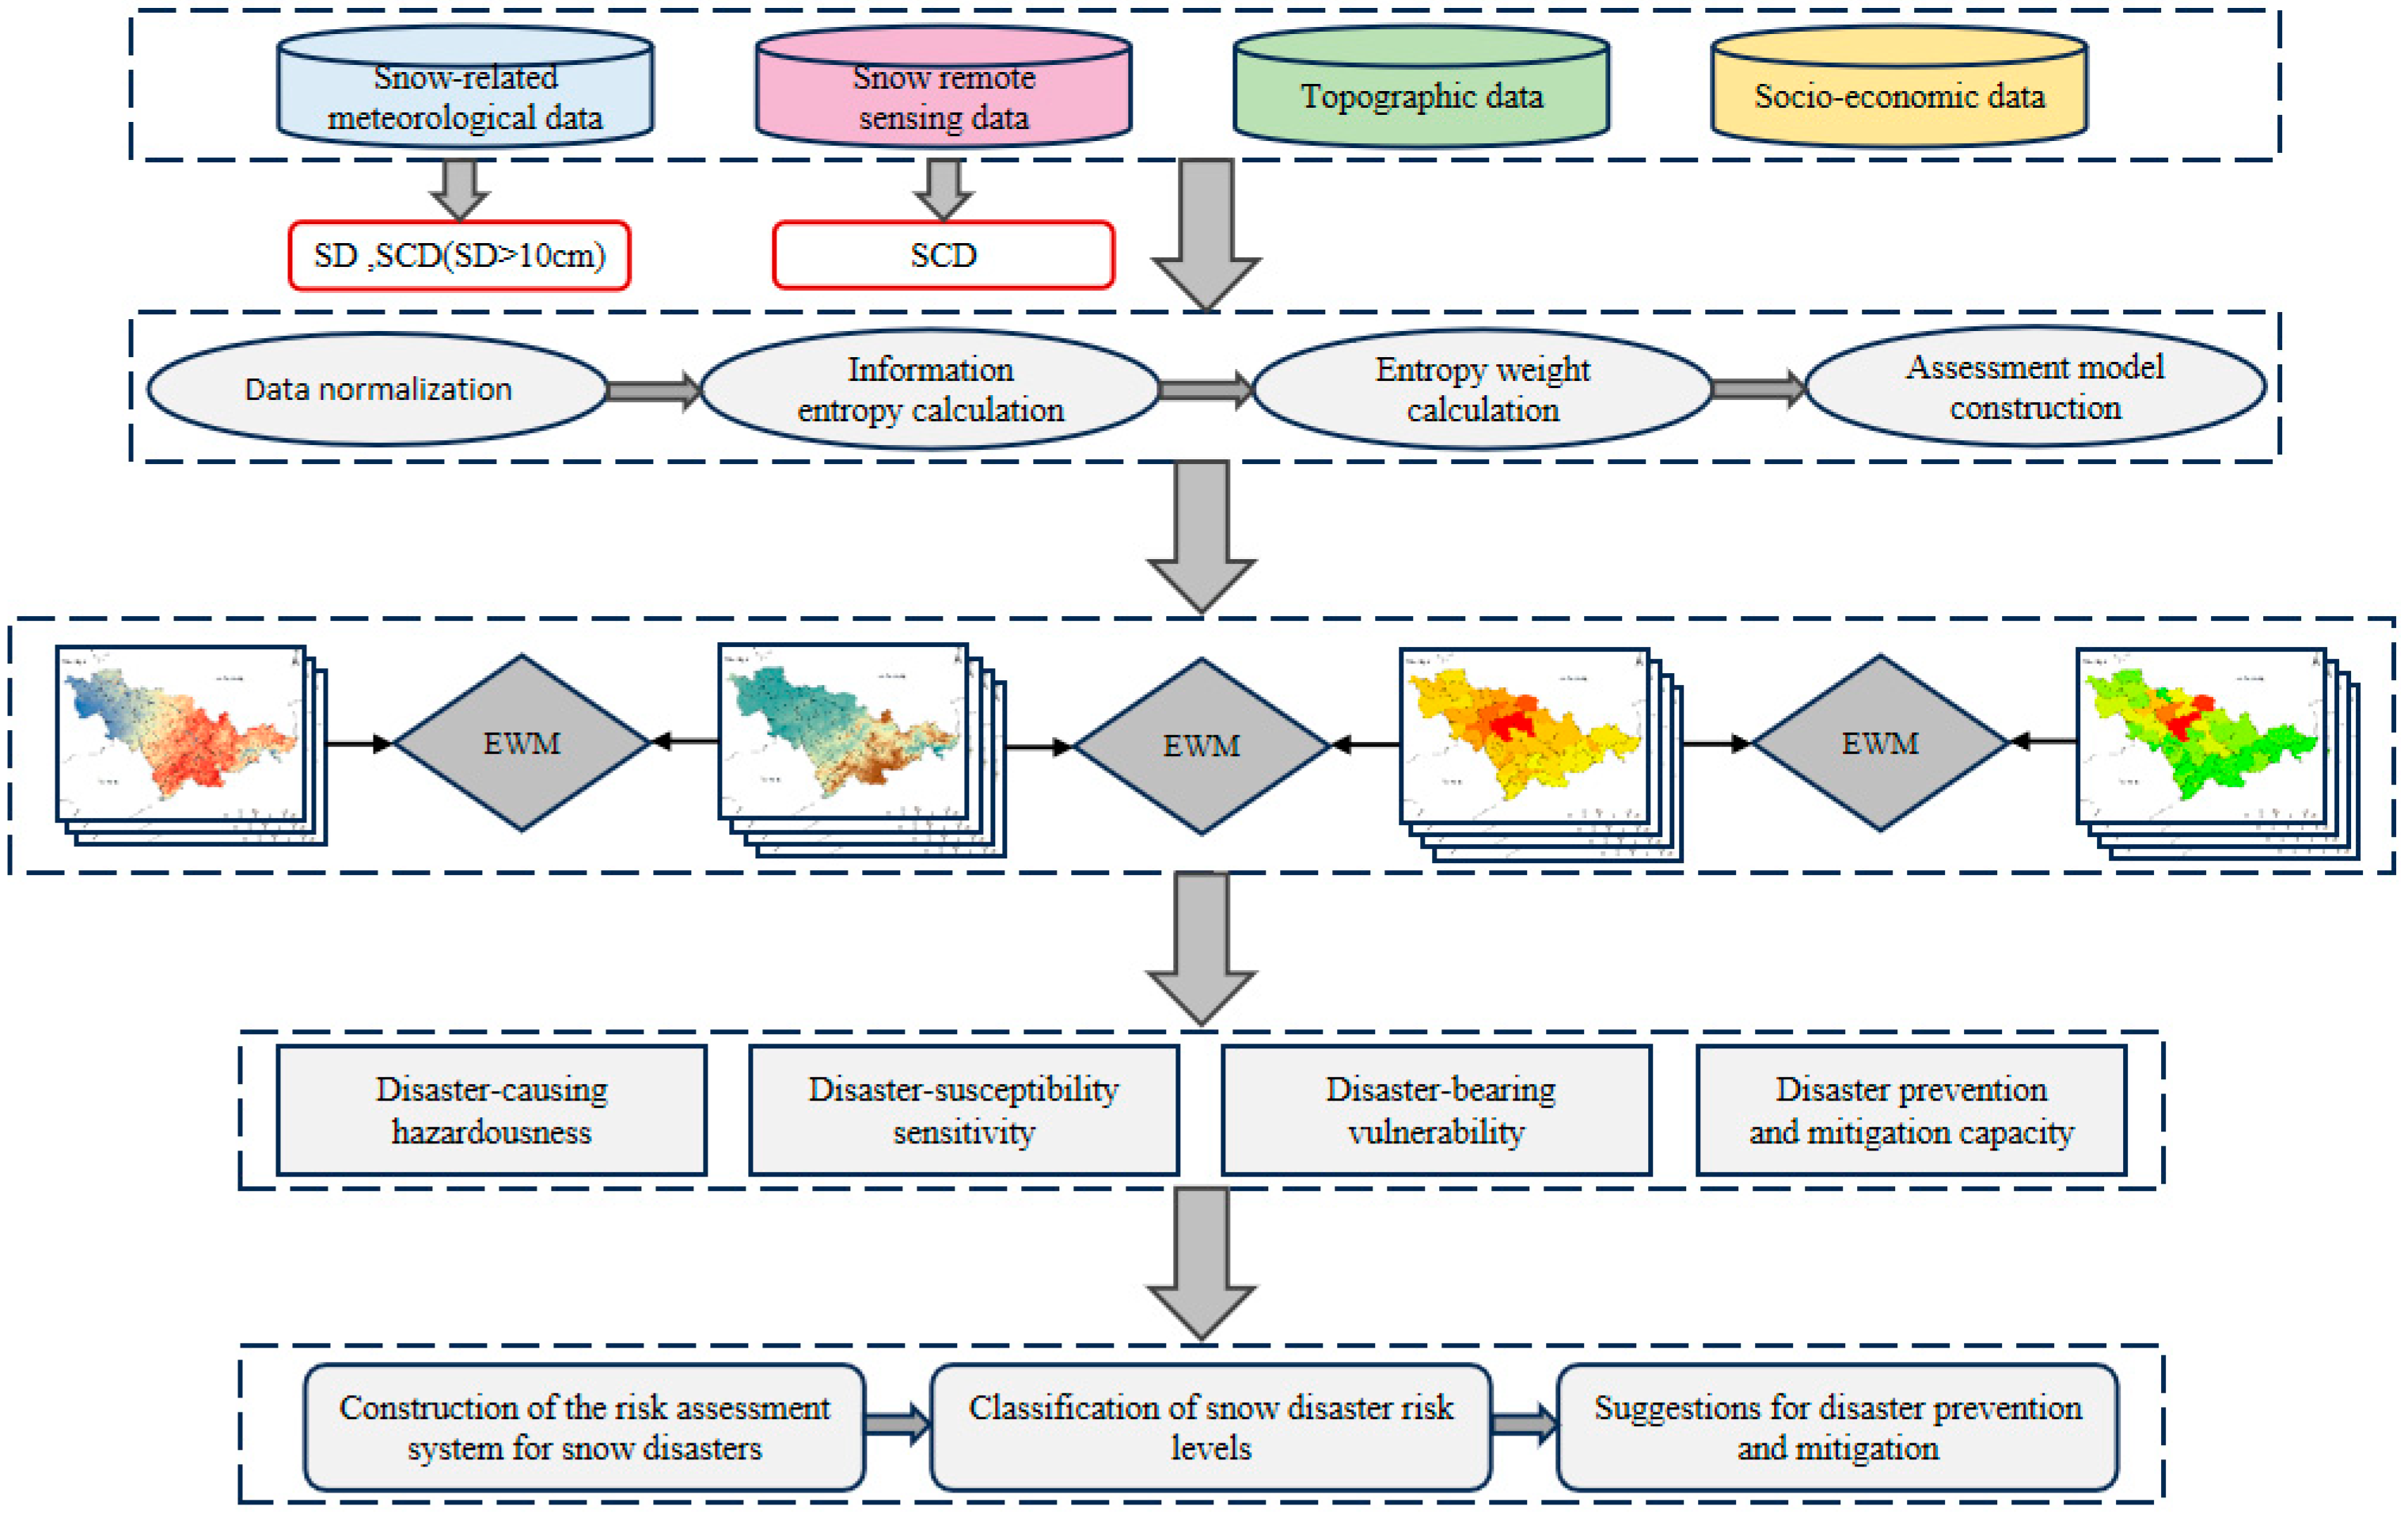
This study outlines the methodological framework for a comprehensive snow disaster risk assessment model through a structured framework (Figure 2), which is organized into three coherent phases. data preparation, model construction, and risk integration and mapping. Firstly, this study integrates four categories of data: meteorological records, remote sensing snow cover products, topographic datasets, and socio-economic statistics. These data support calculating four core risk components: hazardousness, susceptibility, vulnerability, and mitigation capacity. All indicators were normalized to eliminate dimensional differences and ensure comparability. Information entropy was then calculated based on the normalized data to quantify each indicator’s dispersion and informational value, establishing a basis for objective weighting.
Figure 2.
Flow chart of snow disaster risk assessment.
Then, the entropy weight method (EWM) [34] was applied to determine the weights of indicators across different assessment levels objectively. This method minimizes subjective bias and enhances the scientific rigor of the evaluation. The EWM was used iteratively to derive weight coefficients for the four core components, which were then integrated into a comprehensive risk assessment model.
Lastly, using the established model and assigned weights, the four-factor layers were combined to compute a composite snow disaster risk index. Risk levels were classified using the percentile method, resulting in a spatially explicit risk zoning map. This visualization aids in identifying regional risk patterns and supports data-informed decision-making for disaster prevention, resource allocation, and emergency management.
2.3.2. Selecting and Calculating the Indicators for Snow Disaster Risk
Disaster-causing hazardousness represents the prerequisite for snow disaster formation, with higher values indicating greater potential threat. Snow depth, snow cover days, and days with snow depth exceeding 10 cm were selected as assessment indicators, with particular emphasis on sudden heavy snowfall events. The calculation model is:
where Rz represents the disaster-causing hazardousness index, λi represents the weight coefficient for each hazard indicator. Ai represents the corresponding normalized indicator value.
Disaster-susceptibility sensitivity reflects the inherent environmental conditions that influence snow disaster formation. Four indicators were selected: elevation, slope, aspect, and land use type. The calculation model is:
where Ry represents the disaster-susceptibility sensitivity index, λi represents the weight coefficient for each sensitivity indicator, Bi is the corresponding normalized indicator value.
Disaster-bearing vulnerability characterizes the severity of potential loss when snow disasters occur. Four indicators were selected: total population, number of large livestock, number of industrial enterprises, and crop planting area. The calculation model is:
where Rc represents the disaster-bearing vulnerability index, λi represents the weight coefficient for each vulnerability indicator, Ci represents the corresponding normalized indicator value.
Disaster prevention and mitigation capacity represents regional capabilities in disaster resistance and recovery. Four indicators were selected: per capita GDP, public fiscal expenditure, total road mileage, and number of hospital beds, reflecting individual and governmental disaster response capabilities. The calculation model is:
where Rj represents the disaster prevention and mitigation capacity index, λi represents the weight coefficient, Di is the corresponding normalized indicator value.
2.3.3. Construction of the Risk Assessment Model
Given that the evaluation indicators have different units and dimensionalities, direct comparison across indicators is not feasible. To eliminate the influence of measurement units and enable meaningful comparisons, all 15 indicators were normalized to a standardized scale ranging from 0 to 1 using the min-max normalization method [35]. The normalization formula is applied as follows:
where yi denotes the normalized value for the i-th indicator, while xi represents is its original value. The terms max(xi) and min(xi) respectively correspond to the maximum and minimum values observed for that specific indicator.
The entropy weight method [34] is an objective technique that assigns weights to indicators by quantifying the information derived from variations in their observed values. Compared to traditional subjective methods like the AHP, this approach effectively avoids bias introduced by expert scoring [36]. In snow disaster risk assessment, information entropy quantifies each indicator’s uncertainty and informational contribution. A higher entropy value indicates greater uncertainty and information content in describing snow disaster risk, resulting in a smaller weight; conversely, a lower entropy value corresponds to less uncertainty and a larger weight. The information entropy is calculated for each indicator Ej as follows:
where xij denotes the value of the i-th sample for the j-th indicator, and pij s defined as its corresponding proportion (i = 1, 2, 3, …, n; j = 1, 2, 3, …, m). Subsequently, the entropy weight Wj for each indicator is computed as follows:
where Dj represents the coefficient of variation of the j-th indicator (j = 1, 2, 3, …, m). The entropy weight method was used to calculate the weights for each layer, as shown in Table 1.
Table 1.
The indicator weight of snow disaster assessment.
This study employed the percentile method to classify snow disaster risk levels and establish corresponding thresholds. This approach applies to various data types (e.g., continuous and discrete) and is not constrained by data distribution patterns [37]. It also demonstrates strong generalizability, making it suitable for disaster risk assessments across different regions and time periods. The percentile is calculated as follows:
where Pm denotes the m-th percentile; L represents the lower boundary of the m-th percentile group; N denotes the total number of groups; Fb denotes the cumulative frequency of groups below L; f is the frequency of the m-th percentile group; and i is the class width of the m-th percentile group. Based on the calculated percentiles, snow disaster risk levels were categorized as shown in Table 2, where R represents the comprehensive snow disaster risk index.
Table 2.
Classification of risk level of snow disasters. R represents the risk assessment index for snow disasters.
2.3.4. Risk Assessment Model of Snow Disasters
The snow disaster risk assessment system for Jilin Province established in this study comprises four core components: disaster-causing hazardousness, disaster-susceptibility sensitivity, disaster-bearing vulnerability, and disaster prevention and mitigation capacity. By integrating these four categories of risk indicators [38], a comprehensive evaluation of snow disaster risk levels in Jilin Province can be conducted. The entropy weight method [34] was employed to determine indicator weights, and the integrated snow disaster risk is calculated as follows:
where RI represents the snow disaster risk assessment index, Rz, Ry, Rc and Rj represent the normalized assessment indicators for disaster-causing hazardousness, disaster-susceptibility sensitivity, disaster-bearing vulnerability, and disaster prevention and mitigation capacity, respectively. Wa, Wb, Wc and Wd represent the weight coefficients for each component.
3. Results
A four-component framework encompassing hazardousness, sensitivity, vulnerability, and disaster prevention and mitigation capacity was employed to evaluate snow disaster risk in Jilin Province. The resultant risk index was then classified to achieve a comprehensive zoning of risk levels.
3.1. Disaster-Causing Hazardousness Assessment
The hazard assessment for snow disasters revealed the following indicator weights: average snow depth (0.32), number of snow days (0.24) and days with snow depth >10 cm (0.44). The hazard assessment model based on the entropy weight method is formulated as:
where A1, A2, and A3 represent the normalized assessment indicators of snow depth, snow cover days, and days with snow depth greater than 10 cm, respectively.
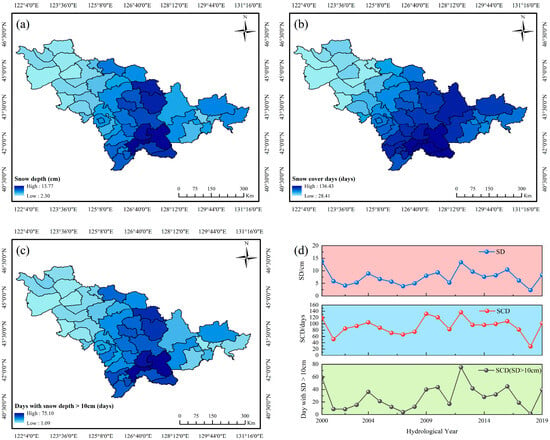
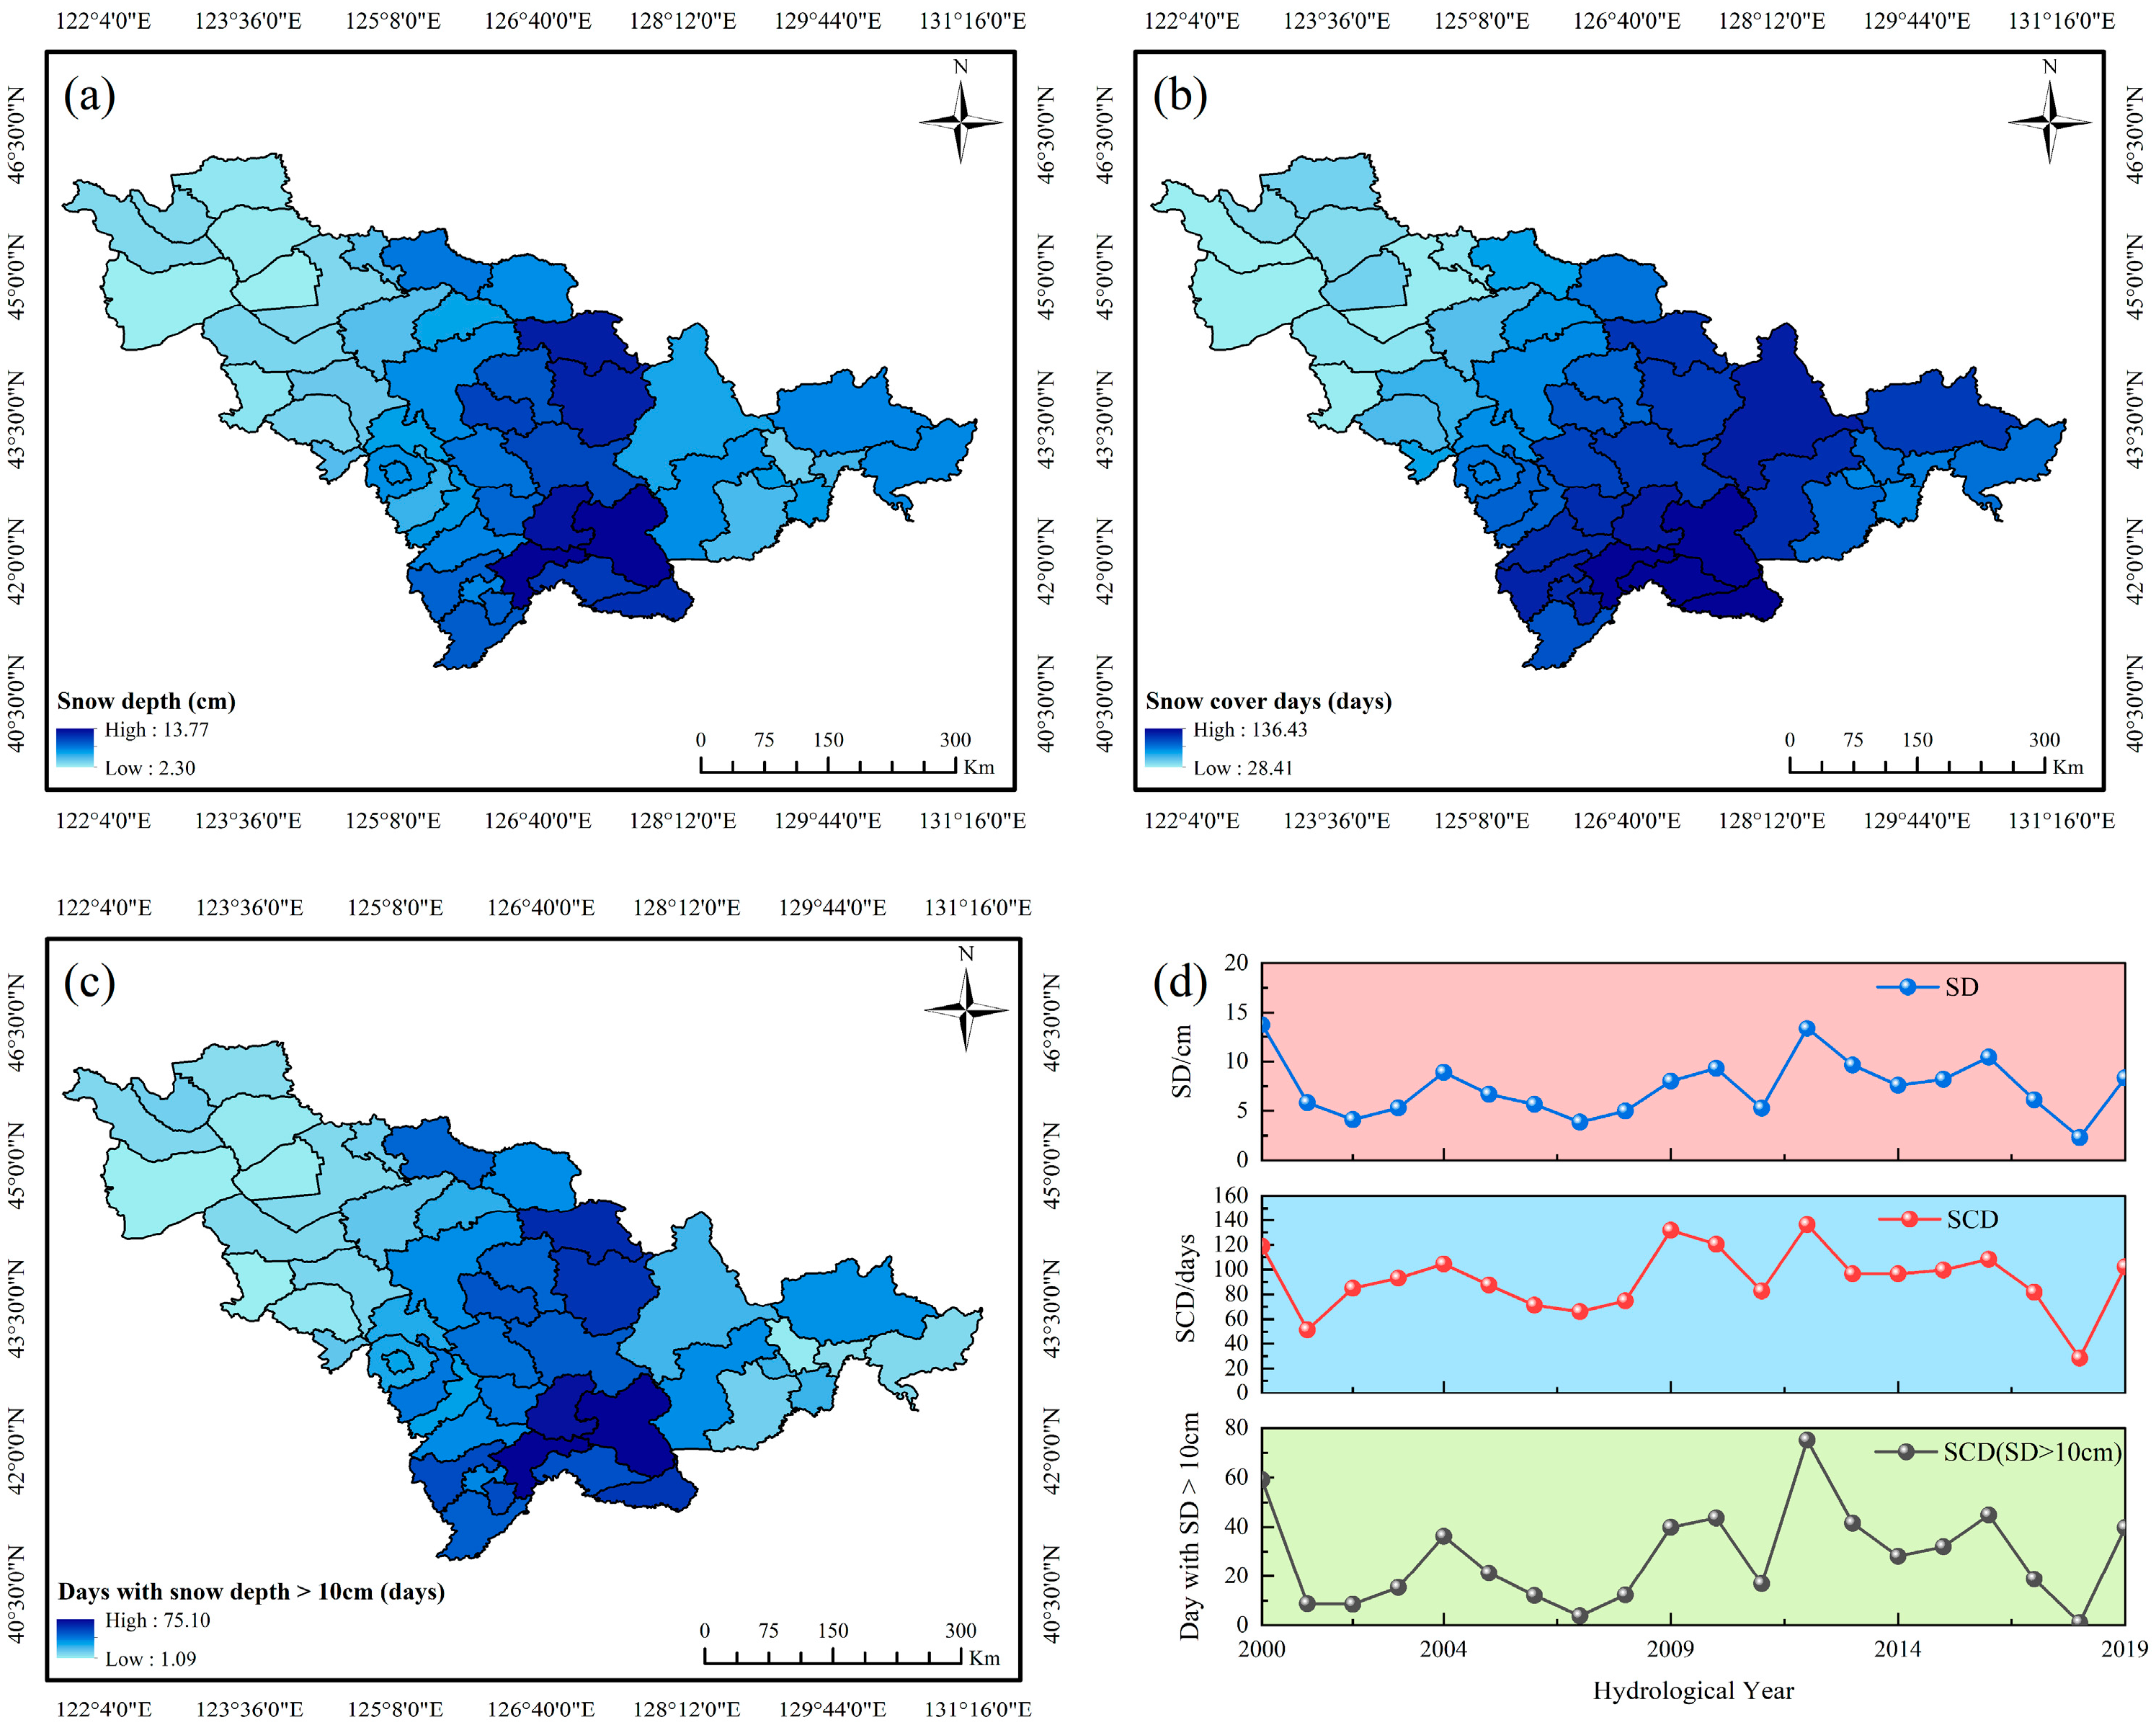
In Jilin Province, the average snow depth, number of days with snow cover, and number of days with snow depth greater than 10 cm during winter generally show higher values in the eastern and southern regions, especially the southeast. The values are lower in the west and northwest plain areas. The Changbai Mountains region, including Fusong County, Antu County, and Jingyu County, has the highest snow depth, with the most snow cover days and the most snow depth greater than 10 cm (Figure 3a–c). The greater the snow depth, the more days with snow cover, and the more days with snow depth greater than 10 cm, the higher the risk of snow disasters and the greater the potential for catastrophe. Figure 3d shows the multi-year variations of three snow cover indicators. The highest average snow depth was recorded in HY2000, reaching 13.77 cm. The highest average snow cover days and days with snow depth exceeding 10 cm were recorded in HY2012, at 136 days and 75 days, respectively. The minimum values for all three indicators occurred in HY2018, at 2.30 cm, 28 days, and 1 days, respectively. The snow cover indicator values fluctuated between their maximum and minimum values.
Figure 3.
Three indicators of disaster-causing hazardousness: (a) snow depth; (b) snow cover day; (c) days with snow depth over 10 cm; (d) temporal variations of three snow cover parameters in Jilin province (HY2000–2019).
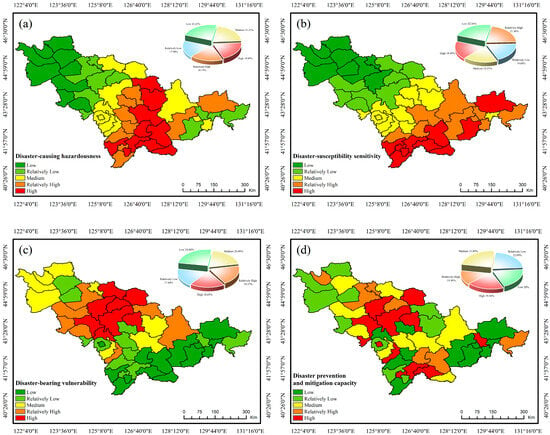
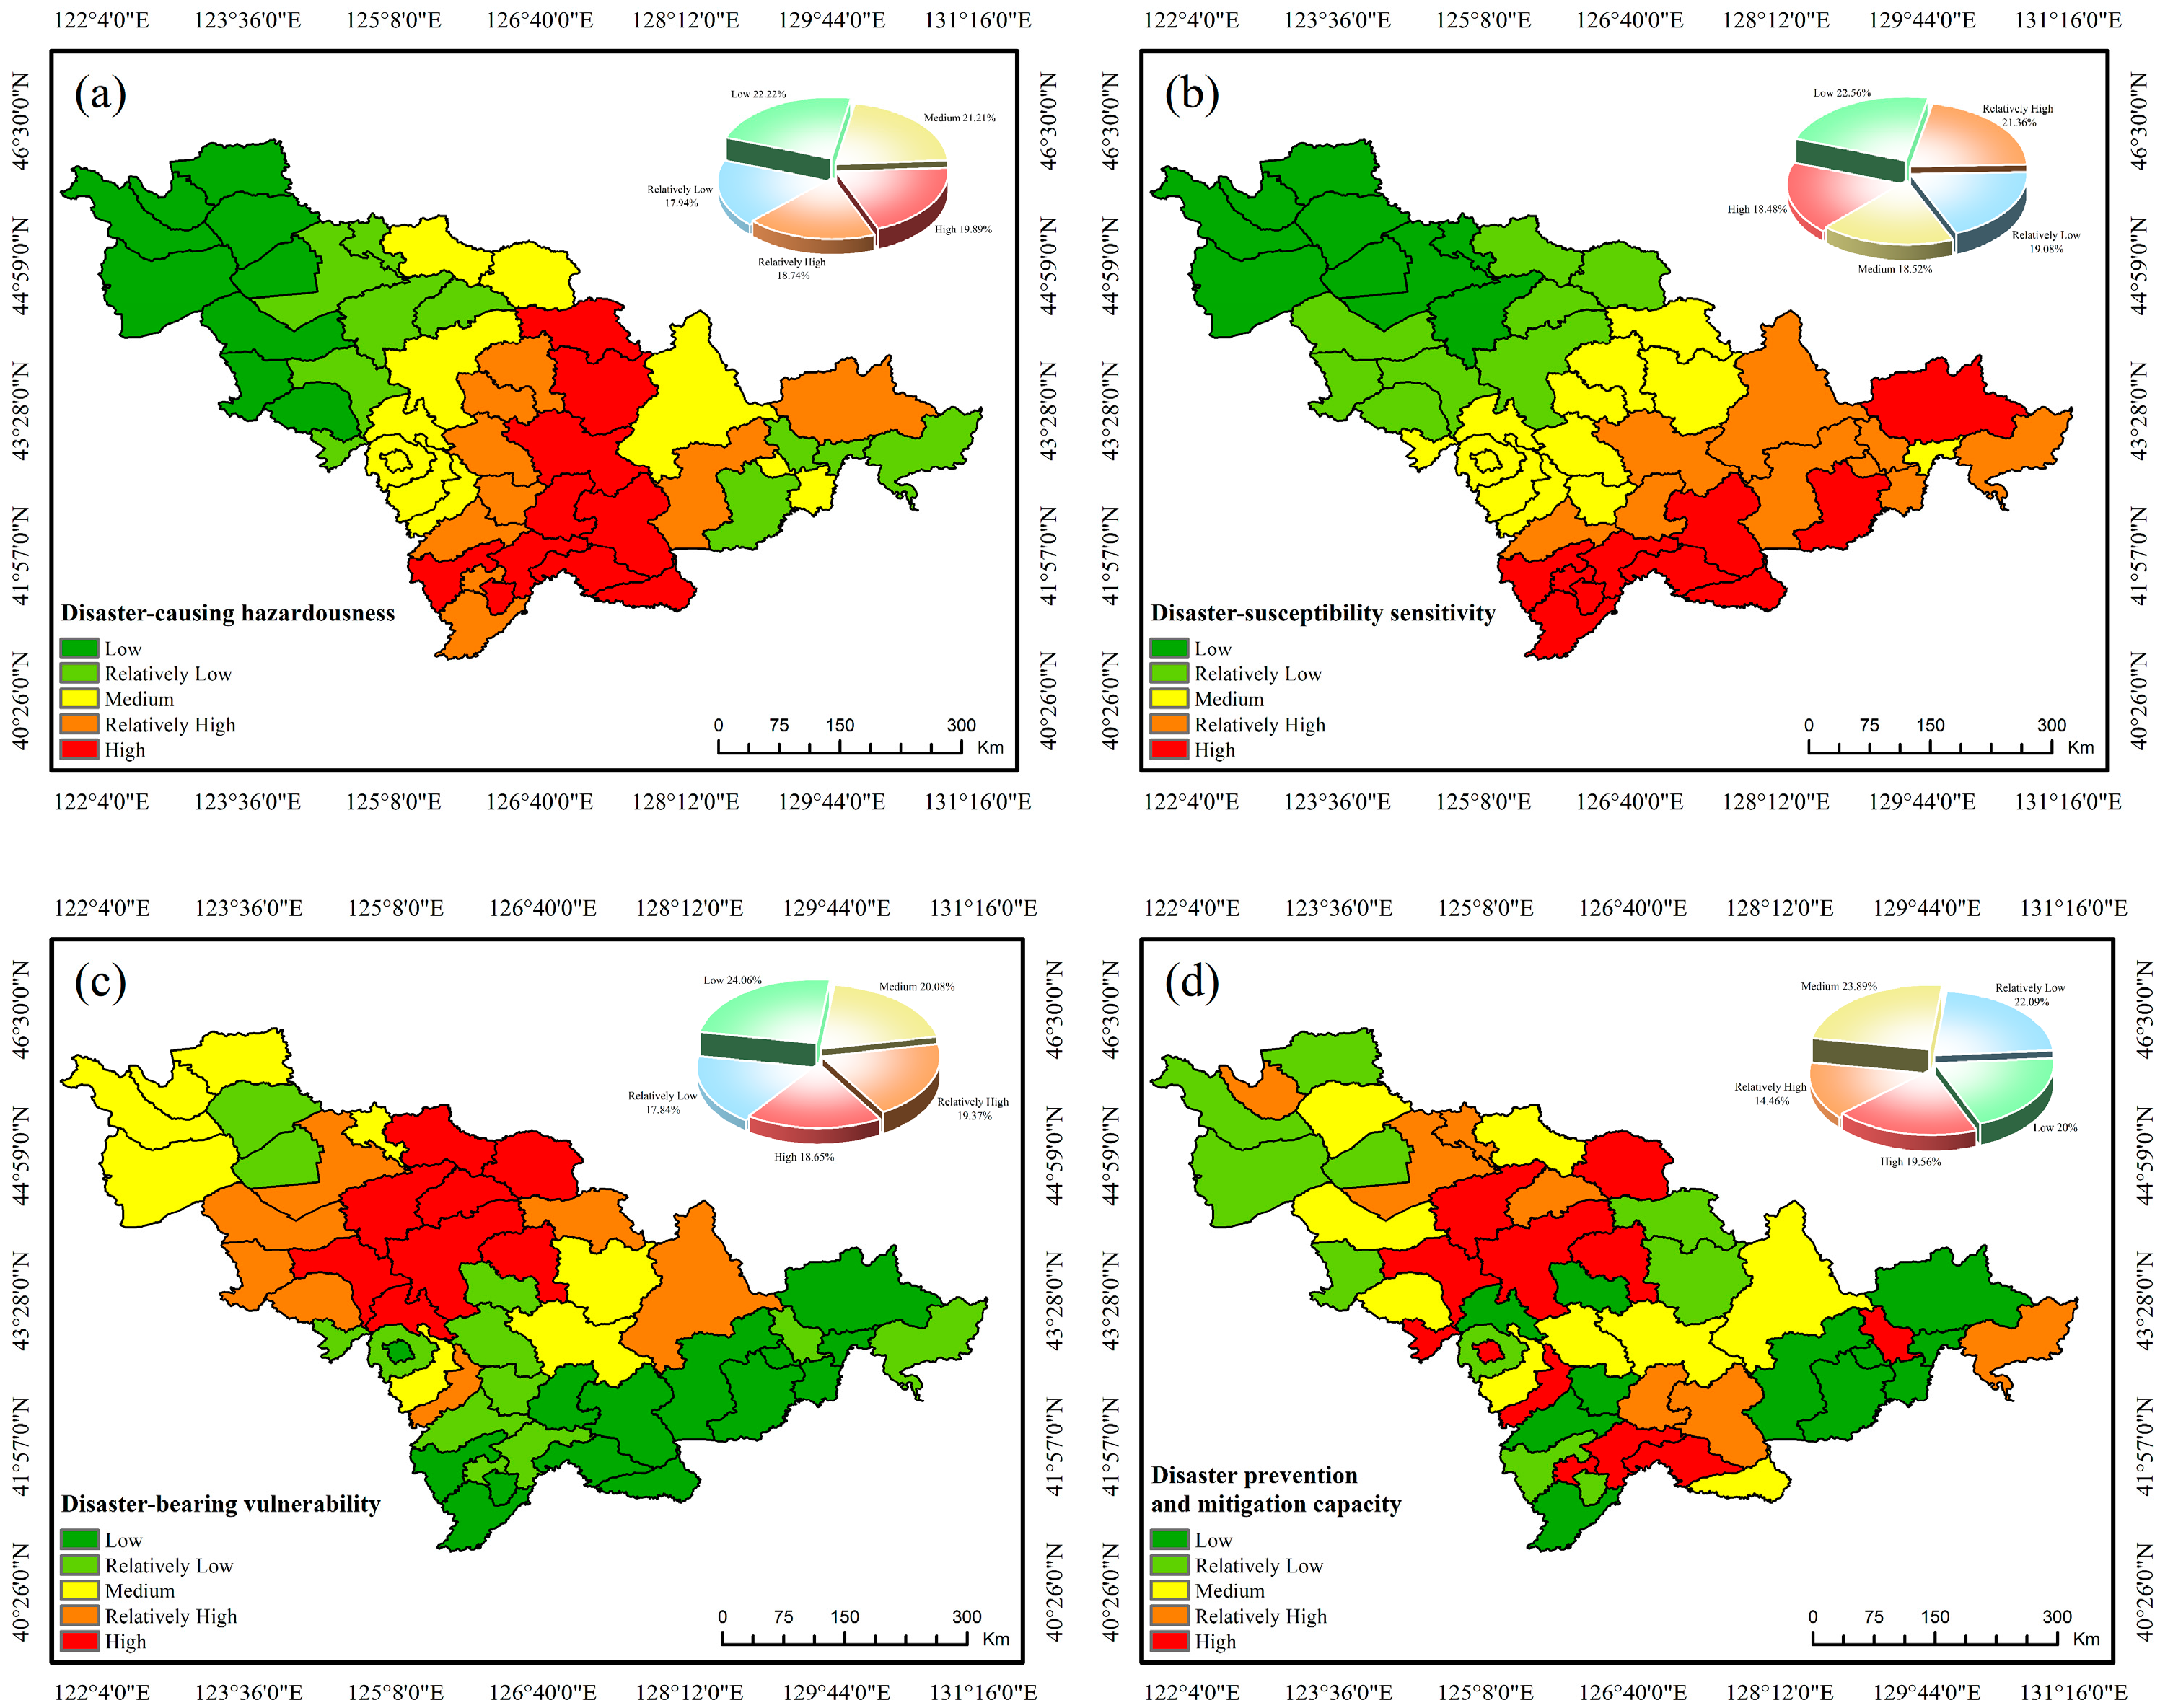
Using the percentile method, the hazard was classified into five levels (Figure 4a). Spatially, the hazard distribution exhibits a decreasing trend from central-southern regions toward both eastern and western peripheries. High-risk areas are concentrated in central-southern regions such as Jingyu, Fusong, Changbai, and Linjiang, surrounded by higher-risk zones. Medium-risk areas are widely distributed around these core regions. In contrast, lower and low-risk areas are primarily located along the western, northern, and eastern edges, including most of Baicheng, Songyuan and Yanbian.
Figure 4.
Four components of snow disaster risk assessment in Jilin Province, China: (a) disaster-causing hazardousness; (b) disaster-susceptibility sensitivity; (c) disaster-bearing vulnerability; (d) disaster prevention and mitigation capacity.
3.2. Disaster-Susceptibility Sensitivity Assessment
Disaster-susceptibility sensitivity is characterized by topographic and land cover conditions influencing snow accumulation and melt. The calculated weights for elevation, slope, aspect, and land use are 0.39, 0.40, 0.13 and 0.08, respectively, with slope emerging as the dominant factor. The susceptibility assessment model is expressed as:
where B1, B2, B3, and B4 represent the normalized assessment indicators for elevation, slope, aspect, and land use categories, respectively.
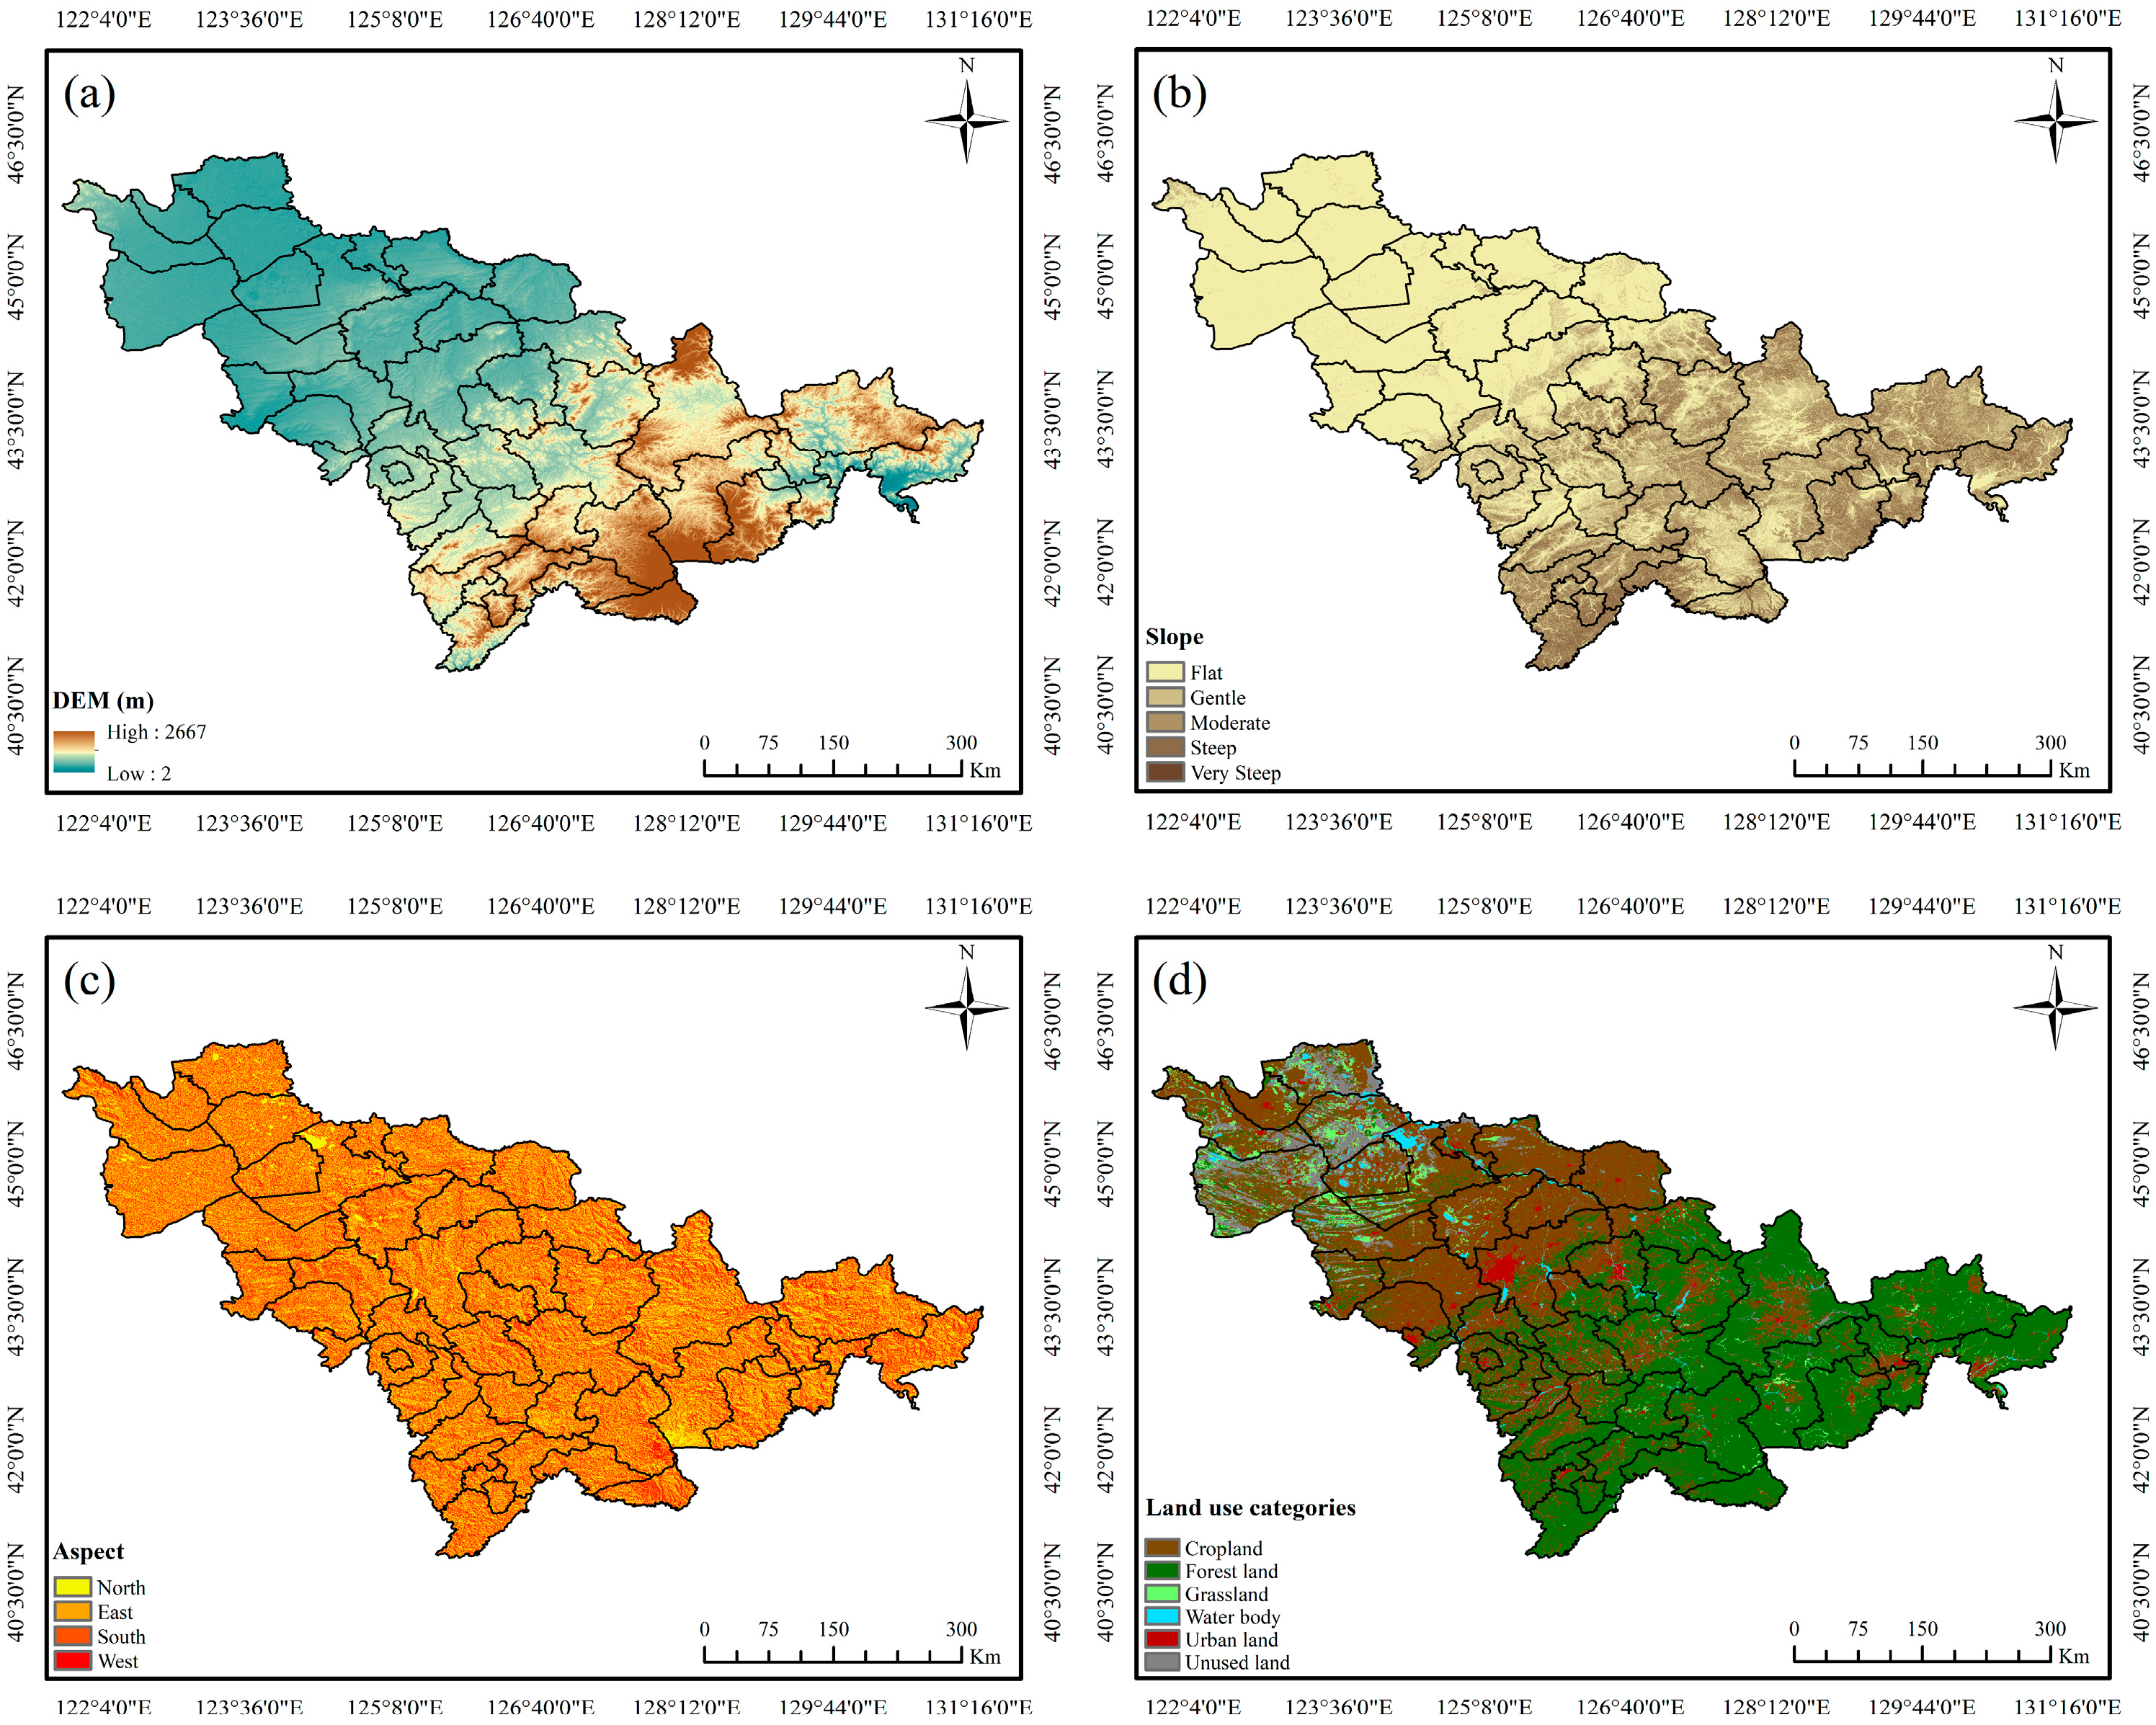
In Jilin Province, elevation and slope increase from west to east, with the highest elevation in the Changbai Mountains reaching 2667 m (Figure 5a,b). Sunny and shady slopes are interspersed, with a higher proportion of shady slopes in the southeast (Figure 5c). The land cover is characterized by forest land in the east and southeast, transitioning to cropland in the central and western regions, while urban areas are predominantly clustered in cities such as Changchun, Jilin, and Siping (Figure 5d). Snow accumulation tends to be more sustained in areas with higher elevations, and snow is more prone to lateral slippage in steep slopes. Shady slopes receive less sunlight than sunny slopes, making them more susceptible to snow disasters. Forests, typically located in mountainous areas with complex terrain, offer favorable snow accumulation conditions and effectively trap snow.
Figure 5.
Four indicators of disaster-susceptibility sensitivity: (a) dem; (b) slope; (c) aspect; (d) land use categories.
Spatial analysis reveals a transparent southeast-to-northwest decreasing gradient in susceptibility levels (Figure 4b). High susceptibility zones are concentrated in the southeastern mountains, including Jingyu, Fusong, and Changbai counties. Medium to high susceptibility areas extend through central regions, while low susceptibility predominates in the western plains.
3.3. Disaster-Bearing Vulnerability Assessment
Disaster-bearing vulnerability reflects potential socio-economic losses from snow disasters, with higher population density and economic activity correlating with greater impacts. The calculated weights for vulnerability indicators are: large livestock (0.20), industrial enterprises (0.44), total population (0.24) and crop planting area (0.12). The prominence of industrial enterprises highlights their critical role in regional vulnerability. The assessment model is formulated as:
where C1, C2, C3, and C4 correspond to the normalized values for the number of large livestock, industrial enterprises, total population, and crop planting area, respectively.
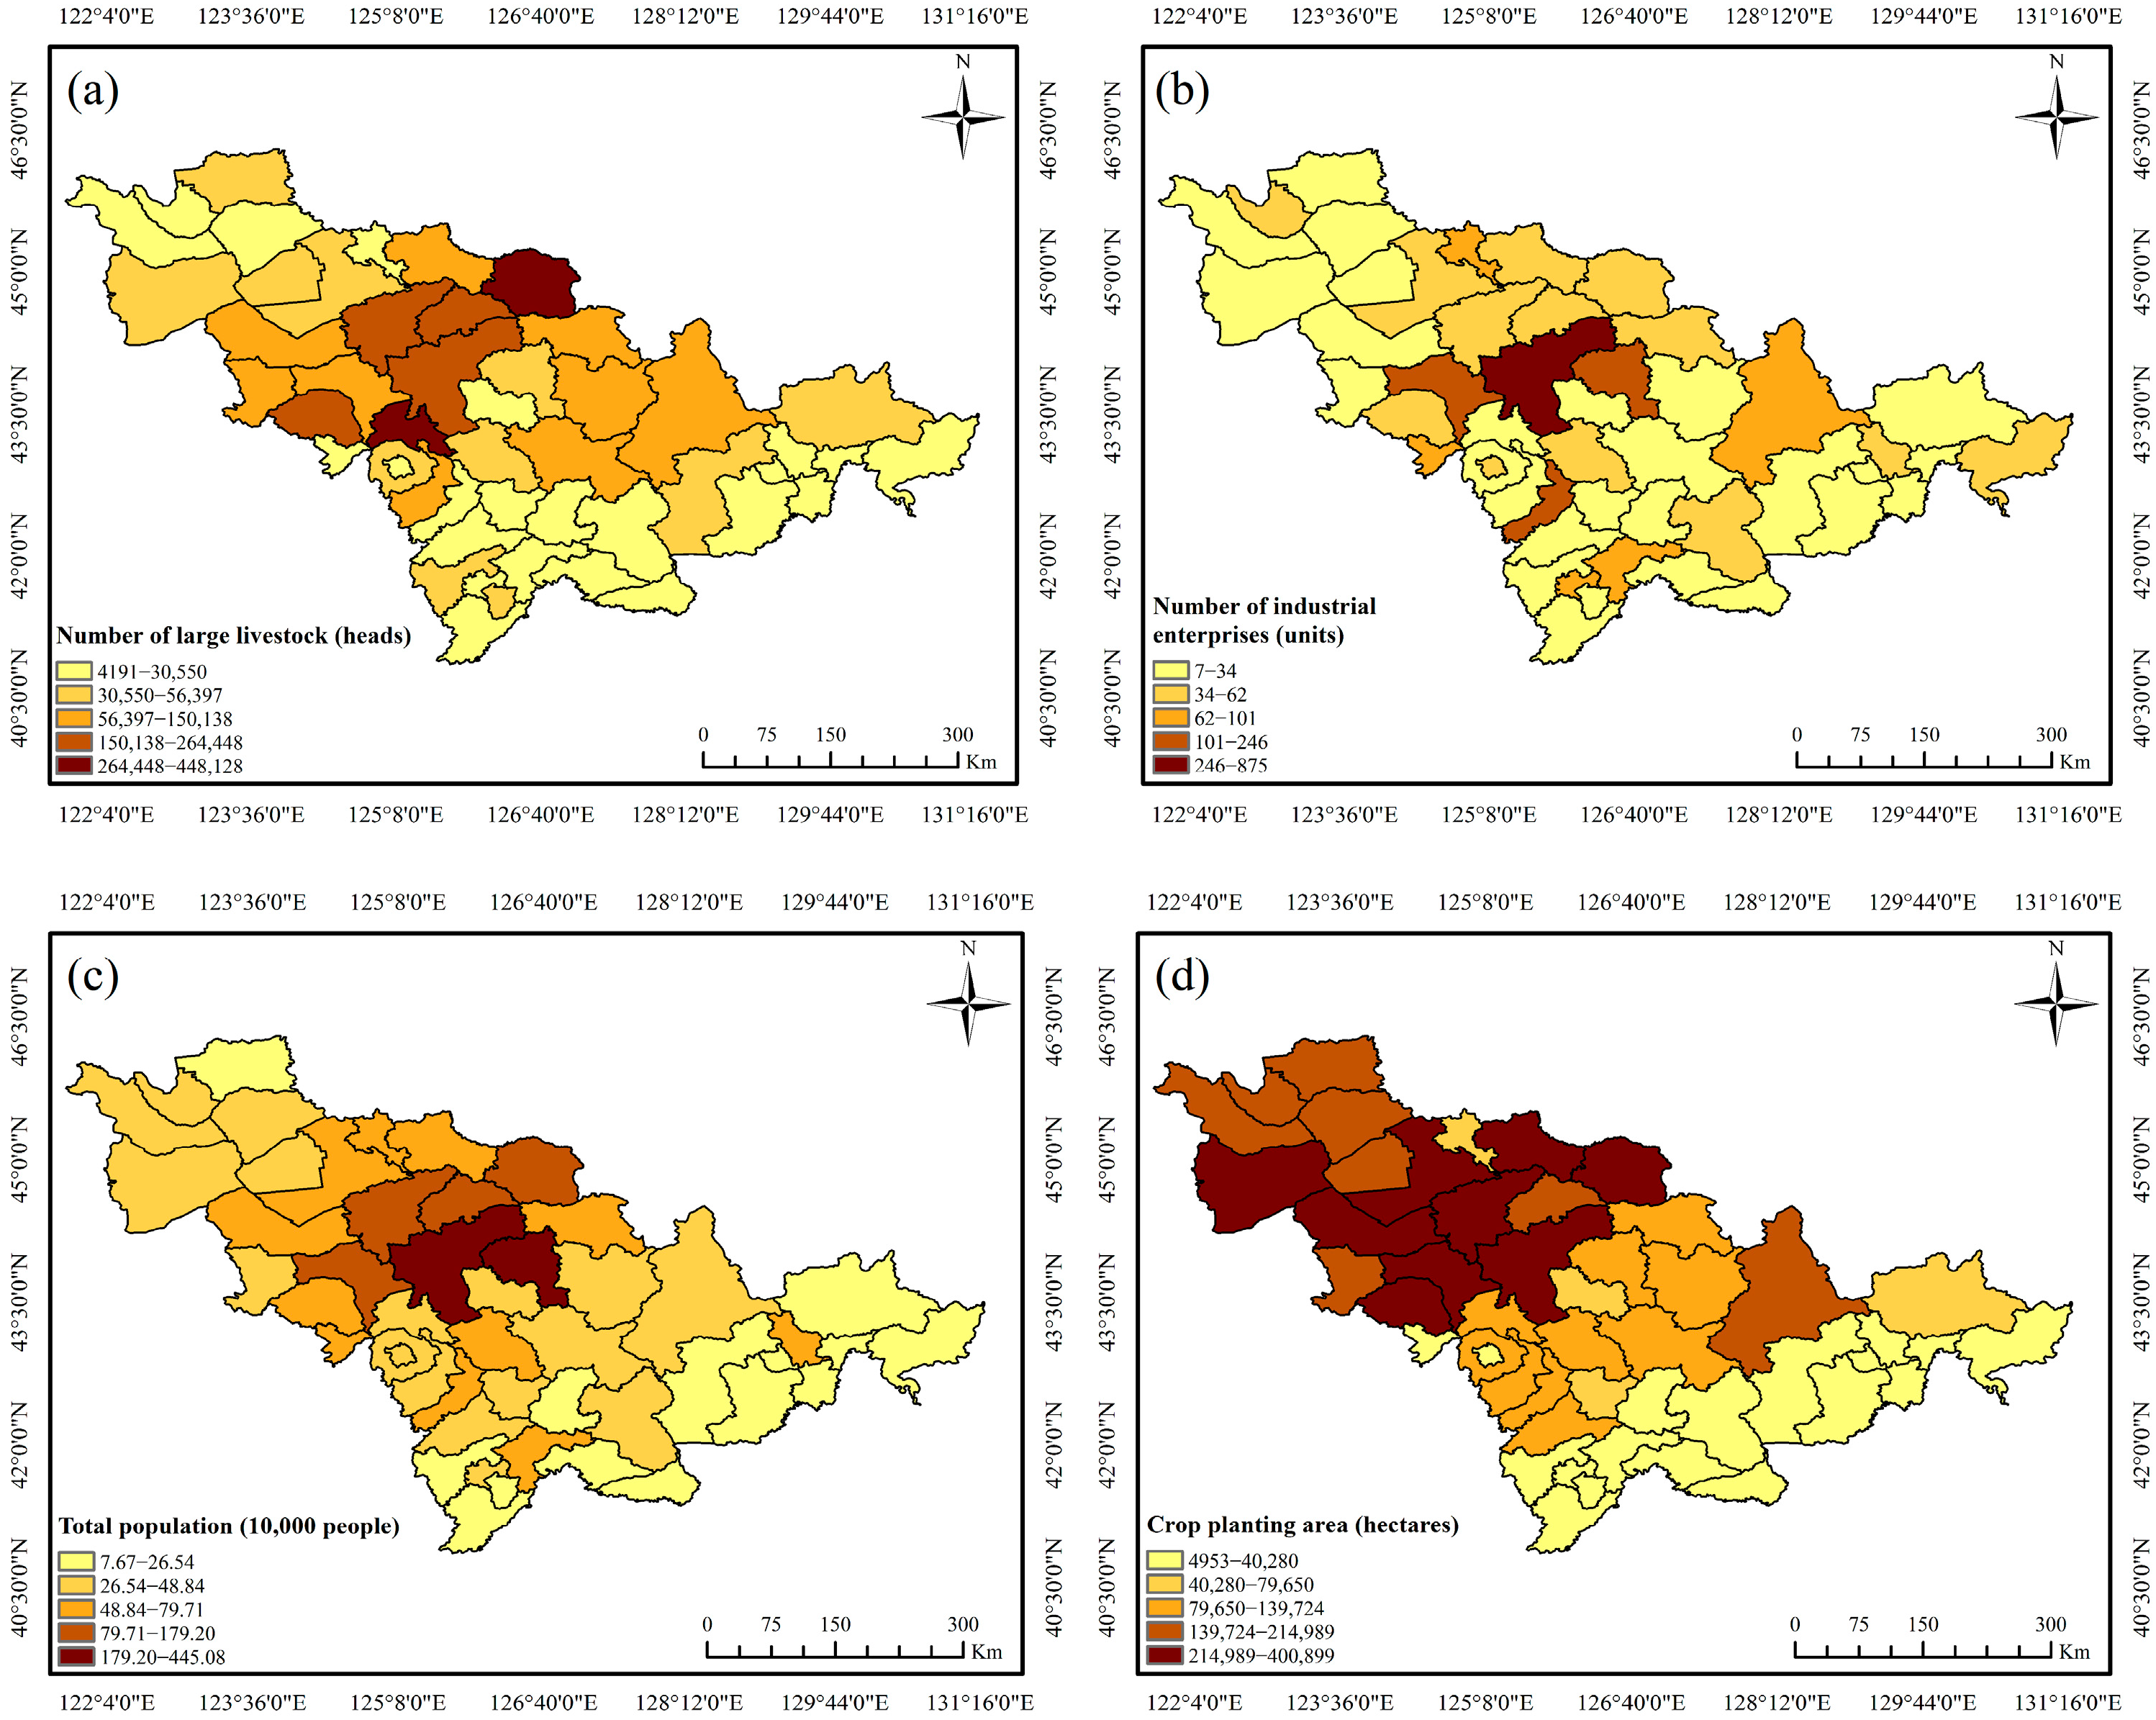
The distribution of large livestock, industrial enterprises, total population, and crop planting area in Jilin Province exhibits a clear “central concentration” characteristic. Areas like Yushu and Yitong have a relatively large livestock population, while Changchun and Jilin have many industrial enterprises. The population is densely distributed in Changchun and its surrounding areas, while the agricultural planting area is mainly distributed in the central and western regions (Figure 6a–d). Areas with a large number of large livestock and industrial enterprises, dense populations, and extensive crop planting areas are severely affected by the snow disaster.
Figure 6.
Four indicators of disaster-bearing vulnerability: (a) number of large livestock; (b) number of industrial; (c) total population; (d) crop planting area.
Spatial analysis reveals a concentric pattern with vulnerability decreasing outward from central regions (Figure 4c). High-vulnerability areas concentrate in central Jilin, including Dehui, Jiutai, Yushu, and central Changchun. Moderate vulnerability zones transition toward peripheral areas, while low-vulnerability regions predominate in southeastern and northwestern territories.
3.4. Disaster Prevention and Mitigation Capacity
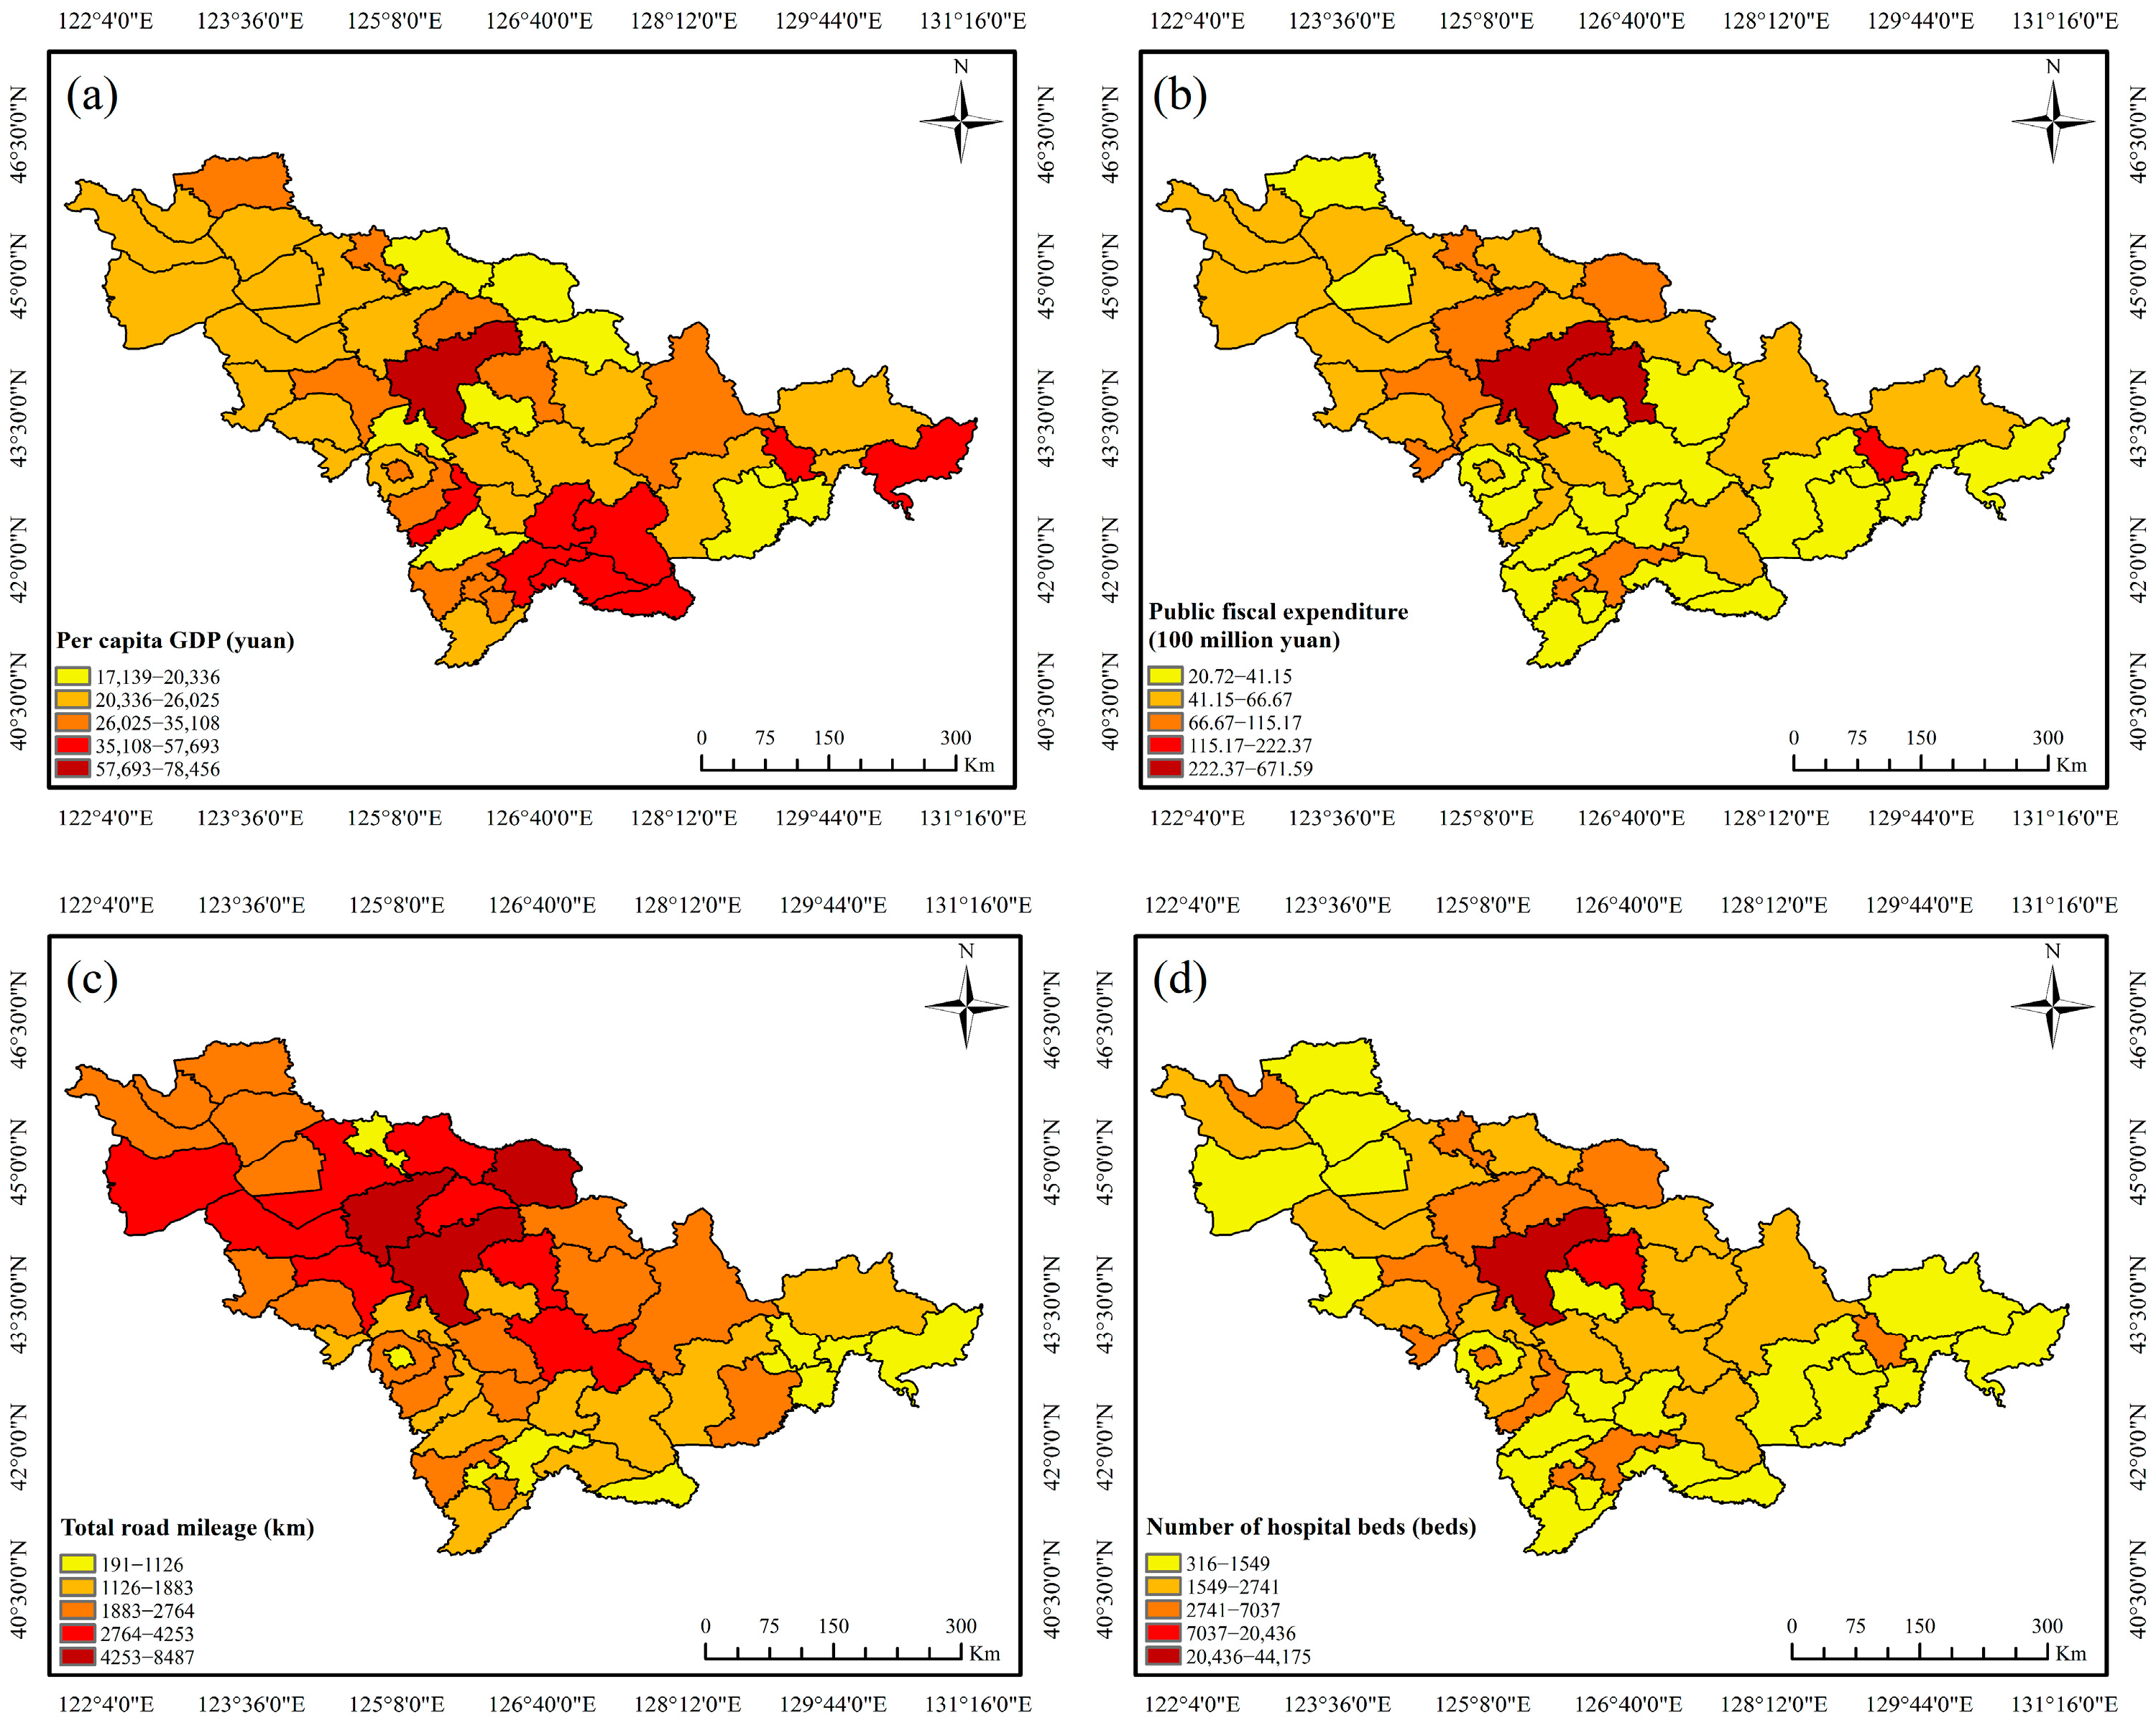
Disaster prevention and mitigation capacity reflects regional capabilities in resisting and recovering from natural disasters, evaluated through healthcare resources, fiscal capacity, infrastructure, and economic development. The calculated weights are: per capita GDP (0.16), public fiscal expenditure (0.37), road mileage (0.07) and hospital beds (0.40). The predominance of hospital beds underscores the critical role of medical resources in disaster response. The assessment model is formulated as:
where D1, D2, D3, and D4 represent per capita GDP, public fiscal expenditure, total road mileage, and hospital bed numbers, respectively.
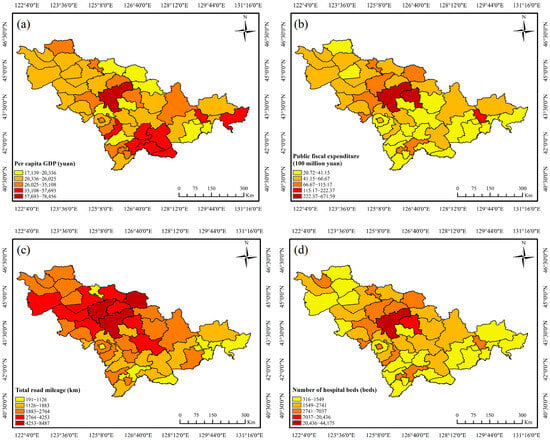
The disaster prevention and mitigation capacity in Jilin Province is characterized by a high consistency with the distribution of disaster-bearing bodies, presenting a distinct central concentration trend. Regions like Changchun and the Changbai Mountain area have higher per capita GDP, and public fiscal expenditure is mainly concentrated in Changchun and Jilin cities. Tonghua, Baishan, Changbai, and the eastern region have a lower proportion of total road mileage, while hospital beds are more widely distributed in the central region (Figure 7a–d). Areas with higher per capita GDP and public fiscal expenditure, as well as greater road mileage and hospital beds, are better able to mitigate the risks posed by snow disasters.
Figure 7.
Four indicators of disaster prevention and mitigation capacity: (a) per capita GDP; (b) public fiscal expenditure; (c) total road mileage; (d) number of hospital beds.
Capacity levels exhibit a radial pattern diminishing from central urban cores toward peripheral areas (Figure 4d). The highest capacity is concentrated in central cities, progressively decreasing toward southern, western, and eastern margins, reflecting the uneven distribution of critical infrastructure and resources across the province.
3.5. Comprehensive Assessment of Snow Disaster Risk in Jilin Province
The snow disaster risk assessment model for Jilin Province integrates four critical dimensions: hazard (0.12), sensitivity (0.15), vulnerability (0.27), and mitigation capacity (0.46). These components collectively capture snow disasters’ formation mechanism, duration, potential damage, and response capability. The comprehensive risk assessment formula is expressed as:
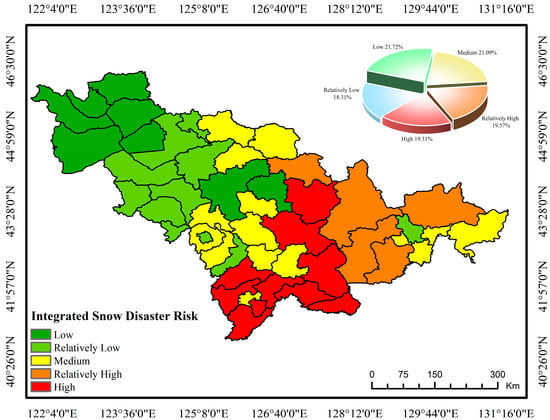
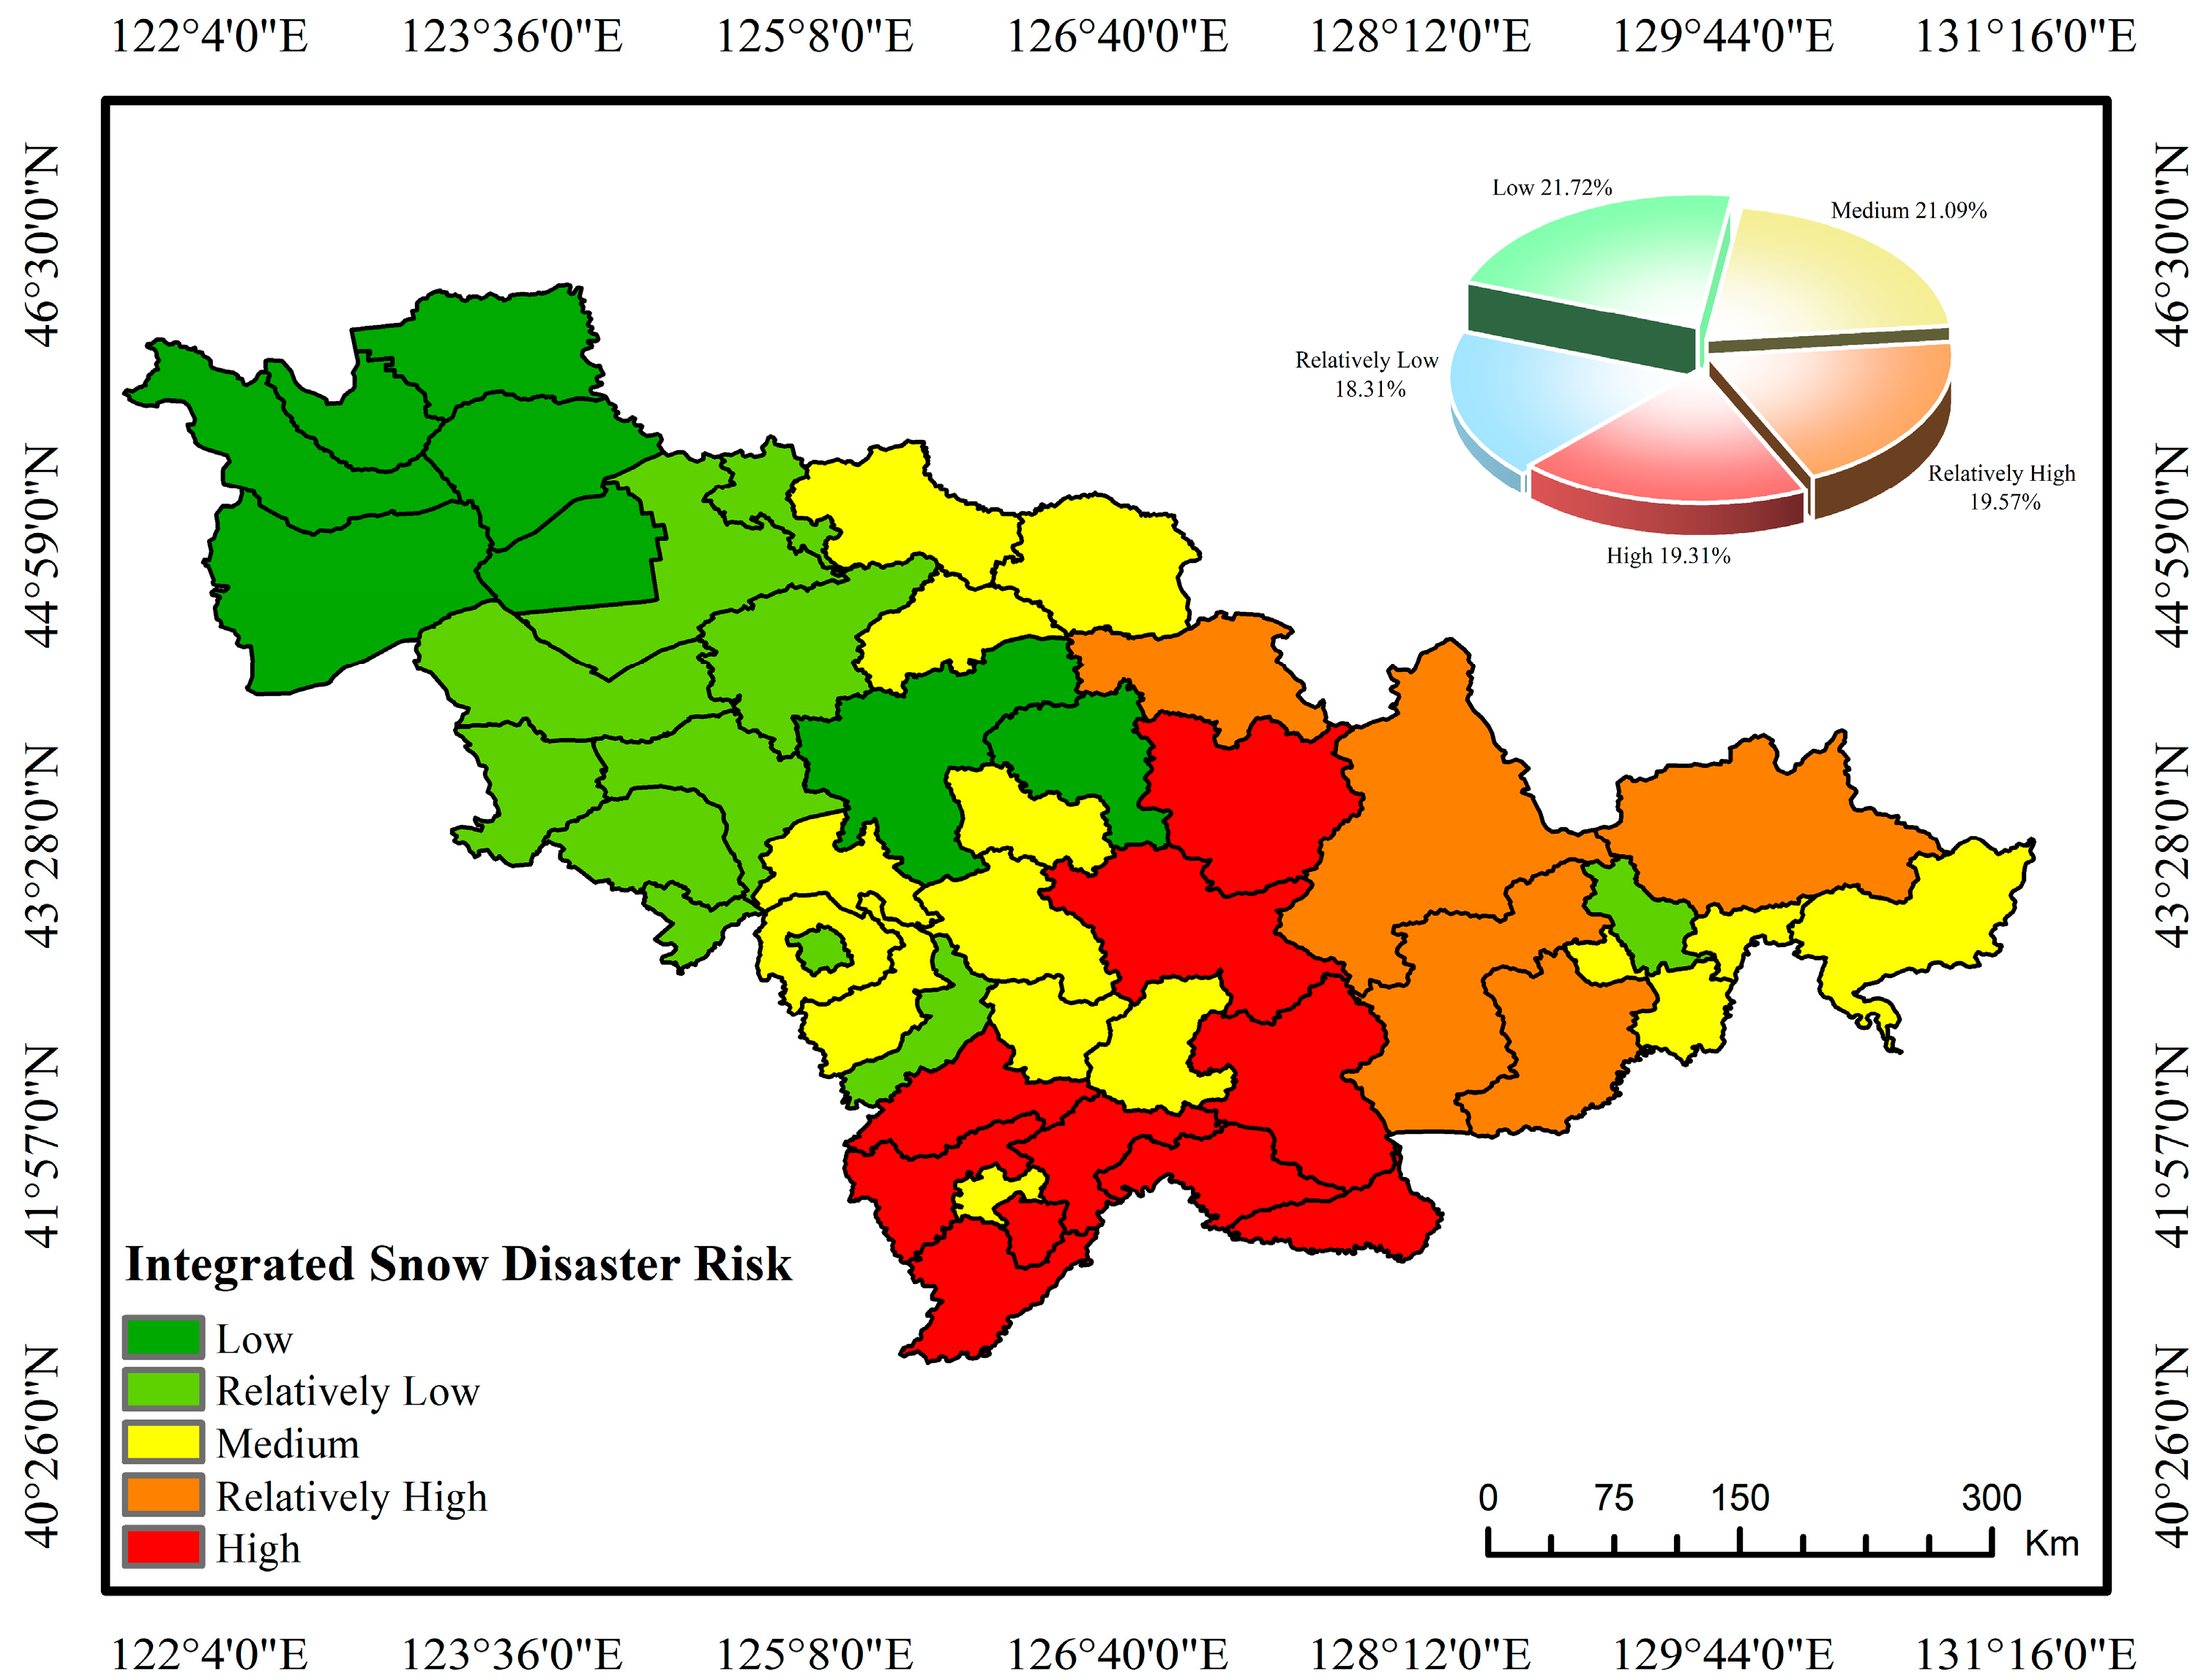
where Rz, Ry, Rc and Rj represent disaster-causing hazardousness, disaster-susceptibility sensitivity, disaster-bearing vulnerability, and disaster prevention and mitigation capacity, respectively. Spatial analysis reveals a distinct southeast-to-northwest decreasing gradient in risk levels (Figure 8).
Figure 8.
A comprehensive assessment of snow disaster risk assessment in Jilin Province, China.
Weight analysis across dimensions indicated that disaster prevention and mitigation capacity (0.46) most significantly influenced the final risk pattern, followed by vulnerability (0.27). The comprehensive risk displayed a transparent gradient decreasing from southeastern mountainous areas to northwestern plains. High-risk zones predominantly concentrate in southeastern mountainous regions, including Jingyu, Fusong, Changbai, and Linjiang. Moderate-risk areas radiate outward from these core zones, while low-risk regions are primarily distributed across the western and northwestern plains, encompassing Baicheng, Da’an, and adjacent counties. This spatial pattern reflects the interaction between natural risks and socio-economic resilience—although southeastern mountainous areas face prominent hazard threats, enhancing emergency medical services, transportation infrastructure, and financial security can effectively mitigate the ultimate risk levels.
4. Discussion
This study developed a comprehensive snow disaster risk assessment model for Jilin Province by systematically integrating the four core dimensions of disaster risk theory: hazard, sensitivity, vulnerability, and mitigation capacity. The results reveal a distinct spatial pattern of snow disaster risk, characterized by a gradient decreasing from the southeastern mountainous regions to the northwestern plains. This discussion interprets these key findings, elucidates the underlying mechanisms, highlights this study’s theoretical and methodological advancements, and acknowledges its limitations.
4.1. Analysis of Regional Risk Drivers
The high-risk concentration in southeastern counties such as Jingyu, Fusong, and Changbai directly results from the synergistic amplification of multiple risk factors. This region is simultaneously characterized by high disaster-causing hazardousness, showing the deepest snowpack and most extended duration, and high disaster-susceptibility sensitivity, defined by steep slopes and complex topography. While this aligns with the general understanding that mountainous areas are prone to snow-related hazards [2,4], our model quantifies this interaction precisely.
More importantly, our analysis reveals that the ultimate risk level is not solely determined by natural factors. Despite having moderate hazardousness and sensitivity, the central regions of Jilin exhibit elevated risk due to very high disaster-bearing vulnerability. This is attributed to the dense concentration of population, industrial enterprises, and agricultural assets, which are highly exposed to potential losses. This finding underscores that socio-economic exposure is a critical driver of snow disaster risk, an aspect often underrepresented in traditional assessments that overemphasize physical snow parameters [6,11].
4.2. Evaluation Performance
Unlike many previous studies that focused predominantly on hazard factors [5,6,19], our model fully integrates the four pillars of disaster risk. This holistic approach allows for a more nuanced understanding of risk genesis. For instance, the high weight of disaster prevention and mitigation capacity (0.46) in the final risk index demonstrates that regional resilience is the most significant modifier of inherent risk. This effectively explains why some areas with high physical hazard do not rank as the highest risk, as their vulnerability might be offset by better infrastructure and resources, a dynamic missed by models lacking this component [21,22].
The use of the entropy weight method marks a significant advancement over studies reliant on subjective weighting techniques like AHP [20]. This method objectively quantifies the informational contribution of each indicator based on its data variability, thereby minimizing expert bias [36]. The resulting weights, particularly the dominance of indicators like “hospital beds” and “public fiscal expenditure” within mitigation capacity, are derived directly from the data, enhancing the reliability and persuasiveness of the assessment compared to models with subjectively assigned weights [20,22].
This study effectively bridges the gap between remote sensing data and socio-economic factors. By fusing meteorological station data, remote sensing-derived snow parameters, topographic data, and socio-economic statistics, we overcome the limitations of approaches that rely on a single data source [5,7]. This integration provides a finer-resolution, more realistic risk map that captures both the physical drivers and the socio-economic consequences of snow disasters, a challenge noted in earlier works [19,23].
4.3. Policy Implications and Practical Applications
The spatially explicit risk zoning developed in this study enables differentiated disaster risk management across Jilin Province, thereby informing the formulation of targeted policies. For high-risk southeastern mountainous areas, policy should focus on enhancing structural mitigation measures, such as improving road resilience, establishing robust early warning systems, and ensuring the accessibility of medical services in remote locations. The priority should shift to reducing exposure and strengthening adaptive capacity for the central high-vulnerability urban and economic hubs. This includes diversifying local economies to reduce reliance on snow-sensitive industries, reinforcing critical infrastructure, and developing sophisticated emergency response plans for metropolitan areas. The northwestern low-risk regions, while currently less threatened, should focus on preparedness and mainstreaming disaster risk consideration into future land-use and development planning to maintain their low-risk status. This targeted approach is more efficient and effective than the one-size-fits-all strategy, which often results from less detailed assessments [6,11].
4.4. Research Limitations and Future Directions
While this study provides valuable findings in the snow disaster risk assessment for Jilin Province, it is not without its limitations, which point to directions for future research. Despite providing valuable insights, this study has several limitations that warrant attention in future research. The county-level assessment scale may obscure internal risk variations at finer administrative levels. Future studies should incorporate higher-resolution remote sensing and vector data to enable grid-based or township-level assessments. In addition, the reliance on static historical data limits the model’s capacity to reflect dynamic changes under climate change. Integrating climate projection data to establish dynamic snow disaster risk forecasting represents an important direction for future work.
5. Conclusions
This study establishes a comprehensive snow disaster risk assessment model for Jilin Province by integrating four critical dimensions: hazardousness factors, environmental sensitivity, socio-economic vulnerability, and disaster prevention and mitigation capacity. Spatial analysis reveals a transparent southeast-to-northwest decreasing gradient in comprehensive risk levels. High-risk zones are predominantly concentrated in the southeastern mountainous counties of Jingyu, Fusong, Changbai, and Linjiang, characterized by elevated hazard exposure and constrained response capabilities. Medium-risk areas radiate outward from these core zones, while low-risk regions primarily distribute across the western plains, including Baicheng City and surrounding counties.
The substantial weight of Disaster prevention and mitigation capacity (0.46) highlights the critical role of socio-economic factors in mitigating disaster impacts. This spatial pattern demonstrates that while southeastern regions face higher natural hazards, the western areas’ enhanced infrastructure and medical resources significantly reduce their risk. These findings provide a scientific basis for region-specific disaster management strategies, suggesting prioritized structural mitigation in southeastern high-risk zones and strengthened preparedness systems in central and western regions.
Although 15 indicators were included, the indicator system could be further refined. Future assessments could benefit from distinguishing road types, accounting for secondary disaster chains (e.g., snow-induced traffic disruptions), and incorporating additional relevant parameters to enhance comprehensiveness and accuracy.
Supplementary Materials
The following supporting information can be downloaded at: https://www.mdpi.com/article/10.3390/w17233402/s1. Table S1: Selection of Key Indicators for Snow Disaster Assessment in Jilin Province. Table S2: Climate station elevation.
Author Contributions
Conceptualization, Y.W. and Q.Y.; methodology, Y.W. and C.W.; validation, Q.Y. and C.W.; formal analysis, Y.W. and S.L.; investigation, Y.W. and X.Z.; data curation, Y.W.; writing—original draft, Y.W.; writing—review and editing, Q.Y. and Y.W.; visualization, Y.W.; funding acquisition, Y.S. All authors have read and agreed to the published version of the manuscript.
Funding
This research was supported by the National Natural Science Foundation of China (Grant No. U24A20582) and the Science and Technology Development Plan in Jilin Province of China (20230203135SF).
Data Availability Statement
The original contributions presented in this study are included in the article/Supplementary Materials. Further inquiries can be directed to the corresponding author.
Conflicts of Interest
The authors declare no conflicts of interest.
References
- GB/T 28921–2012; Natural Disaster Classification and Code. China Standards Press: Beijing, China, 2013.
- Livneh, B.; Badger, A.M. Drought less predictable under declining future snowpack. Nat. Clim. Change 2020, 10, 452–458. [Google Scholar] [CrossRef] [Scilit]
- Mankin, J.S.; Viviroli, D.; Singh, D.; Hoekstra, A.Y.; Diffenbaugh, N.S. The potential for snow to supply human water demand in the present and future. Environ. Res. Lett. 2015, 10, 114016. [Google Scholar] [CrossRef] [Scilit]
- Schweizer, J.; Bruce Jamieson, J.; Schneebeli, M. Snow avalanche formation. Rev. Geophys. 2003, 41, 1016. [Google Scholar] [CrossRef] [Scilit]
- Germain, D. Snow avalanche hazard assessment and risk management in northern Quebec, eastern Canada. Nat. Hazards 2016, 80, 1303–1321. [Google Scholar] [CrossRef] [Scilit]
- Delegerima; Li, Y.P.; Meng, X.F.; Tian, Y.; Ji, Y.X.; Zhang, M. Study of the risk evaluation of snow disaster in pastoral areas of Xilingol League, Inner Mongolia. J. Glaciol. Geocryol. 2020, 42, 1353–1362. (In Chinese) [Google Scholar]
- Ju, X.Y.; Tian, H.; Cheng, X.Y.; Tang, W.A.; Zhu, H. Refinded hazard assessment and regionalization of snow disaster in Anhui Province. Torrential Rain Disasters 2024, 43, 580–586. [Google Scholar]
- Liu, F.; Mao, X.; Zhang, Y.; Chen, Q.; Liu, P.; Zhao, Z. Risk analysis of snow disaster in the pastoral areas of the Qinghai-Tibet Plateau. J. Geogr. Sci. 2015, 24, 411–426. [Google Scholar] [CrossRef] [Scilit]
- Xu, Q.; Huang, F.; Mou, S.; Lu, H. Snow disaster hazard assessment on the Tibetan plateau based on copula function. Sustainability 2023, 15, 10639. [Google Scholar] [CrossRef] [Scilit]
- Wang, S.J.; Zhou, L.Y.; Wei, Y.Q. Integrated risk assessment of snow disaster over the Qinghai-Tibet Plateau. Geomat. Nat. Hazards Risk 2019, 10, 740–757. [Google Scholar]
- Zhang, F.; Zhang, L.; Huang, Y.; Wang, N.; Li, Y.S. Hazard assessment and regionalization of snowstorms in Heilongjiang Province from 1961 to 2015. Phys. Chem. Earth 2020, 115, 102833. [Google Scholar] [CrossRef] [Scilit]
- Maurer, E.P.; Rhoads, J.D.; Dubayah, R.O.; Lettenmaier, D.P. Evaluation of the snow-covered area data product from MODIS. Hydrol. Process. 2003, 17, 59–71. [Google Scholar] [CrossRef] [Scilit]
- Painter, T.H.; Rittger, K.; McKenzie, C.; Slaughter, P.; Davis, R.E.; Dozier, J. Retrieval of subpixel snow covered area, grain size, and albedo from MODIS. Remote Sens. Environ. 2009, 113, 868–879. [Google Scholar] [CrossRef] [Scilit]
- Xiao, L.; Che, T.; Dai, L. Evaluation of remote sensing and reanalysis snow depth datasets over the northern hemisphere during 1980–2016. Remote Sens. 2020, 12, 3253. [Google Scholar] [CrossRef] [Scilit]
- Dai, L.; Che, T.; Wang, J.; Zhang, P. Snow depth and snow water equivalent estimation from AMSR-E data based on a priori snow characteristics in Xinjiang, China. Remote Sens. Environ. 2012, 127, 14–29. [Google Scholar] [CrossRef] [Scilit]
- Taheri, M.; Mohammadian, A. An overview of snow water equivalent: Methods, challenges, and future outlook. Sustainability 2022, 14, 11395. [Google Scholar] [CrossRef] [Scilit]
- Vydra, C.; Dietz, A.J.; Roessler, S.; Conrad, C. The Influence of Snow Cover Variability on the Runoff in Syr Darya Headwater Catchments between 2000 and 2022 Based on the Analysis of Remote Sensing Time Series. Water 2024, 16, 1902. [Google Scholar] [CrossRef] [Scilit]
- Zhang, Y.; Yan, S.; Lu, Y. Snow cover monitoring using MODIS data in Liaoning Province, Northeastern China. Remote Sens. 2010, 2, 777–793. [Google Scholar] [CrossRef] [Scilit]
- Sun, X.Y.; Miao, L.Z.; Feng, X.K.; Zhan, X.X. Snow disaster risk assessment based on long-term remote sensing data: A case study of the Qinghai–Tibet plateau region in Xizang. Remote Sens. 2024, 16, 1661. [Google Scholar] [CrossRef] [Scilit]
- Zhao, L.; Li, Q.; Liu, C.; Wang, Y.; Wang, X. Research on Risk Early Warning for the Cryogenic Freezing Rain and Snow Disaster. IOP Conf. Ser. Earth Environ. Sci. 2021, 692, 042006. [Google Scholar] [CrossRef] [Scilit]
- Liu, X.P.; Zhang, J.Q.; Tong, Z.J.; Bao, Y.L.; Zhang, D.H. Grid-based multi-attribute risk assessment of snow disasters in the grasslands of Xilingol, Inner Mongolia. Hum. Ecol. Risk Assess. 2011, 17, 712–731. [Google Scholar] [CrossRef] [Scilit]
- Wang, W.; Liang, T.; Huang, X.; Feng, Q.; Xie, H.; Liu, X.; Chen, M.; Wang, X. Early warning of snow-caused disasters in pastoral areas on the Tibetan Plateau. Nat. Hazards Earth Syst. Sci. 2013, 13, 1411–1425. [Google Scholar] [CrossRef] [Scilit]
- Gao, M.; Liu, S.; Qin, Z.; Qiu, J.; Xu, B.; Li, W.; Yang, X.; Li, J. Integration of remote sensing with GIS for grassland snow cover monitoring and snow disaster evaluating in Tibet. Remote Sens. Environ. Monit. GIS Appl. Geol. VIII 2008, 7110, 164–174. [Google Scholar]
- Encyclopedia Britannica. Available online: https://www.britannica.com/place/Jilin-province-China (accessed on 20 September 2025).
- Jilin Provincial People’s Government. Available online: https://www.jl.gov.cn/ (accessed on 2 November 2025). (In Chinese)
- Wang, X.M.; Yun, T.; Zhang, Z.Y.; Liu, H.F.; Wang, N. Analysis on Synoptic and Climatic Features of Temperature Inversion Under Different Conditions of Geographical Environment in Winter. Meteorol. Mon. 2009, 35, 91–97. [Google Scholar]
- Ma, C.; Wang, L.; Chen, Y.; Wu, J.; Liang, A.; Li, X.; Jiang, C.; Omrani, H. Evolution and Drivers of Production Patterns of Major Crops in Jilin Province, China. Land 2024, 13, 992. [Google Scholar] [CrossRef] [Scilit]
- Perkins-Kirkpatrick, S.E.; Lewis, S.C. Increasing trends in regional heatwaves. Nat. Commun. 2020, 11, 3357. [Google Scholar] [CrossRef] [Scilit]
- Zhang, X.; Gu, X.; Slater, L.J.; Dembélé, M.; Tosunoğlu, F.; Guan, Y.; Liu, J.; Zhang, X.; Kong, D.; Xie, F.; et al. Amplification of coupled hot-dry extremes over eastern monsoon China. Earth’s Future 2023, 11, e2023EF003604. [Google Scholar] [CrossRef] [Scilit]
- Zhao, Q.; Hao, X.H.; Wang, J.; Sun, X. A MODIS-based snow phenology dataset for China from 2000 to 2020. China Sci. Data 2022, 7, 55–64. (In Chinese) [Google Scholar]
- Farr, T.G.; Rosen, P.A.; Caro, E.; Crippen, R.; Duren, R.; Hensley, S.; Kobrick, M.; Paller, M.; Rodriguez, E.; Roth, L.; et al. The shuttle radar topography mission. Rev. Geophys. 2007, 45, RG2004. [Google Scholar] [CrossRef] [Scilit]
- NASA Jet Propulsion Laboratory. NASA Shuttle Radar Topography Mission Global 3 Arc Second (Version 3) [Data Set]; NASA Land Processes Distributed Active Archive Center: Sioux Falls, SD, USA, 2013. [Google Scholar]
- Xu, X.L.; Liu, J.Y.; Zhang, S.W. China Multi-Period Land Use Remote Sensing Monitoring Dataset (CNLUCC); Data Registration and Publishing System of the Resource and Environmental Science Data Center of the Chinese Academy of Sciences: Beijing, China, 2018. (In Chinese) [Google Scholar]
- Zhu, Y.; Tian, D.; Yan, F. Effectiveness of entropy weight method in decision-making. Math. Probl. Eng. 2020, 2020, 3564835. [Google Scholar] [CrossRef] [Scilit]
- Ali, P.J.M.; Faraj, R.H.; Koya, E.; Ali, P.J.M.; Faraj, R.H. Data normalization and standardization: A technical report. Mach. Learn. Tech. Rep. 2014, 1, 1–6. [Google Scholar]
- Liu, T.J.; Song, H.Q.; Zhang, J.; Luo, X.T.; Peng, R.Y.; Zhang, X.G. Application of the fuzzy analytic hierarchy process in deep space exploration program optimization in China. Chin. J. Eng. 2022, 44, 1433–1443. [Google Scholar]
- Schär, C.; Ban, N.; Fischer, E.M.; Rajczak, J.; Schmidli, J.; Frei, C.; Giorgi, F.; Karl, T.R.; Kendon, E.J.; Zwiers, F.W.; et al. Percentile indices for assessing changes in heavy precipitation events. Clim. Change 2016, 137, 201–216. [Google Scholar] [CrossRef] [Scilit]
- Li, H.; Xi, W.; Zhang, L.; Zang, S. Snow-Disaster Risk Zoning and Assessment in Heilongjiang Province. Sustainability 2021, 13, 14010. [Google Scholar] [CrossRef] [Scilit]

Disclaimer/Publisher’s Note: The statements, opinions and data contained in all publications are solely those of the individual author(s) and contributor(s) and not of MDPI and/or the editor(s). MDPI and/or the editor(s) disclaim responsibility for any injury to people or property resulting from any ideas, methods, instructions or products referred to in the content. |
© 2025 by the authors. Licensee MDPI, Basel, Switzerland. This article is an open access article distributed under the terms and conditions of the Creative Commons Attribution (CC BY) license (https://creativecommons.org/licenses/by/4.0/).