Article

Groundwater Extraction-Induced Land Subsidence in Decheng District: Evolution Law and Sustainable Management Strategies

1
The Second Institute of Hydrogeology and Engineering Geology, Shandong Provincial Bureau of Geology & Mineral Resources (Lubei Geo-Engineering Exploration Institute of Shandong Province), Dezhou 253072, China
2
College of Earth Science and Engineering, Shandong University of Science and Technology, Qingdao 266590, China
3
Shandong Provincial Research Center of Geothermal Resources and Reinjection, Dezhou 253072, China
4
Dezhou Deep Geological Energy Conservation and Carbon Reduction Key Laboratory, Dezhou 253072, China
*
Author to whom correspondence should be addressed.
Water 2025, 17(22), 3240; https://doi.org/10.3390/w17223240 (registering DOI)
Submission received: 17 October 2025 / Revised: 31 October 2025 / Accepted: 11 November 2025 / Published: 13 November 2025
(This article belongs to the Topic Human Impact on Groundwater Environment, 2nd Edition)

Abstract

Globally, intensive groundwater extraction has led to widespread land subsidence, posing severe threats to urban infrastructure, structural safety, and flood control capacity, and resulting in substantial economic losses and ecological degradation. Based on dynamic monitoring data and a poroelastic fluid–solid coupling model developed using COMSOL Multiphysics 6.2, this study systematically investigates the characteristics and evolution of land subsidence in Decheng District before and after the implementation of a groundwater extraction ban. Furthermore, recommendations and strategies for the sustainable management of regional groundwater resources are proposed. The results indicate that after the ban was enforced in 2020, the extraction volumes of deep and shallow groundwater in Decheng District decreased from 830,000 m3/a and 33,070,000 m3/a to 178,000 m3/a and 20,775,000 m3/a, respectively. The ban significantly influenced groundwater levels, with the recovery rate of deep groundwater increasing markedly from approximately 0.5 m/a before the ban to about 5 m/a afterward. Groundwater levels directly govern the rate of land subsidence; their decline increases the effective stress within the strata, leading to aquifer compaction and subsequent subsidence. Following the ban, the subsidence rate in Decheng District decreased significantly, with the annual subsidence volume reduced by more than 80% compared to the pre-ban period. Predictive analysis using the fluid–solid coupling model reveals that extraction from deep confined aquifers is the main driver of regional subsidence, with a time lag of approximately five years between groundwater level changes and subsidence response. After the implementation of the extraction ban, the subsidence rate slowed considerably. Over the long term, the subsiding strata tend to stabilize, although most of the subsidence that has already occurred is irreversible, making it difficult for the strata to return to their original state. In summary, the groundwater extraction ban has effectively facilitated groundwater recovery and mitigated land subsidence in Decheng District, though the response exhibits both temporal lag and spatial variability. Future work should focus on establishing an integrated monitoring and regulation system for land subsidence and groundwater dynamics to ensure the coordinated security of both water resources and the geological environment. These findings provide a scientific basis for informing land subsidence prevention and guiding the rational exploitation of groundwater resources in Decheng District.

1. Introduction

Land subsidence is an environmental geological phenomenon characterized by the gradual settlement of ground surface elevation [1]. This phenomenon has been documented in numerous countries and regions worldwide, with its associated hazards drawing increasing societal attention. The impacts of land subsidence span multiple domains, including economic losses, legal disputes, groundwater resource depletion, flood prevention planning, and sustainable urban development. It often leads to significant alterations in urban topography and disruption of original ground elevations [2,3,4]. In this context, controlling land subsidence is not only a geological hazard mitigation issue but also a critical regional environmental challenge. According to research by the UNESCO International Initiative on Land Subsidence Working Group, subsidence is projected to affect approximately 19% of the global population by 2040 [5,6,7].
Land subsidence in Decheng District, Dezhou, Shandong Province, has been a long-standing issue, covering an extensive area and progressing rapidly. The primary driver is the long-term overexploitation of deep groundwater, significantly influenced by geological and anthropogenic factors such as the considerable thickness and high compressibility of local loose sedimentary layers, alongside urban engineering loads. It has exerted substantial impacts on industrial and agricultural production, water conservancy infrastructure, urban development, and the construction and operation of highways and railways (Figure 1). As a result, it has become one of the major constraints on sustainable socio-economic development in the region [8,9,10,11].
The extraction of deep groundwater is identified as the primary driver of subsidence in this area, exhibiting distinct seasonal variations [12]. Numerous researchers have investigated and summarized the mechanisms and behavior of land subsidence in Dezhou and its surrounding areas, particularly its relationship with groundwater extraction. Yu et al. (2021) employed SBAS-InSAR to conduct extensive long-term monitoring of urban areas in Dezhou [13]. Their observations indicated that the entire subsidence zone exhibits a cyclical pattern of subsidence followed by rebound, repeating in phases, yet with an overall downward trend and distinct seasonal characteristics [13]. Wang et al. (2024) applied a GRU-CNN integrated approach to analyze the relationship between driving factors of dual water circulation and land subsidence [14]. Their findings indicate that the seasonal fluctuations in land subsidence and rebound in Dezhou are primarily governed by changes in the groundwater level of confined aquifers [14]. Fu et al. (2024) performed time-series InSAR monitoring and analysis of land subsidence in Dezhou’s urban area, identifying groundwater level changes as the primary influencing factor, followed by annual precipitation [15]. After the groundwater level drops, the resulting land subsidence usually does not occur immediately, but needs to go through a delay period to fully appear [16]. Through the integration of GRACE and InSAR data, Wei et al. (2025) investigated the lag relationship between groundwater changes and land subsidence, confirming a significant temporal delay in the subsidence response relative to groundwater level variations [17]. Collectively, these studies demonstrate that Dezhou experiences severe land subsidence with marked seasonal characteristics. Groundwater extraction-induced water level fluctuations represent the principal driver of subsidence, with annual precipitation acting as a secondary factor. Moreover, a distinct time lag exists between changes in groundwater levels and the corresponding land subsidence response.
The over-extraction of deep confined aquifers in Dezhou has been reduced by 100%, effectively eliminating all shallow groundwater over-abstraction zones across the municipality. Water levels in some previously over-exploited deep confined aquifers have begun to recover, leading to notable improvements in the groundwater ecosystem. The city has largely achieved a dynamic equilibrium between groundwater extraction and recharge, comparable to conditions observed in a normal hydrological year [18]. Nevertheless, research on land subsidence in Dezhou before and after the implementation of the groundwater extraction ban remains limited. There is also a lack of systematic numerical simulations of land subsidence and quantitative evaluations of the long-term effectiveness of the extraction ban policy. Available data indicate that land subsidence continues even under the current ban. Although ground elevation decline has halted in some areas, there is little evidence of rebound, with only limited regions showing marked improvement (rebound phenomenon). Therefore, it is imperative to analyze the dynamic evolution of groundwater levels and land subsidence following the ban and to develop reliable forecasts of future subsidence trends.
Based on groundwater data and monitoring records of groundwater dynamics and land subsidence from before and after the implementation of the groundwater extraction ban in Dezhou (2007–2020), this study employs systematic data analysis and numerical modeling. The primary objectives are (1) to investigate the evolutionary processes and patterns of land subsidence in response to the extraction ban and (2) to develop a fluid–solid coupling model for land subsidence to predict the ban’s long-term impact on subsidence behavior. The findings provide a scientific basis for subsidence prevention and control in Dezhou and offer insights for coordinating land subsidence management and groundwater resource development in other regions with similar hydrogeological conditions worldwide.

2. Materials and Methods

2.1. Study Area

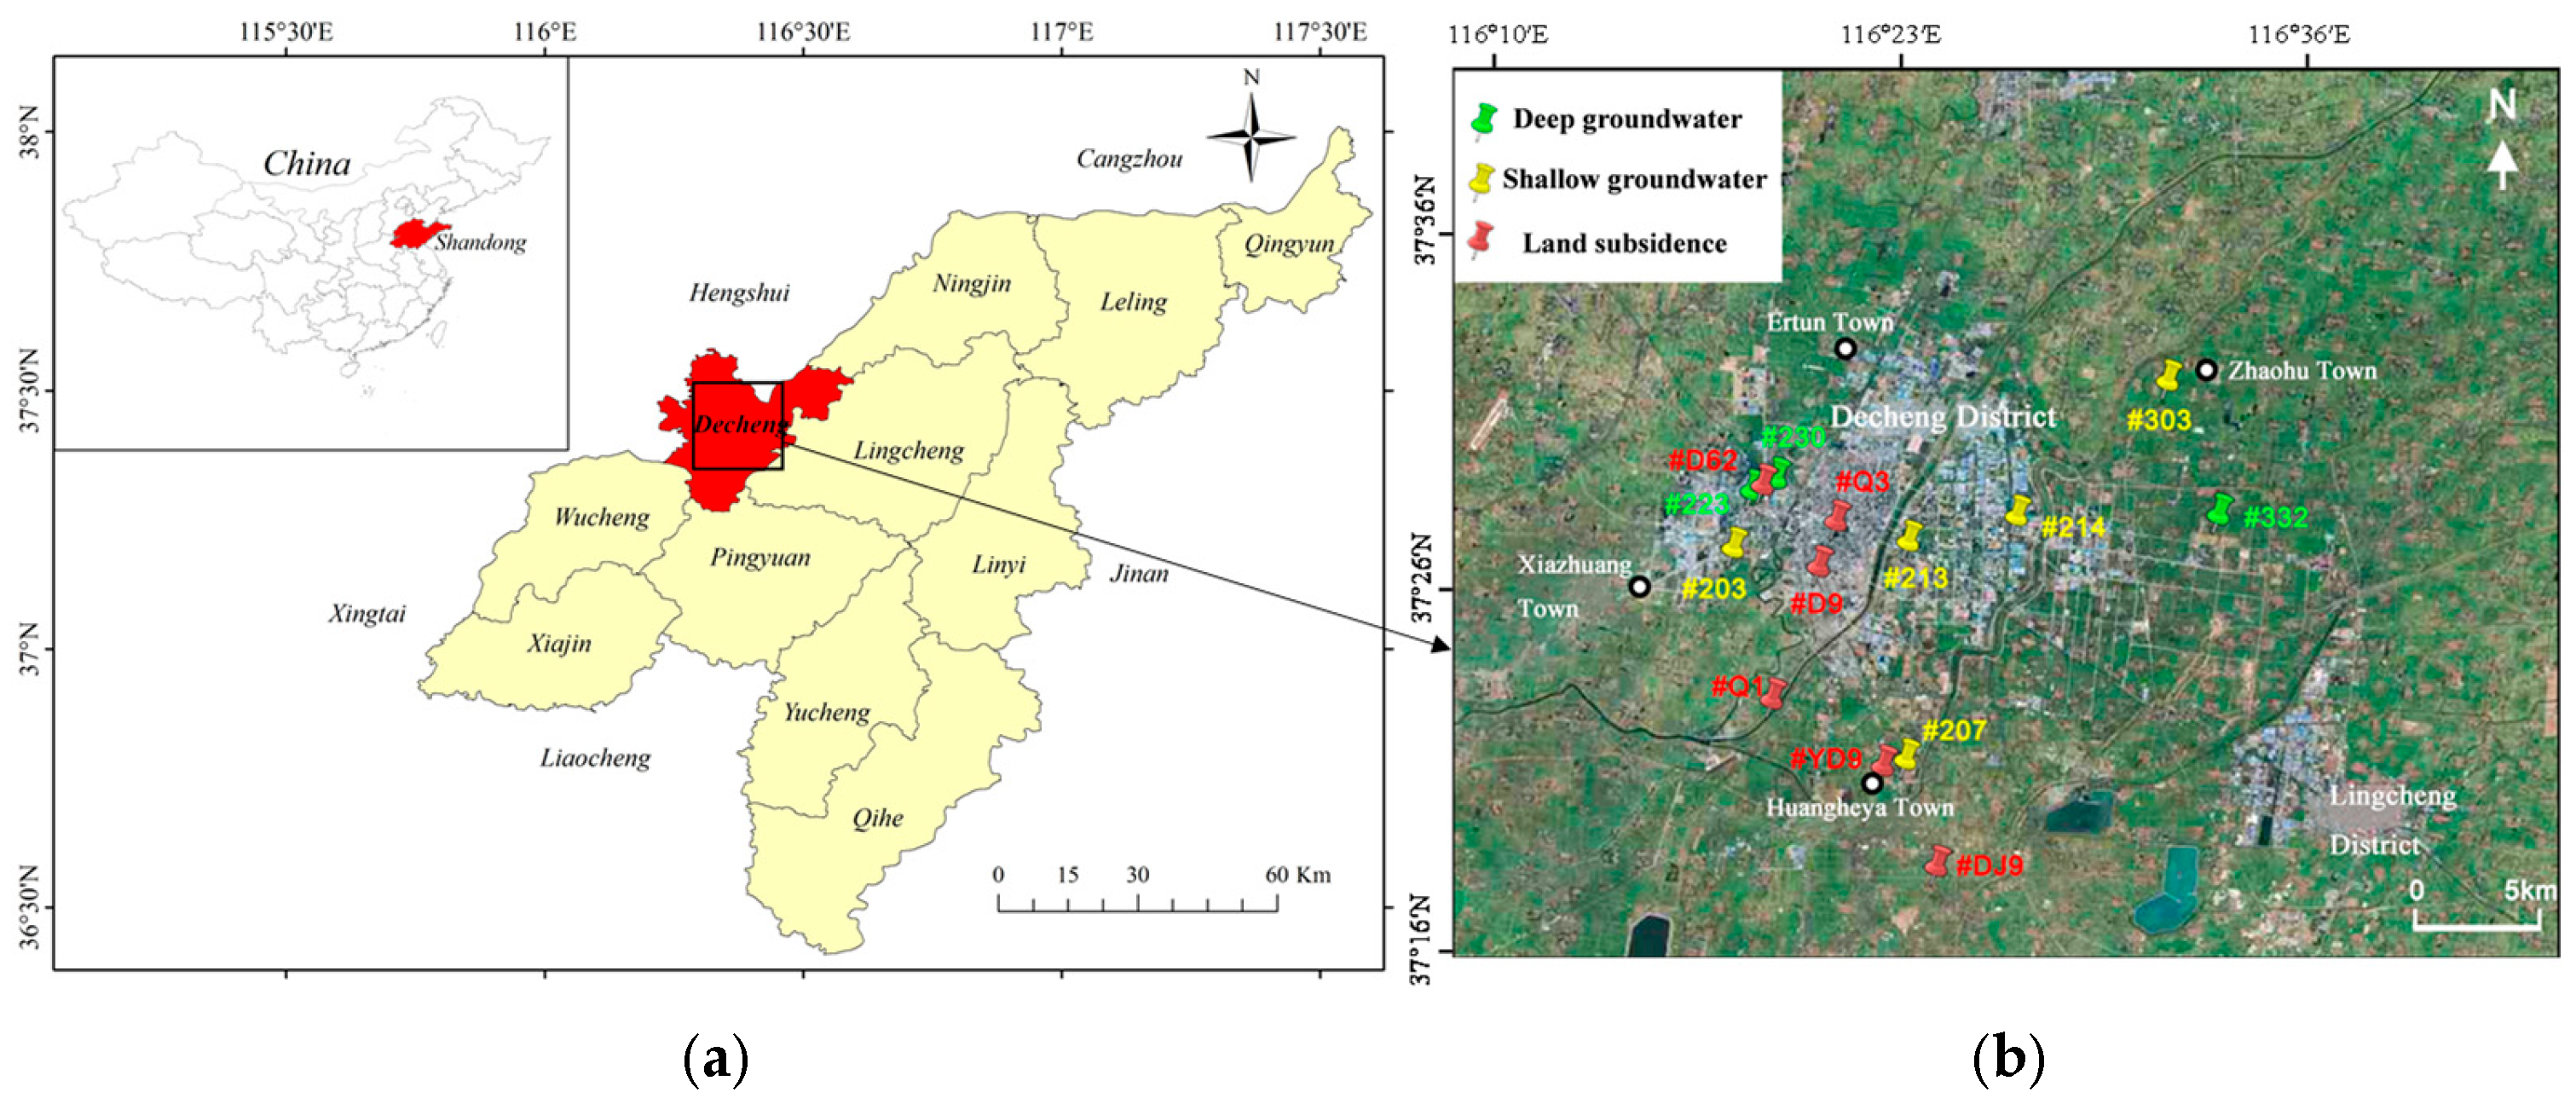
Decheng District is located in Dezhou City, Shandong Province, within the alluvial plain of the Yellow River Delta in northwestern Shandong (115°45′–117°36′ E, 36°24′25″–38°0′32″ N). The terrain slopes gently from west to east, forming the central urban area of Dezhou (Figure 2a). The region features a well-developed river network with numerous lakes, ponds, and canals, serving as an important agricultural production base in Shandong Province (Figure 2) [12]. The region experiences a warm temperate continental climate with an annual average temperature of 13.1 °C and annual average precipitation of 556.2 mm. The aforementioned data originates from the China Meteorological Data Network (http://data.cma.cn/, accessed on 31 October 2025), specifically collected from Dezhou National Meteorological Station (Station ID: 54714). Historically, the area has not experienced major natural disasters such as floods or earthquakes.
Located within the loose rock hydrogeological zone of the Northwestern Shandong Plain, Decheng District hosts groundwater primarily in the pore spaces of Quaternary and Neogene Minghuazhen Formation unconsolidated sediments, with aquifer lithology dominated by silt and fine sand [12]. The groundwater system exhibits a distinct vertical stratification, which can be divided into three primary zones based on key indicators such as hydrochemical characteristics and aquifer structure: the shallow zone (<60 m) comprises a phreatic aquifer within Quaternary alluvial deposits, characterized by HCO3-Ca·Mg-type freshwater (TDS < 1 g/L); Transitioning downward to the intermediate zone (60–250 m) lies a slightly saline aquifer (TDS 1–3 g/L) characterized by SO4·Cl-Na water chemistry; Further downwards, the deep zone (250–800 m) comprises a confined system formed within Tertiary fine-grained sediments, exhibiting HCO3-Na water chemistry ranging from freshwater to slightly fresh water (TDS < 1 g/L). The shallow groundwater system functions as an open system, directly recharged by precipitation, irrigation return flow, and lateral seepage from rivers and canals. Discharge occurs mainly through evaporation and anthropogenic extraction, resulting in strong connectivity with the external environment and rapid responses to hydrological changes. The intermediate groundwater system is semi-confined and widely distributed, though it remains largely untapped due to water quality limitations. The deep groundwater system is also semi-confined. Under natural conditions, it receives limited lateral recharge and discharges via slow cross-formational flow. Under pumping conditions, depletion is dominated by storage release, with minor contributions from lateral inflow and weak inter-aquifer leakage. Artificial extraction represents the primary discharge mechanism [19,20]. Consequently, excessive extraction of deep groundwater is identified as the main external driver of land subsidence in the region.
The deep groundwater resources of Decheng District exhibit pronounced spatial heterogeneity, primarily manifested in substantial variations in key hydrogeological attributes. These include significant regional fluctuations in aquifer unit yield—a parameter influencing available water volume—and total dissolved solids (TDS), a critical indicator of water quality. Regions with abundant deep groundwater are characterized by sand-layer cumulative thicknesses of 40–60 m, dominated by silt, fine sand, medium sand, and medium-fine sand lithologies, with specific yields of 50–200 m3/(d·m). Moderately abundant areas are mainly distributed in the northeastern parts of Qingyun and Leling counties, as well as along the Renli-Antou area in Qihe, where the cumulative sand-layer thickness ranges from 20 to 40 m and lithologies consist of fine sand and medium sand interbedded with sandstone. The specific yield in these areas is generally below 50 m3/(d·m). Areas with scarce deep groundwater are predominantly located along the Yellow River in Qihe County, south of the Qihe-Guangrao major fault zone, exhibiting a NE-trending belt-like distribution (Figure 2b). Here, the cumulative thickness of aquifer sand layers is less than 20 m, composed mainly of medium and medium-fine sand. Due to the prevalence of silty sand and semi-cemented sandstone formations, the aquifer productivity is poor, with specific yields typically below 50 m3/(d·m) [21]. Deep groundwater extraction in Decheng District began in 1965, with initial well depths around 350 m. Between 1980 and 1985, well depths increased to 400–500 m, and currently reach up to 800 m. Since 1985, groundwater extraction has consistently exceeded sustainable yield, resulting in prolonged overexploitation. This has led to the continued expansion and deepening of deep groundwater depression cones. According to extraction statistics, the number of deep groundwater wells in Decheng District increased from 226 in 2010 (extraction volume: 26.694 million m3) to 376 in 2015 (extraction volume: 4.84 million m3), reflecting growing exploitation intensity.

2.2. Dynamic Monitoring Data

This study utilizes the following primary datasets from Decheng District for the period 2007–2022: extraction volumes of deep and shallow groundwater; long-term monitoring records of deep and shallow groundwater dynamics; land subsidence monitoring data; and stratigraphic data required for model development.
The spatial distribution of groundwater level and land subsidence monitoring points is illustrated in Figure 2b. Dynamic groundwater level monitoring points are primarily distributed across Decheng District and its adjacent areas, with key observation zones located near land subsidence monitoring sites. The network consists of five shallow and three deep groundwater level monitoring points, all situated in proximity to subsidence benchmarks within and around the urban core. Land subsidence monitoring in Decheng District is supported by a network of six permanent leveling benchmarks (BJ9, YD9, D9, Q3, Q1, and D62). Each benchmark is securely anchored in stable subsurface strata, providing a reliable reference frame for elevation measurements.

2.3. Methodology

2.3.1. Statistical Analysis of Deformation and Hydrological Data

To quantitatively analyze the relationship between groundwater dynamics and land subsidence, this study systematically processed time-series data of subsidence and hydrological variables [22]. The raw data were first pre-processed to ensure consistency and accuracy. Since groundwater levels and extraction volumes were recorded monthly, while subsidence data were obtained annually, the hydrological data were aggregated into annual averages to align temporally with the subsidence records. Isolated missing values were filled using linear interpolation. Based on the processed data, the average annual subsidence rate (unit: mm/a) was calculated for each monitoring period (2007–2010, 2010–2021, and 2021–2022) using cumulative subsidence measurements at each benchmark. Correspondingly, the average annual groundwater level decline rate (unit: m/a) and annual changes in extraction volume were derived as key indicators for subsequent correlation analysis.
This study employs comprehensive visualization and trend analysis of time-series data to identify patterns and relationships among key variables [23]. Temporal variations in land subsidence rates, groundwater extraction volumes, and groundwater level depths were first visualized using line graphs. These plots revealed distinct multi-phase evolutionary trends through direct observation. To further quantify changes in subsidence intensity across different periods, the average annual subsidence rate was calculated for each of the three defined intervals: 2007–2010, 2010–2021, and 2021–2022. Bar charts were then used to visually compare these rates, clearly illustrating the magnitude and variation in subsidence behavior over time.

2.3.2. Implementation of Fluid–Solid Coupling and Governing Equations

The selection of constitutive models plays a critical role in determining computational accuracy in geomechanical simulations. Considerable research has been devoted to this area: for instance, Chiang et al. developed an inelastic specific storage model to analyze soil settlement induced by water dissipation [24]. Luo et al. incorporated soil nonlinearity using the Duncan-Chang model [25], while Jessen et al. applied a viscoelastic approach to simulate time-dependent deformation, capturing creep behavior and settlement hysteresis [26]. More recently, Shu et al. proposed a new elastic-viscoplastic constitutive model based on field monitoring and laboratory geotechnical test data [27]. However, as the primary focus of this study is to reveal the spatio-temporal evolution of land subsidence before and after the implementation of extraction bans, rather than to achieve high-fidelity simulation of soil deformation magnitudes, computational efficiency is prioritized. Therefore, a poroelastic fluid–solid coupling model is adopted in this work.
The essence of pumping-induced land subsidence is a chain reaction involving fluid–solid interactions: reduced pore water pressure increases the effective stress within the soil, thereby triggering compressive deformation of the soil skeleton. This process involves strong coupling between the seepage field and the stress field: fluid motion follows Darcy’s Law, while soil deformation obeys elastic or specific constitutive relationships. A pronounced bidirectional coupling effect exists between these two phenomena (Table 1), manifested as follows: seepage drives soil deformation by altering effective stress, while soil deformation in turn feeds back into the seepage process. By modifying pore structure and connectivity, it influences key hydraulic parameters (such as permeability coefficient k and porosity n), thereby regulating subsequent seepage behavior.
The governing equation of fluid–solid coupling is mainly composed of the fluid control equation and porous medium control equation [9]. In this study, Biot’s consolidation theory is adopted, and its basic control equations include the fluid control equation and porous medium control equation.
(1)
Fluid control equation
ρ f S α H t + ρ f K H = ρ f α B t ε v o l
In the formula, ρ is the fluid density; H is the pressure head; K is the permeability coefficient; εvol is the volume strain matrix of porous media; Sα is the water storage coefficient of porous media, which is related to the elastic modulus and Poisson’s ratio of porous media; αB is Biot consolidation coefficient; ▽ is Laplace operator; t is time.
(2)
Porous medium control equation
  σ = ρ   g
In the formula, σ is the total stress tensor; ρ is the total density; g is the acceleration of gravity.
The realization process of fluid–solid coupling is the coupling solution process of the fluid control equation and porous medium control equation on the basis of initial conditions and boundary conditions. Using the COMSOL Multiphysics (https://cn.comsol.com/comsol-multiphysics, accessed on 31 October 2025) simulation platform, the single traditional model of porous media mechanics and fluid mechanics is extended in the platform [28], and a fluid–solid coupling calculation model for solving land Subsidence caused by groundwater exploitation is established. To calculate the model, Darcy’s law, solid mechanics interface, and porous elastic interface in multiple physical fields are needed:
(3)
Darcy’s law (Groundwater flow)
k μ p = S s p t
In the formula, ▽ is the divergence operator to calculate the net outflow of the fluid; k is permeability; μ is the dynamic viscosity of the fluid; p is pore water pressure; Ss is water storage rate; and p t is the change rate of pressure with time.
(4)
Solid mechanics (Formation deformation)
σ + F = 0
In the formula, σ is the stress tensor; F is the volume force vector.
(5)
Porous elasticity (fluid–solid coupling)
σ = C : ε α   p   I
In the formula, σ is the stress tensor; c is the elastic stiffness tensor; ε is the strain tensor; α is the Biot coefficient; p is the pore fluid pressure; and I is the unit tensor.
The above equations describe the coupling relationship between solid skeleton stress, strain and pore fluid pressure in porous elastic media, which is suitable for the analysis of fluid–solid coupling problems, such as the interaction between formation deformation and groundwater seepage.

3. Results and Discussion

3.1. Response of Land Subsidence to Groundwater Extraction

Groundwater extraction is the primary factor inducing land subsidence. Its mechanism of action can be summarized as follows: extraction causes changes in the groundwater table, which in turn leads to stratum compression, ultimately manifesting as land subsidence [29,30]. Therefore, analyzing the response of land Subsidence to groundwater extraction hinges on clarifying the dynamic relationship between the three variables: extraction volume, water level, and subsidence.

3.1.1. Variations in Groundwater Extraction

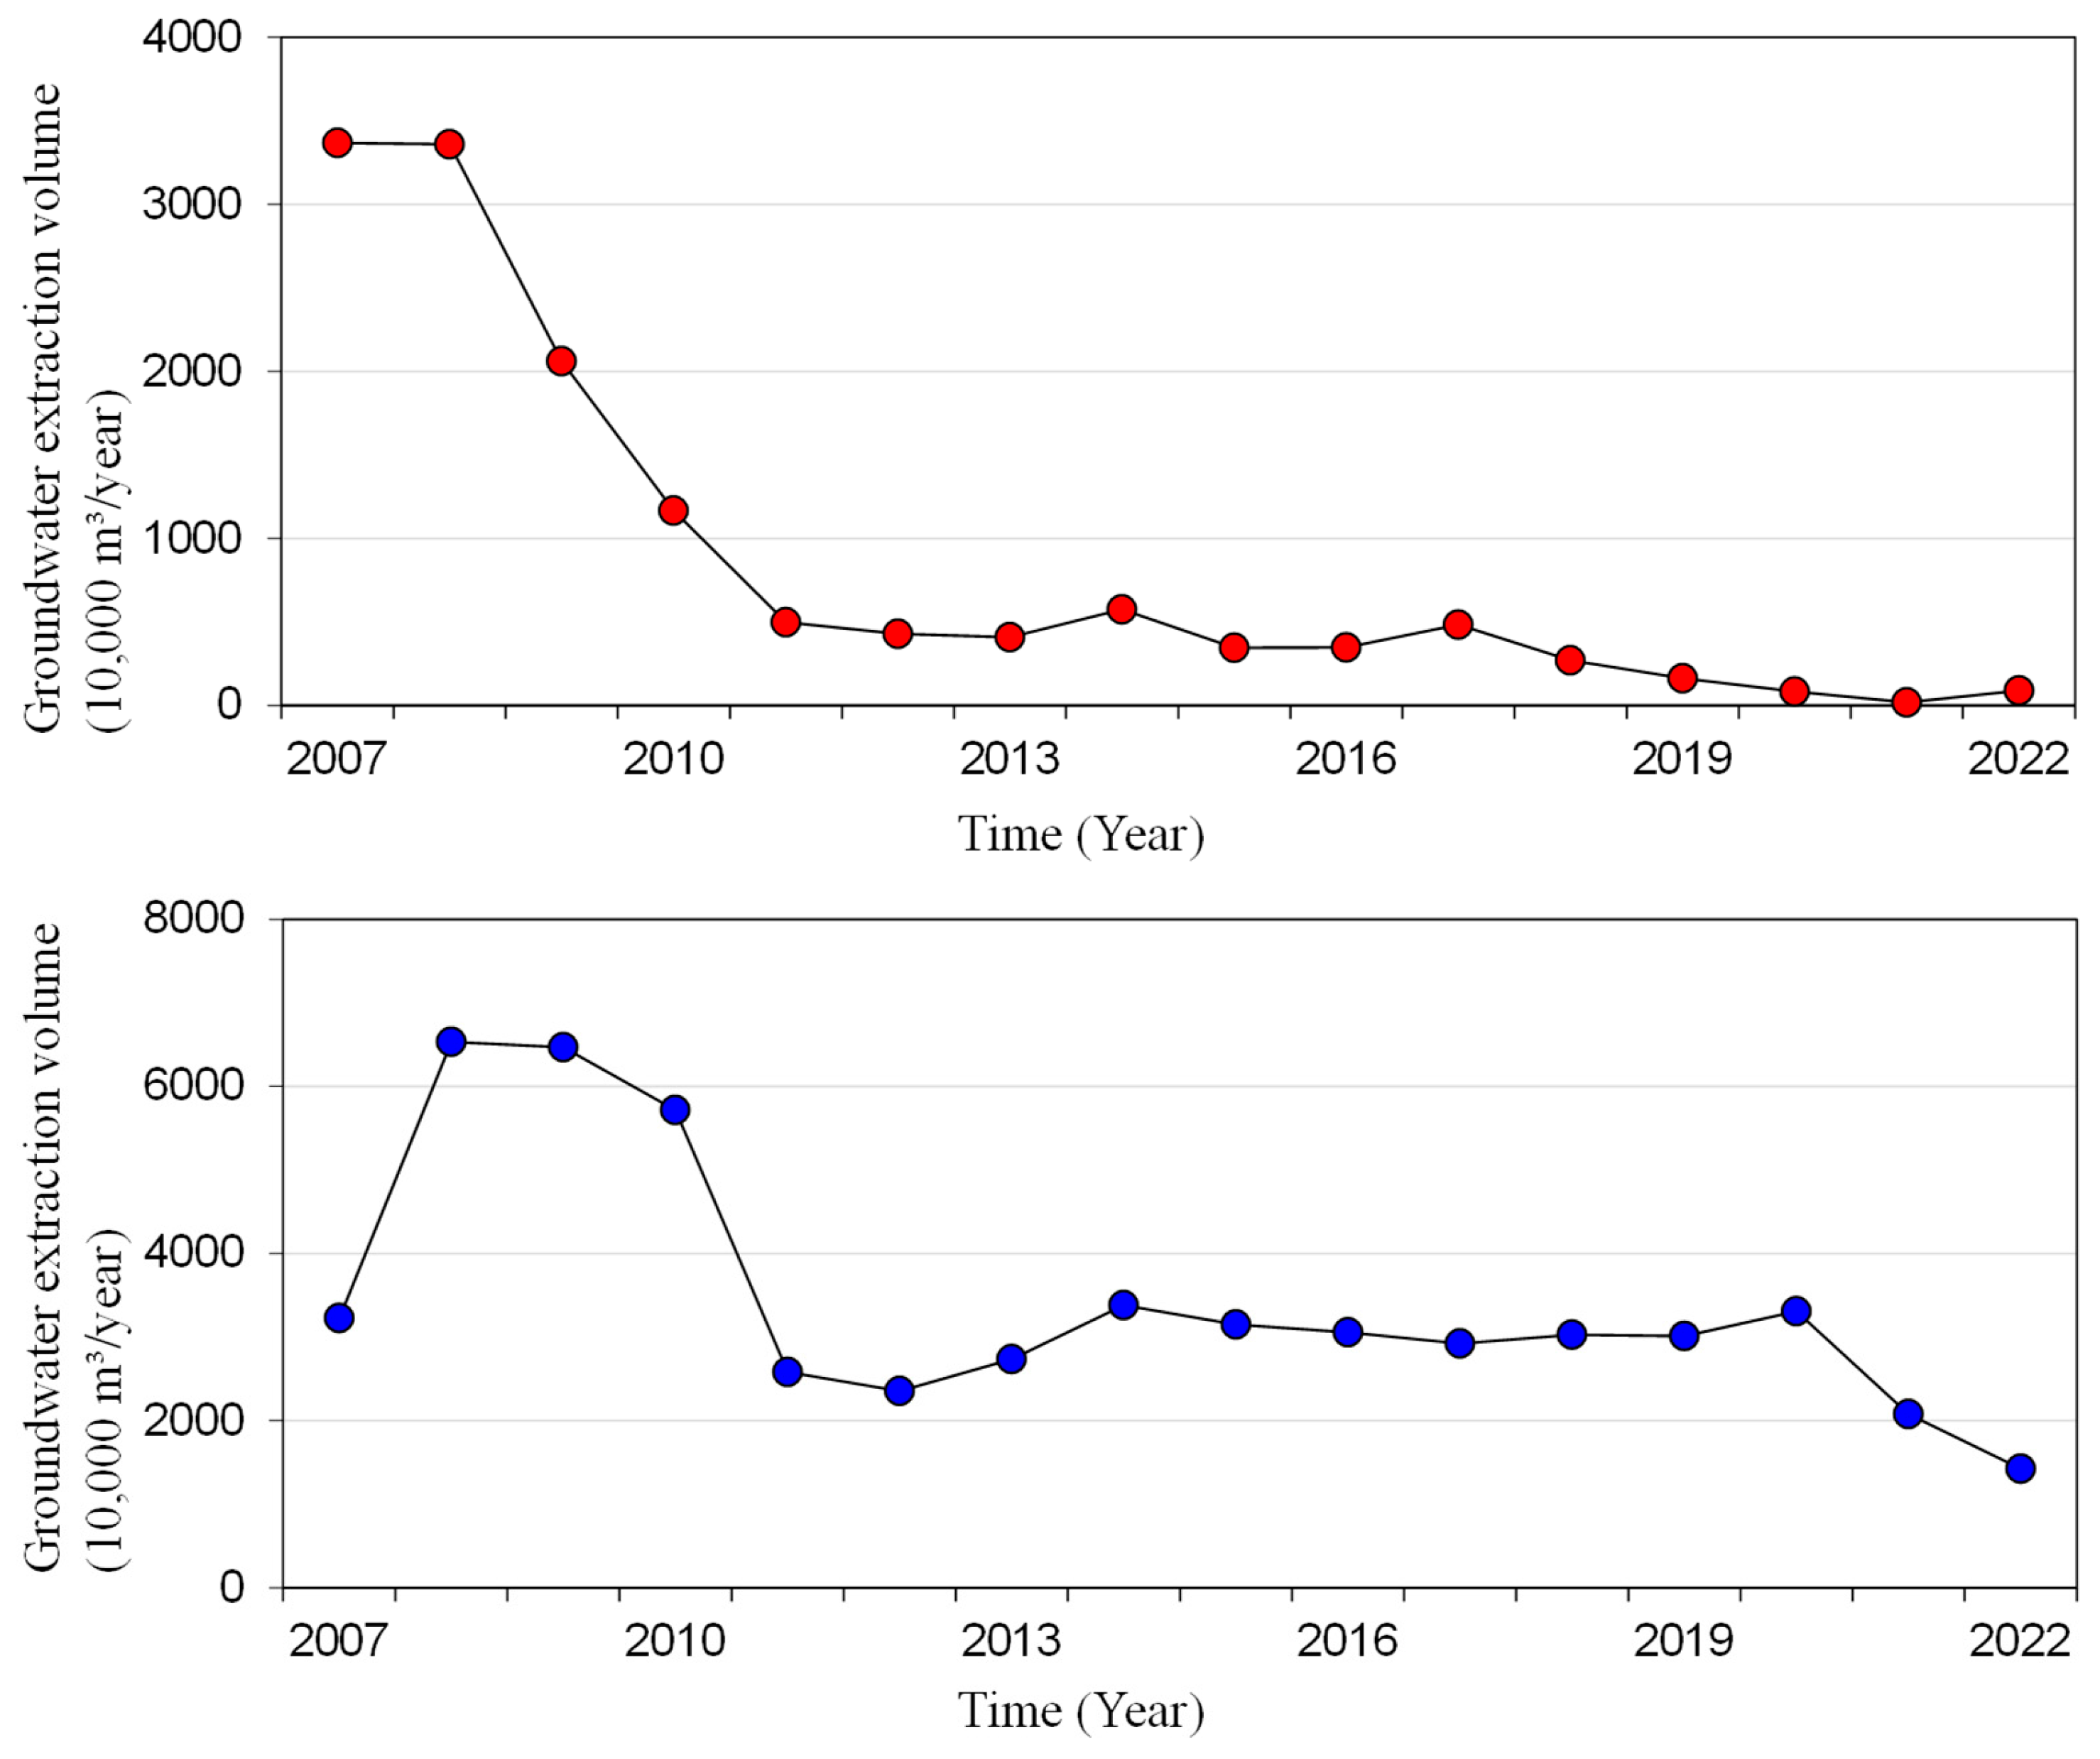
Analysis of groundwater extraction data from the study area reveals distinct temporal trends in both shallow and deep aquifer withdrawals (Figure 3). During the period 2007–2022, extraction volumes consistently decreased across both aquifer systems. Deep groundwater extraction declined sharply between 2008 and 2011, followed by a period of relative stability with minor fluctuations from 2013 to 2017. Shallow groundwater extraction peaked in 2008, after which it also trended downward, albeit with intermittent variations. Following the implementation of the extraction ban in 2020, deep groundwater extraction fell from 830,000 m3/a to 178,000 m3/a, while shallow extraction decreased from 33,070,000 m3/a to 20,775,000 m3/a.

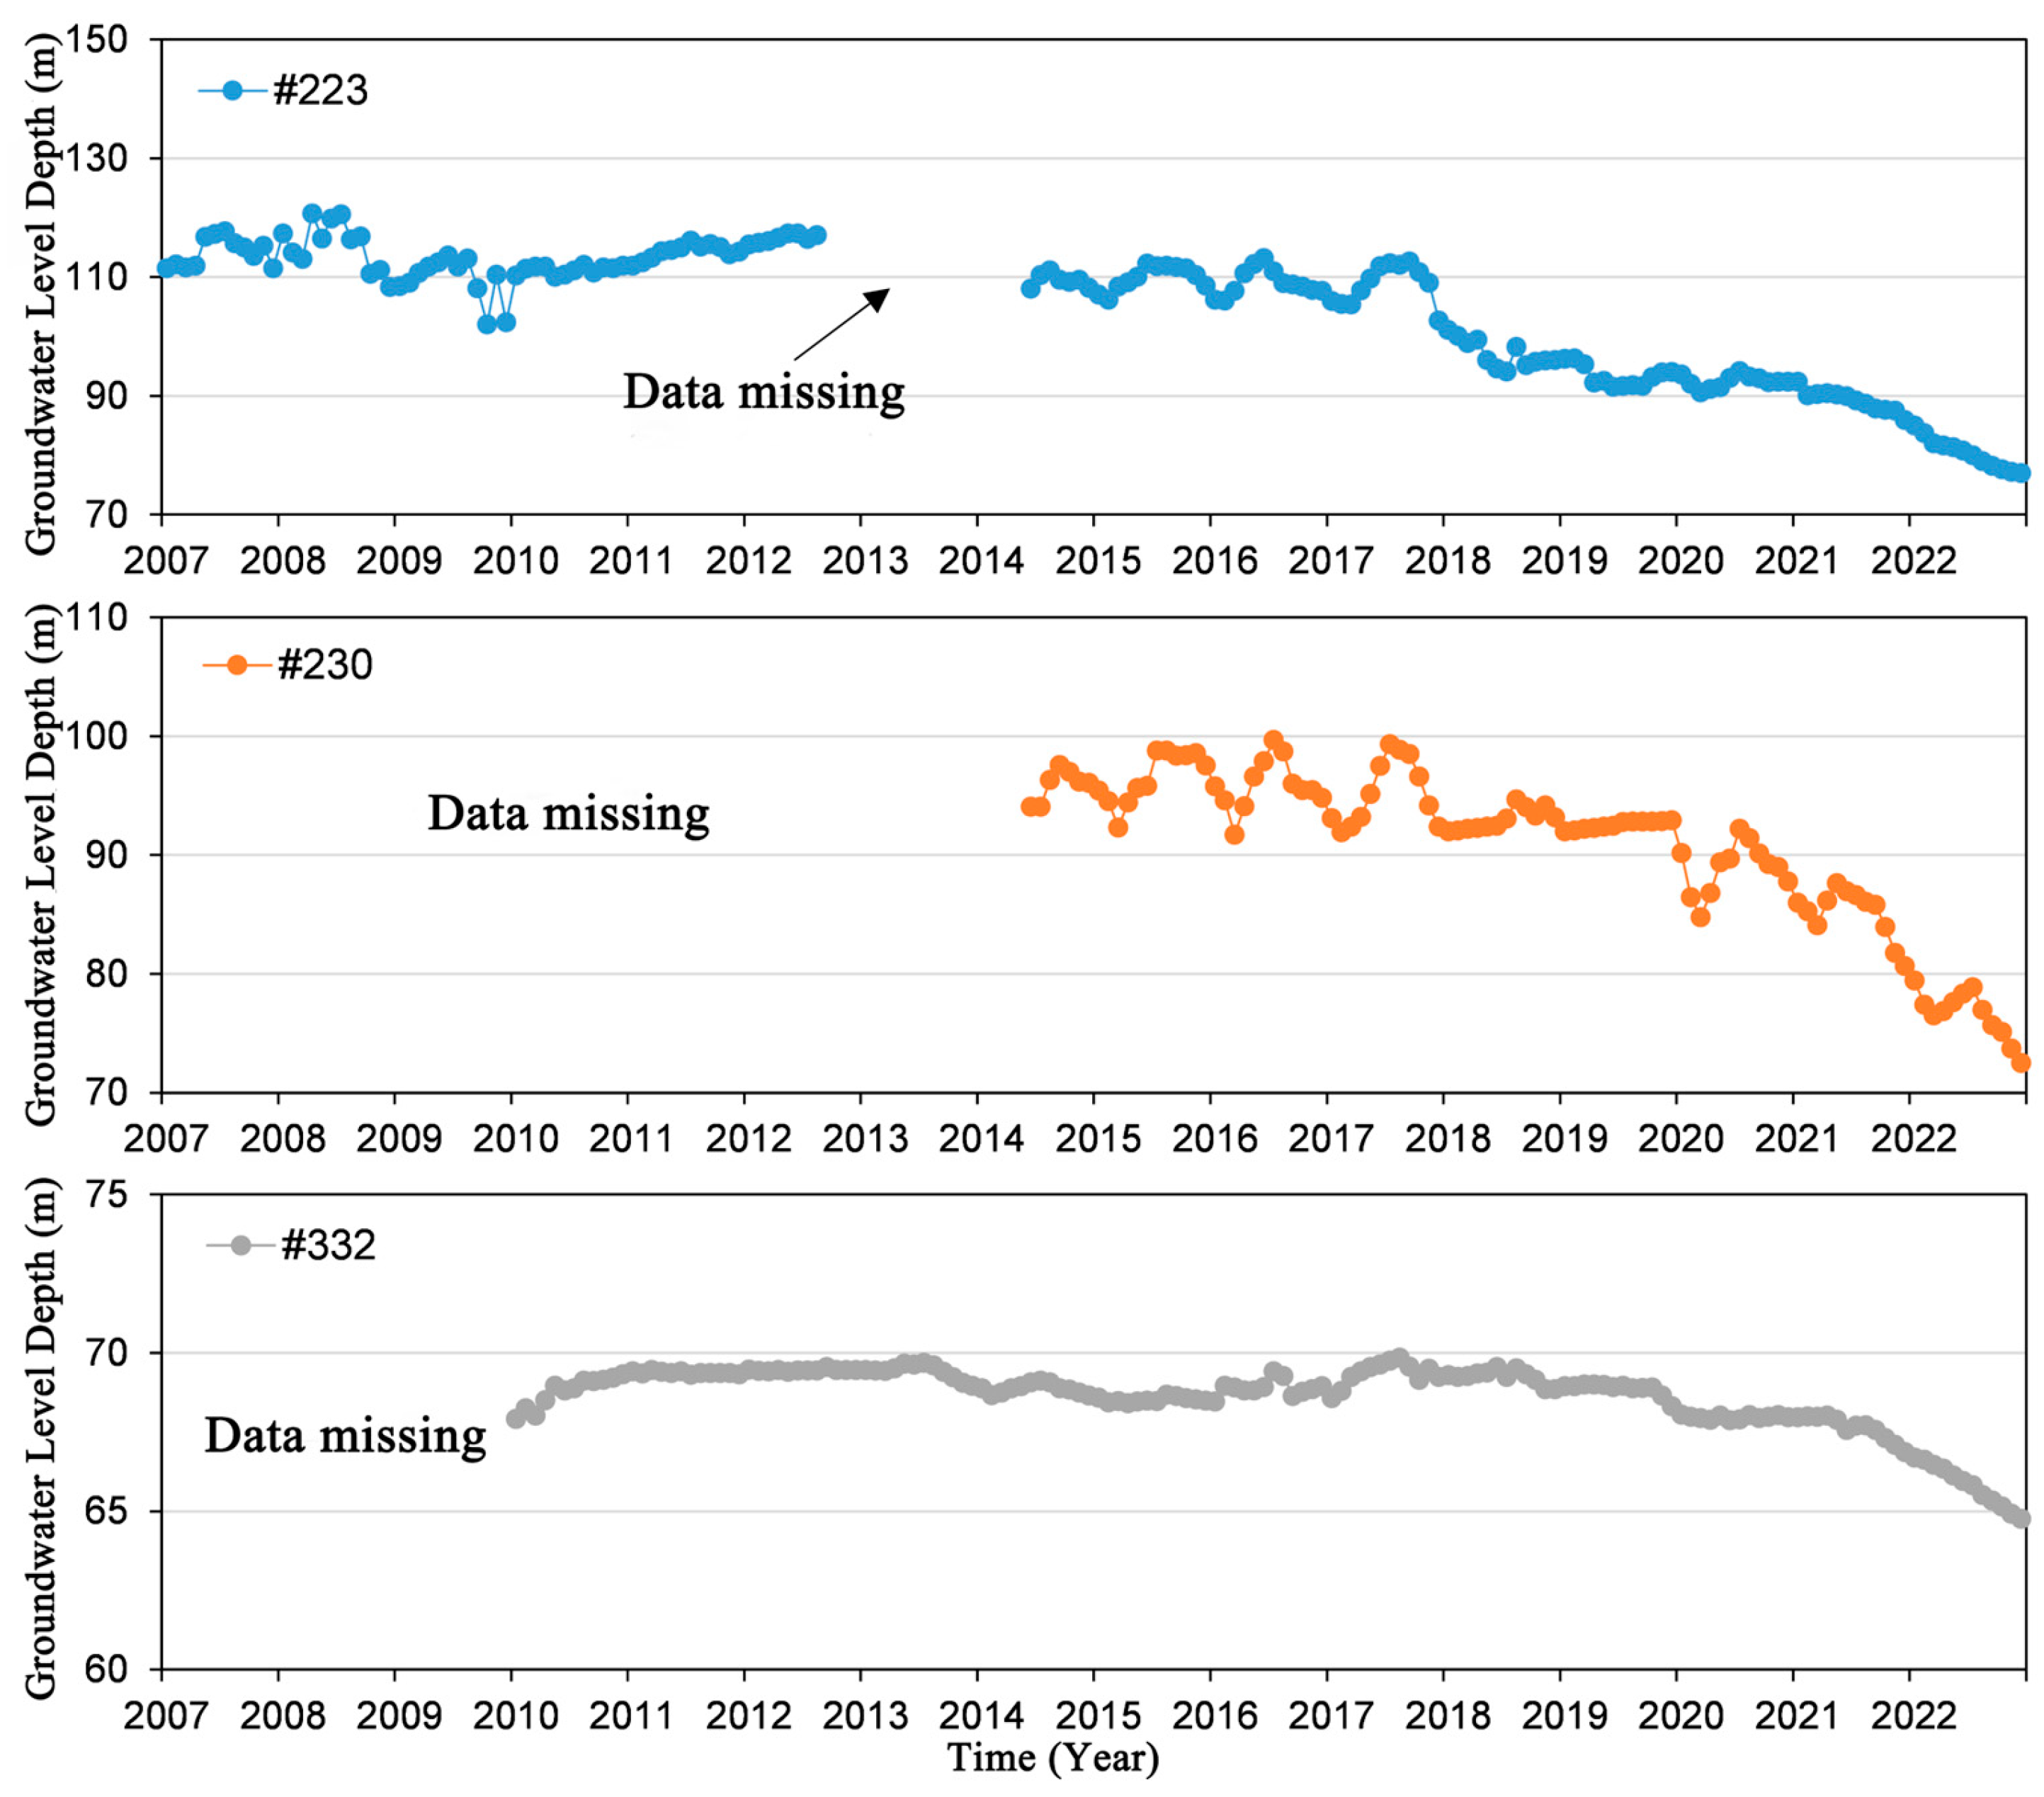
3.1.2. Groundwater Level Response Process

Water level data from five shallow and three deep groundwater monitoring points were analyzed to generate dynamic trend charts (Figure 4 and Figure 5). A direct and strong causal link exists between groundwater extraction and aquifer responses. The shallow aquifer system reacts promptly to extraction changes: the notable increase in extraction during 2007–2008 caused sharp declines in shallow groundwater levels and a considerable rise in burial depth across all monitoring points. Subsequent fluctuations in extraction led to complex water level variations—including recovery, stabilization, or further decline—highlighting the direct control of extraction on shallow aquifer dynamics. After 2020, with the strict enforcement of extraction restrictions, shallow groundwater levels showed clear recovery. Although these levels fluctuated around a medium-term average, long-term extraction resulted in a net increase in burial depth compared to initial conditions.
The deep aquifer response was more pronounced. Following a sustained rapid decline in extraction since 2007, deep groundwater levels transitioned from continuous drawdown to gradual recovery. Since 2017, with consistently reduced extraction, deep water levels have recovered steadily at an average rate of about 0.5 m/a. After the 2020 extraction bans, the recovery rate accelerated dramatically, rising from approximately 0.5 m/a to about 5 m/a, underscoring the effectiveness of stringent extraction controls. Monitoring points located outside urban areas (#303, #332) exhibited more gradual water level changes, consistent with the lower local extraction intensity, further confirming that extraction magnitude is the primary factor governing water level variations.

3.1.3. Rate of Land Subsidence

Land subsidence data from six monitoring points in Decheng District are presented in Table 2. Overall, the subsidence pattern in Decheng District shows an initial increase followed by a decrease in subsidence rates (Figure 6). Each monitoring point recorded relatively high average subsidence rates between September 2007 and November 2010. Subsequently, average subsidence increased between November 2010 and November 2021, before experiencing a significant decline between November 2021 and September 2022, with the annual average subsidence rate decreasing by over 80% compared to the earlier period. Considering the patterns of change in groundwater extraction volumes, increased extraction accelerated subsidence rates, while reduced extraction slowed them [31]. The groundwater extraction ban within the area has thus demonstrated clear effectiveness in controlling subsidence. However, changes in subsidence driven by groundwater extraction do not occur immediately but exhibit a certain degree of lag [32].

3.2. Prediction Analysis of Land Subsidence Numerical Simulation

Given the large number of actual well groups, layout of pumping wells and dynamic changes in extraction volume, it is impossible to fully replicate the actual stratigraphic extent and real pumping well data in the model. To investigate the fundamental mechanisms through which groundwater extraction and extraction bans influence land subsidence, this study developed an idealized numerical model for simulation analysis.

3.2.1. Model Conceptualization and Geometry

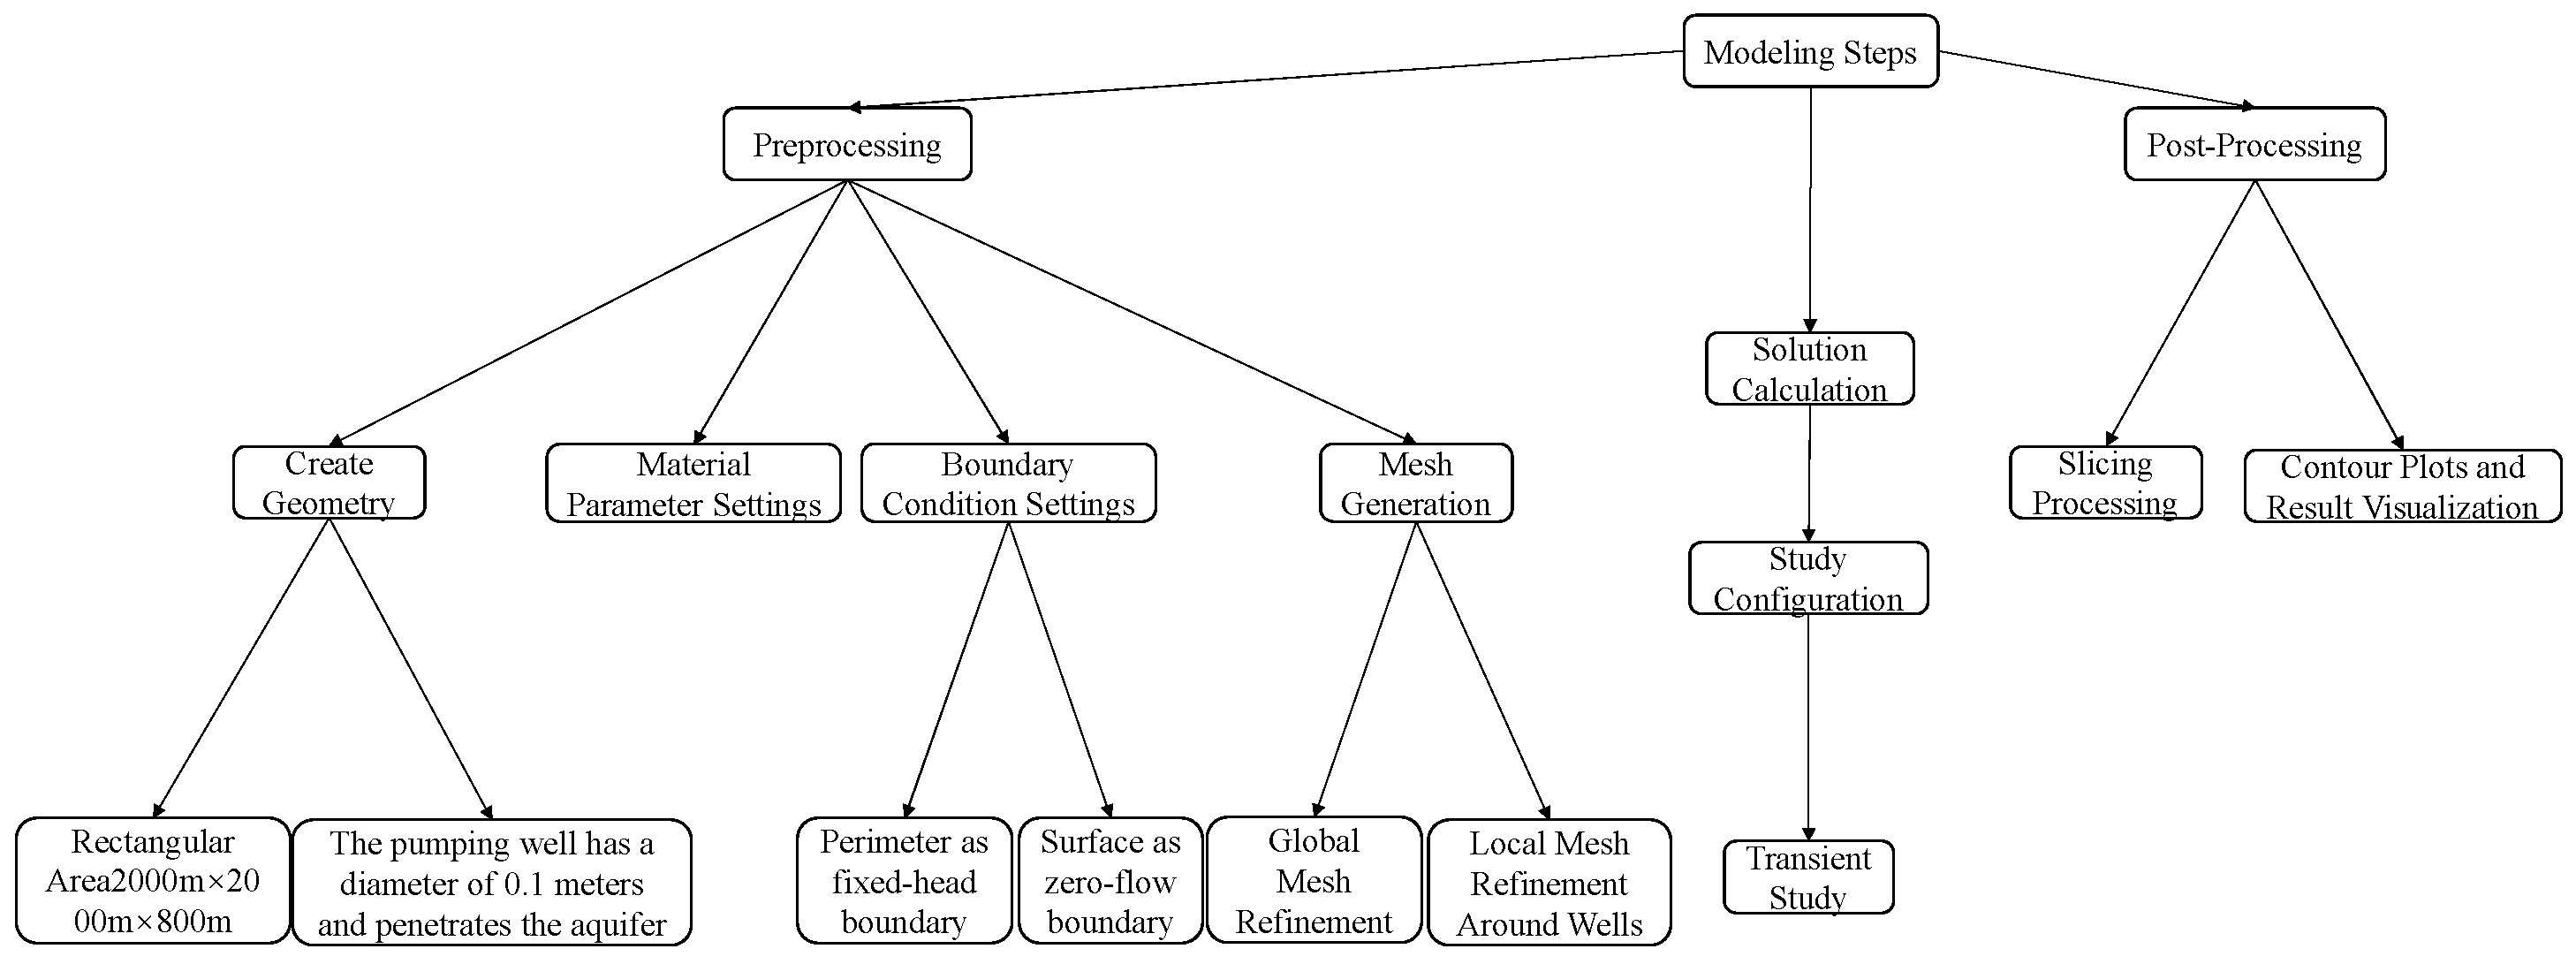
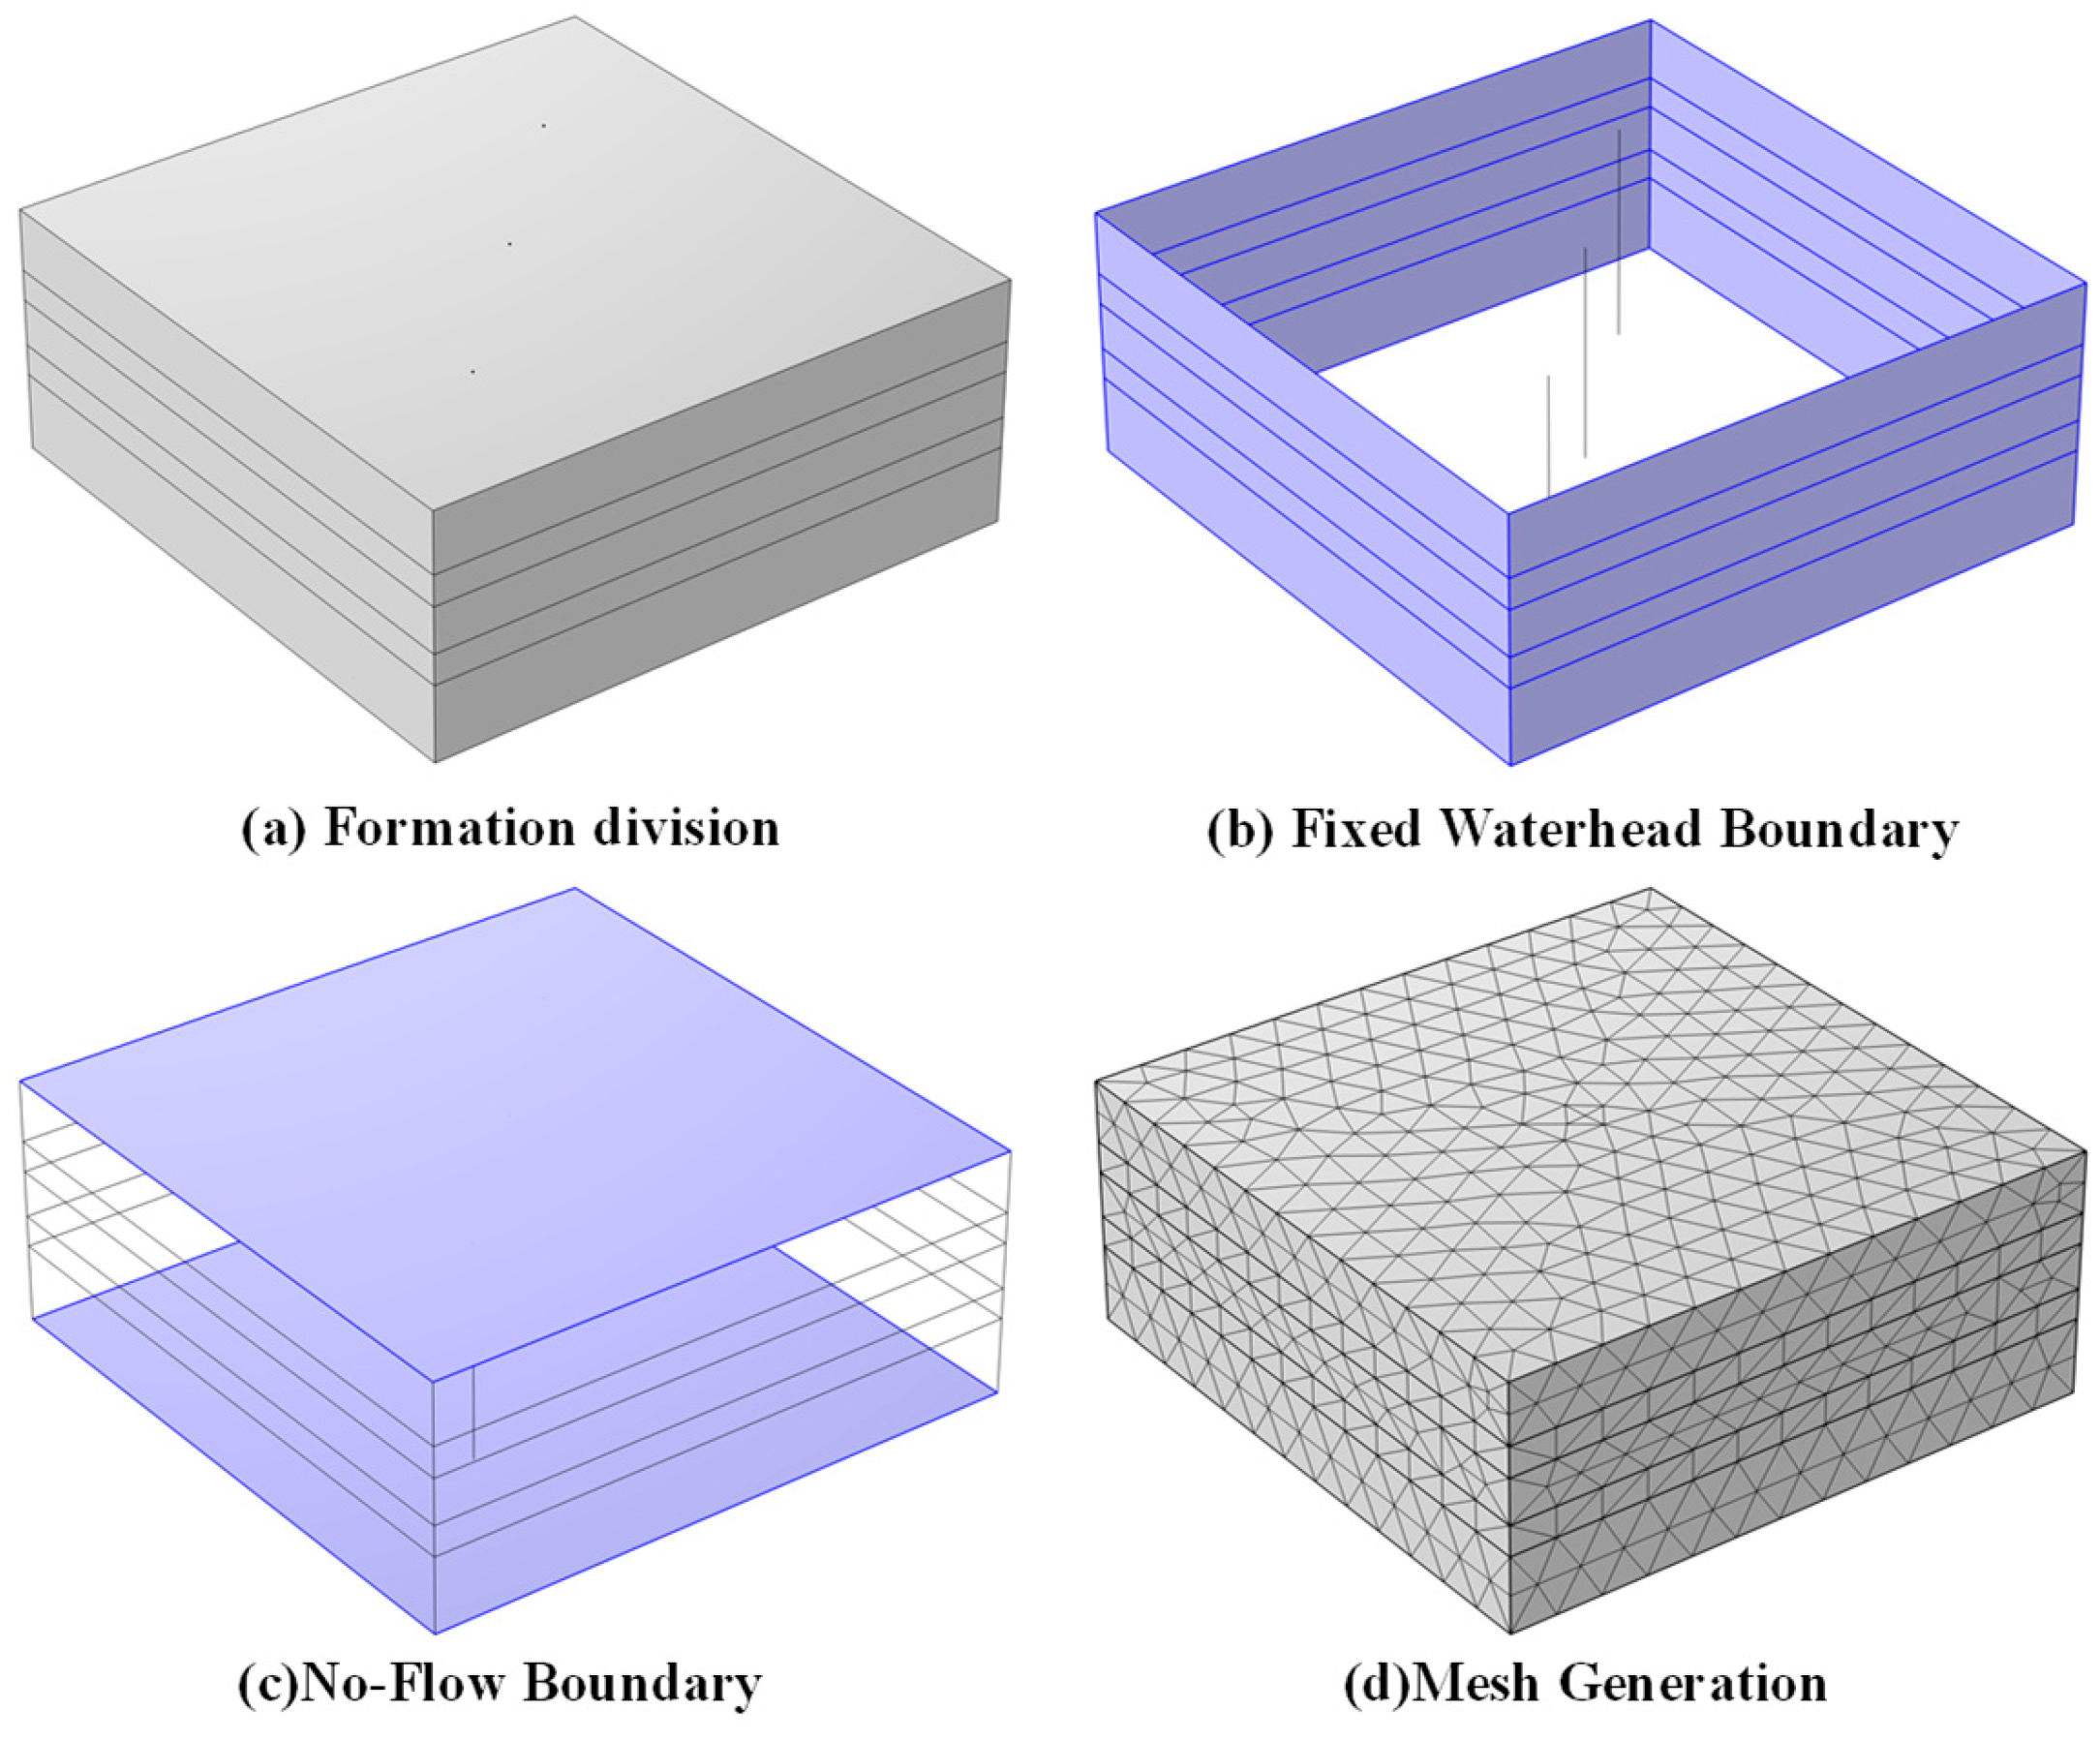
The modeling procedure is illustrated in Figure 7. The model was constructed using a method of layer-by-layer extrusion, progressing from surfaces to volumes [33]. This process began with the creation of a rectangular area, which was then assigned a height to generate a hexahedron, into which wells penetrating the aquifers were inserted. To construct a numerical model, this study employed statistical methods to identify key stratigraphic levels based on borehole stratigraphic data and geotechnical parameters. Consequently, the strata within the 800-m depth were simplified into a conceptual model comprising primary aquifers and aquitards. Layers 1 to 5 are 0–200 m, 200–300 m, 300–450 m, 450–550 m, and 550–800 m, respectively (Figure 8a). Layer 1 is the overburden. Layers 2 and 4 are aquitards, while Layers 3 and 5 are aquifers, which serve as the primary water-producing layers. Based on the stratigraphic framework of the Dezhou region in the North China Plain and in accordance with hydrogeological survey data and previous research findings, the necessary data for the 800 m depth model calculation were input. Where specific stratigraphic data were insufficient, empirical values were applied (Table 3).
The boundary conditions are defined as follows: The peripheral boundaries far from the pumping well centers are specified as fixed waterhead boundary (Figure 8b), with horizontal movement constrained and vertical movement set to free sliding. The top surface constitutes a no-flow boundary (Figure 8c), permitting unrestricted vertical movement. The bottom boundary is a no-flow boundary with fixed displacements in both horizontal and vertical directions. The pumping wells are defined as constant-flux boundaries, with horizontal displacement constrained and vertical movement free.
A refined mesh was applied to the entire model domain. The element size was set to be finer in the vicinity of the wells (Figure 8d). This refinement is necessary because the groundwater flow simulation requires accurate capture of the high hydraulic gradient around the wells, while the land subsidence simulation necessitates continuity of inter-layer displacement. Furthermore, the fluid–solid coupling formulation requires the mesh to be aligned with material interfaces. A swept mesh was employed for the main model region, while boundary layer meshing was used for local refinement around the wells.
Upon completion of the model run, three-dimensional contour maps of stress, velocity, and pressure will be obtained. To more intuitively depict the impact of groundwater extraction on land subsidence, the pressure contour map can be selected. Within this display, navigate to Solid Mechanics → Displacement → solid.disp and choose the ‘Displacement Magnitude’ (m) expression to generate the corresponding cloud map. To provide a more intuitive demonstration of the formation of a settlement funnel, the model may be sectioned.
To ensure model reliability, this study systematically calibrated and validated the established idealized model using historical monitoring data. The data period was divided into a calibration period (2007–2017) and an independent validation period (2017–2022). Based on the structure setting of the ideal model, the key physical parameters such as the permeability and porosity hydraulic conductivity of the main aquifers are limitedly adjusted within a reasonable range set according to the formation data of Decheng District. The calibration objective was to minimize the discrepancy between simulated and observed groundwater levels and land subsidence trends. The simulated subsidence trend is consistent with the actual measured trend. Upon obtaining acceptable calibration results, all parameters were held constant, and the model was run forward through the validation period (2017–2022) to simulate changes in water levels and subsidence during this interval. These simulations were then compared against measured data that were not involved in the calibration process. After adjustment, despite the idealized nature of the model, the simulation results demonstrated good agreement with the measured data during the validation period. This indicates that, even with its simplifications, the model reliably captures the primary fluid–solid coupling processes governing land subsidence in the study area and possesses a fundamental capability for predicting future scenarios.

3.2.2. Deformation Characteristics of Different Aquifers

The numerical simulation results (Figure 9 and Figure 10) indicate that groundwater extraction from both deep and shallow aquifers, under the same pumping rates, leads to a spatiotemporally progressive evolution of soil deformation. The common patterns are as follows: initial deformation begins at the interfaces between the pumped aquifer and the adjacent upper and lower aquitards. The upper interface experiences subsidence due to compression, while the lower interface exhibits limited heave caused by the reduction in pore water pressure. During the deformation propagation phase, the subsidence zone extends upward through the overlying soil layers in a “mushroom-shaped” pattern until it reaches the ground surface. The area of land subsidence continues to expand, eventually forming a subsidence funnel. After a period of time, a stable state is reached, and the soil deformation and subsidence essentially stabilize.
Extraction from shallow aquifers is characterized by a relatively limited expansion trend of the land subsidence area during the deformation propagation phase, accompanied by uneven deformation. Upon stabilization, an asymmetric funnel profile develops, exhibiting greater subsidence in the upper part and lesser in the lower part. The adjacent lower aquitard shows little change (with insignificant heave) near the pumping wells, and the affected zone is confined. In contrast, extraction from deep aquifers produces a more pronounced subsidence funnel that is positioned relatively deeper. At stability, the central subsidence zone along the vertical profile displays a “shallow bowl-shaped” distribution, with roughly equal extents of subsidence in the upper and lower sections. The adjacent lower aquitard exhibits a distinct “cone-shaped” heave near the pumping wells.
Based on the analysis of numerical simulation results, the spatiotemporal evolution patterns of land subsidence are summarized. The characteristics of deformation and subsidence, as well as the final stabilization time, are fundamentally consistent between deep and shallow aquifer extraction and align with the actual response mechanisms. When pumping occurs from the first aquifer, the underlying soil mass experiences heave. Furthermore, the region at the bottom of the pumped aquifer exhibits a characteristic deformation sequence of heave followed by subsidence. During extraction from different aquifer levels, the settlement deformation at the interface between the second aquifer and the overlying aquitard stabilizes earlier than at other locations. Soil deformation and subsidence originate from the reduction in pore water pressure and the consequent increase in effective stress within the pumped aquifer. This leads to cumulative deformation in both the aquifer itself and the adjacent aquitards. This deformation gradually migrates upward through the soil mass, ultimately propagating to the ground surface and reaching a stable state. Notably, the magnitude of land subsidence induced by pumping from the first aquifer is the smallest. This indicates that, under constant-head boundary conditions and with identical pumping rates, extracting relatively shallower confined groundwater has a lesser impact on land subsidence.

3.2.3. Impact of Pumping Volume and Well Layout

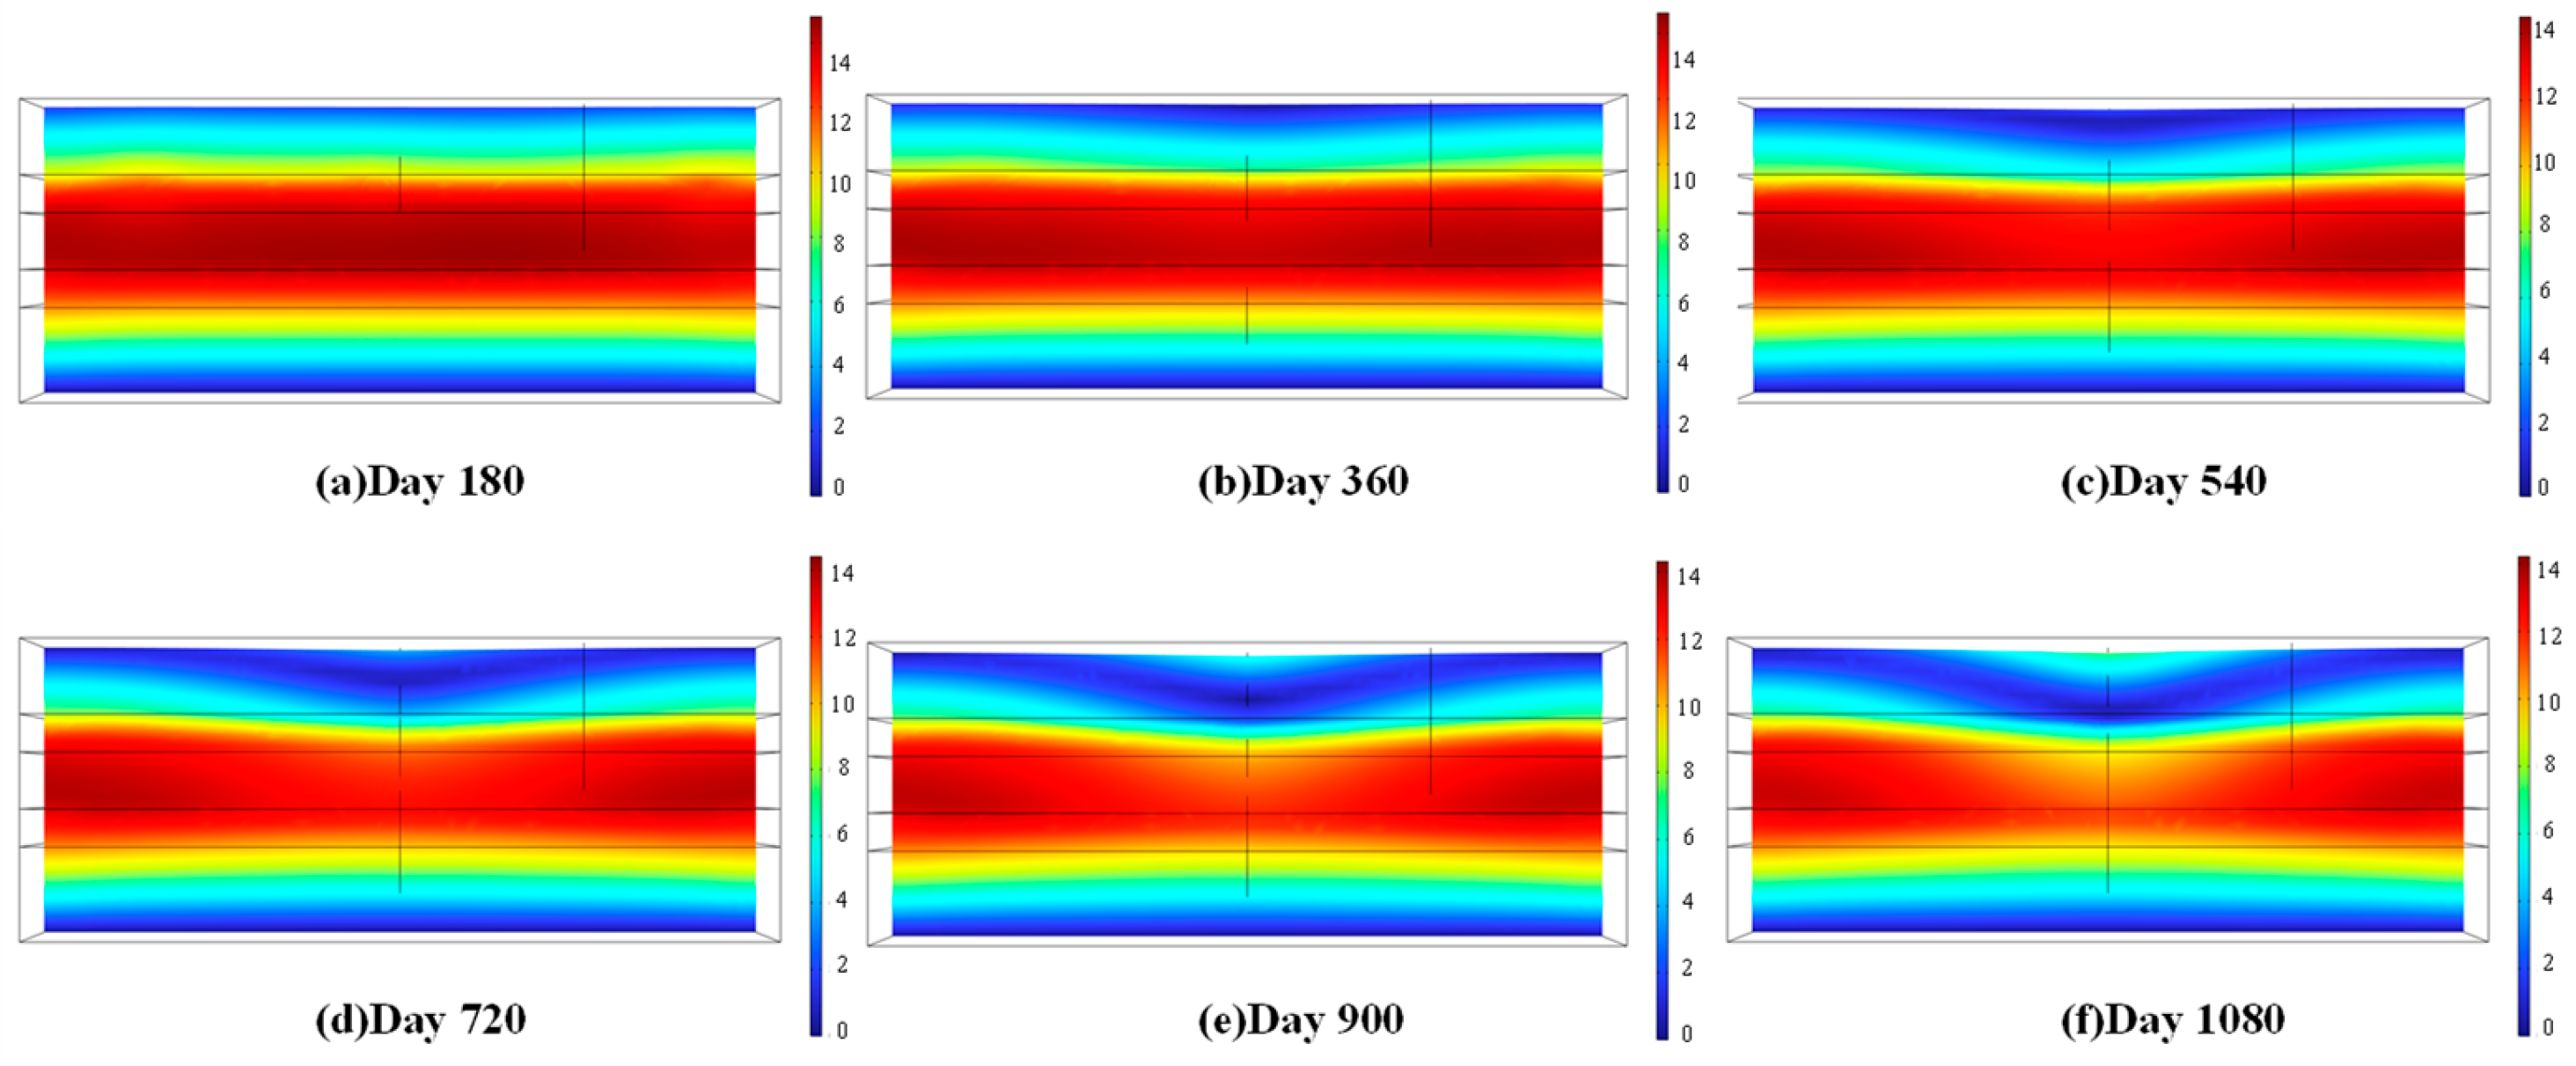
To investigate the evolution process of land subsidence in the Northwestern Plain of Shandong and examine the impact of varying pumping rates on subsidence, a simulation was set up involving a single pumping well penetrating to the second aquifer to simulate the extraction of deep groundwater. In COMSOL Multiphysics, a transient study was configured with six time intervals, during which the pumping rate was progressively increased at each stage. This setup was designed to simulate the influence of continuously increasing extraction rates on land subsidence (Figure 11).
The numerical simulation results for the period of 0–180 days under no pumping conditions show a baseline state with a uniform ground surface free from deformation and equilibrium of pore water pressure at zero extraction rate. During the 180–360 day period with an extraction rate of Q (initial value), initial subsidence manifests as a shallow bowl-shaped funnel with a central settlement of ΔS1 ≈ 50 mm and an influence depth of less than 50 m. From 360 to 540 days, with the extraction rate doubled to 2 Q, the subsidence expands with the funnel center shifting downward by 10 m, transforming into an asymmetric funnel morphology with an increasing proportion of deep compression. During the 540–720 day period, with the extraction rate tripled to 3Q, plastic deformation is triggered, characterized by a critical transition where the subsidence rate surges by ΔS540720 ≈ 120 mm and a deep shear zone develops at burial depths exceeding 100 m. When the extraction rate reaches 4Q during 720–900 days, multi-strata subsidence occurs with secondary settlement centers forming in shallow layers while the deep funnel exhibits a “narrow-neck flask” configuration with a depth-to-width ratio greater than 3. Finally, at 900–1080 days with the maximum extraction rate of 5Q, the land subsidence hazard fully develops with the surface settlement area expanding by 200%.
The evolutionary characteristics observed across these six stages clearly reveal a linear dynamic response between increasing pumping rates and the catastrophic progression of subsidence. The escalation in groundwater extraction is identified as the direct cause of accelerated land subsidence, providing a crucial theoretical basis for groundwater management and control in the Northwestern Shandong Plain. As pumping rates continue to rise, the subsidence development demonstrates a “deep-dominant” pattern—characterized by a vertically extended, narrow-neck flask-shaped funnel that is wider at the top and narrower at the bottom. This morphology reflects a significant enhancement of compression in deep soil layers. Concurrently, deep aquifer pumping induces water loss from shallow aquifers through leakage recharge effects, ultimately triggering a chain compaction process of multi-strata hydraulic interconnected subsidence.
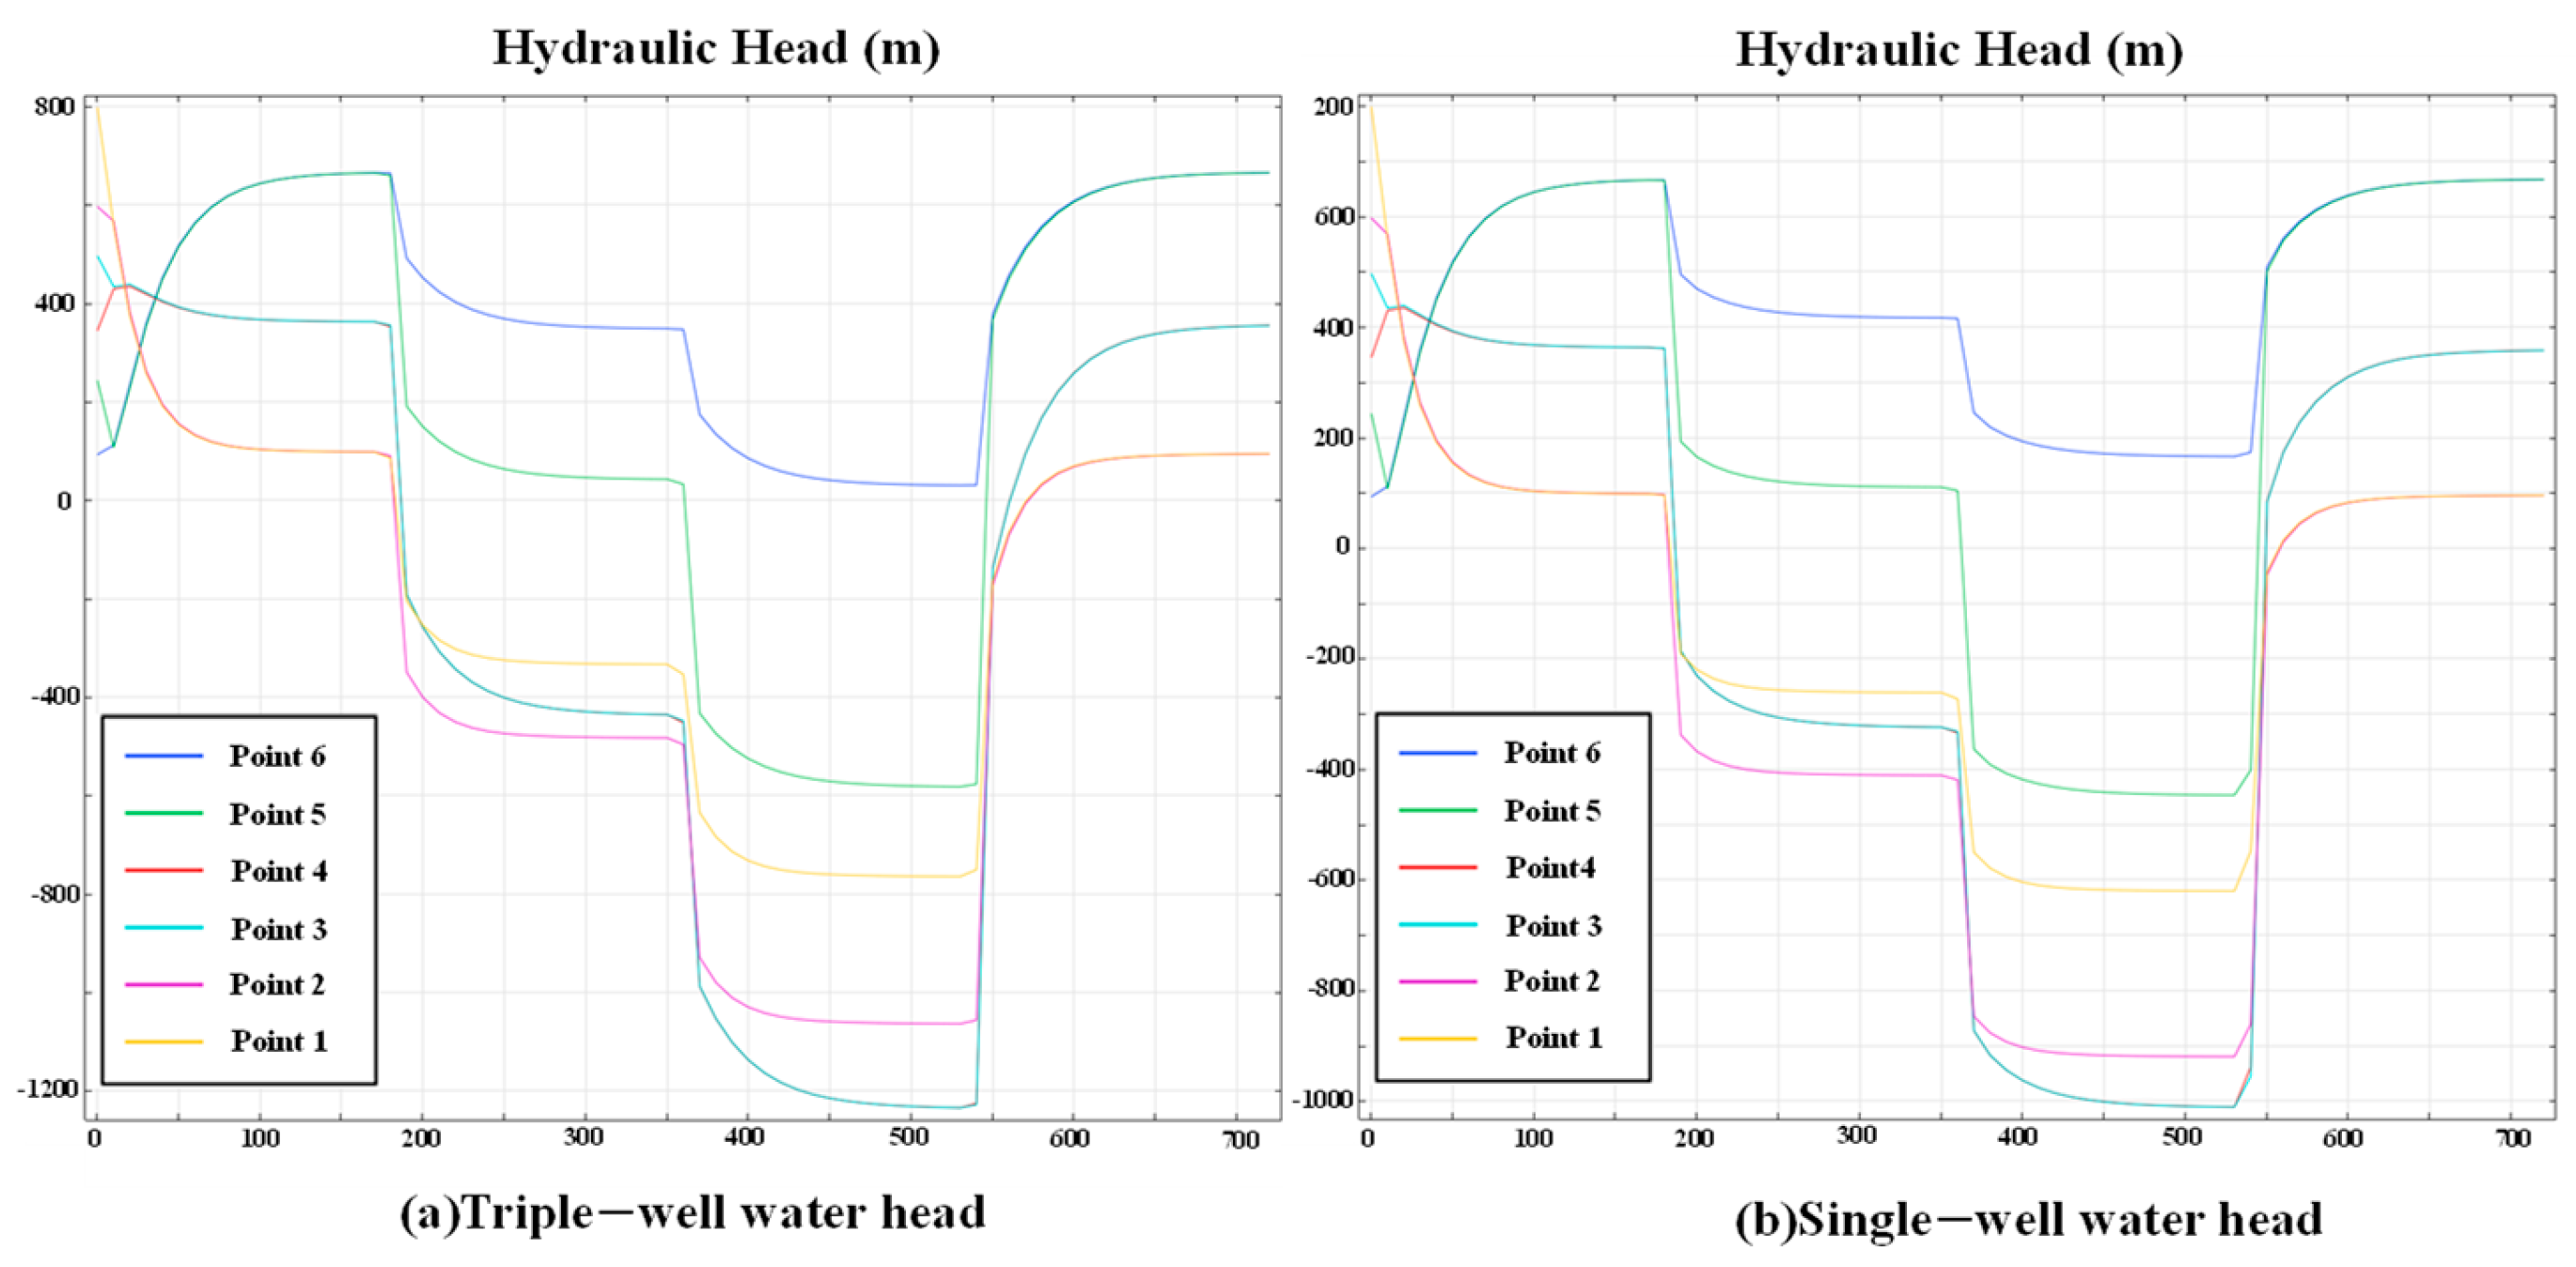
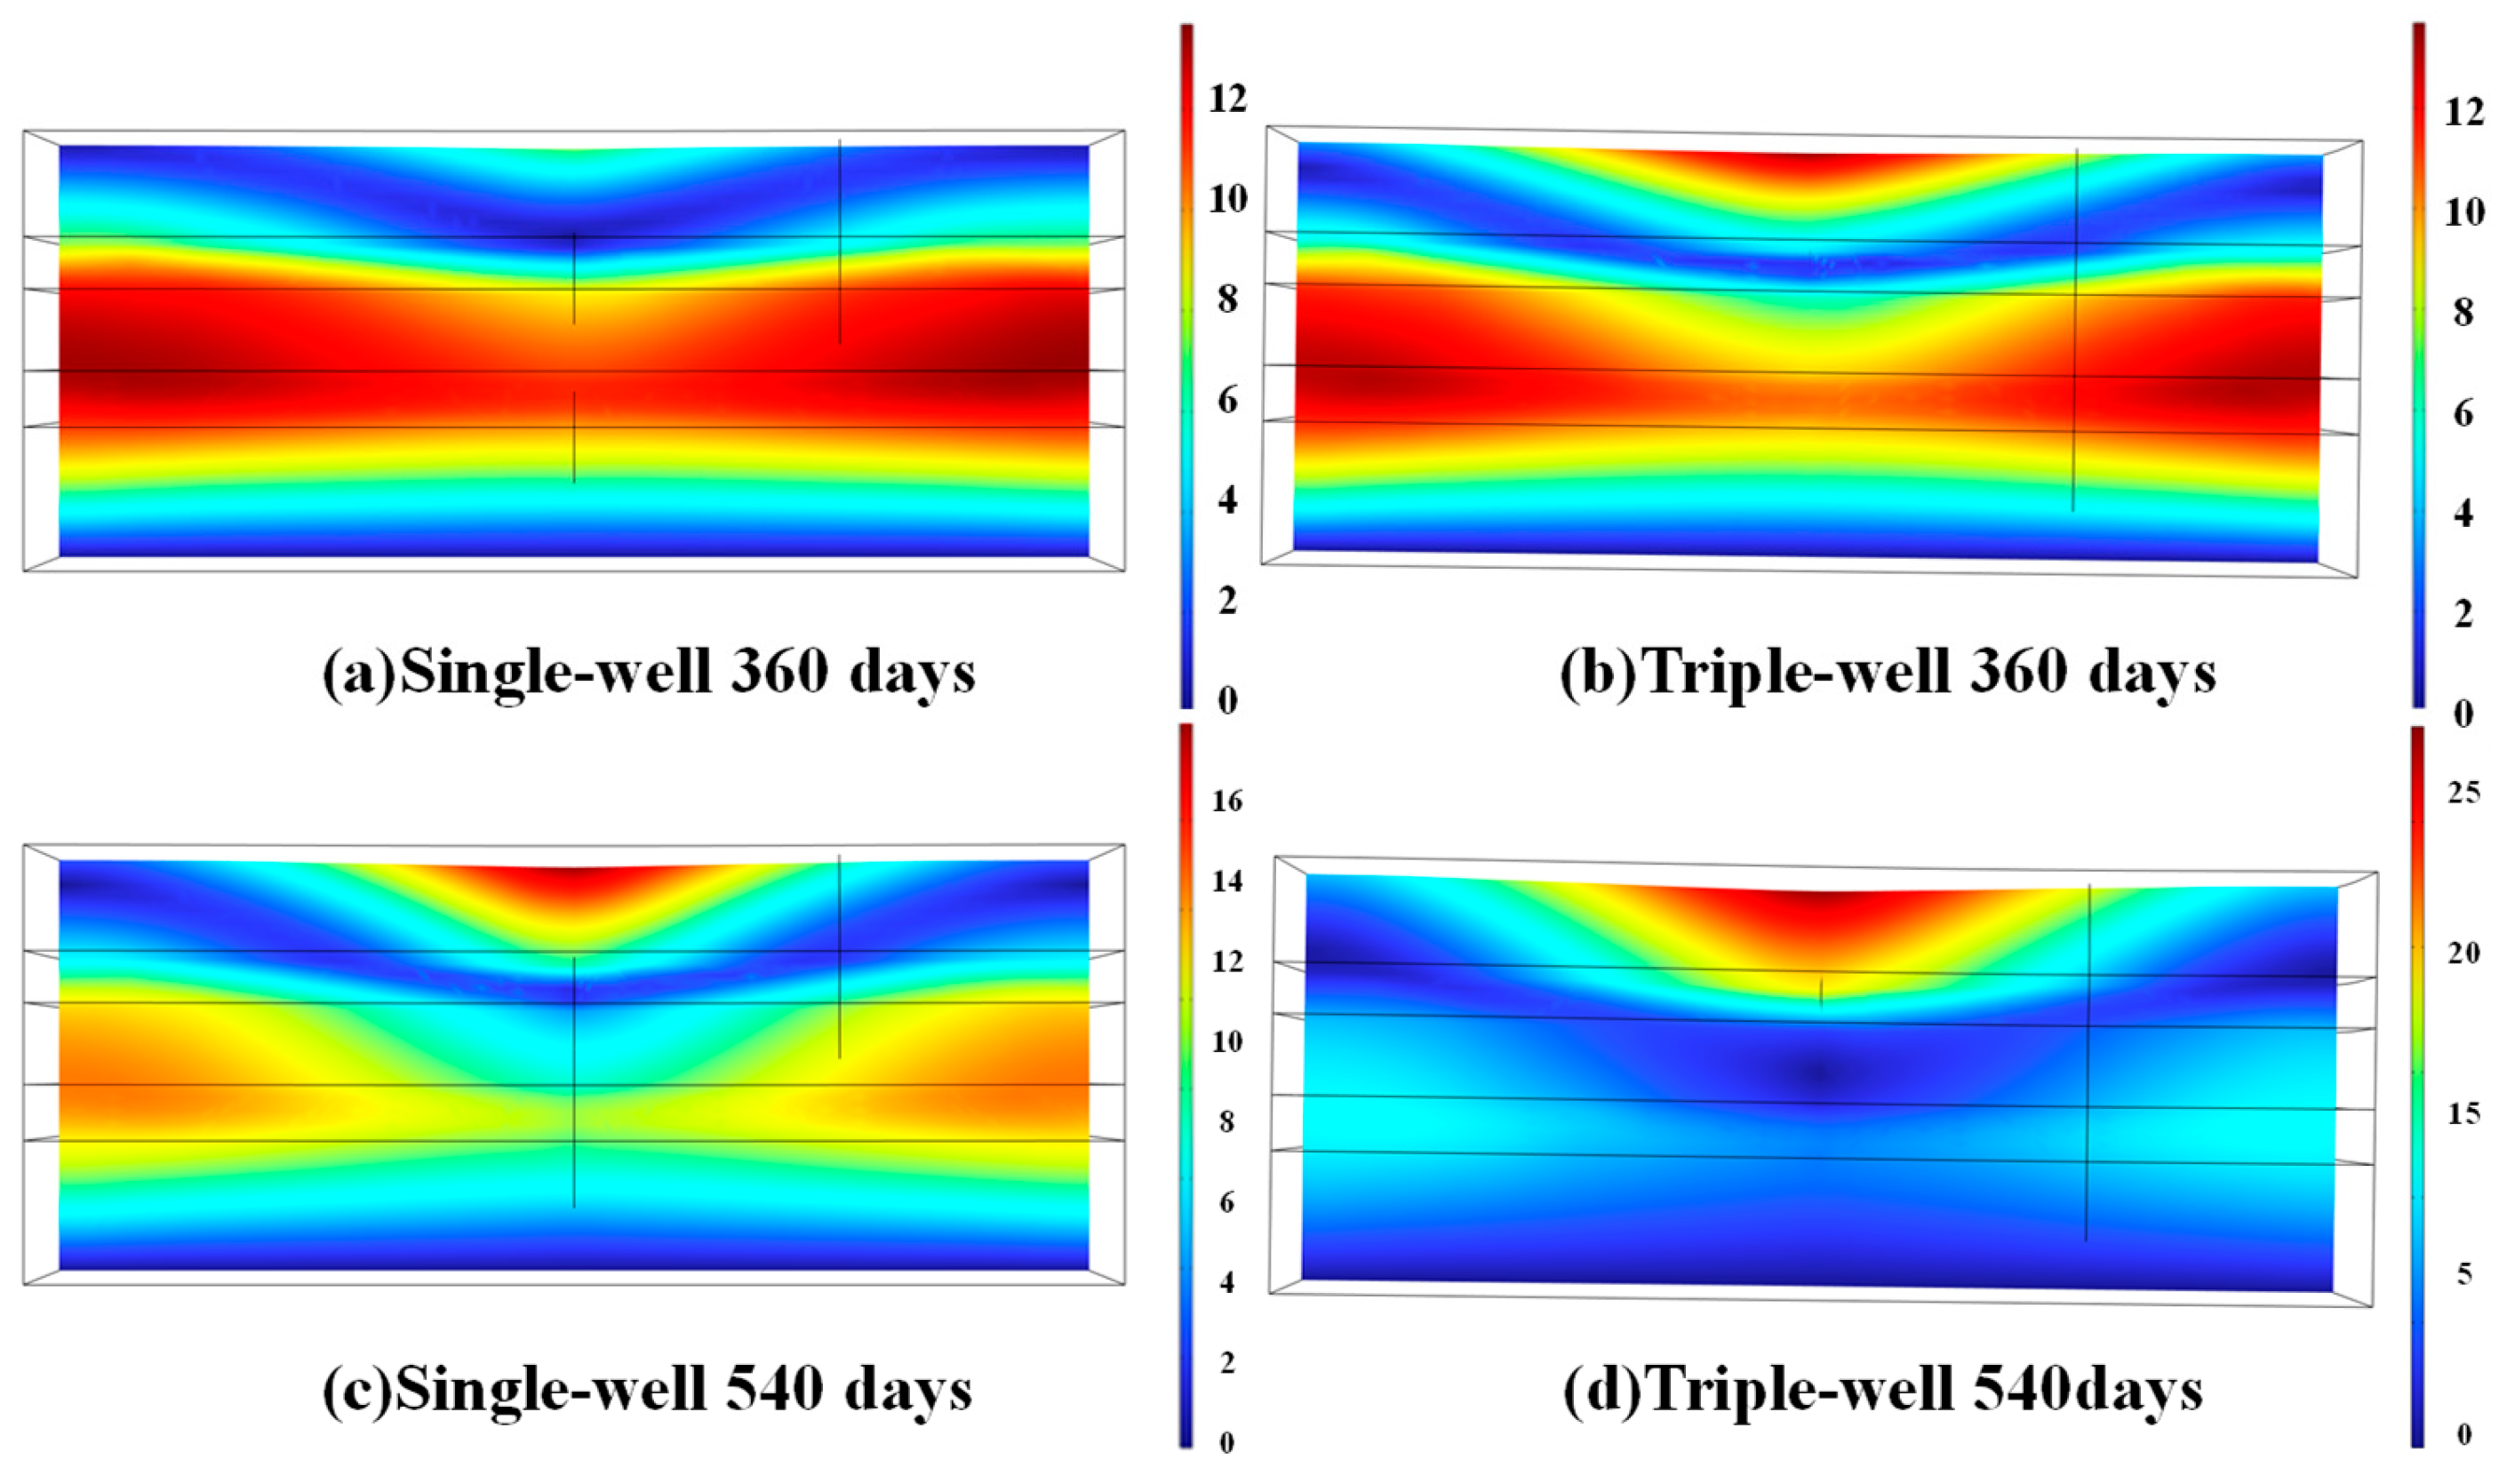
The groundwater extraction wells in Decheng District are predominantly concentrated around the peripheries of the groundwater depression cone and the land subsidence funnel (covering areas such as Decheng Urban Area, Chenzhuang, and Changzhuang), with fewer wells distributed in the outer regions. The excessive clustering of extraction wells directly drives the formation and evolution of these two types of cones. To address the issue of excessive land subsidence gradients under a constant total extraction volume, this study evaluates the potential of optimizing the spatial distribution of extraction wells and the allocation of extraction rates to achieve subsidence control. Based on the actual conditions of Dezhou City, the research focuses on Decheng District, where subsidence is most pronounced, to conduct a study on the optimization of the extraction well layout. The research methodology is as follows: First, the land subsidence process resulting from a single deep extraction well operating at a specific pumping rate for 540 days is established as the baseline scenario. Subsequently, while maintaining the total extraction volume unchanged, two additional wells of the same specifications are added near the baseline well to form a three-well cooperative extraction scenario (the spacing between extraction wells is set at 707.1 m, with the center point of the model’s top surface as benchmark point 1, and points 2 to 6 set sequentially at depths of 200 m, 100 m, 150 m, 100 m, and 150 m below). By simulating the subsidence process over 540 days under the three-well scenario, differences in head distribution (Figure 12) and subsidence characteristics (Figure 13) between the three-well and single-well scenarios are compared and analyzed, thereby revealing the effectiveness of layout adjustment for subsidence control.
Comparative analysis indicates that under the constraint of a constant total extraction volume, changing the extraction pattern from three concentrated wells to a single well leads to an increase in hydraulic head measurements at every monitoring point. This demonstrates a rise in groundwater levels, which effectively slows the subsidence rate and significantly reduces the subsidence gradient in the central settlement zone. After increasing the distribution spacing of extraction wells, the water levels at the centers of the groundwater depression cones in both the first and second aquifer groups show elevation, while the hydraulic gradient decreases throughout the simulated domain. Therefore, optimizing the planar layout of extraction wells plays a significant role in controlling the development of depression cones in both aquifer groups and mitigating land subsidence.

3.2.4. Model Predictions

The COMSOL Multiphysics 6.2 was employed to simulate the impact of extraction prohibition on land subsidence. Based on studies of land subsidence trends induced by groundwater extraction, the model utilizes a single well extracting deep groundwater to more accurately simulate the effects of extraction prohibition. The model boundaries were set as constant-head conditions. A mass flow rate per unit length was specified in the well, which initially increases gradually over time and then abruptly drops to zero, simulating the entire process of continuously increasing groundwater extraction followed by the implementation of an extraction ban. This numerical experiment effectively characterizes the coupled response and its evolution between changes in the groundwater flow field and stratum deformation in the context of extraction prohibition.
The extraction rate of the well was set to zero, meaning the mass flow rate per unit length in the well was specified as 0, to simulate the natural subsidence behavior of the 800 m deep formation under the influence of the boundary head conditions. As shown in Figure 14, it can be observed that even in the absence of pumping, very slight land subsidence occurs. The greatest amount of subsidence is observed in the third layer, which has the highest hydraulic conductivity.
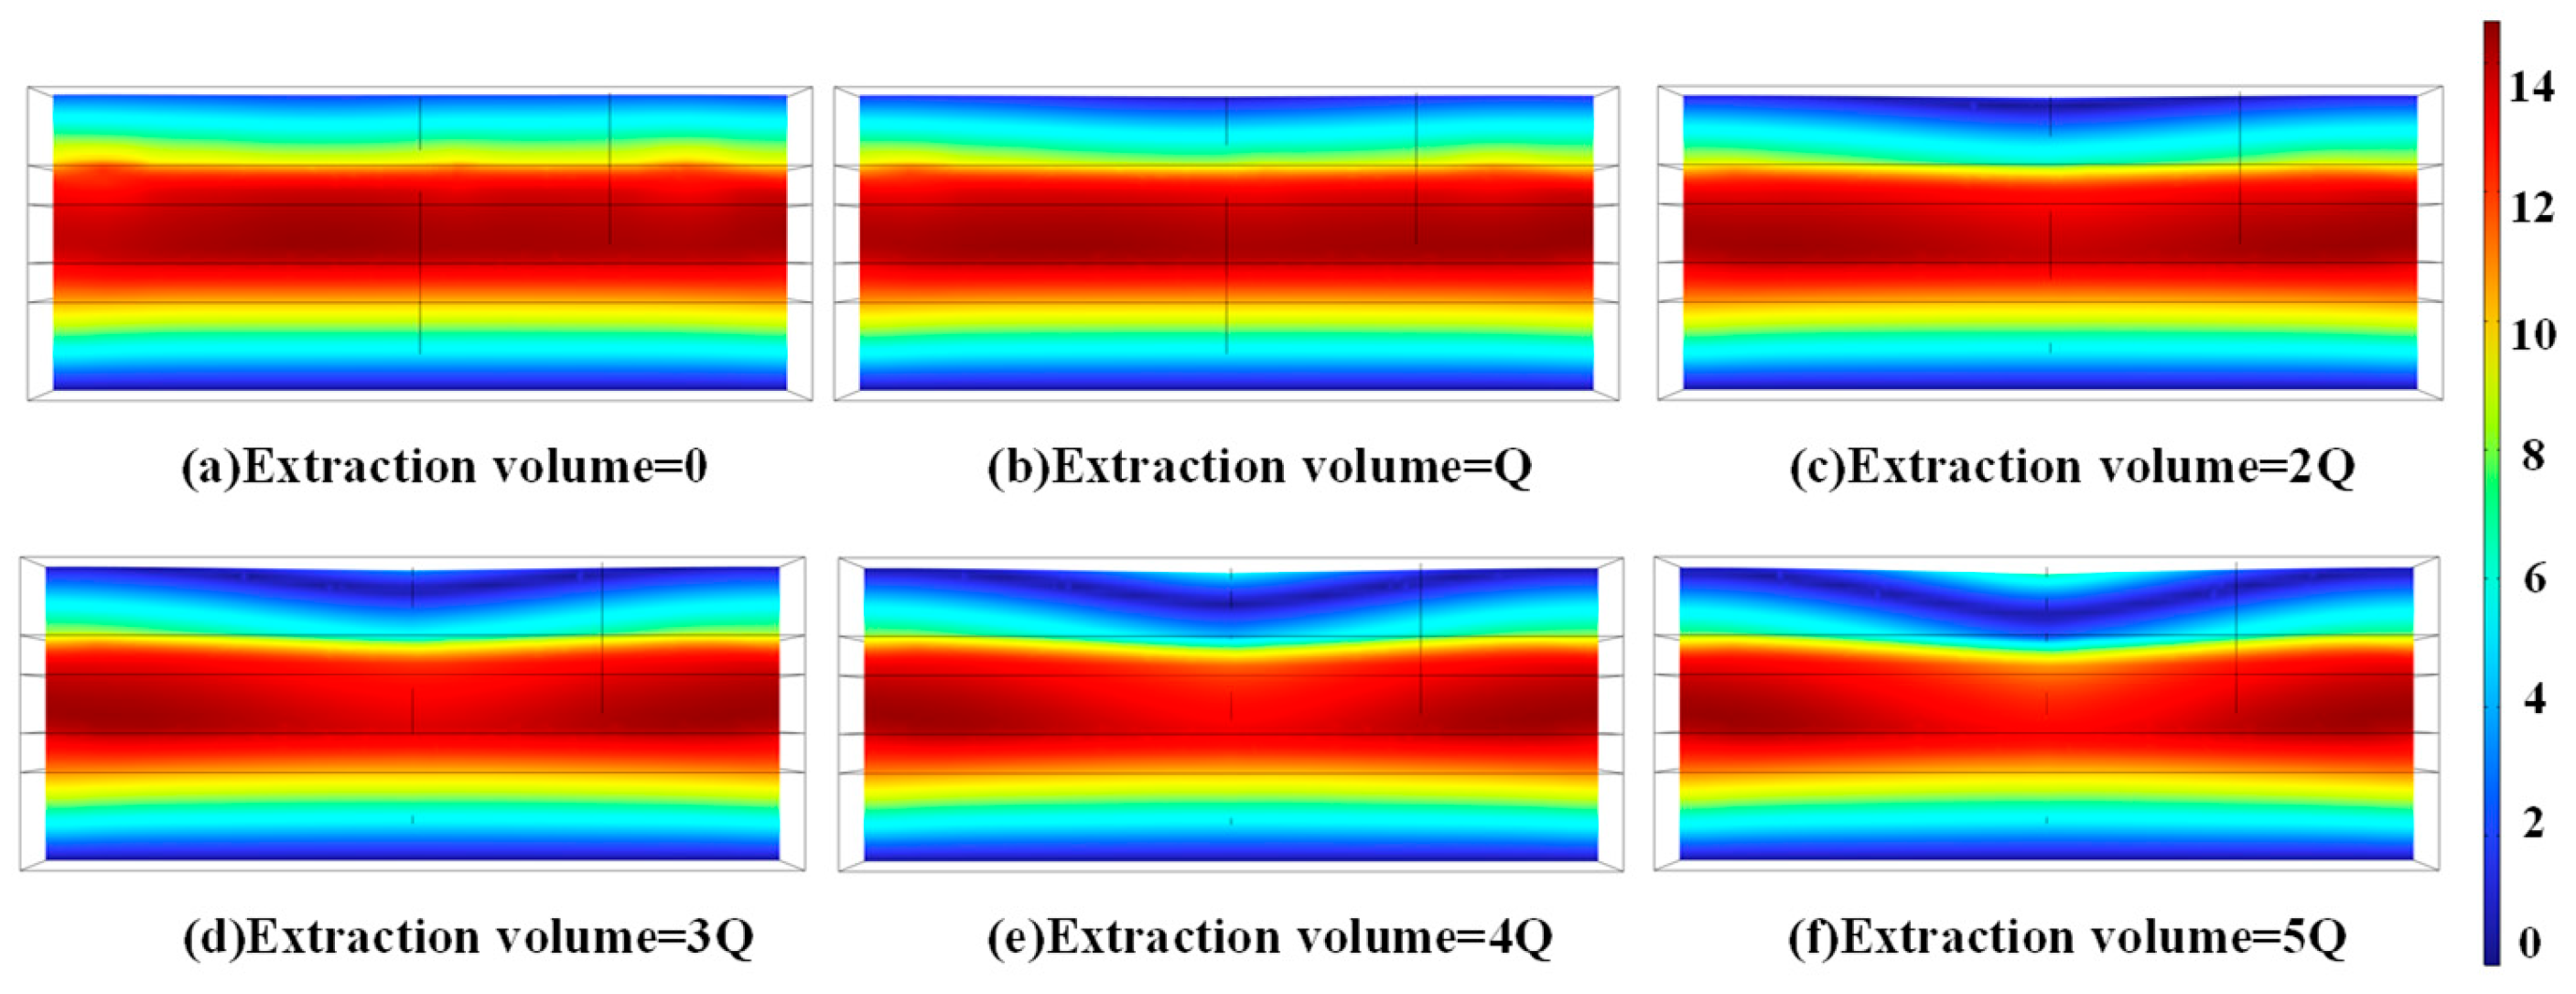
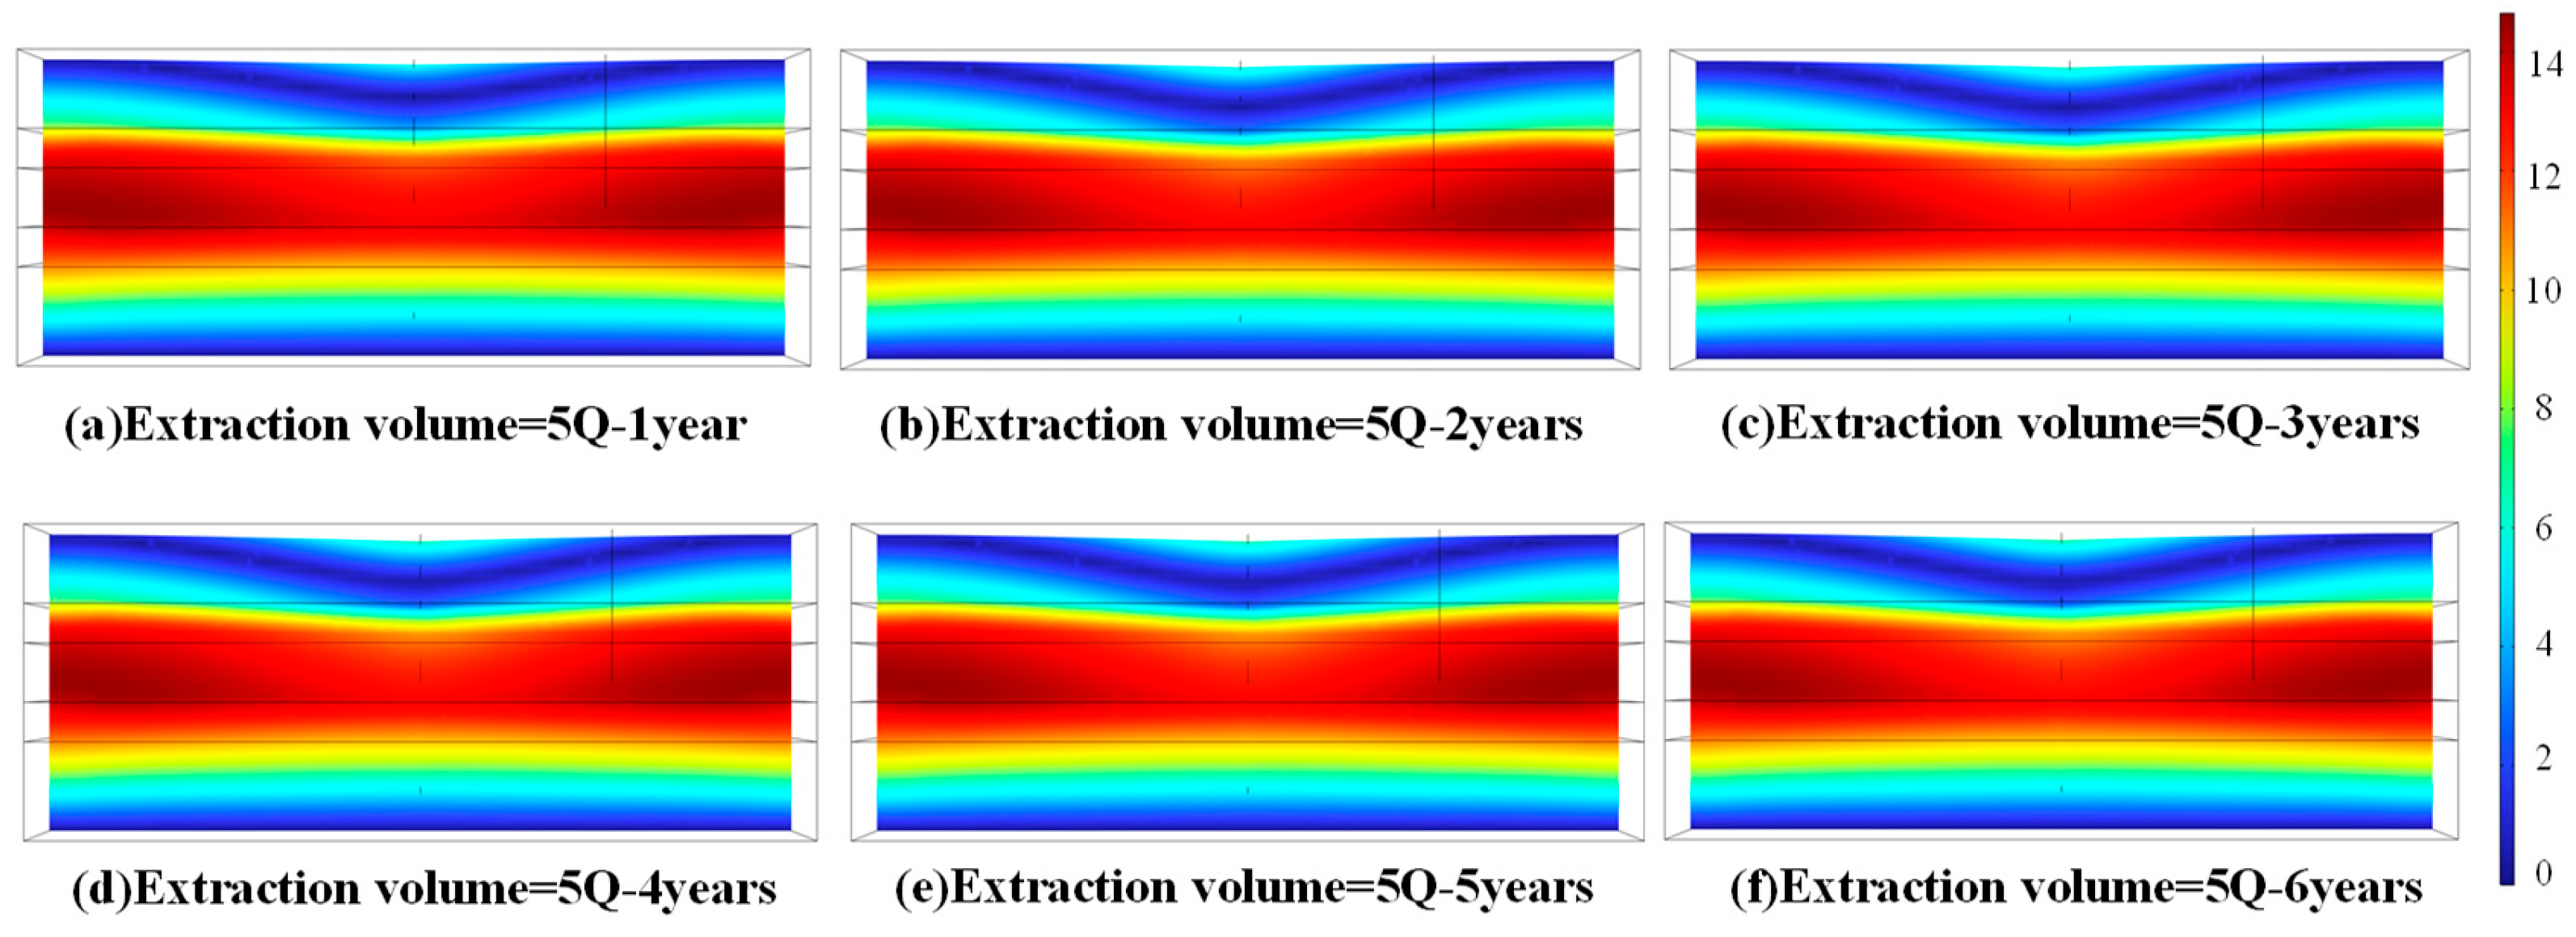
A single-well model was employed to simulate the process of deep groundwater extraction. To more intuitively analyze the displacement response of subsurface strata, the pumping rate of the extraction well was set to increase incrementally from zero through five discrete stages. As shown in Figure 15, with each successive increase in the pumping rate, the land subsidence funnel gradually forms and expands. The most pronounced settlement is observed in the immediate vicinity of the well, and the overall subsidence effect becomes increasingly evident. During periods when the pumping rate is held constant, the initial abrupt change in extraction causes a relatively high subsidence rate, leading to accelerated land subsidence. Subsequently, under sustained extraction at the same intensity, as the groundwater recharge rate gradually reaches a dynamic equilibrium with the pumping rate, the land subsidence rate decreases significantly (Figure 16).
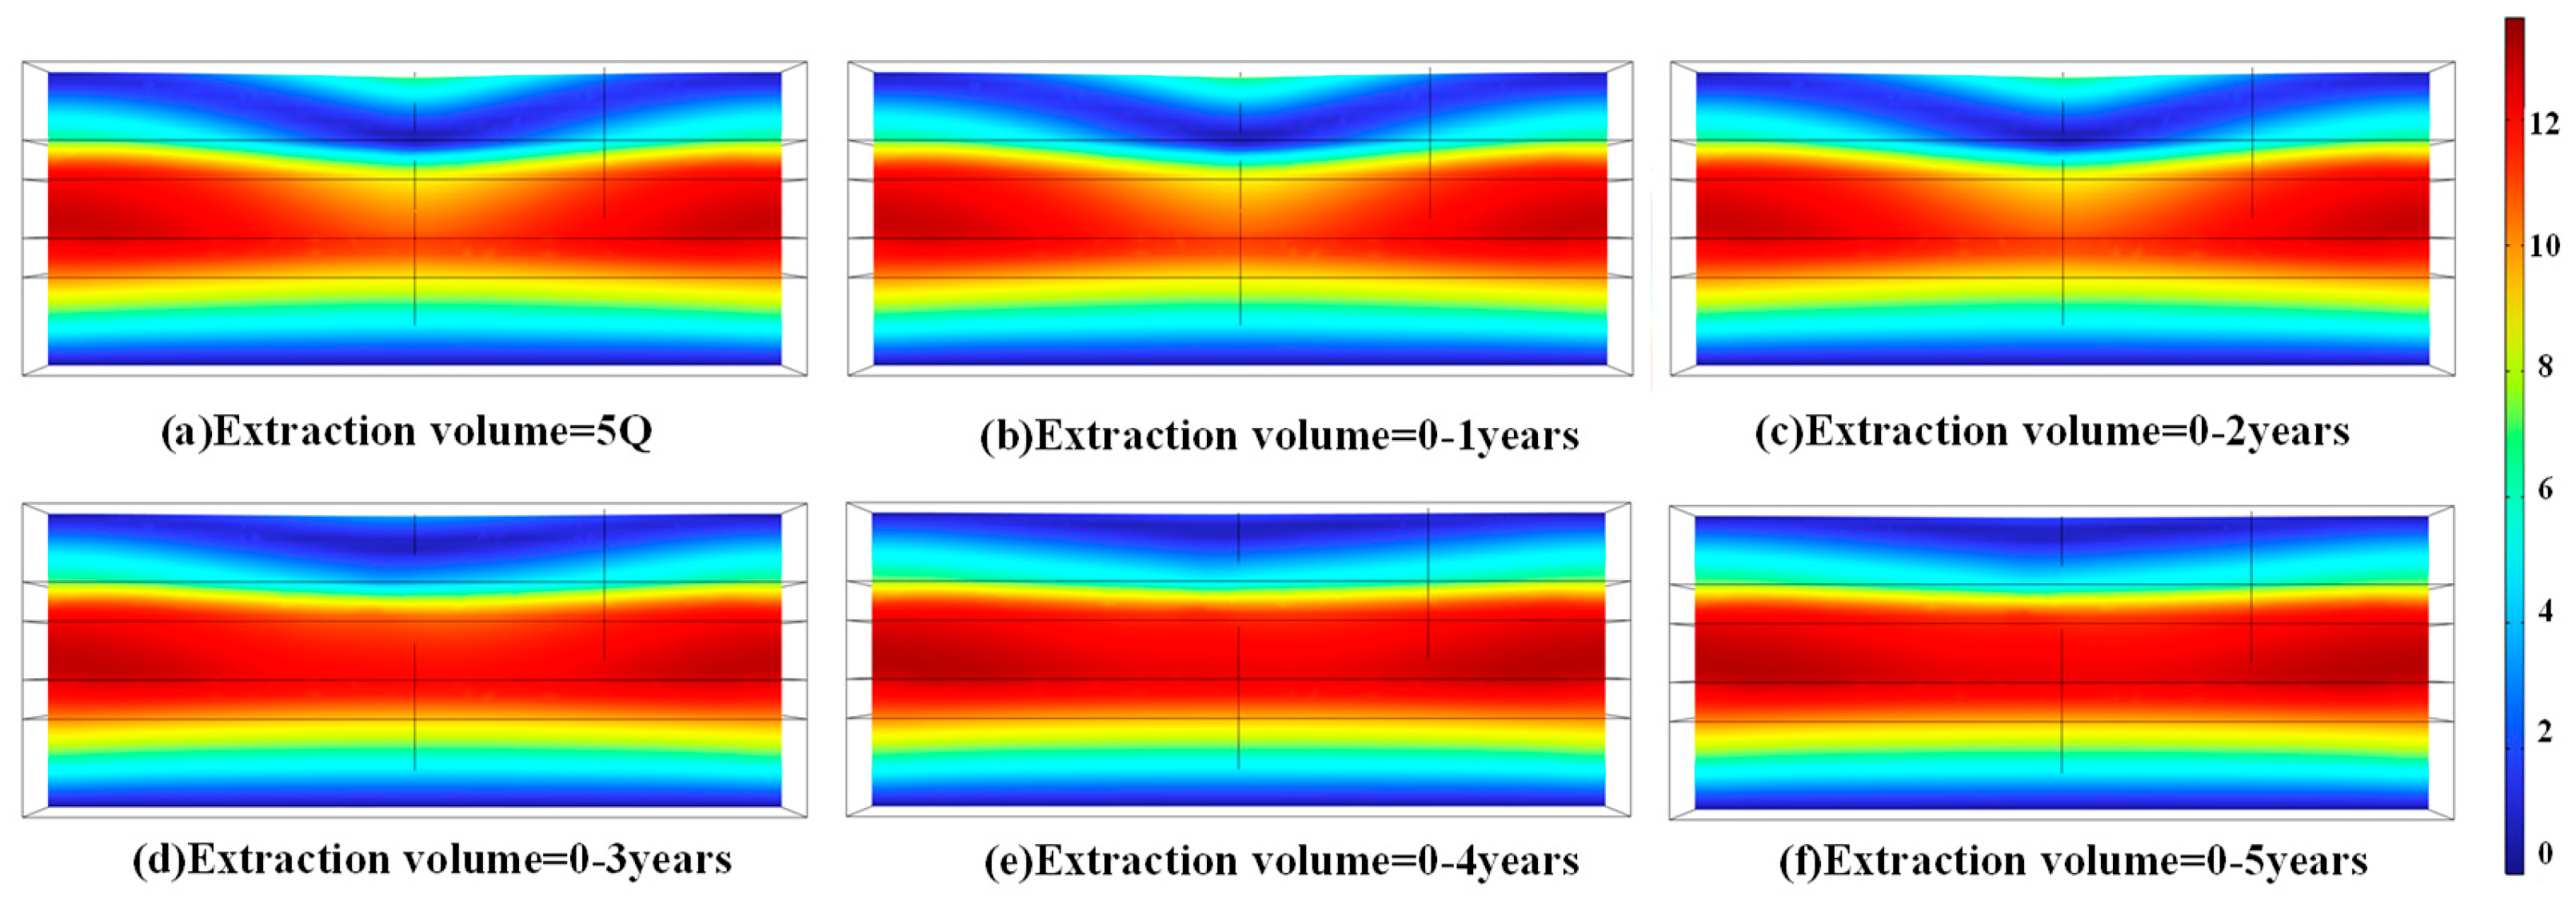
Observation of stratigraphic changes was conducted five years after implementing extraction prohibition measures in formations experiencing excessive deep groundwater extraction, to predict the impact of extraction prohibition on land subsidence. According to Figure 17, in the short term following extraction prohibition, the land subsidence rate decreases significantly, and the shape of the subsidence funnel remains stable. Under prolonged extraction prohibition, the land subsidence funnel gradually recovers, and the land subsidence begins to show a rebound trend. Analysis based on the land subsidence statistical histogram and numerical simulation results indicates that extraction prohibition can substantially reduce the rate of land subsidence. Although prolonged extraction prohibition may induce rebound in the already subsided strata, it is unlikely to restore the ground to its pre-extraction elevation.
Based on the analysis of historical monitoring data regarding variations in groundwater depth and corresponding settlement at monitoring points, combined with numerical simulation results of both short-term and long-term extraction prohibition scenarios, the effectiveness of extraction prohibition policies in controlling land subsidence can be predicted. In the short term following the implementation of extraction prohibition, land subsidence does not cease immediately, but the subsidence rate decreases significantly with minor fluctuations. This reflects a lag period of approximately five years in the land subsidence response to water level changes caused by extraction, even after groundwater extraction has ceased. Under long-term extraction prohibition, the groundwater system gradually recovers equilibrium. The spatial extent of land subsidence progressively contracts, and some areas even exhibit a trend of uplift. The results demonstrate that extraction prohibition measures can effectively slow the subsidence rate and induce a certain degree of stratum rebound. However, due to constraints such as irreversible compaction from historical over-extraction, the self-weight stress of the strata, and plastic deformation of aquifers, the magnitude of rebound is limited, making it difficult to fully restore the ground to its pre-extraction elevation. Nevertheless, extraction prohibition significantly inhibits the progression of subsidence and promotes a slight yet distinct rebound of the strata, demonstrating its positive effect in controlling land subsidence and facilitating the restoration of the geological environment. It is recommended that future work integrate long-term monitoring with multi-factor coupled simulations to further evaluate the recovery potential of extraction prohibition policies under different geological conditions.

3.3. Evolution Law of Land Subsidence

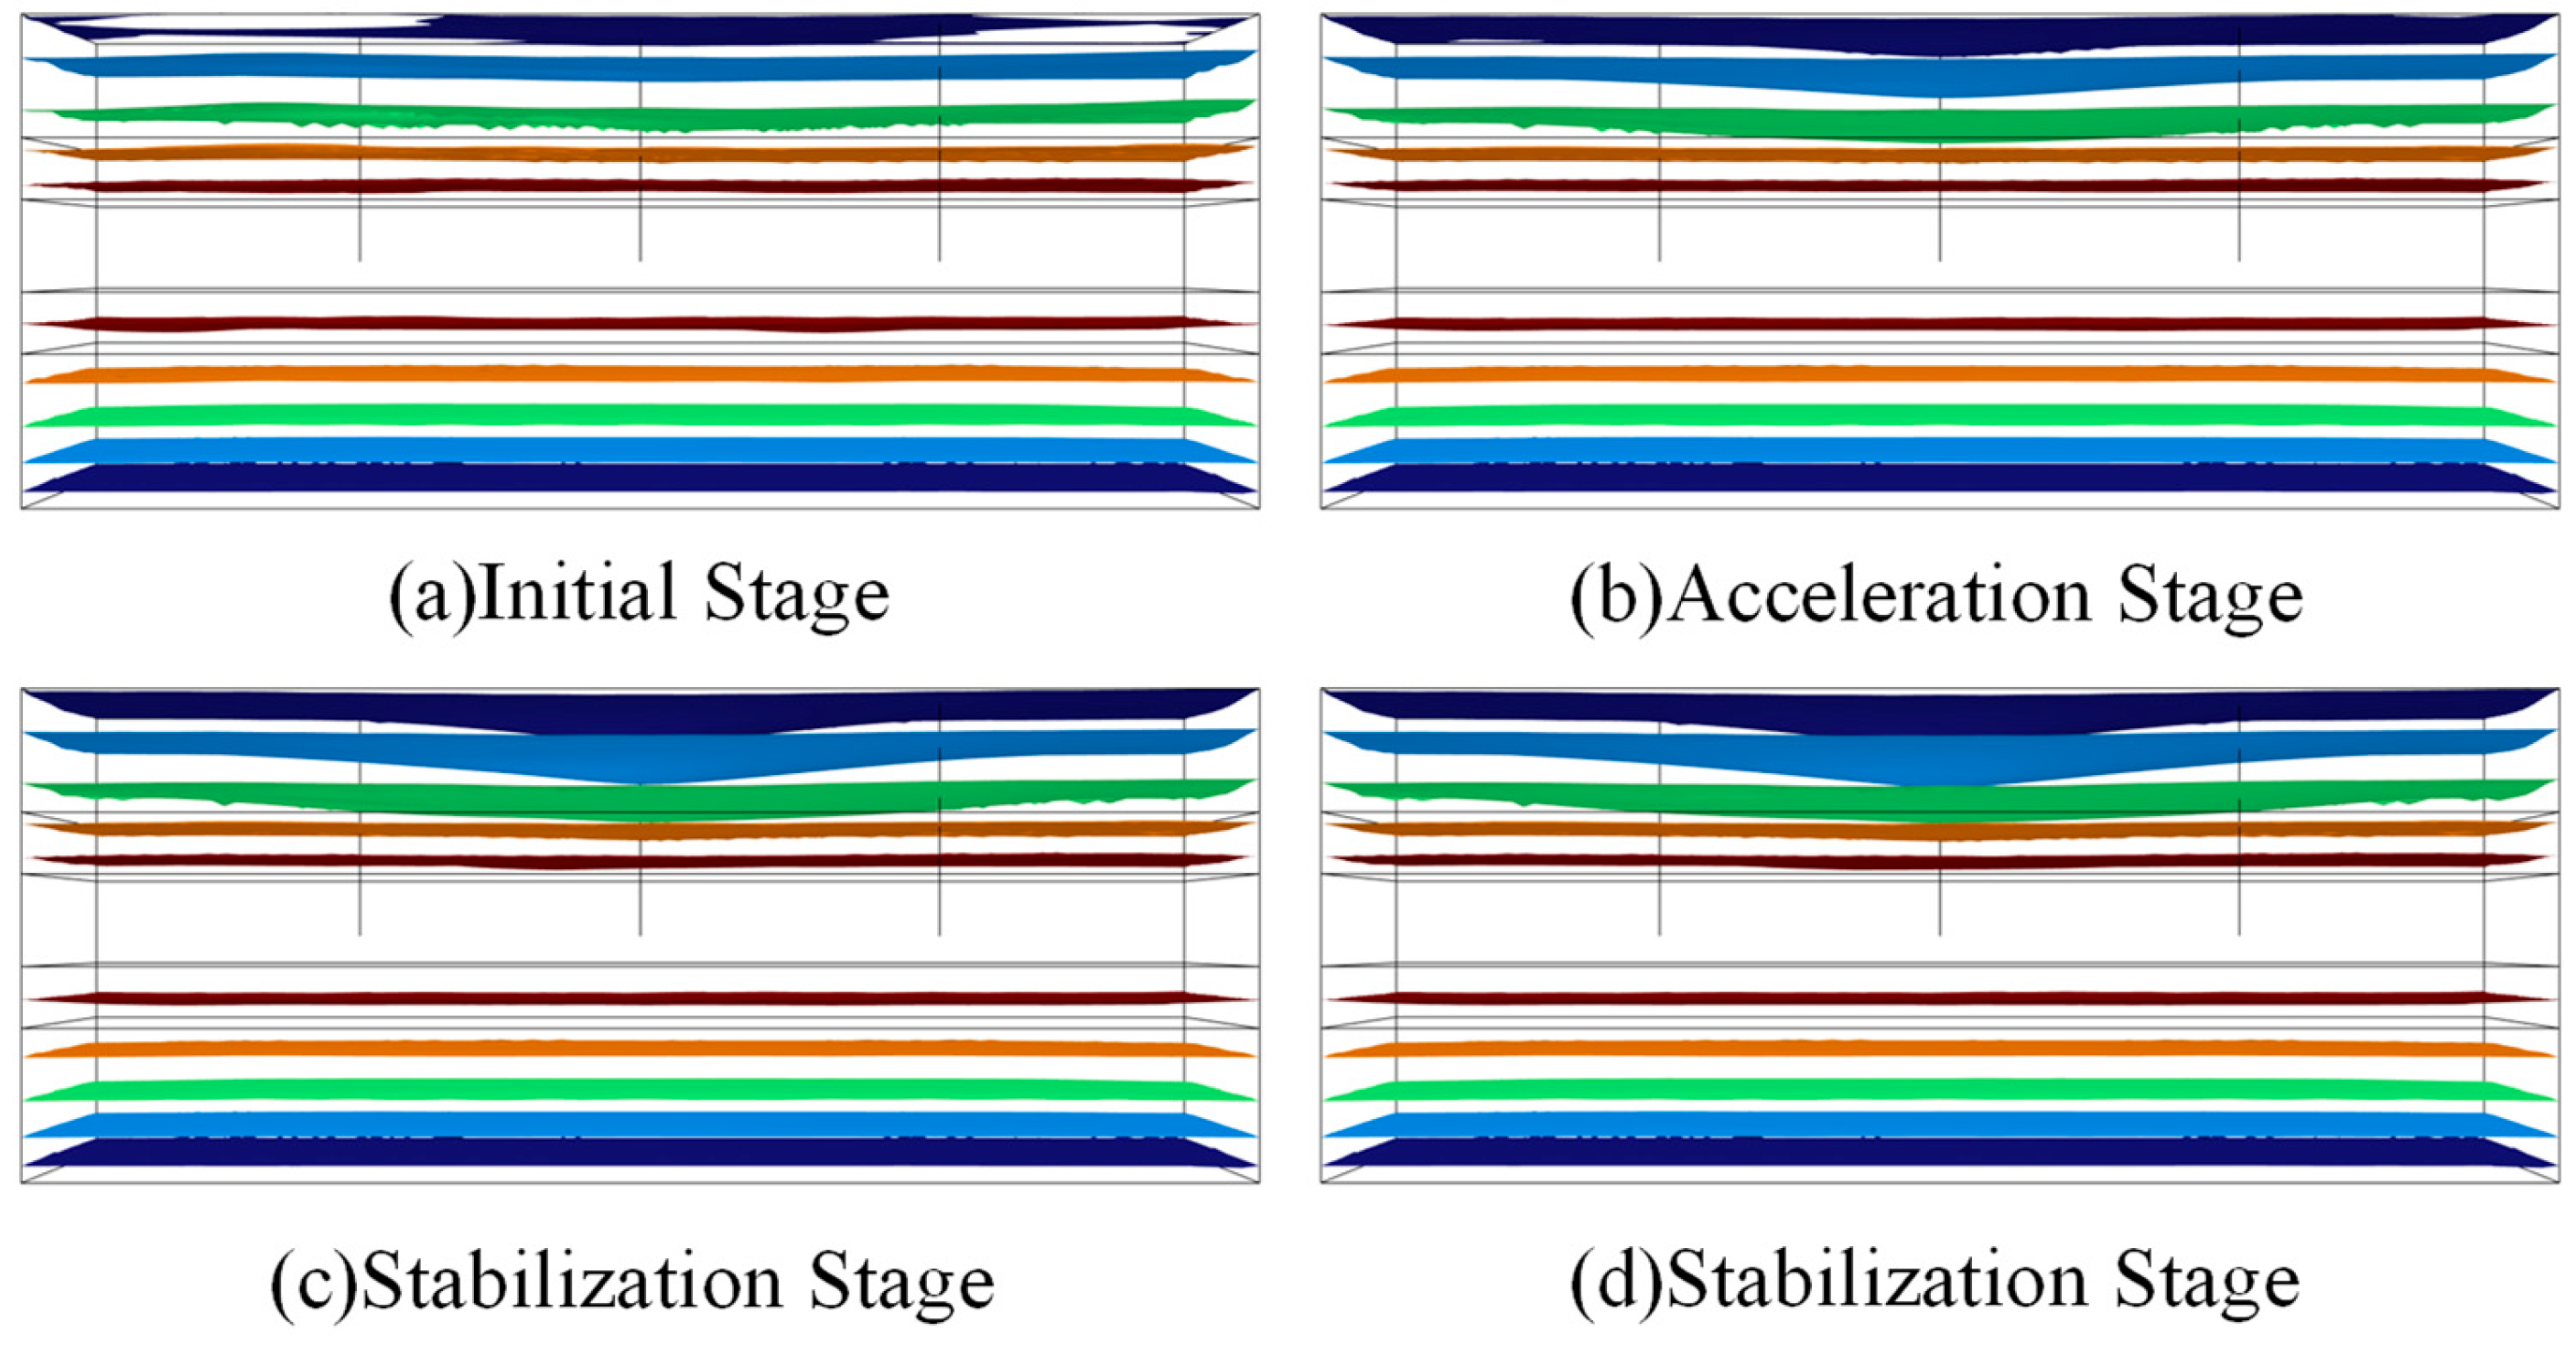
The evolution process of land subsidence in Decheng District can be roughly divided into the following stages.
In the initial stage (Figure 18a), at this stage, the signs of land subsidence are not obvious, but geological conditions and human activities have begun to lay the foundation for the occurrence of subsidence. The regional geological conditions are complex, and there are easily compressible strata such as soft soil, and human activities such as groundwater exploitation are also increasing [34].
In the acceleration stage (Figure 18b), with the continuous increase in groundwater exploitation, the groundwater level gradually decreases, which leads to the decrease in pore water pressure in the soil layer, the consolidation and compression of the soil layer, and the ground settlement begins to accelerate. In addition, unreasonable land use and water conservancy projects may also aggravate the process of land subsidence.
In the stabilization stage (Figure 18c,d), after the land subsidence reaches a certain level, the speed of land subsidence may gradually stabilize due to the gradual slowdown of soil compression and the adjustment of human activities (such as restricting groundwater exploitation and implementing the overall land use planning). However, in some cases, if human activities continue to exert pressure on the geological environment, land subsidence may continue at a faster rate.
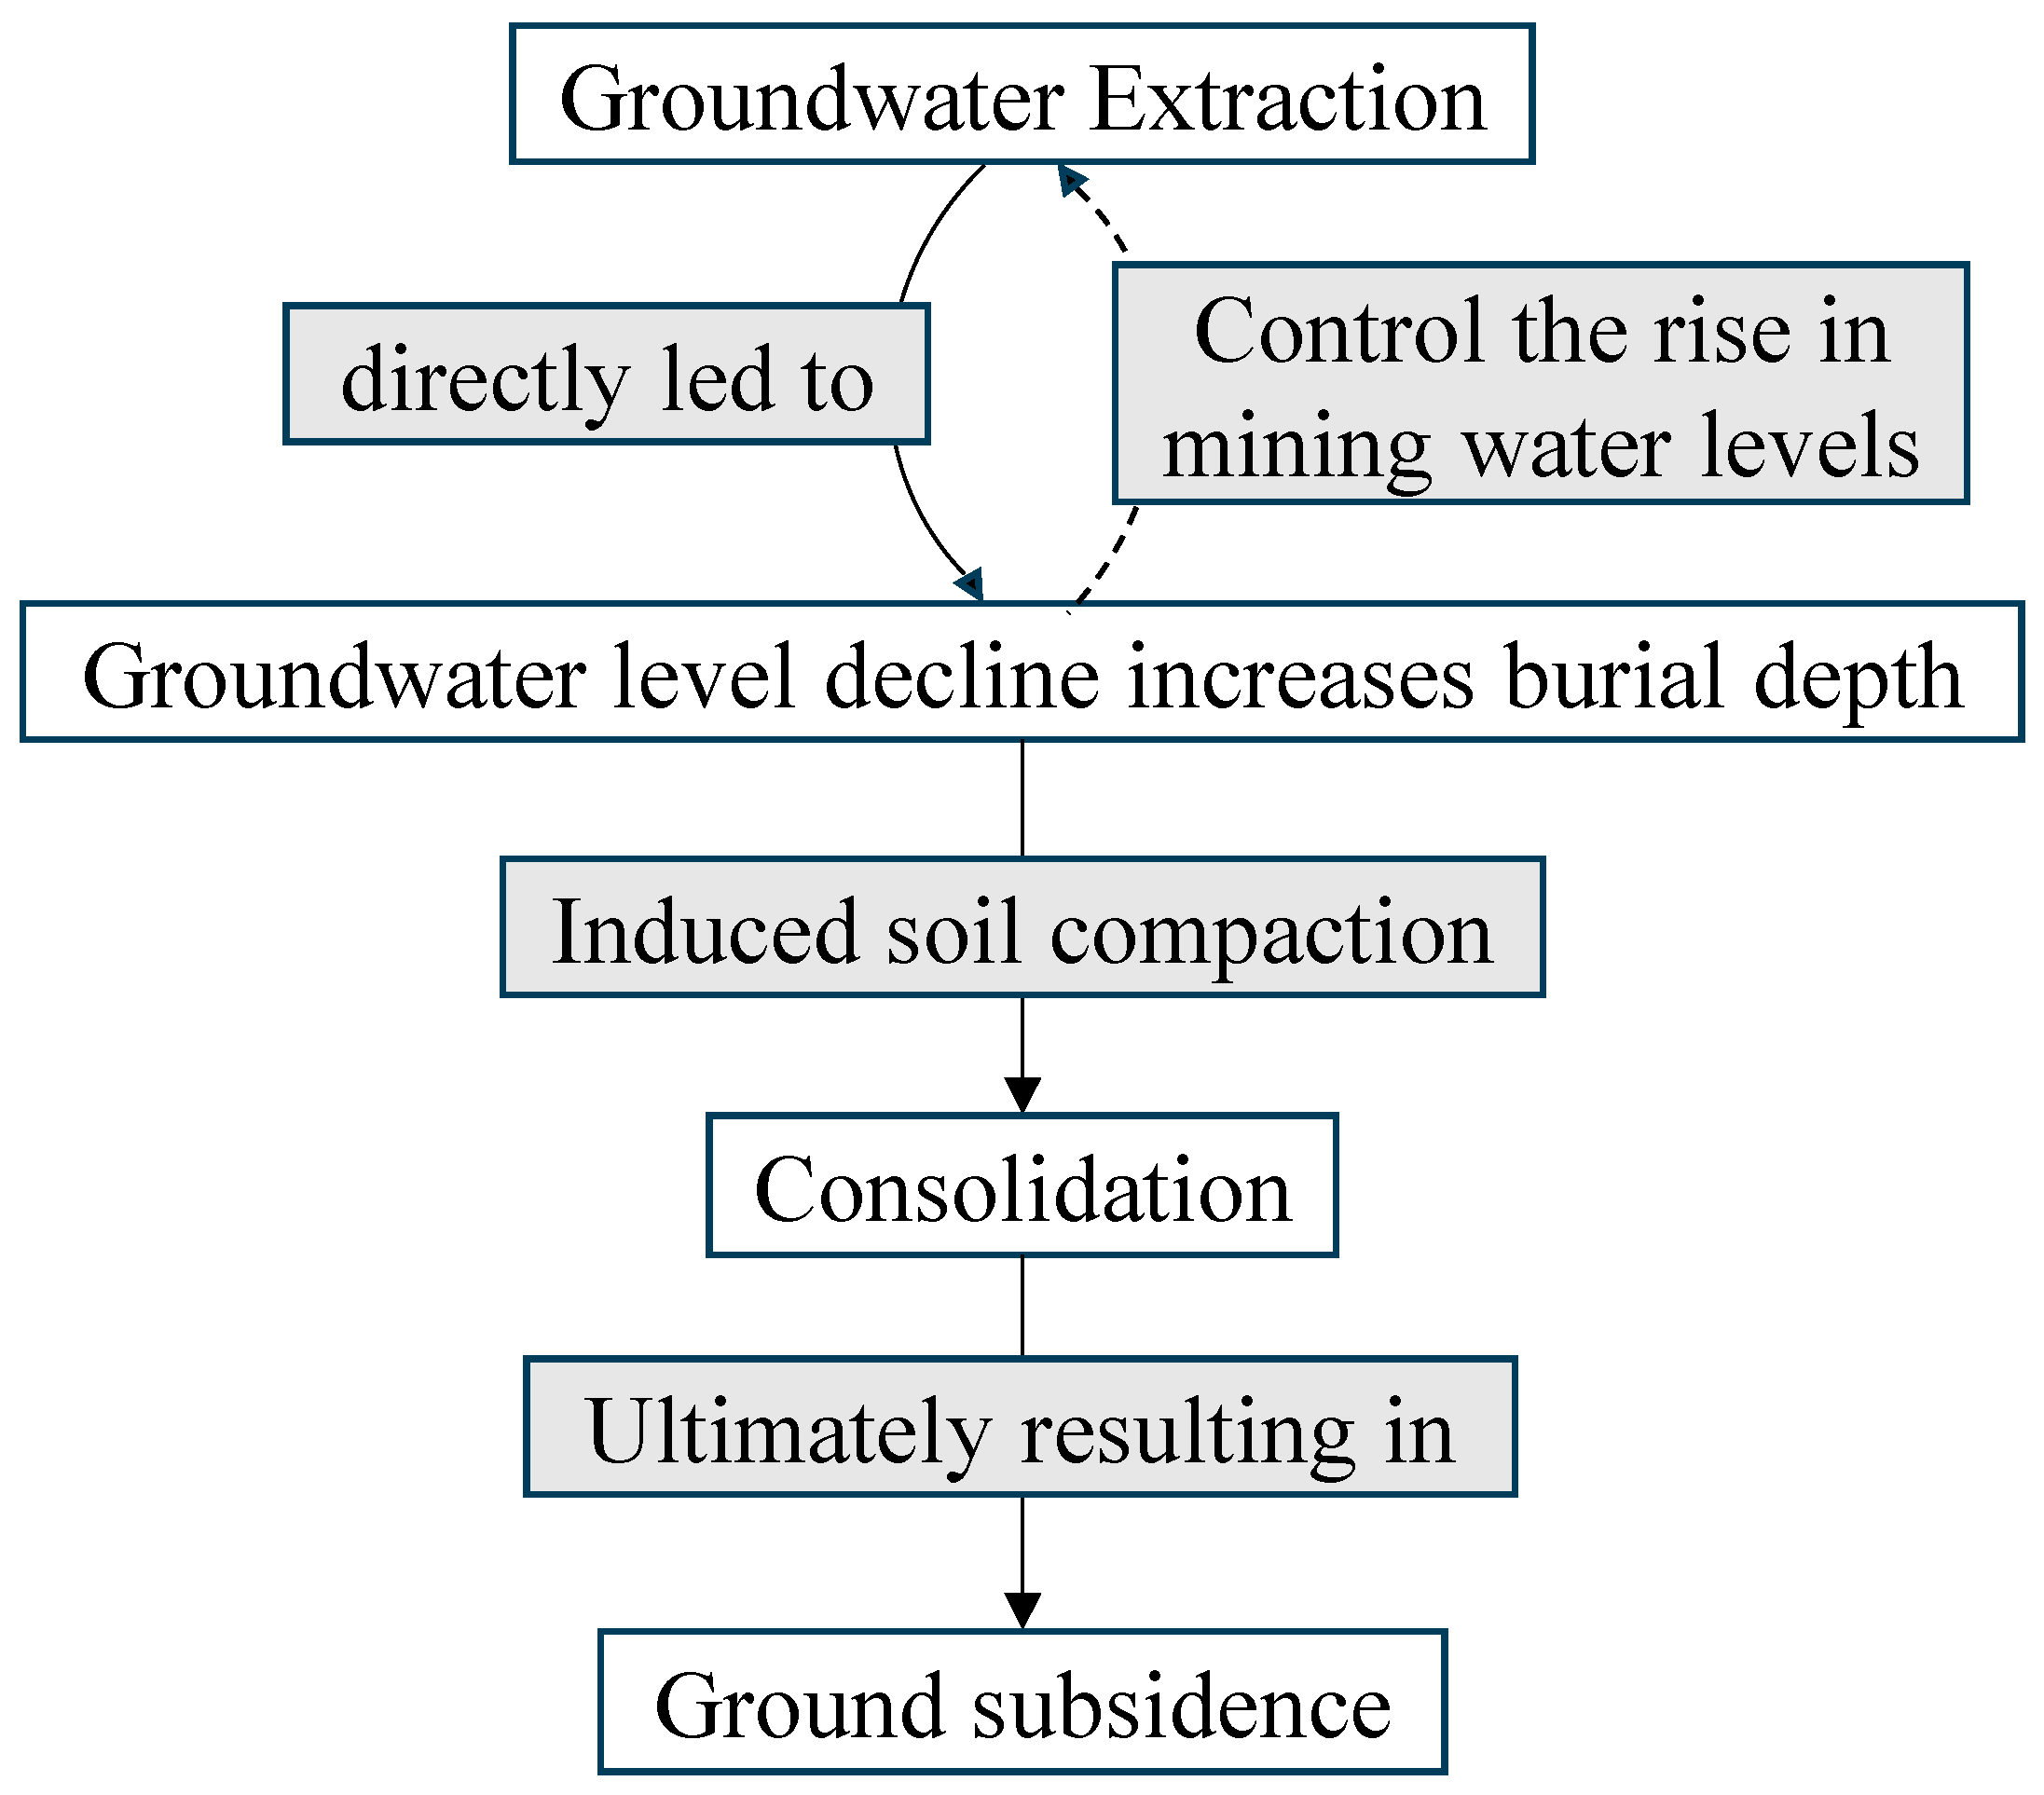
Groundwater exploitation, groundwater level change and land subsidence constitute a direct “drive-response-effect” causal chain (Figure 19). The core relationship can be summarized as follows: artificial exploitation is the initial driving force, which breaks the natural balance of the groundwater system, causes the groundwater level to drop, and leads to an increase in the effective stress of the aquifer and its overlying soil layer, thus causing compaction consolidation, which is directly manifested as land subsidence on the surface.
Although shallow groundwater exploitation will cause the water level to drop, its direct impact on land subsidence is weak. After 2020, shallow mining is limited, and the subsidence rate of water level rise slows down, which shows that it still has a certain regulatory effect. Deep groundwater exploitation is the main controlling factor of regional land subsidence. From 2007 to 2010, the deep mining was large and the subsidence rate was high; Although mining decreased during 2010–2021, the settlement continued to increase, reflecting the obvious lag of settlement response. After 2021, the deep mining is extremely low, and the settlement rate slows down significantly, indicating that controlled mining is an effective means to curb settlement. To sum up, groundwater exploitation, especially deep mining, is the key factor driving regional land subsidence. Although reducing mining cannot immediately inhibit subsidence, long-term mining control can significantly promote water level recovery and slow down the subsidence process, which has important regulatory significance.

3.4. Inspiration of Land Subsidence to Groundwater Management

Groundwater level decline is the primary cause of land subsidence. Tokyo and Osaka were the first cities in Asia to experience severe ground subsidence. Through stringent regulations under the Industrial Water Act and Building Water Act restricting groundwater extraction, coupled with vigorous development of public water supply systems, subsidence was effectively curbed [35]. Lowered water tables increase effective stress within soil layers, leading to compressional settlement. Greater extraction volumes accelerate subsidence, readily forming regional subsidence funnels. Following the implementation of extraction bans, groundwater levels have risen in most areas, causing subsidence funnels to contract and settlement to slow or even reverse, demonstrating significant effectiveness. However, regional variations are pronounced: in areas of long-term overexploitation, groundwater recovery is slow and the delayed effects of subsidence persist, reflecting the controlling influence of hydrogeological conditions (such as lithology, permeability, and boundary characteristics) on the subsidence process. It is recommended that, building upon existing extraction bans, water source structures be further optimized to promote surface water substitution for groundwater. Surface water engineering should be strengthened through the systematic development of reservoirs, flood detention basins, and water distribution networks, enhancing local runoff regulation and external water transfer capacity to establish surface water as the primary source for urban and rural water supply. A phased approach to water source replacement should be adopted, prioritizing urban public water supply and industrial cooling sectors while progressively reducing deep confined aquifer extraction to alleviate subsidence drivers at source. Concurrently, refine zoned management controls and implement precise extraction oversight. Designate permanent extraction prohibition zones in areas of severe subsidence, high geological hazard risk, and central urban districts. Establish restricted extraction zones in subsidence development areas or urban peripheries, enforcing dual controls on both extraction volume and intensity. Establish mechanisms for water abstraction rights allocation and supervision, implementing permit and quota management for essential agricultural and ecological water use. Utilize online monitoring systems for real-time oversight to ensure effective implementation of controls.
The balance between resource utilization and risk prevention and control, simple and rude “banning it once” or “letting it go” are not scientific water resources management strategies. The failure to make rational use of high-quality groundwater resources itself constitutes a waste of resources. On the other hand, although the rise in groundwater level helps to improve regional hydrogeological conditions, it may also trigger a series of negative effects. For example, the rise in groundwater level will lead to the corresponding increase in urban flood control level, especially in the context of frequent extreme precipitation events caused by climate change, which will further aggravate the flood control pressure. At the same time, the rise in groundwater level will increase the difficulty of underground engineering construction, and the decline of foundation bearing capacity will lead to the settlement, cracking and even collapse of buildings. In addition, the strength of rock and soil is weakened due to the increase in water, which may induce geological disasters such as landslides, collapses and foundation softening. The balance of water and salt transport is broken, and the salt rises with the capillary water and accumulates on the surface, thus aggravating the risk of soil secondary salinization.
Therefore, we should pay attention to the possible negative effects of groundwater level rise while seeing the remarkable effect of groundwater prohibition on preventing land subsidence. In the future, the rise in groundwater level may evolve from the traditional “resource crisis” to the threat of urban security, especially in the urban areas in front of the mountain. Further study the relationship between groundwater level and land subsidence in different areas, especially the critical groundwater level of land subsidence. In addition, the reasonable threshold of groundwater level or mining amount should be set for different functional areas and different depths (shallow, middle and deep), and the scope of forbidden mining area and restricted mining area should be dynamically adjusted. We should shift groundwater management from resource development to the ecological security dimension, improve the dynamic monitoring of groundwater level, scientifically predict the changing trend of groundwater level, and establish a full-cycle regulation mechanism of “mining-subsidence-rebound” to cope with the new crisis caused by the possible rise in groundwater level.

4. Conclusions

Based on the dynamic monitoring data and COMSOL Multiphysics porous elastic fluid–solid coupling model, this study systematically analyzes the control effect and internal mechanism of the groundwater prohibition policy on land subsidence in Decheng District, and draws the following conclusions:
The policy of prohibiting groundwater exploitation significantly reduces the exploitation intensity of deep and shallow groundwater, and effectively promotes the recovery of the groundwater level, especially the recovery rate of the deep groundwater level, which increases from about 0.5 m/a before the prohibition to about 5 m/a. At the same time, the rate of land subsidence has obviously slowed down, and the average annual settlement has decreased by more than 80% compared with that before the mining ban, indicating that the mining ban measures have achieved remarkable results in controlling settlement.
Numerical simulation shows that the exploitation of deep confined water is the main cause of regional land subsidence. The land subsidence did not stop immediately after the prohibition of mining, and the response of the subsidence to the change in water level has a lag effect of about five years; the compression deformation of the soil is irreversible. Although the long-term prohibition of mining can stabilize the subsidence stratum, it is difficult to recover to the initial state.
The prohibition of groundwater exploitation is the most effective measure to slow down land subsidence. However, while affirming the effectiveness of the prohibition of groundwater exploitation, we should pay attention to the possible negative effects caused by the rising water level. Divide the area into no-extraction zones and restricted-extraction zones: the former are primarily located in areas of severe subsidence or ecologically sensitive zones, where a rigid ban on extraction is enforced; the latter are mainly situated in developing subsidence zones or peripheral areas, where extraction is subject to strict approval and oversight within approved quotas. In order to realize the cooperative safety of regional water resources and geological environment, it is suggested to establish and improve the integrated dynamic monitoring and regulation mechanism of “land subsidence–groundwater level”, enhance the early warning and prevention and control ability of land subsidence risk, and support the rational development of groundwater resources and the sustainable development of geological environment protection.

Author Contributions

G.J.: Formal analysis, investigation, methodology, writing—draft; Y.C.: Conceptualization, methodology, writing—original draft; Y.Y.: Investigation, supervision, writing—review and editing; J.D.: Investigation, supervision, writing—review and editing; P.N.: Resources; W.L.: Resources; Z.Z.: Resources; K.L.: Resources, writing—review; Z.G.: Supervision, J.L.: Supervision. All authors have read and agreed to the published version of the manuscript.

Funding

This study was supported by Shandong Provincial Research Center of Geothermal Resources and Reinjection, and Dezhou Deep Geological Energy Conservation and Carbon Reduction Key Laboratory (Grant: No. LBYKFJJ003).

Data Availability Statement

The datasets used and analyzed during the current study are available from the corresponding author on reasonable request.

Acknowledgments

We would like to express our sincere thanks to the editors and reviewers for their very helpful comments on the paper.

Conflicts of Interest

The authors declare no conflicts of interest.

References

  1. Wang, G. New Preconsolidation Heads Following the Long-Term Hydraulic-Head Decline and Recovery in Houston, Texas. Groundwater 2022, 61, 674–691. [Google Scholar] [CrossRef] [PubMed]
  2. Raspini, F.; Loupasakis, C.; Rozos, D.; Adam, N.; Moretti, S. Ground subsidence phenomena in the Delta municipality region (Northern Greece): Geotechnical modeling and validation with Persistent Scatterer Interferometry. Int. J. Appl. Earth Obs. Geoinf. 2014, 28, 78–89. [Google Scholar] [CrossRef]
  3. Du, J.; Zhang, Y.; Luo, Z.; Zhang, C. Prediction of Ground Subsidence Induced by Groundwater Mining Using Three-Dimensional Variable-Parameter Fully Coupled Simulation. Water 2024, 16, 2487. [Google Scholar] [CrossRef]
  4. Gong, S. Summary of land subsidence research in Shanghai. Shanghai Geol. 2006, 4, 25–29. [Google Scholar]
  5. Herrera-García, G.; Ezquerro, P.; Tomás, R.; Béjar-Pizarro, M.; López-Vinielles, J.; Rossi, M.; Mateos, R.M.; Carreón-Freyre, D.; Lambert, J.; Teatini, P.; et al. Mapping the global threat of land subsidence. Science 2021, 371, 34–36. [Google Scholar] [CrossRef]
  6. Zhang, Z.; Lin, Q.; Yan, H.; Zhu, X.; Zhang, X.; Yang, S.; Huang, C.; Shi, Y.; Hu, J.; Li, X.; et al. Ground subsidence monitoring and prediction based on InSAR and CNN-BiGRU-Attention: A case study of Chengdu. Eng. Geol. 2025, 357, 108336. [Google Scholar] [CrossRef]
  7. He, Q.; Liu, H.; Wei, L.; Zhang, Z. Analysis of the Driving Factors for Land Subsidence in the Northern Anhui Plain: A Case Study of Bozhou City. Water 2025, 17, 1854. [Google Scholar] [CrossRef]
  8. Hao, R.; Wang, X.; Xu, Y. Analysis of the factors resulting in the acceleration of land subsidence in the central area of Dezhou city, China. Environ. Earth Sci. 2022, 81, 400. [Google Scholar] [CrossRef]
  9. Jia, C.; Zhang, G.; Wang, J.; Zhang, C. Research on land subsidence induced by groundwater extraction and its engineering application: A case study of Dezhou area, Shandong Province. J. Earth Sci. Environ. 2015, 37, 102–110. (In Chinese) [Google Scholar]
  10. Zhang, Y.; Li, H.; Shang, T.; Jia, C.; Liang, H.; Yang, Y. Extension theory-based division of land subsidence prone areas in Dezhou using analytic hierarchy process. Shandong Land Resour. 2016, 32, 58–64. (In Chinese) [Google Scholar]
  11. Zhu, L.; Zhan, J.; Zhang, X.; Zhu, D.; Run, P. Discussion on progress in monitoring and prevention of land subsidence in Dezhou City. J. Geol. Hazards Environ. Preserv. 2020, 31, 26–30. (In Chinese) [Google Scholar]
  12. Wang, H.; Gong, H.; Chen, B.; Zhou, C.; Yang, Y.; Sun, X. A physics-informed neural network approach to predicting land subsidence-rebound in Dezhou City under different climate scenarios. J. Hydrol. Reg. Stud. 2025, 62, 102773. [Google Scholar] [CrossRef]
  13. Yu, W.; Cheng, C.; Zhang, Y.; Xue, G. Land subsidence analysis in Dezhou based on time-series SAR. Geomat. Spat. Inf. Technol. 2021, 44, 127–129+132. (In Chinese) [Google Scholar]
  14. Wang, H.; Gong, H.; Chen, B.; Zhou, C.; Yang, Y.; Sun, X. Research on land subsidence-rebound affected by dualistic water cycle driven by climate change and human activities in Dezhou City, China. J. Hydrol. 2024, 636, 131327. [Google Scholar] [CrossRef]
  15. Fu, X.; Ge, P.; Chen, M.; Zhu, L.; Wei, L.; Ding, R.; Liu, H.; Liu, F. Time-series InSAR monitoring and analysis of land subsidence in Decheng District, Dezhou City, Shandong Province. Geomat. Inf. Sci. 2024, 49, 118–124. (In Chinese) [Google Scholar]
  16. Jia, C.; Zhang, S.; Sun, X.; Di, S.; Ding, P. Correlation between groundwater extraction and land subsidence in the Northwest Shandong Plain. China Sci. 2021, 16, 173–180. (In Chinese) [Google Scholar]
  17. Wei, X.; Yang, G.; Liu, T.; Shao, M.; Ma, Z. Study on the hysteresis between groundwater changes and land subsidence based on GRACE and InSAR data. Nat. Resour. Remote Sens. 2025, 37, 122–130. (In Chinese) [Google Scholar]
  18. Li, W.; Ding, Y.; Yan, S. Effectiveness and suggestions for groundwater over-exploitation control in Dezhou City. Shandong Water Resour. 2024, 8, 64–65+68. (In Chinese) [Google Scholar]
  19. Feng, Y.; Wu, Q.; Liu, S. Dynamic chemical evolution of deep groundwater in Dezhou City. Shandong Land Resour. 2019, 35, 51–55. (In Chinese) [Google Scholar]
  20. Zhao, Y. Research on Land Subsidence Caused by Groundwater Exploitation in Dezhou, Shandong. Master’s Thesis, Jilin University, Changchun, China, 2016. (In Chinese). [Google Scholar]
  21. Duan, X.; Huang, X.; Liu, S.; Yang, Y. Flow field evolution and water quality dynamics of deep groundwater resources in Decheng District, Shandong Province. J. Hebei Norm. Univ. (Nat. Sci. Ed.) 2020, 44, 539–546. (In Chinese) [Google Scholar]
  22. Farías, C.A.; Sánchez, M.L.; Bonì, R.; Cigna, F. Statistical and Independent Component Analysis of Sentinel-1 InSAR Time Series to Assess Land Subsidence Trends. Remote Sens. 2024, 16, 4066. [Google Scholar] [CrossRef]
  23. Fomo, D.; Sato, A.H. Adaptive Segmentation and Statistical Analysis for Multivariate Big Data Forecasting. Big Data Cogn. Comput. 2025, 9, 268. [Google Scholar] [CrossRef]
  24. Chiang, W.; Kinzelbach, W. 3D Groundwater Modeling with PMWIN-A Simulation System for Modeling Groundwater Flow and Pollution; Springer: Berlin/Heidelberg, Germany, 2003. [Google Scholar]
  25. Luo, Z.; Liu, J.; Li, L. Three-dimensional fully coupled numerical simulation of groundwater withdrawal and land subsidence in Quaternary unconsolidated sediments. Chin. J. Geotech. Eng. 2008, 30, 193–198. (In Chinese) [Google Scholar]
  26. Jessen, B.; Vogt, S.; Cudmani, R. Combined study of creep and ageing under deviatoric loading in granular materials. Acta Geotech. 2025, 20, 1831–1845. [Google Scholar] [CrossRef]
  27. Shu, X.; Wang, Z.; Peng, Y.; Zhou, Z.; Tian, Y. A novel elasto-viscoplastic constitutive model for predicting the embankment settlement on soft structured clay. Comput. Geotech. 2024, 167, 106093. [Google Scholar] [CrossRef]
  28. Musa, D. Advanced 3D thermo-hydro-mechanical modelling of thermal aperture evolution in enhanced geothermal systems. Energy Convers. Manag. 2025, 342, 120129. [Google Scholar]
  29. Shi, X.; Wu, J.; Ye, S.; Zhang, Y.; Xue, Y.; Wei, Z.; Li, Q.; Yu, J. Regional land subsidence simulation in Su-Xi-Chang area and Shanghai City, China. Eng. Geol. 2008, 100, 27–42. [Google Scholar] [CrossRef]
  30. Galloway, D.L.; Burbey, T.J. Review: Regional land subsidence accompanying groundwater extraction. Hydrogeol. J. 2011, 19, 1459–1486. [Google Scholar] [CrossRef]
  31. Luo, Z.; Wang, X.; Dai, J.; Li, Z.; Li, S. Influence of Land Subsidence on Minable Groundwater Resources. Earth Sci. 2024, 49, 248–252. [Google Scholar]
  32. Zhou, C.; Gong, H.; Chen, B.; Li, X.; Li, J.; Wang, X.; Gao, M.; Si, Y.; Guo, L.; Shi, M.; et al. Quantifying the contribution of multiple factors to land subsidence in the Beijing Plain, China with machine learning technology. Geomorphology 2019, 335, 48–61. [Google Scholar] [CrossRef]
  33. Chen, H.; Xue, Y.; Qiu, D. Numerical simulation of the land subsidence induced by groundwater mining. Clust. Comput. 2023, 26, 3647–3656. [Google Scholar] [CrossRef]
  34. Hong, Y.; Chen, P.; Yao, Y.; Qiu, L.; Liu, H.; Zhu, C.; Lu, J. Land Subsidence in the Loess Plateau: SBAS-InSAR Analysis of Yan’an New District During 2017–2022. Sensors 2025, 25, 6298. [Google Scholar] [CrossRef]
  35. Hayashi, T.; Tokunaga, T.; Aichi, M.; Shimada, J.; Taniguchi, M. Effects of human activities and urbanization on groundwater environments: An example from the aquifer system of Tokyo and the surrounding area. Sci. Total Environ. 2008, 407, 3165–3172. [Google Scholar] [CrossRef]
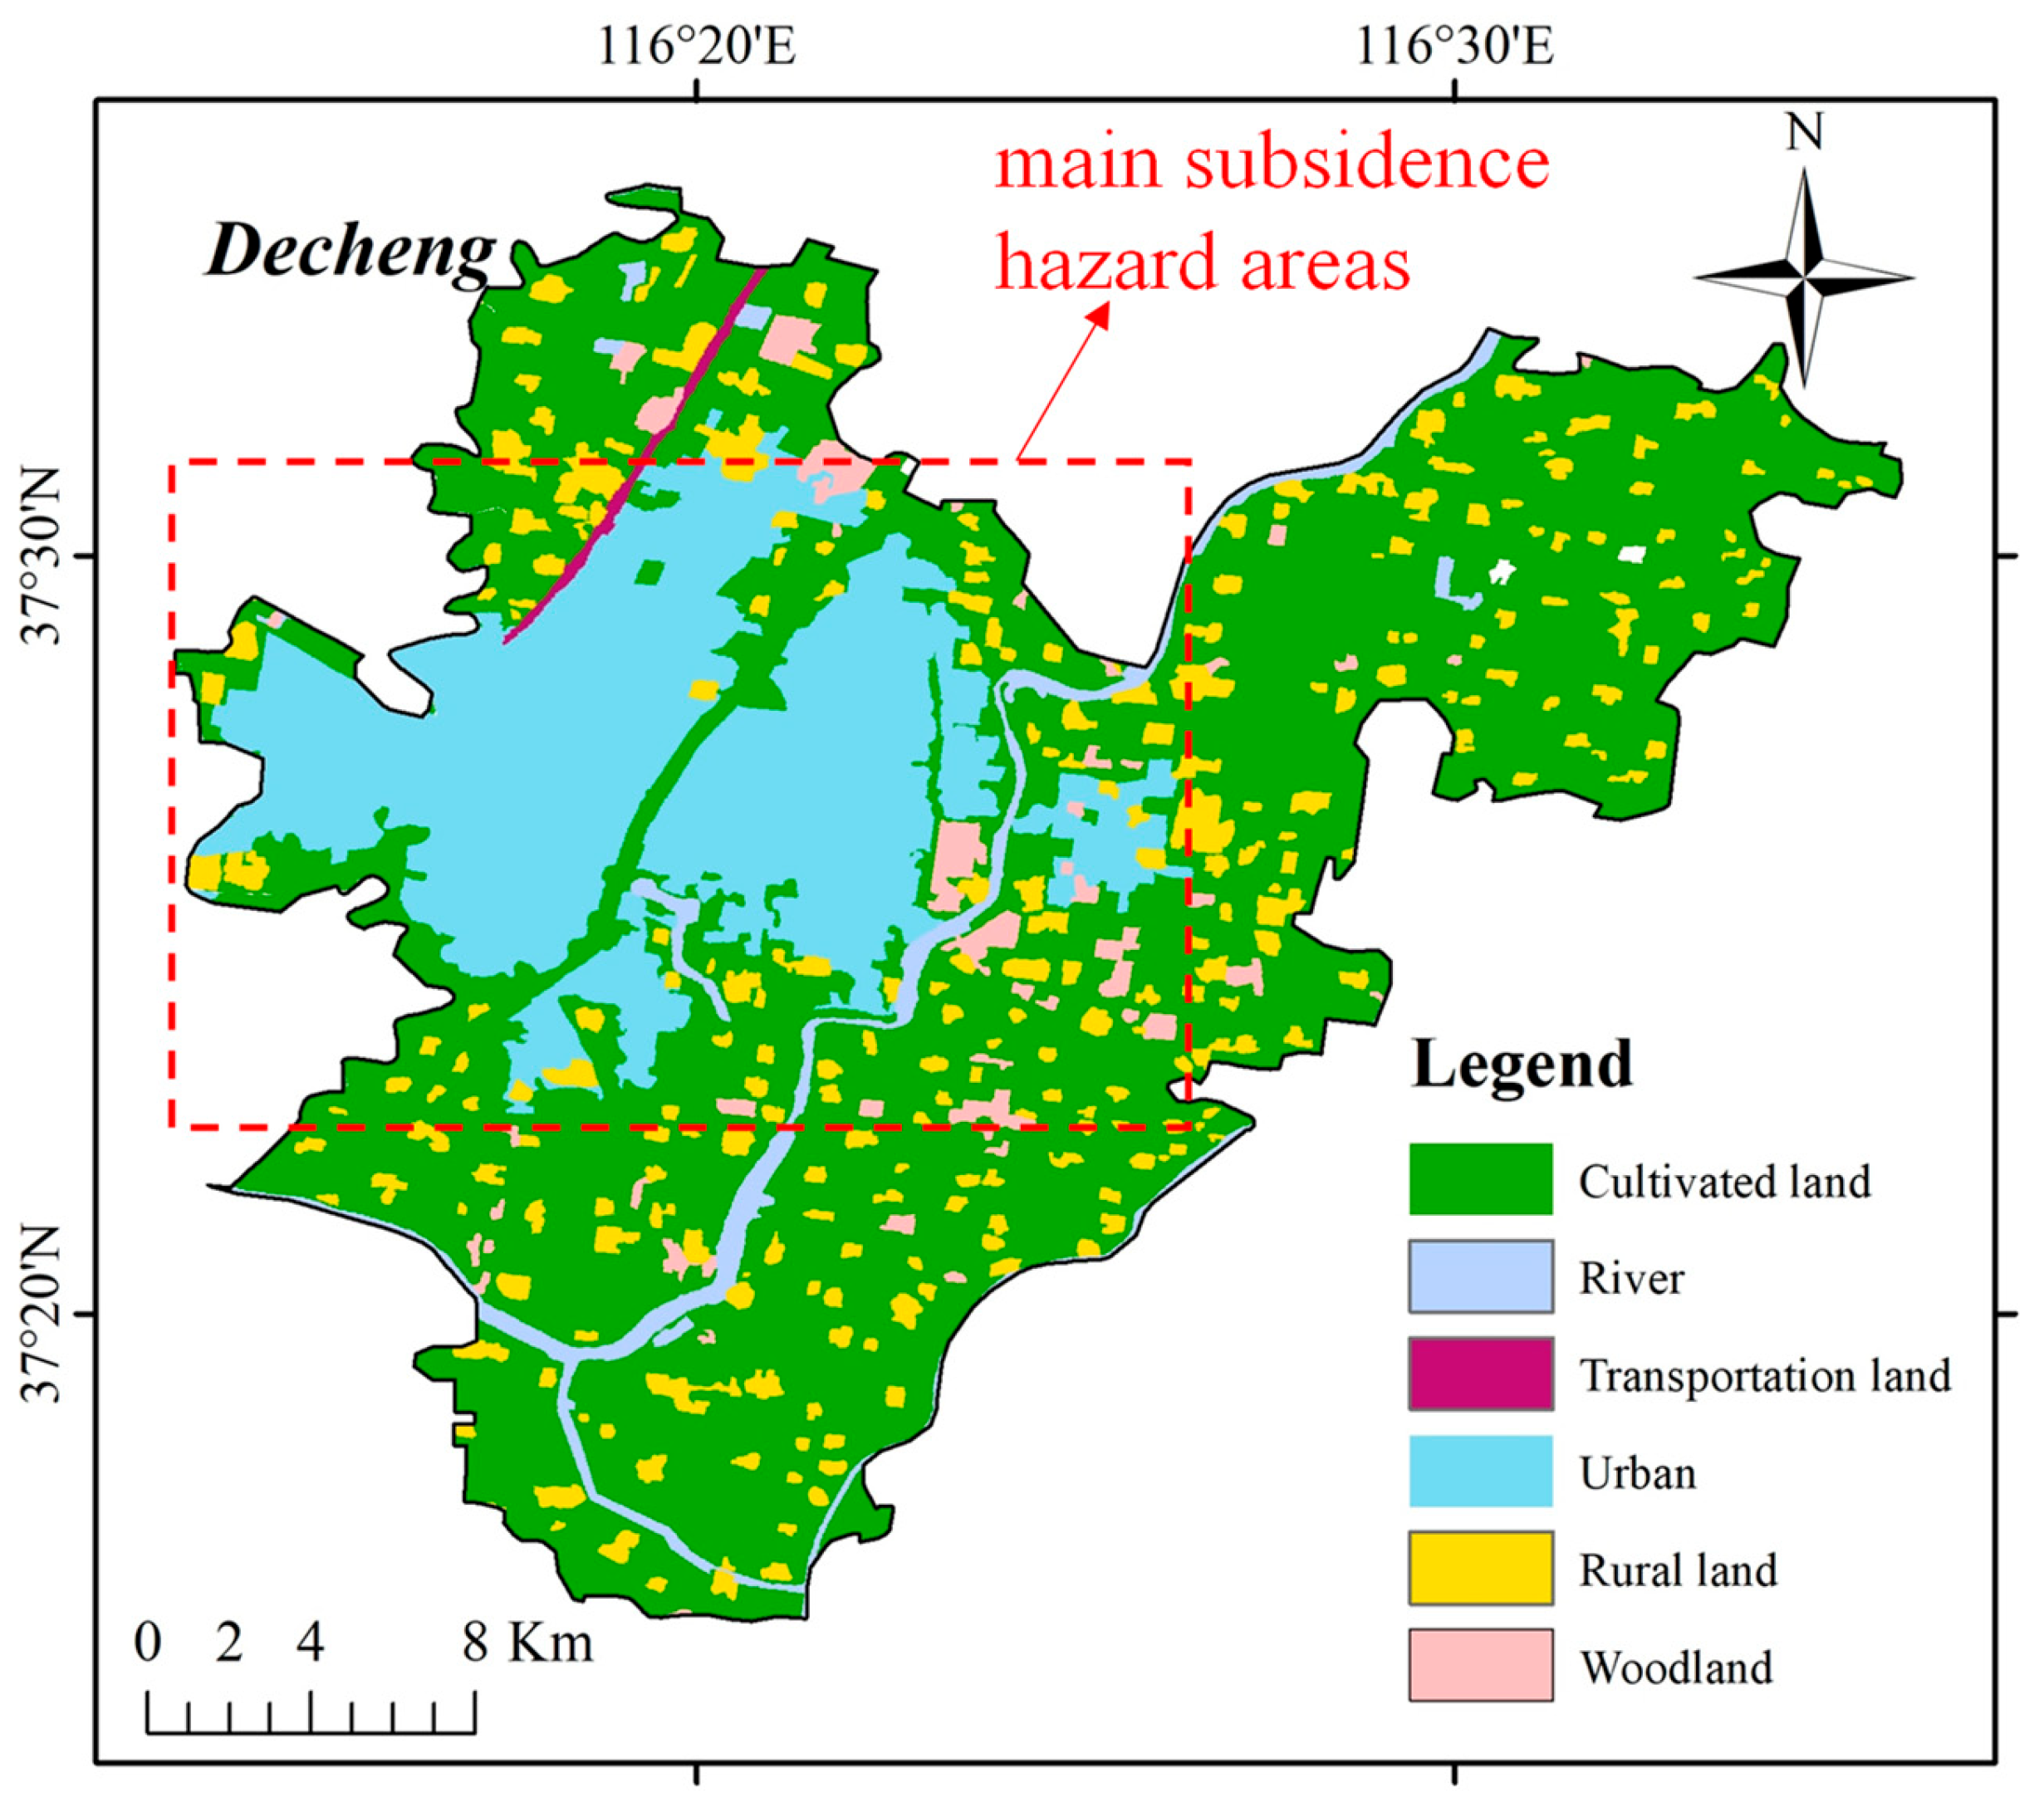
Figure 1. Land use and main subsidence area map of Decheng District.
Water 17 03240 g001
Figure 2. (a) Schematic map of Decheng District; (b) Location map of groundwater level monitoring points (# denotes the serial number) (Data sourced from Google Maps).
Water 17 03240 g002
Figure 3. Dynamic changes in groundwater extraction volumes at monitoring points in Decheng District.
Water 17 03240 g003
Figure 4. Dynamic changes in deep groundwater level depth (# denotes the serial number).
Water 17 03240 g004
Figure 5. Dynamic changes in shallow groundwater level depth (# denotes the serial number).
Water 17 03240 g005
Figure 6. Statistical bar chart of annual average land subsidence.
Water 17 03240 g006
Figure 7. Geometric modeling procedure.
Water 17 03240 g007
Figure 8. Workflow of model pre-processing, including formation division, boundary condition definition, and mesh generation.
Water 17 03240 g008
Figure 9. Groundwater extraction from shallow aquifers.
Water 17 03240 g009
Figure 10. Groundwater extraction from deep aquifers.
Water 17 03240 g010
Figure 11. Land subsidence under variable pumping rates.
Water 17 03240 g011
Figure 12. Comparison of hydraulic head between single-well and three-well scenarios.
Water 17 03240 g012
Figure 13. Comparison of Subsidence Between Single-Well and Three-Well Scenarios.
Water 17 03240 g013
Figure 14. Initial displacement when extraction volume is 0.
Water 17 03240 g014
Figure 15. Displacement diagram for extraction volume increasing from 0 to 5Q.
Water 17 03240 g015
Figure 16. Displacement when extraction volume stabilizes at 5Q.
Water 17 03240 g016
Figure 17. Displacement after 5 years under prohibition conditions.
Water 17 03240 g017
Figure 18. Schematic diagram of the stages in the evolution of land subsidence.
Water 17 03240 g018
Figure 19. Land subsidence process chain.
Water 17 03240 g019
Table 1. Bidirectional coupling effect.
DirectionPhysical ProcessInfluence Parameters
seepage→deformationThe decrease in water head changes the effective stress fieldTriggering soil strain and displacement
deformation→seepageSoil compression changes pore structure and permeabilitycoefficient k and porosity n
Table 2. Land subsidence data at benchmarks in Decheng District.
Dot2007.9–2010.112010.11–2021.112021.11–2022.9
DJ9−55−226−5
YD9−72−269−15
D9−84−313−10
Q3−83−312−10
Q1−96−409−5
D62−106−397−5
Table 3. Stratigraphic distribution and computational parameters of the model.
Property/Unit0–200 m200–300 m300–450 m450–550 m550–800 m
Density/kg/m319802050210021502150
Young’s Modulus/Pa1.1 × 1085 × 1071.4 × 1086 × 1071.9 × 108
Poisson’s Ratio0.350.30.250.250.2
Dynamic Viscosity0.0010.0010.0010.0010.001
Biot Coefficient0.80.70.750.60.8
Porosity0.440.30.350.250.32
Disclaimer/Publisher’s Note: The statements, opinions and data contained in all publications are solely those of the individual author(s) and contributor(s) and not of MDPI and/or the editor(s). MDPI and/or the editor(s) disclaim responsibility for any injury to people or property resulting from any ideas, methods, instructions or products referred to in the content.