Abstract
This study investigated the energy requirement for running desalination units coupled to cogeneration plants. Various cogeneration systems were explored using power- and heat-allocated approaches. The specific work and heat necessary for operating different desalination systems were determined. The investigation revealed that the specific work and heat remain consistent regardless of the desalination daily capacity. It was observed that the energy demand for operating a desalination system mainly relies on power plant efficiency. The investigation revealed that the energy demand for a plain multi-effect desalination system was lower than that for multi-effect desalination with thermal vapor compression. Additionally, the energy requirement for a multi-effect desalination system with preheaters was lower than that for plain multi-effect desalination. Comparisons also indicated that the energy demand of multi-stage flash exceeds that of different multi-effect desalination systems. Based on the primary thermal energy input, a universal performance ratio was used to evaluate the desalination unit performance. Furthermore, a new correlation was proposed to predict the universal performance ratio.
Keywords:
desalination; operating energy; heat added allocation; power allocation; MED; MED-PH; MED-TVC; MSF 1. Introduction
Freshwater demand is a critical concern in Saudi Arabia and worldwide. Desalination is a reliable solution to tackle water shortage problems. Based on the Shared Socioeconomic Pathway (SSP2) study, Gao et al. [1] concluded that, by 2050, desalination will become increasingly feasible for developing nations. Desalination is an energy-consuming process. Consequently, the adaption of cogeneration, which combines power generation and desalination, is used to maximize the system’s energy utilization efficiency. The US Department of Energy recommended using renewable energy for running cogeneration plants to minimize the operational expenses of desalination water production [2].
The primary factor in selecting the appropriate cogeneration systems lies in the economics of water production. Evaluating the performance of cogeneration plants, where electric and thermal energy are involved, is a complex task and is not easy to perform. Detailed reviews of thermo-economic models assessing the cost of energy required for desalination processes are presented in [3,4]. Thermo-economic analyses of desalination systems were carried out by [5,6,7,8] based on the economic model established by Kavvadias and Khamis [9]. The study of Khan et al. [5] indicated differing cost trends for the examined desalination technologies. Meanwhile, Haya et al. [6] suggested that using nuclear energy in cogeneration was a promising technique to reduce water production expenses. Moreover, Sadeghi et al. [7] proposed a hybrid reverse osmosis multi-effect desalination (RO-MED) system with an optimal ratio of 0.7 to reduce water production costs.
Major desalination processes include thermal and electric-driven systems. Comparisons of the energy required to operate these systems are not a straightforward task [10,11,12,13]. According to Altman et al. [10], comparing the thermal energy requirements of multi-effect desalination (MED) and multi-stage flash (MSF) systems with the electric energy needs of reverse osmosis (RO) systems could not lead to definitive conclusions. As reported by [10,14], there is no standard technique to estimate the cost of freshwater production in cogeneration plants. Consequently, distributing the energy cost between power and water production remains a subject of debate. ElNashar [12] pointed out that existing methods used for cost allocation in cogeneration plants presented significant challenges.
The feasibility of the cogeneration systems can be judged based on the produced freshwater levelized cost. The type and the quantity of energy required to operate desalination systems represent important factors. Various energy demand approaches were explored, including exergy and energy methods [10,11,12,13,14,15,16,17,18,19,20,21,22,23,24,25]. An exergy approach was presented by [10,16,21,22,26]. Altmann et al. [10] developed a theoretical exergy-based approach to determine the energy consumption of 48 different configurations of cogeneration plants. In this investigation, the heat and power requirements of these systems were traced back to their primary form. Shahzad et al. [21,22] and Ng et al. [26] introduced an exergy-based analysis to determine the quantity of fuel needed by the desalination units in a cogeneration plant. Shahzad et al. [21,22] and Ng et al. [26] assessed different desalination methods using a universal performance ratio (UPR) based on the type of primary energy input.
Two main approaches can be employed to determine the energy requirements of desalination systems: the power-allocated method (PAM) [11,15,16,17,18,23,24,25] and the heat-allocated method (HAM) [19,20]. In the PAM approach, steam extraction from the turbine to heat the thermal desalination system decreases the cogeneration power plant’s capacity to generate electricity. The reduction in the cogeneration electric power output is considered as the energy demand to run the desalination system. The HAM method considers the additional heat required to substitute the steam thermal energy extracted to heat the desalination system as the energy requirement of the desalination system. This additional heat is needed to maintain the stand-alone power plant’s full load output.
Zeitoun et al. [27] developed thermo-economic models for cogeneration power and desalination systems. In these models, the levelized cost of water was estimated for nine configurations where three types of desalination systems were connected with three types of power plants. In this study, the energy consumption of the desalination systems was estimated using the PAM and HAM procedures. The main key findings of this investigation were as follows:
- Applying the HAM method for estimating the levelized cost of water narrowed the gap between the cost of water produced by the MED and the seawater reverse osmosis (SWRO) systems.
- The levelized cost of water for the simple MED was lower than that for multi-effect distillation with thermal vapor compression (MED-TVC).
- The profit margin for cogeneration combined power plants powered by natural gas was higher than that for nuclear power plants.
The previous investigation of Zeitoun et al. [27] raised many important questions, including the impact of using highly efficient power plants, e.g., supercritical steam power plants, on the water levelized cost, if the simple MED competes with MED-TVC, and the impact of using preheaters with the simple MED.
The current study focused on the energy consumption of thermal desalination systems integrated with steam, nuclear, combined, and supercritical pressure power plants. The desalination systems investigated included plain MED, MED with preheaters, MED-TVC, and once-through MSF systems. The energy consumption of these desalination systems was compared to the SWRO energy requirement to explore the reason for RO spread adoption. According to published statistics, most of the desalination plants newly installed worldwide are RO-based [8].
The procedure of the current study involved the following steps:
- -
- Analyze the performance of a stand-alone power plant to determine its full power output and overall efficiency for a given amount of heat added;
- -
- Analyze the performance of a power plant connected to a desalination system to determine the loss of its power generation for the same amount of heat added to determine the loss in power.
- -
- Analyze the performance of a power plant connected to a desalination system to determine the additional heat required to maintain the full power output.
- -
- Use the above results to determine the energy requirement to run desalination systems based on the PAM and HAM methods.
2. Stand-Alone Power Plant Simulation
In the current investigation, supercritical power plants (ScPPs) connected to plain MED, multi-effect with preheaters (MED-PH), MED-TVC and once-through MSF desalination systems were examined. The configurations of these cogeneration plants are shown in Figure 1, Figure 2, Figure 3 and Figure 4. The configurations presented by Zeitoun et al. [27] were revisited to determine the energy requirements for operating MED, MED-TVC, and MSF systems connected to a steam power plant (SPP), nuclear power plant (NPP), and combined power plant (CPP). This study extended the cases analyzed by [27] by including the MED-PH configuration. The figures illustrating these configurations are shown in Appendix A. The complete list of cogeneration configurations investigated is listed in Table 1.
Figure 1.
ScPP connected to plain MED system.
Figure 2.
ScPP connected to MED-PH system.
Figure 3.
ScPP connected to MED-TVC system.
Figure 4.
ScPP connected to the MSF system.
Table 1.
Investigated configurations of cogeneration power plants/desalination systems.
A plain MED unit connected to a ScPP is depicted in Figure 1. The supercritical pressure boiler supplies steam to a turbine of three stages. The steam undergoes reheating after expansion in the high-pressure turbine, as shown in Figure 1. The power plant is equipped with nine feed-water heaters; one of the open type and eight of the closed type, as shown in Figure 1. The pressure distribution along the feed-water heaters was optimized as reported in [28]. The parameters used to simulate the ScPP are detailed in Table 2. Thermal simulation of the stand-alone ScPP was performed using EES software V11.725 [29]. The stand-alone simulation was conducted to obtain the overall characteristics of the power plant under full load conditions.
Table 2.
Stand-alone ScPP simulation data.
For the investigated power plants, the following input data were maintained:
- The heat added to operate the different examined power plants was maintained at QH = 3000 MW.
- The rise in the temperature of the condenser cooling water was assumed to be 5 °C, and the terminal temperature difference at the condenser exit was assumed to be 5 °C.
- The efficiencies of the components of ScPP are listed in Table 2.
A thermodynamic model using the mass and energy conservation equations of the ScPP components was developed. The overall balances of mass and energy for the power plant were checked for the solved conditions. At the exit of the boiler of the ScPP, the pressure and temperature were maintained at 330 bar and 610 °C, respectively, see Table 2. The pressures along the components of the ScPP are listed in Table 2. The steam was reheated to 630 °C after the expansion in the high-pressure turbine. The simulation results of the stand-alone ScPP plant are also listed in Table 2, where the overall efficiency is 44.19%, and full output is 1325.78 MW.
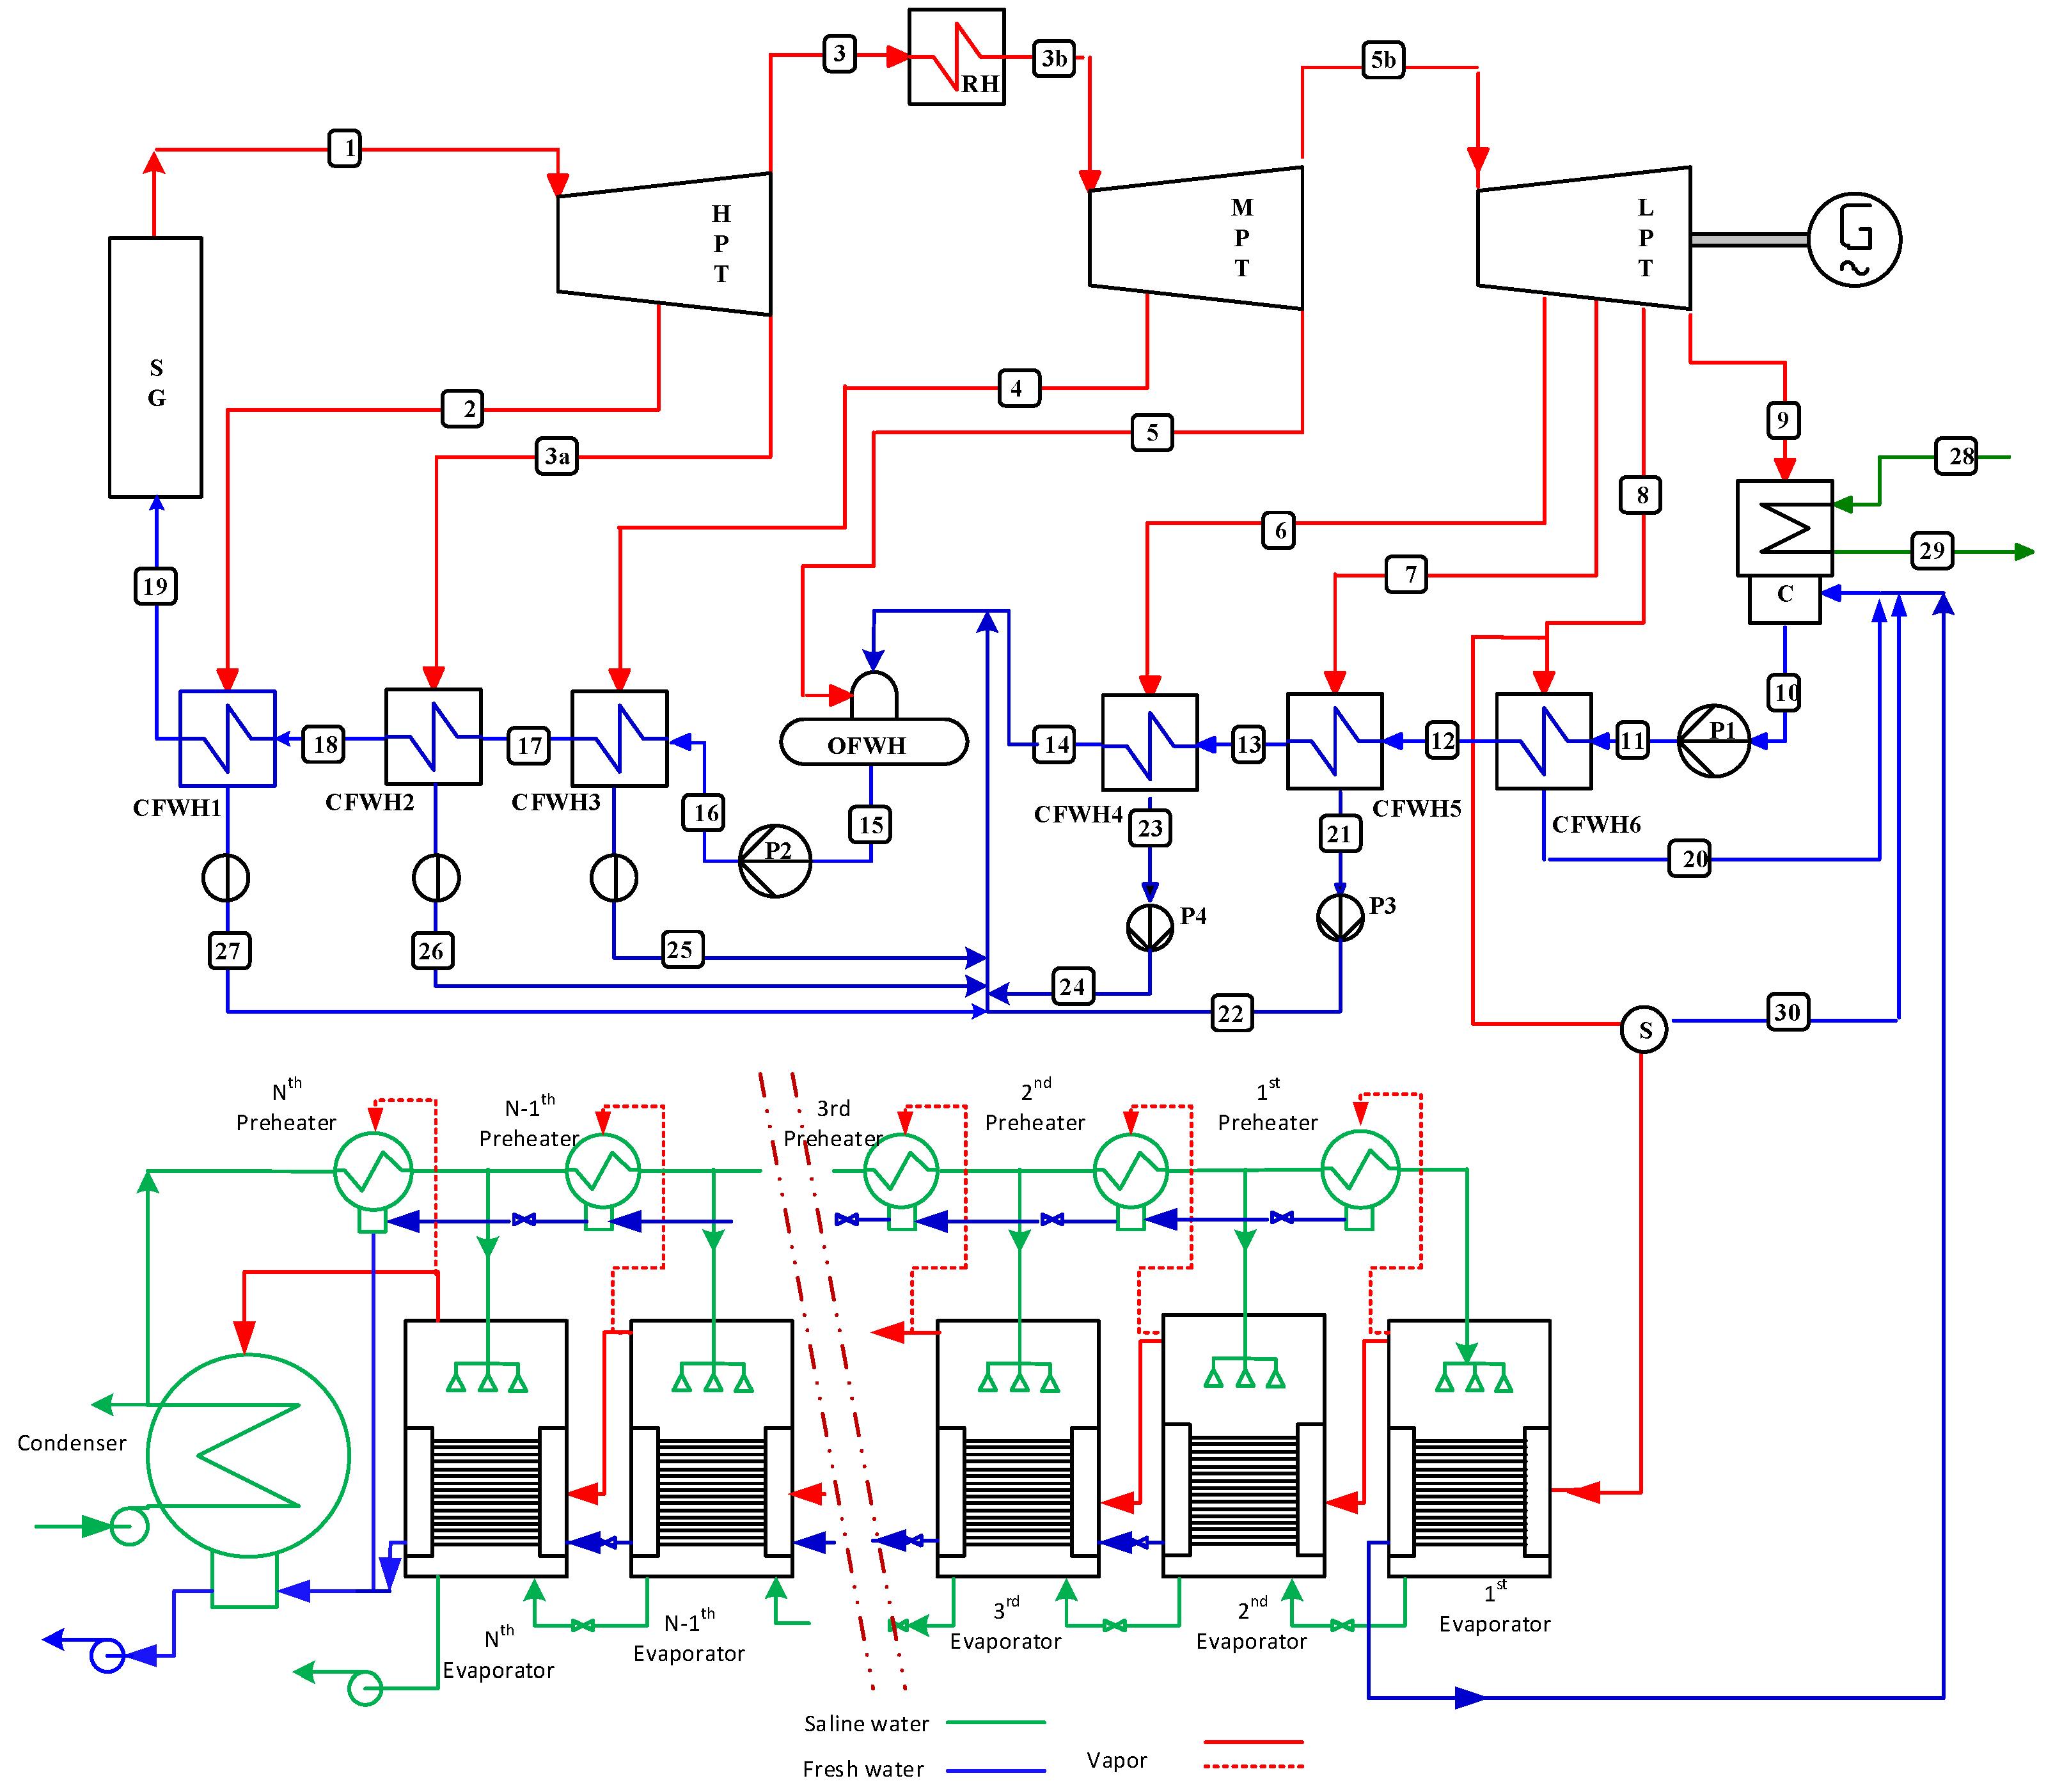
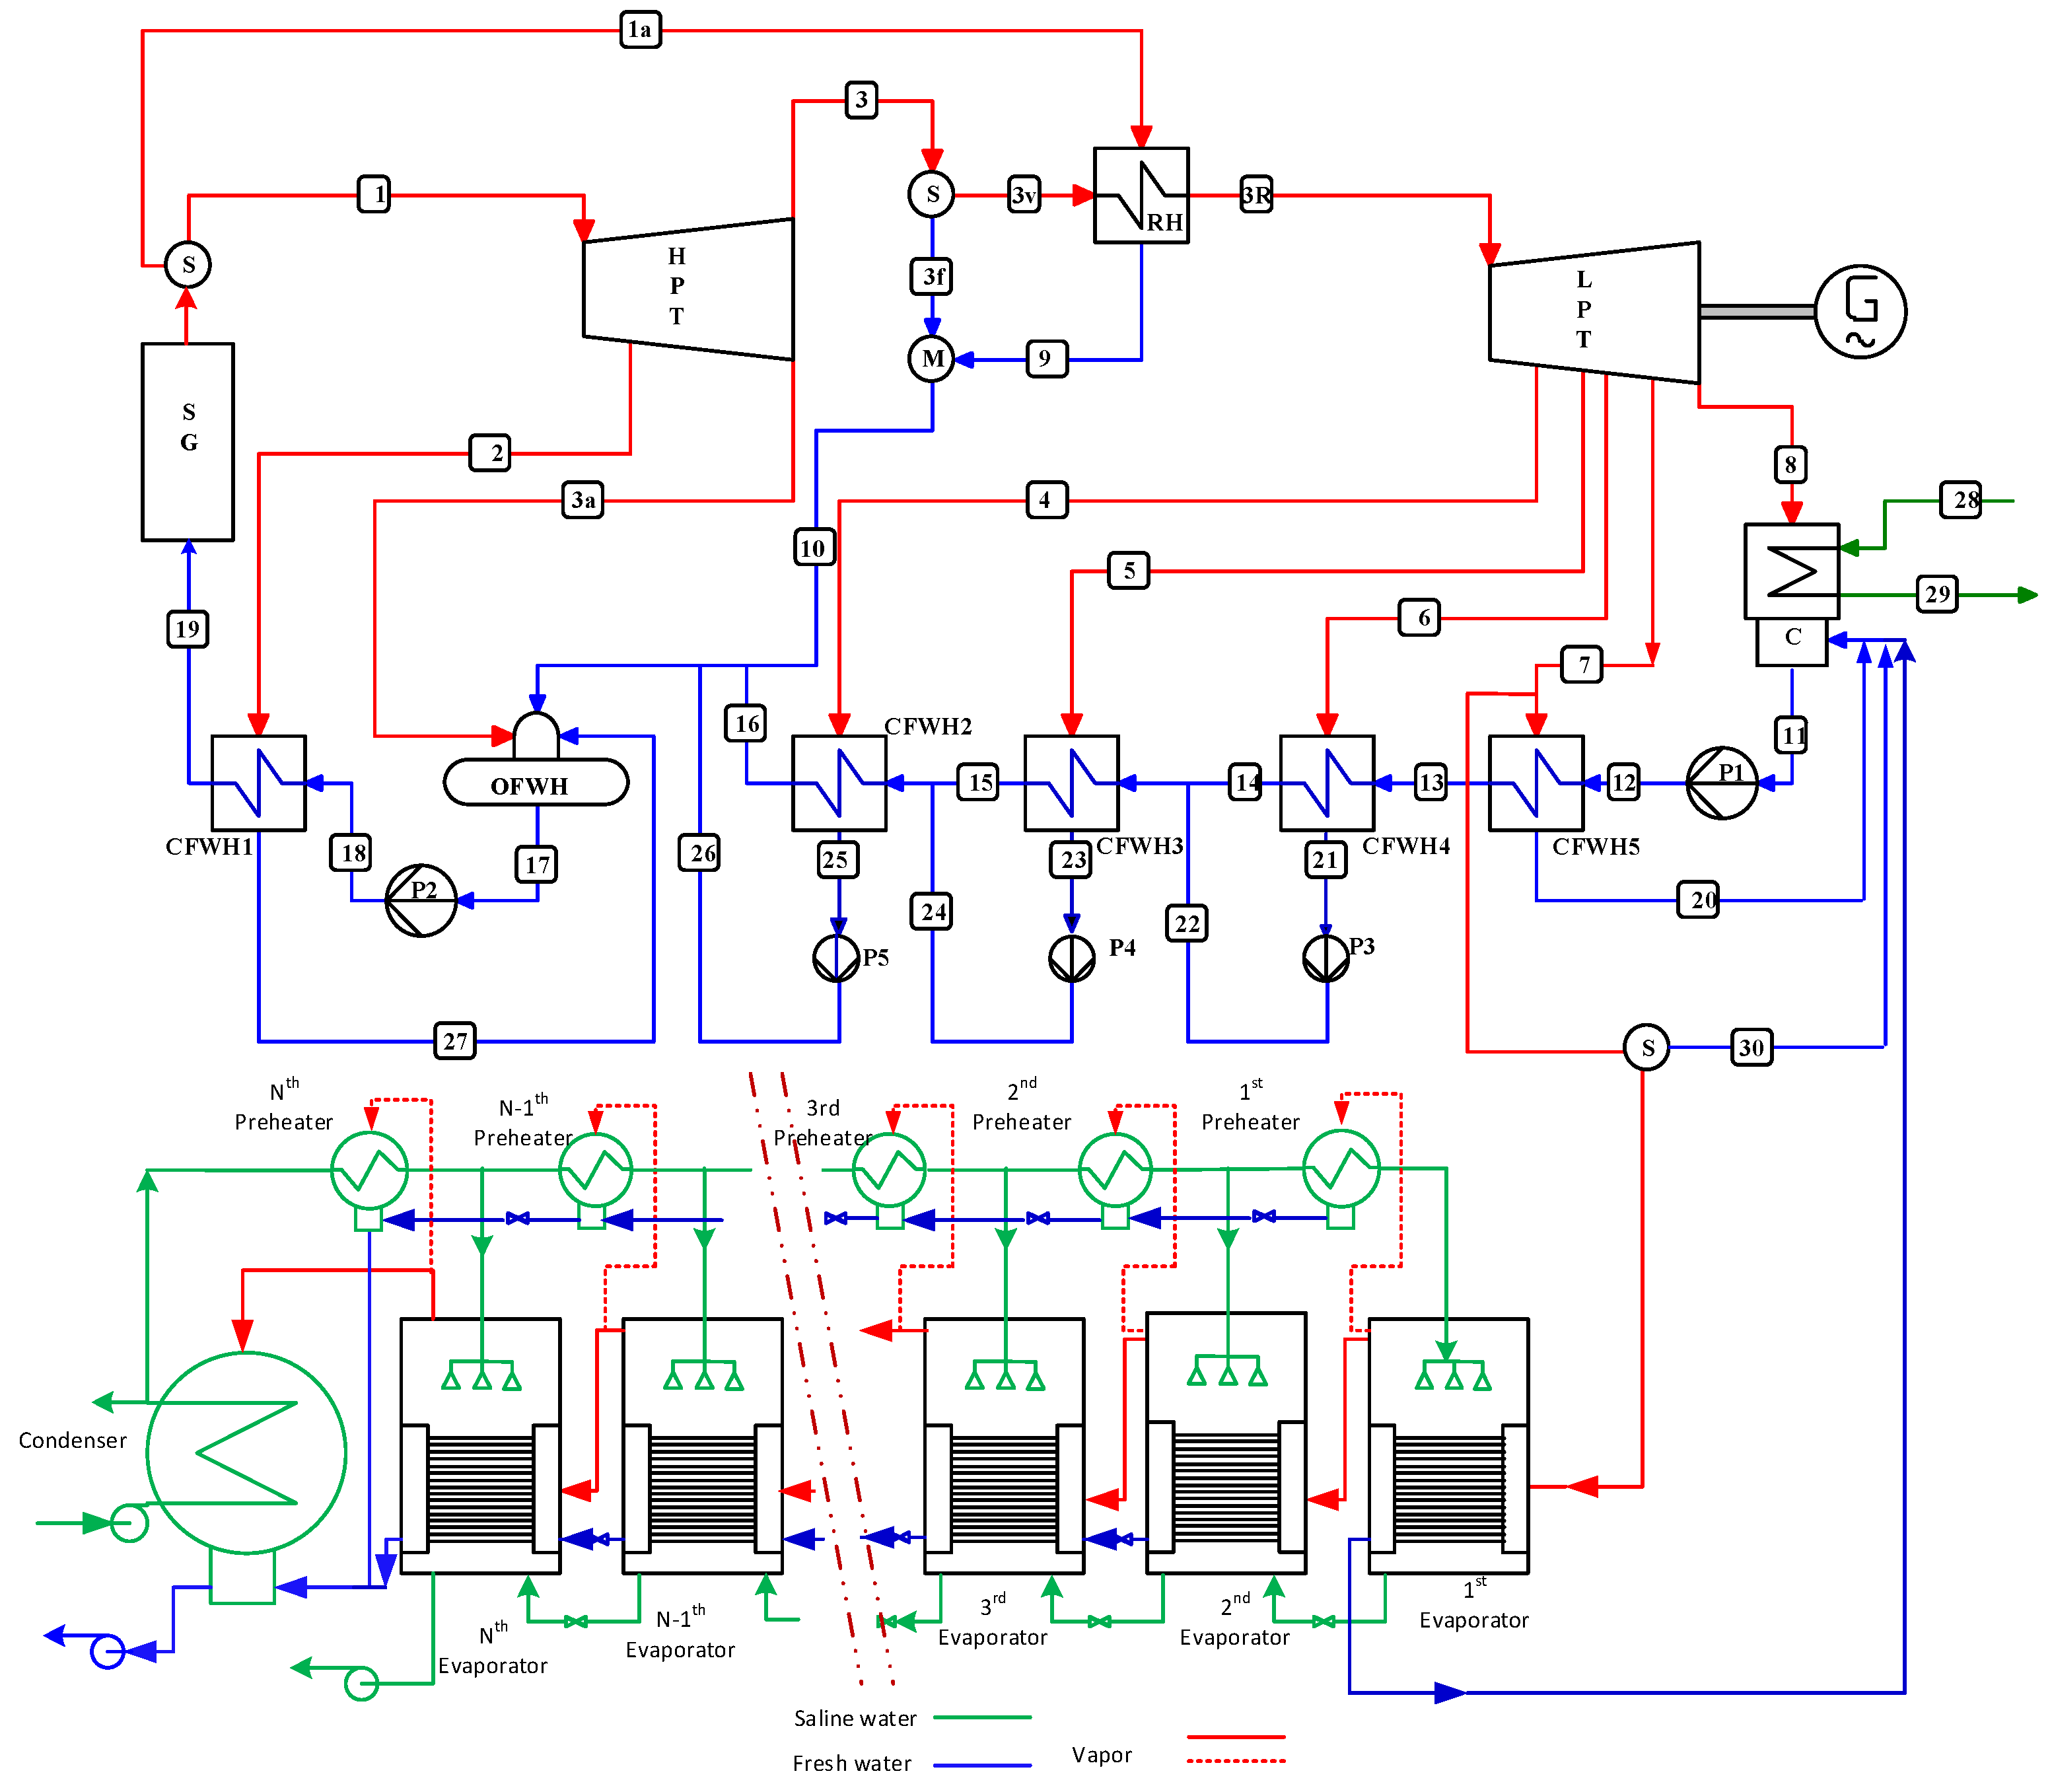
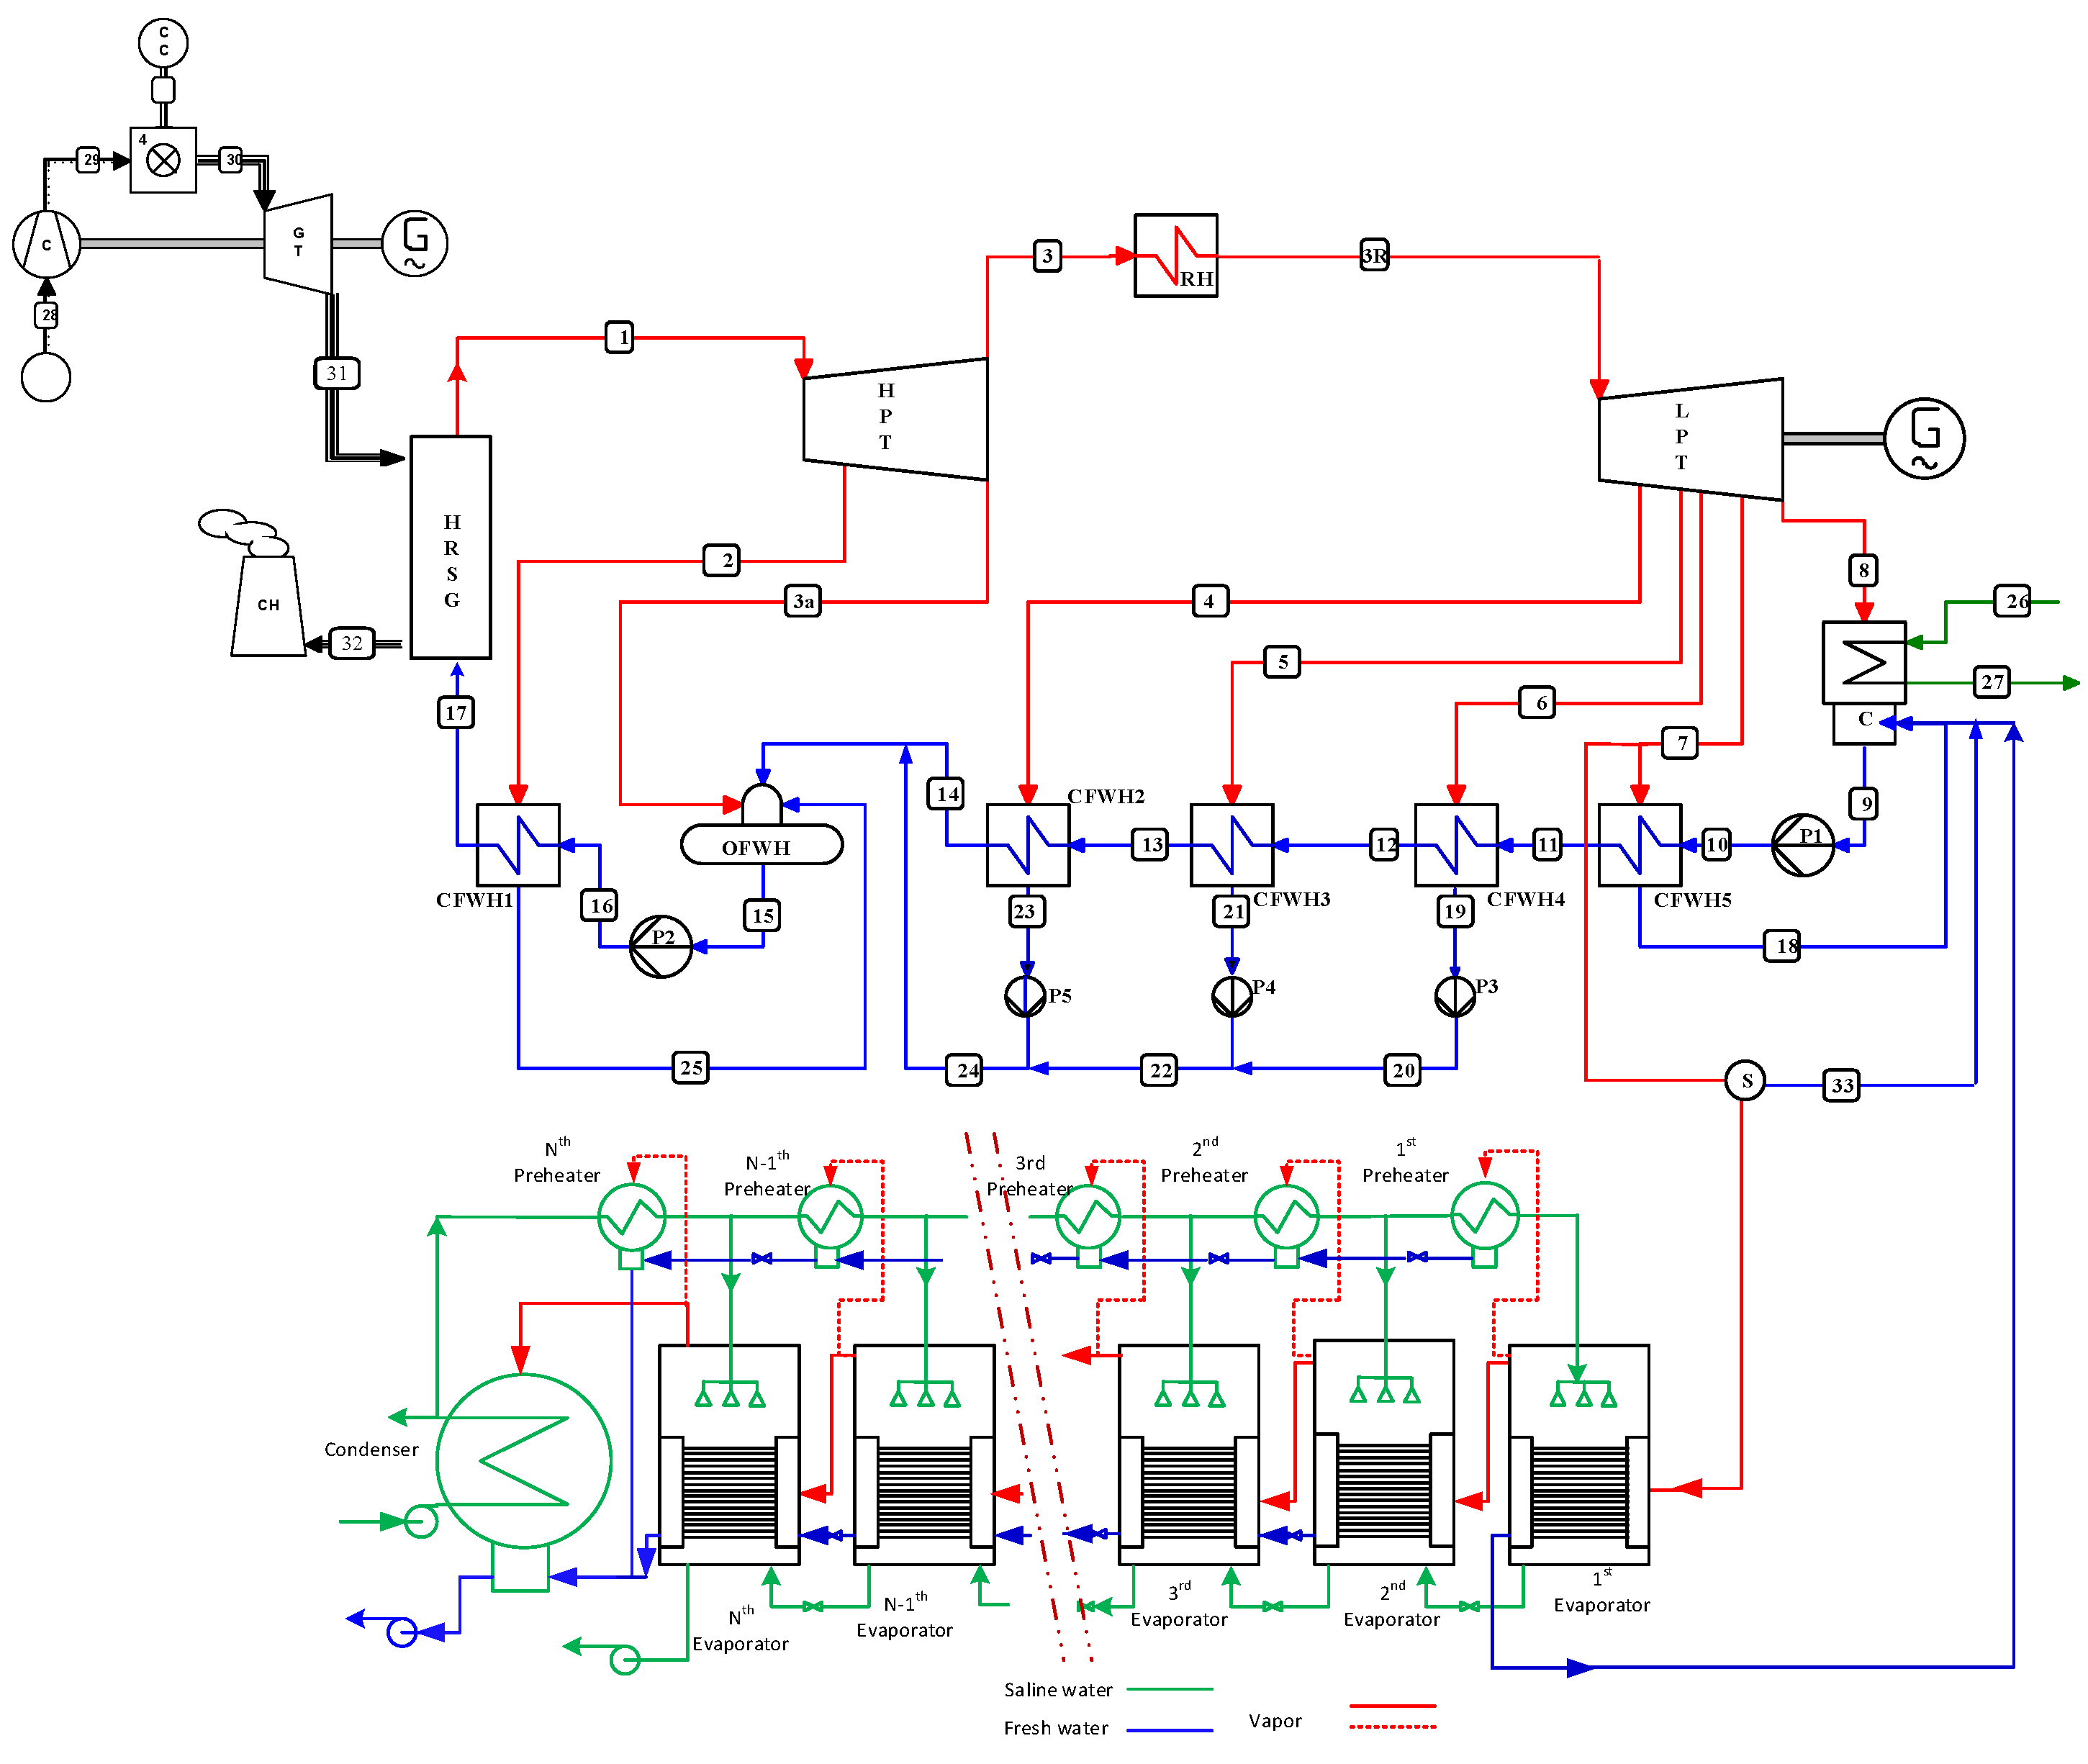
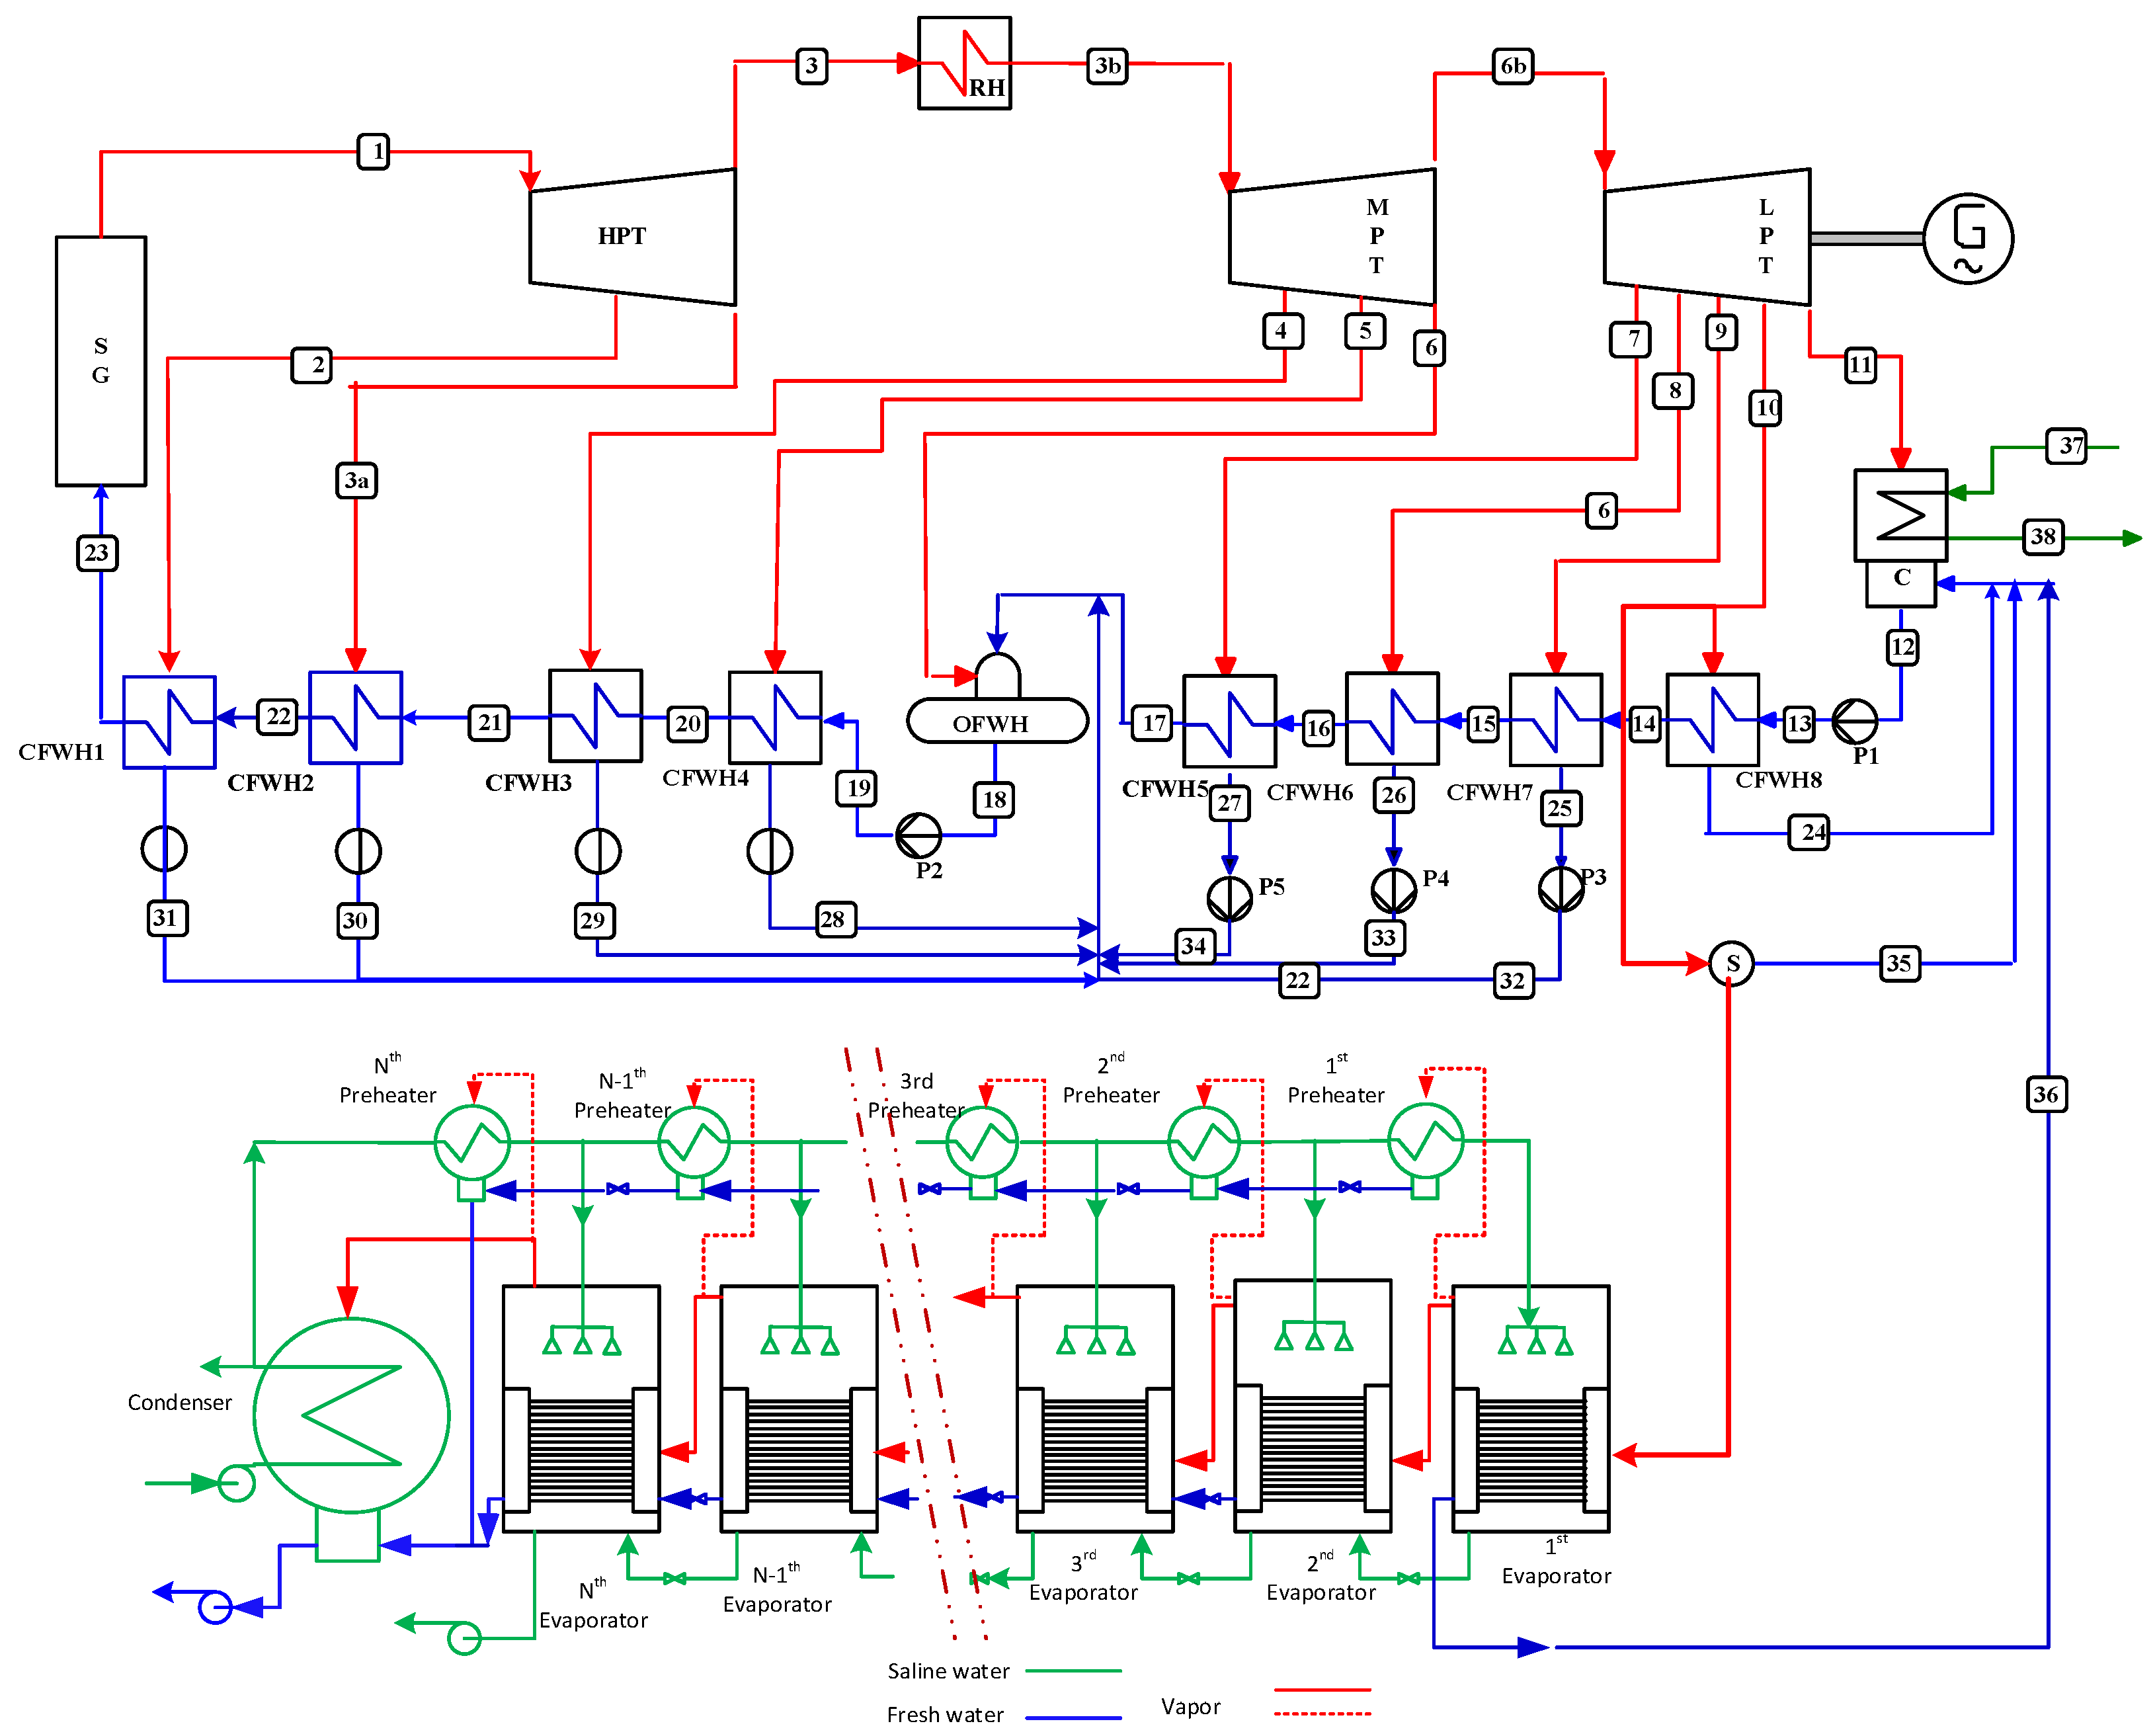
3. Cogeneration Plant Simulation
In the cogeneration plant simulation, thermodynamic models of plain MED, MED-PH, MED-TVC, and MSF systems [30,31] were integrated into an ScPP model for the configurations shown in Figure 1, Figure 2, Figure 3 and Figure 4. The validation of the desalination models was discussed in [27]. In addition, a model of MED-PH was integrated into the models of SPP, CPP, and NPP plants presented in [27], and their configurations are shown in Appendix A. The main specifications and parameters of the investigated desalination systems are listed in Table 3.
Table 3.
Desalination system characteristics.
The investigated plain MED and MED-PH systems consisted of eight effects, as shown in Figure 1 and Figure 2. The steam was withdrawn at the ninth feed water heater to heat the MED and MED-PH systems, as shown in Figure 1 and Figure 2. The thermal simulation of the ScPP coupled to a MED or a MED-PH was conducted for different desalination daily capacities using EES software [29]. The energy requirement to run the MED and MED-PH was determined according to the PAM and HAM approaches discussed before. Figure 3 shows the investigated MED-TVC system. The MED-TVC consisted of 10 effects where the TVC extracted vapor from the seventh effect. The heating vapor was fed to the first effect at 70 °C. The examined once-through MSF, shown in Figure 4, consisted of 40 stages where the top brine temperature was maintained at 120 °C and the TTD was fixed at 7 °C at the MSF exit [31]. The thermal gain output ratio of the simulated systems is included in Table 3 The thermal gain output ratio GORth, based on the energy ratio, was estimated as follows:
where md is the desalination capacity in kg/s, mhs is the steam withdrawn to heat the thermal desalination system, hfgN is the latent heat at the last effect or the last stage, and ∆hhs is the drop in the enthalpy of the extracted steam. The data obtained for the cases investigated by Zeitoun et al. [27] are also included in Table 3.
3.1. Desalination Energy Requirement According to PAM
In the PAM approach, the decrease in the power plant net output was considered as the energy necessary to run the desalination system. The fuel energy (QH) supplied to the boiler was kept at a rate of 3000 MW. The power requirement to run the desalination system WD included the power lost due to the steam extraction and the power required to run the pumps of the desalination system [27]:
where ΔW is the drop in the cogeneration plant output power [27];
Wfull represents the full power of the stand-alone plant, and Wp represents the power developed by the cogeneration plant. Wpump is the power required to circulate the seawater and to extract the produced fresh water and concentrate brine from the desalination unit; see Appendix B for details.
The specific work WPAM (kWh/m3), which is the work needed to yield one cubic meter of fresh water, can be estimated by dividing the daily energy consumption in kWh by the daily desalination capacity:
The equivalent specific heat QPAM (kWh/m3), which is the heat needed to produce one cubic meter of fresh water, was determined from the following:
where ηov is the stand-alone power plant overall efficiency at the full load. The specific work and heat required to run the different investigated desalination systems, using the PAM method, are shown in Figure 5 and Figure 6, respectively. WPAM data for the investigated configuration are also listed in Table 3.
Figure 5.
Specific work needed to operate different desalination processes connected to ScPP.
Figure 6.
Specific heat needed to operate different desalination processes connected to ScPP.
3.2. Desalination Energy Requirement According to HAM
In the HAM method, the ScPP output connected to a desalination unit was maintained at the designed full load Wfull, (Table 2). Consequently, the heat input to the cogeneration plant was increased by ∆Q to maintain the full load. This heat increase is needed to compensate for the thermal energy of the steam pulled out to heat the desalination unit. It was assumed that the boiler of the ScPP could produce additional steam to cover the heating steam needs of the connected desalination system. The heat needed to run the desalination system includes the heat increase and the heat corresponding to the pumping work of the desalination system:
The specific heat QHAM (kWh/m3), which is the heat needed to produce one cubic meter of fresh water, was estimated by dividing the daily heat consumption in kWh by the daily desalination capacity:
The specific equivalent work WHAM (kW h/m3), which is the work needed to produce one cubic meter of fresh water, can be estimated as follows:
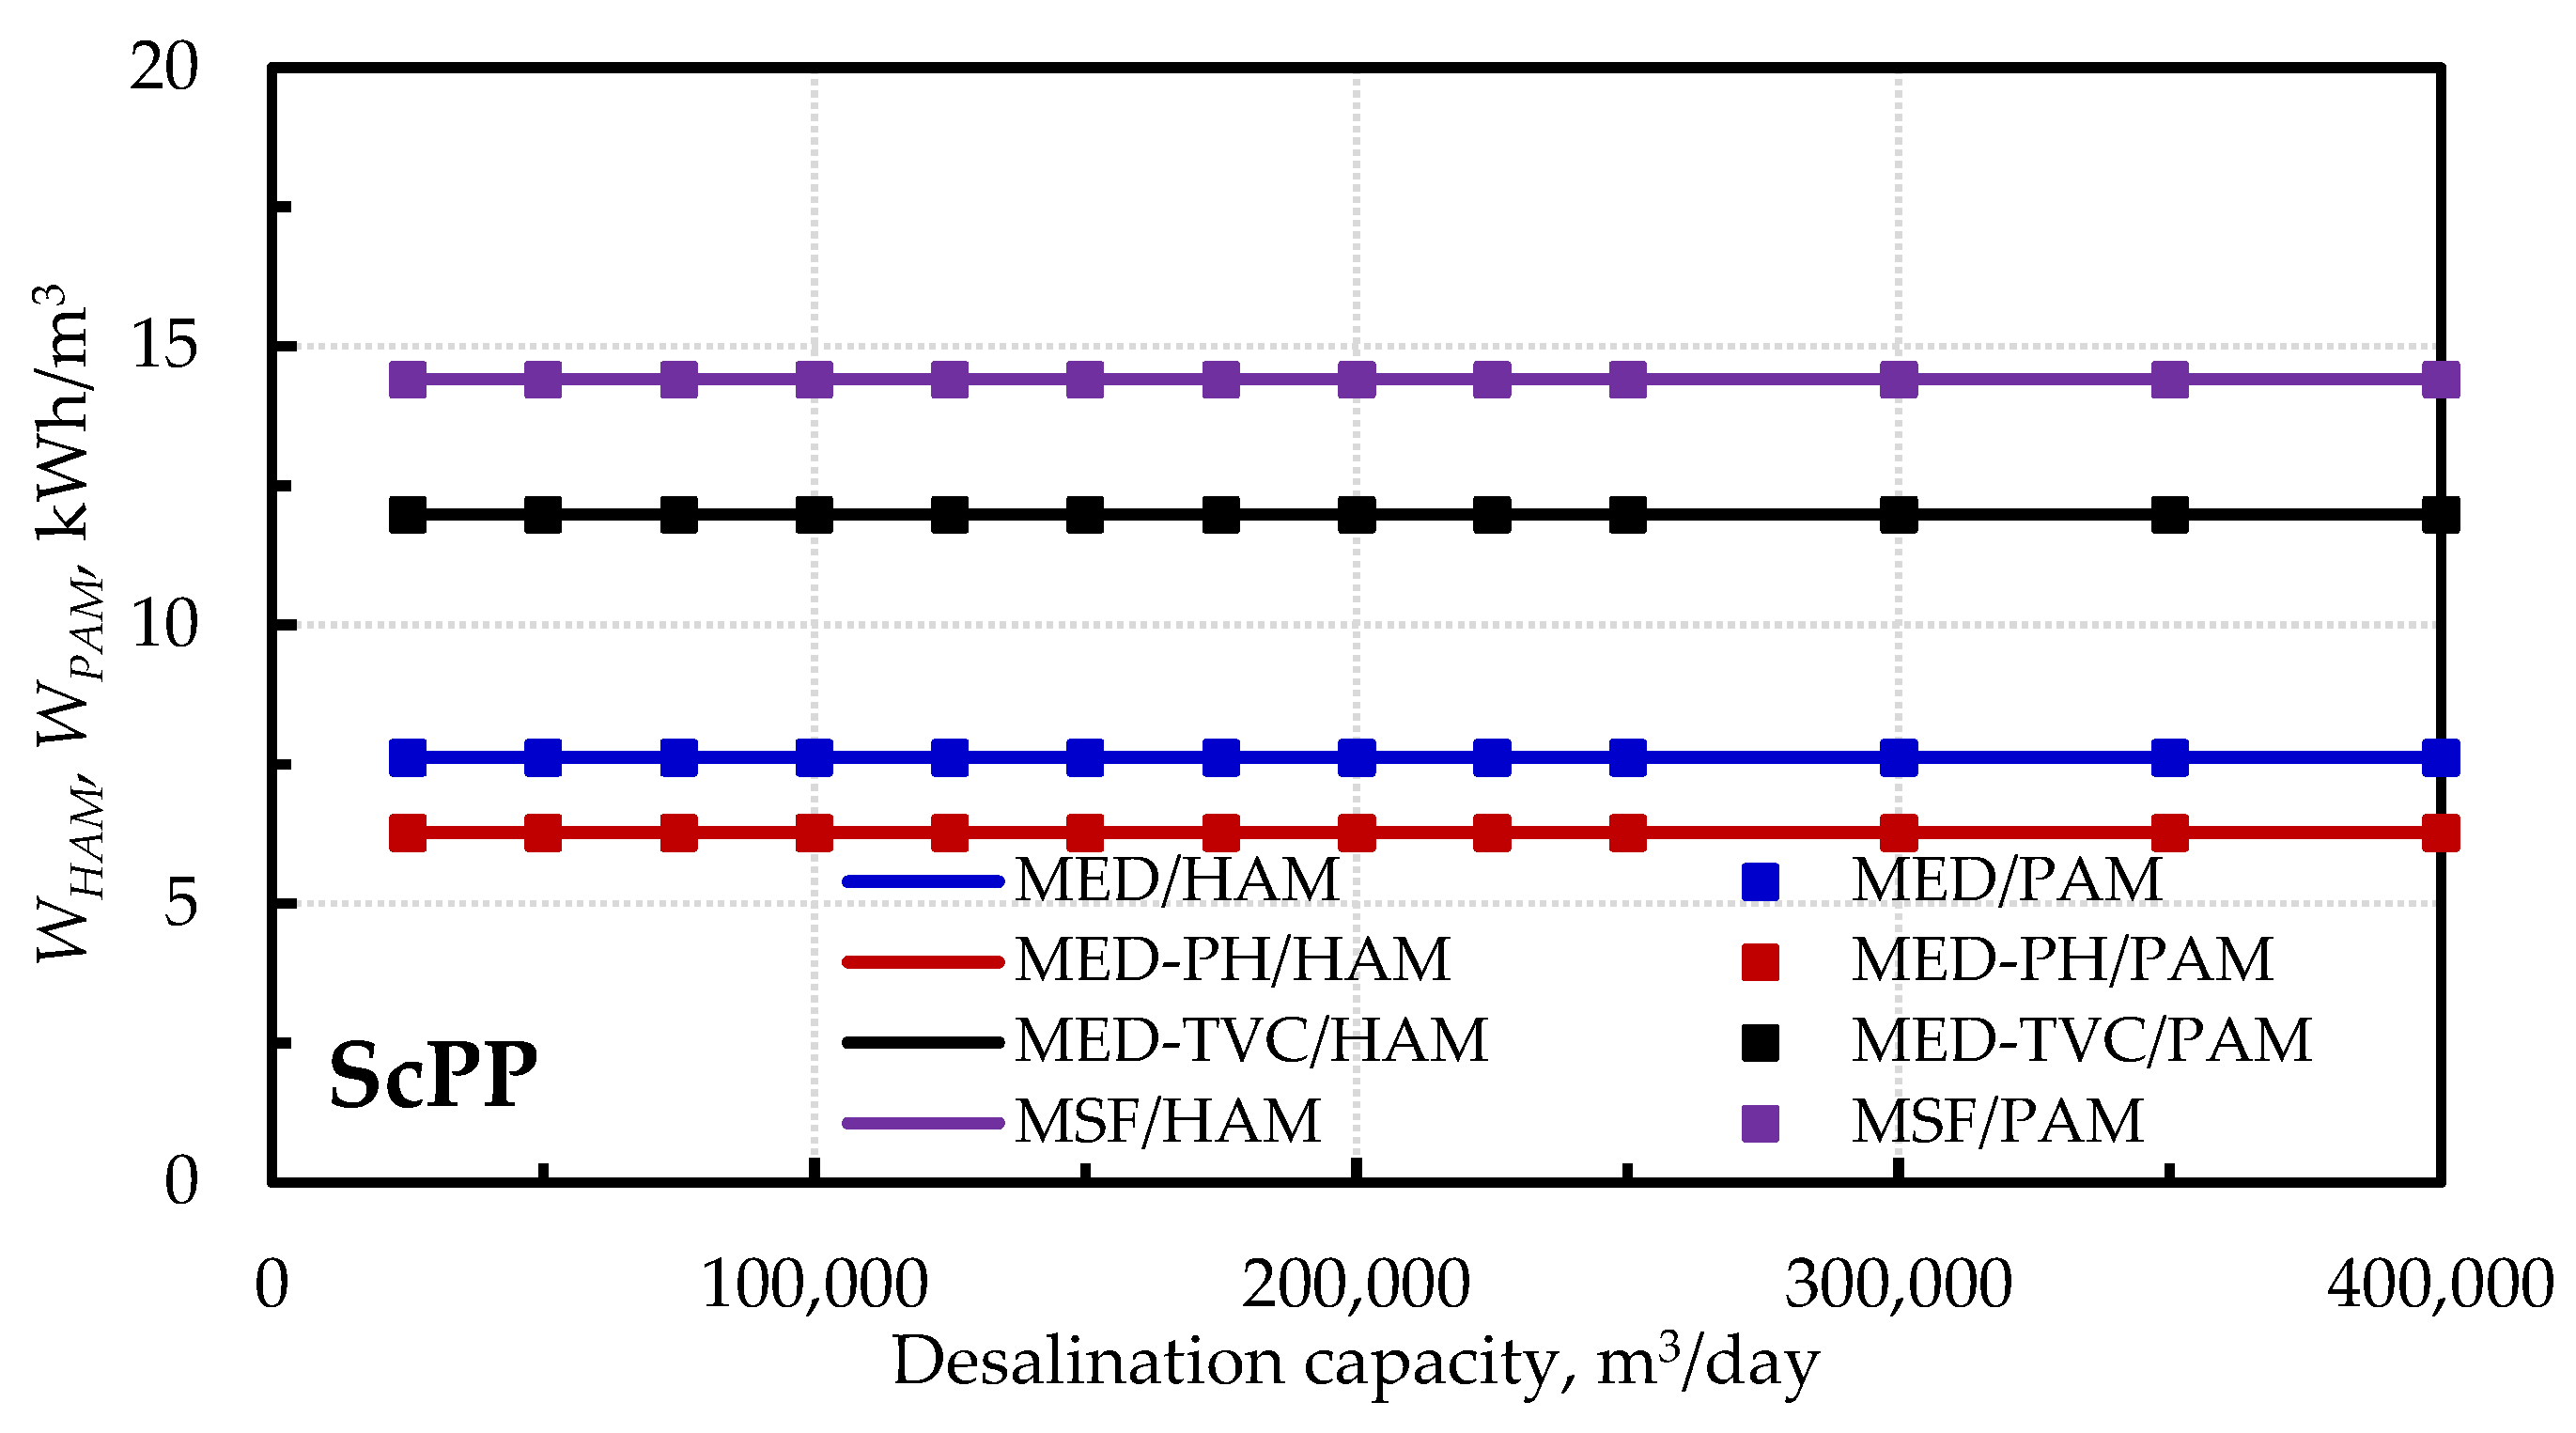
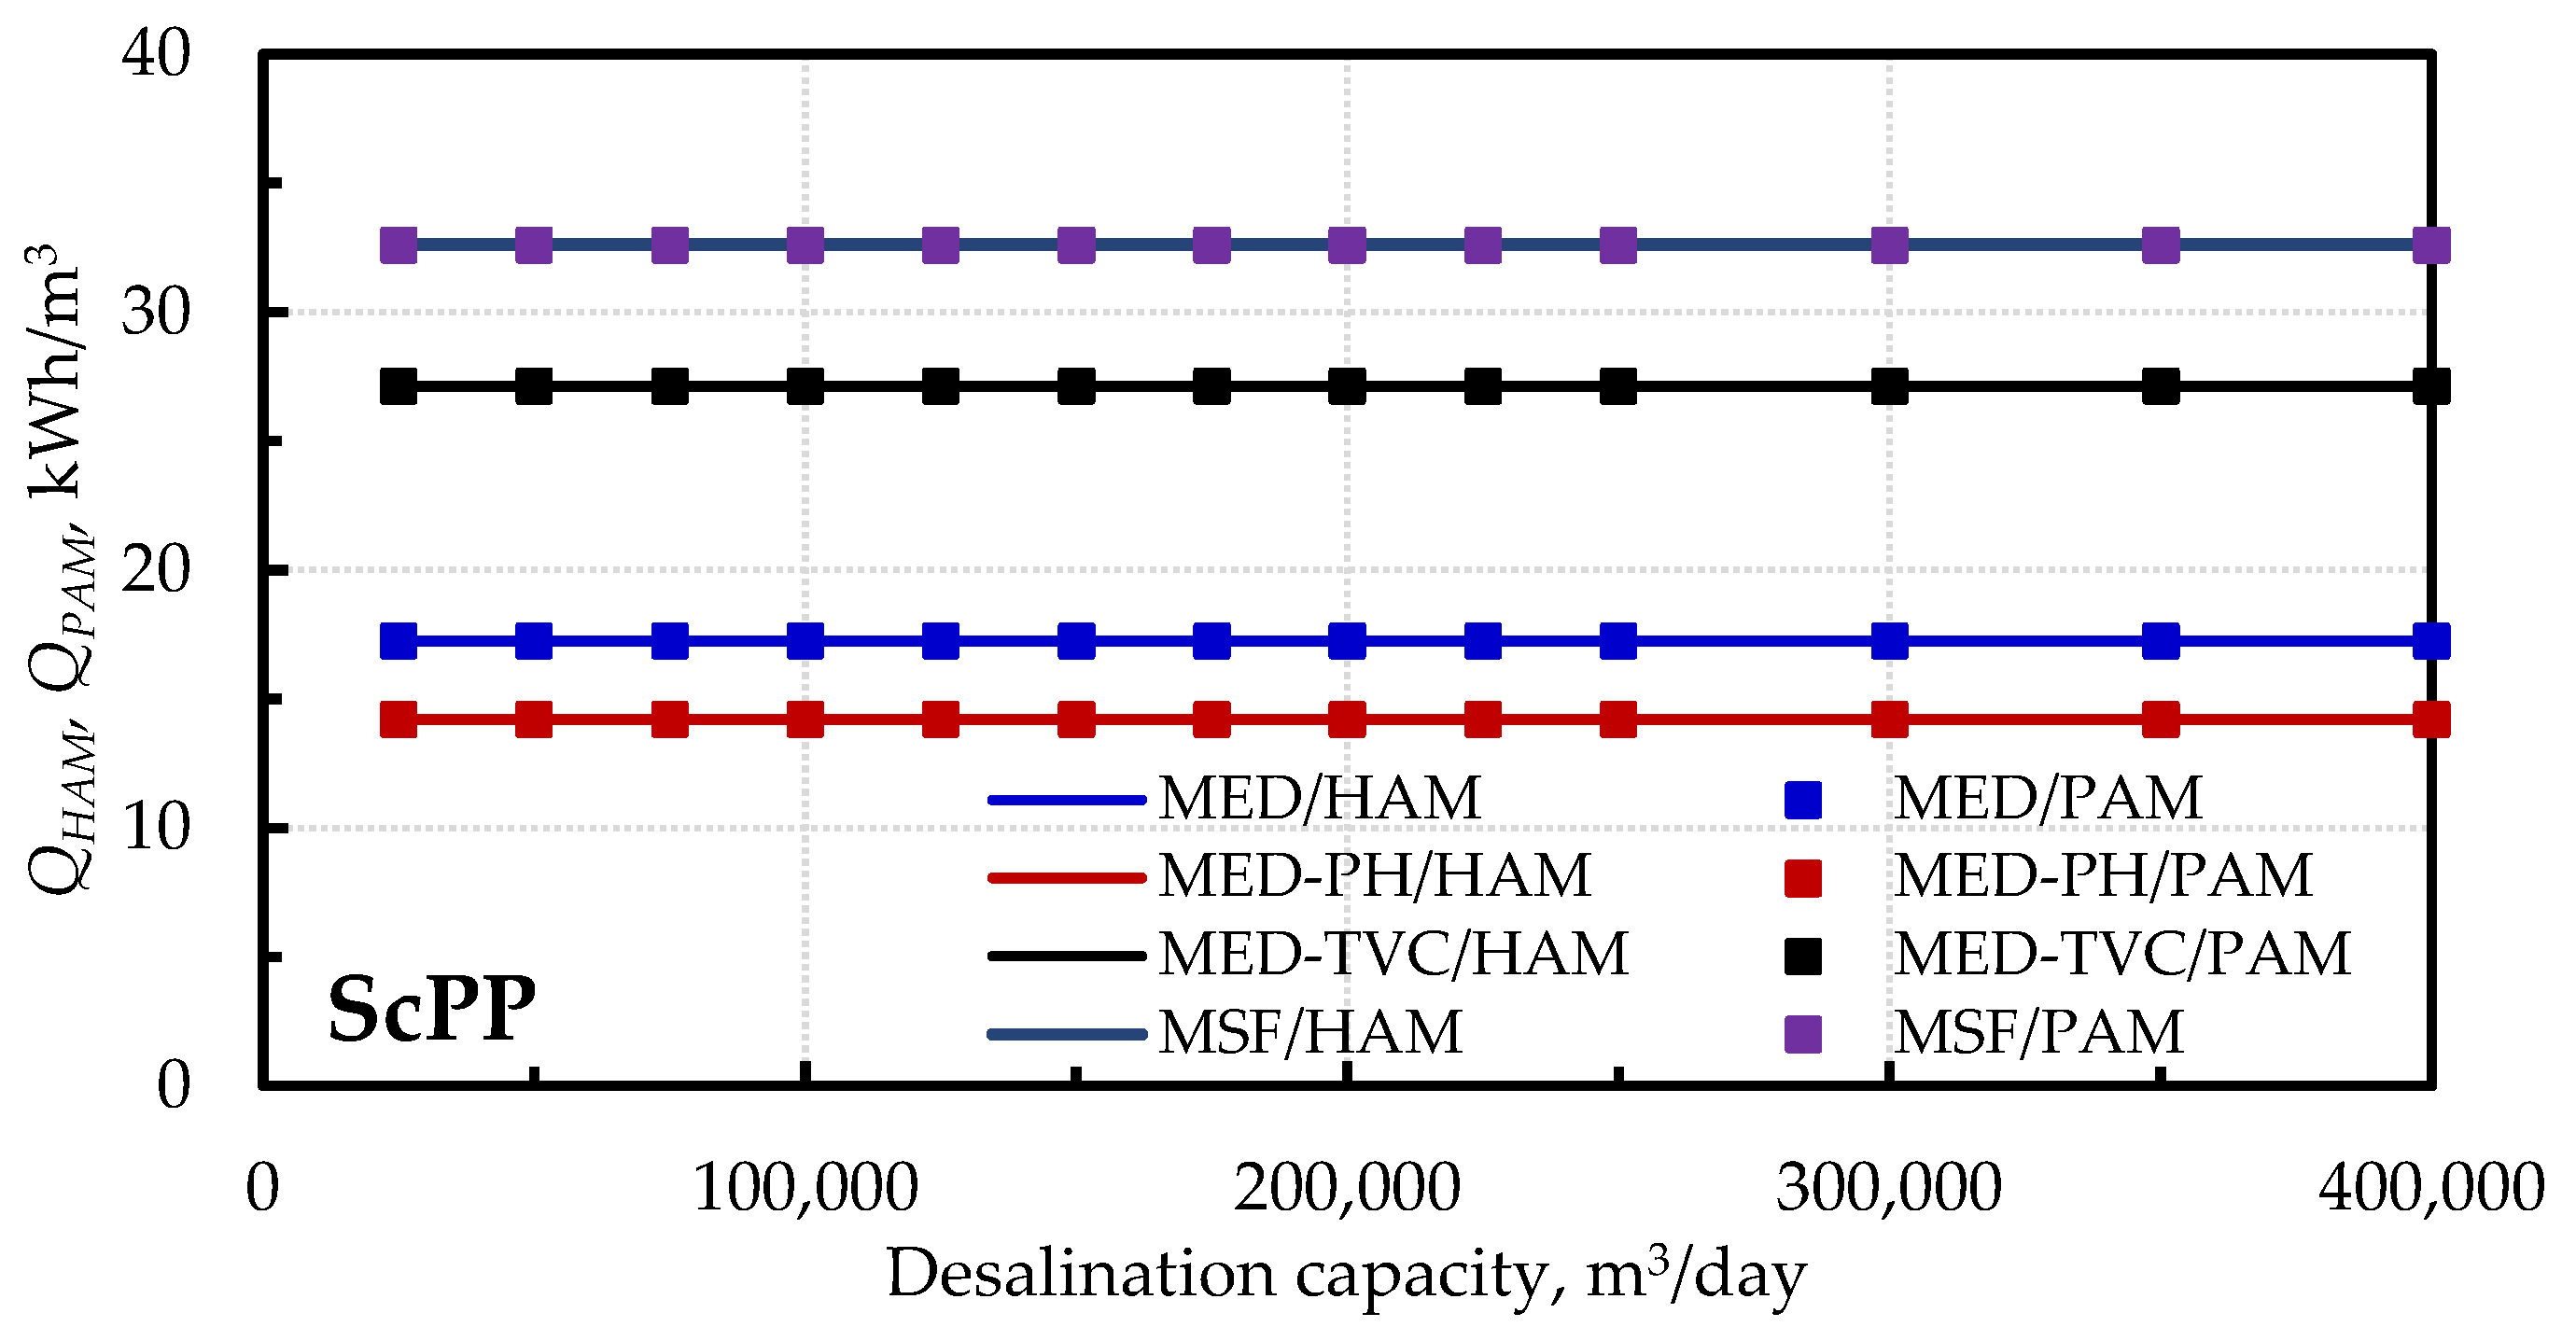
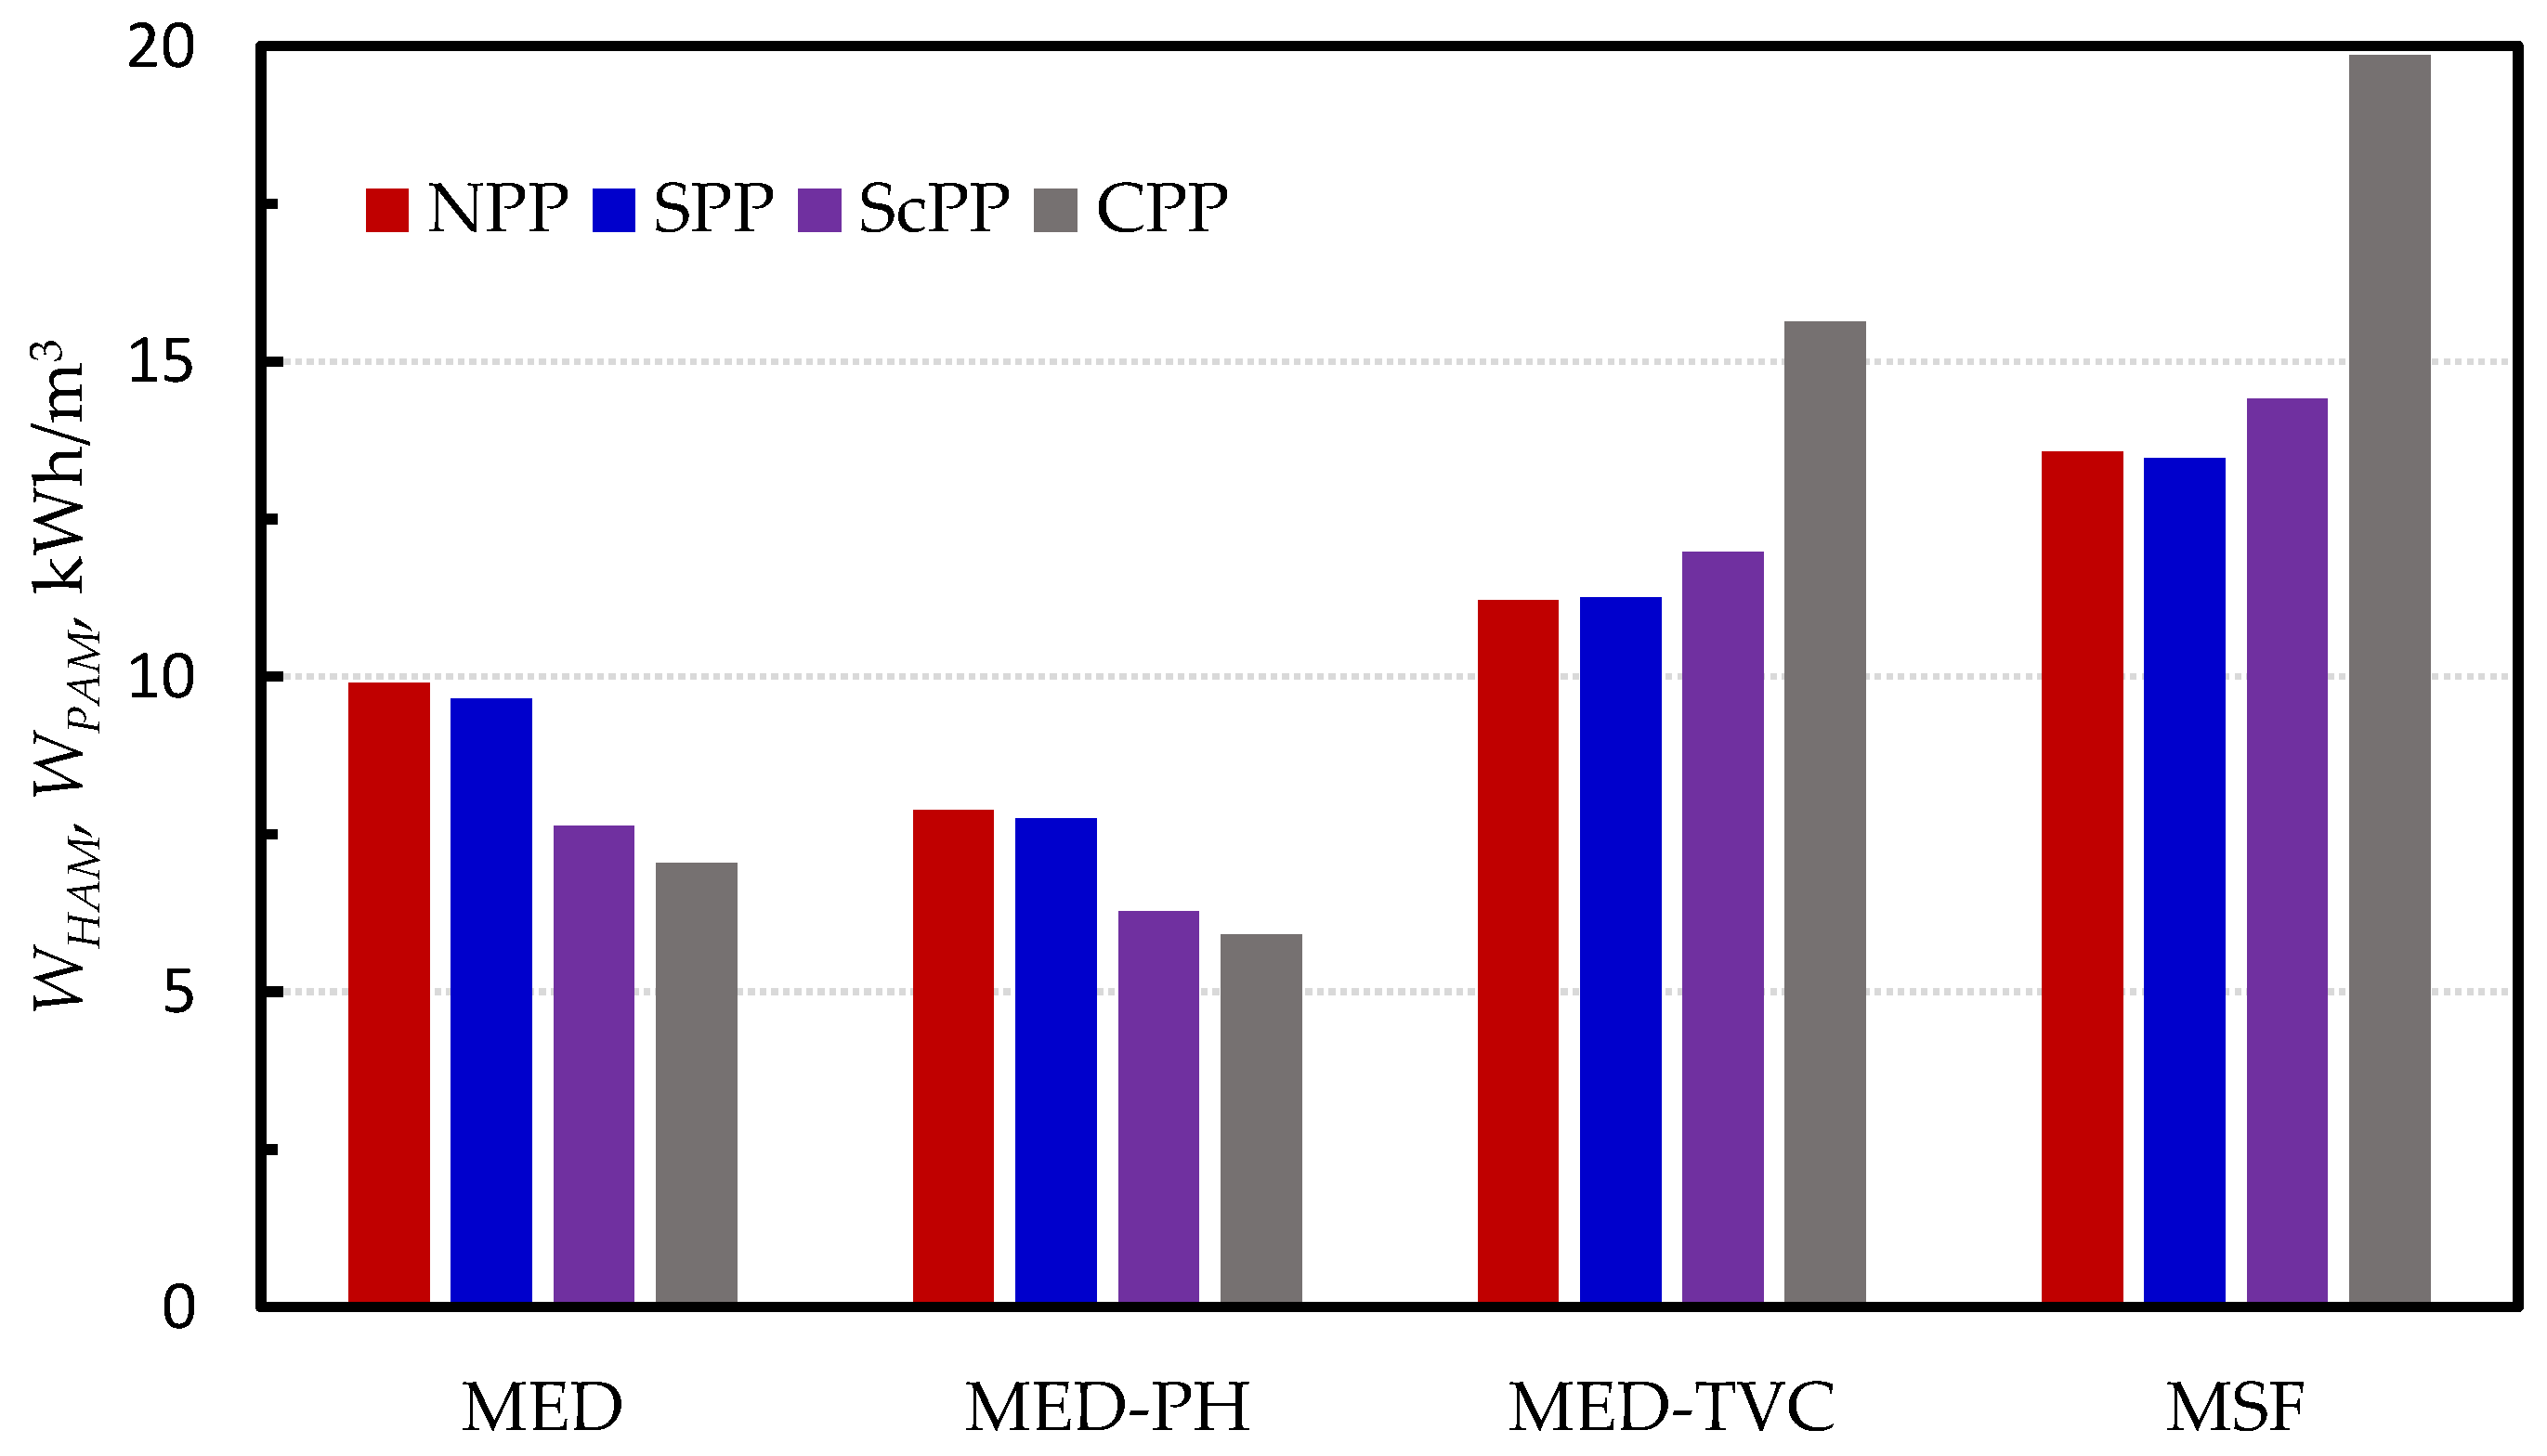
3.3. Results for Energy Requirements of Desalination Systems
The data shown in Figure 5 and Figure 6 and listed in Table 3 indicate that the PAM and HAM approaches lead to the same results, and the specific heat and work needed to operate the examined desalination systems are independent of the systems’ daily desalination capacities. The obtained data revealed that the energy needed to run the MED-PH system is the lowest and the energy needed to operate the MSF system is the highest. Extracting steam with high pressure, as in MSF and MED-TVC, reduces the power output of the low-pressure steam turbines, leading to a significant increase in the energy needed to operate the MSF and MED-TVC systems. The energy needed to run the desalination system does not mainly depend on the GORth of the desalination system. The MED-TVC system, of high GORth, needs more energy than the simple MED system of low GORth. The GORth of the desalination system does not separately indicate the efficiency of the desalination unit. The overall efficiency of the power plant represents a main parameter in determining the efficiency of the desalination plant.
Figure 7 and Figure 8 show the specific work and heat needed to operate different desalination systems. The data for the needed work of Figure 7 falls near the range reported by Al-Karaghouli and Kazmerski [32]. They reported 14.45–21.35 kWh/m3 for MED-TVC and 19.6–27.25 kWh/m3 for MSF. These values were estimated based on 30% overall power plant efficiency. Figure 8 shows that the heat needed to run the desalination system decreases as the overall efficiency of the plant increases. However, the trend is different for MED-TVC and MSF connected to a CPP. There are two reasons for this problem: the high pressure of the extracted steam and the limited amount of steam in the CPP. These two factors dramatically affect the performance of the CPP connected to MED-TVC or MSF.
Figure 7.
Specific work needed to run desalination systems.
Figure 8.
Specific heat needed to run desalination systems.
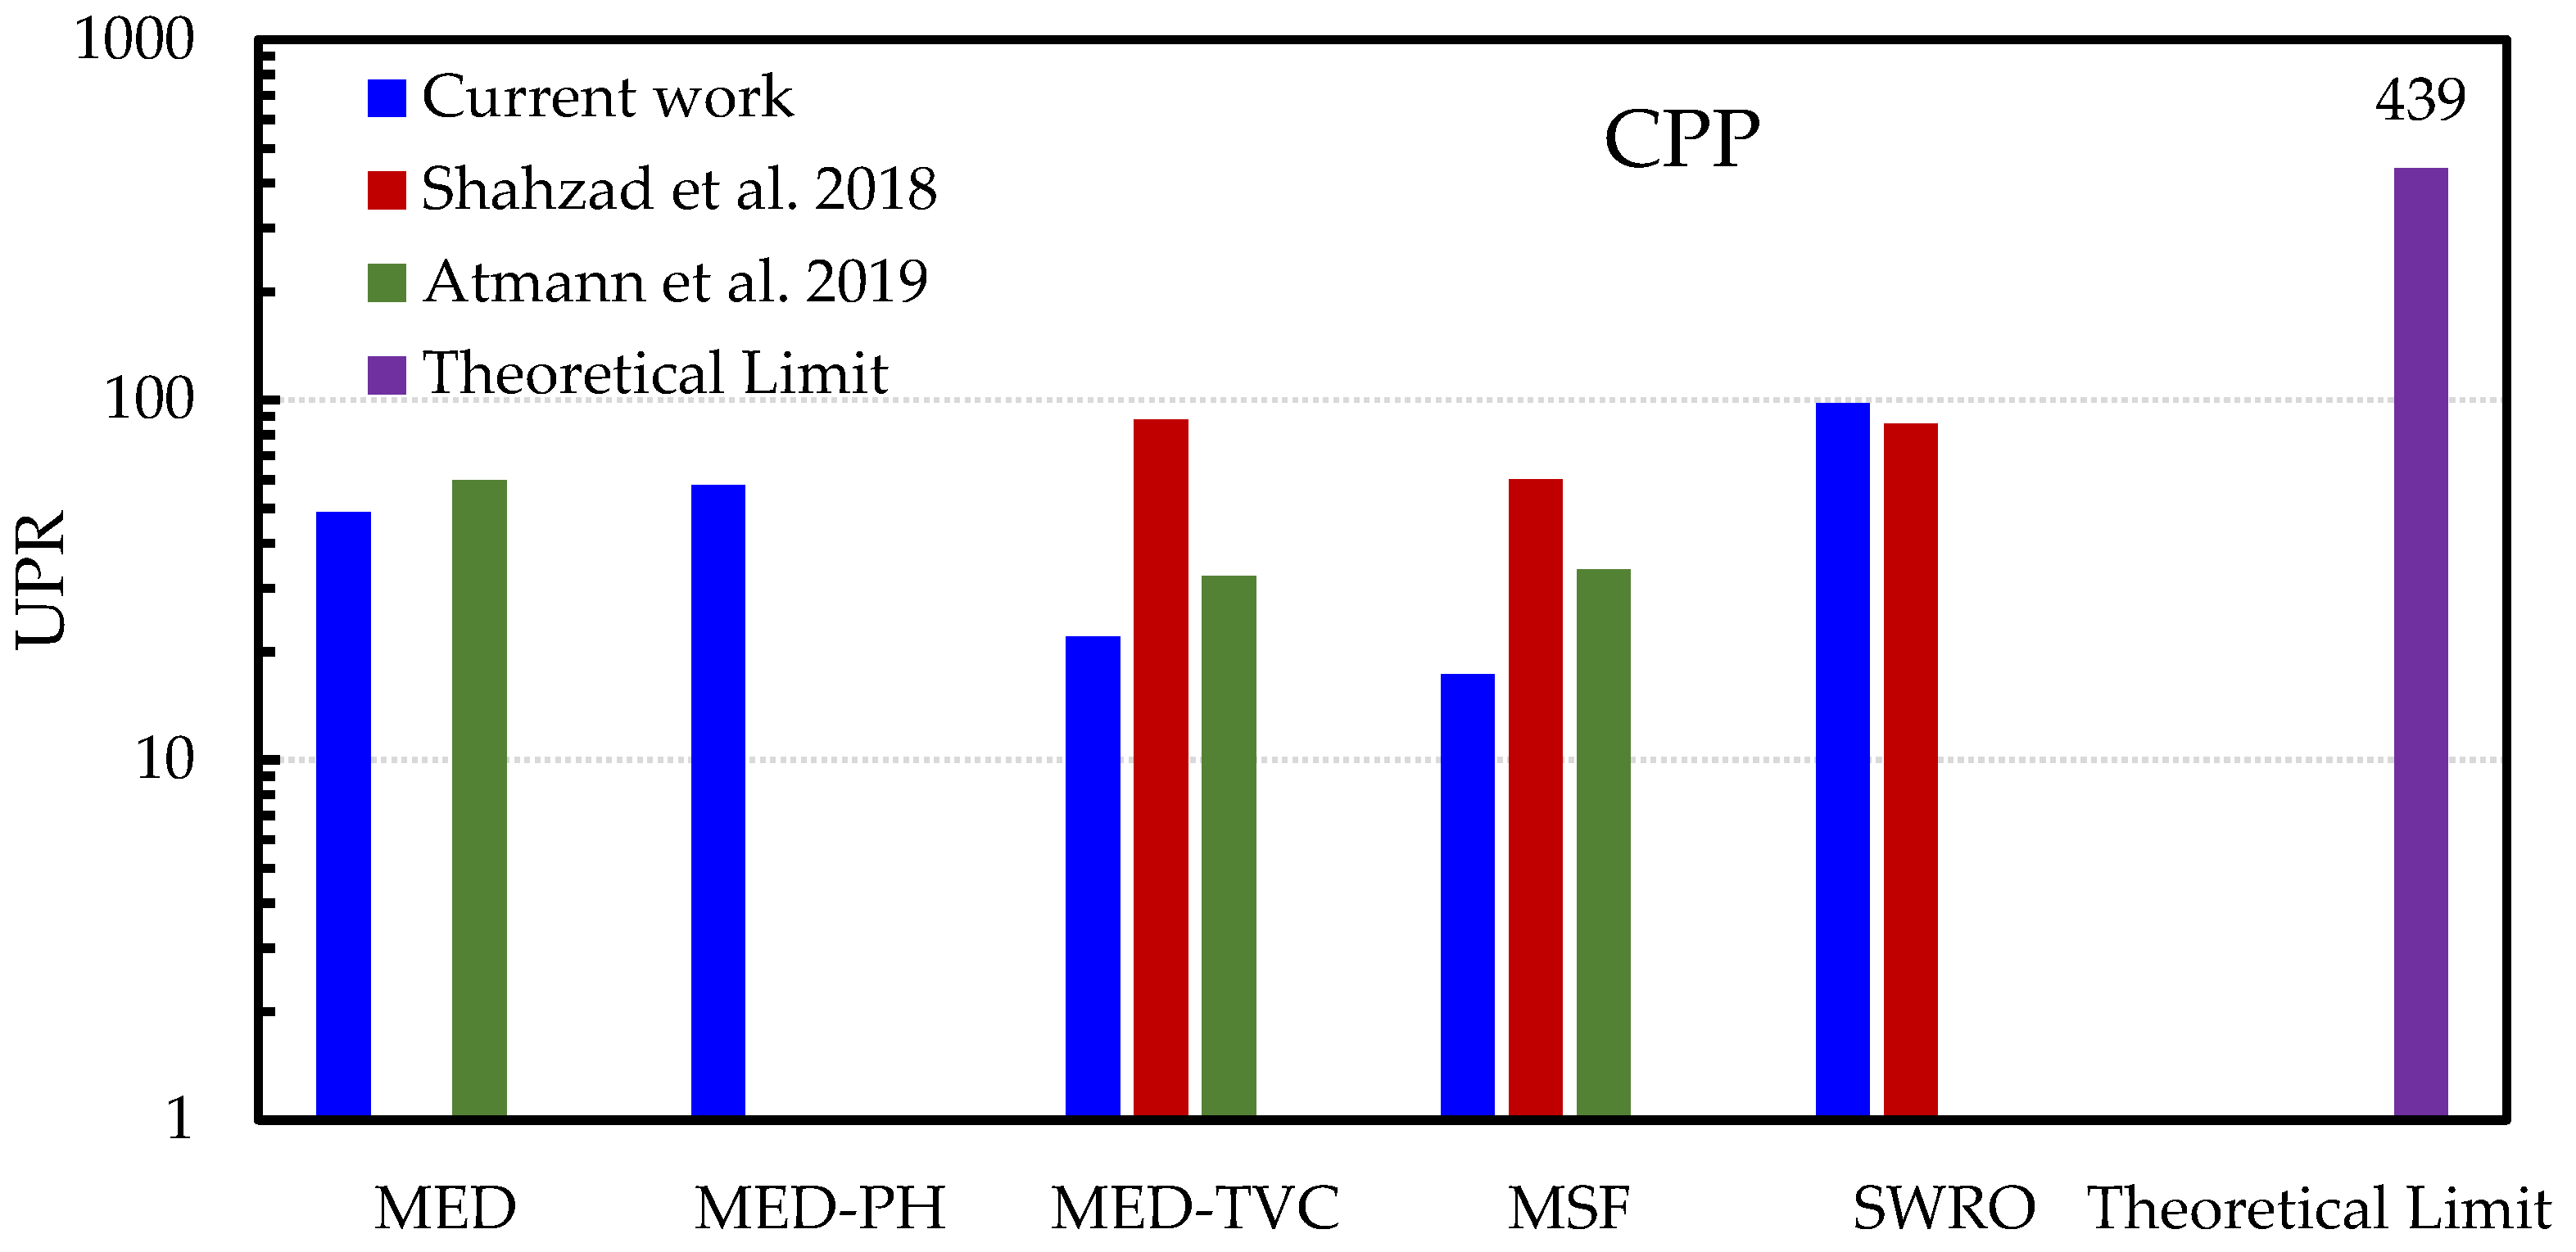
4. Universal Performance Ratio
The universal performance ratio (UPR) presented in [21,22] can be used to indicate the performance of a thermal desalination unit connected to a power plant. The UPR represents the ratio between the heat required to evaporate the desalinated water production rate and the thermal primary form of energy required to run the desalination system. UPR was reduced to the following form in the current investigation:
QHAM can be replaced by QPAM. The obtained UPR data are included in Table 3. Figure 9 shows the UPR for different desalination systems. Figure 9 indicates that the simple MED without or with preheaters, MED or MED-PH, performs better than MED-TVC, which was also concluded by [10]. Removing the TVC will also reduce the capital investment in the desalination system. The UPR of MSF is the poorest compared to simple MED, MED-PH, and MED-TVC. The reason for the low UPR of MSF and MED-TVC is the high reduction in the power plant output due to the high pressure of the extracted steam. Figure 9 indicates that the UPR mainly depends on the power plant’s overall efficiency. For simple MED and MED-PH, the UPR significantly increases from NPP to CPP, i.e., from a low-efficiency to high-efficiency plant. The UPR of the desalination systems connected to the CPP is the best due to the CPP’s high efficiency. However, when a CPP is connected to MED-TVC or MSF, the UPR decreases. As discussed earlier, there are two reasons for this problem: the high pressure of the extracted steam required to heat the desalination system and the limited quantity of steam in the CPP.
Figure 9.
Universal performance ratio of desalination systems connected to different power plants.
As reported by [21,22], the minimum work for salt separation is Wmin = 0.78 kWh/m3. The theoretical limit of a desalination system connected to the CPP can be estimated as follows:
where ηov is the overall efficiency of the CPP at full load. As mentioned before, the energy required to run the desalination system was estimated by [10,21,22] using the exergy approaches. Figure 10 illustrates a comparison between the theoretical limit, the current data, and the data of [10,21,22]. The energy required to run SWRO, in the current investigation, is based on a specific work consumption of 3.5 kWh/m3, as obtained from [33]. The data in Figure 10 indicate the large gap between the theoretical limit and the actual cases.
Figure 10.
Comparison between UPR of desalination systems connected to CPP [10,22].
Investigating the UPR data in Figure 9 or Table 3 indicates that the UPR depends on the GORth of the desalination system and the overall efficiency of the stand-alone power plant. It is known that the performance of the cogeneration system deteriorates as the pressure of the extracted steam increases. Consequently, a new parameter was introduced to design a correlation for UPR prediction. This parameter represents the efficiency of the Rankine cycle related to the desalination process. This efficiency ηD represents the ratio between the lost expansion turbine work and the thermal energy extracted from the heating steam,
where ha is the enthalpy of the extracted steam to heat the desalination system, hb is the enthalpy of the low-pressure turbine exit, and hfr is the enthalpy of the saturated liquid returned to the power plant cycle. The following correlation was introduced to predict the UPR:
The predicted UPRs of this correlation are listed in Table 3. The differences between predicted UPRpr and system UPR are also listed in Table 3. The comparison between the predicted UPRpr and UPR data is shown in Figure 11. For MED and MED-PH systems, the predictions of the new correlation are reasonably good and fall within +1.5 and 5.7% of the system UPR. For MED-TVC and MSF, the predictions of the correlation are reasonable and fall within −10% and +16.8% of system UPR. The differences between predicted and actual UPR can be attributed to the extracted steam conditions, which are not completely dry saturated. The extracted steam was either superheated or wet vapor.
Figure 11.
Validation of UPR correlation.
5. Conclusions
The energy required to operate desalination systems coupled to different power plants was investigated using the power- and heat-allocated methods. Both procedures led to the same results. The obtained data revealed the following:
- The specific heat and work needed to operate the examined desalination systems are independent of daily system desalination capacity.
- The MED-PH system needs the lowest amount of energy to operate.
- The MSF system needs the highest amount of energy to operate.
- The MED-TVC system needs more energy than the simple MED system.
- Extracting steam with high pressure, as in MSF and MED-TVC, reduces the output power of the low-pressure turbines, leading to a significant increase in the energy required to run the desalination systems.
- The GORth of the desalination system, in cogeneration plants, does not independently indicate the effectiveness of the desalination plant. The overall efficiency of the power plant is a main parameter in determining the effectiveness of the desalination plant.
The universal performance ratio, based on the thermal primary form of energy input, was used to evaluate the systems’ performance. A new correlation was introduced to predict the universal performance ratio. The predicted value of the new correlation was good for the plain MED and MED-PH systems and reasonable for the MED-TVC and MSF systems. For the MED and MED-PH systems, the predictions of the UPR correlation fell within +1.5 and 5.7% of the actual UPR. For the MED-TVC and MSF, the predictions of the UPR correlation fell within −10% and +16.8% of system UPR.
Funding
This work was supported by King Saud University, Deanship of Scientific Research and the Research Center of the College of Engineering.
Data Availability Statement
Data are contained within the article.
Acknowledgments
The author thanks the Deanship of Scientific Research and RSSU at King Saud University, and the Research Center of the College of Engineering for their technical support.
Conflicts of Interest
The author declares no conflict of interest.
Abbreviations
| Acronyms | |
| CFWH | Closed-feed water heater |
| CPP | Combined power plant |
| EES | Engineering equation solver |
| FWH | Feed-water heater |
| HAM | Heat-allocated method |
| HPT | High-pressure turbine |
| LPT | Low-pressure turbine |
| MED | Multi-effect desalination |
| MED-PH | Multi-effect desalination with preheaters |
| MED-TVC | Multi-effect desalination with thermal vapor compression |
| MPT | Medium pressure turbine |
| MSF | Once through multi-stage flash |
| NPP | Nuclear power plant |
| OFWH | Open feed-water heater |
| PAM | Power-allocated method |
| PH | Preheater |
| SG | Steam generator |
| SPP | Steam power plant |
| ScPP | Supercritical power plant |
| SWRO | Seawater reverse osmosis |
| RH | Reheater |
| RO | Reverse osmosis |
| RO-MED | Hybrid reverse osmosis multi-effect desalination |
| TTD | Terminal temperature difference at exit of the last stage of MSF |
| Nomenclature | |
| GORth | Gain output ratio, energy-based |
| HR | Heat rate, kJ/kWh |
| h | Enthalpy, kJ/kg |
| hfgN | Latent heat of vaporization at the last stage or effect |
| mD | Desalination capacity, m3/day |
| md | Desalination capacity, kg/s |
| mhs | Steam extracted to heat desalination plant, kg/s |
| N | Number of stages or effects |
| NTVC | The number of effects connected to TVC |
| P | Pressure, bar |
| QH | Heat added, MW |
| QHAM | Specific heat estimated based on HAM, kWh/m3 |
| QPAM | Specific heat estimated based on PAM, kWh/m3 |
| UPR | Universal performance ratio |
| T | Temperature, °C |
| W | Power, MW |
| WHAM | Specific work estimated based on HAM, kWh/m3 |
| WPAM | Specific work estimated based on PAM, kWh/m3 |
| Greek symbols | |
| ∆hhs | Enthalpy drop, kJ/kg |
| ∆Q | Increase in heat added, MW |
| ∆W | Loss in power, MW |
| η | Efficiency |
| Subscript | |
| c | Compressor |
| D | Desalination |
| full | Full Load |
| m | Mechanical |
| ov | Overall |
| pump | Pumps Of Desalination Systems |
| t | Turbine |
| sat | Saturation |
Appendix A. Power Plants and Desalination Systems
Figure A1.
SPP-MED-PH.
Figure A2.
NPP-MED-PH.
Figure A3.
CPP-MED-PH.
Appendix B. Pumping Work
For MED systems, the work needed to circulate sea water, brine and fresh water along the system was estimated from the following equation; note that the friction pressure drop was ignored in the current calculation:
where:
Vc, Vf, Vd and Vb are condenser cooling water, MED feed, desalinated water and brine flow rates in m3/s, respectively.
Pdisch is the discharge pressure of fresh water, brine and condenser cooling water. It is assumed to be 60% higher than atmospheric pressure to compensate for friction losses.
PN is the pressure in the last effect of MED system.
Pf is the pressure needed by MED sprinklers. It is assumed to be 500 kPa.
ηpump is the pump efficiency.
For MSF systems, the work needed to circulate sea water, brine and fresh water along the system was estimated from the following equation; note that the friction pressure drop was ignored in the current calculation:
where:
Vf, Vd and Vb are MSF feed, desalinated water and brine flow rate in m3/s, respectively.
Pdisch is the discharge pressure of fresh water and brine water. It is assumed to be 60% higher than atmospheric pressure to compensate for friction losses.
PN is the pressure in the last stage of MSF system.
Ps1 is the pressure of sea water at the inlet of the first stage of MSF. It was assumed to be 60% higher than the saturation pressure of the first stage of MSF to compensate for the friction losses.
References
- Gao, L.; Yoshikawa, S.; Kanae, S. An Economic Assessment of the Global Potential for Seawater Desalination to 2050. Water 2017, 9, 763. [Google Scholar] [CrossRef]
- Haynes, M.; Gunawan, A.; Yee, S. Techno-Economic Comparison between Conventional and Innovative Combined Solar Thermal Power and Desalination Methods for Cogeneration. In Proceedings of the ASME 2018 Power Conference, Lake Buena Vista, FL, USA, 24–28 June 2018. [Google Scholar] [CrossRef]
- Ghaffour, N.; Missimer, T.M.; Amy, G.L. Technical review and evaluation of the economics of water desalination: Current and future challenges for better water supply sustainability. Desalination 2013, 309, 197–207. [Google Scholar] [CrossRef]
- Jamil, M.A.; Shahzad, M.W.; Zubair, S.M. A comprehensive framework for thermoeconomic analysis of desalination systems. Energy Convers Manag. 2020, 222, 113188. [Google Scholar] [CrossRef] [PubMed]
- Khan, S.; Khan, S. Karachi nuclear power plant (KANUPP): As case study for techno-economic assessment of nuclear power coupled with water desalination. Energy 2017, 127, 372–380. [Google Scholar] [CrossRef]
- Haya, N.; Shaheen, F.; Raed, H.; Nidal, H. Energy for desalination: A state-of-the-art review. Desalination 2020, 491, 114569. [Google Scholar] [CrossRef]
- Sadeghi, K.; Ghazaie, S.; Sokolova, E.; Fedorovich, E.; Shirani, A. Comprehensive techno-economic analysis of integrated nuclear power plant equipped with various hybrid desalination systems. Desalination 2020, 493, 114623. [Google Scholar] [CrossRef]
- Sadeghi, K.; Ghazaie, S.; Fedorovich, E.; Sokolova, E.; Shirani, A. Economic assessment of the possible desalination processes for the first unit of Bushehr nuclear power plant. Therm. Eng. 2020, 67, 271–281. [Google Scholar] [CrossRef]
- Kavvadias, K.; Khamis, I. The IAEA DEEP desalination economic model: A critical review. Desalination 2010, 257, 150–157. [Google Scholar] [CrossRef]
- Altmann, T.; Robert, J.; Bouma, A.; Swaminathan, J.; Lienhard, J. Primary energy and exergy of desalination technologies in a power-water cogeneration scheme. Appl. Energy 2019, 252, 113319. [Google Scholar] [CrossRef]
- Ihm, S.; Al-Najdi, O.; Hamed, O.; Jun, G.; Chung, H. Energy cost comparison between MSF, MED and SWRO: Case studies for dual purpose plants. Desalination 2016, 397, 116–125. [Google Scholar] [CrossRef]
- El-Nashar, A. Cost allocation of electricity and water in a cogeneration plant. Desalination 1992, 85, 197–212. [Google Scholar] [CrossRef]
- El-Nashar, A.A. Cost allocation for electricity and water for the umm al nar west cogeneration plant using the exergy accounting method. Desalination 1989, 71, 57–71. [Google Scholar] [CrossRef]
- Hamed, O. Thermoeconomic analysis of combined power cycle integrated with MSF/SWRO desalination plant. Desalin. Water Treat. 2016, 57, 26552–26561. [Google Scholar] [CrossRef]
- Wade, N. Energy and cost allocation in dual-purpose power and desalination plants. Desalination 1999, 123, 115–125. [Google Scholar] [CrossRef]
- El-Nashar, A. Cost allocation in a cogeneration plant for the production of power and desalted water comparison of the exergy cost accounting method with the WEA method. Desalination 1999, 122, 15–34. [Google Scholar] [CrossRef]
- Hamed, O.; Al-Washmi, H.; Al-Otaibi, H. Thermoeconomic analysis of a power/water cogeneration plant. Energy 2006, 31, 2699–2709. [Google Scholar] [CrossRef]
- Mabrouk, A.; Nafey, A.; Fath, H. Steam, electricity and water costs evaluation of power-desalination co-generation plants. Desalin. Water Treat. 2010, 22, 56–64. [Google Scholar] [CrossRef]
- Rognoni, M. Energy cost for desalination evaporation versus reverse osmosis. Int. J. Nucl. Desalin. 2011, 4, 277–284. [Google Scholar] [CrossRef]
- Dardour, S.; Safa, H. Energetic and economic cost of nuclear heat impact on the cost of desalination. EPJ Nuclear Sci. Technol. 2017, 3, 1. [Google Scholar] [CrossRef]
- Shahzad, M.; Burhan, M.; Ng, K. A standard primary energy approach for comparing desalination processes. NPJ Clean Water. 2019, 2, 1. [Google Scholar] [CrossRef]
- Shahzad, M.; Burhan, M.; Son, H.; Oh, S.; Ng, K. Desalination processes evaluation at common platform: A universal performance ratio (UPR) method. Appl. Therm. Eng. 2018, 134, 62–67. [Google Scholar] [CrossRef]
- Darwish, M.; Bin Amer, A. Cost allocation in cogeneration power–desalination plant utilising gas/steam combined cycle (GTCC) in Kuwait’. Int. J. Exergy 2014, 14, 275–302. [Google Scholar] [CrossRef]
- Darwish, M.; Al Asfour, F.; Al-Najem, N. Energy consumption in equivalent work by different desalting methods: Case study for Kuwait. Desalination 2003, 152, 83–92. [Google Scholar] [CrossRef]
- Darwish, M.; Al Awadhi, F.; Raheem, M.A. The MSF: Enough is enough. Desalin. Water Treat. 2010, 22, 193–203. [Google Scholar] [CrossRef]
- Ng, K.; Shahzad, M.; Son, H.; Hamed, O. An exergy approach to efficiency evaluation of desalination. Appl. Phys. Lett. 2017, 110, 184101. [Google Scholar] [CrossRef]
- Zeitoun, O.; Orfi, J.; Khan, S.; AlAnsary, H. Desalinated water costs from steam, combined, and nuclear cogeneration plants using power and heat allocation methods. Energies 2023, 16, 2752. [Google Scholar] [CrossRef]
- El-Wakil, M. Powerplant Technology; McGraw-Hill Education: New York, NY, USA, 1985. [Google Scholar]
- EES. Commercial V11.725. Available online: https://www.fchartsoftware.com/ees/ (accessed on 22 February 2024).
- Zeitoun, O.; Orfi, J.; Khan, S.; AlAnsary, H. Analysis of MED Systems; Internal Report; KCARE: Riyadh, Saudi Arabia, 2022. [Google Scholar]
- Zeitoun, O.; Orfi, J.; Khan, S.; AlAnsary, H. Multi Stage Flash Desalination; Internal Report; KCARE: Riyadh, Saudi Arabia, 2022. [Google Scholar]
- Al-Karaghouli, A.; Kazmerski, L. Energy consumption and water production cost of conventional and renewable-energy-powered desalination processes. Renew. Sustain. Energy Rev. 2013, 24, 343–356. [Google Scholar] [CrossRef]
- Available online: https://www.desaldata.com (accessed on 22 February 2024).
Disclaimer/Publisher’s Note: The statements, opinions and data contained in all publications are solely those of the individual author(s) and contributor(s) and not of MDPI and/or the editor(s). MDPI and/or the editor(s) disclaim responsibility for any injury to people or property resulting from any ideas, methods, instructions or products referred to in the content. |
© 2024 by the author. Licensee MDPI, Basel, Switzerland. This article is an open access article distributed under the terms and conditions of the Creative Commons Attribution (CC BY) license (https://creativecommons.org/licenses/by/4.0/).