1. Introduction
Floods are natural phenomena that cause serious economic, environmental and social damage [
1,
2]. However, in certain situations, floods can be induced by anthropic actions [
3,
4,
5,
6,
7]. In such cases, the flood risk become greater not only due to the increase in vulnerability and exposure [
8,
9,
10,
11], but also when a wrong operation or malfunctioning of flood protection structures may occur [
12,
13,
14,
15,
16,
17,
18]. This is, for example, the case for the eventual failure or improper operation of hydraulic structures such as dams, off-stream reservoirs, levees, irrigations channels, etc.
Off-stream reservoirs are defined as human-made structures designed for the storage of any kind of fluid—usually water and mine tailings—located outside the basin’s channel network and totally or partially delimited by a retention dyke. They are essential structures for different purposes, such as: water supply to small populations, irrigation, cattle raising, firefighting, purification, recreation, mine tailings, and electric facilities, among other uses [
19,
20,
21,
22,
23].
Accounting for the similarities with dams, off-stream reservoirs are commonly treated as dams and the same safety regulatory regime commonly applies. Thus, off-stream reservoirs are often classified into various categories according to safety requirements adopting different formulations in several countries [
24].
To that end, hydraulic studies that consider the break of the dyke of the structure, and the subsequent flood wave propagation, are utilised for flood hazard and inundation extent mapping. Flood risk management and emergency response planning are among the flood mitigation measures to minimise property damage and loss of life [
25,
26]. These studies serve as the basis for the classification process to determine the potential risk that a flood might cause to the elements at risk located in the vicinity of the structure. Several numerical tools are available for practitioners to simulate the breach formation on dams or off-stream reservoirs (DAMBRK, SMPDBK, FLDWAV, Iber, FLO-2D, etc.) and, thus, the subsequent flood wave propagation process (INFOWORKS, HEC-RAS, Iber, FLO-2D, GUAD 2D, etc.).
One of the main issues when practitioners deal with the classification of an off-stream reservoir according to their potential damage in case of failure or improper operation is the selection of the break point. In case of dams, there is generally no subjectivity on the selection of this point: the worse situation is a break at the tallest part of the dam, which usually coincides with the river. However, the selection of this point is not trivial in off-stream reservoirs because they are not directly associated to a river bed and may have irregular geometry.
Off-stream reservoirs are usually built near agricultural fields or mining facilities, being the terrain notably modified with several anthropic actions (smoothing slopes, changing the natural drainage network, conforming terraces, etc.). As a result, the flood wave propagation process is complex and, at first instance, not easily determinable. An analysis considering only a single break point (a simulation scenario) could lead to an underestimation of potential damages because the break point that would cause the worst potential damages is generally unknown. To solve this issue, practitioners traditionally analyse several break scenarios according, for example, to the number of dykes of the off-stream reservoir or to topographical aspects. Despite that, the worst break point might not be selected and, thus, it would result, again, in an underestimation of the maximum potential damages.
In such cases, a deterministic approach might not be sufficiently suitable. Several flood studies focus the flood hazard analysis from a statistical point of view. Ahmadisharaf et al. [
27] used the outflow hydrograph as the uncertain parameter in a Monte-Carlo-based probabilistic approach. Rizzo et al. [
28] analysed the influence of the breach width and the reservoir level before the breach formation. The study of Bello et al. [
29] also deal with the influence of the breach parameters in the generation of the hydrograph. All of them focus on dam-like structures and the parameters for the breach definition, while probabilistic off-stream reservoir flood hazard studies are less analysed in the bibliography.
The present study aims to fill this gap with a probabilistic approach for off-stream reservoir failure flood hazard assessment. The breach parameters are kept unchanged, while the break point is defined stochastically along the dyke of the structure. Each breach formation and the flood wave propagation are simulated in the same model following an in-cascade process. Then, the hydraulic results are analysed statistically to generate probabilistic flood extent and flood hazard maps. The whole process was integrated in a unique numerical tool, providing to practitioners the results of each deterministic scenario, the possibility to carry out a probabilistic approach for flood hazard assessment based on them, and the direct determination of the envelope of the flood extent. Additionally, the proposed methodology allowed for exploring the minimum number of scenarios necessary to provide good statistical results and exploring how the computational domain can be optimised.
2. Materials and Methods
2.1. Breach Formation and Flood Propagation Modelling
Iber is a software that solves 2D depth-averaged shallow water equations using a finite volume solver [
30,
31]. It includes, among other calculation modules and capabilities [
15,
32,
33,
34,
35,
36,
37,
38,
39], a specific tool that considers the breach formation in the simulation process. Thus, this numerical tool can simulate, jointly, the generation of a breach in a dyke and the subsequent propagation of the flood in the calculation domain.
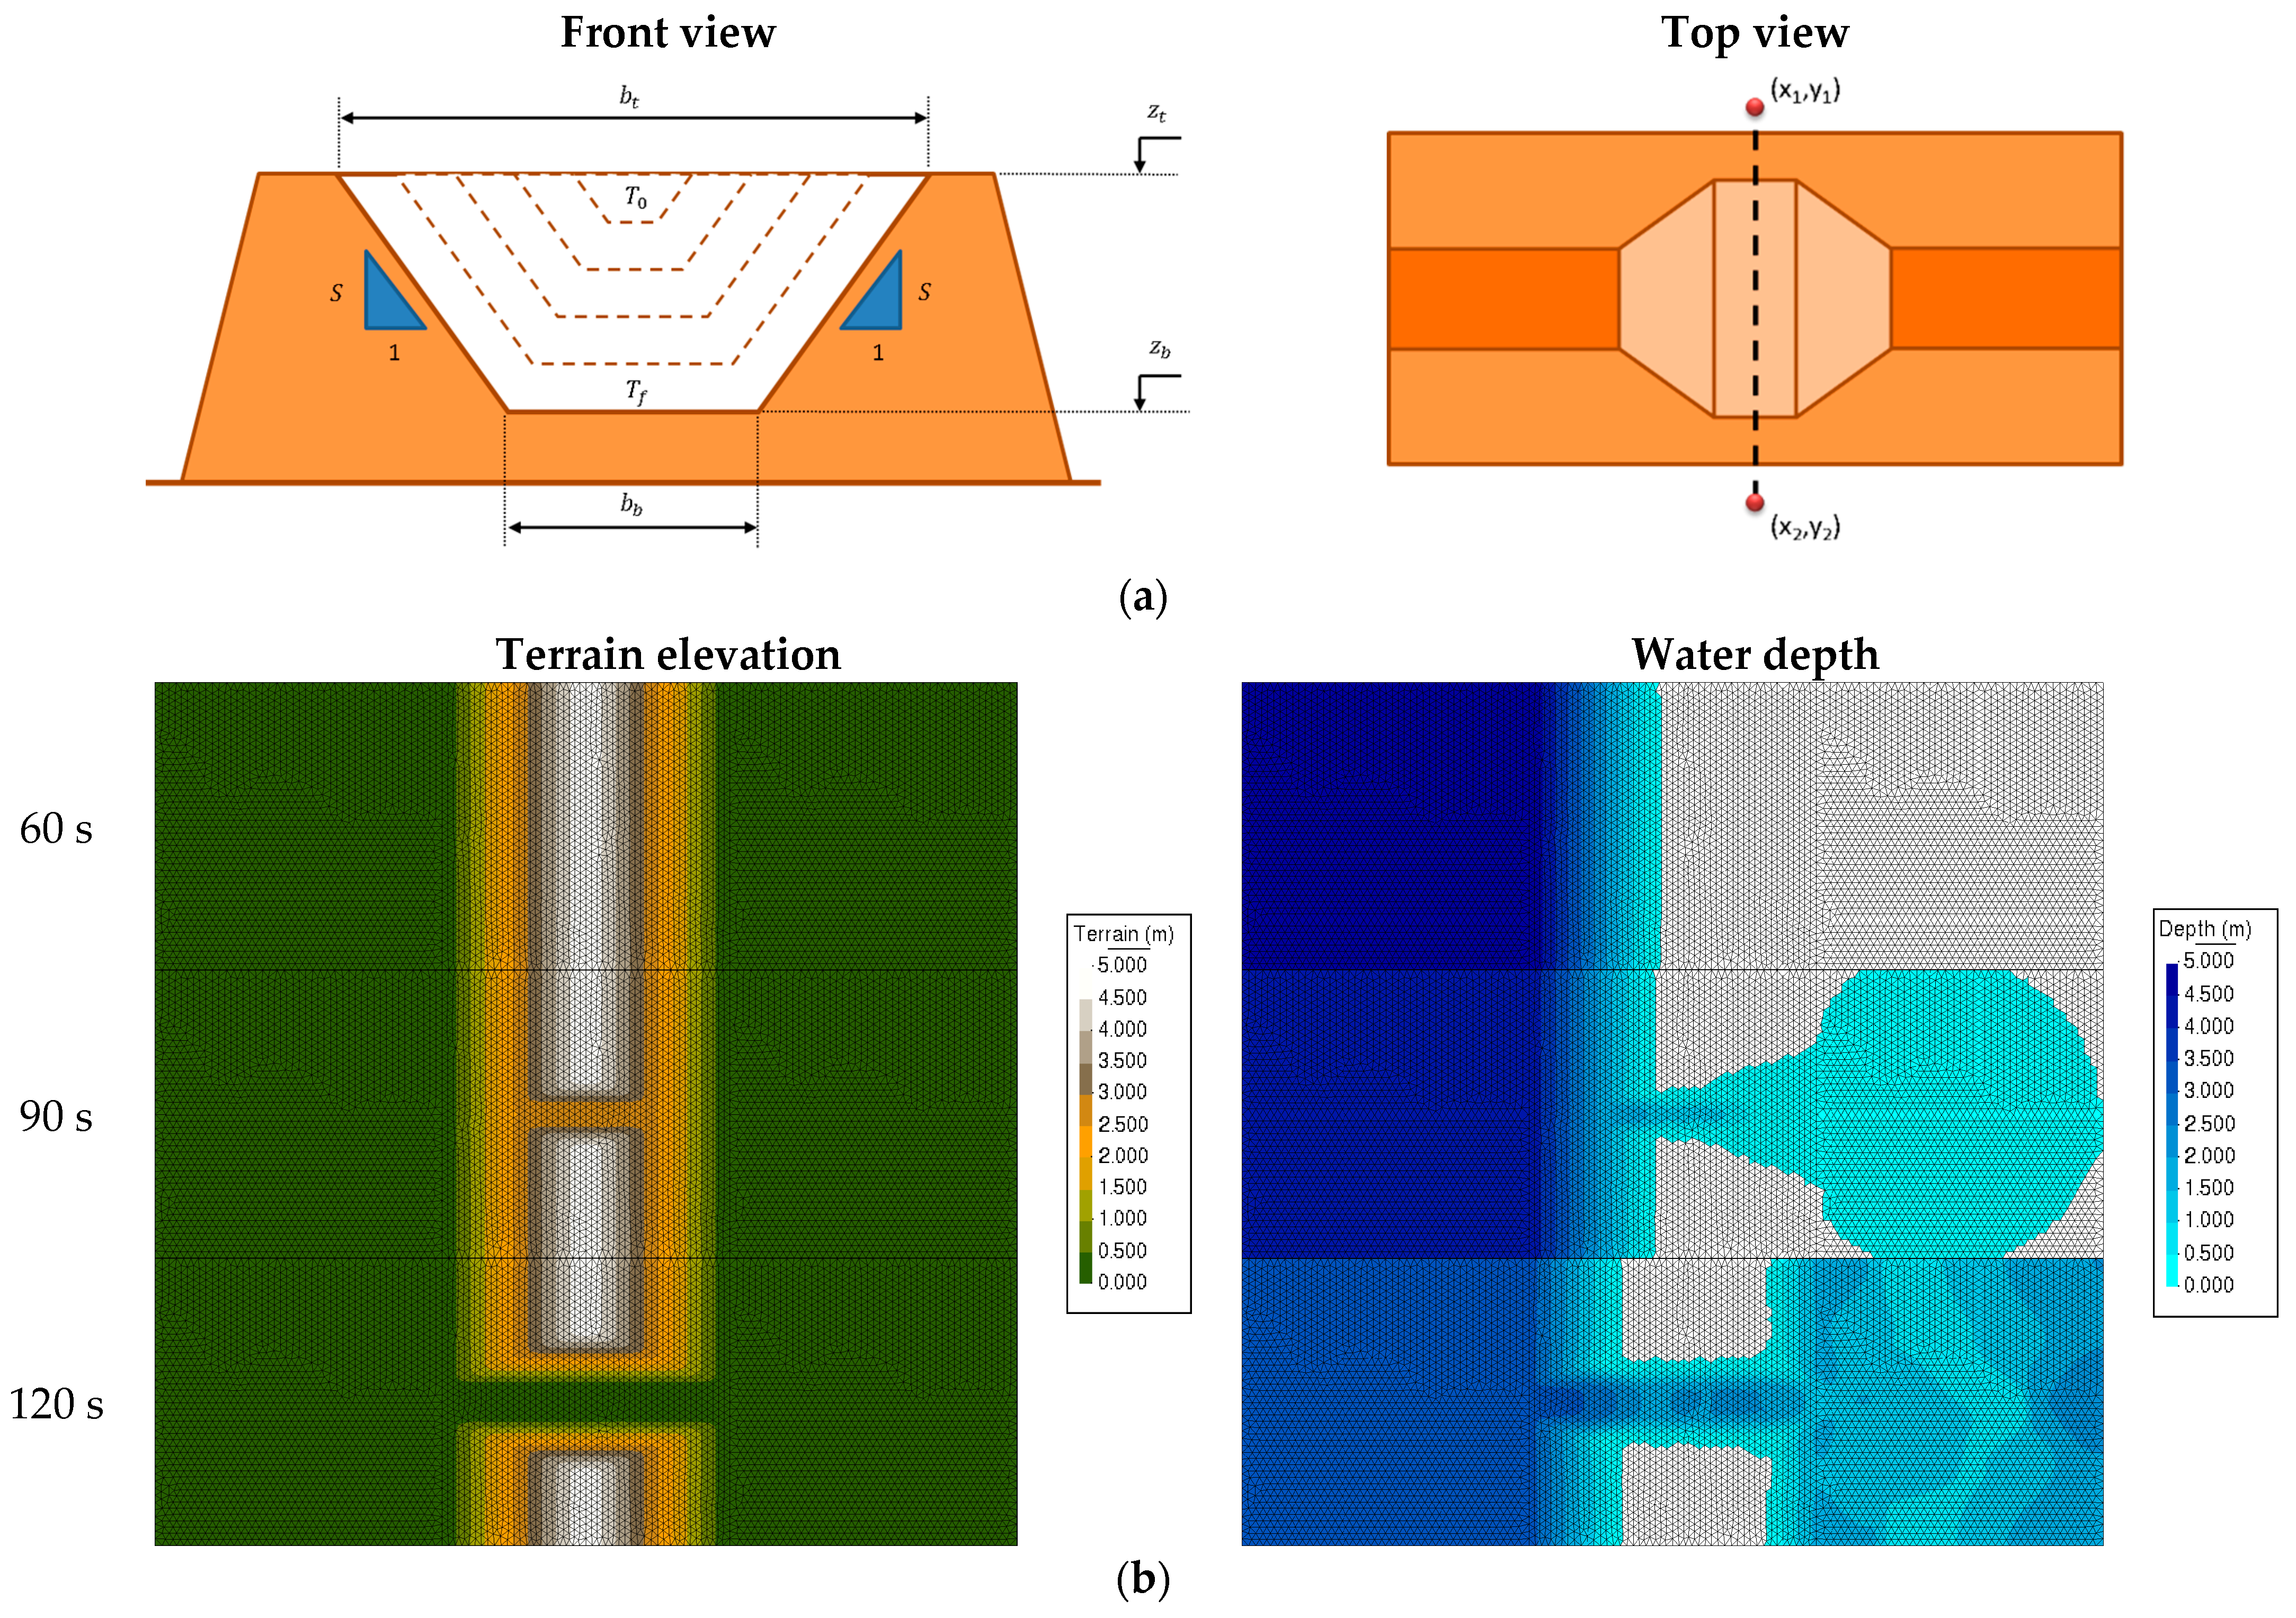
Iber implements two types of breaches, both trapezoidal-shaped. One follows the specifications of the Spanish Technical Guide [
40], whose section is defined as a trapezium of 1/1 lateral slope. The time formation (
) and average width (
) of the breach are calculated as follows:
where
is the volume of the reservoir (in hm
3) and
is the height of the dyke measured from the crest to the terrain (in m). The other methodology follows the user’s specifications, i.e., the breach is defined by the top (
) and bottom (
) width, the top (
) and bottom (
) elevation, and the time formation (
). Thus, the user also manages the lateral slope (
) of the breach (
Figure 1a).
Once a breach is activated in the model, the terrain evolves, generating a trapezoidal-shaped section along a generatrix axis (
Figure 1a). The breach formation process can start when either the simulation time (
) or the water elevation (
) on the inner part of the dyke is greater than a particular value defined by the user. This latter option is designed for the generation of breaches caused by overtopping, dams’ main failure mode [
41], but it can be also used for off-stream reservoirs if endogenous rainfall is considered or if malfunctioning of the filling system is produced.
The breach formation is considered in the model numerically. During the simulation, Iber changes the elevation of the nodes of the calculation mesh according to the breach specifications. Once the elevation of the nodes is lower than the water elevation, the fluid leaves the reservoir.
Figure 1b exemplifies the breach formation process (left) and the consequences on the fluid motion (right), which is originally at rest at one side of the dyke (
= 60 s).
Currently, the whole calculation process can be performed with the sequential version, using the computing processor unit (CPU), or with the parallelized version, which uses the graphical processor unit (GPU), called R-Iber [
35]. The breach formation process described above has been incorporated into this new parallelized code, allowing to reach speed-ups above 80 in comparison to the sequential version.
2.2. Stochastic Breach Generation and Probabilistic Approach
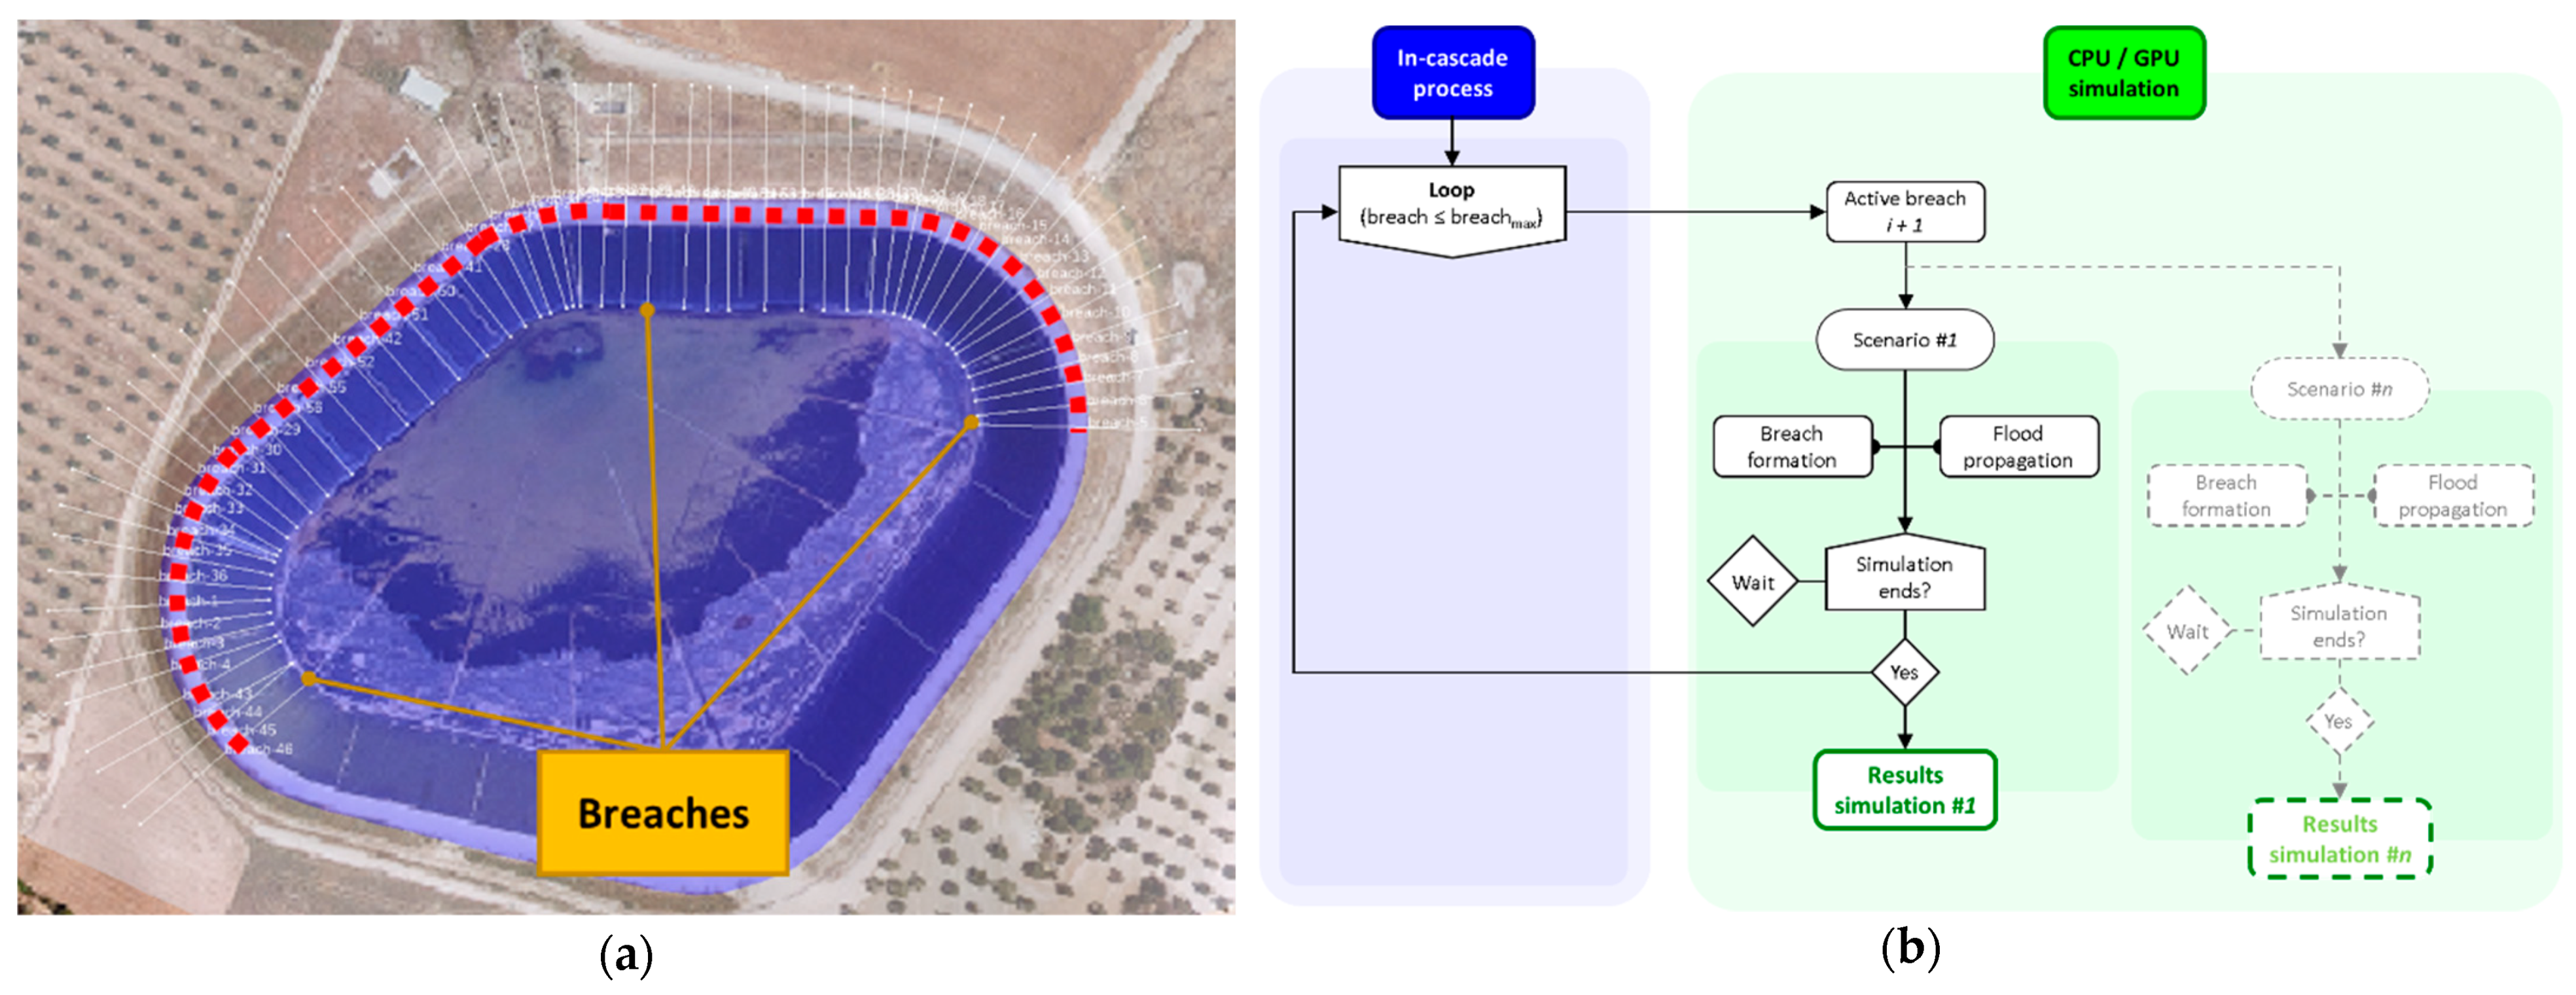
The present probabilistic approach for off-stream reservoir failure flood hazard assessment is based on a stochastic definition of the break points along the dyke. Instead of analysing each scenario separately, as in a deterministic approach, a large number of simulations are automatically carried out in the same model allowing, then, a probabilistic analysis.
To that end, once the crest of the dyke is selected (
Figure 2a, red dashed line) the breaches are automatically generated separated by an equidistance (
Figure 2a, white lines). The parameters of the breach defined by the user (kind of breach, top/bottom elevation, top/bottom width, time formation, etc.) are also applied automatically. Thereby, a number of failure scenarios will be generated automatically, corresponding each one to a breach formation. Following this, an in-cascade calculation process simulates each scenario and saves the results in the same model (
Figure 2b).
Any numerical tool can run several simulations at the same time in the same processor unit. However, this creates a significant bottleneck, reducing the global computing capacity, especially when a GPU device is utilised [
42]. Despite R-Iber allowing the selection of the GPU device on which to carry out each simulation [
35], the use of either a cluster of GPUs or CPUs by practitioners is infrequent. For this reason, an in-cascade simulation process was selected instead of a parallel simulation process (a simulation per device). This procedure allows for the comparison of the calculation time between the sequential and parallelised versions.
Once the simulation ends, the results of all scenarios can be loaded into the interface and jointly analysed. On one hand, a deterministic analysis can be performed scenario per scenario, as traditionally carried out, looking for the breach (or scenario) that provides the worst potential damages. On the other hand, if the number of scenarios is large enough, a probabilistic approach is recommended for the results analysis.
For this last purpose, a new tool was developed, allowing the user to select the threshold for the hydraulic variables (depth, velocity, specific discharge, and water elevation) and the hazard criteria of any existing recommendations or guide. This tool evaluates whether the threshold is exceeded in any element of the calculation domain and scenario. In the affirmative case, class 1 is assigned to the element. Accounting for the number of class 1 of each element in all scenarios, the probability of exceedance of a particular threshold is directly obtained at each element. Thereby, flood probability maps are automatically generated with this methodology.
The presented methodology is independent of the type of fluid stored in the off-stream reservoir. Despite it not only being applied to irrigation ponds (water, “Newtonian” fluid-like), there is no limitations to use it, for example, in mine tailing ponds (muds, non-Newtonian fluid-like). This approach can help in the development of ad hoc guidelines that allow the complexity of fluid, tailings, and dam failures to be considered in order to properly characterize potential breach and runout scenarios [
20,
43].
2.3. Case Studies
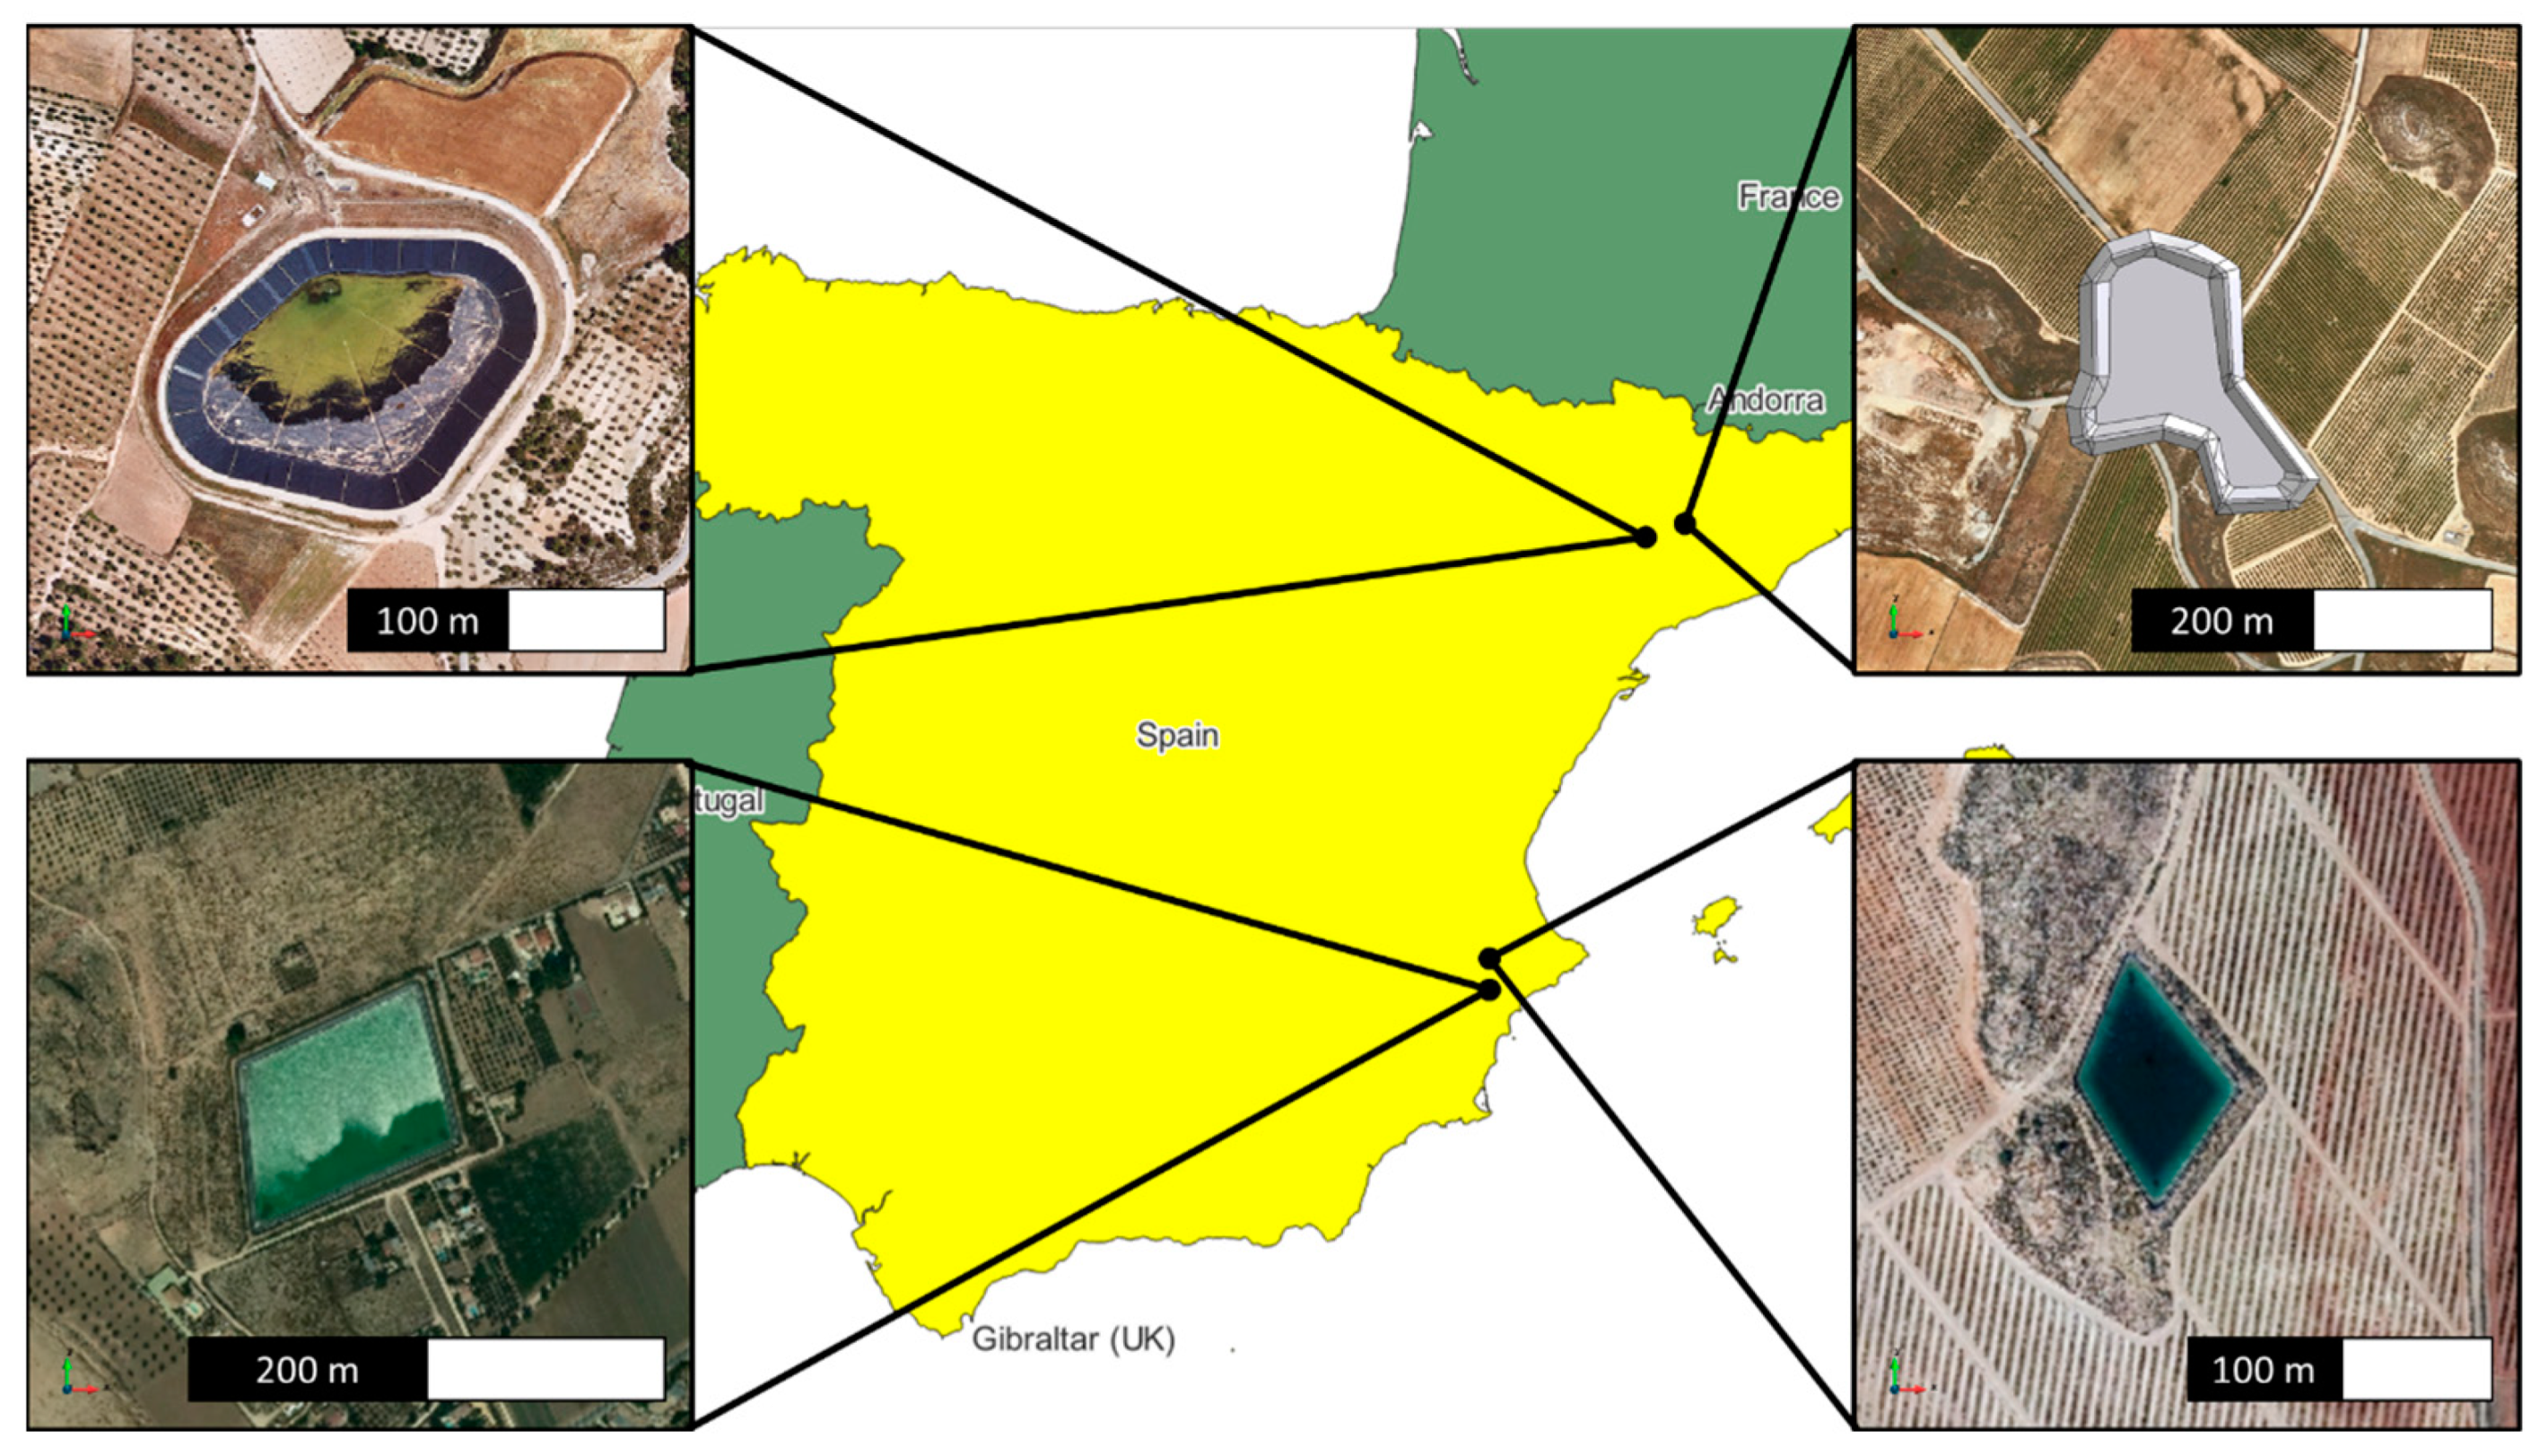
The performance of the probabilistic approach was tested in four case studies located in Spain (
Figure 3). The Rubial case study is a structure formed by four straight dykes, being all of them built over the natural terrain. The surrounding terrain is defined by agricultural terraces. The Montoliu case study is a projected off-stream reservoir located at the top of a hill with an irregular geometry. In this case, the flood propagation process is conditioned by the embankment of a highway. The Lagunilla and Segarra case studies are partially excavated off-stream reservoirs located on a ridge. Thus, depending on the break point, the water could flow down one or another valley, or both.
The selection of the case studies was oriented to include the common typologies of embankment-made off-stream reservoirs and the different flood casuistic in case of failure. This resulted in the selection of:
3 already-built structures (Rubial, Lagunilla, and Segarra) and a planned one (Montoliu);
2 structures with all dykes above the natural terrain (Rubial and Montoliu), and 2 structures that are partially excavated in the natural terrain, but also have dykes over the natural terrain (Lagunilla and Segarra);
the propagation of the flood may be conditioned by the proximity of a natural stream (Montoliu) or the flood may be complex and, a priori, not easily determinable (Rubial, Lagunilla and Segarra).
The authors are aware this selection cannot cover all situations worldwide. In any case, the proposed methodology can be easily extrapolated to other typologies of off-stream reservoirs (e.g., concrete, stone masonry, etc.) by including the proper breach geometry and formation characteristics of each country or region.
All geographical data needed to generate the models, such as digital terrain elevation (DTM), land uses, orthophotos and elements at risk, were obtained from the National Geographical Institute of Spain [
44,
45]. The DTM used in all models was a 2 m grid spacing that comes from the 2nd Coverage (2015–Present). Since the proposed methodology is independent of the topographical data, other sources, such as digital surface models (DSM), light detection and ranging (LiDAR), etc., can be utilised as well. The land uses map came from the CORINE Land Cover project [
46], version 2018, and it was included in the database of Iber through the recommendations for the development of the national flood zone mapping system of Spain [
47].
In all case studies, the breach formation process was considered following the specifications of the Spanish Technical Guide [
40]. The breach formation process started at the beginning of the simulation (
= 0 s). Only dykes that are fully exposed were selected as alignments of the crest to define the breaches. The main characteristics of the model, the off-stream reservoir, and the general values of the breach are summarized in
Table 1.
3. Results
3.1. Probabilistic Flood Maps
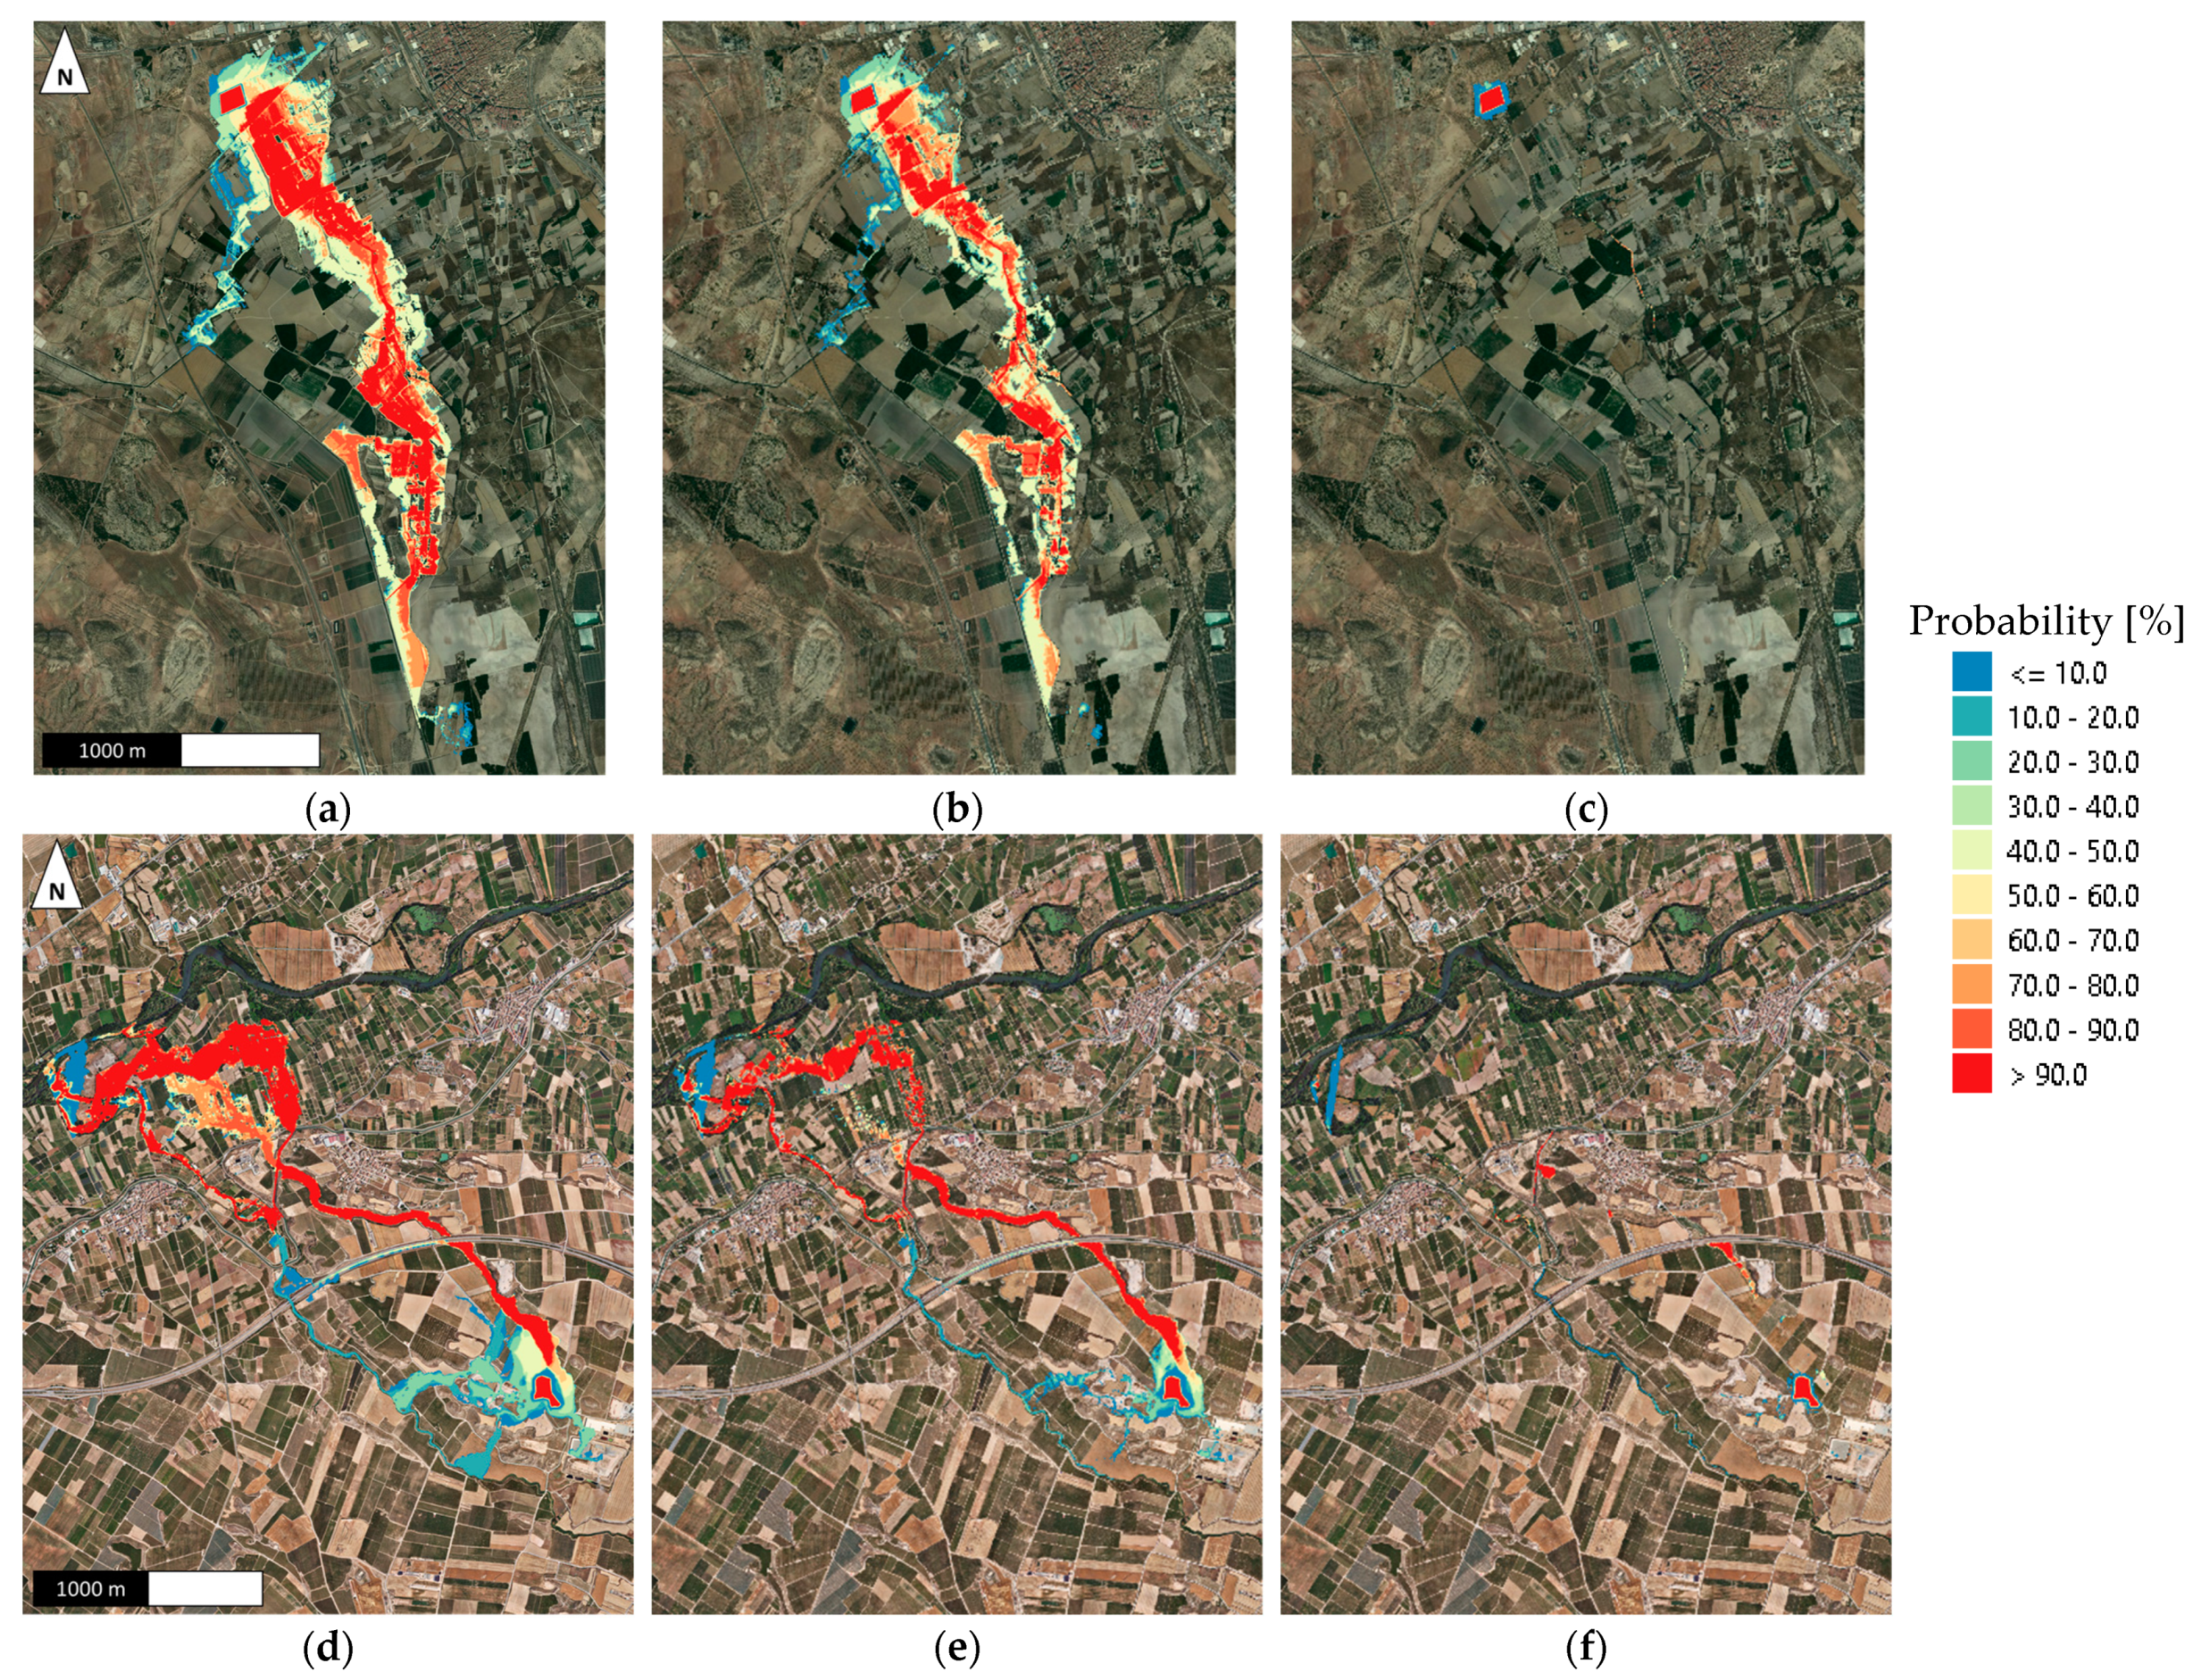
The probabilistic flood maps of the case studies presented below are shown for a value of probability of exceedance of 0.01 (P[h > 0.01 m]), 0.1 (P[h > 0.1 m]), and 1 m (P[h > 1 m]) of water depth. The first criterion (P[h > 0.01 m]) is a representation of the maximum probable extent of the inundation in case of failure, and the last (P[h > 1 m]) is a representation of one of the hazard criteria of the Spanish Technical Guide, but in terms of probability. Probabilistic flood maps of other hydraulic variables (velocity, specific discharge, and water elevation) can also be obtained.
In case of the failure of the Rubial off-stream reservoir, the flood would generally extend towards the south (
Figure 4a). The probability of flooding is high (above 90%) at the SE corner near the structure (
Figure 4a,b). Then, the high probability area (depths greater than 0.01 and 0.1 m) is narrowed in accordance with the topography and, finally, the probability of flooding decreases downstream. Water depths above 1 m would be produced in few locations, being only appreciable near the structure and in the irrigation ditch located at the SE of the pond (
Figure 4c), which generally concentrates the flow.
The probability of flooding in case of failure of the Montoliu off-stream reservoir shows a preference floodway towards the north, then shifting towards the NW (
Figure 4d,e). The flood would generally reach the highway and the irrigation channel (
Figure 4f) because the probability of exceeding 1 m of water depth is 100%, regardless of the location of break point. Contrary to what was expected, the river would not play an important role in the flood propagation process because the probability of flooding is less than 20% until the irrigation channel. At that point, the flood of the channel would generate the overtopping and the subsequent spill towards the river (with a probability above 90%). The overtopping of the channel would be produced in three points (
Figure 4d) with a probability above 80% at the central part, above 90% at the southern part, and 100% at the northern part. Additionally, the flood would arrive at the highway in 100% of the cases, producing a flood over the infrastructure with a probability higher than 80%.
The flood scenarios of the Lagunilla case study generate an inundation envelope divided in two branches: one towards the north and the other to the south (
Figure 5a). The probability of flooding is highly influenced by the location of the breach but, in general, the flood would be produced towards the south, with a major probability of occurrence, rather than towards the north (
Figure 5b). The flow would concentrate towards the south of the gentle hill, located at the east of the pond, with a probability above 90%, while the probability reduces to 60% towards the north with punctual locations up to 80% at the low part of the agricultural terraces. The inundation would be less probable at the north of the hill (below 50%), being the irrigation ditch reached in less than 40% of the failure cases. A probability of flooding with a water depth above 1 m is quite limited in this case, having only crossed this threshold at the pond and in its vicinity, and in very few locations in the irrigation channel (
Figure 5c).
The failure of the Segarra off-stream would generate a complex flood probability map with several branches (
Figure 5d). Despite that, the flood would generally concentrate around the central branch (north) during the first meters (probability above 90%). Then, the probability of flooding is almost identical for the northeast and northwest valleys (>80%). Only in almost 30% of the cases, the flow would reach the upper part of the NE valley (right branch). Three of the four roads located in the study area would be flooded, with a probability of 75% at a minimum. Despite the fact that the road located at the NW would be reached by the flood with almost 50% probability, it would never be flooded due to the good location and geometrical characteristics of the culvert. However, the location of the culvert for the irrigation channel is not placed correctly, and the inundation would cause an overtopping in 80% of the failure cases. Flood scenarios above 0.1 m of water depth (
Figure 5e) would have a similar extension than scenarios of P[h > 0.01 m]. Water depths higher than 1 m would be produced not only near the pond, but also upstream of the roads and especially on the irrigation channel (
Figure 5f).
3.2. Probabilistic Flood Hazard Assessment and Pond Classification
Danger to human life, depending on depth and velocity, has been evaluated for each case study according to the Spanish Technical Guide. That is, a ‘high danger’ situation in non-urban areas is defined when the water depth (
) is higher than 1 m, the flow velocity (
) is higher than 1 m/s, or the product of both variables (
) is higher than 0.5 m
2/s [
40]. Accounting for the potential damages caused by eventual failure or improper operation, the structures must be classified in three categories: ‘Category A’ when the flood can seriously affect urban areas or essential services or cause significant material or environmental damage; ‘Category B’ when the flood causes significant material or environmental damage or affects a small number of dwellings; and ‘Category C’, the flood can cause material or environmental damage of moderate importance and only incidental loss of life. This criterion is defined for deterministic scenarios; however, it can also be applied considering the probability of threshold exceedance for these variables.
The elements at risk (EaR) considered in this analysis were houses, electric facilities, other buildings, transport infrastructures, and agricultural facilities. In the vicinity of each structure, 74, 669, 13, and 152 EaR are found in the case studies of Rubial, Montoliu, Lagunilla, and Segarra, respectively.
In the case study of Rubial, the water depth threshold ( > 1 m) was overcome only in 1 EaR with a probability of 2.2%. In case of the criteria of velocity ( > 1 m/s), 16 EaR were affected with probabilities between 3.7 and 46.8%. Only in 4 EaR was the product of both variables above the threshold ( > 0.5 m2/s). Considering that the assessment of the EaR shows ‘high danger’ in between 3 and 63 of the 136 scenarios simulated, the off-stream reservoir could be classified as ‘Category A’ with a high degree of probability independent of the break point considered.
As shown in
Section 3.1, the potential flood in case of failure of the Montoliu off-stream is highly influenced by the presence of a highway and the irrigation channel. The EaR considered as ‘high danger’ based on the abovementioned criteria reach 80% of the failure cases analysed in the irrigation channel, and almost 65% in the highway. Other elements at risk have a lessened probability of exceeding the hydraulic variables; however, this off-stream reservoir could be classified as ‘Category A’ due to the potential affections to essential structures regardless of the break point.
The 13 EaR of the Lagunilla off-stream reservoir did not exceed the hydraulic threshold in any of the scenarios simulated. Thus, this structure could be classified as ‘Category C’ with a 100% of probability. By contrast, only 13 of the 152 EaR considered in the Segarra case study could be affected by a hypothetical failure. In three of them, the water depth and the velocity were higher than 1 m and 1 m/s, respectively, having probabilities of exceedance between 10.8 and 69.7% for the water depth, and between 9 and 69.7% for the flow velocity. Considering that, in 38 of the 56 cases simulated, the irrigation channel would be affected by the flood and the off-stream reservoir of Segarra could be classified as ‘Category B’ due to this EaR is considered essential.
3.3. Computational Time
The proposed methodology is integrated in the CPU and GPU versions of Iber. However, it would not be applicable in a reasonable computation timeframe without using HPC techniques, particularly general-purpose computing on a graphics processing unit (GPGPU). The benefits of using GPU instead of CPU computing are exemplified with the Rubial case study. Four mesh configurations were used to discretise the study area: 22,263, 90,239, 363,375, and 2,278,983 elements. The coarsest mesh represents only 56 calculation points, or elements, per hectare, while the finest mesh represents more than 5700 calculation points per hectare, one or two orders of magnitude above the commonly used discretization in flood studies [
48]. Only four failure scenarios were calculated, corresponding each one to a breach formation at one side of the dyke of the structure, being the breach located in the middle.
Table 2 synthetises the performance of the numerical model depending on the processing unit utilised: CPU or GPU. In both cases, the computational time increases quadratically with the number of elements of the model, being necessary more than 9 days for the CPU in case of the finest mesh (more than 2.25 days per scenario). In GPU computing, this time is reduced to less than 3 h (less than 40 min per scenario). That is, using a NVIDIA
® GeForce
® GTX 1660 Ti device built into a laptop, the 136 scenarios of the Rubial were calculated with the second finest mesh in less than 7 h.
Comparing the computing time of the GPU versus the CPU version of Iber, a speed-up of 13 was obtained for the coarsest mesh. This value increases with the number of elements, reaching a maximum of 85.5 with the finest mesh discretisation. In this case, the speed-up follows a logarithmic trend (R2 > 0.95).
A scalability test was carried out comparing the number of elements and the computing time between CPU and GPU computing. The utilization of different meshes discretisation shows a constant increment in the required computing time per 1000 elements for the sequential version (CPU), while this time is almost constant, and less than 1.5 s per 1000 elements in the parallelised version (GPU). The increment of elements compared to the coarse mesh is 4 times, 16 times, and 102 times, with increments of speed-up of 3.1 times, 5.5 times, and 6.5 times respectively. Hence, the GPU version performs more efficiently than the CPU version, not only keeping the computing time per 1000 elements almost constant, but also increasing the speed-up when the number of elements of the computational domain also increases.
4. Discussion
4.1. Deterministic Flood Maps
Since the evolution of the hydraulic variables are calculated for each simulation scenario, a deterministic flood map analysis can also be performed. The results can be analysed using traditional methodologies, because maps of maximums water depths and velocities are directly provided by the numerical model, or can be exported to third party software (e.g., geographical information systems).
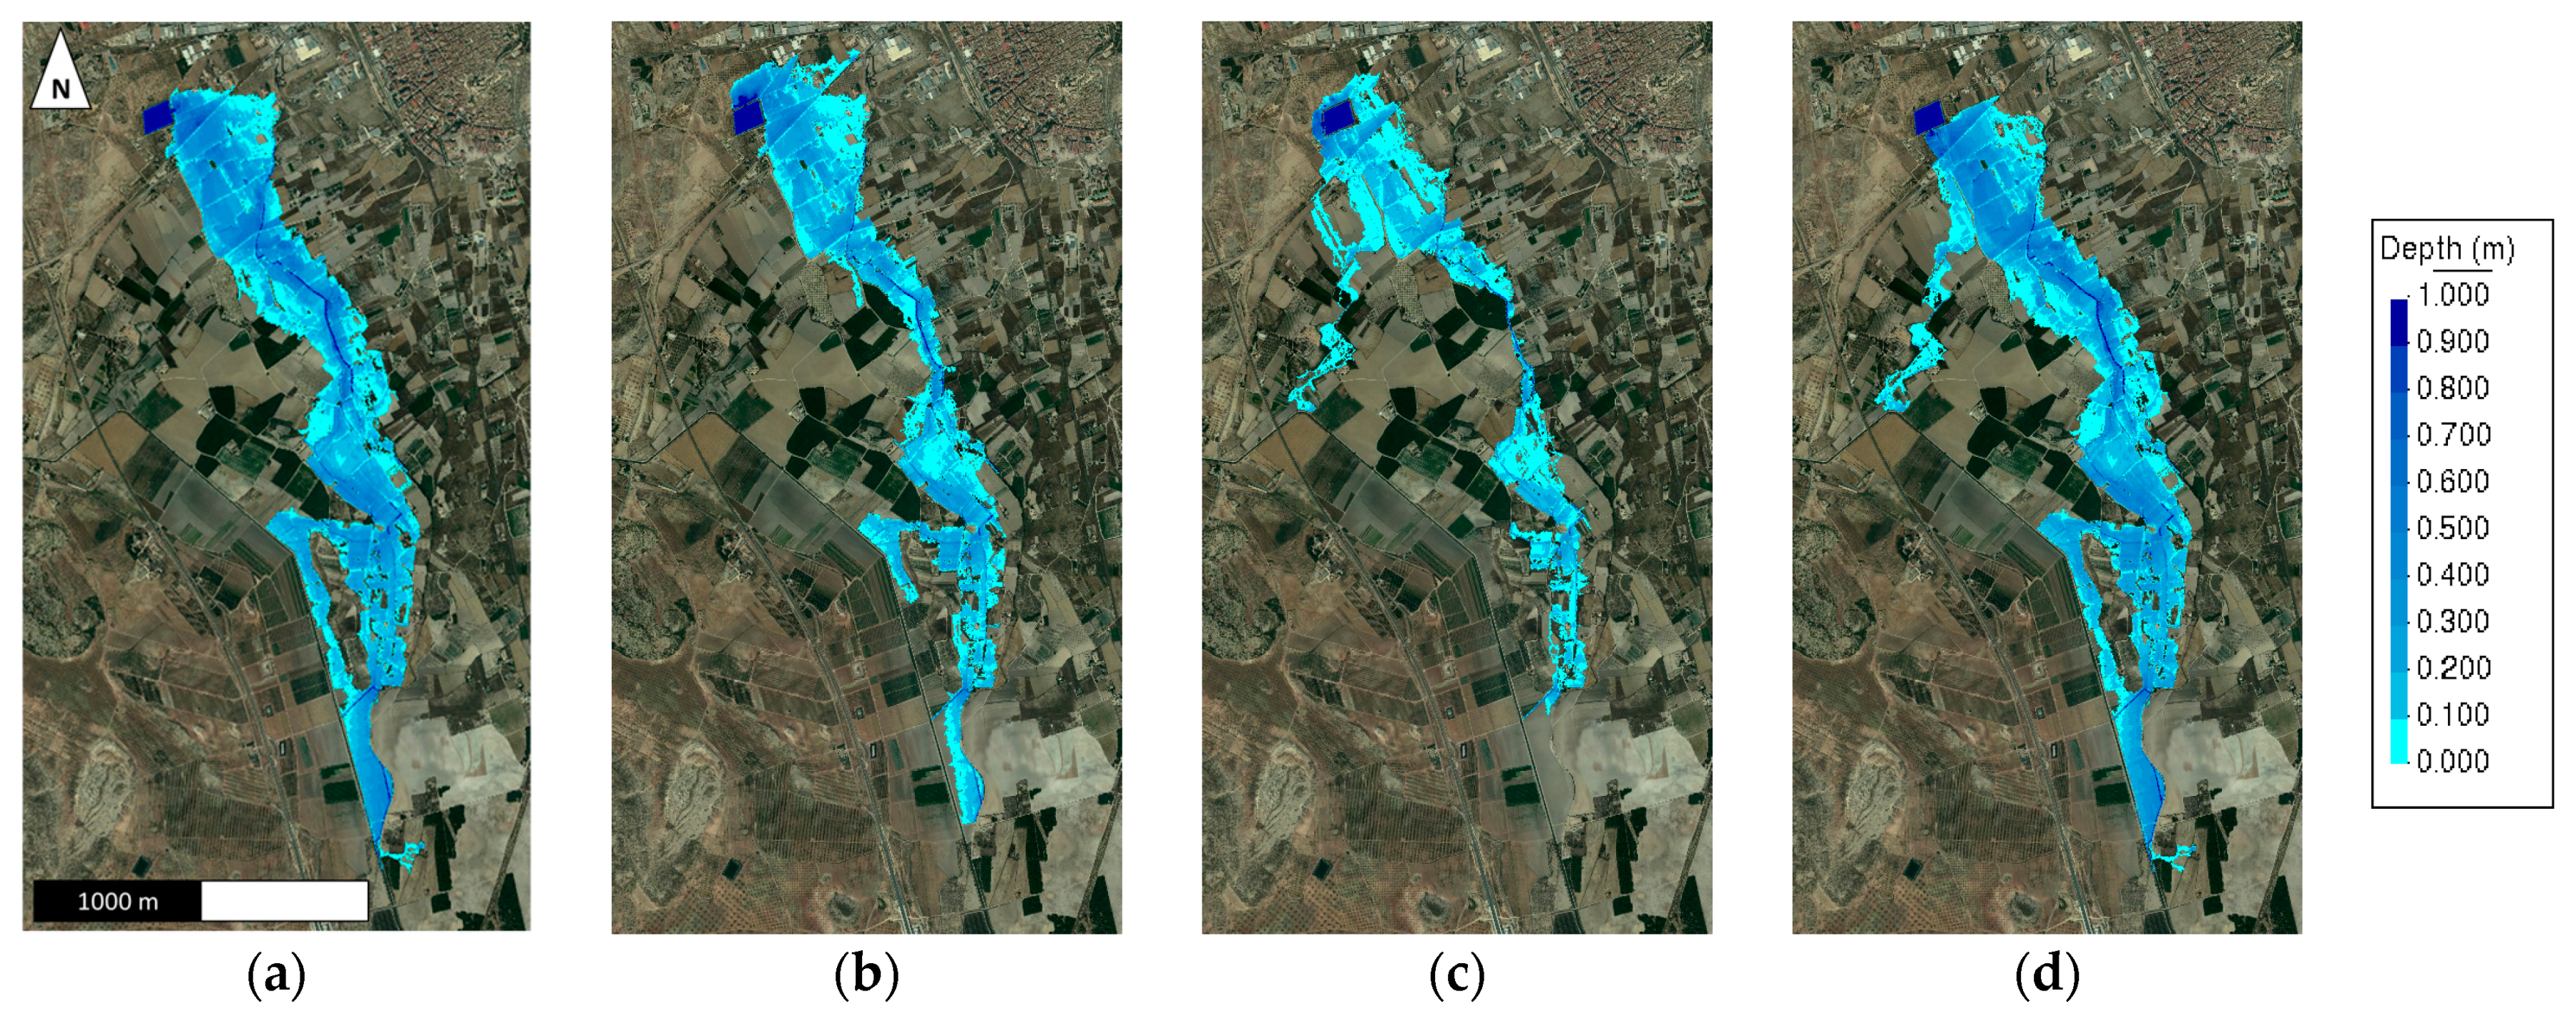
In the Rubial case study, in which 136 break scenarios were simulated, the main issue lies in the selection of the break point, because the perimeter of the structure is divided into four dykes oriented to the E, N, W, and S.
Figure 6 shows the maximum flood extent when considering the break at the middle part on the east dyke (a), north dyke (b), west dyke (c), and south dyke (d). Despite the fact that a general trend of the flow direction towards the south is observed, the flood extension, and thus the affections to the elements at risk, notably differs. A failure towards the west would concentrate the inundation in the vicinity of the structure, while the others, especially the eastern and southern breaks, would reach maximum extension. Hence, the elements at risk would be affected to a greater or lesser extent depending on which dyke the failure was produced.
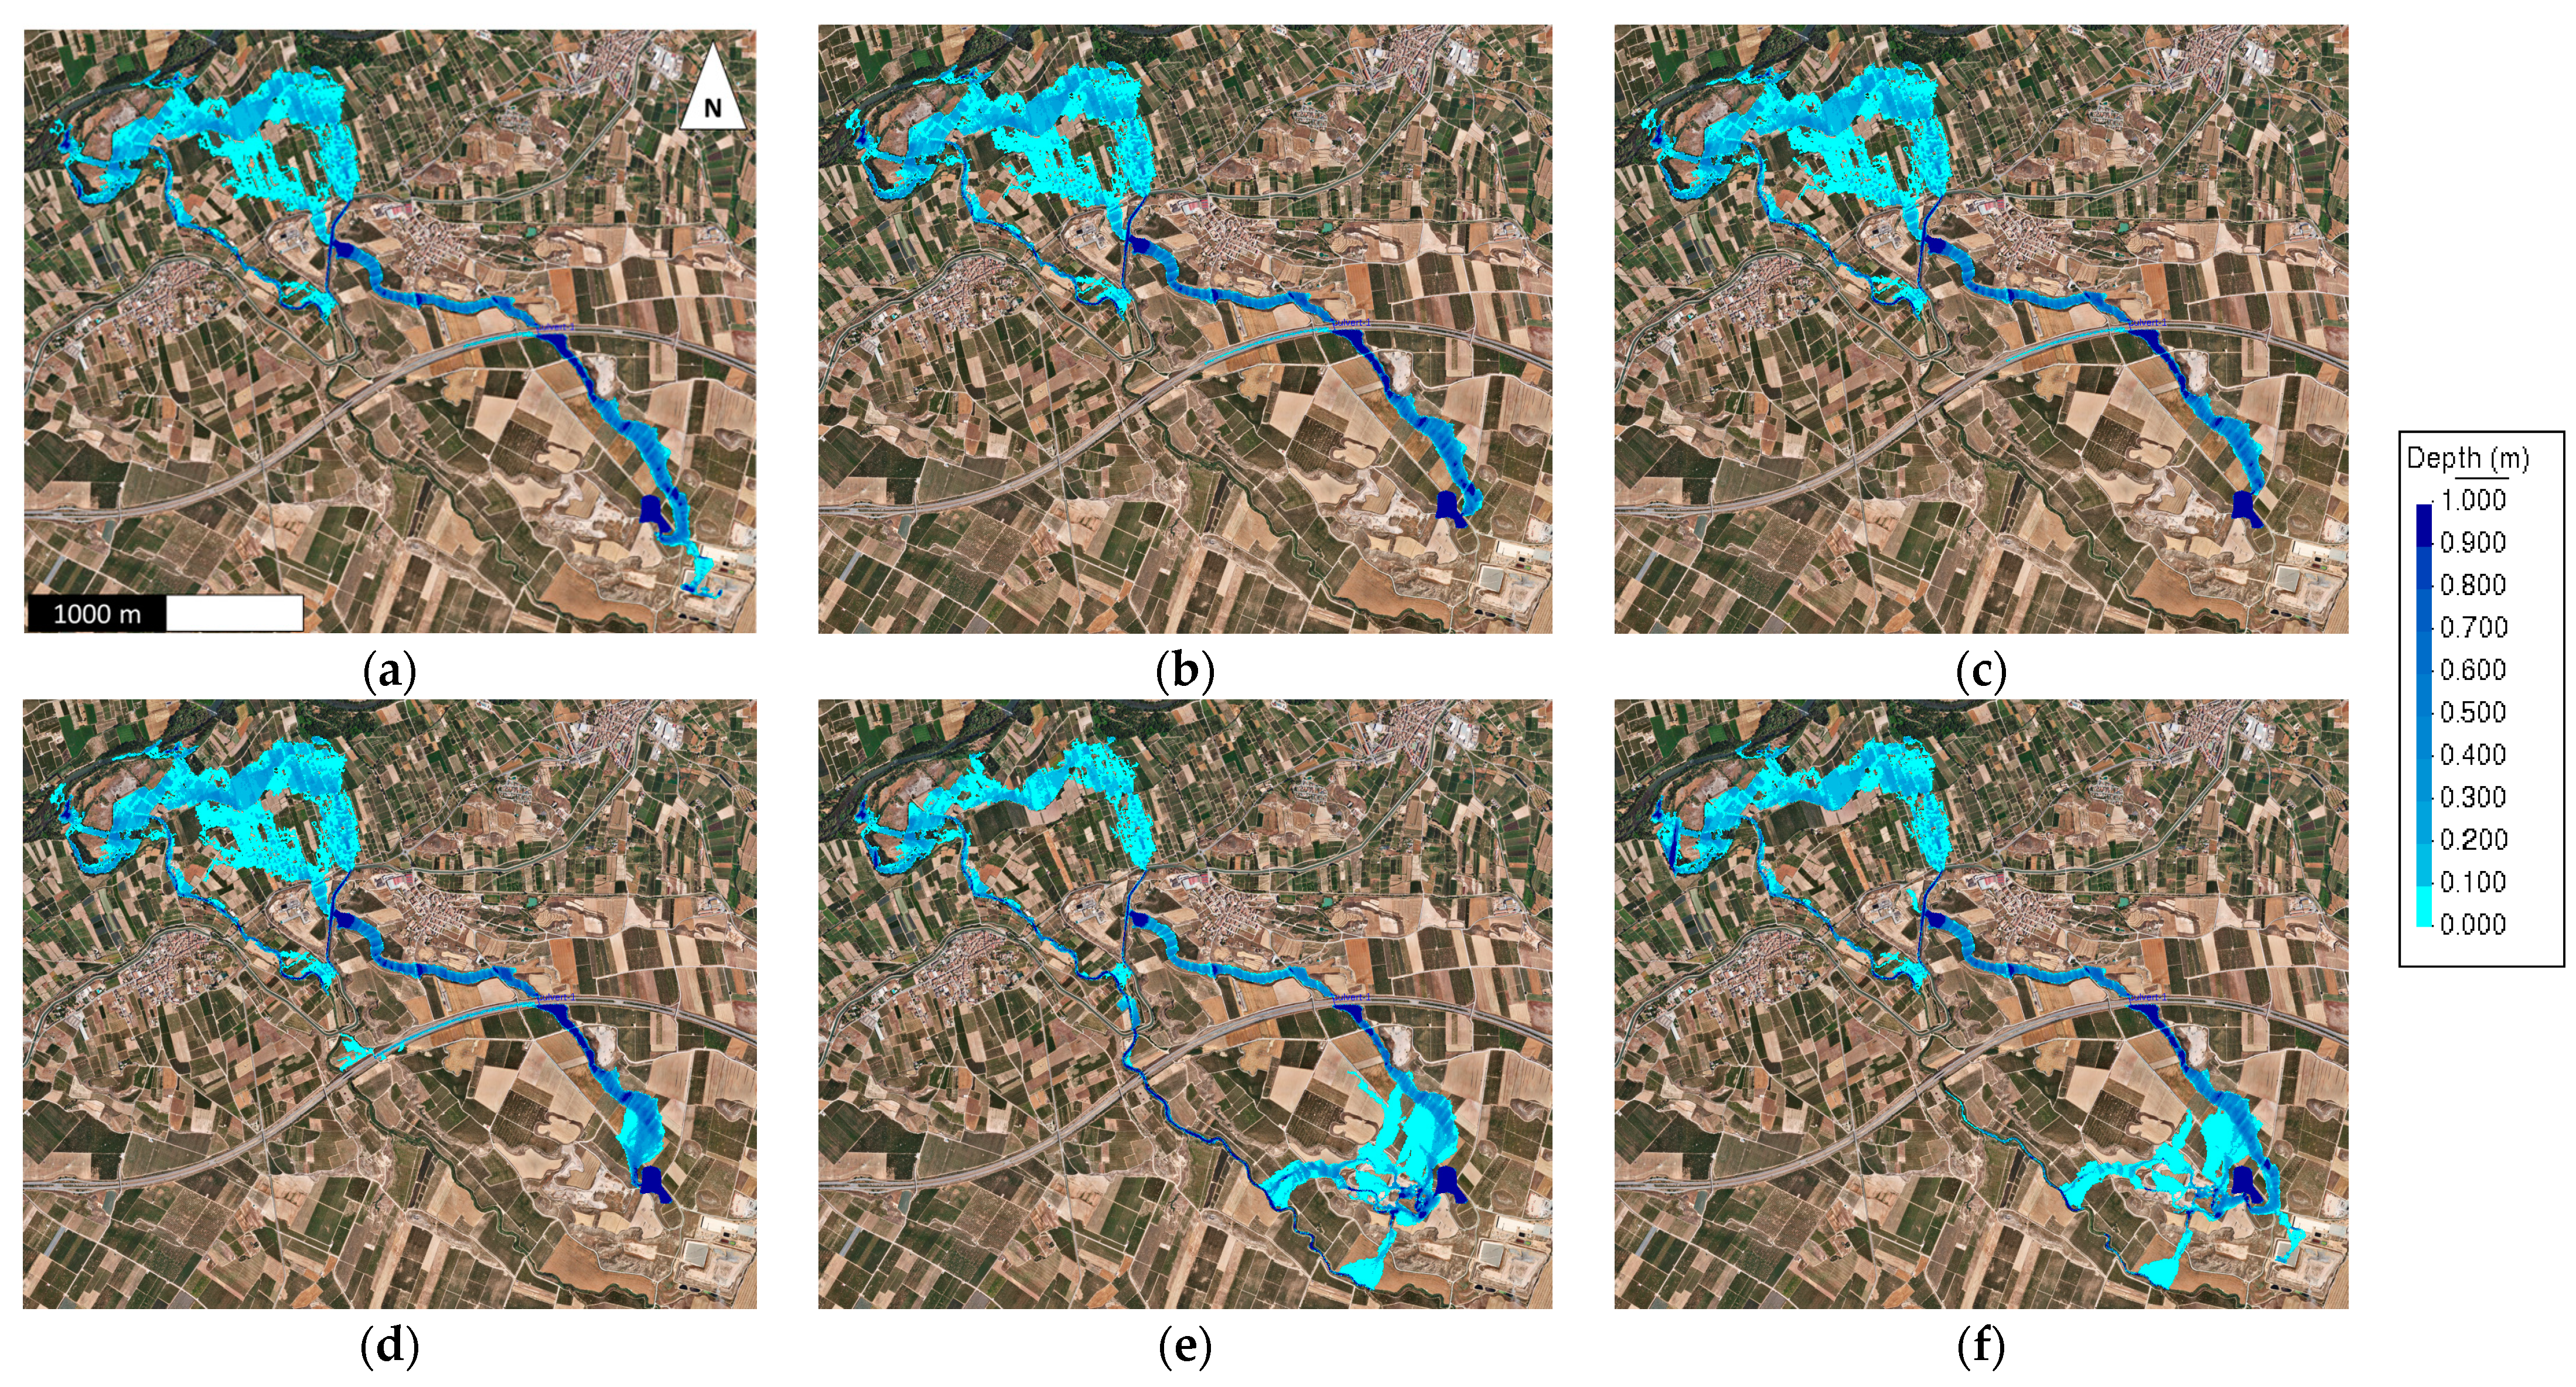
A similar situation would be produced in the Montoliu case study, because the off-stream reservoir is planned to be built over the natural terrain, but on the top of a hill. Despite a small river exists at the west, the fluid generally spreads towards the north flooding agricultural terraces and reaches a highway, first, and an irrigation channel, later (
Figure 7). In several scenarios, the culvert located below the highway, at the north of the pond, would not have enough hydraulic capacity, and the water would accumulate, reaching and flowing over the road (
Figure 7a–d). Only the failure of the dykes located at the south-west would reduce the amount of water flowing through the culvert (
Figure 7e–f).
Lagunilla and Segarra off-stream reservoirs were partially built over the natural terrain: only one or two sides of the dyke are fully exposed.
Figure 8a,b shows the maximum flood extent in Lagunilla caused by a potential failure at the medium part of the NE and SE dykes, respectively. Both inundations differ notably because a gentle hill divides the area of spill, but the SE break also floods the northern area. Breaks towards the NE would reach an irrigation ditch, meaning the flood would be partially channelled.
A similar flood process would occur in case of failure of the Segarra off-stream reservoir. Depending on the break point, the flood would propagate to a greater or lesser extent towards the NW or NE valleys. In this case, the topography is highly anthropic, mainly formed by agricultural terraces with an irrigation channel and roads, which highly condition the propagation process of the flood.
As shown in the previous cases, the selection of the break point is not trivial. A wrong selection would not provide the worst scenario in terms of maximum flood hazard: neither its extension nor hydraulic variables. Thus, a probabilistic analysis based on the stochastic generation of the break point ensures the obtaining of the global flood extent envelope that includes the worst scenario.
4.2. Which Is the Minimum Number of Breaches (Scenarios) That Would Provide Good Statistical Results?
The proposed statistical approach is based on the stochastic definition of breaches along the dykes of the off-stream reservoir. The number of breaches, or scenarios, was determined by means of an equidistance between breaches, that was 5 or 10 m depending on the case study (see
Table 1). In this section, the minimum number of scenarios needed to obtain suitable statistical results is explored through the Rubial case study. The probabilistic flood extent (P[h > 0.01 m]) is compared considering an equidistance between breaches of 5, 10, 20, and 50 m, and only 1 breach per dyke.
The histograms of the probability, grouped in ranges of 10%, are summarised in
Table 3. As expected, the flood extent increases with the number of breaches considered. By contrast, the frequency of 100% slightly increases when the number of scenarios decreases, being 3205 for 5 m equidistance, while it is 3311 for 1 breach per side. The histograms are similar for equidistances of 5, 10, and 20 m, with particular differences in the upper part (>70%) for the 20 m equidistance.
The three major frequencies concentrate in 40–50, 80–90, and 90–100% for the 5 and 10 m equidistance. This trend changes completely for 20 and 50 m equidistance and 1 breach per side, especially for high flood probabilities (>70%). In these cases, the range between 70 and 80% concentrates the third major frequency with the same order of magnitude than the second and the first. These values clearly differ from the results obtained with the scenarios of an equidistance of 5 and 10 m, particularly in the range 80–90%, in which it is the third major frequency, while it is the ninth for the other scenarios. As expected, the scenario defined as a breach per side only has frequencies in 25, 50, 75, and 100% of probability of exceedance of the hydraulic variable, frequencies of 50 and 100% being the same order of magnitude as the rest of scenarios.
As shown, scenarios with equidistances between breaches of 5 and 10 m provide similar results. In this case, using half the distance between breaches only increases the flood extent by about 0.1%, thus both equidistances are statistically significant and consistent. Despite an equidistance of 20 m between breaches providing similar results in comparison with 10 and 5 m equidistance, the appreciable differences in the lower and upper part of the histogram could make the results unsuitable. This fact is reproduced in the other case studies, regardless of the location of the off-stream reservoir and the generation of branches of inundation.
4.3. Limiting the Calculation Domain
As mentioned before, one of the main issues for practitioners when dealing with off-stream reservoir failure studies is the location of the breach that generates the worst results in terms of flood hazard. In this regard, the definition of the calculation domain is also challenging because the flood extent is, a priori, unknown. This is especially complex to determine in highly anthropic topographies, where off-stream reservoirs are commonly located to supply water for agricultural purposes.
This problem is commonly by-passed—not fully solved—by defining a sufficiently large calculation domain. With that, the numerical model is not optimised, and a huge number of elements are unnecessarily used to discretise the computational domain. A major number of elements generally implies greater calculation times, despite using HPC techniques [
35]. Thus, a previous analysis should be required with the aim of reducing the calculation domain, the total number of elements strictly necessary and, as a consequence of that, the global computational time.
The methodology presented in
Section 2.2 to generate the stochastic scenarios can also be used to determine an optimised computation domain utilising, for that purpose, a coarse mesh. In this case, the whole simulation process will run in a few minutes, even in large computational domains. Once the simulation process ends, a flood map corresponding to a probability of over 0.01 m of water depth, or less, roughly provides the envelope of the flood extent. The definitive and optimised computational domain can be obtained by applying a buffer to this preliminary flood area.
This technique was utilised for all case studies presented herein. For example, in the Segarra case study, an original model was utilised to simulate the flood propagation, discretising a study area equivalent to the extension of the topographic sheet (2267 ha). Applying the proposed methodology and a buffer of 100 m, the study area was reduced to 646 ha. The first model built for the Lagunilla case had 676 ha and, once fine-tuned, the total area of the calculation domain reduced to 398 ha (also with a buffer of 100 m). Therefore, this approach can also be useful for optimising the numerical model, reducing the number of elements to half or less and, as proved in
Section 3.3, also the global computational time.
4.4. Fine-Tuning Hazard and Risk Criteria to Assess the Potential Flood Damage in Roadways
The classification of off-stream reservoirs should not be overly complex. The release of the current Spanish Technical Guide [
40] in 2021, which replaced the old version of 1996 [
49], is a step forward, despite it being mainly oriented—and defined—for dams. Although other technical documents are, a priori, not necessary to interpret the current guideline [
50], the classification process defined in 1996, and also in 2021, admits the development of new strategies to carry out the flood hazard assessment for dams and ponds [
51].
The flood hazard criterion in the case of non-urban areas was accommodated to follow the hazard criteria in case of fluvial inundations [
52]. However, the assessment of the potential flood damage when roadways might be exposed is less defined, especially the hazard criteria [
53].
To that end, Martínez-Gomariz et al. [
53] present a new methodology to assess potential flood damage to roads in the case of dams or ponds failure. The safety of the vehicle occupants is pointed out when the stability is lost in case of flood. They propose not only the application of a proper hazard criterion based on the stability of the vehicle [
54], but also a vulnerability criterion to floods according to the exposure (minimum and maximum expected number of vehicles), the sensitivity (age of the vehicles), and the number of occupants per vehicle.
Keeping in mind that the category of an off-stream reservoir might depend on the assessment of hazard in roadways, such as in the Montoliu and Segarra case studies, this criterion could fine-tune the potential flood damage assessment in case of failure. The floodable road length is a critical parameter [
54], and it could be underestimated if a deterministic flood assessment is conducted.
With the proposed probabilistic approach, the flood envelop can be directly obtained, which considers any break point along the dyke(s) of the off-stream reservoir. Hence, both methodologies are complementary and may fine-tune the current flood hazard assessment in case of an off-stream reservoir failure.
4.5. A Machine Learning Approach for Estimating the High-Risk Areas
As stated previously, the Spanish Technical Guide allows the utilisation of well-justified alternative methodologies that help in the classification process function of the potential risk in case of failure. That is, for example, the use of machine learning (ML), a common technique used to predict the behaviour of structures [
55,
56], morphodyncamic evolution [
57], hydrological purposes [
58], the flood extent [
59], and the peak discharge due to breaching of embankment dams [
60], among others.
Silva-Cancino et al. [
61] presented a methodology based on ML to identify risk zones at any point in the vicinity of an off-stream reservoir. A ML-based surrogate model was trained with data obtained from 1200 two-dimensional hydraulic synthetic cases. For each model, 200 elements at risk were randomly distributed within the computational domain. The hydraulic variables were then extracted, providing a database of 240,000 points classified as ‘low danger’ and ‘high danger’ according to the Spanish Technical Guide for non-urban areas. The ML predictive model is based on the random forest classification algorithm and provides a pre-classification of the off-stream reservoir (A, B or C) accounting for the topographical data, the location of the elements at risk, and some geometrical data.
The random forest classifier algorithm uses class probabilities to estimate the correct predicted class in each tree and in the overall prediction [
62]. That is, an element at risk is taken as ‘high danger’ if the class probability is higher than the probability threshold (defined as 0.5). A probability above this threshold, but close to 1, means a more reliable prediction of the ML model.
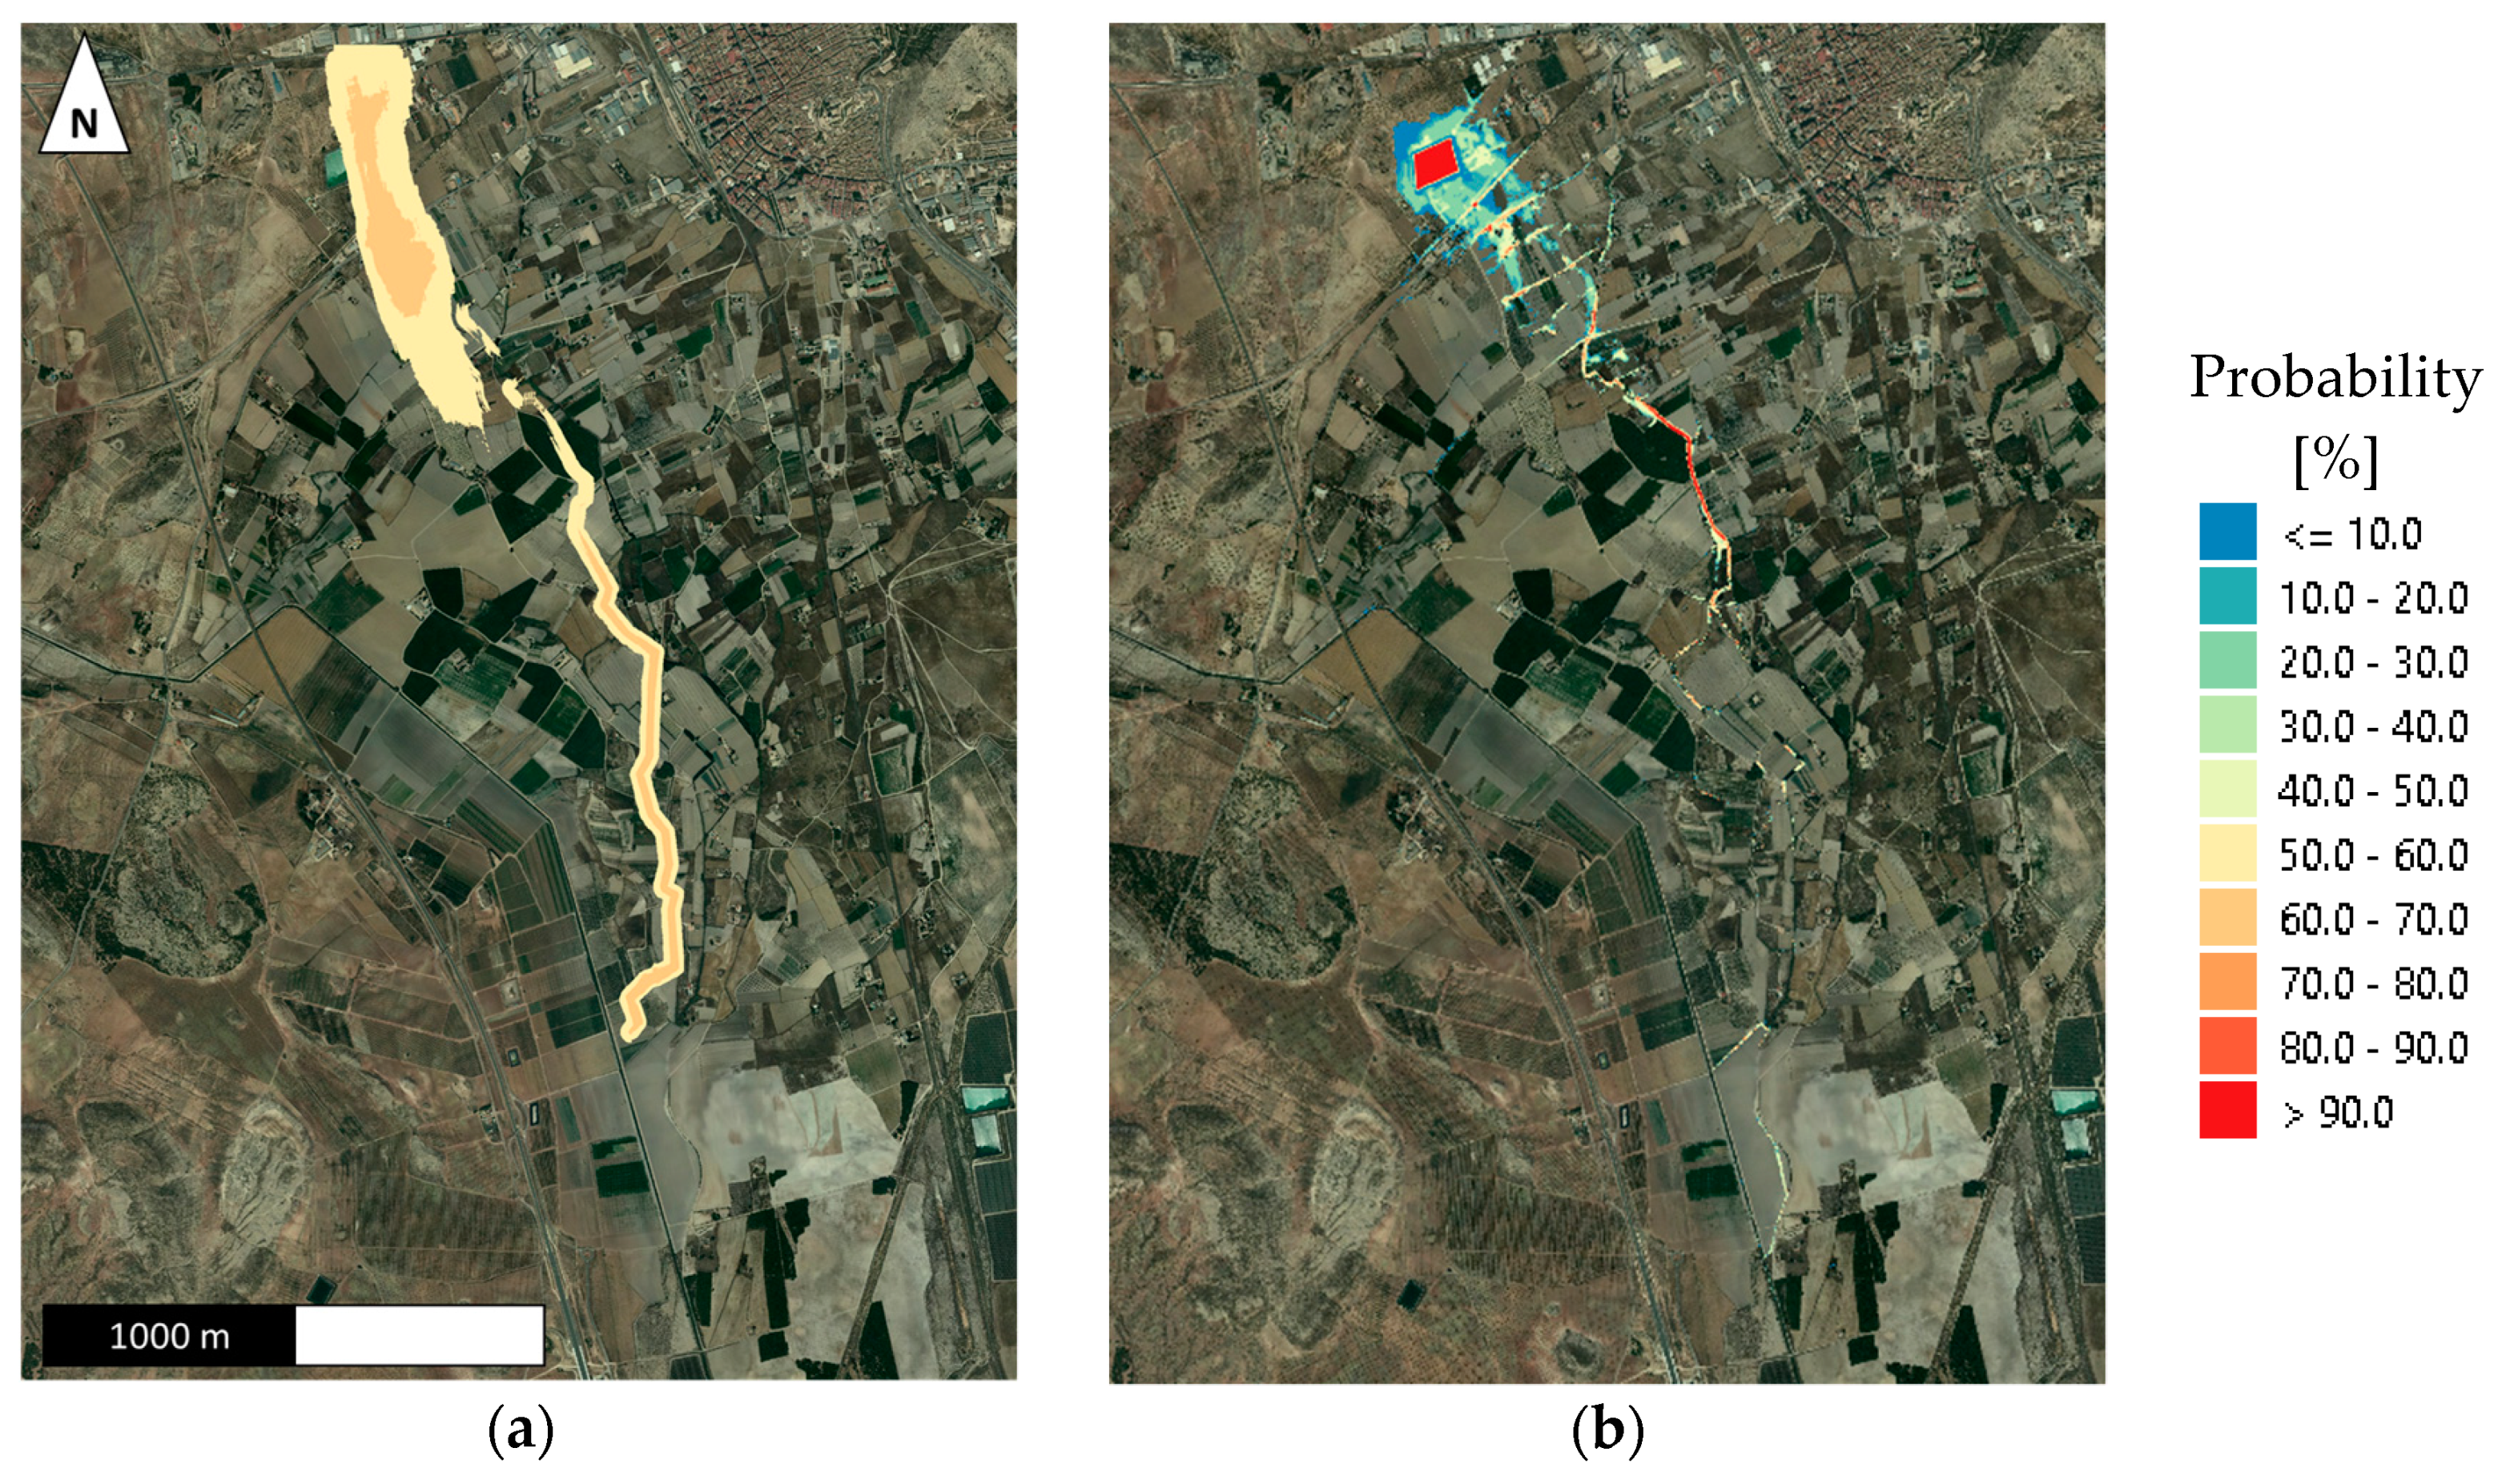
The class probability also applies to a complete study area, such as was performed in the Rubial case study. Probabilities between 50 and 60% were obtained in most of the areas predicted as ‘high danger’ in the vicinity of the structure, while more reliable predictions were observed in the irrigation ditch with values above 60% (
Figure 9a). By contrast, the proposed methodology provides a map of the probability of ‘high danger’ in case of stochastic failure of the off-stream reservoir (
Figure 9b). Both methodologies present a similar spatial distribution of the results, with high values near the pond and in the irrigation ditch.
The results of the proposed methodology model are richer and have higher resolution than ML-based approaches. For example, from the 74 elements at risk of this case study, 4 of them have a probability of being ‘high danger’ between 40 and 50%, 3 between 30 and 40%, 7 between 20 and 30%, 2 between 10 and 20%, and the other less than 10%. That is, in at least 40 of the 136 simulated cases, seven elements at risk were classified as ‘high danger’. Thus, the structure would be classified as ‘Category A’ with a probability greater than 30%.
The ML-based approach provides the ‘high danger’ class with a certain degree of uncertainty. That is, how reliable are the estimated results. By contrast, the map of probability of the proposed methodology is per se a reliable result because a probability greater than 0% means that there is, at least, one scenario in which ‘high danger’ is obtained in an element at risk.
5. Conclusions
One of the main issues faced by practitioners when classifying an off-stream reservoir according to its potential damage in case of failure is the establishment of the breaking point location. To that end, a novel methodology has been developed to cover all possibilities, and that serves to carry out a probabilistic approach for off-stream reservoir failure flood hazard assessment.
A stochastic generation of breaches along the dyke of the off-stream reservoir is defined, the results being statistically significant and consistent with an equidistance of 5 and 10 m between breaches. Then, an in-cascade calculation process simulates each breach formation and the flood propagation process in the same model. Due to the large number of simulations, the results can be analysed from a probabilistic point of view, thereby generating maps of probability of inundation in case of a potential failure of the structure.
The proposed methodology allows for the direct determination of the global envelope of the flood extent, using a low value for the probability of exceedance threshold of water depth (e.g., P[h > 0.01 m]). Thereby, the simulation of the worst break scenario is ensured from a purely hydraulic point of view. However, the global probability of flooding also depends on the structural strength of the dyke.
With the proposed methodology, it is possible to obtain the deterministic flood maps of all scenarios calculated in the same model. The methodology also allows the determination of an optimised computation domain for more detailed simulations, e.g., by using a coarse mesh and a buffer of the resulting enveloping flood extent. The methodology can be extrapolated to other typologies of off-stream reservoirs, other kinds of breaches, and adapted to other safety regulations. Thereby, it is an open and easily-adaptable methodology, the results of which are less dependent on the practitioners and can provide a more homogenous framework for water authorities or agencies when evaluating dam-break flood-hazard studies.
The implementation of the breach formation process in a parallelised code, jointly with the flood propagation process, allows the simulation of high-resolution numerical models in a reasonable computation timeframe. The integration of the probabilistic approach, together with the classical deterministic approach, expands the functionalities of the numerical tool and attempts to solve the main issue, when dealing with the assessment and classification, according to their downstream potential damage.


 ,
, 


