1. Introduction
Water resources are vital to human survival and are a central part of the biosphere [
1]. Water connectivity is the basis for material flow and energy transfer in terrestrial ecosystems [
2,
3], and is one of the necessary conditions for maintaining ecosystem diversity [
4]. With industrialization, human societies are increasingly demanding water resources and the number and extent of natural water ecological disturbances (e.g., dam construction, river pumping, or straightening) are increasing [
5,
6]. Intense anthropogenic activities have increased the degradation of the structure and function of water ecosystems and regional water scarcity [
7,
8,
9]. Hydrological connectivity is a key driver of water ecosystem structure and function and is an important tool for addressing water system issues and water allocation.
Hydrological connectivity refers to the extent of water-mediated transfer of matter, energy, and biology in the terrestrial landscape elements of a system [
10,
11,
12]. It plays a key role in basin functions such as water allocation, underlying biogeochemical and nutrient cycling processes, and their response to disturbances in basins [
13,
14,
15]. Therefore, the assessment and optimization of regional hydrological connectivity and the understanding of hydrological flows and their causes are necessary for the conservation of regional water ecosystems, management, and allocation of water resource demand within the basin, and construction of ecological projects [
16,
17]. However, although hydrological connectivity is an important parameter for water ecological functions and water resource management in basins, there are many assessment methods, most of which are specific to the characteristics of the study area and have regional limitations [
18,
19,
20]; no evaluation system or methodology has been proposed for larger areas [
21]. Several studies have been conducted on the hydrological connectivity of intermittently flooded areas, such as paddy fields, delta beaches, floodplains, and wetlands and their protected areas [
22,
23], while fewer studies have been conducted on plain areas within the basin [
21]. As basins are the smallest unit in the complete study of the hydrological cycle, there is an urgent need for hydrological connectivity assessments at the basin scale for an improved understanding of regional water ecological functions and water resource management [
24].
Human-induced natural disturbances can reduce the spatial relationships between natural water patches [
25]. This alters their heterogeneity and increases barriers to water circulation within the basin, thereby reducing hydrological connectivity. With the growing awareness of its importance, a large number of hydrological connectivity projects have been implemented at the application level with a main objective of water quantity regulation (e.g., water diversion projects, etc.) [
26]. Optimizing the hydrological connectivity pattern has become an important tool for regional water supply, flood and drought prevention, water resources distribution, and ecological security [
27]. However, practical experience shows that hydrological connectivity projects may also bring some negative impacts and potential risks [
28], such as increased flood control pressure, environmental degradation, and invasive alien species. To address these issues, studies on the optimization of hydrological connectivity patterns within the basin have been progressively carried out. Current research has concluded that changes in hydrological connectivity are based on the modification of river systems and the effects of dam and gate construction [
29,
30]. The solutions are thus mostly based on the existing hydrological structure of the study area, and hydrological connectivity is optimized by adjusting the hydraulic distribution within the water system (e.g., dam and gate passage) [
31,
32], for example, to enhance the material and energy transfer function of the water body. However, this approach is mainly aimed at areas with well-developed and mature water system structures and has certain limitations. For example, in arid regions where precipitation is scarce and water bodies are scattered, it is difficult to optimize hydrological connectivity by adjusting the existing water system structure to meet regional water-use requirements. Optimizing hydrological connectivity in water-scarce areas requires the development of new water connectivity pathways that combine natural water systems to form an integrated artificial–natural hydrological structure. New water connectivity pathways should be connected by points in the basin where the flow of water is less impeded, with obstructions to hydrological connectivity, including both human and natural factors [
33]. The Dongliao River Basin (DRB) of northeast China is a humid and semi-humid region with a highly uneven spatiotemporal distribution of water resources and long-term breakage of some major rivers, where the hydrological flow is affected. The DRB is an important grain-producing region, with a large proportion of water used in primary industries and a large, dense distribution of farmland patches, resulting in high irrigation pressure [
34]. Considering social, economic, and ecological benefits, new water connectivity paths are constructed for connectivity optimization, and independent water bodies in the basin are integrated into the hydrological structural network. This can satisfy the water irrigation for designated arable land, from a water-use management perspective, while avoiding its degradation and disappearance, and improve the hydrological connectivity of the basin from a water ecology conservation perspective. This is important for improving the distribution of water resources in the basin and protecting its water ecological functions.
Based on the binary water-cycle theory, this study integrates natural and artificial connectivity, and uses the graph theory method to evaluate the hydrological connectivity at the basin scale, using the DRB as a case study and using the graph theory and binary water cycle theory, integrating the natural connectivity and artificial connectivity, for hydrological structural connectivity evaluation and optimization at the basin-scale arid plain areas. Spatial analysis of obstruction costs at each level was carried out to verify the results and the necessity of optimization at each level. The objectives of this study were: (a) to obtain hydrological connectivity assessment results at the basin scale; (b) to construct new hydrological connectivity pathways in the basin to obtain a hierarchical and optimal network of natural–artificial hydrological connectivity in the basin; (c) to determine the spatial distribution of hydrological obstructions after hydrological connectivity optimization. The results of this study has theoretically explored methods for optimizing hydrological connectivity in water-scarce areas, filling a gap in research on optimizing connectivity structures in arid plains. In terms of application, it provides theoretical support and constructive advice for river-lake connectivity and ecological projects such as the construction of water channels in the basin.
2. Materials and Methods
2.1. Study Area
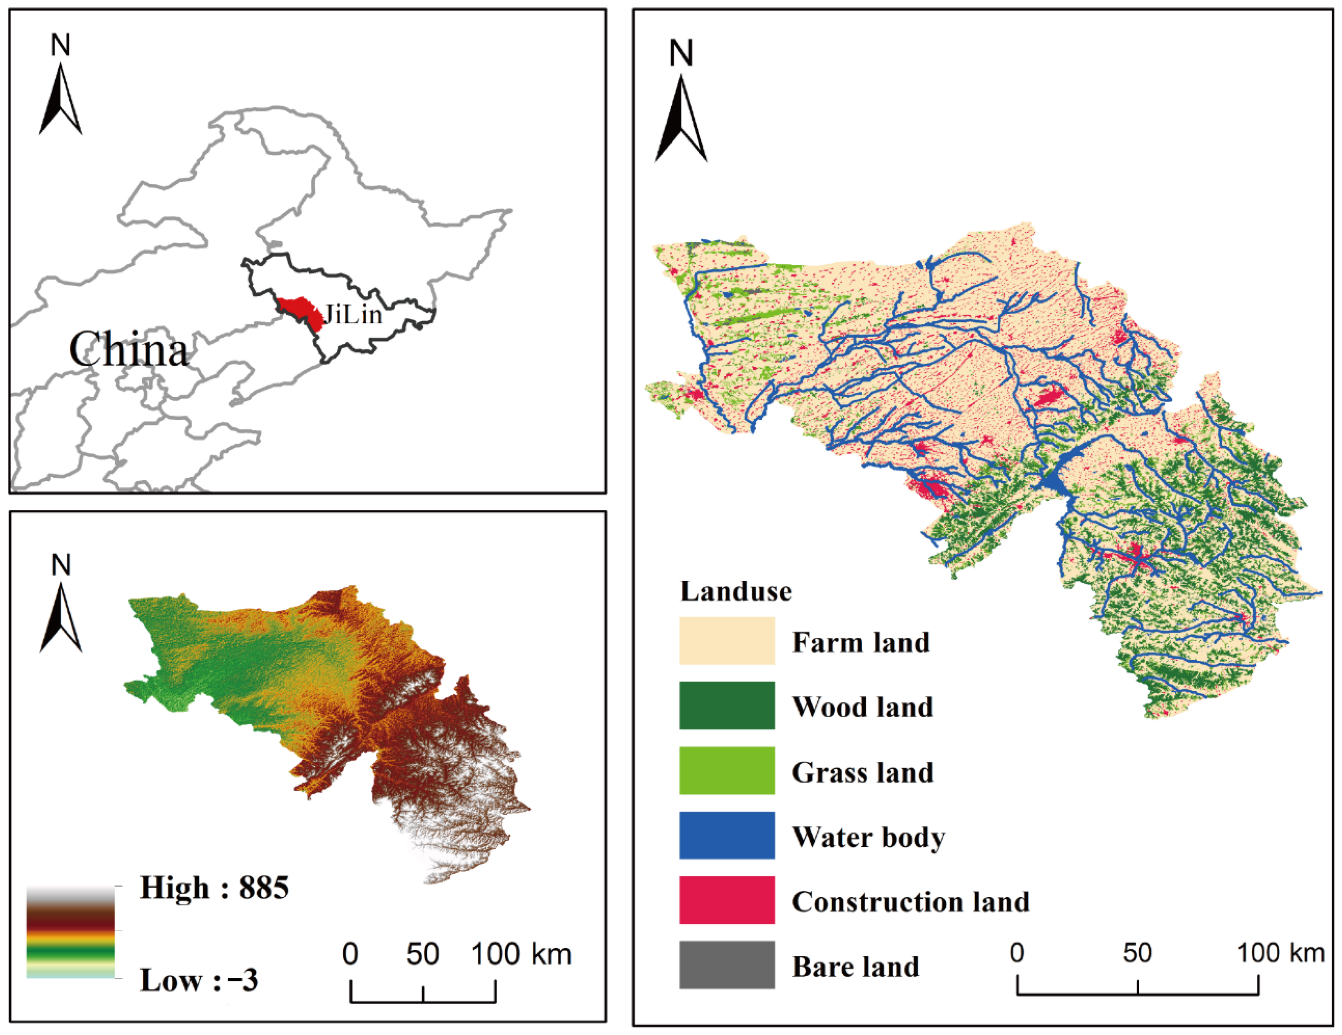
The DRB in Jilin Province (
Figure 1) originates from the Jilin Hadaling Mountains and covers a total area of ~17,000 km
2, accounting for 8% of the total land area of Jilin Province. The DRB spans ~2.5° longitudes and ~1.5° latitudes (123°18′52″–125°47′4″ E and 42°36′46″–44°9′28″ N). The administrative area covers 9 counties (cities and districts) comprising 90 townships. The area is located in the upper reaches of the DRB system and has no transit water. Owing to climate change, precipitation in the area is persistently low, resulting in a resource-based water shortage. The per capita water resource in the basin is 495 m
3, which is 31% of the provincial average and 23% of the national average. Moreover, the water resource development and utilization rates are much higher than the internationally accepted 40% threshold. The basin system includes the three main rivers (Dongliao River, Zhaosutai River, and Tiaozi River), each of which has numerous tributaries. The topography of the DRB is generally gentle, with ~2/3 of the area having a slope of <5°, gradually decreasing from east to west; the highest elevation is 650 m and the average elevation is 328 m. The DRB in Jilin Province is in the transition zone from mixed coniferous and broad forests to grasslands and has the characteristics of forest vegetation. The average annual temperature ranges from 4.4 to 8.1 °C, with an average multi-year temperature of 6.3 °C and an average multi-year precipitation of 547.47 mm. The top three areas of land-use in the basin are 70.58% arable land, 14.12% forest land, and 8.82% construction land. All counties (cities) are important commercial grain-production bases in Jilin Province.
2.2. Data Sources
Land-use data for this study were obtained from the website of the Resource and Environmental Science Data Center (
https://www.resdc.cn, accessed on 12 June 2021) of the Chinese Academy of Sciences. Slope data were calculated from digital elevation model (DEM) data downloaded from the Geospatial Data Cloud (
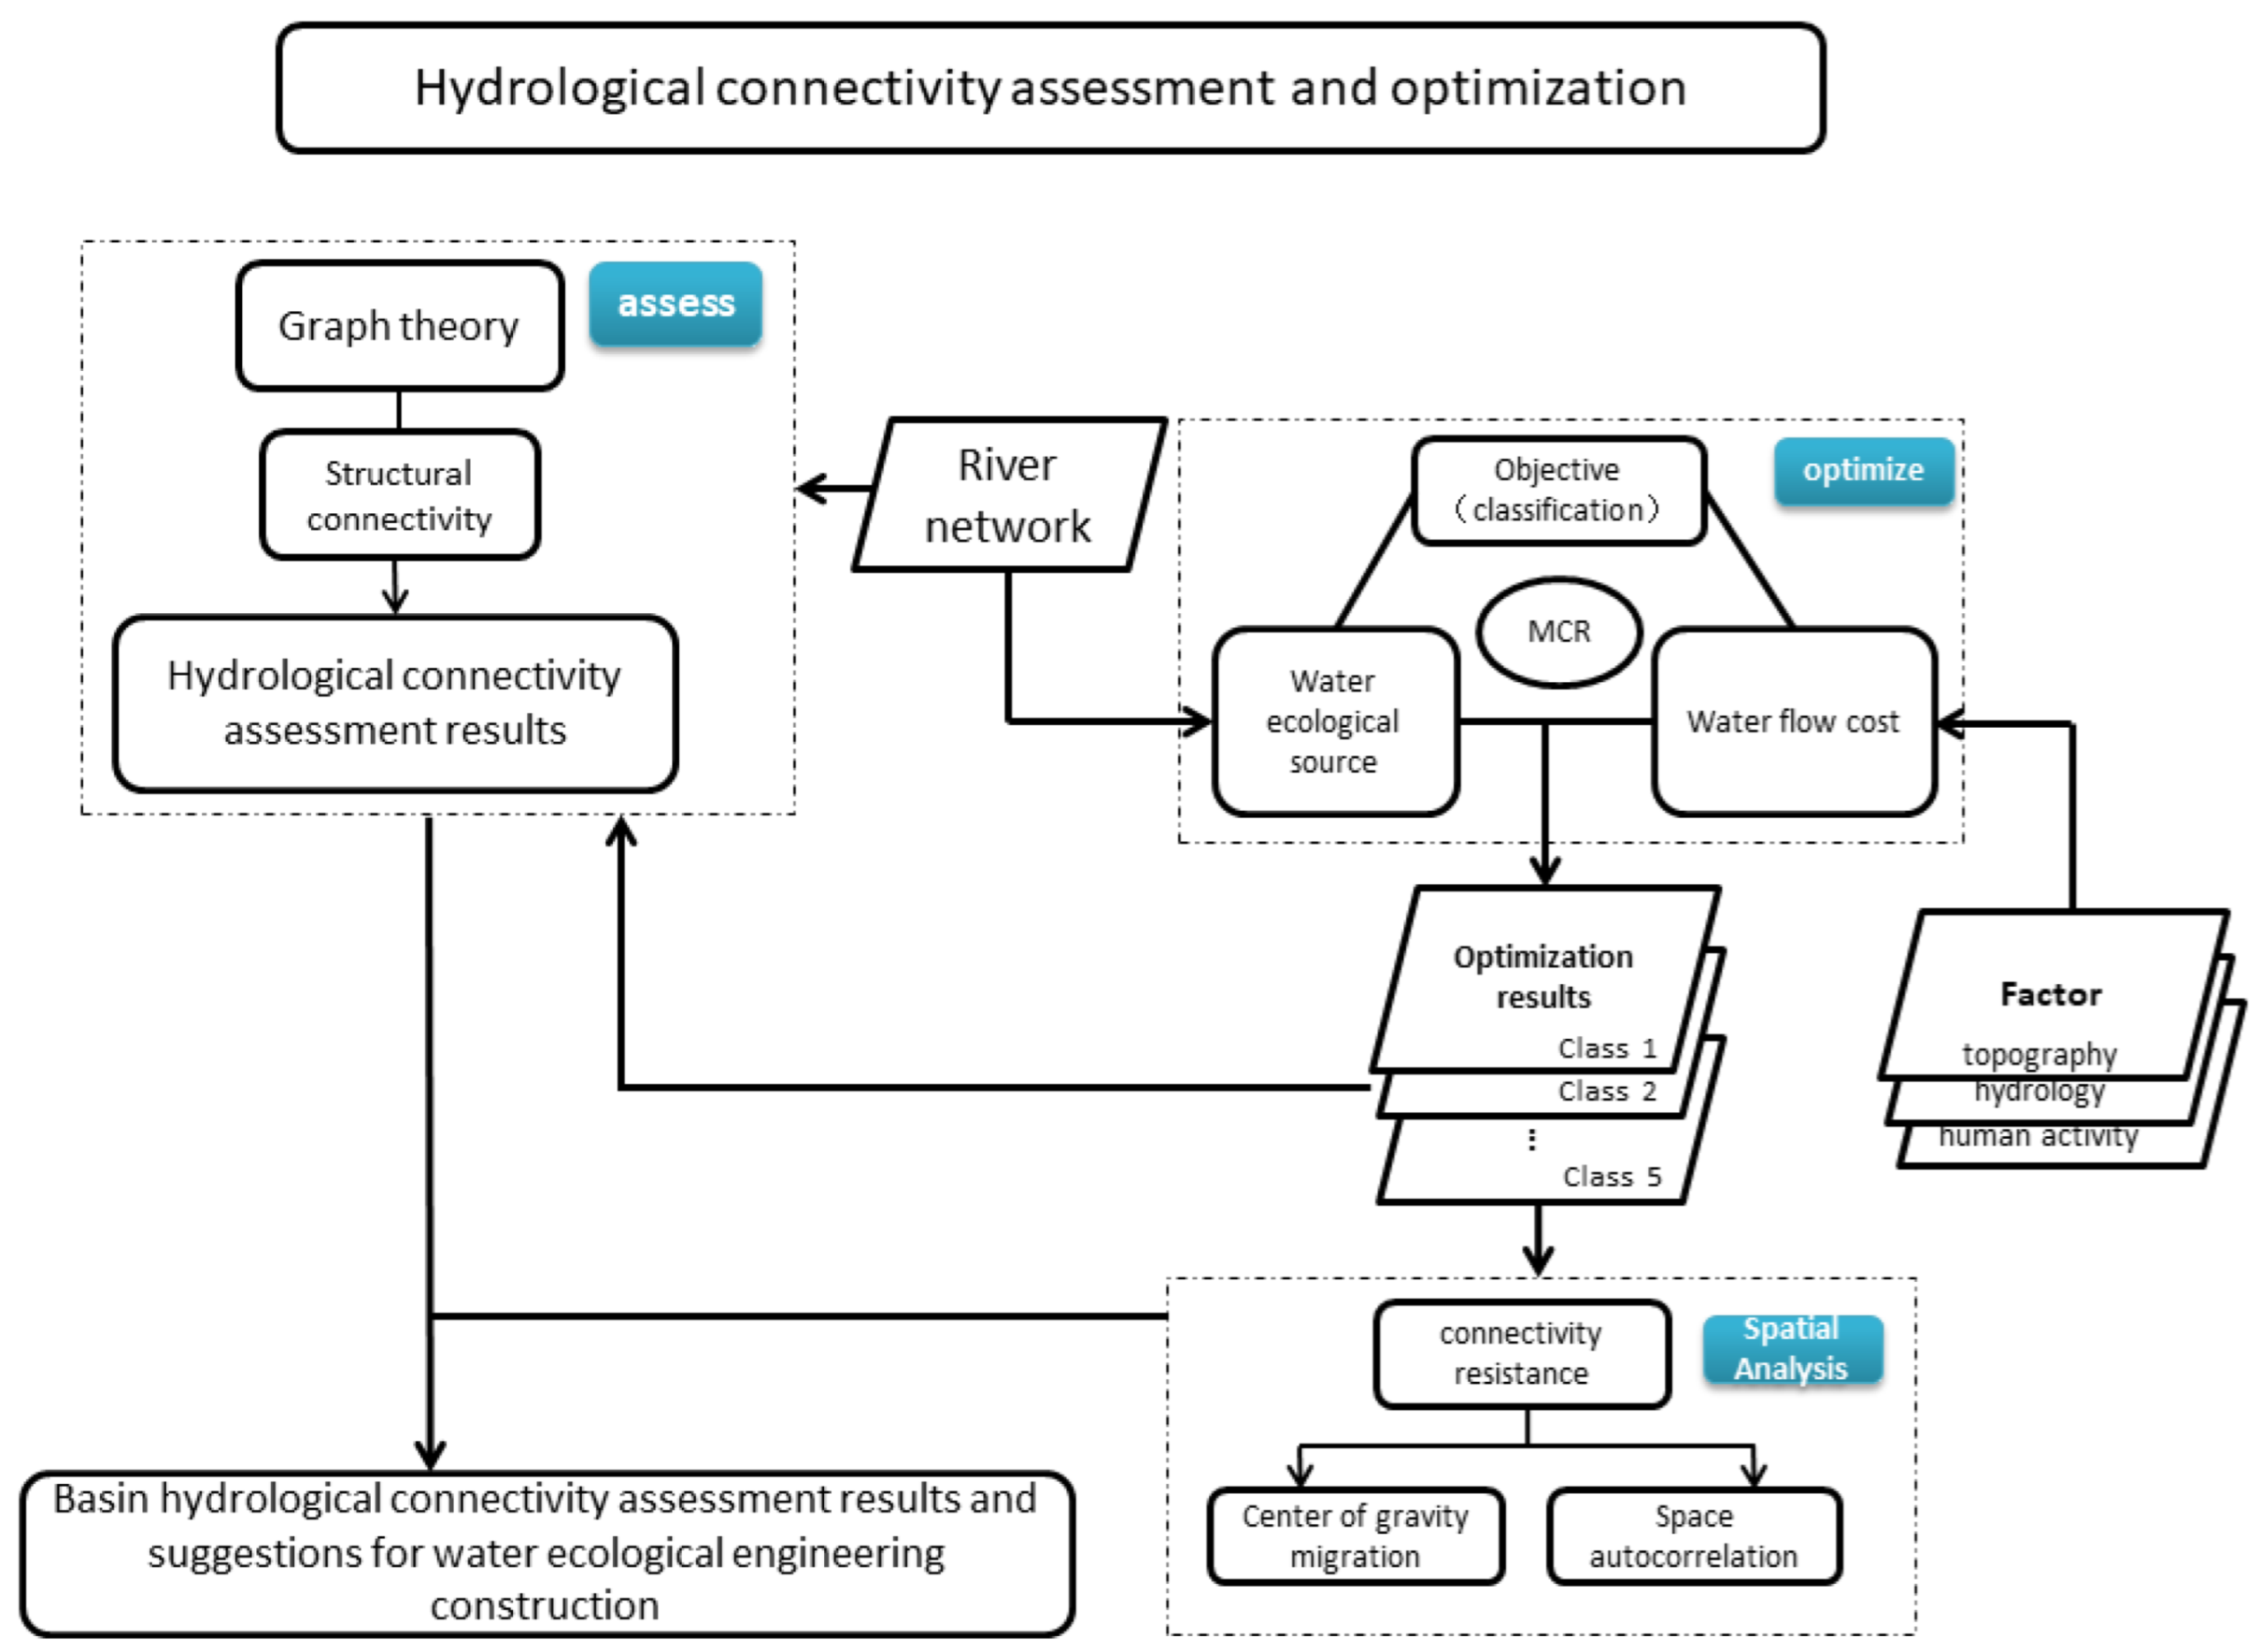
www.gscloud.cn/search, accessed on 12 June 2021). Normalized vegetation index (NDVI) and water system data were obtained from the manual visual interpretation and calculation of Landsat8 multispectral data downloaded from the Geospatial Data Cloud. The raster data used in this study are all 2020 data with a spatial resolution of 30 m; the specific structure of the study is illustrated in
Figure 2.
2.3. Hydrological Connectivity Assessment Based on Graph Theory
Graph theory is a branch of operations research that allows the conversion of landscape systems into digital graphics, with nodes identifying elements of the system and collections of links indicating the existence of relationships or interactions between elements [
35]. Based on the water flow corridor and patches in the study area, the hydrological network of the basin was constructed to quantify the geographical location of water bodies in the basin, processes (e.g., linking cycles between them), and hydrological connectivity.
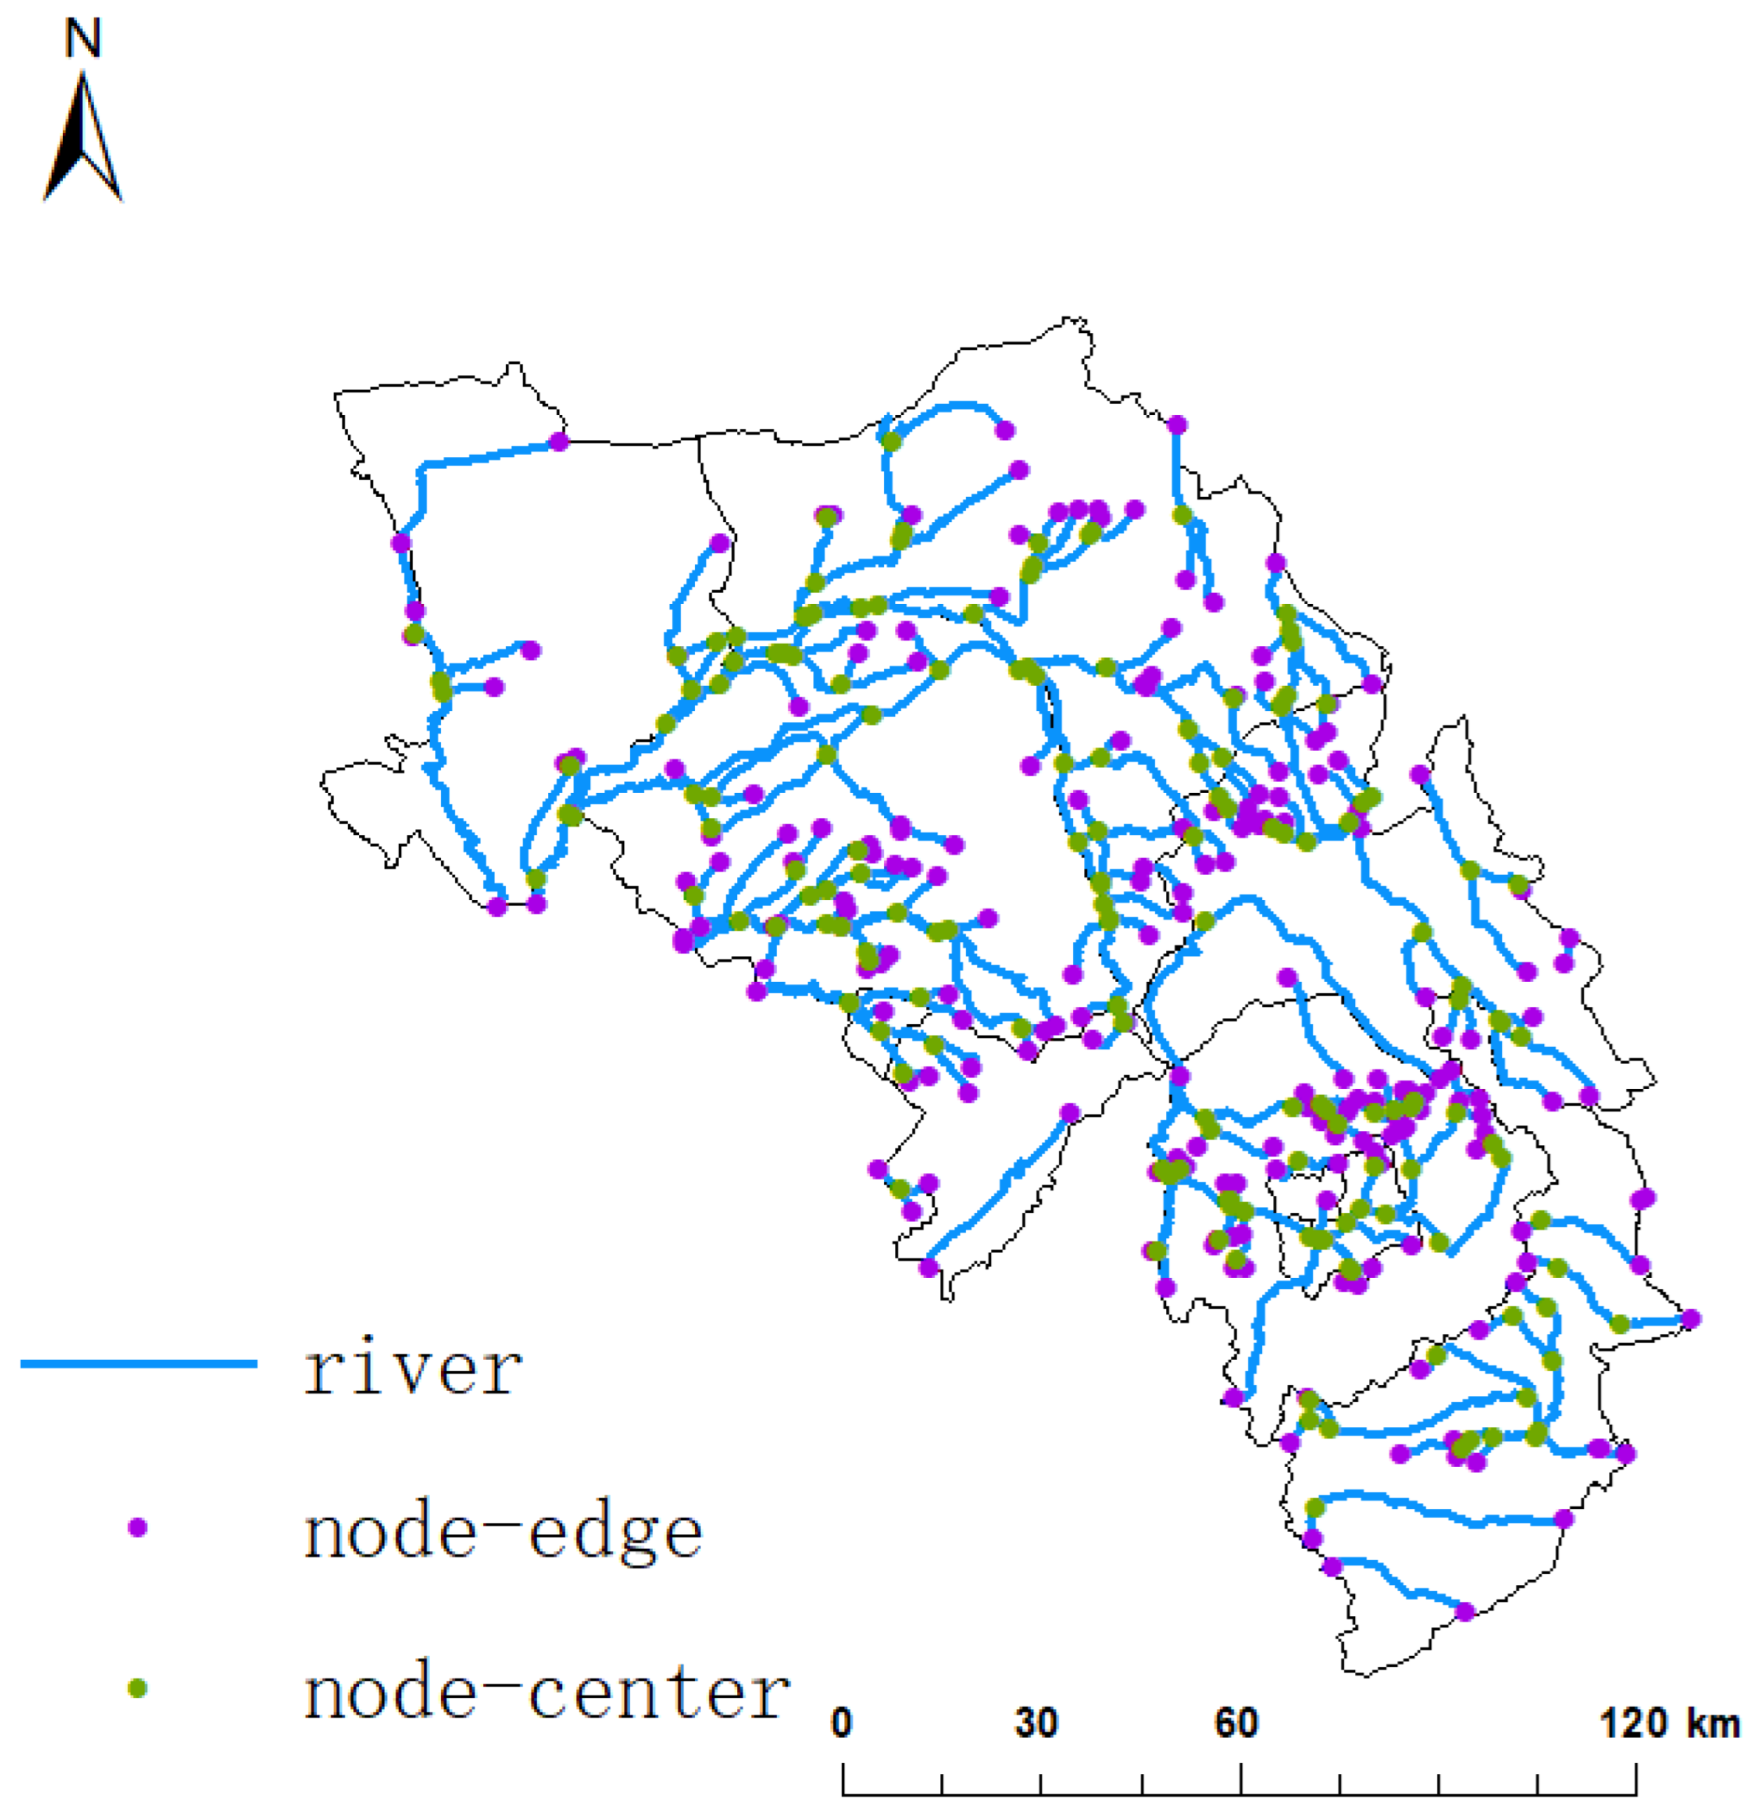
Linear elements, such as rivers and canals in the DRB, were generalized as river links and the intersections of linear elements or surface elements, such as lakes and reservoirs, were generalized as nodes, forming a hydrological connectivity structure map for the study area (
Figure 3).
The hydrological network graph G = (N, E) is the set of water hydrological nodes N = [n
i] (i = 1,......, n) and water hydrological links E = [(uv)] (u, v ∈ N, with the symbol [uv] denoting the link between point u and point v). The bipartite graph G can be uniquely specified by an n × n adjacency matrix A(G) describing specific relationships between nodes, which is the basis for computing the connectivity index.
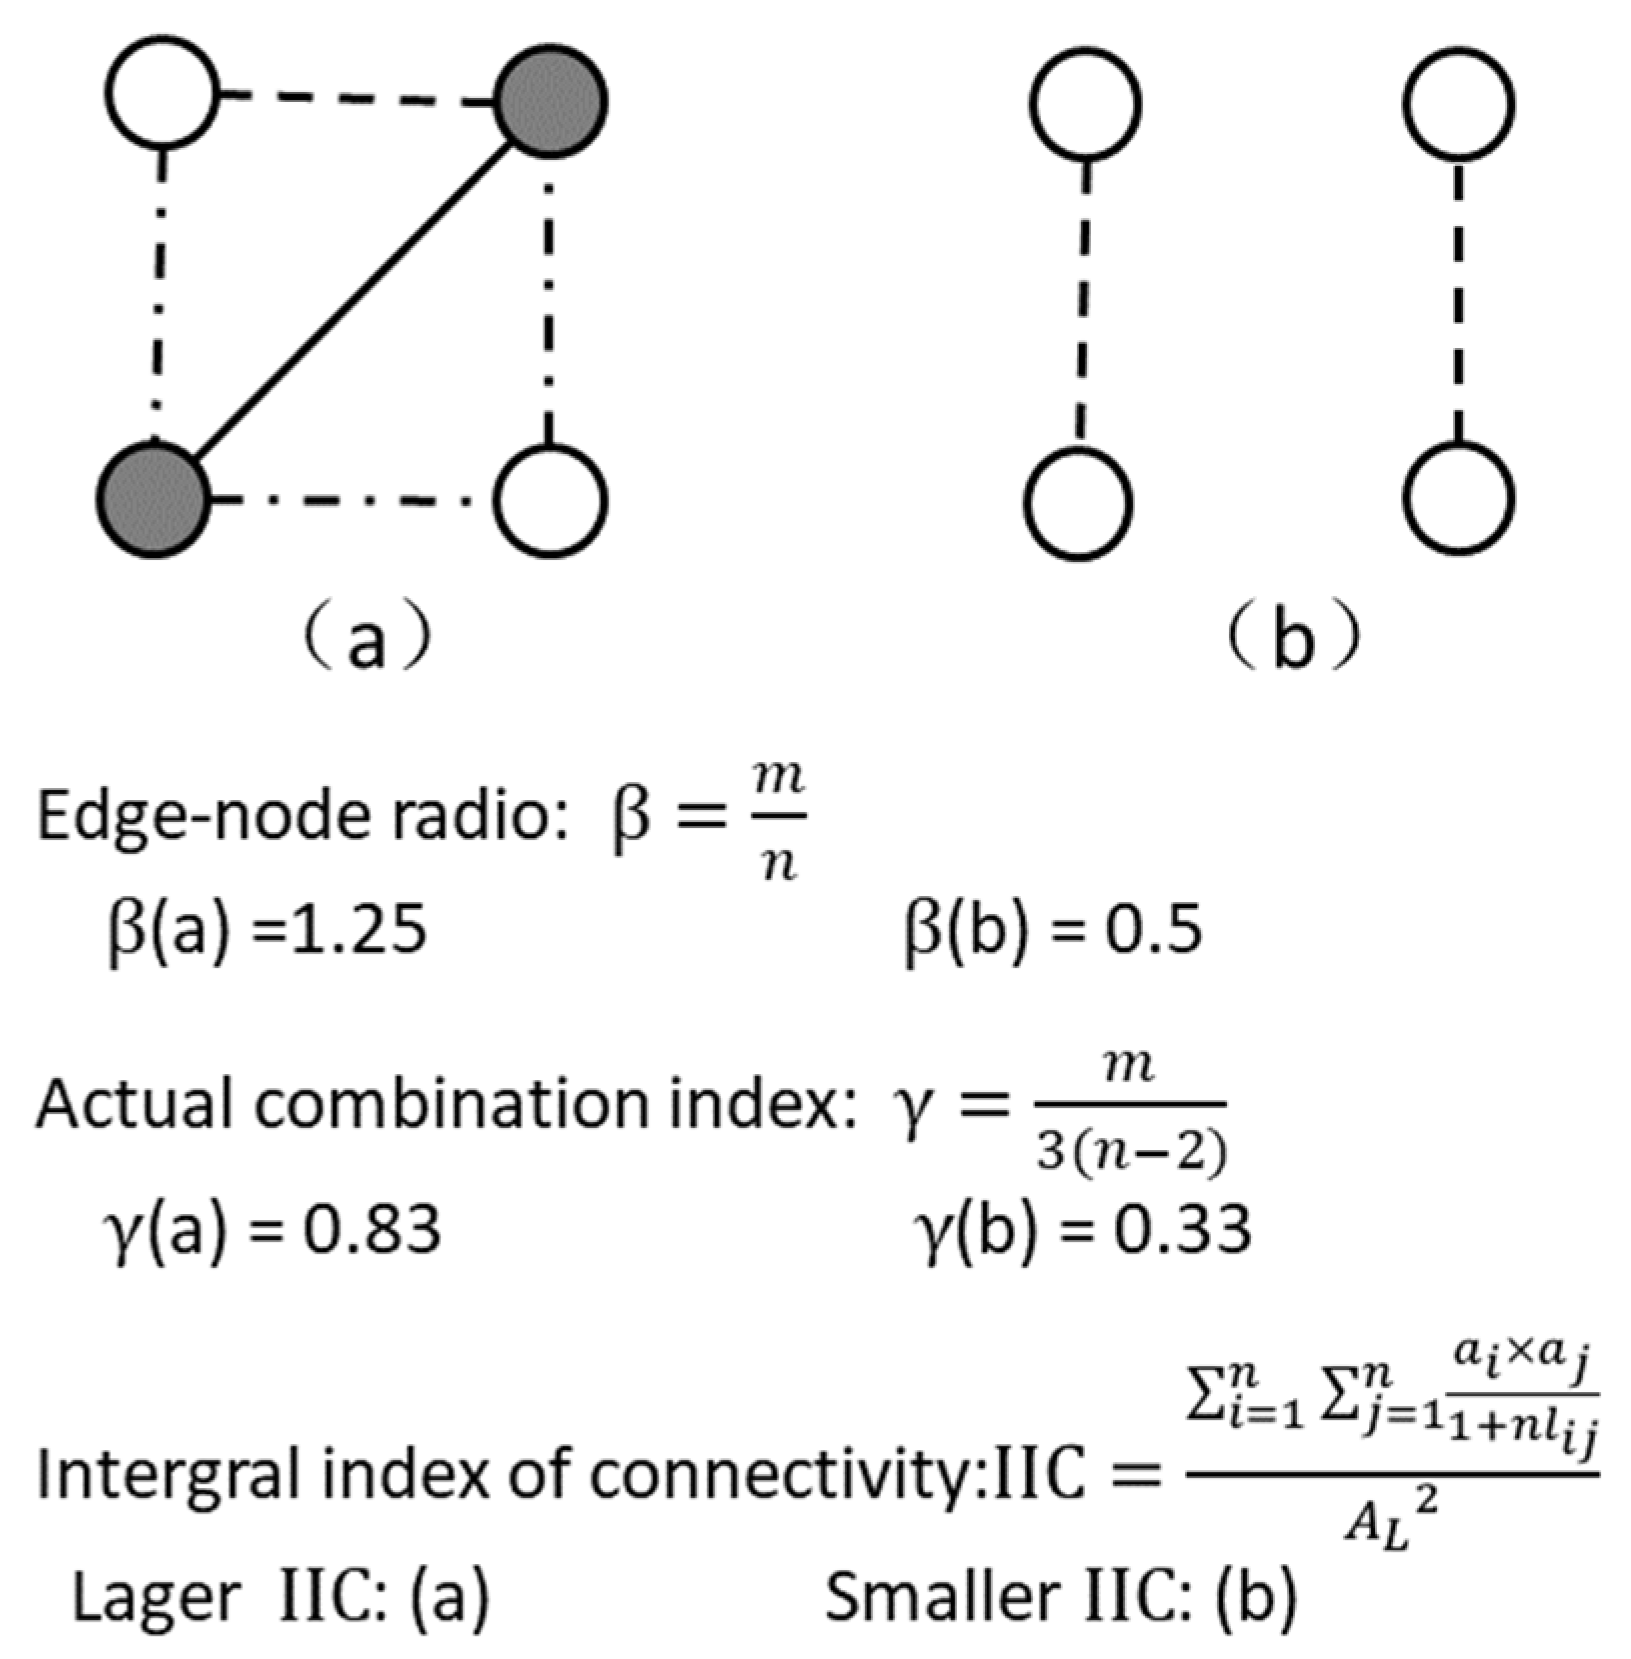
After constructing the network, a total of three metrics, the edge node ratio (β), edge node connectivity (γ), and Index of Integration of Connectivity (IIC), were identified to assess the structural connectivity of the hydrological connectivity of the basin. A case study illustrating these three indicators of connectivity is shown in
Figure 4. We selected β and γ to show the internal complexity of the transmission pathway network, and IIC to indicate the overall connectivity of the transmission pathway network.
As a connectivity metric, β is the average number of river chains per node in the connectivity network and is an indication of the degree of complexity of the relationship between each node and the surrounding water system, which is calculated as follows:
where β is the river chain node ratio, ranging from 0 to 3; m is the number of river chains in the entire network; n is the number of nodes in the entire network.
A larger value of β indicates a greater number of water transport paths connected at that node, presenting a greater internal complexity of the hydrological network.
The actual bonding degree, γ, is the ratio of the actual number of connected river chains to the maximum theoretical number of connected river chains, indicating the strength of the interconnectivity between river chains in the river network and reflecting the complexity of the network; this is calculated as follows:
where γ is the actual bonding degree, ranging from 0 to 1 and m is the number of river chains in the entire network. When γ = 0, there are no links in the network, only isolated points exist; when γ = 1, every node in the network is linked to all other nodes.
The IIC was used to assess the overall connectivity of the landscape elements in a transport path network. The index ranges from 0 to 1 and increases as connectivity increases. The index is sensitive to both landscape area (or quality-weighted area) and connectivity, which is calculated as follows:
where IIC is the overall connectivity, n is the total number of nodes; a
i and a
j are attributes of nodes i and j, respectively (e.g., drainage areas separated by transport paths); nl
ij is the number of links in the shortest path between nodes i and j, respectively; A
L is the maximum landscape attribute (e.g., the total area of the catchment).
2.4. Basin Hydrological Connectivity Optimization Model
By integrating landscape ecology and geomorphological analysis, water bodies in the basin that are not currently included in the system of the water network (i.e., separately existing water bodies that are not connected to other water bodies) are used as the optimization targets of the basin hydrological connectivity pattern. By extracting the paths with the least circulation barriers in the basin, the optimization targets are connected to the existing water systems to improve the basin hydrological connectivity.
Optimization objectives and connectivity paths of existing water systems are influenced by multiple factors within the basin [
36]. Hydrological factors included surface water distribution; topographic factors included terrain and geomorphology; human factors included land-use and hydraulic engineering construction. Taking the above factors into account, the minimum cumulative resistance (MCR) model was used to construct a cumulative resistance surface for hydrological circulation in the basin to obtain the connection paths between individual water bodies and existing water systems and the optimal results of hydrological connectivity patterns.
The MCR model considers three main factors, namely source, resistance, and cumulative cost [
37]. In this study, the MCR model was used to obtain the paths of the source (existing hydrological network) through the cumulative depletion distance surface to the lowest cumulative depletion distance of the target to optimize the hydrological network in the study area and obtain the results of hydrological connectivity patterns optimization in the basin.
The MCR model was implemented based on the spatial analysis function of the ArcGIS10.6 software to determine the degree of obstruction to the flow of water in the basin and to calculate the path with the least obstruction, whose equation is shown below:
where C
i is the cumulative cost of the i-th raster cell to the target and is the minimum resistance accumulated in the pathway from the raster cell at that location to the source; D
i is the cumulative number of pixels in the pathway from a raster cell i in space to the target at minimum cost; F
i is the cumulative cost of the resistance of a raster cell i at the surface.
The existing water systems in the basin are used as the source of water network optimization to construct new water body connectivity paths. The connection of independent water bodies in the basin will improve the hydrological connectivity of the basin, enhance the circulation of the basin water system, and increase the number of water resources available in the basin.
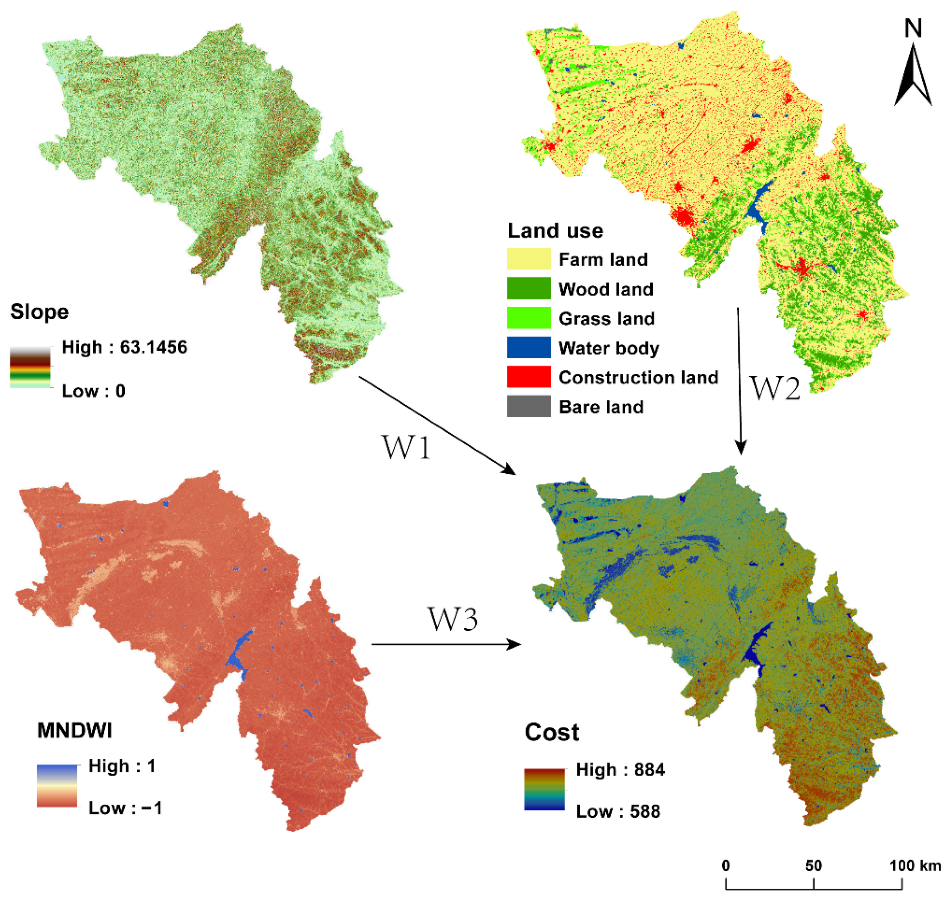
The determination of the cost of water connectivity resistance in a basin comprises three component factors: topography, hydrology, and human activities. The topography and hydrology were classified into nine levels using the natural interruption point method with resistance weights of 1 to 9. Human activities were expressed using land use types, which are classified into six categories: arable land, forest land, grassland, water bodies, bare land and construction land, according to the level 1 classification. The resistance weights of each land type were determined according to the expert scoring method to determine the grading score based on the land type. The resistance surface of each factor was weighted and calculated, wherein the weight of each factor was obtained by combining the Analytic Hierarchy Process (AHP) and expert scoring methods. The specific weights are listed in
Table 1. Finally, the weighted resistance surface of basin water connectivity was obtained.
The individually existing water bodies in the basin were used as the optimization connectivity targets of the hydrological network, and the independent water bodies in the whole basin were screened. Water bodies with water surface areas of >10,000 m
2 were selected and graded into targets based on the functional importance of water ecology. Finally, five levels of optimization targets were obtained. The grading of basin optimization targets is listed in
Table 2.
Using the existing water system in the basin as the source, its grid cell was defined as 1, that is, the minimum resistance to flow through the source and the resistance to flow through other grids in the basin was associated with the distance between the grid and the source and the cost of resistance of the grid itself. Finally, the path with the least obstruction between the source and the target was obtained. The optimization result was obtained by superimposing the existing water network (water system) with the connection path of the optimized target.
Owing to the optimization priority, the cumulative distance spent at each level of the optimization was obtained by considering the results of the previous level of the optimization as the source location. For example, the source place of the second level of optimization calculation is the optimal connectivity path of the existing water system in the basin superimposed on the first level of optimization objectives.
2.5. Spatial Autocorrelation of Hydrological Connectivity Barriers
Spatial autocorrelation is a spatial data analysis method that determines whether and to what extent a location in space is correlated with its neighbors. One of the most important metrics for calculating correlation is the Moran index [
38], which includes both global and local Moran indices. The global Moran index can characterize clustering at large scales, while the local Moran index can distinguish hot and cold spots in a study area at small scales [
39].
where x
i is the hydrological resistance value; ω
ij is the spatial weight value; n equals the total number of elements; and s
2 is the aggregation of all spatial weights. Global Moran index values are distributed in [−1, 1], with [0, 1] indicating a positive correlation between geographical entities, [−1, 0] indicating a negative relationship, and 0 indicating no relationship. The higher the absolute value, the higher the degree of spatial autocorrelation.
where n is the total number of all regions, and I represented the local Moran index of the i region. The range of values of the local Moran index is not limited to [−1, 1]. A high absolute value of the local Moran index indicates that area units with similar values to the variable are clustered in space, and a low absolute value indicates that area units with dissimilar variables are clustered in space.
In this study, the global Moran index is used to respond to the spatial correlation of hydrological flow obstruction in the basin and to clarify the correlation between the raster cell and its surrounding cell resistance values [
40]. Displayed by Moran scatter plots, spatial clustering of hydrological flow impediments using local Moran indices to clarify the spatial aggregation of basin connectivity resistance as well as outliers. The spatial clustering of similar and dissimilar samples was assessed local indicators of spatial association (LISA) aggregation plots, reflecting four types of aggregation: high–high; low–low; high–low; and low–high. In this study, the global and local Moran indices of hydrological circulation resistance in the Dongliao River basin were calculated using GeoDa1.16 software, and the spatial correlation of hydrological circulation resistance in the basin and the clustering relationship were determined.
2.6. Barycenter Migration Model
The center-of-gravity migration model is the most useful single quantity for describing the spatial distribution of geographic objects and can reflect dynamic changes in spatial distribution [
41]. A flat spatial center of gravity for hydrological connectivity resistance was obtained using the mean center tool in ArcGIS10.6. The flat center of gravity can visualize the spatial and temporal trends of changes in regional geographical objects.
In this study, we attempted to calculate the center of gravity of the resistance surface at each level (t) for different optimization levels of hydrological connectivity using the following equations to describe the spatial evolutionary trend of the resistance to hydrological connectivity:
where X
t and Y
t are the latitude and longitude of a certain class of centers. In the space of class t: C
ti is the area of the i-th connectivity barriers in t level; X
i and Y
i are the latitude and longitude of the i patch, respectively;
p is the total number of fragments in a certain class of space in year
t. The distance of the center of gravity shift of hydrological connectivity resistance is calculated by the following equation:
where D is the offset distance of the center of gravity from optimization level t to t′; C is the conversion of geographic coordinate units to plane distance (km) with a value equal to 111.111; X
t and Y
t denote the longitude and latitude at the sampling point at optimization level t, respectively; X
t′ and Y
t′ denote the longitude and latitude at the sampling point at optimization level t′, respectively.
3. Results and Discussion
Hydrological connectivity provides insights into how water flow develops under different environmental conditions and enables managers to determine when, where, and how to successfully intervene in the hydrological processes of the basin [
42]. Thus, this is an important tool for water resource management in the basin and an important theoretical basis for ecological engineering construction. The water resources in the DRB have been developed far beyond the upper limit of development and there remains a significant risk of water overuse and an uneven distribution of water resources in time and space. The results of the hydrological connectivity assessment are combined with hydrological connectivity optimization to protect vulnerable, isolated water bodies in the basin and to enhance the water cycle and hydro-ecological processes in water bodies throughout the basin. Feasible methods were explored to optimize the hydrological connectivity of the basin, to solve existing water resource management problems in the basin, and to provide theoretical support and concrete solutions for river-lake connectivity and ecological projects, such as the construction of aqueducts in the basin.
3.1. Basin Hydrological Connectivity Evaluation
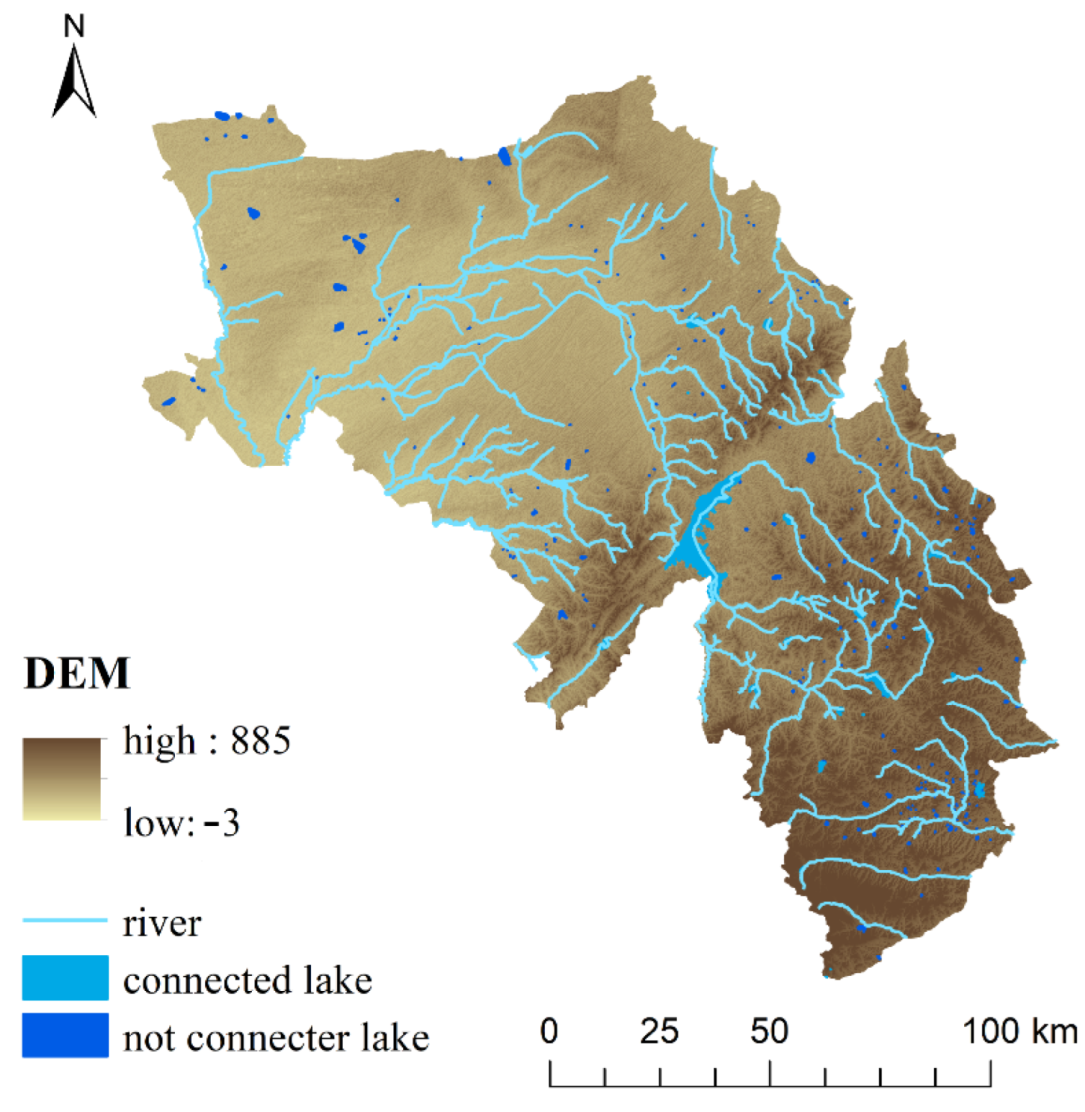
The distribution of existing water systems in the basin shows a correspondence with the distribution of basin elevation (
Figure 5). The overall flow direction is from southwest to northeast. The surface in the southeast is relatively more undulating and the water system is distributed accordingly, showing a tree-like form. The water system in the northeast plain area is more scattered, and the form of the water system gradually changes from tree-like to net-like.
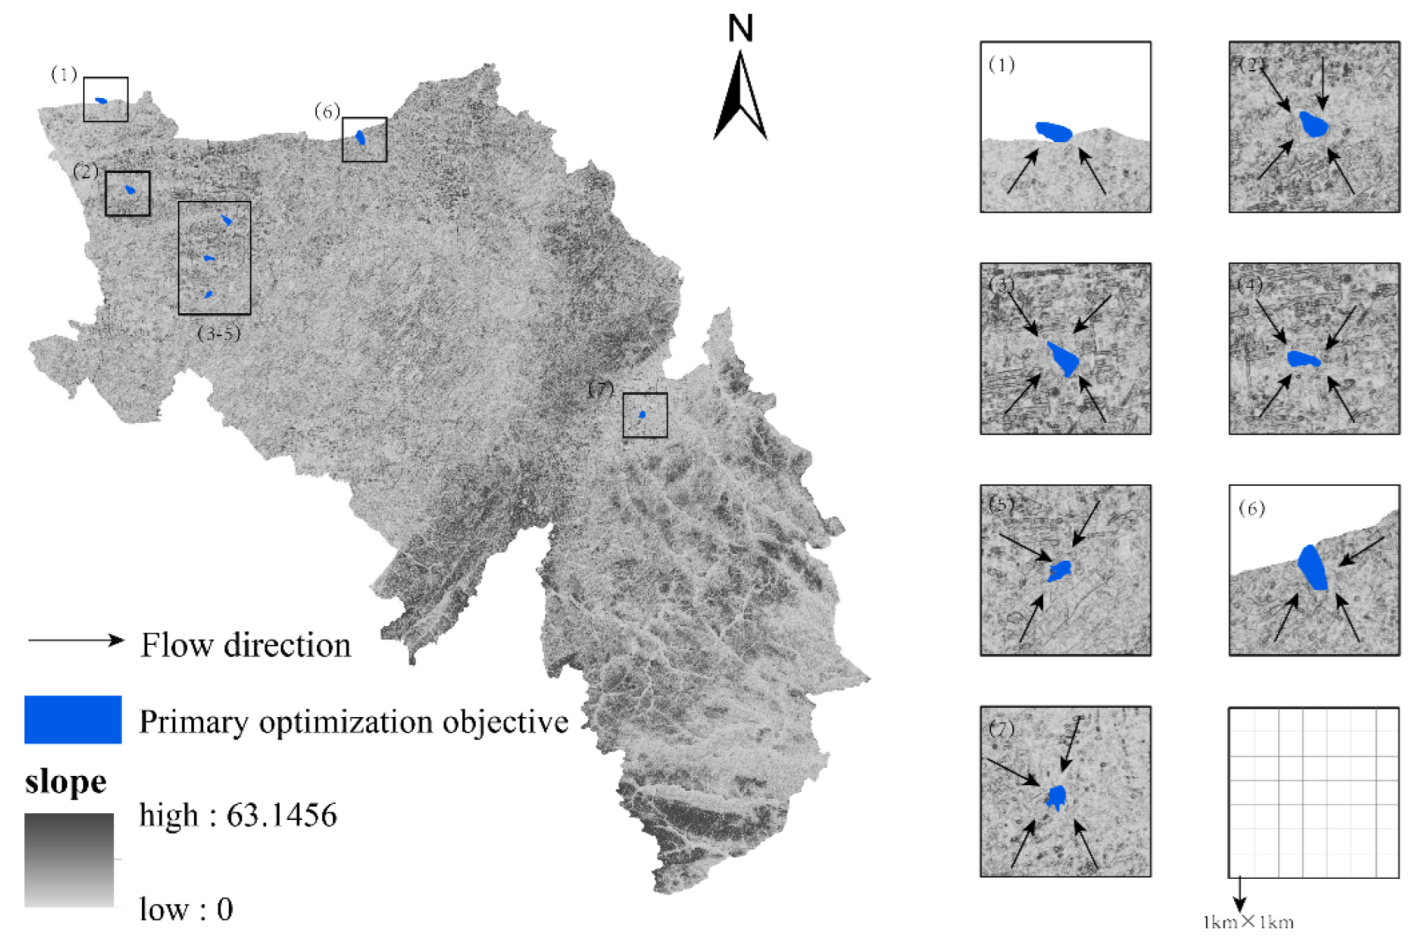
In addition to some large surface water bodies in the basin, such as the Erlongshan and Yangmu reservoirs, which are connected to the water system, there are also a large number of water bodies that are not connected to the water system. These water bodies have a large difference in slope from the surrounding area, forming catchment areas, which in turn evolve into independently existing water bodies (
Figure 6).
As they exist separately, they have a low participation in the hydrological cycle and energy transfer in the basin, and are more fragile. In order to protect them from degradation and disappearance, and at the same time improve the overall water ecological function of the basin, they should be integrated into the hydrological connectivity pattern of the basin.
Since the river channels in the basin remain unchanged in the short term, we chose the 2020 water system for the hydrological structural connectivity assessment study of the basin. The line element (link) of the water ecological pattern network of the DRB in this study mainly consisted of one mainstream water body (Dongliao River) and two tributary water bodies (Zhaosutai and Tiaozi rivers) in the southwest of the basin; the point element (node) mainly consisted of lakes and reservoirs and linked intersection points in the basin. The hydrological network of the DRB (
Figure 3) has 335 river chains with a total length of 2992.18 km, among which there are 46 river chains (35 main streams of the Dongliao River with a total length of 31.73 km, 8 main streams of the Zhaosutai River with a total length of 11.62 km, and 3 main streams of the Jiaozi River with a total length of 6.04 km) in the basin and 366 nodes. The hydrological connection assessment indices of the basin were calculated as β = 0.9153, γ = 0.3068, and IIC = 5.0678.
In comparison with the other plain areas, the Dongliao River basin is characterized by stable and dispersed structural connectivity at times. In the Taihu Plain of China, the β index was 1.50 and 1.27, and the γ index was 0.50 and 0.42, in the 1960s and 1980s, respectively. During this period, the capillary river network degraded, the number of nodes and links in the river network increased, and structural connectivity tended to decline [
43]. In contrast, the DRB has been suffering from scarce precipitation and water shortage for many years, and the relevant authorities have paid considerable attention to the management and protection of the rivers. Most of the natural rivers in the basin are currently protected, and thus the hydrological connectivity structure in this study has not changed much over the years without degradation and other phenomena. According to the results, the hydrological structure of the DRB is not very well connected in the plain areas and the connectivity index is relatively small.
3.2. Basin Hydrological Connectivity Optimization
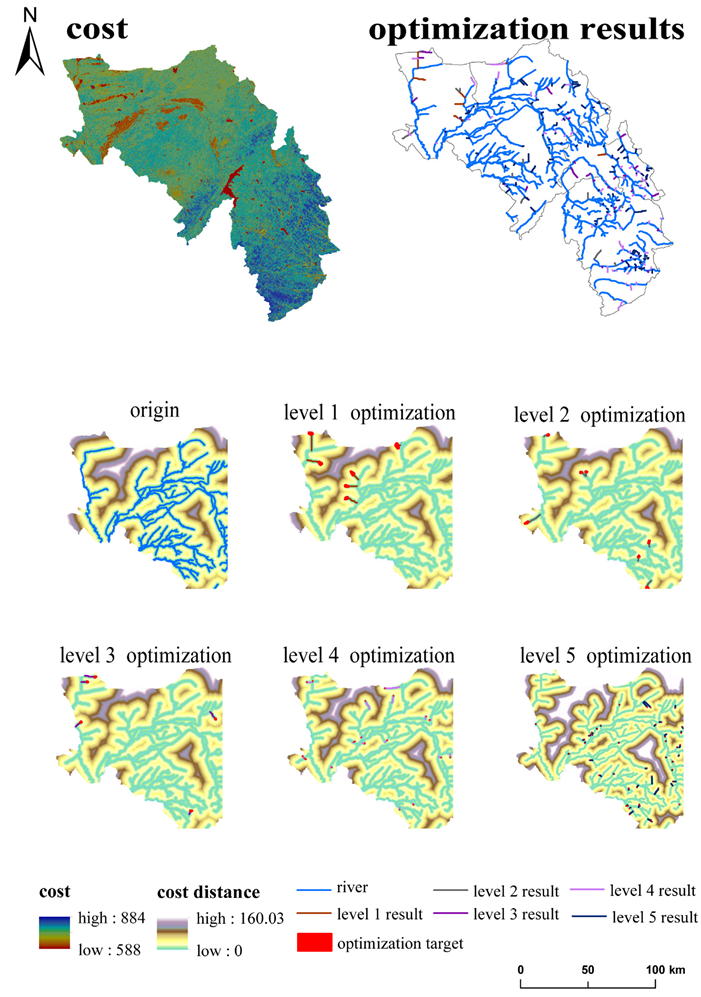
The existing water systems (including seasonal rivers) in the DRB were considered as the water ecological source sites. The water bodies that existed alone in the DRB were selected as the optimization connectivity targets and divided into five levels according to their ecological function importance to optimize the connectivity targets. The hydrological flow resistance surface was obtained based on hydrological, vegetation, and anthropogenic factors (
Figure 7), and the MCR model was used to determine the least obstructive water body connectivity path to obtain the optimized results of basin-borne hydrological connectivity.
To increase the connectivity among water bodies, water bodies that exist separately in the DRB were considered as optimization targets and new water body connectivity paths were constructed. According to the importance of the ecological function of the optimization target, graded optimization was carried out and incorporated into the water hydrological network of the basin to enhance the water cycle and water ecological processes of water bodies in the whole basin. After the 1 level optimization of the hydrological network, 14 nodes and 14 river chains were added. To avoid non-optimal or duplicate paths generated by independent calculations of the optimization process at each level, the optimization calculations at each level were based on the optimization results of the previous level; the results of each level of optimization and the distance cost used for optimization are shown in
Figure 8. As the optimization level increases, the overall hydrological connectivity resistance in the basin decreases.
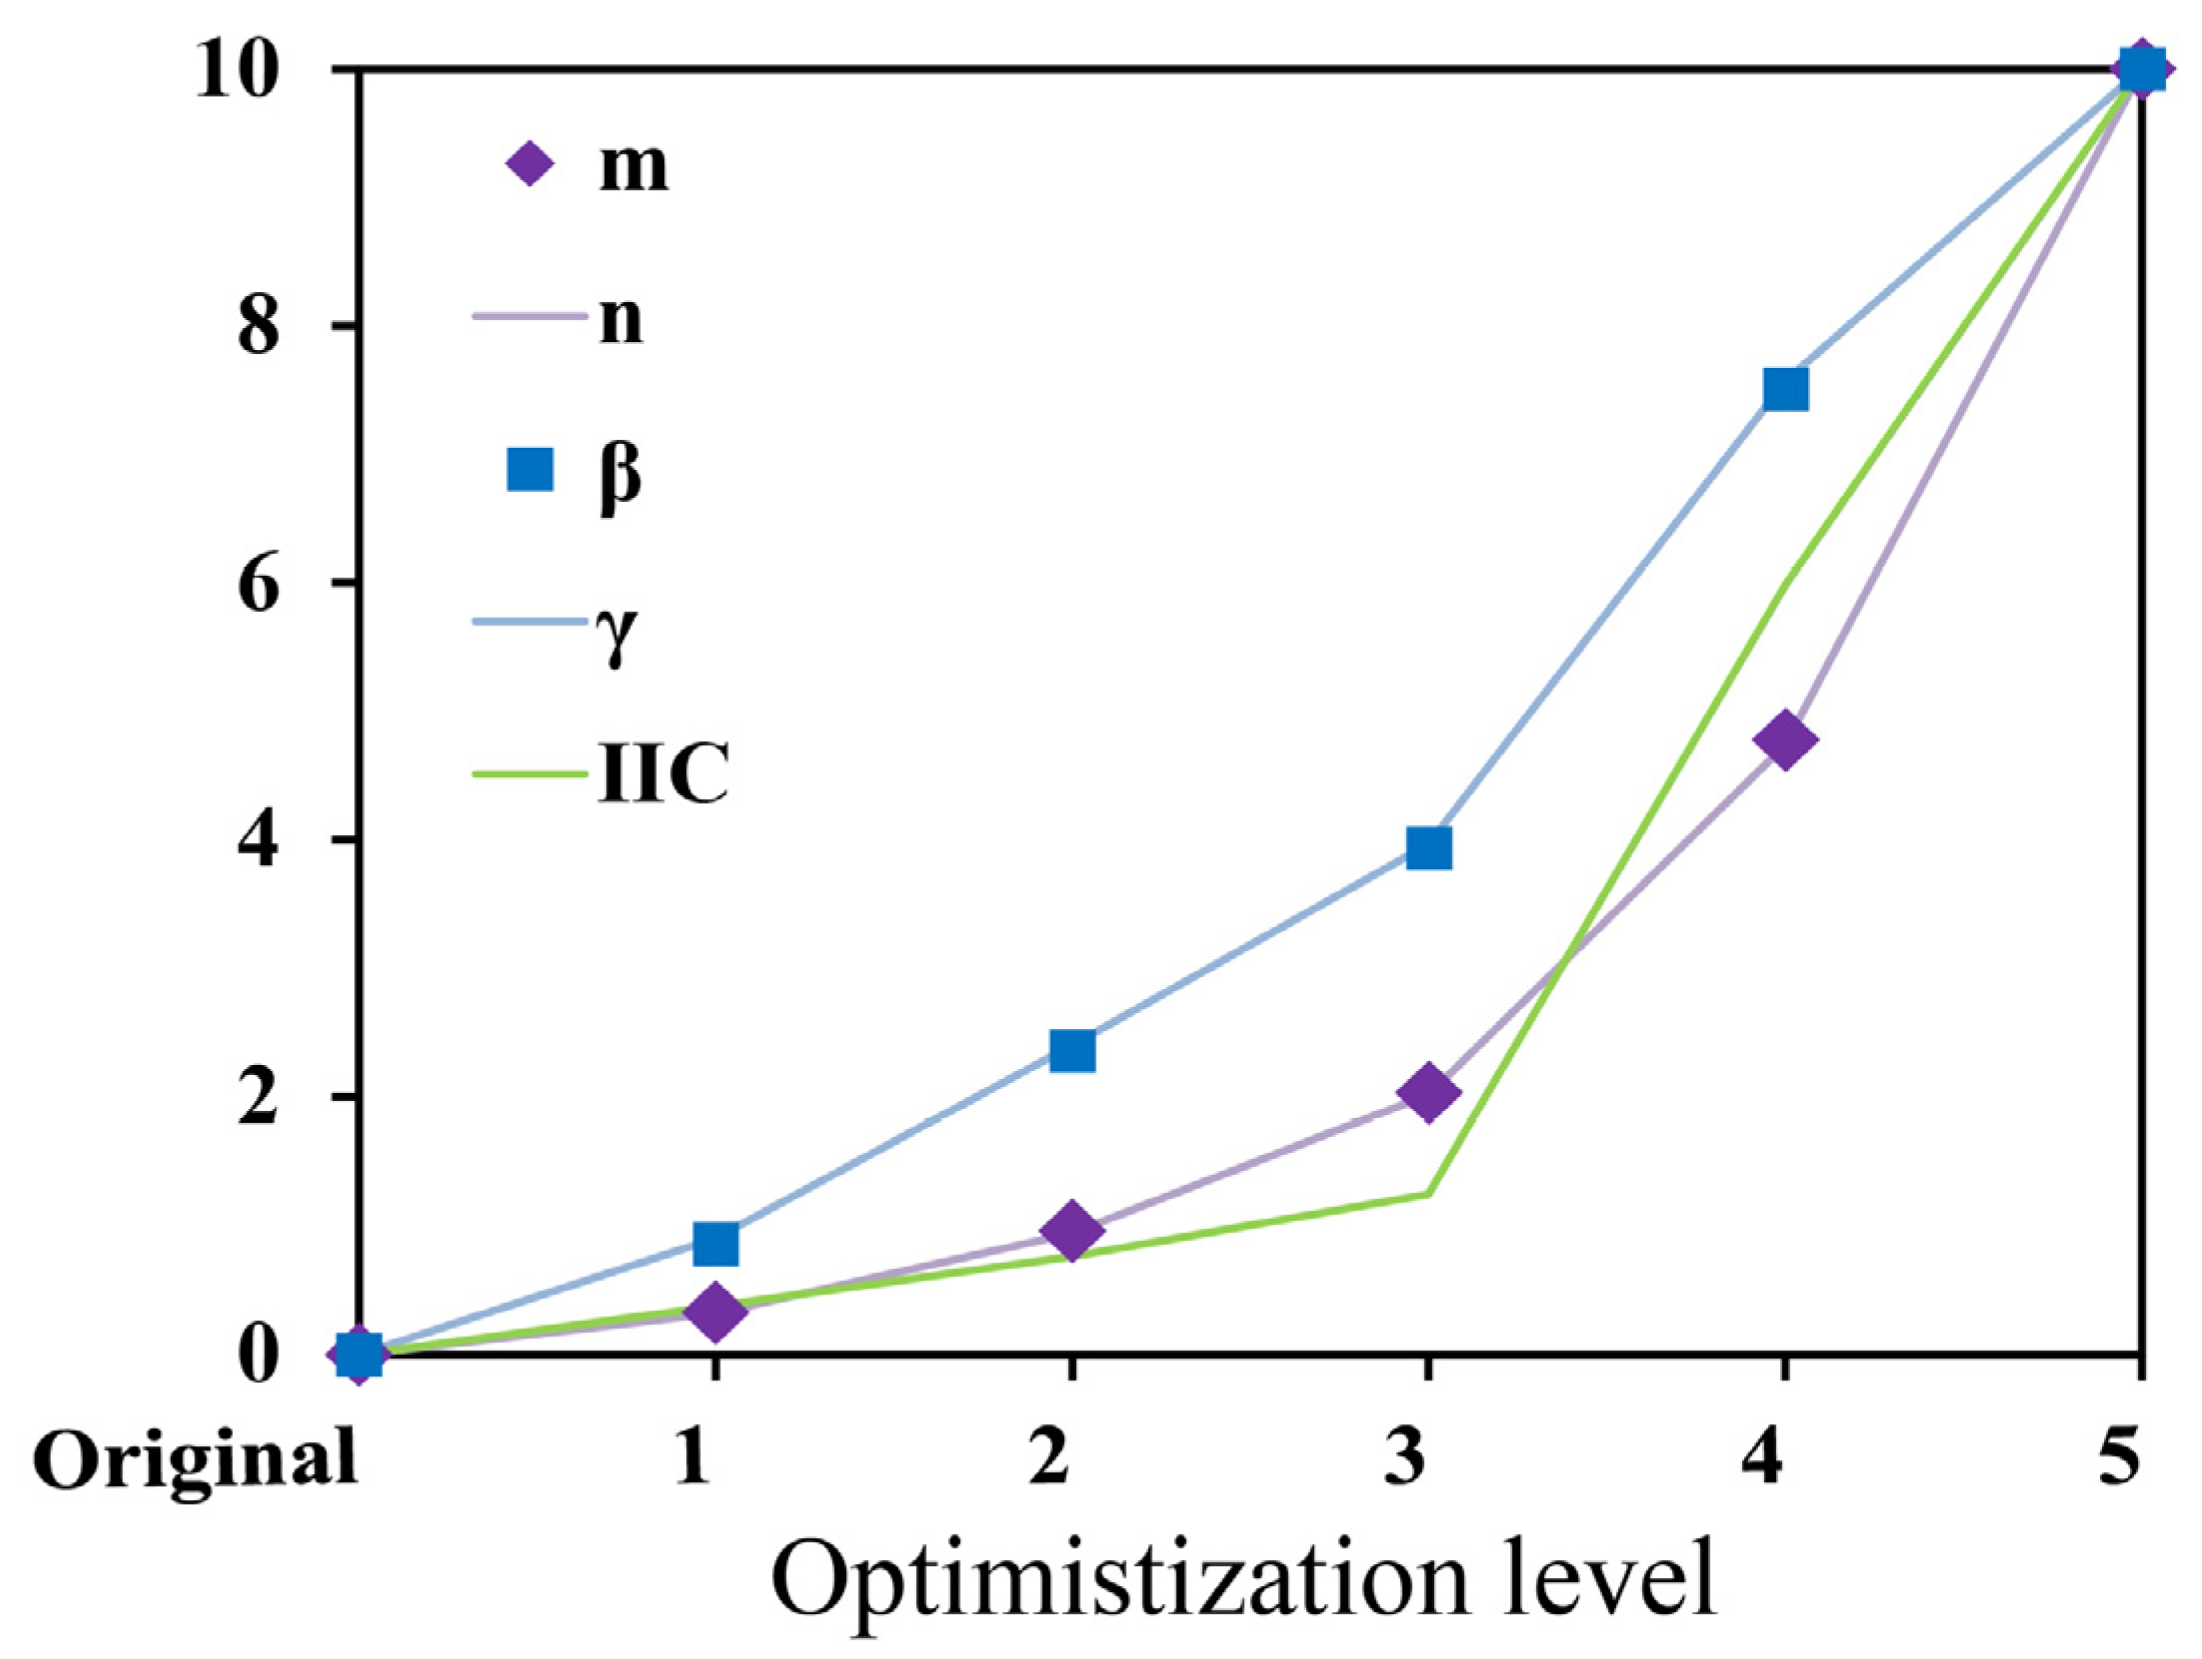
The hydrological network evaluation indices and the number and changes of the increased elements for each level of optimization results are shown in
Figure 9. Each index shows an increasing trend with an increase in the optimization level. Among them, m and n and β and γ show almost identical upward trends after normalization, and the degree of increase in β and γ increases with the optimization level. The five levels of optimized nodes and links increased by a total of 224 and 230 (
Table 3), respectively, and the β index increased from 0.91 to 0.96 of the original structure, a total increase of 4.48%. The γ index increased from 0.30 to 0.32, a total increase of 4.17%, and the IIC index increased from 5.07 to 7.64, a total increase of 50.70%. The added value of the β and γ indices was comparable, and the added value of the IIC index. The β and γ indices were comparable, with the IIC index showing a relatively large increase in value.
Generally, optimizing one target will generate two new river chains (Δm, generation of optimized river chains and splitting of original river chains) and two new nodes (Δn). If nodes already exist at the intersection of the optimized river chain and the original network, the number of added elements will be reduced accordingly. The better the connectivity of the network with the addition of the optimized river chain, the smaller the number of added elements [
44,
45]. Overall, the results of this study are the same as those of other studies [
46] in that the complexity of both the transport path network and the associated connections increase as the level of optimization increases and as the number of nodes and links increases. In particular, the β and γ indices indicate that the internal complexity of the transport path network increases with the level of optimization. The increase in the optimization level increases the number of water connectivity paths in the basin and the complexity of the river network. The overall connectivity produces a sudden increase after four levels of optimization under the overall rising trend. In contrast, the relative number of increased elements shows an overall decreasing trend (
Table 3). Therefore, it is appropriate to optimize hydrological connectivity in the DRB basin at level 4. This differs slightly from other studies in that this study produced a surge point, which may be relevant to the study population. Most of the other studies that have increased the number of relevant node links have been for small areas such as agricultural catchments, and the studies may have different tendencies for optimization purposes [
25,
46].
3.3. Evolution of the Center of Gravity for Different Optimization Levels
In this study, the center of gravity shift equation was applied to calculate the center of gravity shift trajectories for different resistance areas under each optimized connectivity level of the DRB. The mean centers of different resistance areas experienced geographic migration (
Figure 10). In the case of different levels of connectivity optimization, the migration direction of each resistance region is mostly the same, all moving in a southerly direction. The longest migration distance was for the level 5 resistance region, which moved 0.512 km to the south, while there was almost no center-of-gravity migration for the level 1 resistance region. Notably, the migration direction was essentially the same for all resistance areas, a shift to the south. This migration reflects the hydrological resistance instability of the DRB and the necessity of hydrological connectivity optimization.
3.4. Spatial Evolutionary Features
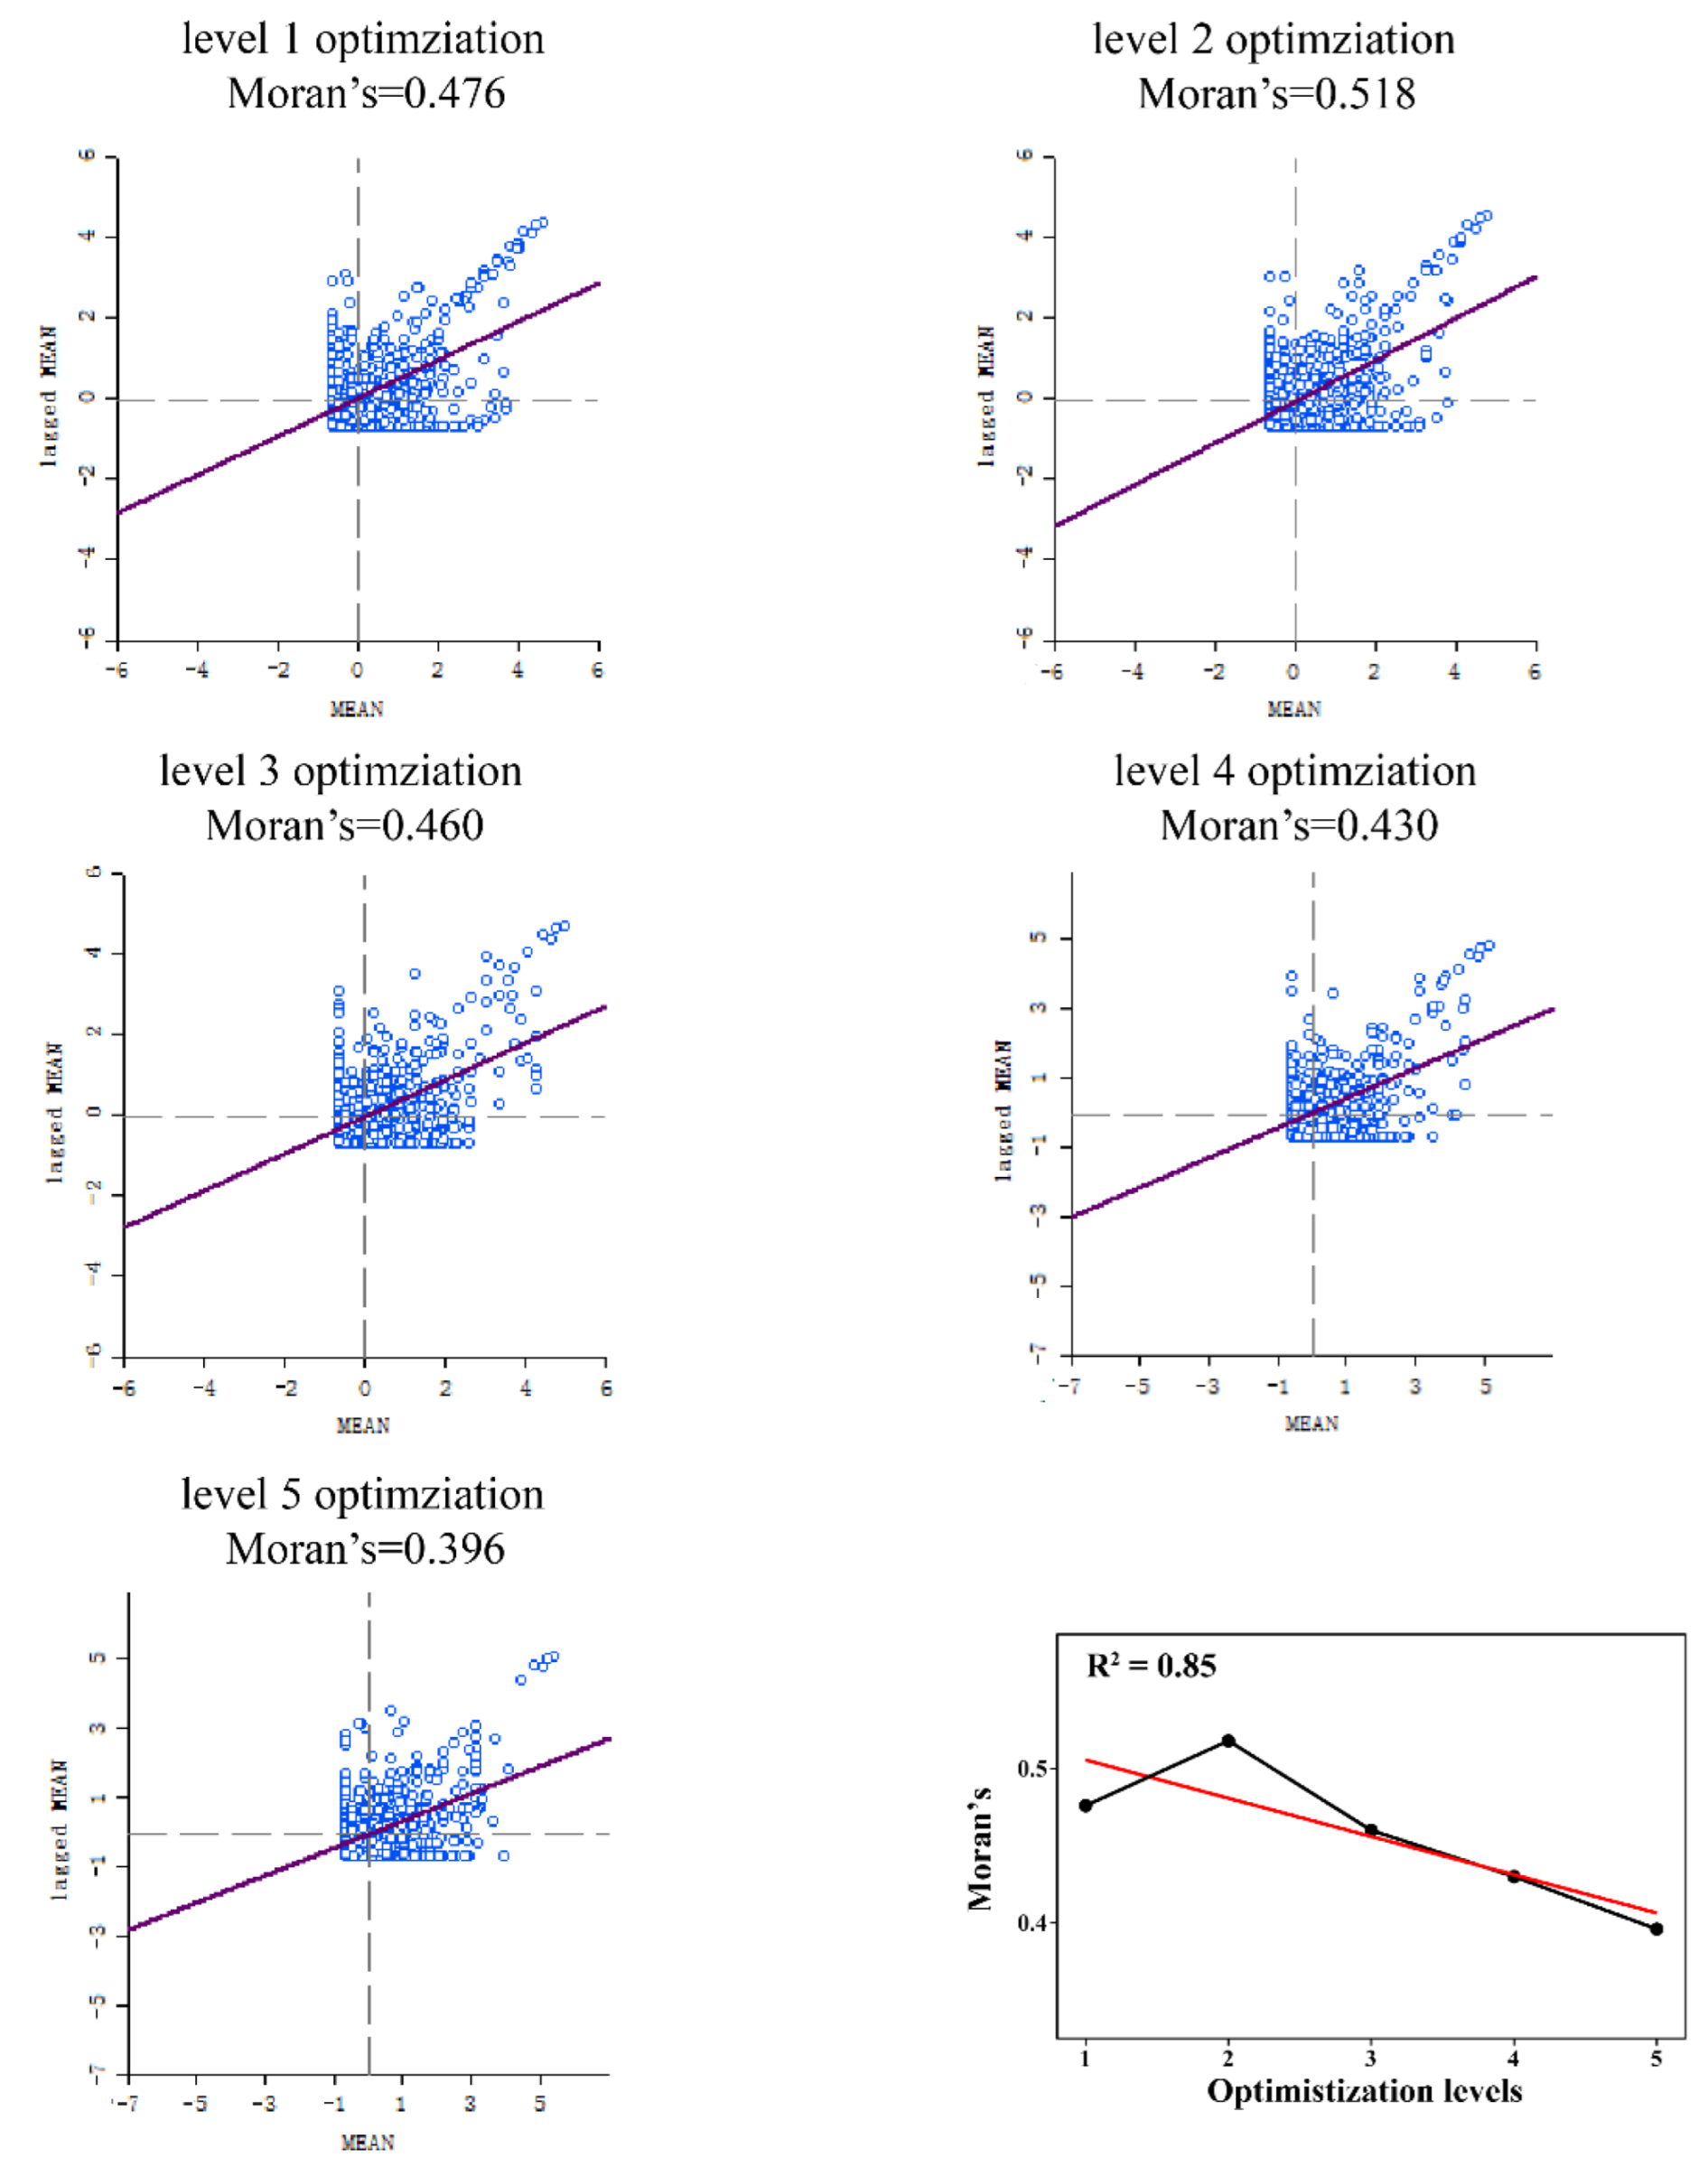
The global Moran index of hydrological connectivity resistance in the DRB was positive following optimization at all levels (
Figure 11). The regional hydrological flow obstruction was not randomly distributed; there was a certain intrinsic connection, that is, it is spatial positive correlation, but some fluctuations appeared between different levels. Furthermore, the global Moran index increased from level 1 to level 2 optimization, indicating higher spatial correlation; however, from level 2 to level 5 optimization, the global Moran index decreased gradually, indicating lower spatial correlation. Therefore, the resistance to the spatial circulation of waters in the basin decreases as the optimization level increases, where the first level of optimization is particularly necessary. This is of great significance to solve the problem of the uneven spatial distribution of water resources in the DRB.
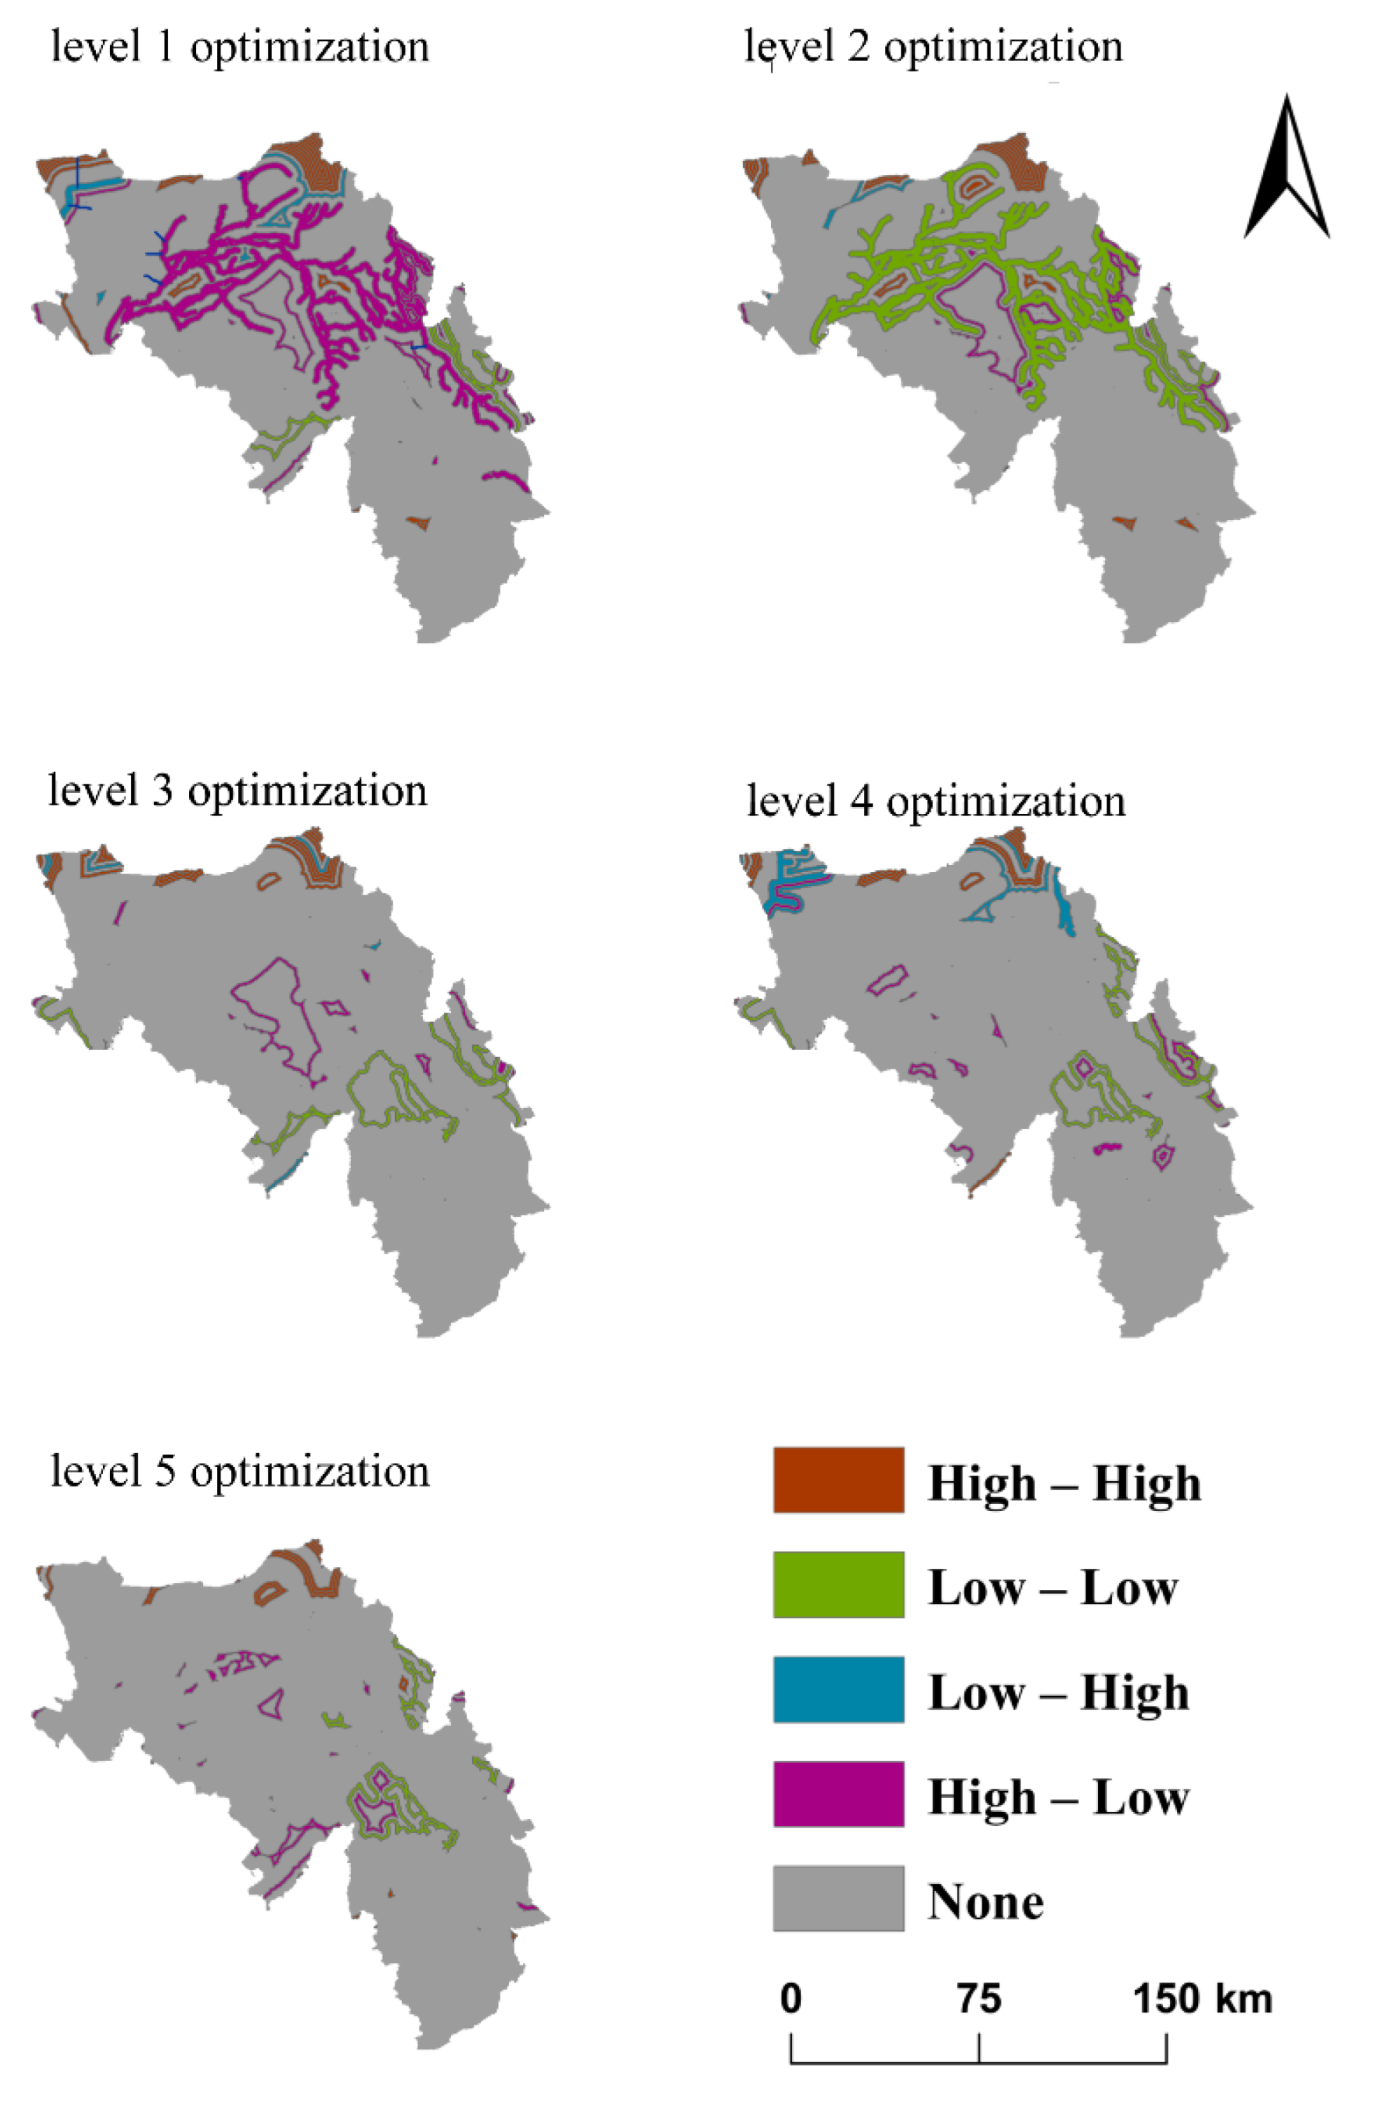
The local Moran index reveals clustering results of hydrological flow obstruction after each optimization level with significant spatial outliers (
Figure 12). According to the LISA diagram, the outlier area in the basin gradually decreased as the optimization level increased.
As the optimization level increases, the basin as a whole exhibits a shift of low–low aggregates and a decrease in high–low aggregates and low–high aggregates, switching from high–low aggregation to low–low aggregation to, finally, no clustering, around the main road of Dongliao River. This again supports the idea that as the level of optimization increases, the water flow obstruction as well as the spatial correlation of waters in the basin reduced.
3.5. Connectivity Program
From the results of the study, it is clear that an increase in spatial autocorrelation of hydrological connectivity resistance in the basin is necessary after level 1 optimization; after level 4 optimization, there is a sudden increase in connectivity, which is more cost-effective. This study provides three scenarios for optimization, Scenario 1 is economically biased and carries out level 1 optimization, Scenario 2 integrates social, economic, as well as social benefits and carries out level 4 optimization, Scenario 3 is socio-ecologically biased and carries out level 5 optimization. The specific designs are shown in
Table 4.
As can be seen from
Table 4, with the exception of Scenario 1, the construction of connectivity projects is generally Siping > Liaoyuan > Gongzhuling, with relatively few intra-urban connectivity projects in each municipal administrative district (Tiedong and Tiexi districts in Siping; Longshan and Xi’an districts in Liaoyuan).
4. Conclusions and Future Suggestions
In this study, a framework for evaluating and optimizing the connectivity of natural and artificial hydrological structures at the basin scale was developed, using the binary water cycle and graph theory as the underlying theories. A spatial analysis of the resistance to hydrological connectivity in the optimized basin was carried out. The framework was applied to arid plain areas where water resources are scarce and water bodies are scattered. The results show that the spatial distribution of hydrological connectivity resistance varies significantly with increasing levels of optimization, and show a certain trend of spatial aggregation. The increasing connectivity effect of each level tended to increase before decreasing with an increase optimization level. Therefore, when carrying out the hydrological connectivity project in the Dongliao River Basin, the first level of optimization is a must, and the fourth level of optimization is more cost-effective and a more suitable choice. It is worth noting that the framework can be extended to other similar integrated natural–artificial hydrological structures, as it can handle any identifiable artificial, natural hydraulic connectivity pathway.
It is suggested that future work can be carried out in the following aspects, firstly, the front-end data source accuracy can be improved, as the time and space scale of the water body water system data interpreted by remote sensing limited the accuracy of the whole framework. Secondly, from the perspective of combining management and theory, the relevant assessment and optimization framework can be combined with a Big Data platform to build an intelligent platform for watershed management, providing real-time data forecasts for integrated decision-making by management departments.


