The Effect of Flood Protection Works on Flood Risk
Abstract
:1. Introduction
2. Materials and Methods
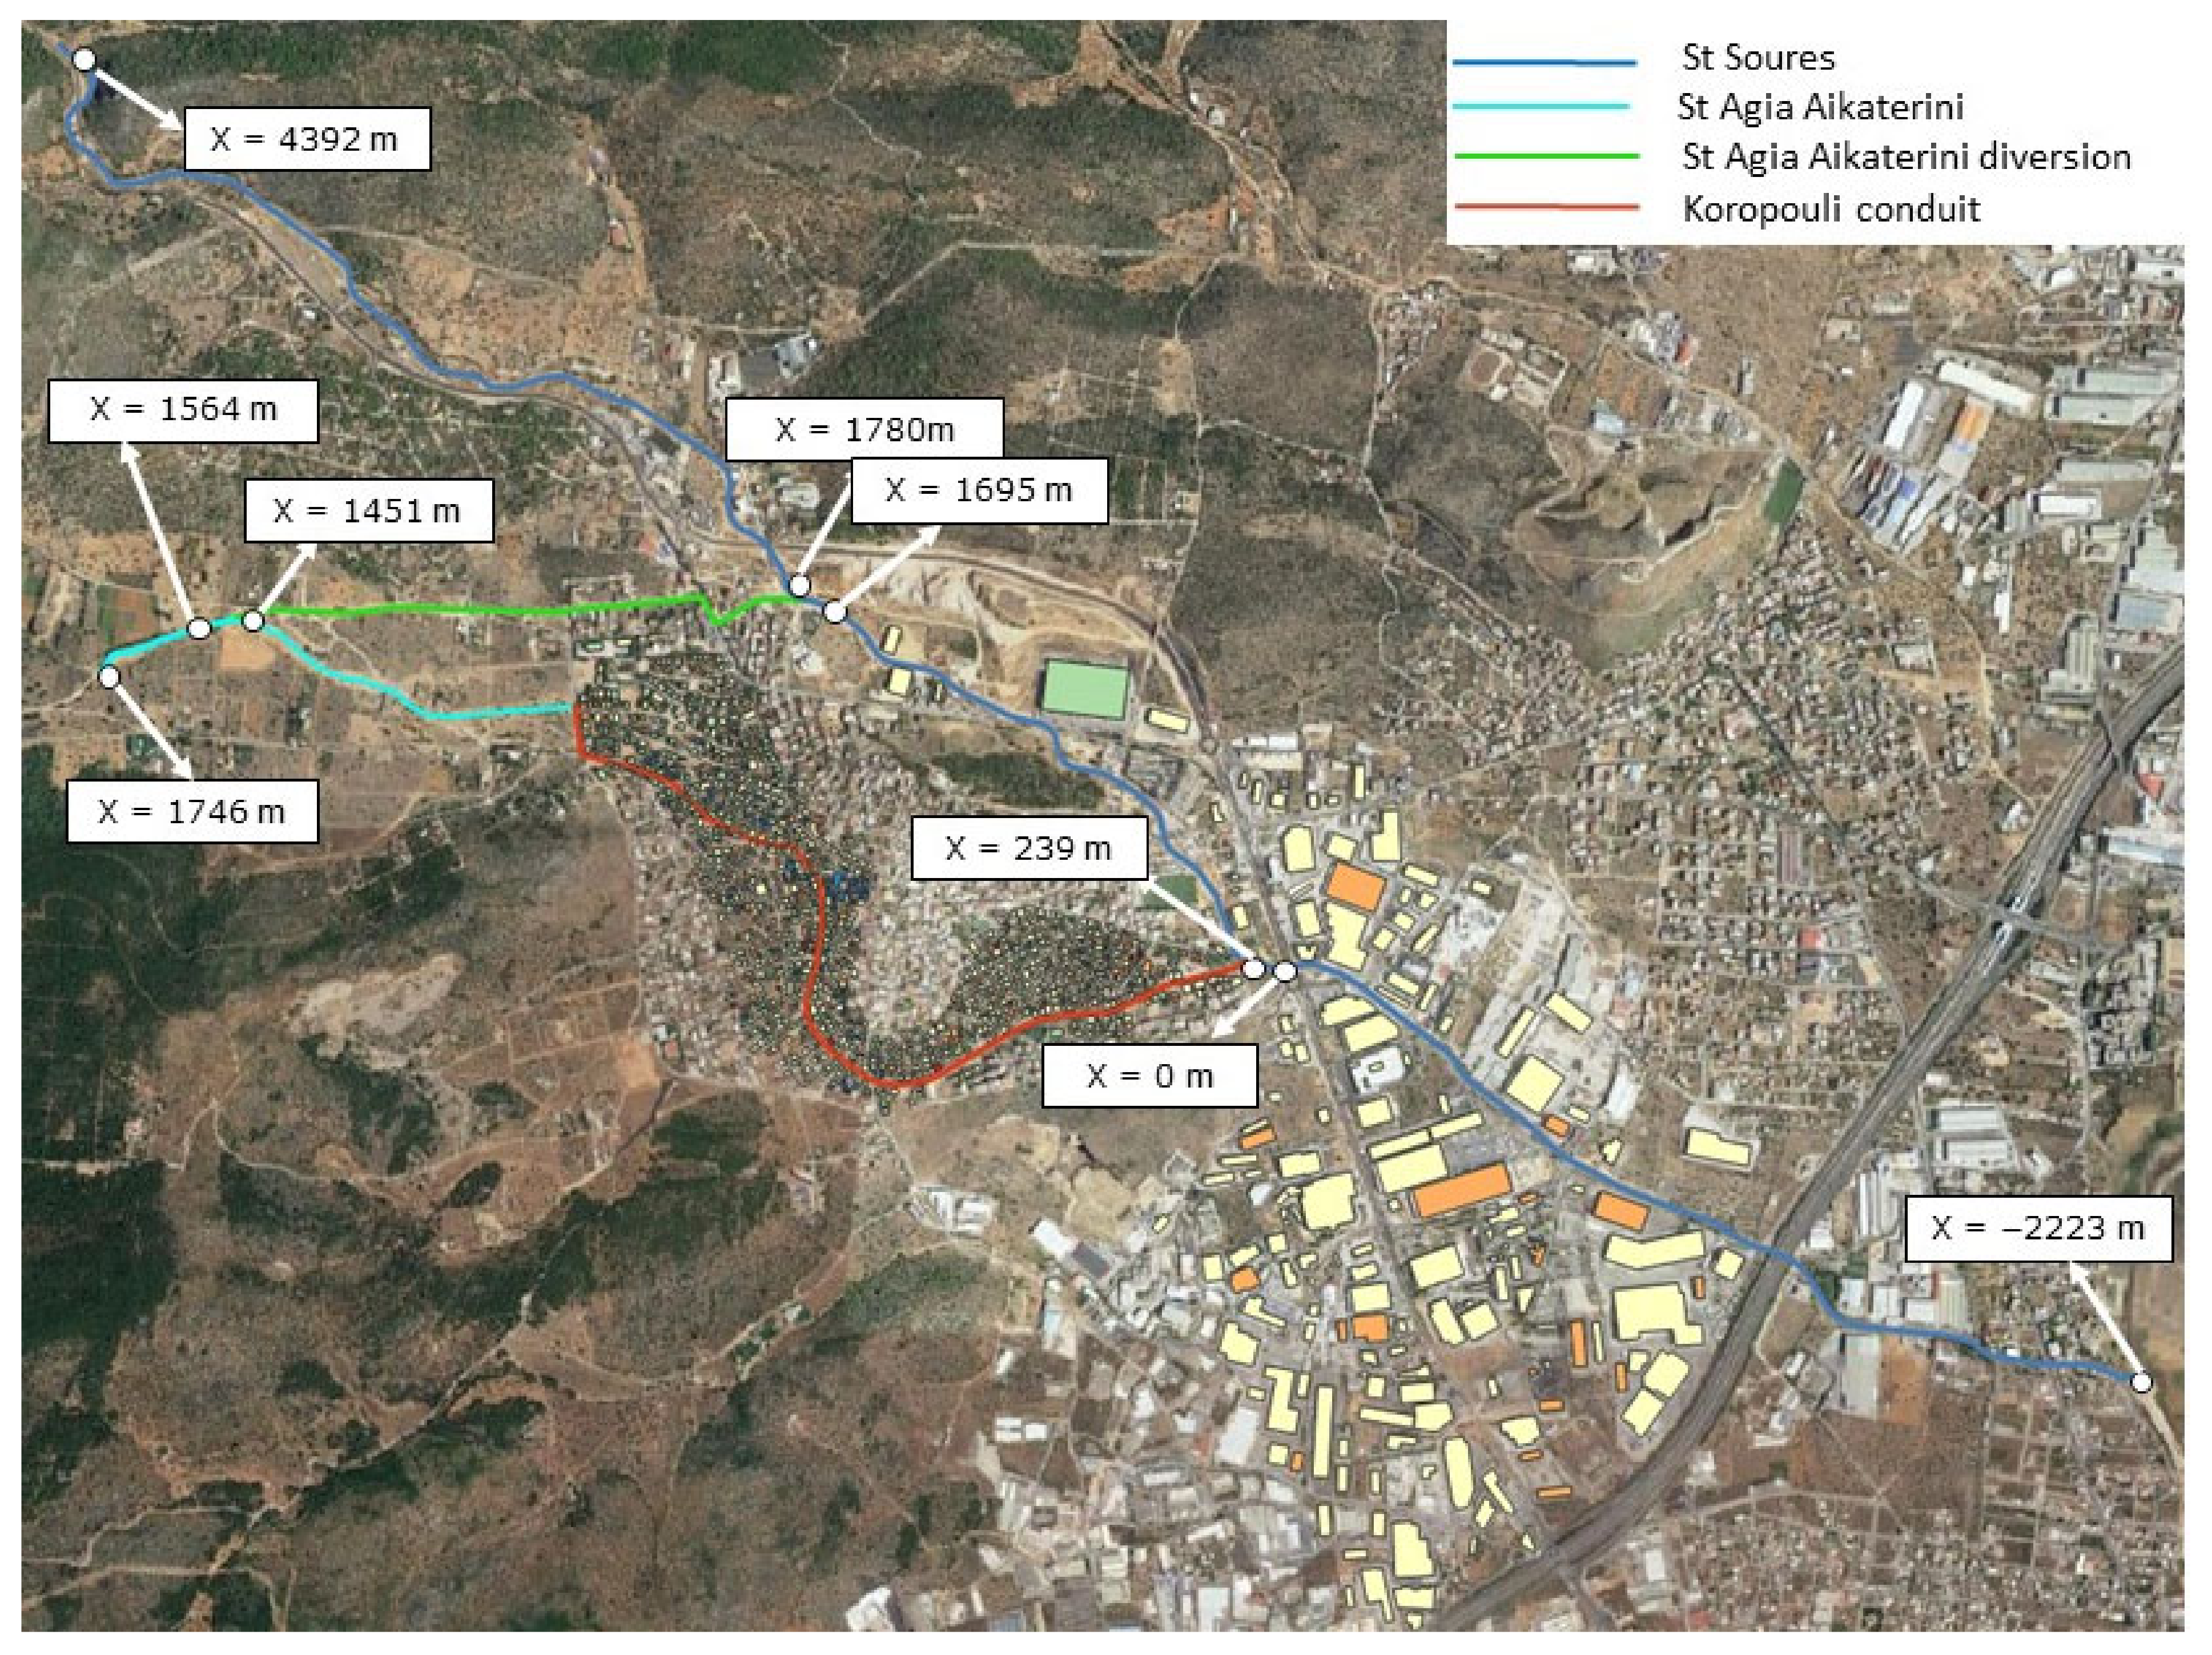
2.1. The Area of Study, the Flood of 2017, and the Main Characteristics of the Flood Protection Works
2.2. Scenarios of Calculations
2.3. Hydrological and Hydrodynamic Modeling
2.4. Flood Risk Assessment Approach
3. Results
3.1. Calculated Inundation Area
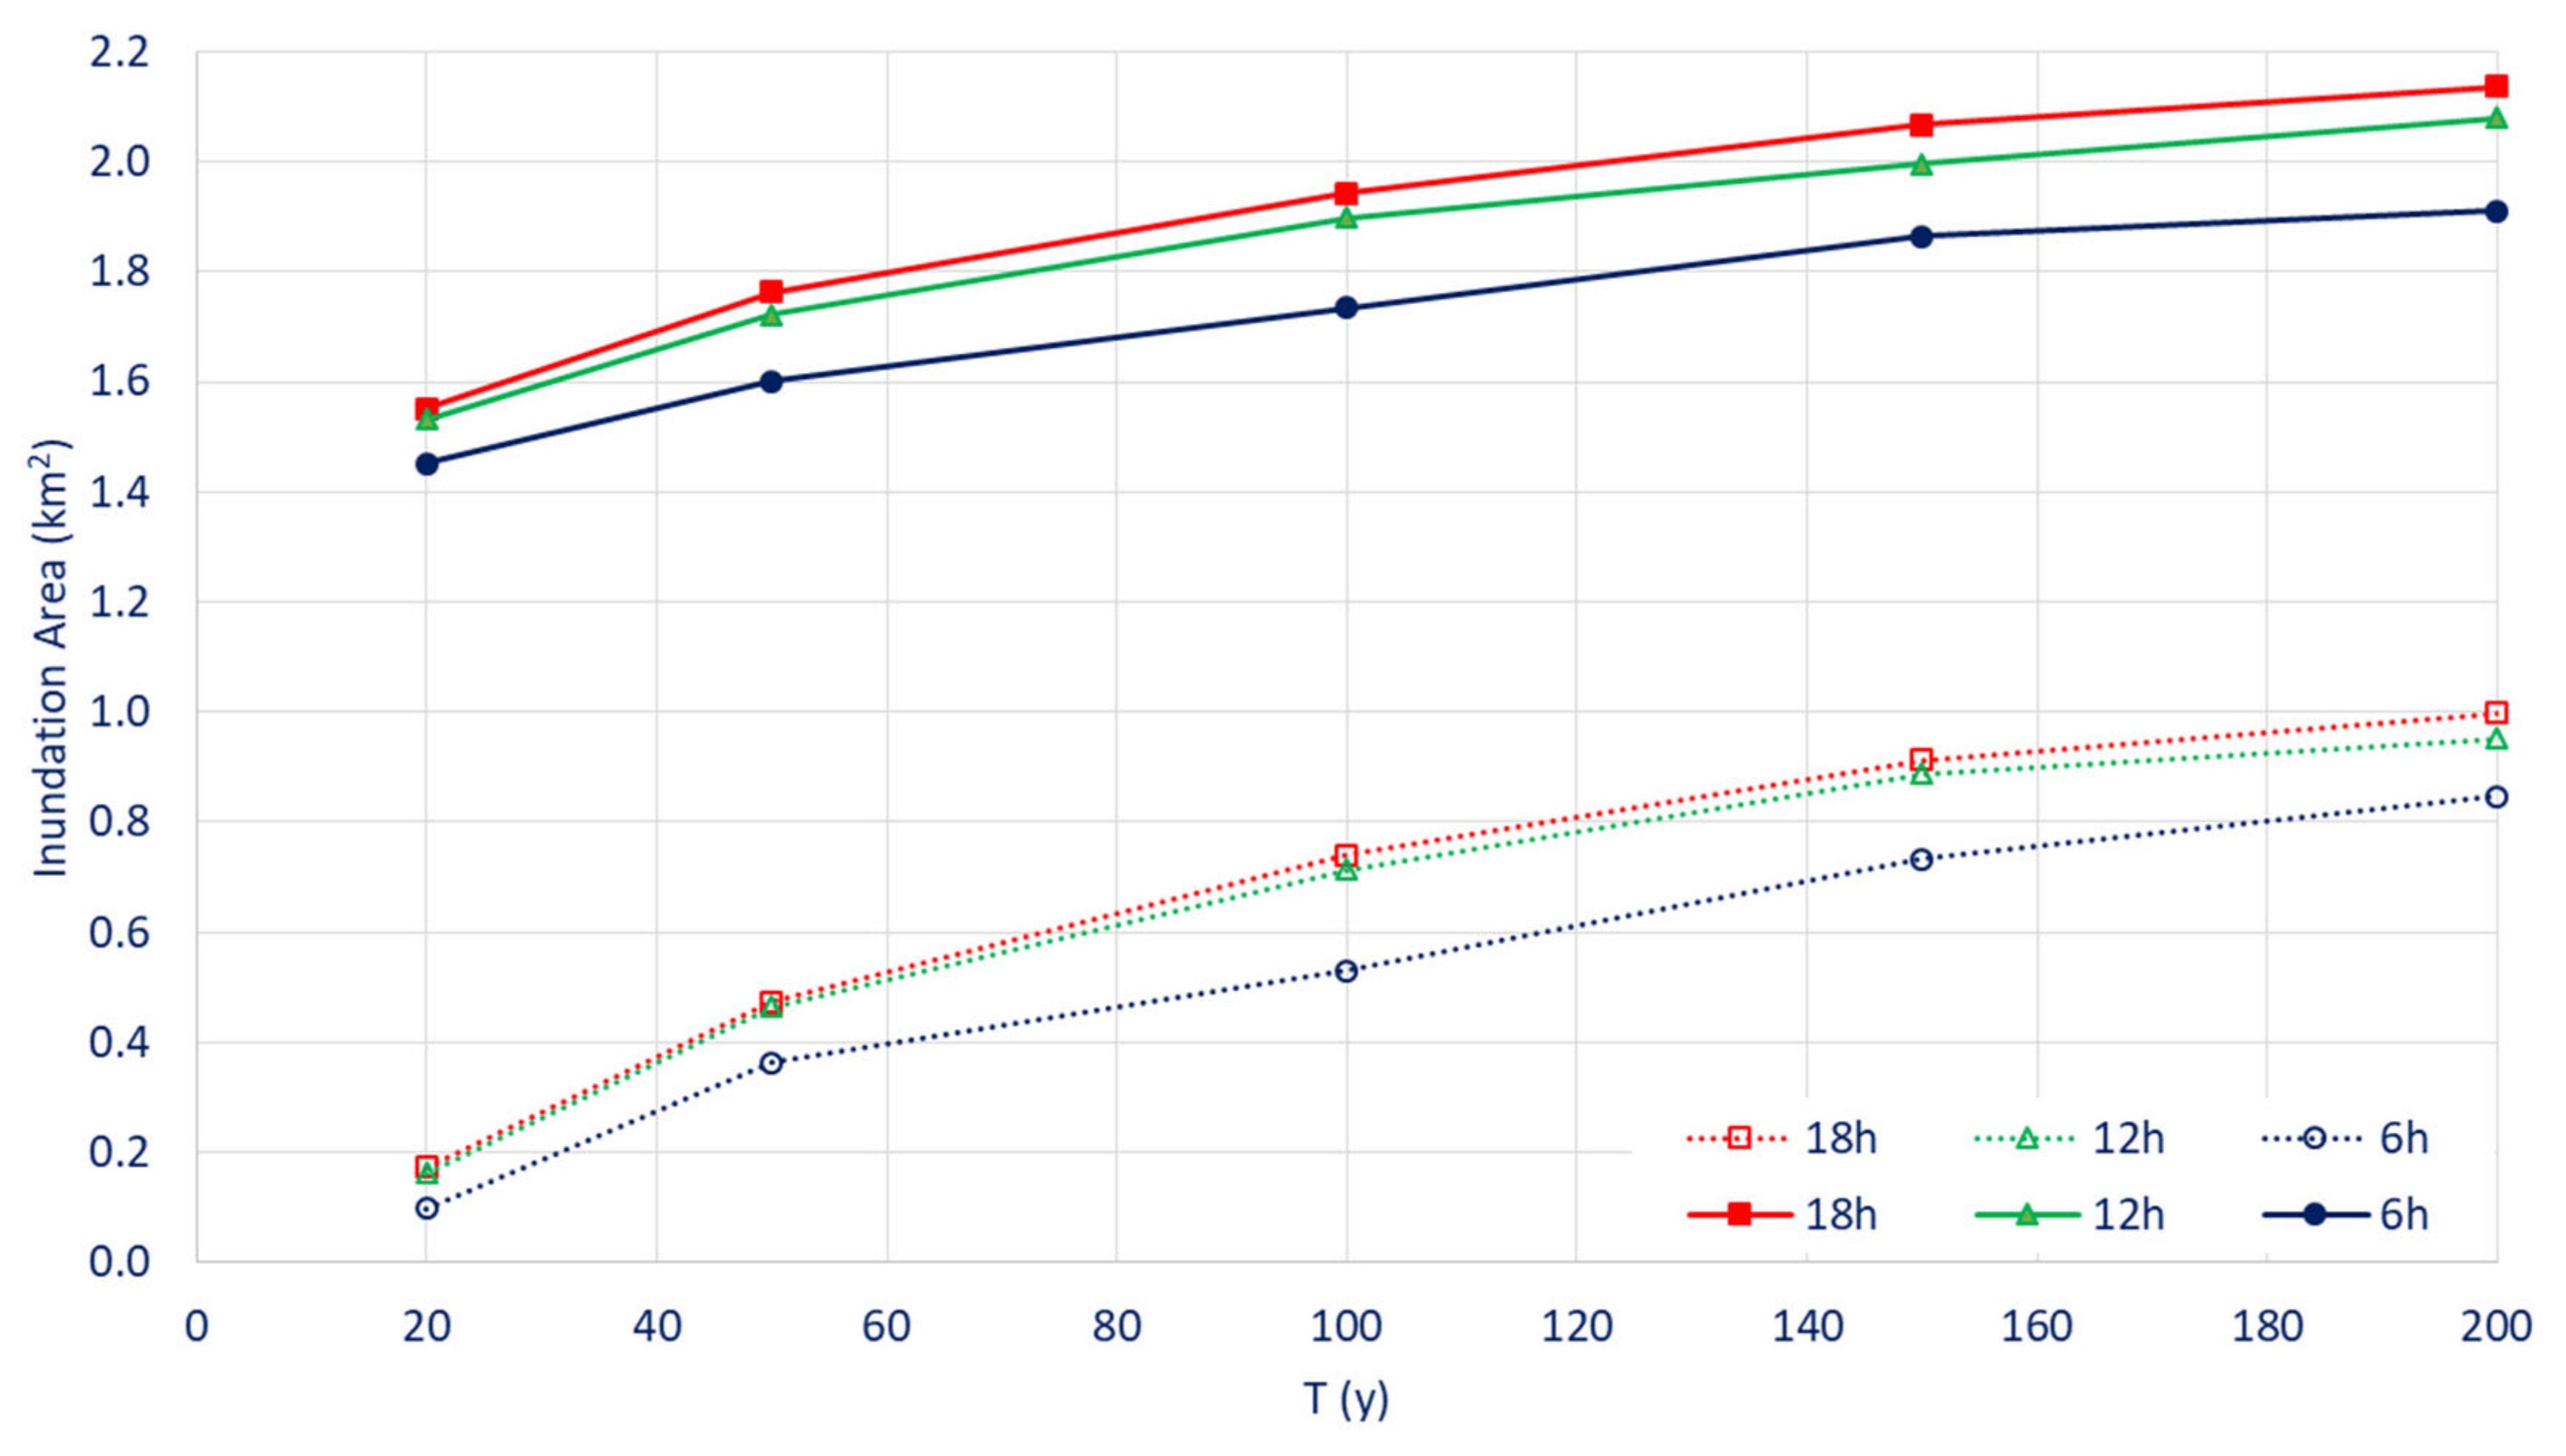
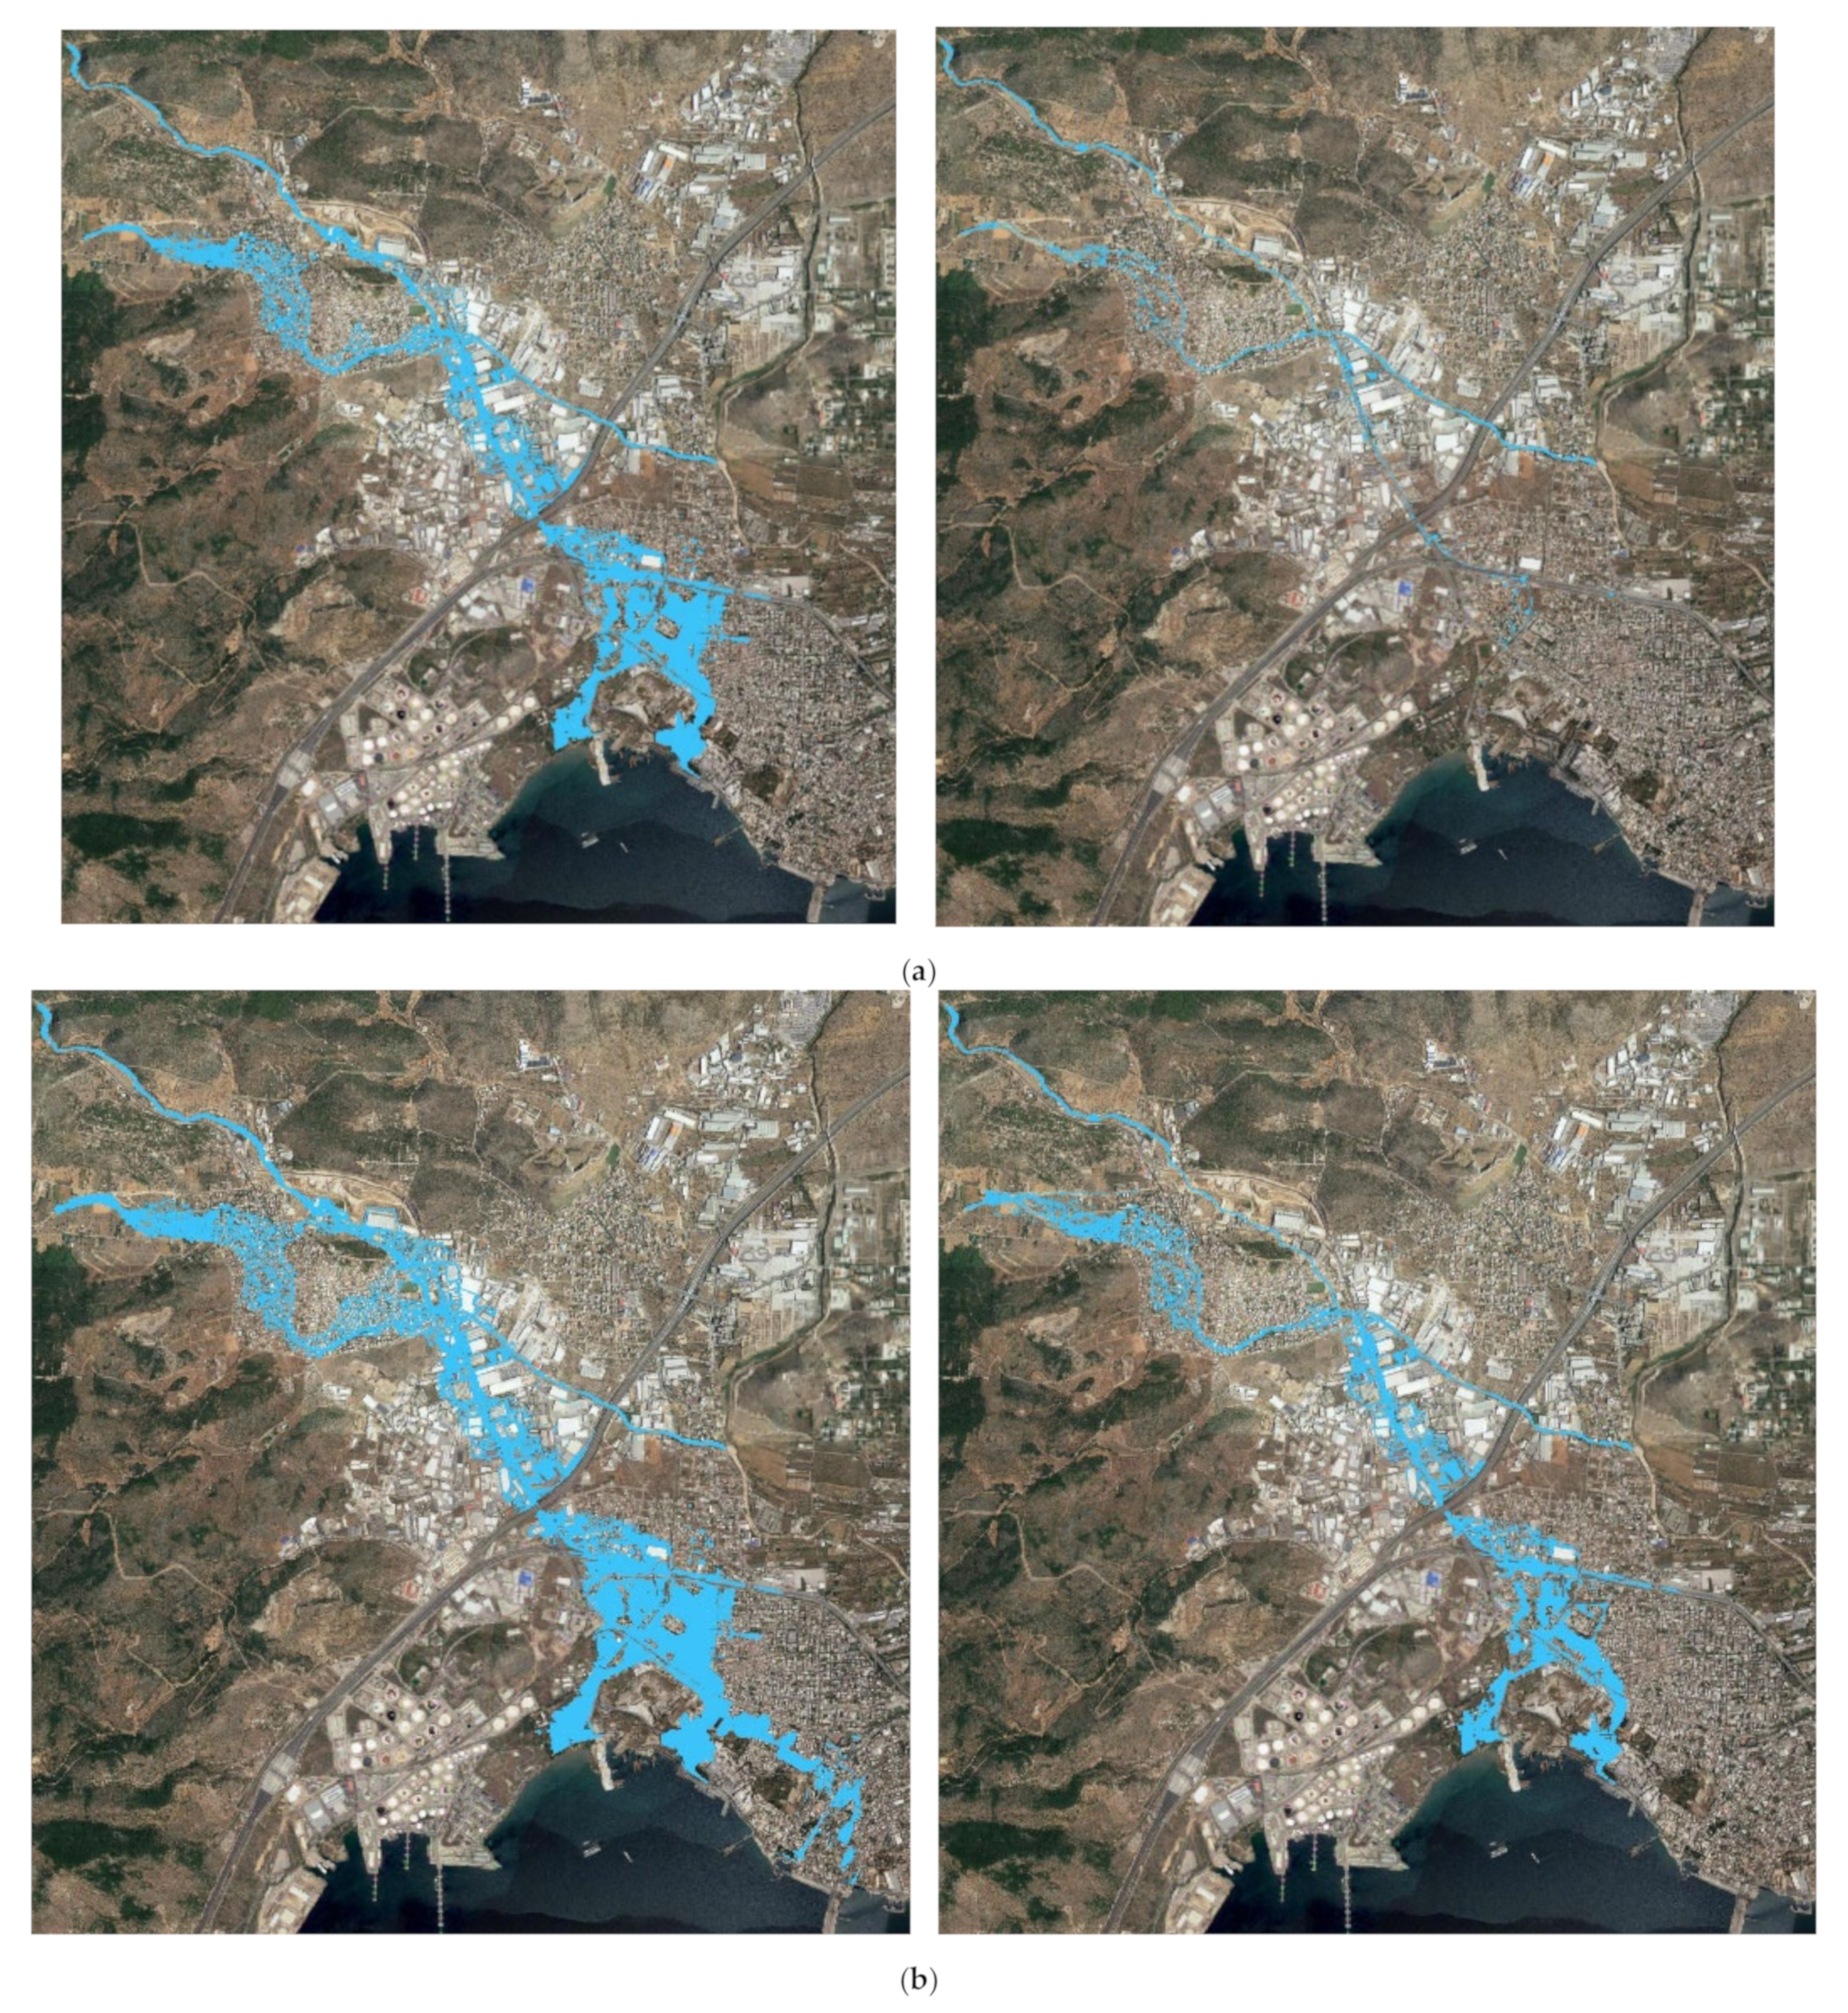
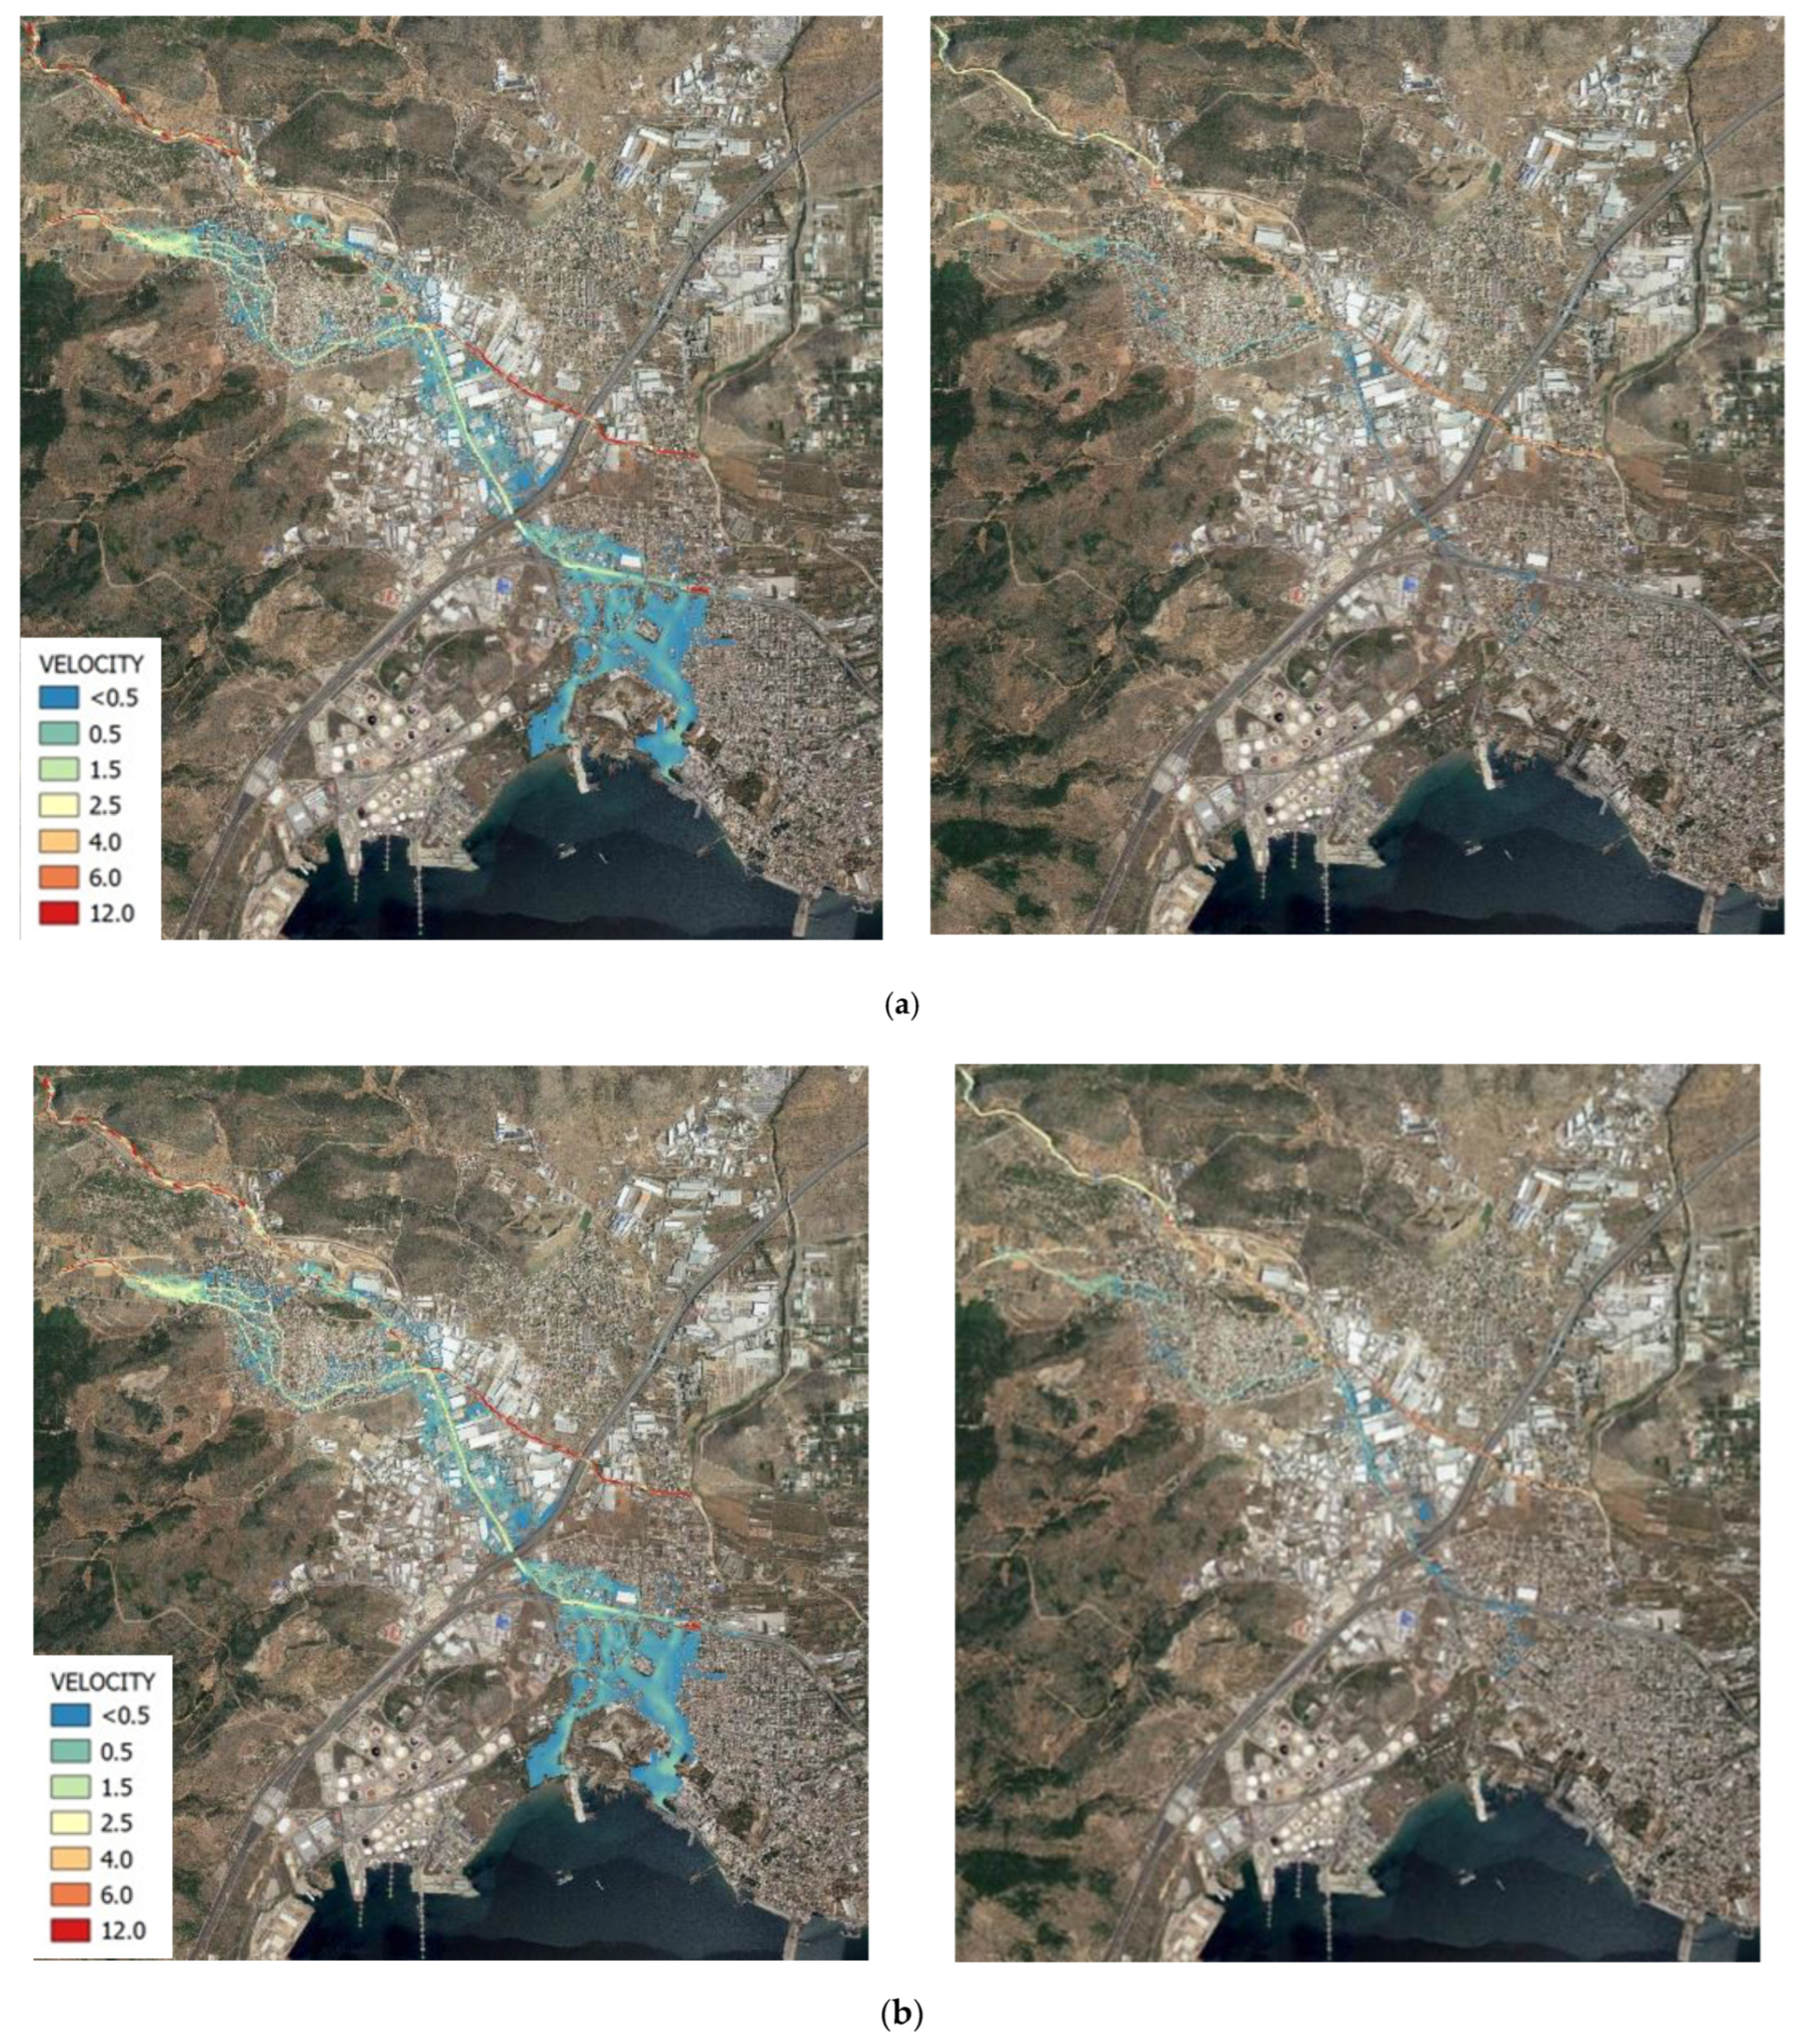
- The inundation areas range from 1.45 to 2.14 km2 without works for the extreme scenarios S20-06 and S200-18, and from 0.10 to 1.00 km2 with works for the extreme scenarios W20-06 to W200-18. The inundation area increases with increasing return period and increasing rain duration.
- The effect of the works on the inundation areas is very pronounced. The presence of the works results in a decrease in the inundation areas by 53–89%. As expected, this reduction decreases with increasing return period, while for the same return period the effect of the rain duration is more pronounced for the smaller return periods.
3.2. Flood Hazard Assessment
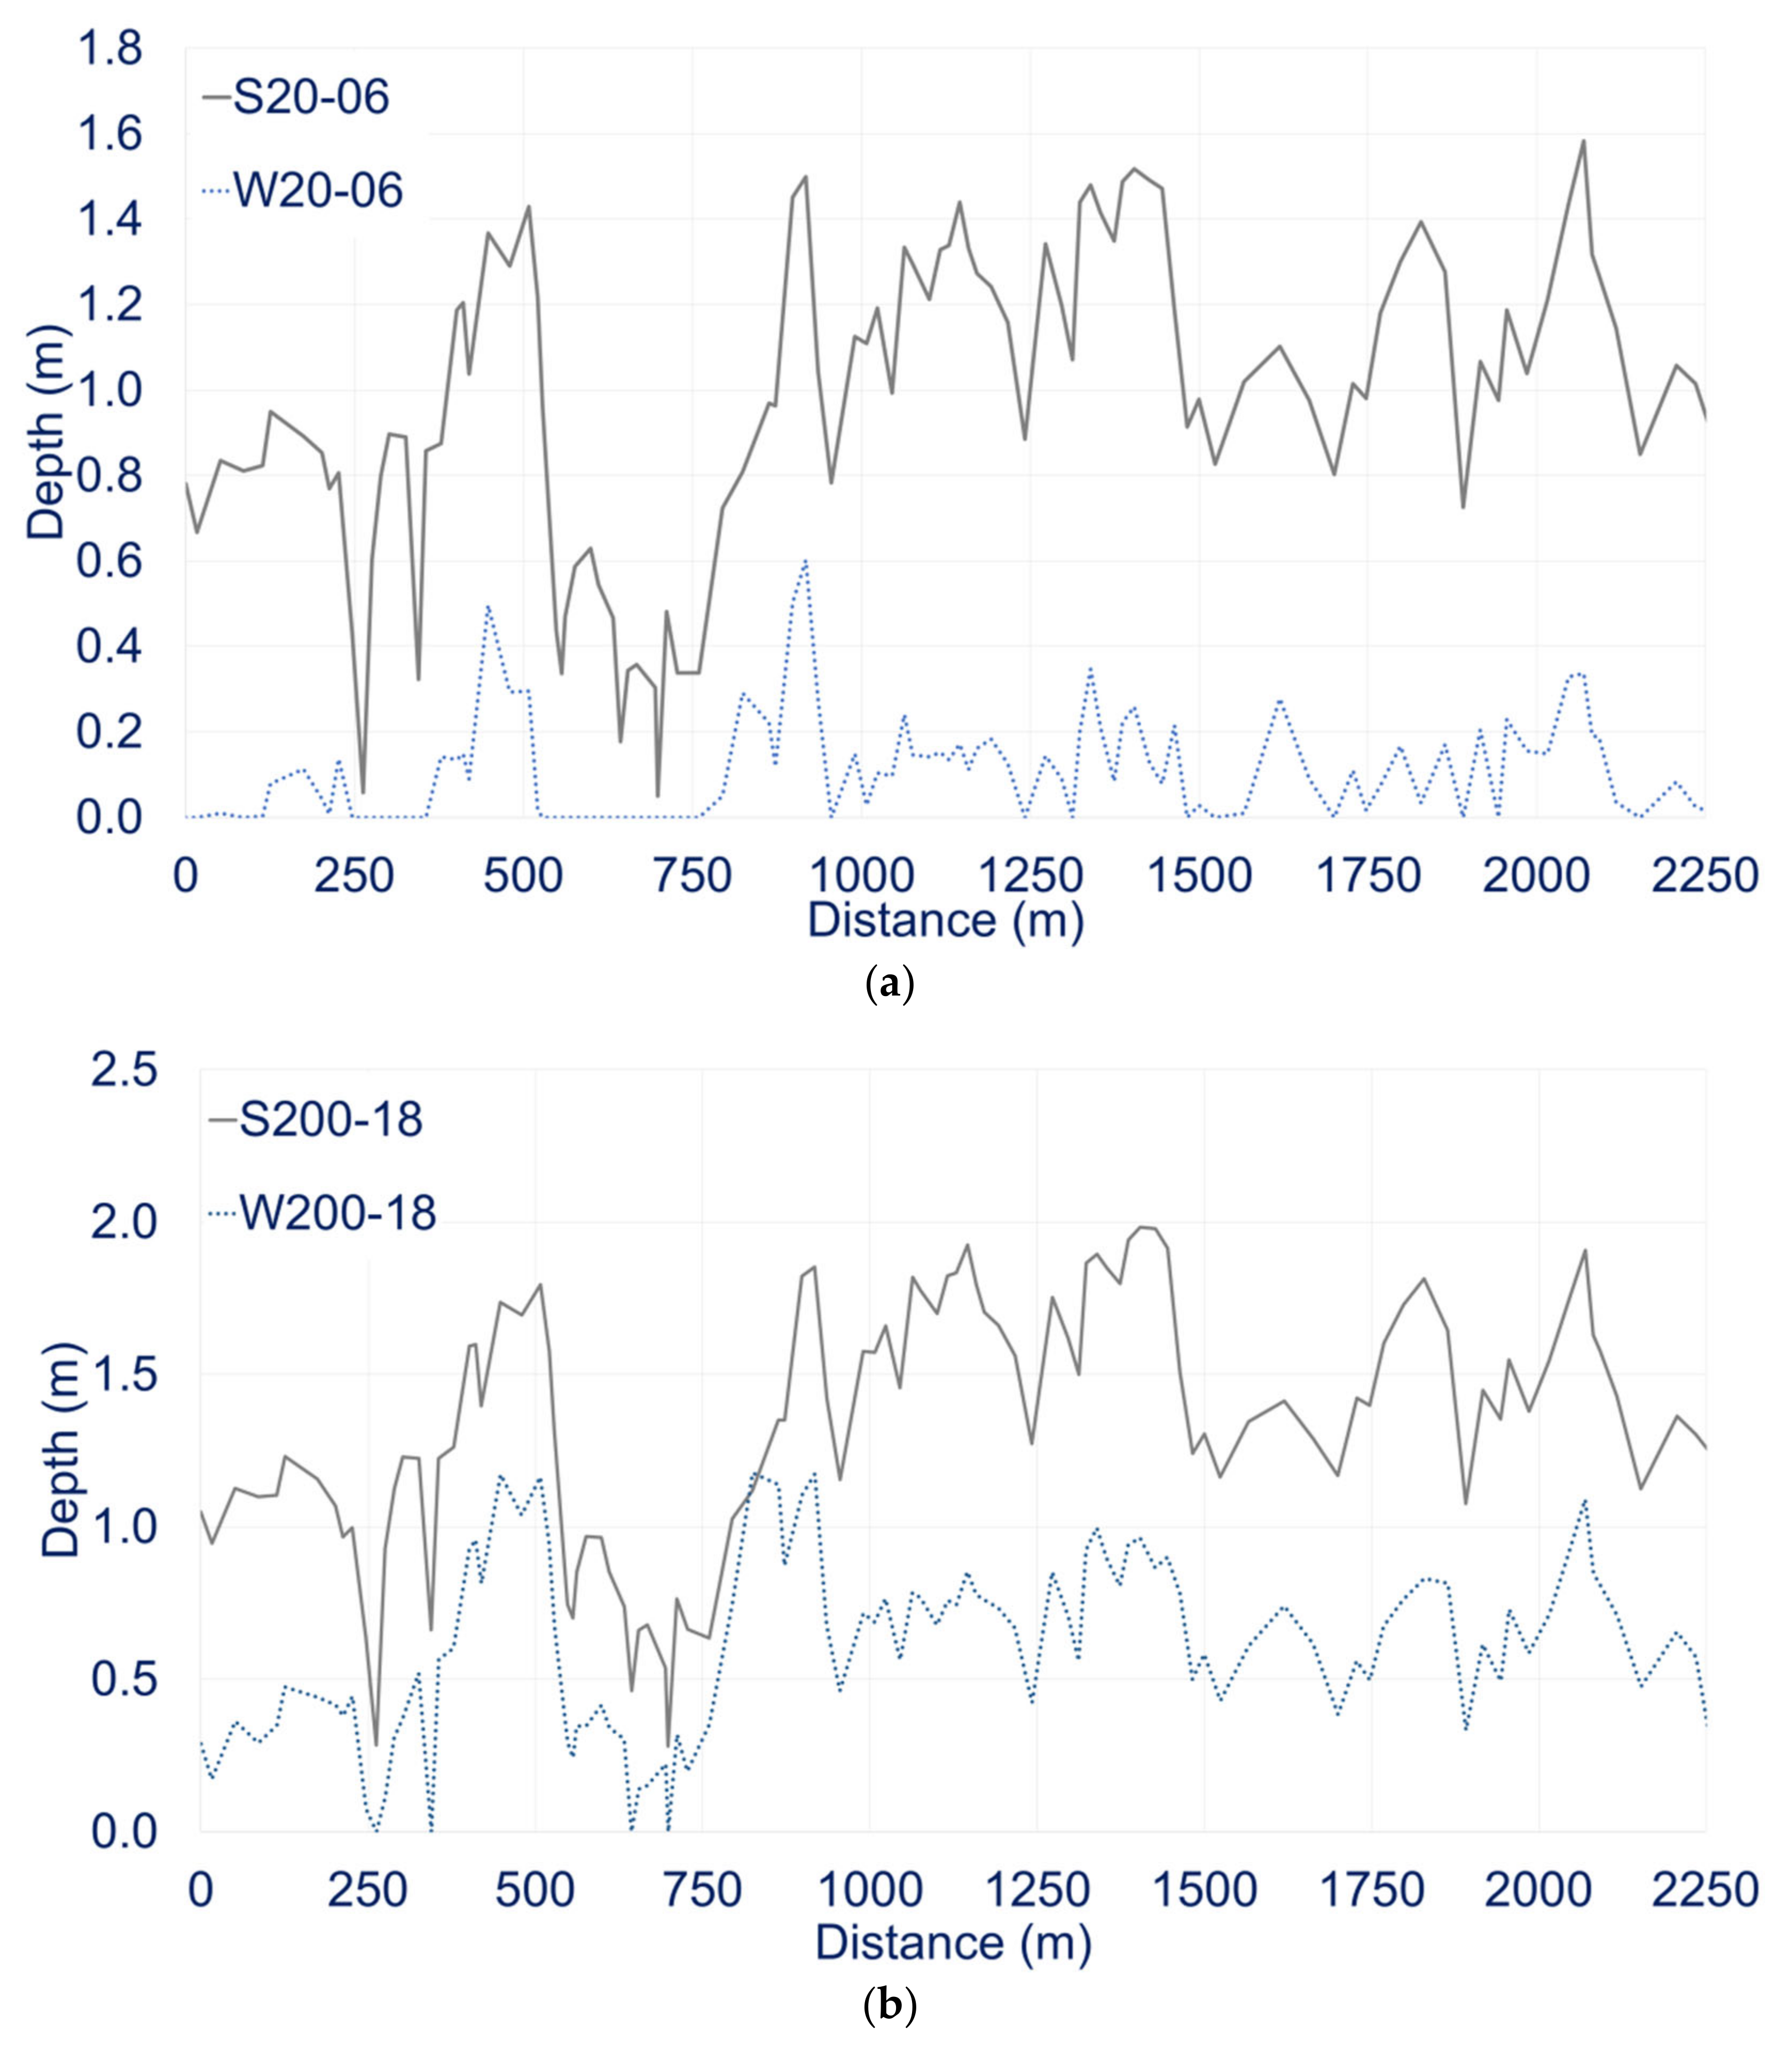
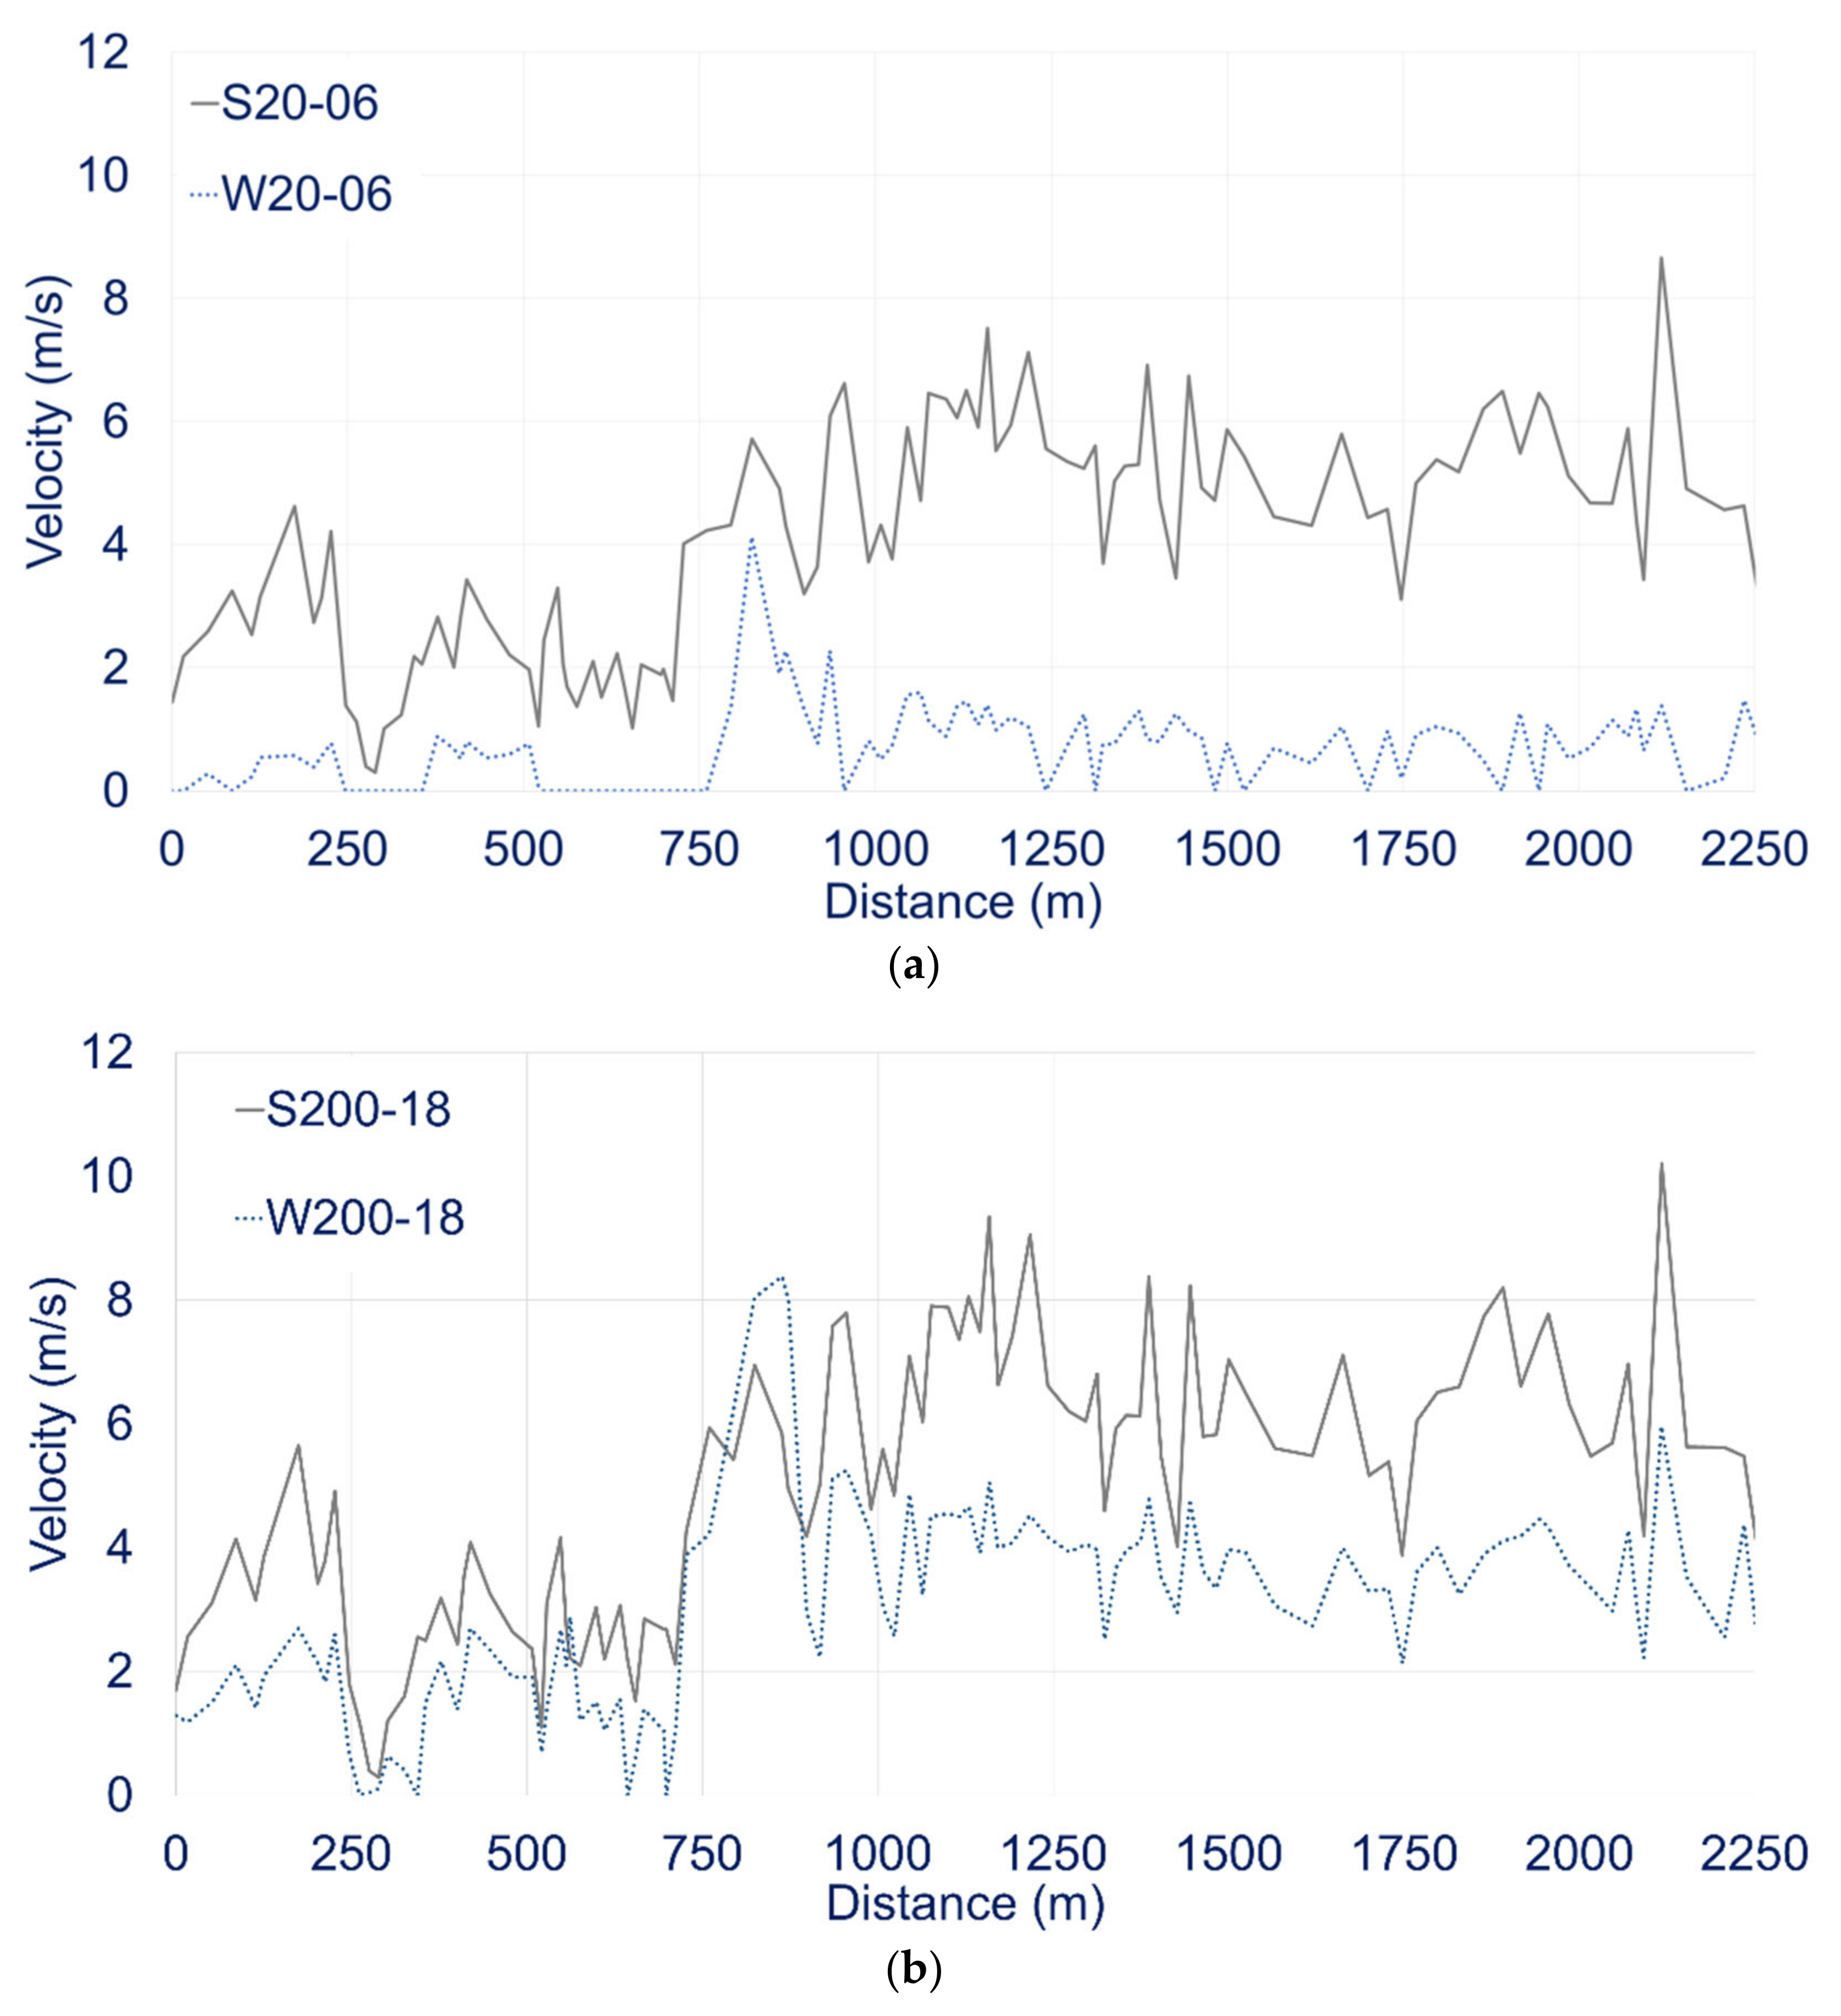
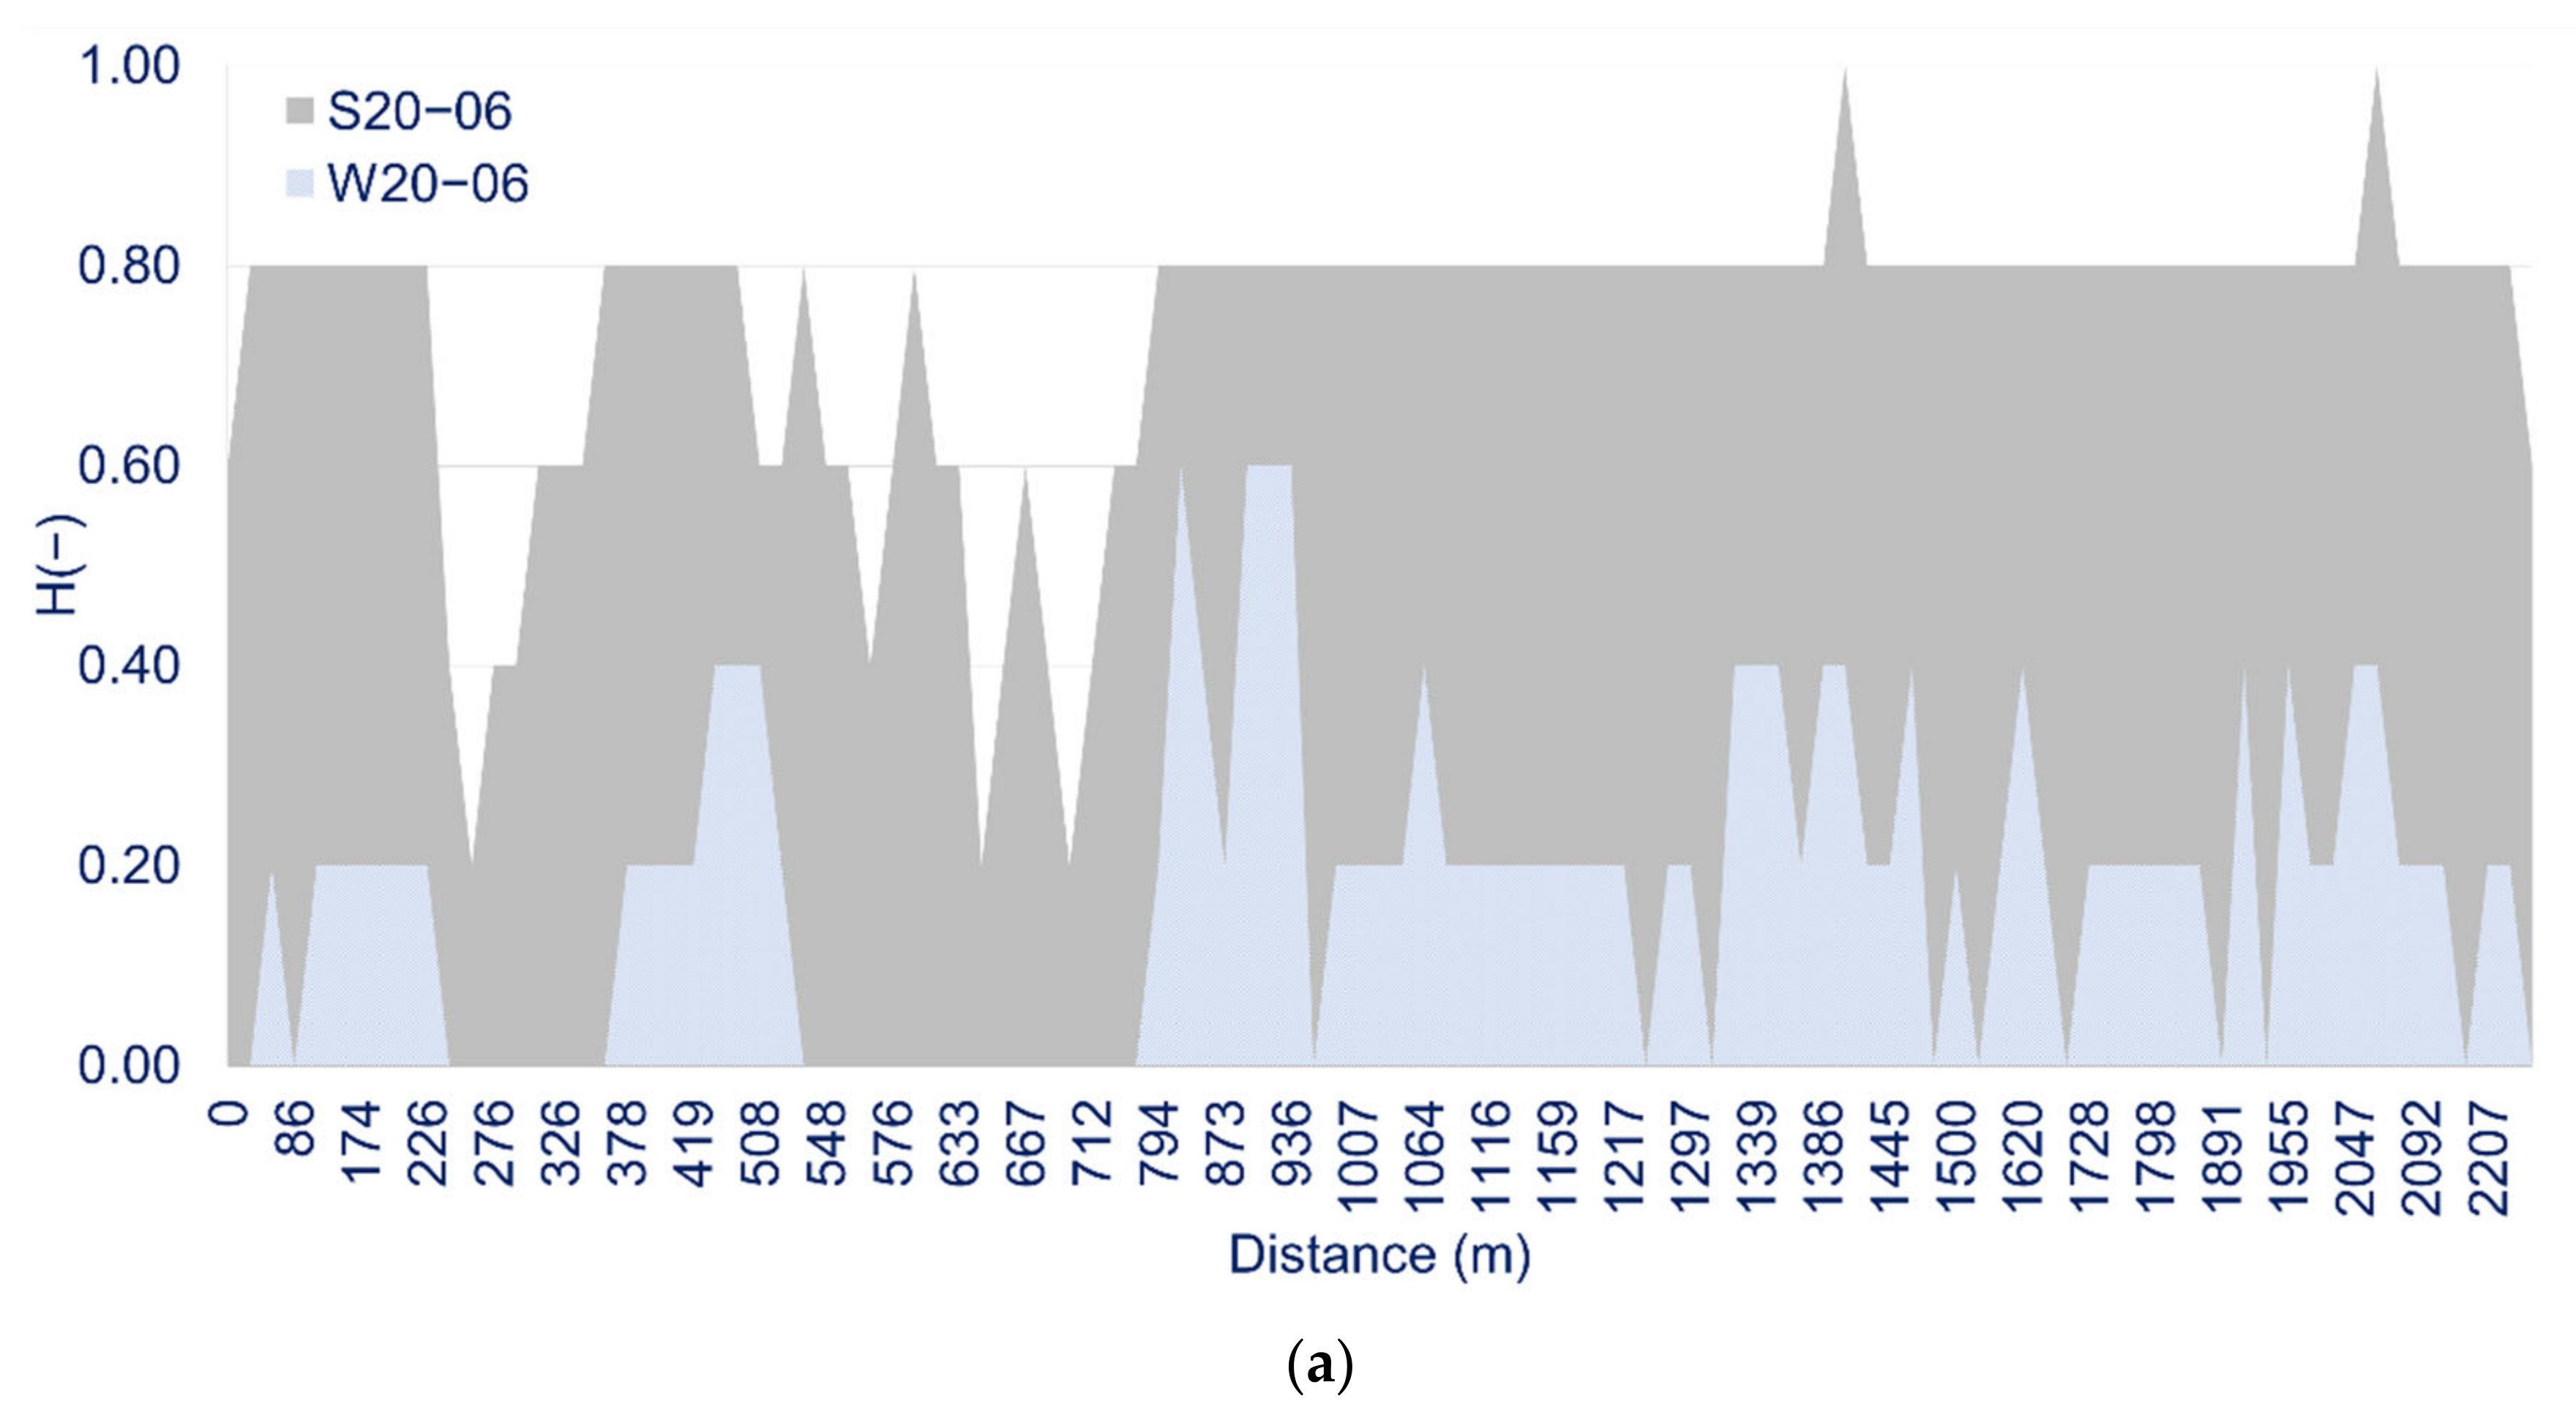
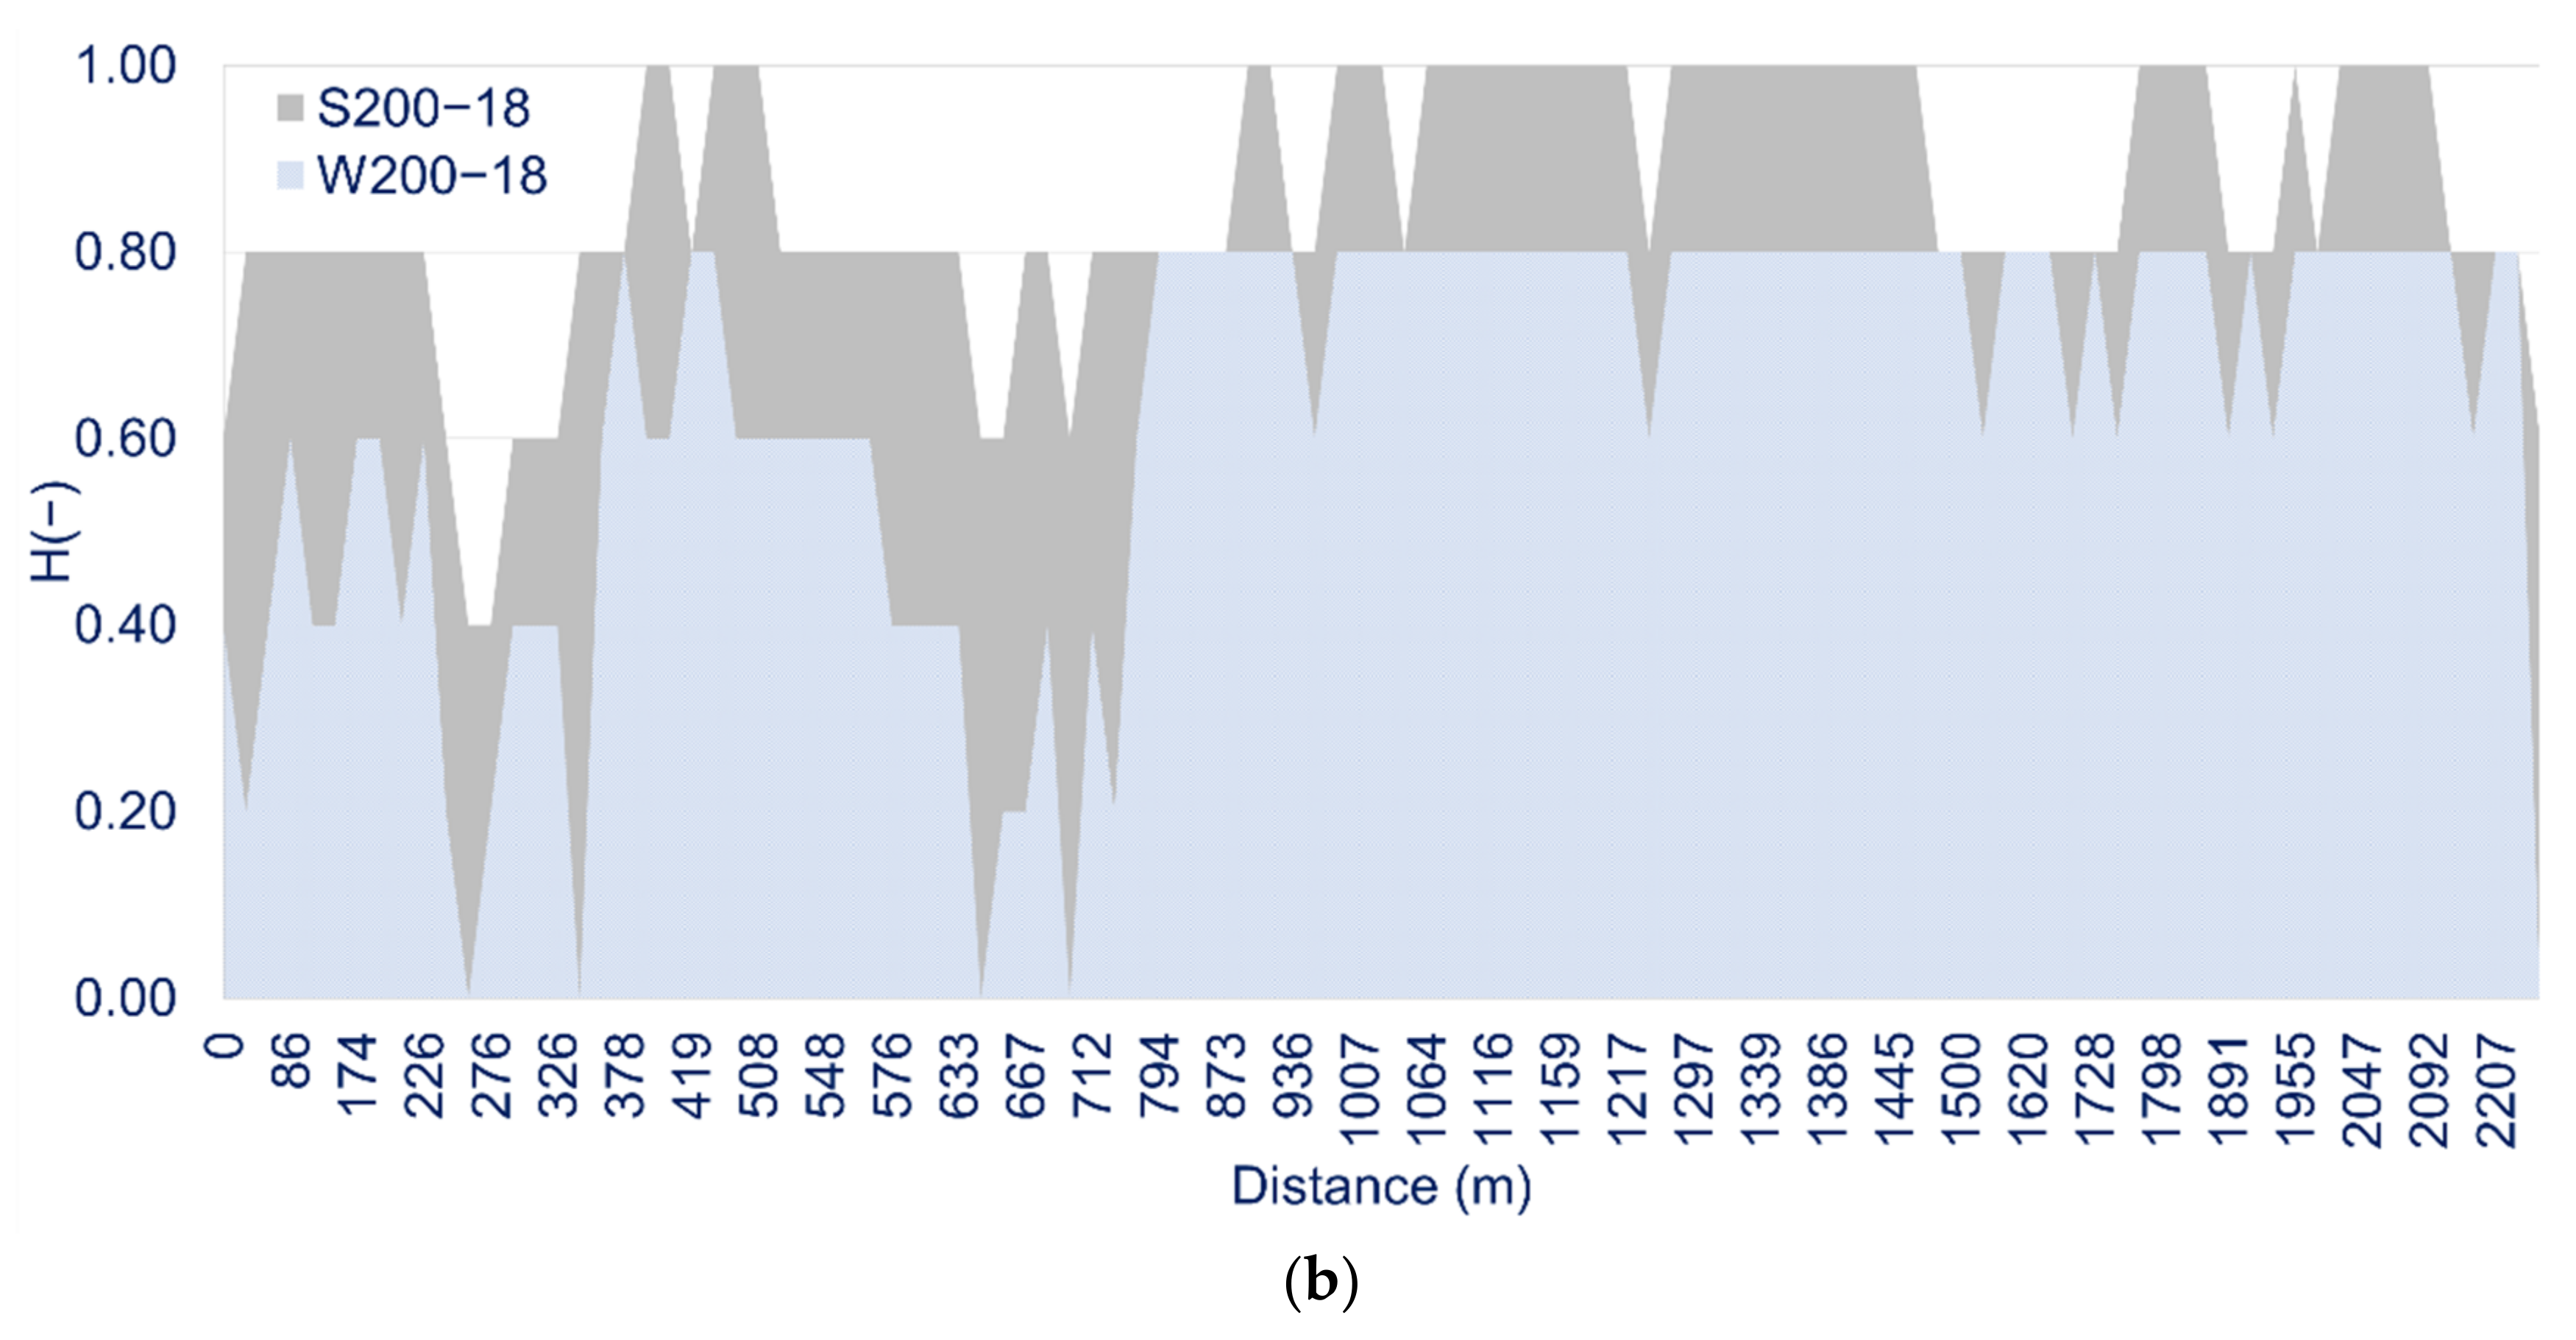
- Along Koropouli Street, the maximum water depths range from 1.58 to 1.98 m for the extreme scenarios S20-06 and S200-18 (without works), respectively, and from 0.60 to 1.18 m for the extreme scenarios W20-06 and W200-18 (with works), respectively. The maximum flow velocities range from 8.66 to 10.21 m/s for the extreme scenarios S20-06 and S200-18 (without works), respectively, and from 4.13 to 8.40 m/s for the extreme scenarios W20-06 and W200-18 (with works), respectively. The maximum water depths and flow velocities increase with increasing return period and increasing rain duration. The effect of the flood protection works on the maximum water depths is significant. The presence of the works reduces the maximum water depths by 38–62% and the maximum flow velocities by 18–52%; the maximum reductions are observed for the minimum return period and maximum rain duration.
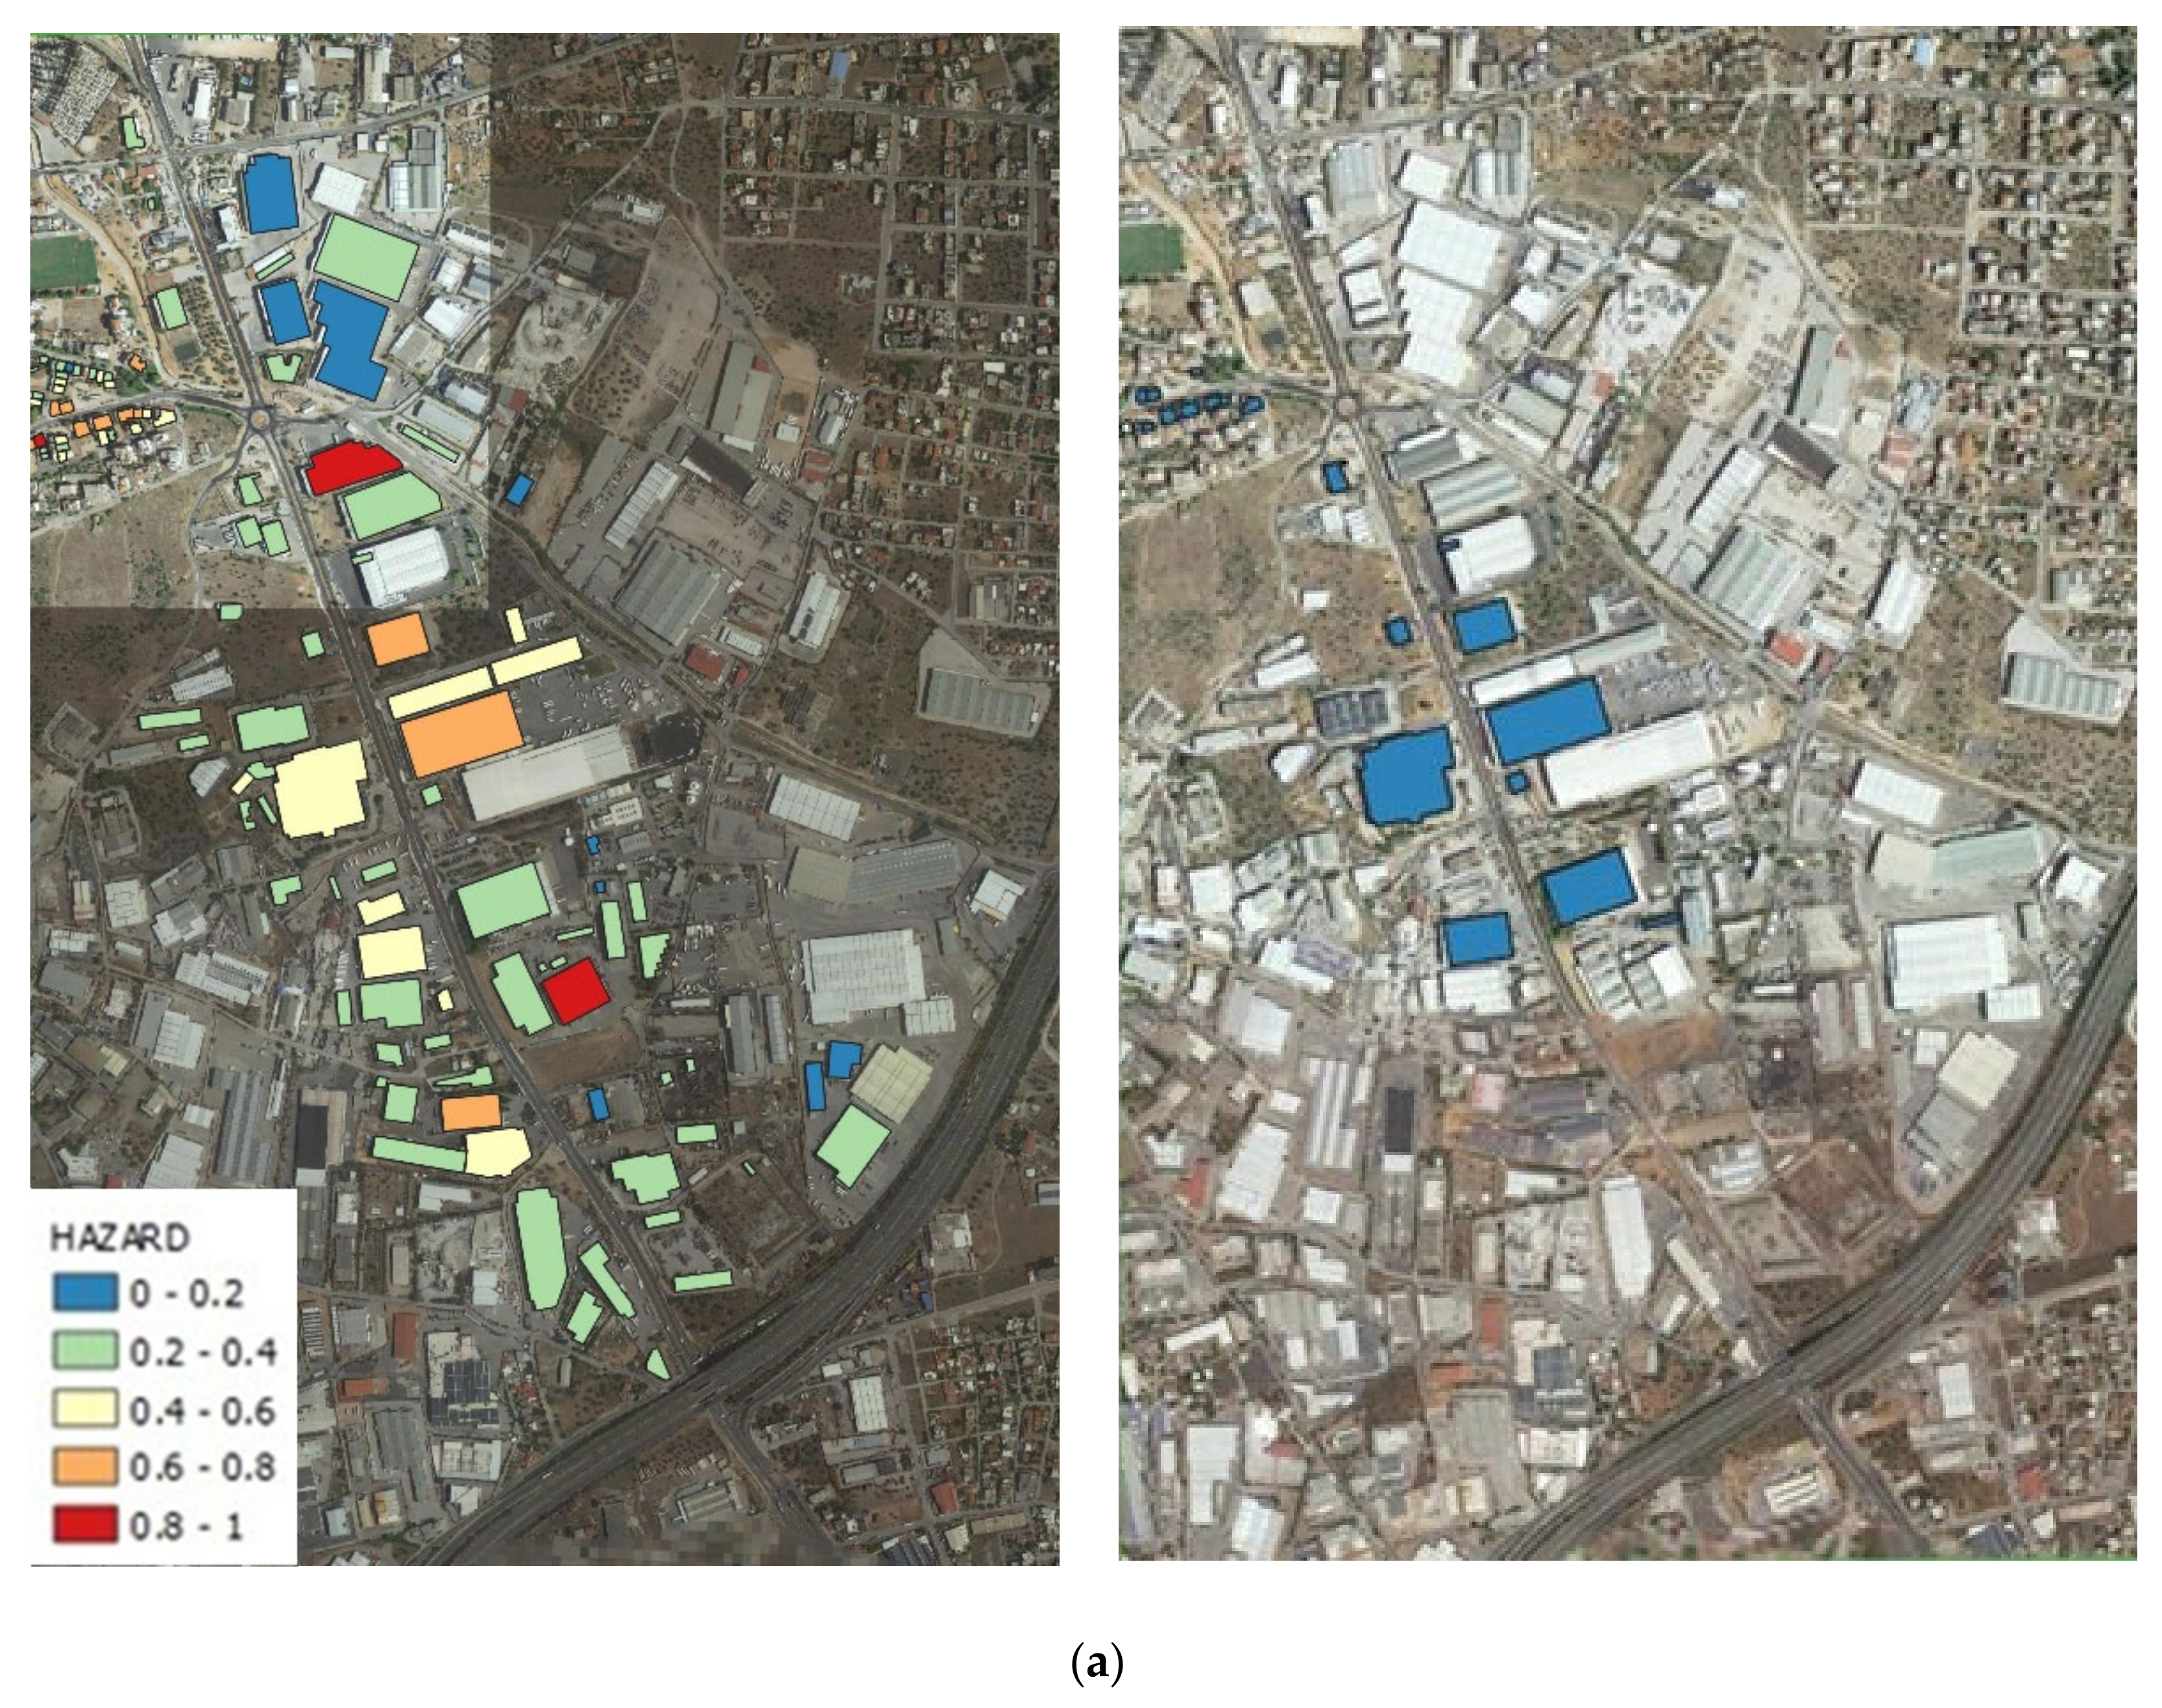
- The maximum flood hazard values in the residential area range from 0.80 to 1.00 m for the extreme scenarios S20-06 and S200-18 (without works), respectively, and from 0.60 to 0.80 m for the extreme scenarios W20-06 and W200-18 (with works), respectively. Following the behavior of the maximum water depths and flow velocities, the flood hazard increases with increasing return period and increasing rain duration. Moreover, the effect of the flood protection works on the average flood hazard along Koropouli Street is pronounced; the average value of hazard ranges from 0.75 to 0.78 for the extreme scenarios S20-06 and S200-18, respectively, and from 0.19 to 0.65 for the extreme scenarios W20-06 and W200-18, respectively. In other words, the presence of the works results in a decrease in the flood hazard by 24–75%; as expected, this reduction decreases with increasing return period and decreasing rain duration. It should be noted that this dependence on the rain duration becomes weaker with longer rain durations.
3.3. Vulnerability Assessment
3.4. Risk Assessment
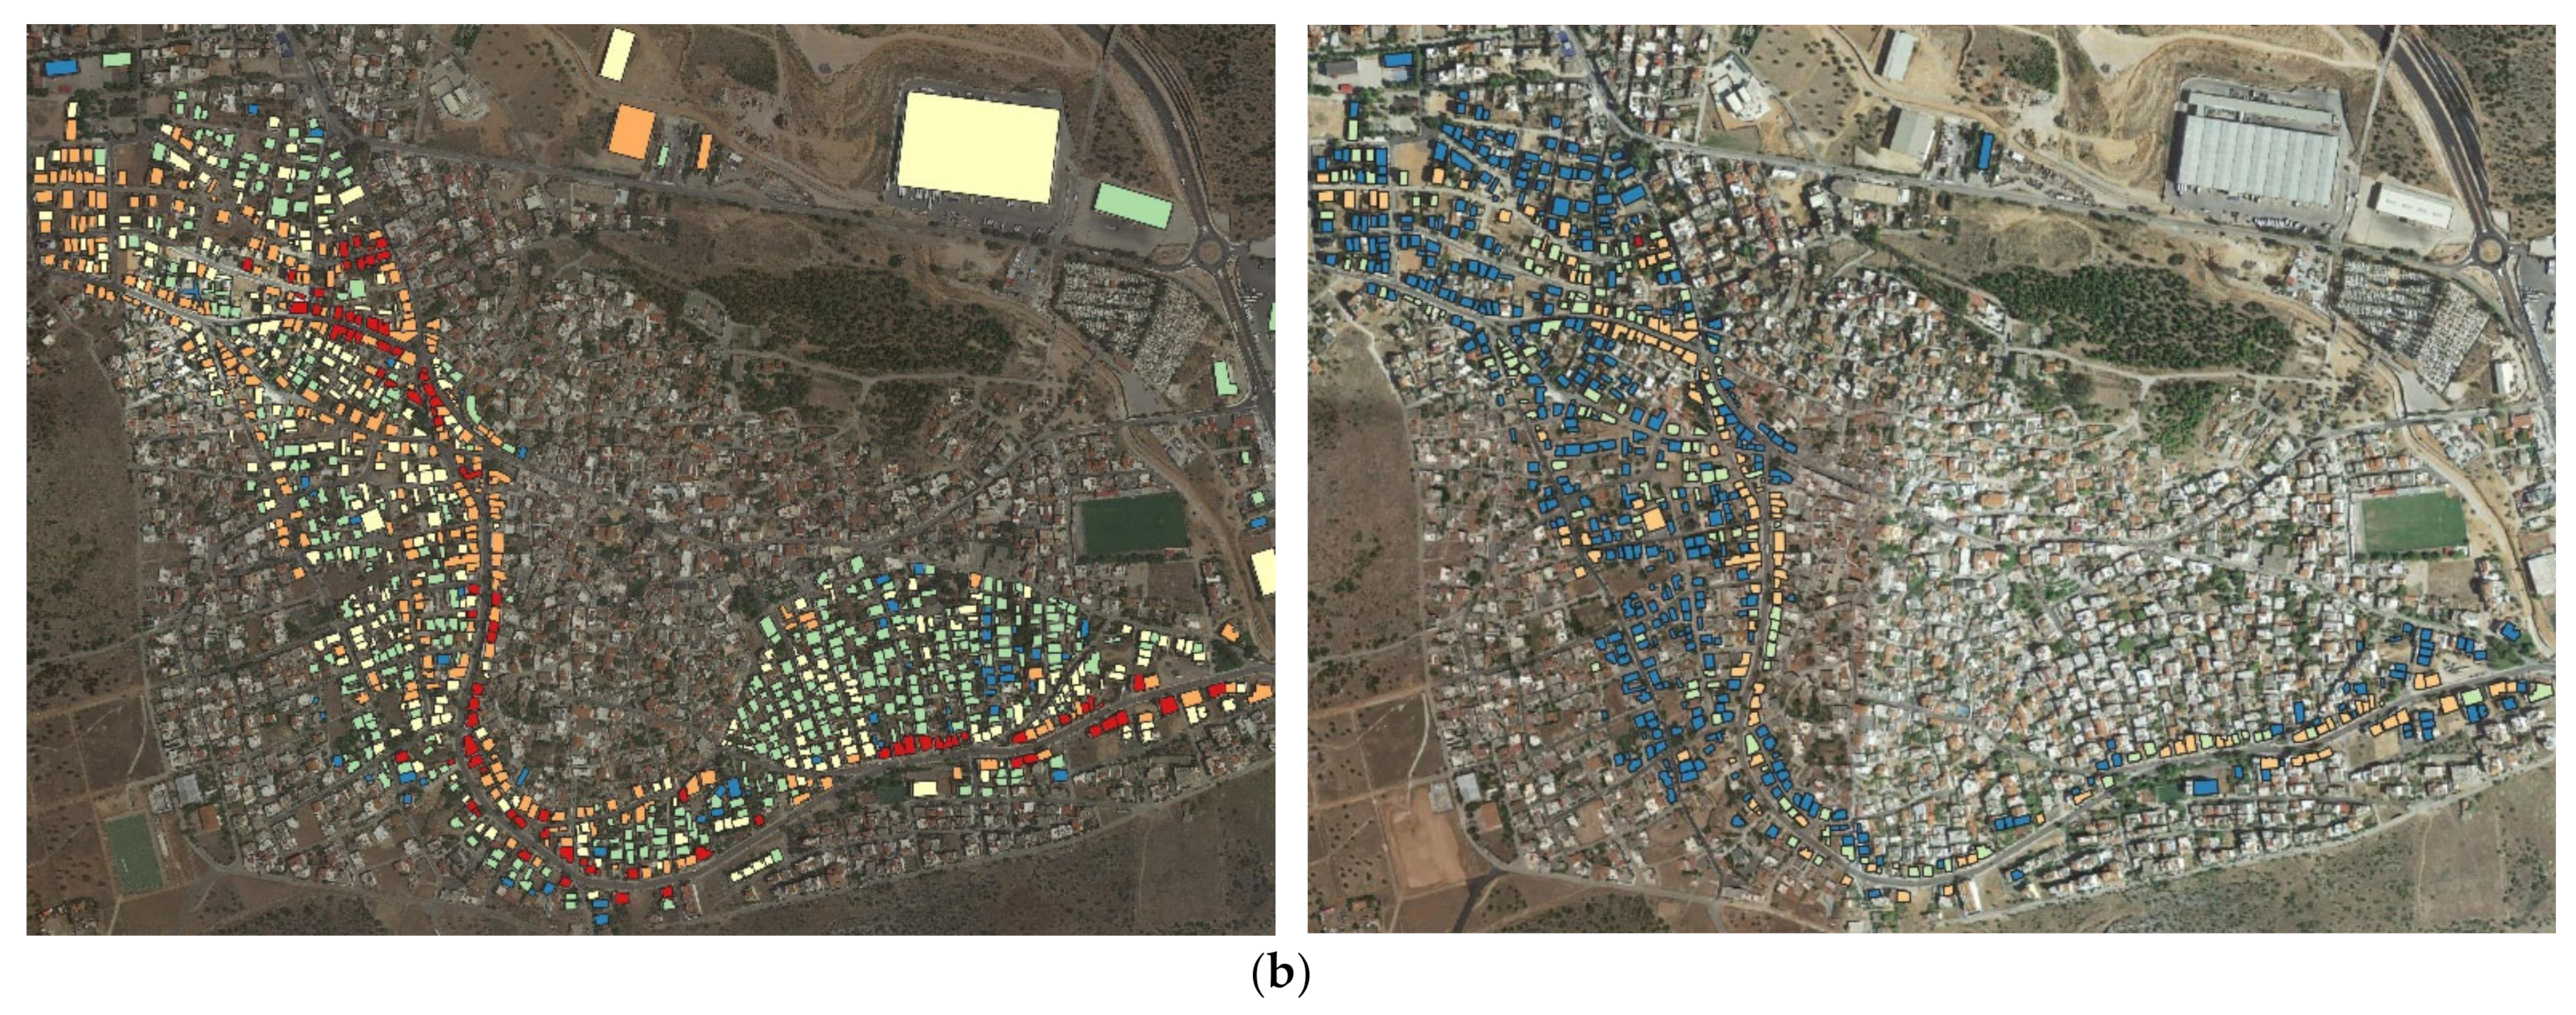
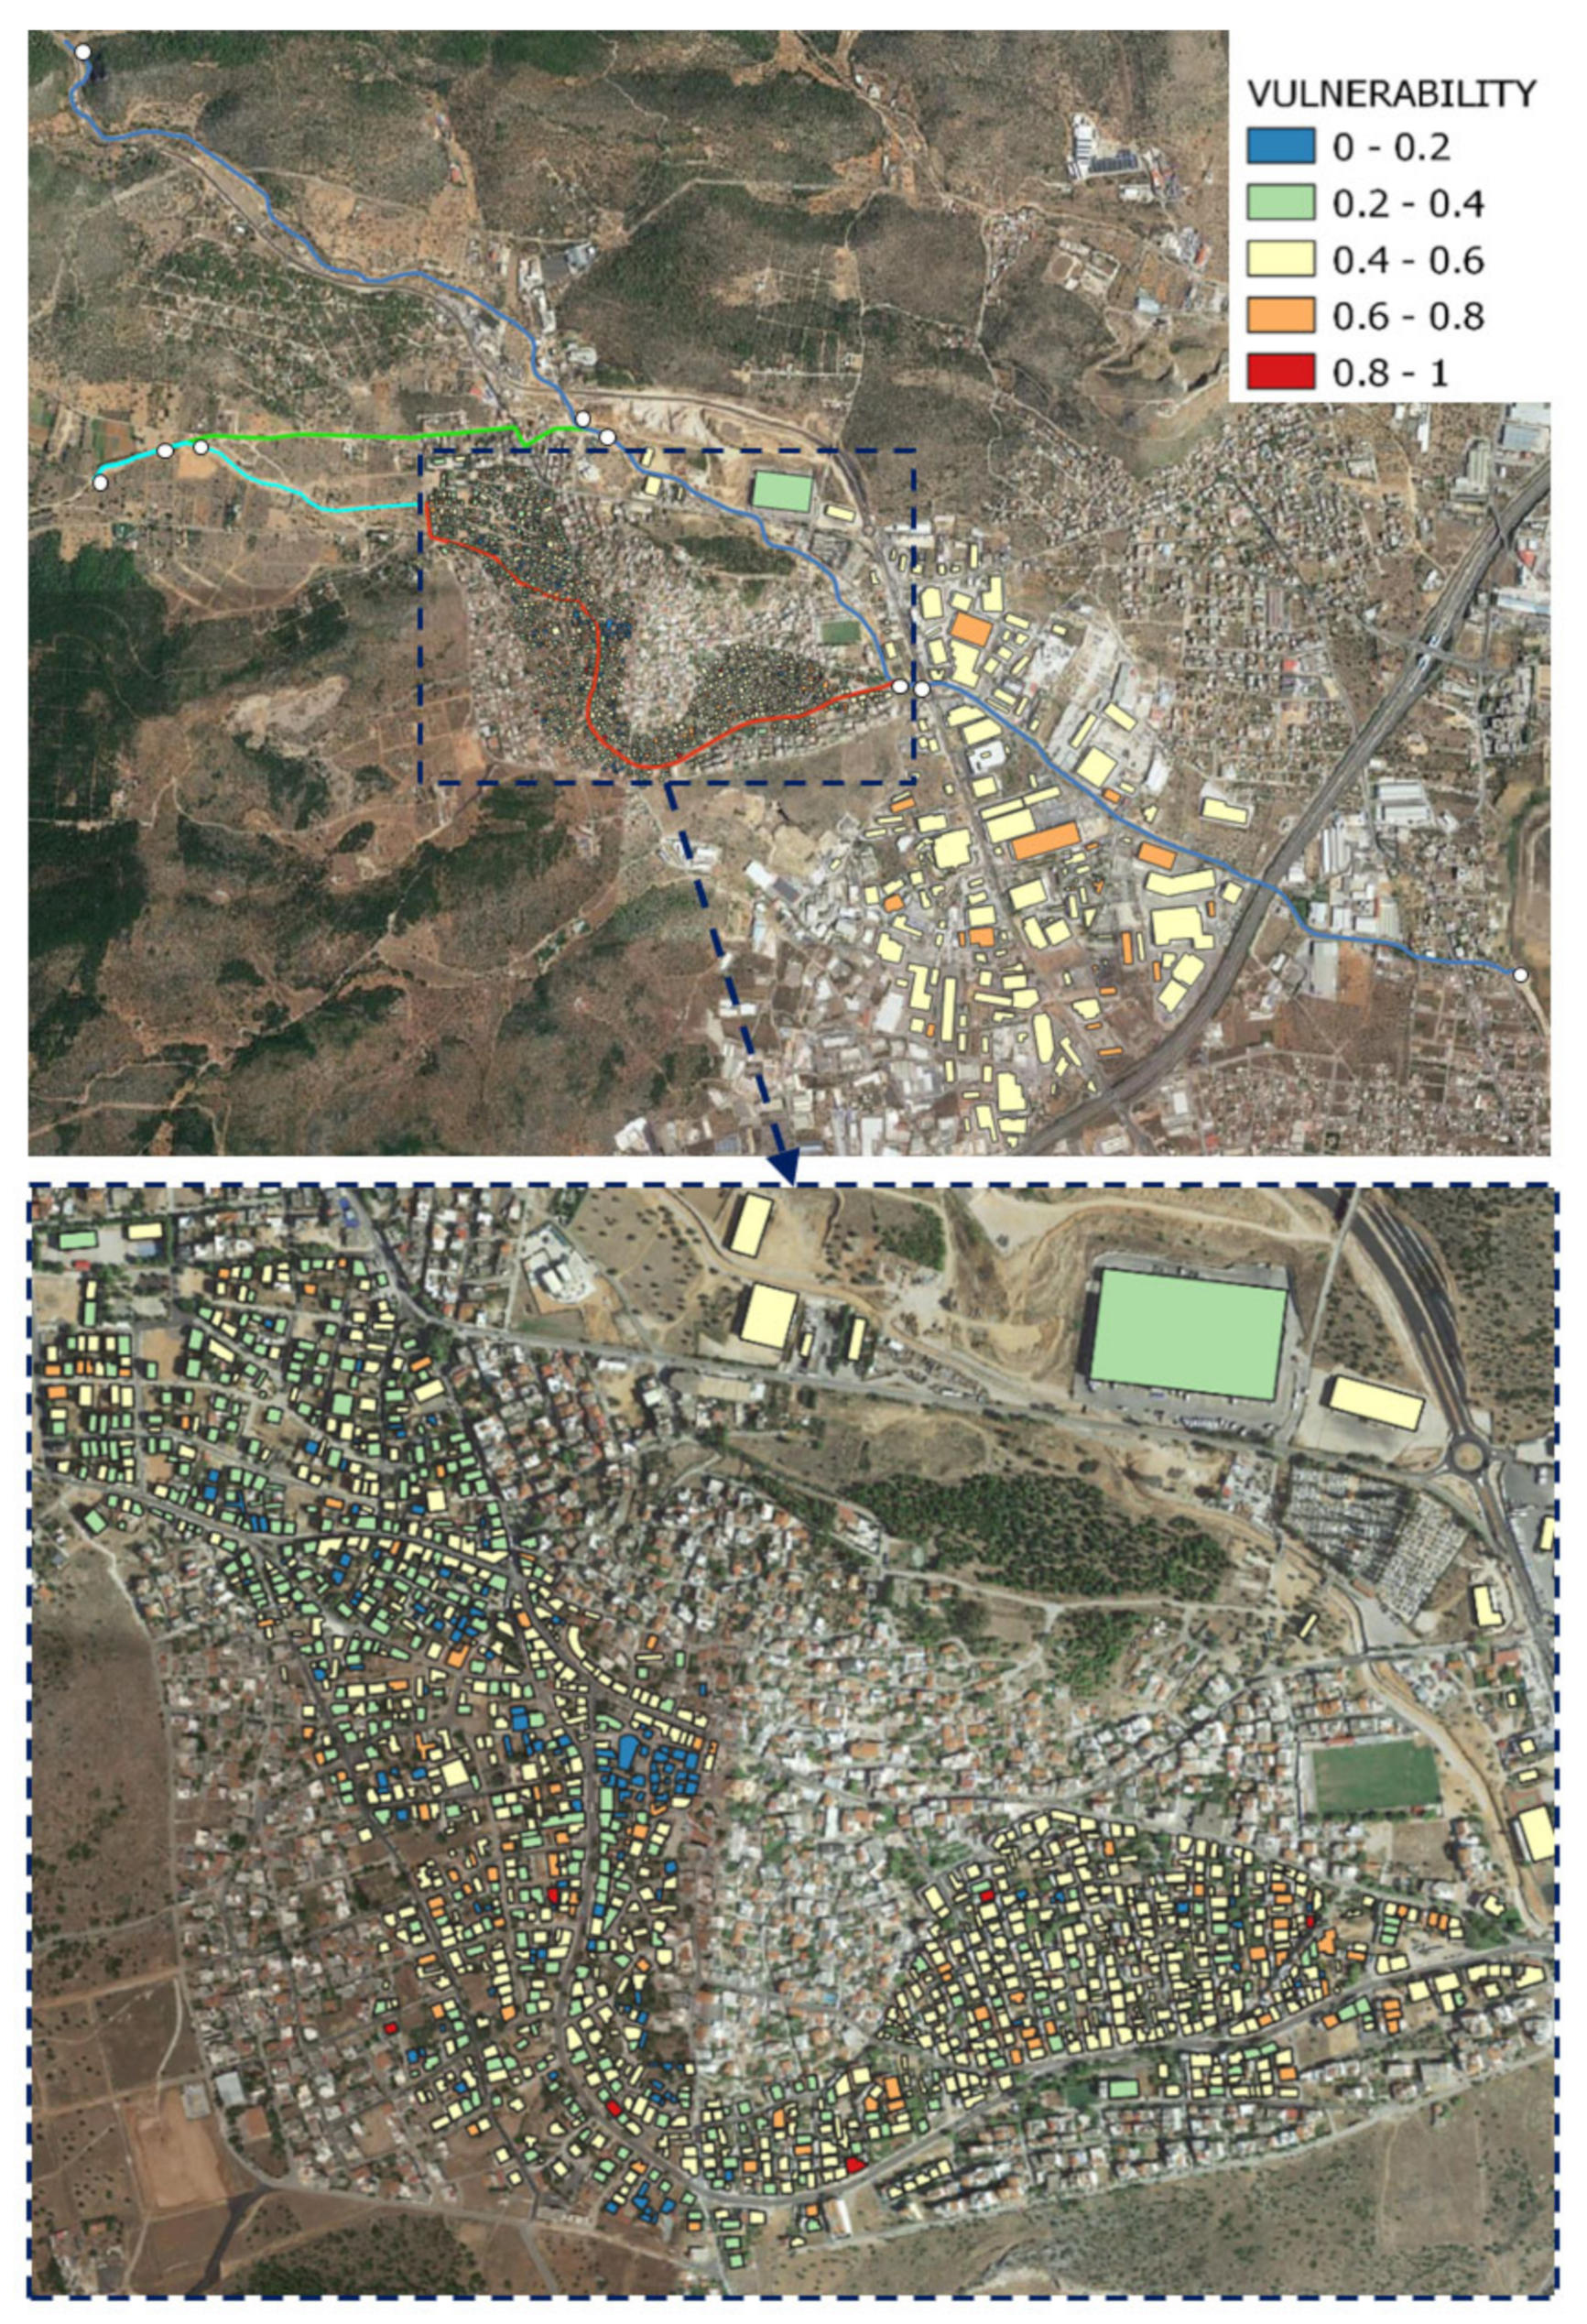
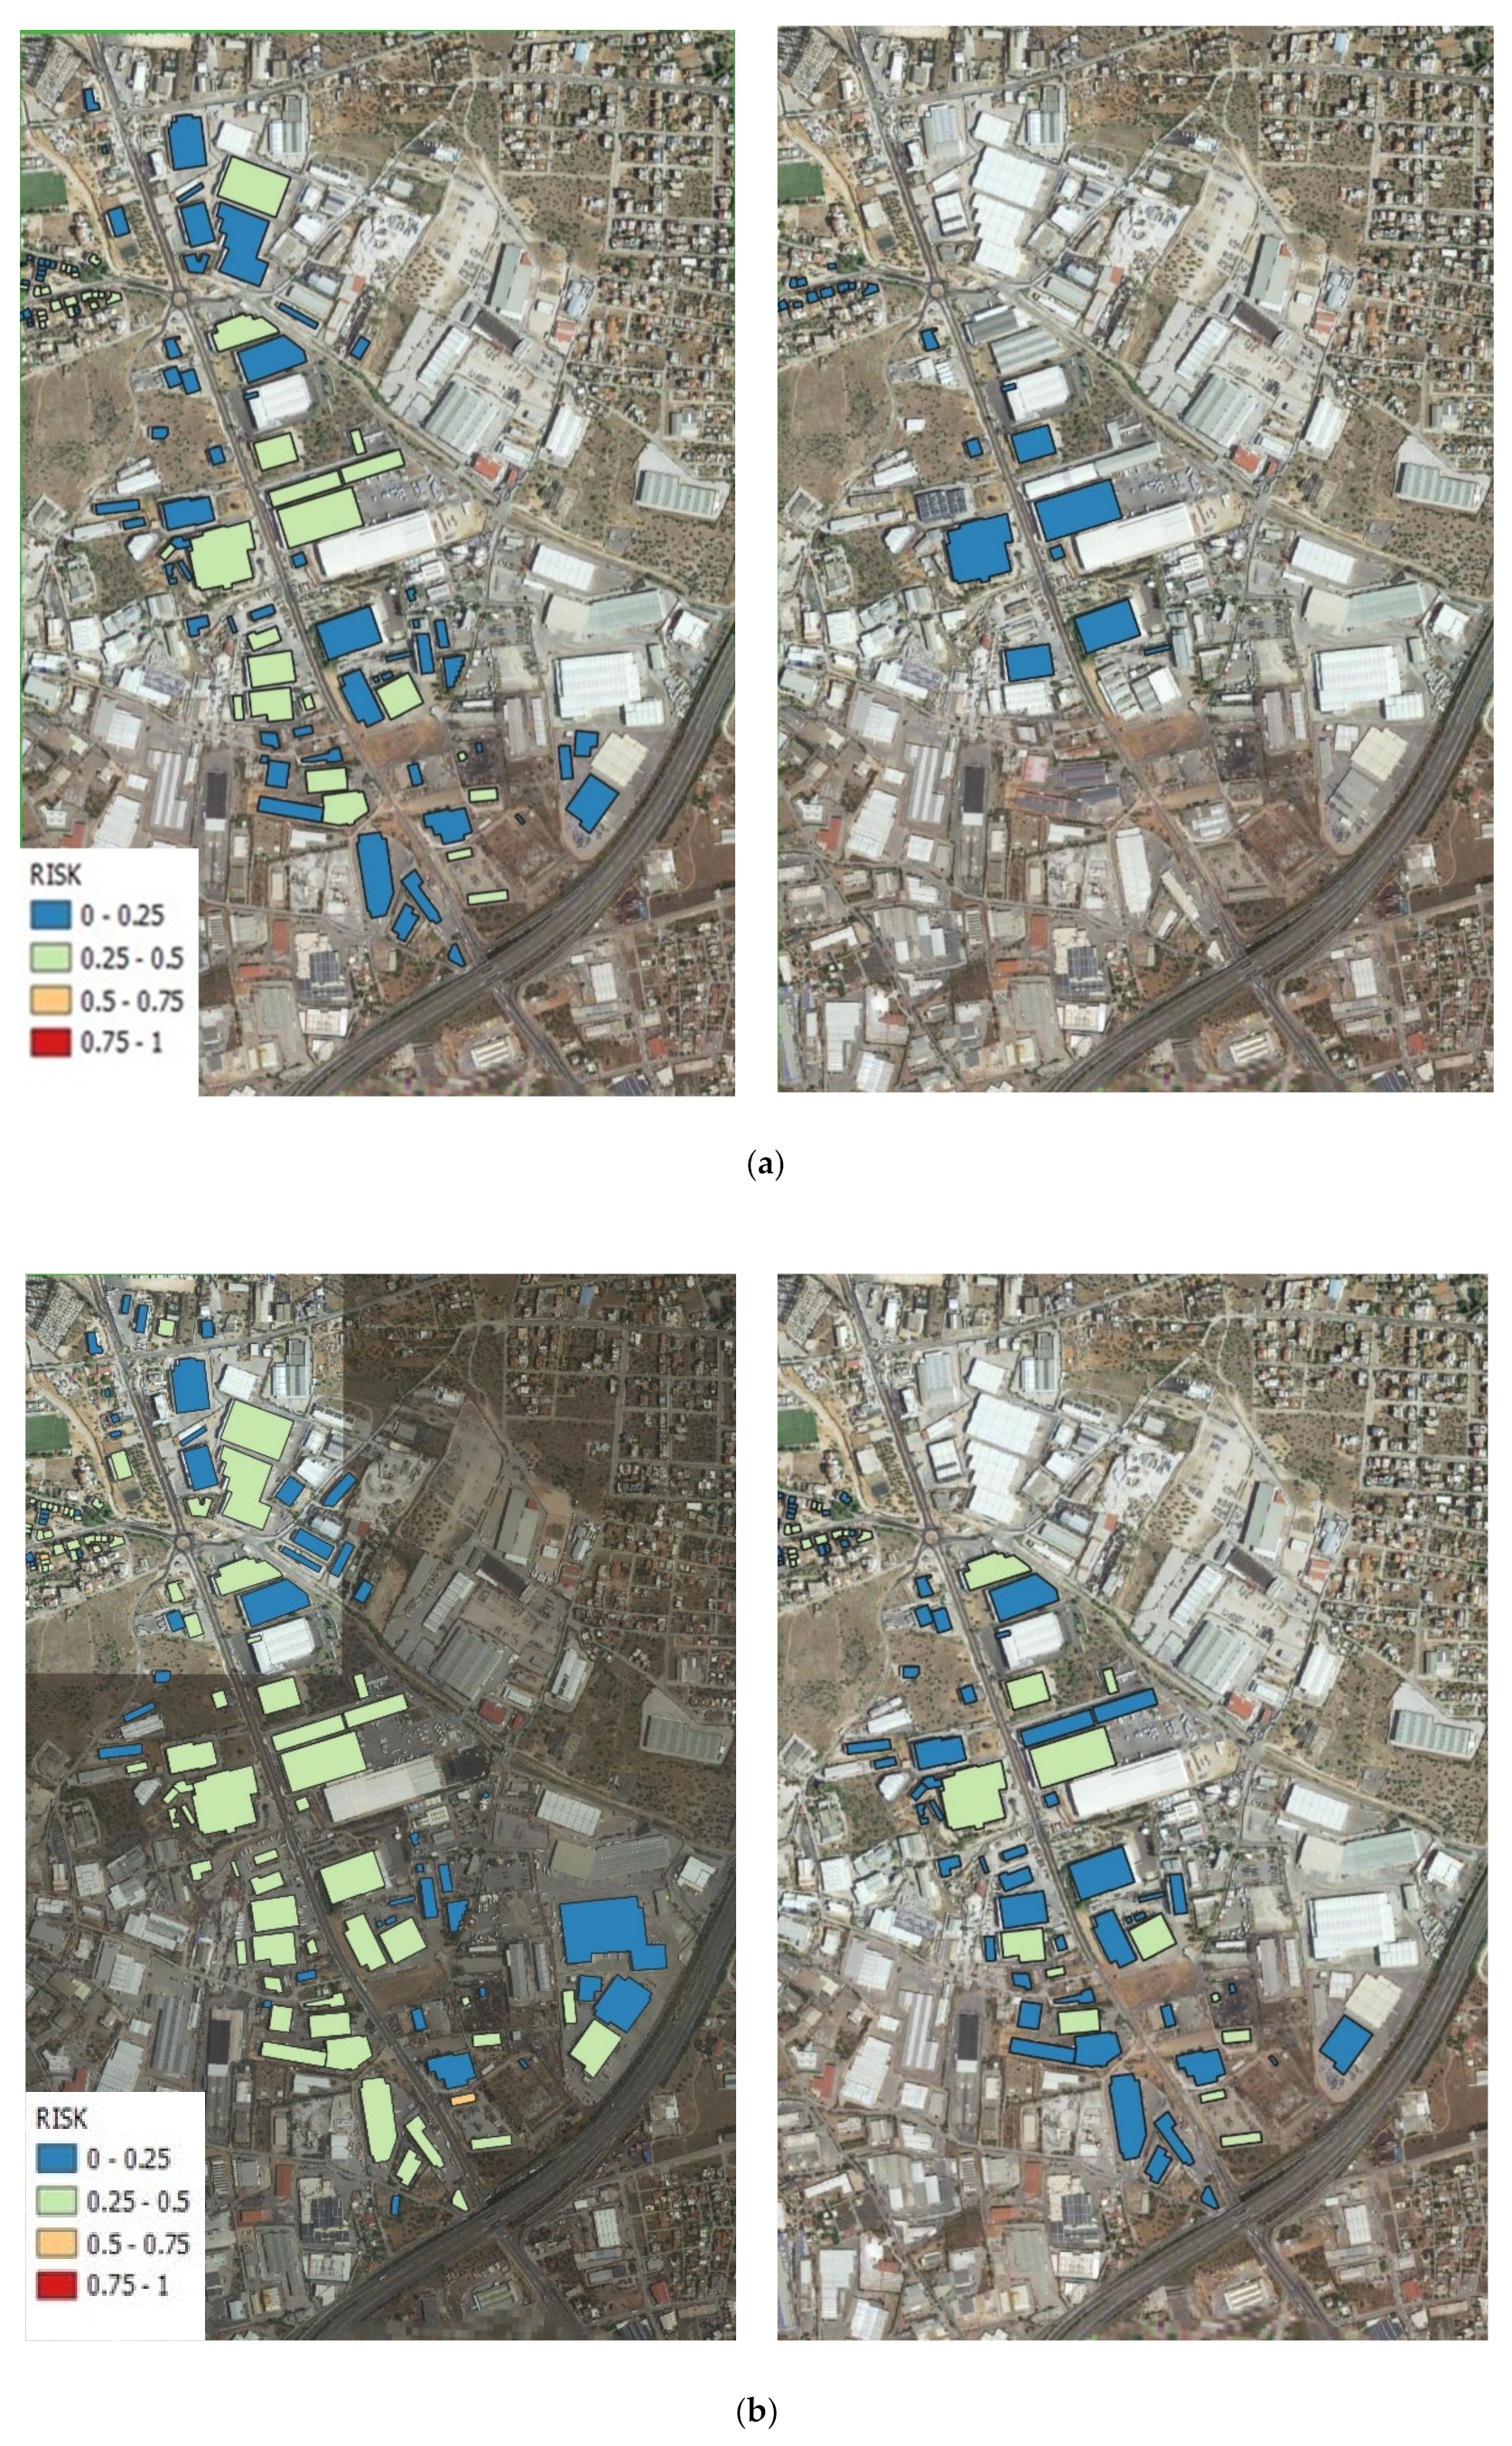
- The maximum flood risk values in the residential area range from 0.73 to 0.86 for the extreme scenarios S20-06 and S200-18 (without works), respectively, and from 0.46 to 0.59 for the extreme scenarios W20-06 and W200-18 (with works), respectively. The flood risk increases with increasing return period and increasing rain duration.
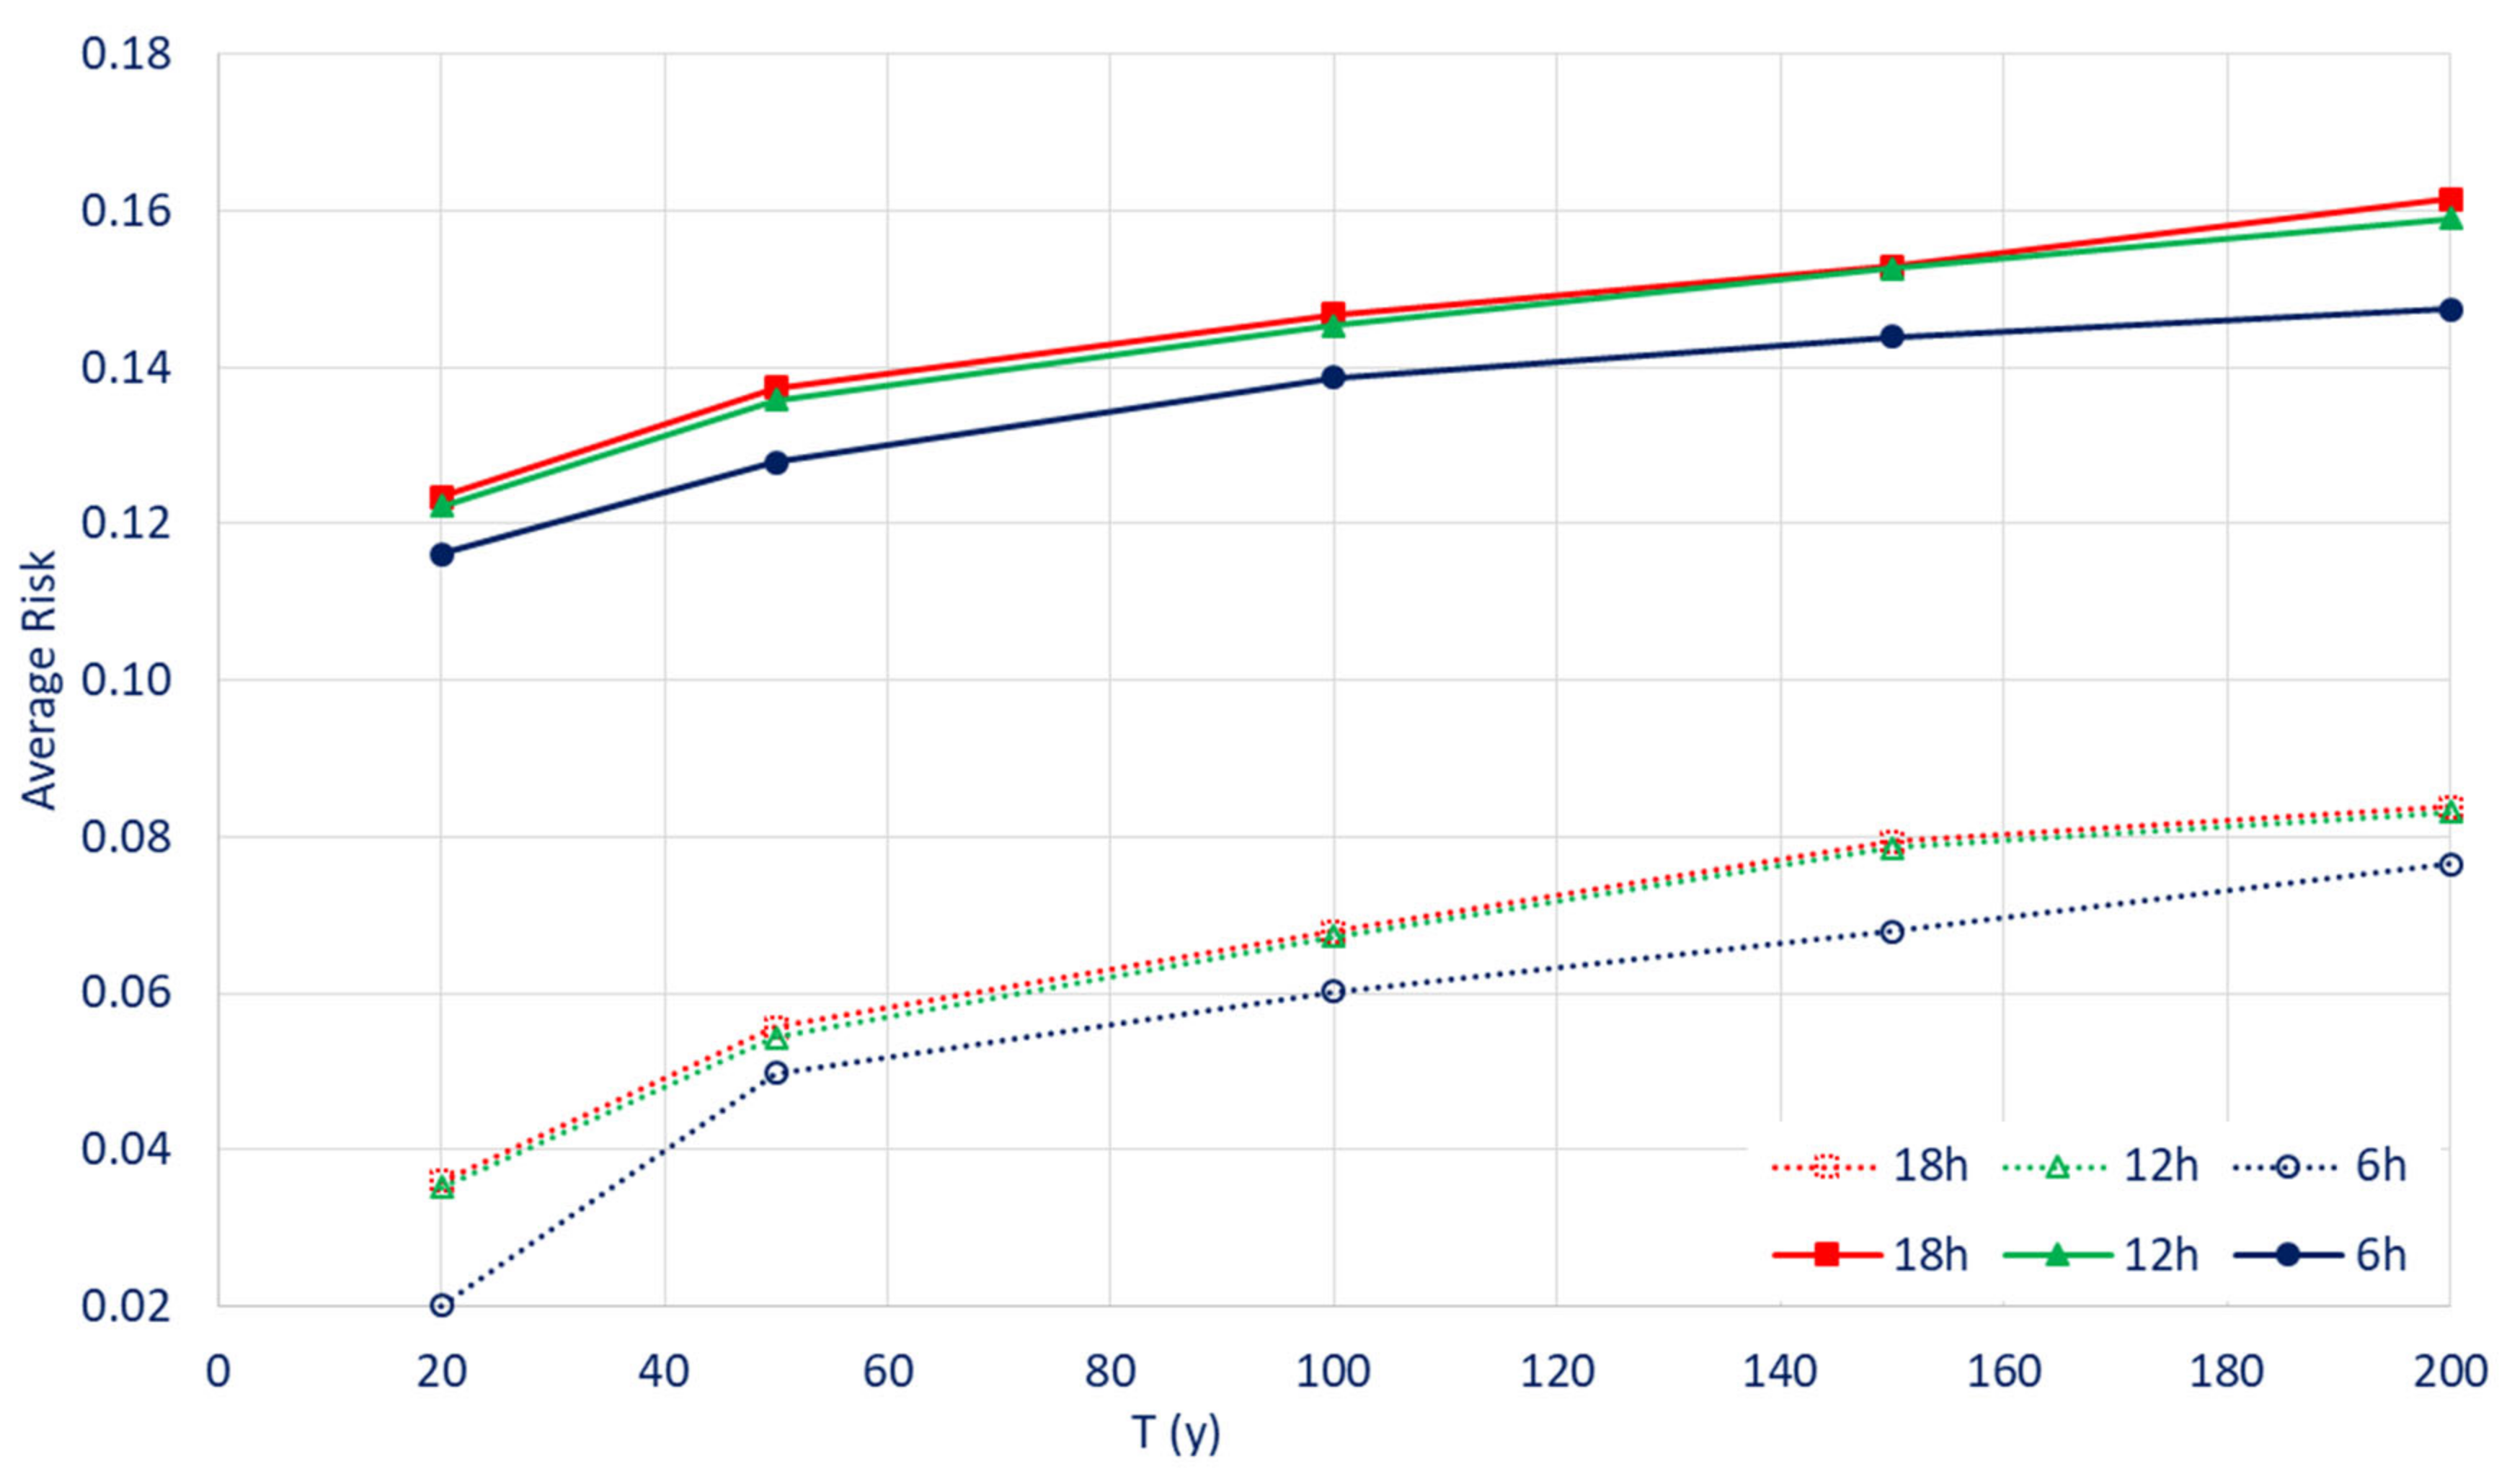
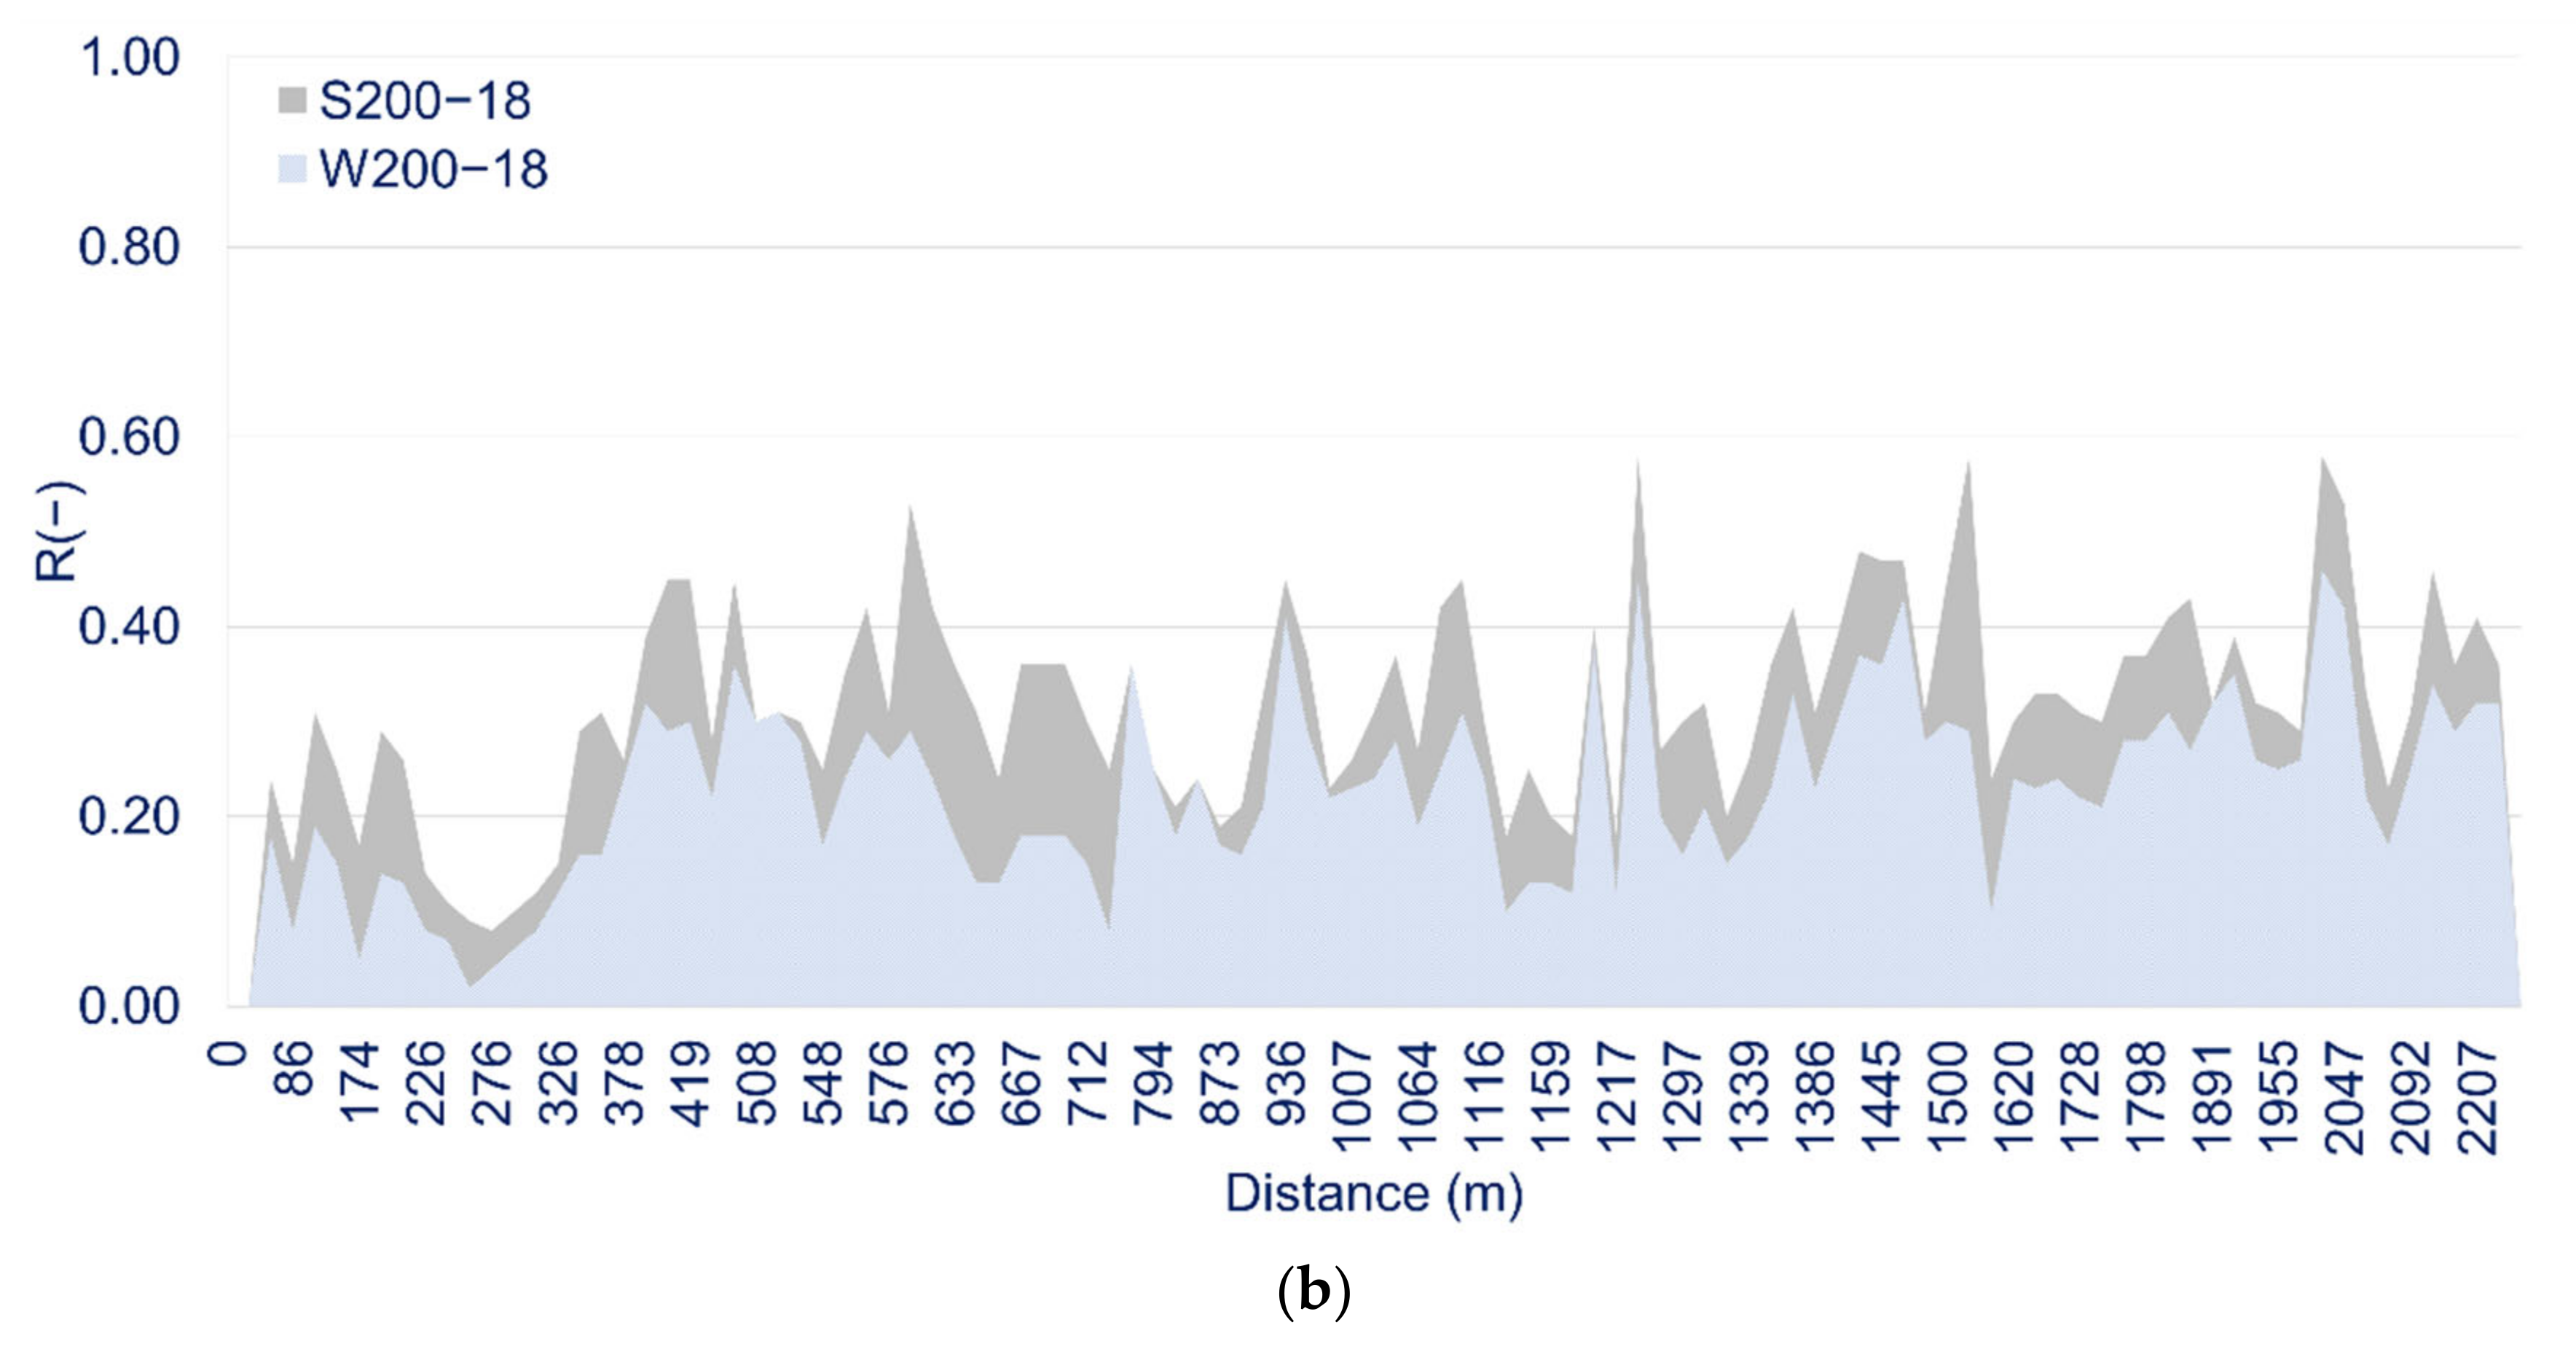
- The effect of the flood protection works on the average flood risk along Koropouli Street is pronounced; the average value of risk ranges from 0.28 to 0.32 for the extreme scenarios S20-06 and S200-18, respectively, and from 0.07 to 0.23 for the extreme scenarios W20-06 and W200-18, respectively, i.e., the presence of the works results in a decrease in the flood risk by 27–74%. This reduction decreases with increasing return period and decreasing rain duration; moreover, its dependence on the rain duration becomes very small with longer rain durations.
4. Discussion
5. Conclusions
Author Contributions
Funding
Institutional Review Board Statement
Informed Consent Statement
Data Availability Statement
Acknowledgments
Conflicts of Interest
References
- Ulbrich, U.; Brücher, T.; Fink, A.H.; Leckebusch, G.C.; Krüger, A.; Pinto, J.G. The central European floods of August 2002: Part 1—Rainfall periods and flood development. Weather 2003, 58, 371–377. [Google Scholar] [CrossRef] [Green Version]
- European Environment Agency. Deaths Related to Flooding in Europe. Available online: https://www.eea.europa.eu/data-and-maps/figures/people-per-million-population-affected-4 (accessed on 1 November 2022).
- Cornwall, W. Europe’s deadly floods leave scientists stunned. Science 2021, 373, 372–373. [Google Scholar] [CrossRef] [PubMed]
- European Union Directive 2007/60/EC of the European Counil and European Parliment of 23 October 2007 on the assessment and management of flood risks. Off. J. Eur. Union 2007, 288, 27–34.
- Merz, B.; Kreibich, H.; Thieken, A.; Schmidtke, R. Estimation uncertainty of direct monetary flood damage to buildings. Nat. Hazards Earth Syst. Sci. 2004, 4, 153–163. [Google Scholar] [CrossRef] [Green Version]
- Pistrika, A.K.; Tsakiris, G. Flood risk assessment: A methodological framework. Water Resour. Manag. New 2007, 1, 14–16. [Google Scholar]
- Diez-Herrero, A.; Garrote, J. Flood risk analysis and assessment, applications and uncertainties: A bibliometric review. Water 2020, 12, 2050. [Google Scholar] [CrossRef]
- De Moel, H.; Jongman, B.; Kreibich, H.; Merz, B.; Penning-Rowsell, E.; Ward, P.J. Flood risk assessments at different spatial scales. Mitig. Adapt. Strateg. Glob. Chang. 2015, 20, 865–890. [Google Scholar] [CrossRef] [PubMed] [Green Version]
- Wright, D.B. Methods in Flood Hazard and Risk Assessment; World Bank: New York, NY, USA, 2015. [Google Scholar]
- Diakakis, M.; Deligiannakis, G.; Antoniadis, Z.; Melaki, M.; Katsetsiadou, N.K.; Andreadakis, E.; Spyrou, N.I.; Gogou, M. Proposal of a flash flood impact severity scale for the classification and mapping of flash flood impacts. J. Hydrol. 2020, 590, 125452. [Google Scholar] [CrossRef]
- UNESCO-IHE. Flood Vulnerability Indices (FVI). Available online: http://www.unesco-ihe-fvi.org/ (accessed on 31 October 2022).
- IPCC Special Report: The Ocean and Cryosphere in a Changing Climate; Cambridge University Press: Cambridge, UK, 2019.
- Kappes, M.S.; Papathoma-Köhle, M.; Keiler, M. Assessing physical vulnerability for multi-hazards using an indicator-based methodology. Appl. Geogr. 2012, 32, 577–590. [Google Scholar] [CrossRef]
- Connelly, A.; Carter, J.G.; Handley, J. State of the Art Report (4) Vulnerability Assessment: Definition, Indicators and Existing Assessment Methods. Eur. Proj. RESIN–Clim. Resilient Cities Infrastruct. 2015, 12–50. [Google Scholar]
- Kron, W. Flood risk = hazard • values • vulnerability. Water Int. 2005, 30, 58–68. [Google Scholar] [CrossRef]
- Antony, R.; Rahiman, K.U.A.; Vishnudas, S. Flood Hazard Assessment and Flood Inundation Mapping—A Review. In Current Trends in Civil Engineering: Select Proceedings of ICRACE 2020; Thomas, J., Jayalekshmi, B.R., Praveen, N., Eds.; Springer: Singapore, 2020; pp. 209–219. ISBN 9789811581502. [Google Scholar]
- Dung, N.B.; Long, N.Q.; Goyal, R.; An, D.T.; Minh, D.T. The Role of Factors Affecting Flood Hazard Zoning Using Analytical Hierarchy Process: A Review. Earth Syst. Environ. 2022, 6, 697–713. [Google Scholar] [CrossRef]
- Munpa, P.; Kittipongvises, S.; Phetrak, A.; Sirichokchatchawan, W.; Taneepanichskul, N.; Lohwacharin, J.; Polprasert, C. Climatic and Hydrological Factors Affecting the Assessment of Flood Hazards and Resilience Using Modified UNDRR Indicators: Ayutthaya, Thailand. Water 2022, 14, 1603. [Google Scholar] [CrossRef]
- Mitsopoulos, G.; Panagiotatou, E.; Sant, V.; Baltas, E.; Diakakis, M.; Lekkas, E.; Stamou, A. Optimizing the Performance of Coupled 1D/2D Hydrodynamic Models for Early Warning of Flash Floods. Water 2022, 14, 2356. [Google Scholar] [CrossRef]
- Pita, G.L.; Albornoz, B.S.; Zaracho, J.I. Flood depth-damage and fragility functions derived with structured expert judgment. J. Hydrol. 2021, 603, 126982. [Google Scholar] [CrossRef]
- Nixon, S. EU Overview of Methodologies Used in Preparation of Flood Hazard and Flood Risk Maps; EU Publications Office: Luxembourg, 2015. [Google Scholar]
- Special Secretariat for Water. Flood Risk Management Plan; Special Secretariat for Water: Athens, Greece, 2015. [Google Scholar]
- Custer, R.; Nishijima, K. Flood Vulnerability Assessment of Residential Buildings by Explicit Damage Process Modelling; Springer: Berlin/Heidelberg, Germany, 2015; Volume 78, ISBN 1106901517. [Google Scholar]
- Papathoma-Köhle, M. Vulnerability curves vs. Vulnerability indicators: Application of an indicator-based methodology for debris-flow hazards. Nat. Hazards Earth Syst. Sci. 2016, 16, 1771–1790. [Google Scholar] [CrossRef] [Green Version]
- Merz, B.; Kreibich, H.; Schwarze, R.; Thieken, A. Review article “Assessment of economic flood damage”. Nat. Hazards Earth Syst. Sci 2010, 10, 1697–1724. [Google Scholar] [CrossRef]
- Nasiri, H.; Yusof, M.J.M.; Ali, T.A.M.; Hussein, M.K.B. District flood vulnerability index: Urban decision-making tool. Int. J. Environ. Sci. Technol. 2019, 16, 2249–2258. [Google Scholar] [CrossRef] [Green Version]
- UNDRR. Structural and Non-Structural Measures. Available online: https://www.undrr.org/terminology/structural-and-non-structural-measures (accessed on 1 November 2022).
- Guo, Z.; Chen, L.; Yin, K.; Shrestha, D.P.; Zhang, L. Quantitative risk assessment of slow-moving landslides from the viewpoint of decision-making: A case study of the Three Gorges Reservoir in China. Eng. Geol. 2020, 273, 105667. [Google Scholar] [CrossRef]
- Dong, X.; Guo, H.; Zeng, S. Enhancing future resilience in urban drainage system: Green versus grey infrastructure. Water Res. 2017, 124, 280–289. [Google Scholar] [CrossRef]
- Panagiotatou, E.; Stamou, A. Mathematical Modelling of Nature-Based Solutions for flood risk reduction under Climate Change conditions. In Proceedings of the 7th IAHR Europe Congress, Athens, Greece, 7–9 September 2022; Stamou, A., Tsihrintzis, V., Eds.; IAHR: Athens, Greece, 2022. [Google Scholar]
- Sayers, P.; Li, Y.; Galloway, G.; Penning-Rowsell, E.; Shen, F.; Wen, K.; Chen, Y.; Le Quesne, T. Flood Risk Management; UNESCO: Paris, France, 2013; ISBN 9781606921470. [Google Scholar]
- Freni, G.; La Loggia, G.; Notaro, V. Uncertainty in urban flood damage assessment due to urban drainage modelling and depth-damage curve estimation. Water Sci. Technol. 2010, 61, 2979–2993. [Google Scholar] [CrossRef] [PubMed]
- Diakakis, M.; Deligiannakis, G.; Andreadakis, E.; Katsetsiadou, K.N.; Spyrou, N.I.; Gogou, M.E. How different surrounding environments influence the characteristics of flash flood-mortality: The case of the 2017 extreme flood in Mandra, Greece. J. Flood Risk Manag. 2020, 13, e12613. [Google Scholar] [CrossRef]
- Diakakis, M.; Andreadakis, E.; Nikolopoulos, E.I.; Spyrou, N.I.; Gogou, M.E.; Deligiannakis, G.; Katsetsiadou, N.K.; Antoniadis, Z.; Melaki, M.; Georgakopoulos, A.; et al. An integrated approach of ground and aerial observations in flash flood disaster investigations. The case of the 2017 Mandra flash flood in Greece. Int. J. Disaster Risk Reduct. 2019, 33, 290–309. [Google Scholar] [CrossRef]
- Anastasios, S. The Disastrous Flash Flood of Mandra in Attica-Greece and now What? Civ. Eng. Res. J. 2018, 6, 1–6. [Google Scholar] [CrossRef]
- IFRC. Emergency Plan of Action Final Report Greece: Floods; IFRC: Geneva, Switzerland, 2017. [Google Scholar]
- Stamou, A.; Mitsopoulos, G.; Baltas, E. Identification of the weak points in the application of a methodology for the design of Flood Early Warning Systems in Cli-mate Change Conditions—The case of the town of Mandra. In Proceedings of the 7th IAHR Europe Congress, Athens, Greece, 7–9 September 2022; Stamou, A., Tsihrintzis, V., Eds.; IAHR: Athens, Greece, 2022. [Google Scholar]
- (GSRI), G.S. of R. and I. Climpact: National Network for Climate Change and Its Impact. Available online: https://climpact.gr/ (accessed on 1 November 2022).
- Mitsopoulos, G.; Diakakis, M.; Panagiotatou, E.; Sant, V.; Bloutsos, A.; Lekkas, E.; Baltas, E.; Stamou, A.I. ‘How would an extreme flood have behaved if flood protection works were built?’ the case of the disastrous flash flood of November 2017 in Mandra, Attica, Greece. Urban Water J. 2022, 19, 911–921. [Google Scholar] [CrossRef]
- Feloni, E.; Theochari, A.-P.; Skroufouta, S.; Bournas, A.; Baltas, E. Analysis of the hydrologic conditions during the flood event occurred in Mandra, Greece, on November 2017. In Proceedings of the 17th International Conference on Environmental Science and Technology, Athens, Greece, 1–4 September 2021; CEST: Athens, Greece, 2021. [Google Scholar]
- Brunner, G. HEC-RAS River Analysis System Hydraulic Reference Manual Version 5.0; Hydrologic Engineering Center, Institute for Water Resources, U.S. Army Corps of Engineers: Davis, CA, USA, 2016. [Google Scholar]
- Bournas, A.; Baltas, E.; Stamou, A. Implementation of the Gridded Flash Flood Guidance Method in the Mandra Basin in west Attica, Greece. In Proceedings of the 7th IAHR Europe Congress: Innovative Water Management in a Changing Climate, Athens, Greece, 7–9 September 2022; Stamou, A., Tsihrintzis, V., Eds.; IAHR: Athens, Greece, 2022; Volume 1, pp. 457–458. [Google Scholar]
- Bournas, A.; Baltas, E. Investigation of the gridded flash flood Guidance in a Peri-Urban basin in greater Athens area, Greece. J. Hydrol. 2022, 610, 127820. [Google Scholar] [CrossRef]
- Neuhold, C.; Nachtnebel, H. Flood risk assessment in an Austrian municipality comprising the evaluation of effectiveness and efficiency of flood mitiga-tion measures. In Flood Risk Management: Research and Practice; Samuels, P., Huntington, S., Allsop, W., Harrop, J., Eds.; Routledge: London, UK, 2008; pp. 767–773. [Google Scholar]
- Blanco-Vogt, A.; Schanze, J. Assessment of the physical flood susceptibility of buildings on a large scale–Conceptual and methodological frameworks. Nat. Hazards Earth Syst. Sci. 2014, 14, 2105–2117. [Google Scholar] [CrossRef] [Green Version]
- BMVBS. Hochwasserschutzfibel. Bauliche Schutz- und Vorsorgemaßnahmen in Hochwassergefährdeten Gebieten; BMVBS: Berlin, Germany, 2006. [Google Scholar]
- Fedeski, M.; Gwilliam, J. Urban sustainability in the presence of flood and geological hazards: The development of a GIS-based vulnerability and risk assessment methodology. Landsc. Urban Plan. 2007, 83, 50–61. [Google Scholar] [CrossRef]
- Mazzorana, B.; Simoni, S.; Scherer, C.; Gems, B.; Fuchs, S.; Keiler, M. A physical approach on flood risk vulnerability of buildings. Hydrol. Earth Syst. Sci. 2014, 18, 3817–3836. [Google Scholar] [CrossRef] [Green Version]
- Hawkesbury-Nepean Floodplain Management Steering Committee. Reducing Vulnerability of Buildings to Flood Damage. In Guidance on Building in Flood Prone Areas; Hawkesbury-Nepean Floodplain Management Steering Committee: Parramatta, Australia, 2006. [Google Scholar]
- Müller, A.; Reiter, J.; Weiland, U. Assessment of urban vulnerability towards floods using an indicator-based approach—A case study for Santiago de Chile. Nat. Hazards Earth Syst. Sci. 2011, 11, 2107–2123. [Google Scholar] [CrossRef] [Green Version]
- Diakakis, M.; Deligiannakis, G.; Pallikarakis, A.; Skordoulis, M. Identifying elements that affect the probability of buildings to suffer flooding in urban areas using Google Street View. A case study from Athens metropolitan area in Greece. Int. J. Disaster Risk Reduct. 2017, 22, 1–9. [Google Scholar] [CrossRef]
- Apel, H.; Thieken, A.H.; Merz, B.; Blöschl, G. Natural Hazards and Earth System Sciences Flood risk assessment and associated uncertainty. Nat. Hazards Earth Syst. Sci. 2004, 4, 295–308. [Google Scholar] [CrossRef]
- Mel, R.A.; Viero, D.P.; Carniello, L.; D’Alpaos, L. Multipurpose use of artificial channel networks for flood risk reduction: The case of the waterway Padova-Venice (Italy). Water 2020, 12, 1609. [Google Scholar] [CrossRef]
- Li, C.; Cheng, X.; Li, N.; Du, X.; Yu, Q.; Kan, G. A framework for flood risk analysis and benefit assessment of flood control measures in Urban Areas. Int. J. Environ. Res. Public Health 2016, 13, 787. [Google Scholar] [CrossRef] [PubMed] [Green Version]
- Thomas, H.; Nisbet, T. Modelling the hydraulic impact of reintroducing large woody debris into watercourses. J. Flood Risk Manag. 2012, 5, 164–174. [Google Scholar] [CrossRef]
- Pagliara, S.; Carnacina, I. Bridge pier flow field in the presence of debris accumulation. Proc. Inst. Civ. Eng. Water Manag. 2013, 166, 187–198. [Google Scholar] [CrossRef]
- Diakakis, M.; Boufidis, N.; Salanova Grau, J.M.; Andreadakis, E.; Stamos, I. A systematic assessment of the effects of extreme flash floods on transportation infrastructure and circulation: The example of the 2017 Mandra flood. Int. J. Disaster Risk Reduct. 2020, 47, 101542. [Google Scholar] [CrossRef]
- Panici, D.; Kripakaran, P.; Djordjević, S.; Dentith, K. A practical method to assess risks from large wood debris accumulations at bridge piers. Sci. Total Environ. 2020, 728, 1–10. [Google Scholar] [CrossRef]
- Pinheiro, V.B.; Naghettini, M.; Palmier, L.R. Uncertainty estimation in hydrodynamic modeling using Bayesian techniques. Rev. Bras. Recur. Hidricos 2019, 24, e38. [Google Scholar] [CrossRef]






| Flood Protection Works | No | Yes | ||||||||
|---|---|---|---|---|---|---|---|---|---|---|
| T(y) | 20 | 50 | 100 | 150 | 200 | 20 | 50 | 100 | 150 | 200 |
| t = 6 h | S20-06 | S50-06 | S100-06 | S150-06 | S200-06 | W20-06 | W50-06 | W100-06 | W150-06 | W200-06 |
| t = 12 h | S20-12 | S50-12 | S100-12 | S150-12 | S200-12 | W20-12 | W50-12 | W100-12 | W150-12 | W200-12 |
| t = 18 h | S20-18 | S50-18 | S100-18 | S150-18 | S200-18 | W20-18 | W50-18 | W100-18 | W150-18 | W200-18 |
| T (y)—St Soures | T (y)—St Agia Aikaterini | |||||||||
|---|---|---|---|---|---|---|---|---|---|---|
| t (h) | 20 | 50 | 100 | 150 | 200 | 20 | 50 | 100 | 150 | 200 |
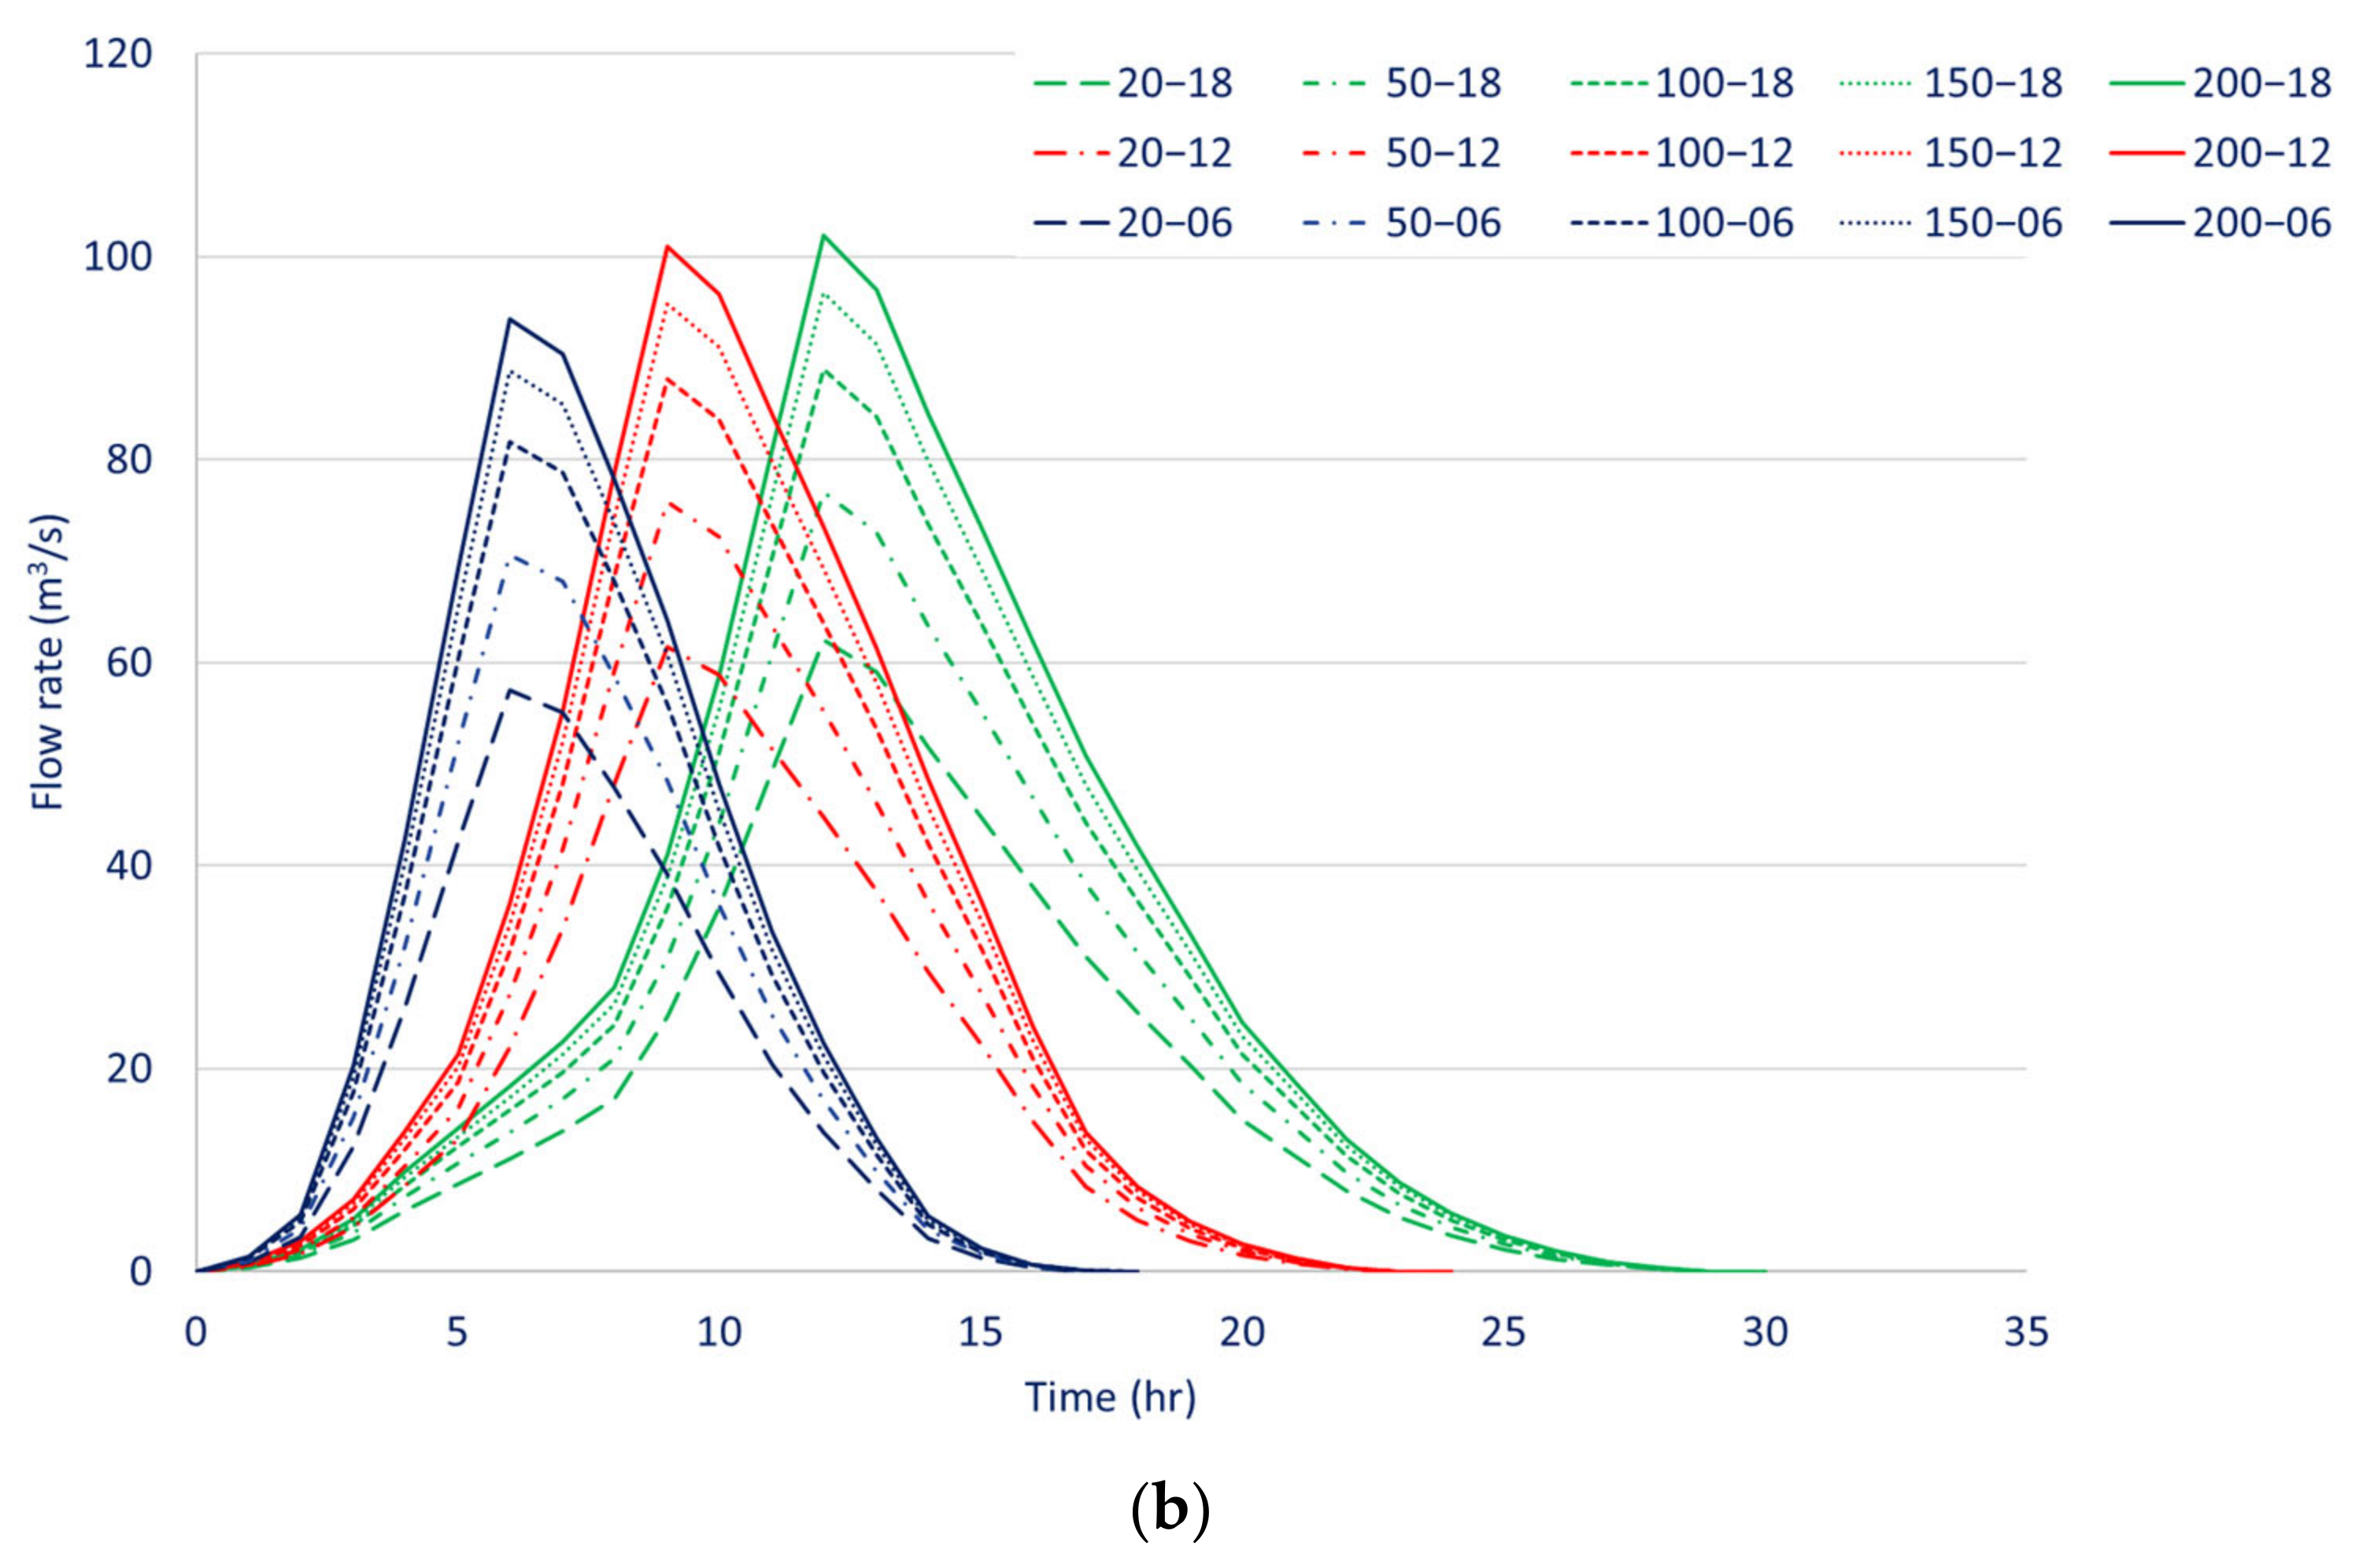
| 6 | 32.31 | 39.82 | 46.11 | 50.04 | 52.96 | 57.27 | 70.59 | 81.72 | 88.7 | 93.86 |
| 12 | 38.13 | 46.99 | 54.41 | 59.05 | 62.49 | 58.77 | 75.88 | 87.85 | 95.35 | 100.9 |
| 18 | 39.39 | 48.55 | 56.21 | 61.00 | 64.56 | 62.26 | 76.73 | 88.83 | 96.41 | 102.03 |
| U (m/s) | ||||
|---|---|---|---|---|
| D (m) | <0.5 | 0.5–2.0 | 2.0–4.0 | >4.0 |
| <0.2 | Very Low (0.2) | Very Low (0.2) | Very Low (0.2) | Low (0.4) |
| 0.2–0.5 | Low (0.4) | Low (0.4) | Medium (0.6) | Medium (0.6) |
| 0.5–1.0 | Low (0.4) | Medium (0.6) | High (0.8) | High (0.8) |
| 1.0–1.5 | Medium (0.6) | Medium (0.6) | High (0.8) | Very high (1.0) |
| 1.5–2.0 | High (0.8) | High (0.8) | Very high (1.0) | Very high (1.0) |
| >2.0 | Very high (1.0) | Very high (1.0) | Very high (1.0) | Very high (1.0) |
| Independent Variable | Description |
|---|---|
| LW | Light well (Cour anglaise) |
| UGR | Garage ramps leading to underground spaces |
| PLT1 and PLT2 | Pillars (pilotis) and their relevant position; PLT1 denotes pilotis below ground level and PLT2 denotes pilotis at ground level |
| BLO1 and BLO2 | Relevant position of the buildings’ lower openings (windows or doors); BLO1 denotes openings below ground level and BLO2 denotes openings at ground level |
| ADJ1 | Adjacency to other buildings (measured as the number of sides exposed to open space); in this case, ADJ1 denotes 1 open side. |
| T(y) | 20 | 50 | 100 | 150 | 200 |
|---|---|---|---|---|---|
| t = 6 h | 93 | 77 | 69 | 61 | 56 |
| t = 12 h | 89 | 73 | 62 | 56 | 54 |
| t = 18 h | 89 | 73 | 62 | 55 | 53 |
| Flood Protection Works | No | Yes | No | Yes | No | Yes | No | Yes | No | Yes |
|---|---|---|---|---|---|---|---|---|---|---|
| T(y) | 20 | 20 | 50 | 50 | 100 | 100 | 150 | 150 | 200 | 200 |
| t = 6 h | 0.75 | 0.19 | 0.79 | 0.33 | 0.82 | 0.47 | 0.83 | 0.58 | 0.85 | 0.62 |
| t = 12 h | 0.77 | 0.24 | 0.80 | 0.37 | 0.83 | 0.57 | 0.85 | 0.63 | 0.86 | 0.65 |
| t = 18 h | 0.77 | 0.24 | 0.80 | 0.37 | 0.83 | 0.58 | 0.85 | 0.64 | 0.86 | 0.65 |
| T(y) | 20 | 50 | 100 | 150 | 200 |
|---|---|---|---|---|---|
| t = 6 h | 75 | 58 | 43 | 30 | 27 |
| t = 12 h | 69 | 54 | 31 | 27 | 24 |
| t = 18 h | 68 | 54 | 31 | 25 | 24 |
| Flood Protection Works | No | Yes | No | Yes | No | Yes | No | Yes | No | Yes |
|---|---|---|---|---|---|---|---|---|---|---|
| T(y) | 20 | 20 | 50 | 50 | 100 | 100 | 150 | 150 | 200 | 200 |
| t = 6 h | 0.28 | 0.07 | 0.28 | 0.12 | 0.29 | 0.16 | 0.30 | 0.19 | 0.31 | 0.21 |
| t = 12 h | 0.28 | 0.10 | 0.29 | 0.13 | 0.30 | 0.19 | 0.31 | 0.22 | 0.31 | 0.23 |
| t = 18 h | 0.28 | 0.10 | 0.29 | 0.13 | 0.30 | 0.19 | 0.31 | 0.22 | 0.32 | 0.23 |
| T(y) | 20 | 50 | 100 | 150 | 200 |
|---|---|---|---|---|---|
| t = 6 h | 74 | 58 | 46 | 36 | 32 |
| t = 12 h | 66 | 56 | 37 | 30 | 27 |
| t = 18 h | 66 | 56 | 36 | 29 | 27 |
Publisher’s Note: MDPI stays neutral with regard to jurisdictional claims in published maps and institutional affiliations. |
© 2022 by the authors. Licensee MDPI, Basel, Switzerland. This article is an open access article distributed under the terms and conditions of the Creative Commons Attribution (CC BY) license (https://creativecommons.org/licenses/by/4.0/).
Share and Cite
Mitsopoulos, G.; Diakakis, M.; Bloutsos, A.; Lekkas, E.; Baltas, E.; Stamou, A. The Effect of Flood Protection Works on Flood Risk. Water 2022, 14, 3936. https://doi.org/10.3390/w14233936
Mitsopoulos G, Diakakis M, Bloutsos A, Lekkas E, Baltas E, Stamou A. The Effect of Flood Protection Works on Flood Risk. Water. 2022; 14(23):3936. https://doi.org/10.3390/w14233936
Chicago/Turabian StyleMitsopoulos, Georgios, Michalis Diakakis, Aristeides Bloutsos, Efthymios Lekkas, Evangelos Baltas, and Anastasios Stamou. 2022. "The Effect of Flood Protection Works on Flood Risk" Water 14, no. 23: 3936. https://doi.org/10.3390/w14233936


