
Optimal Positioning of RTC Actuators and SuDS for Sewer Overflow Mitigation in Urban Drainage Systems
by
 ,
,
Marco Eulogi
1,*, 
Sonja Ostojin
2,
Pete Skipworth
2,
Stefan Kroll
3,
James D. Shucksmith
1 and 
Alma Schellart
1 1
Department of Civil and Structural Engineering, University of Sheffield, Sheffield S1 3JD, UK
2
Environmental Monitoring Solutions Ltd., Unit 7, President Buildings, Savile Street East, Sheffield S4 7UQ, UK
3
Aquafin NV, R&D, Dijkstraat 8, 2630 Aartselaar, Belgium
*
Author to whom correspondence should be addressed.
Water 2022, 14(23), 3839; https://doi.org/10.3390/w14233839
Submission received: 19 October 2022
/
Revised: 10 November 2022
/
Accepted: 20 November 2022
/
Published: 25 November 2022
(This article belongs to the Special Issue Modeling and Simulation of Urban Drainage Systems)
Abstract
:Real-time control (RTC) and sustainable drainage systems (SuDS) can be implemented simultaneously to enhance the performance of existing urban drainage systems (UDS). However, significant challenges arise when choosing the optimal locations due to hydraulic interactions between the different interventions and the high number of possible configurations. This paper presents a novel optimization–simulation framework to optimize the spatial allocation of flow control devices (FCDs) combined with SuDS for combined sewer overflow (CSO) spill mitigation within UDS. Optimal intervention schemes were identified by a genetic algorithm (GA), combining different numbers of FCDs installed in existing manholes with simplified SuDS implemented in different portions of the catchment. The methodology was tested on two case-study catchments with different characteristics to mitigate CSO spills during synthetic storm events. FCD-SuDS configurations were then validated during continuous rainfall series, resulting in CSO spill volumes reduction ranging between 11% and 45% compared to the baseline networks. The results demonstrate how the GA-based method can efficiently identify optimal placement schemes within UDS characterized by different distributions of in-pipe storage potential as well as hydrological responses to rainfall-runoff events, enhancing the combined benefits of the two decentralized solutions for mitigating CSO spills.
1. Introduction
The enlargement of impervious areas and the increase in the frequency of extreme precipitation due to climate change pose increasing challenges for the management and operation of urban drainage systems (UDS) [1,2,3]. Without adapting UDS, the frequency and magnitude of combined sewer overflows (CSOs) are expected to increase. Overflow discharges are recognized as a source of pollution for receiving water bodies, and CSO spill reduction is promoted and supervised by regulatory bodies [4,5]. Conventional urban drainage solutions consider the enlargement of the drainage infrastructure or the expansion of the storage capacity with construction-based solutions. Both feature high up-front investment costs and are coming under increased scrutiny due to potentially high embedded carbon and/or carbon emissions associated with pumping [6,7]. Therefore, there is increasing interest in the water sector in developing decentralized and distributed technologies to manage sources of pollution and runoff volumes [8] as well as to increase the flexibility of existing drainage infrastructure in response to future climate trends [9].
SuDS (sustainable drainage systems), also known as LIDs (low-impact developments) or BMPs (best management practices), are distributed source controls that are implemented to manage runoff volumes within urban catchments [10]. These systems aim to enhance natural processes such as infiltration, percolation, evaporation, and attenuation with green infrastructures, reducing or removing stormwater volumes entering the existing sewage system. SuDS may include green roofs, bioretention cells, permeable pavement, vegetated swales, and infiltration trenches, among others, and are known to provide water quality, biodiversity, and amenity benefits [11]. However, the widespread implementation and management of distributed LID-BMPs-SuDS practices may be challenging due to space availability, especially in highly urbanized areas [12], and spatially varied socioeconomic constraints (e.g., lack of public interest and support, and private and public lands owned by different parties) [13,14].
Another alternative to increase the capacity of UDS are real-time control (RTC) systems. RTC is designed to achieve the real-time management of existing UDS through the continuous monitoring of process data (e.g., water levels and flow) and the dynamic adjustment of flow conditions with flow control devices (FCDs, e.g., pumps, sluice gates, and moveable weirs) [15,16]. RTC systems can be classified as local control systems or system-wide control systems based on their complexity and control scope [15,17]. RTC systems can potentially be a cost-effective solution, depending on the type and size of the system. The practical applications of RTC systems have mostly been documented for large case studies, with many operators still reluctant to adopt RTC systems [18]. In engineering practice, the opinion often prevails that RTC requires more effort than conventionally operated systems [19].
CENTAUR is a local RTC system that was designed to mitigate CSO spills and/or urban flooding in sewer networks, increasing the performance of existing drainage infrastructure [20,21]. CENTAUR consists of FCDs, inserted into existing manholes, that mobilize the existing in-pipe storage capacity to regulate the water level at predefined target locations (e.g., the CSO chamber and manholes prone to urban flooding). An FCD is composed of a movable sluice gate coupled with an emergency overflow weir above the sluice gate, which allows the flow to bypass the sluice gate in the case of extreme events. The gradual opening and closing of the sluice gate are controlled by an autonomous fuzzy logic algorithm based on real-time in-sewer-level information, which is more flexible than traditional PID (proportional integral derivative) controllers when input parameters are highly variable. The emergency overflow weir prevents sewer overflow upstream of the FCD installation site. FCDs can easily be relocated to different locations (i.e., manholes) with limited civil works to address changes in land use and future climate trends. Therefore, CENTAUR offers a flexible solution to increase the resilience of UDS when managing stormwater volumes during rainfall events, with low costs when compared to traditional alternatives (e.g., storage tanks).
The performance of both SuDS and RTC structures for CSO spill mitigation can be maximized by optimizing their spatial distribution, type, and size. However, due to the high number of possible implementation schemes, especially in large catchments, as well as the large number of constraints (e.g., physical and socioeconomic) that are potentially involved in the selection, traditional trial-and-error approaches often deliver suboptimal designs, and optimization-based methodologies are preferred [12]. Numerous studies have considered the spatial optimization of either SuDS or distributed RTC systems, which is commonly achieved by coupling SWMM or SUSTAIN models with evolutionary algorithms in a simulation–optimization framework [22,23,24,25]. An extensive bibliometric review of design optimization (allocation, type, and dimensioning) and the performance evaluation of multiple SuDS in UDS can be found in [26]. Similarly, the efficient placement of flow control devices is a crucial step in the design of cost-effective RTC systems in UDS [27,28]. Recently, [29] developed a simulation–optimization framework to identify optimal FCD placement schemes for overflow spill mitigation at a single CSO, combining a genetic algorithm with an SWMM model. In [30], the authors further developed the method, extending its applicability to larger UDS featuring multiple CSO locations. However, limited research has been found on aiming to understand how RTC and SuDS systems interact hydraulically and/or achieve added benefits through combining these systems. Experimental and modeling studies reviewed by [31] demonstrated how the potential benefits achieved by nature-based solutions (i.e., detention basins, bioretention cells, and green roofs) can be enhanced by coupling such systems with RTC. For example, in [32] the performance of stormwater detention basins was improved through the dynamic control of regulators (i.e., outlet valves) using rainfall forecasts, while [33] conducted an experimental study on the application of RTC systems to stormwater biofilters for rainfall harvesting and reuse. In [8], the authors found that the RTC performance in reducing CSO spill volumes, consisting of FCDs installed at different locations within the sewer network, could be further enhanced by coupling the system with SuDS implemented at the catchment level.
The above studies either refer to more traditional in-sewer RTC systems such as PID controllers and model predictive control or the RTC of the SuDS itself. Hence, there is currently a lack of understanding concerning the hydraulic interactions between local autonomous FL-controlled RTC and SuDS systems within UDS and how they affect optimal location selection for these systems at the urban catchment scale. As far as the authors are aware, to date, no robust and efficient methodology to design implementation strategies for local autonomous FL-controlled RTC combined with SuDS systems to achieve a given level of performance can be found in the literature. Furthermore, most existing spatial optimization studies focus on single case-study catchments, with little consideration of how the type and nature of the catchment influence the effectiveness of the solution. Current challenges include the time-consuming nature of optimization in large UDS and the need to accurately simulate the hydraulics within the UDS to fully capture the interactions between different systems (e.g., green infrastructure plus FCDs).
This research aimed to investigate the hydraulic interaction and potential enhancement when implementing both CENTAUR local RTC and SuDS for CSO spill volume reduction in two case-study catchments with varying characteristics and to develop a methodology for the placement of such schemes to achieve a given level of performance. The specific objectives were to (1) adapt a genetic algorithm methodology for the optimization of the placement of RTC actuators as well as simplified SuDS systems in a UDS; (2) simulate the performance of different optimized combinations of SuDS and RTC solutions for CSO spill mitigation in two study catchments against benchmark networks with no intervention; and (3) validate the performance of RTC coupled with SuDS using a continuous rainfall time series and consider the relative performance in the different catchments.
2. Methodology
2.1. Case Studies
The performance of the CENTAUR RTC and SuDS systems in reducing CSO spills was evaluated in two case studies: the Arendonk catchment (Flanders, Belgium) and the Zona Central catchment (Coimbra, Portugal). Table 1 provides summary details of each catchment. The case studies were modeled using EPA Storm Water Management Model (SWMM) [34], a dynamic rainfall-runoff and network hydraulics simulation model that is widely used for optimization problems in sewer networks. SWMM hydraulic simulations were carried out using the MatSWMM interface [35]. MatSWMM is an open-source software package that further extends the default functionalities of RTC systems in SWMM models, allowing the FCDs to be controlled by the CENTAUR fuzzy logic algorithm. The Arendonk model was mostly a flat catchment, with pipe slopes varying between −0.044 m/m and 0.88 m/m (90% between 0 m/m and 0.006 m/m) and a total of 16 CSOs distributed in different portions of the catchment. The Zona Central model featured steep slopes in the upper/mid portion of the catchment, leading into more gentle lower slopes (pipe slopes varying between −0.51 and 2.26 m/m, 90% between −0.08 and 0.22 m/m). When runoff volumes exceeded the maximum hydraulic capacity of the sewer network, flows were discharged at a single CSO located immediately upstream of the final outlet. Further detail on the two case-study catchments can be found in [29,30]. In both case-study catchments, the optimal placement schemes were identified by minimizing the overflow volumes discharged at single CSOs, which were located close to the final outlet in the Zona Central model and in the central portion of the catchment in the Arendonk model.
2.2. SuDS Zones
SuDS can take many forms (e.g., infiltration trenches, bioretention basins, green roofs, and swales), each exhibiting different hydrological and hydraulic mechanisms for managing runoff volumes. For this investigation, SuDS were simulated within a subcatchment by converting the impervious area into a pervious area. While the reduction in the impervious area was a highly simplified representation of SuDS, this provided a reasonable representation of the infiltration-based structures within subcatchments. This study investigated a higher-level planning and design case of CSO spill volume reduction and not the detailed design of the SuDS themselves.
When implementing sustainable drainage systems within a catchment, SuDS were applied to groups of subcatchments (SuDS zones) instead of single subcatchments. A SuDS zone corresponded to a group of subcatchments in which a fixed impervious area (ha) was converted into a pervious area. This ensured that an equivalent rainfall depth was collected and processed in each SuDS zone (homogeneous rainfall intensity within the catchments), providing a more rigorous comparison between SuDS placement schemes. Moreover, the implementation of green infrastructure into clusters of subcatchments allowed us to drastically reduce the number of combinations of numbers and locations of SuDS, limiting the computational time required by the optimization-based solver to identify the optimal placement schemes.
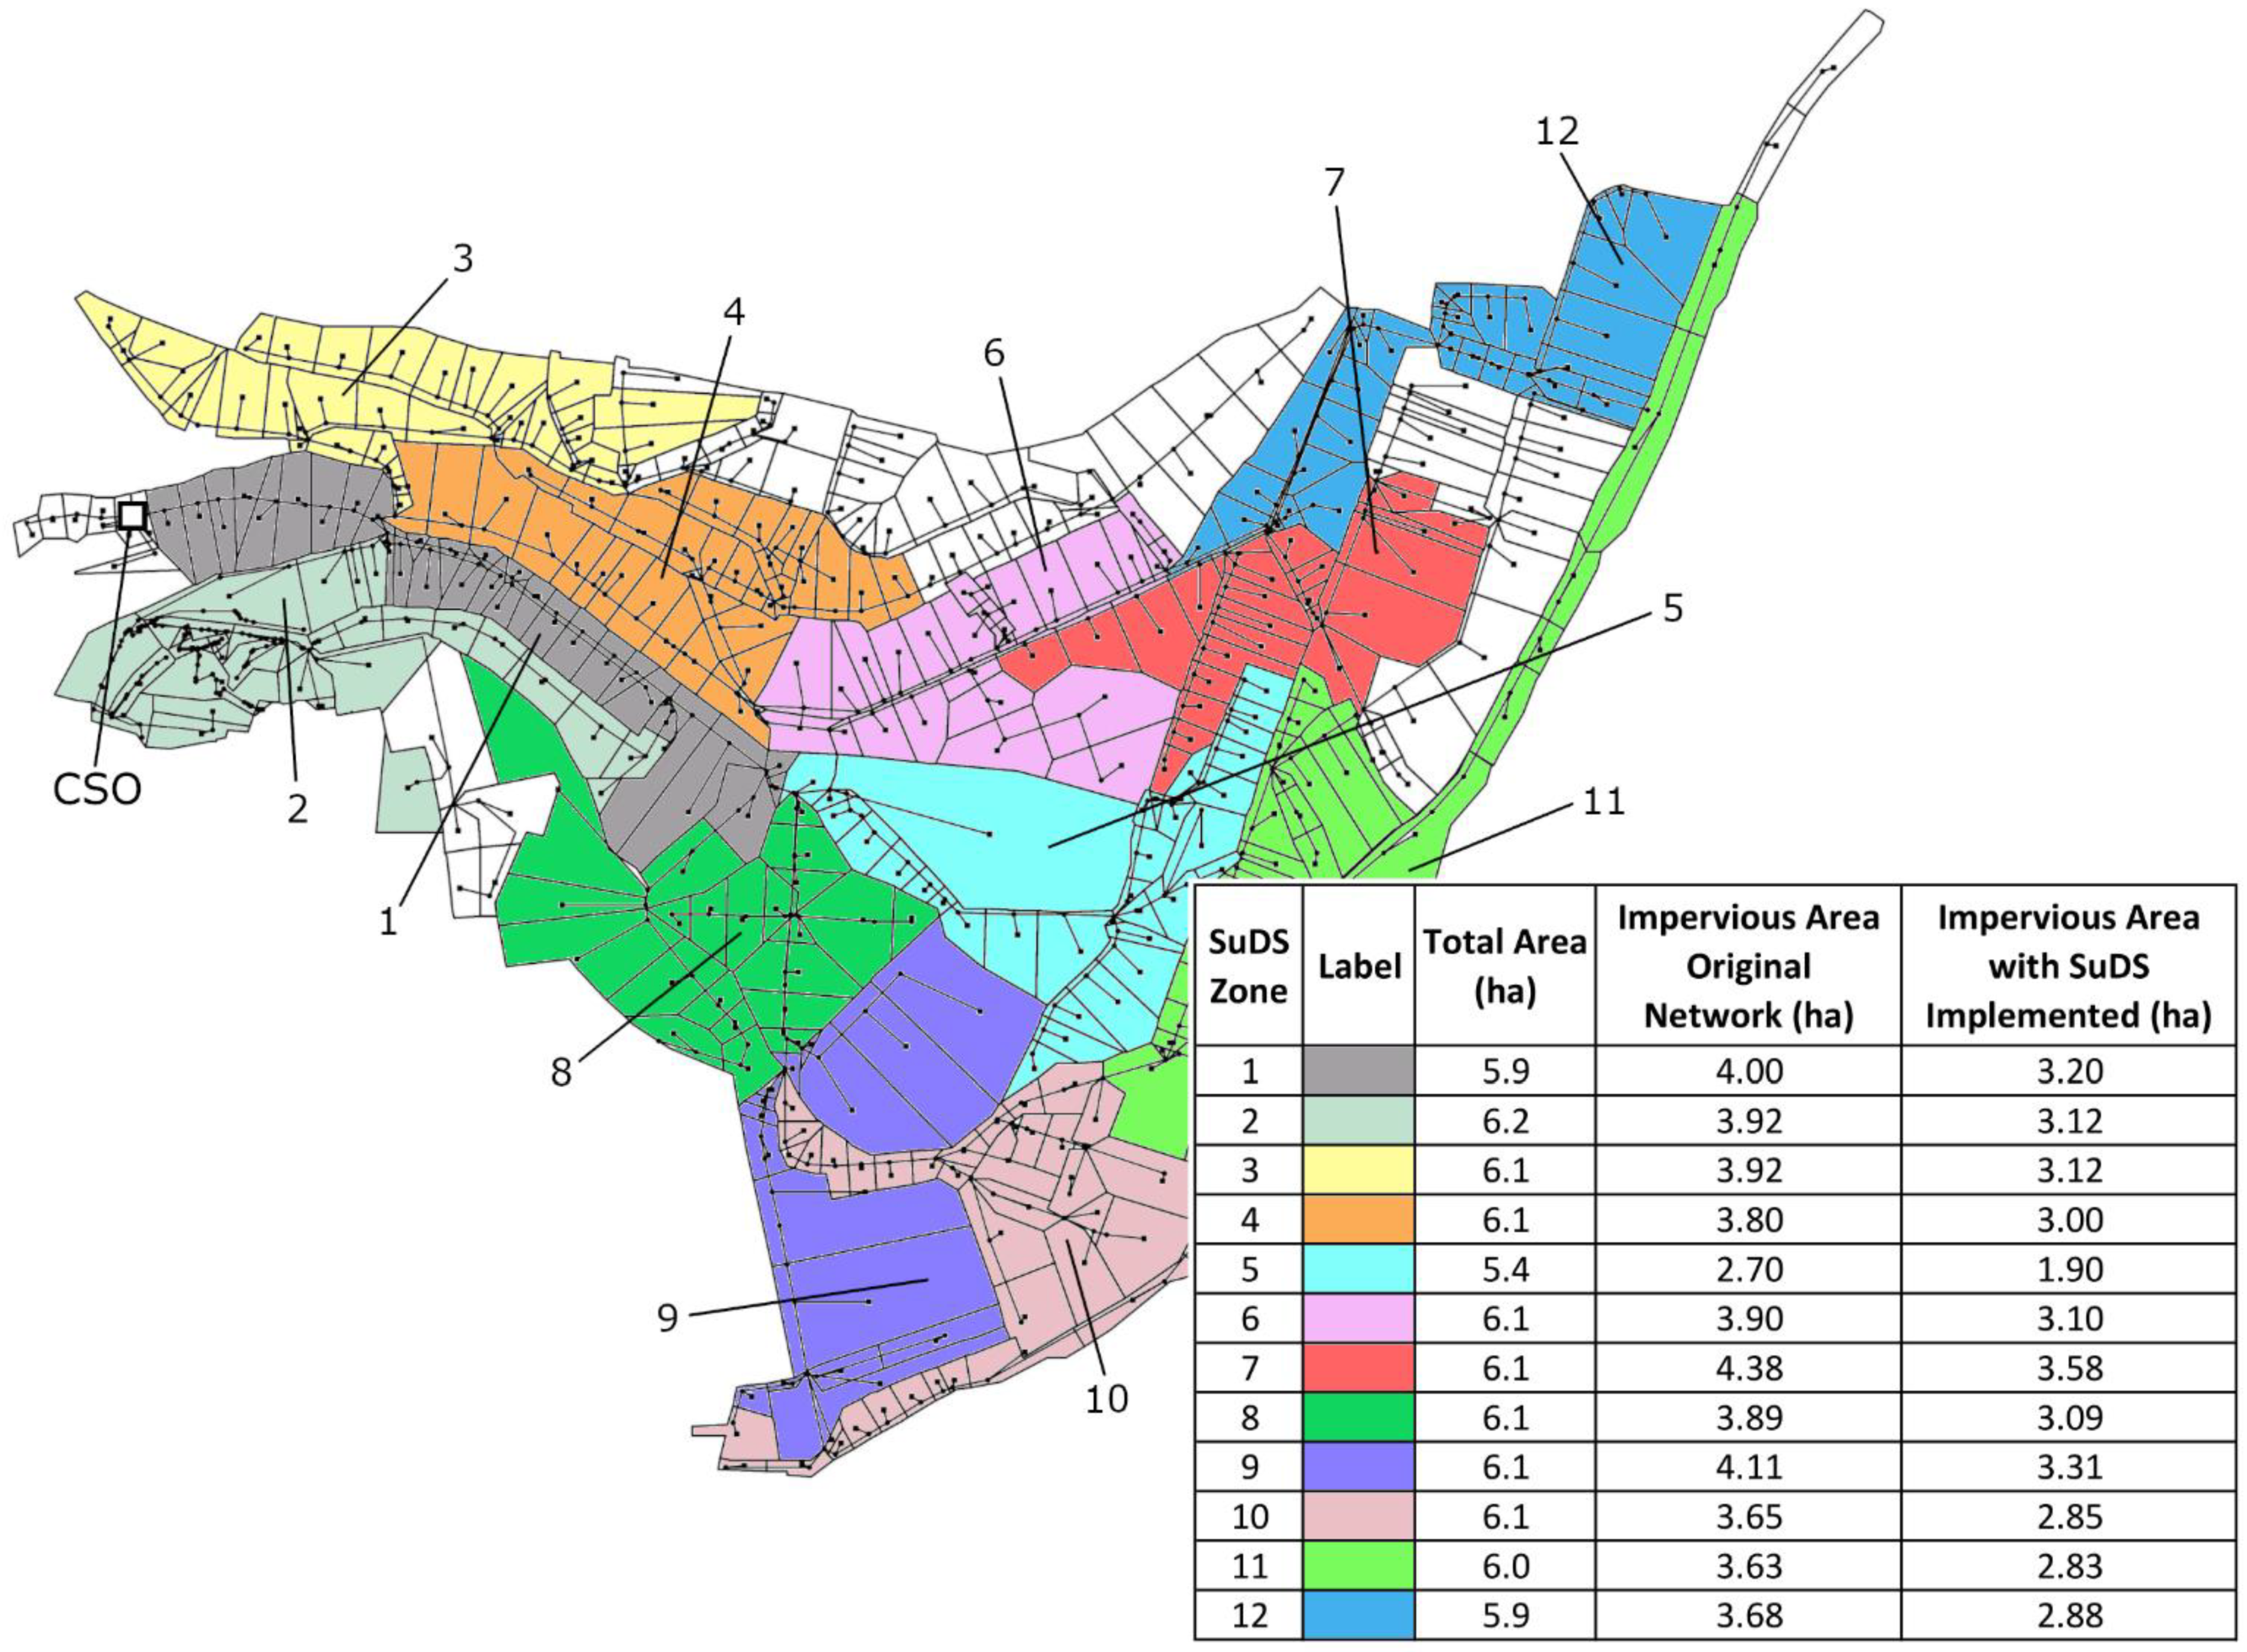
The subdivision of the Arendonk and Zona Central catchment models into SuDS zones is shown in Figure 1 and Figure 2, respectively. In this study, the SuDS zones featured similar total surface areas (3 ± 0.3 ha in the Arendonk model and 6 ± 0.6 ha in the Zona Central model) and were selected so that the runoff volumes generated in each SuDS zone were collected by the same branches within the sewer networks (SuDS zones linked to different segments of the sewer network). While the optimization-based methodology could be performed using different clusters of subcatchments, the proposed selection of SuDS zones ensured a rigorous evaluation of the hydraulic interaction between green infrastructure at the catchment level and FCDs at the sewer-network level. The numbers and positions of SuDS zones were selected prior to the optimization process to ensure an efficient trade-off between the computational load and the area of search of the optimization-based method as well as feasible and realistic implementations of green infrastructures within the catchments (~20% of the impervious area converted to the pervious area in each SuDS zone).
2.3. Flow Control Devices
The potential installation sites for flow control devices were manholes positioned upstream of the CSO spill to be regulated by the RTC system, and they were connected to one entering conduit and one exiting conduit. FCDs were modeled as circular sluice gates (orifices) coupled with rectangular overflow weirs (links). The orifice–link element was implemented within the SWMM model by connecting the FCD node to an auxiliary node (with the same properties, e.g., invert level, maximum depth, and initial depth) positioned immediately upstream. The sluice gate diameter was set to be equal to the upstream pipe diameter to avoid restrictions in the cross-section. An overflow weir above the gate acted as a fail-safe in the case of gate failure, preventing urban flooding upstream of the FCD location. In the Zona Central sewer network, the weir heights were calculated using a synthetic design based on Portuguese IDF curves [36] (return period of 50 years and duration of 45 min), and in the Arendonk sewer network they were calculated using a historical rainfall event recorded in the year 2004 (return period of 14 years and duration of 27 min).
While FCDs hydraulically interacted to reduce CSO spill volumes during storm events, each actuator was autonomous and was independently operated by the CENTAUR FL algorithm. The FL algorithm considered the water level at the CSO chamber and immediately upstream of the FCD installation site. During rainfall events, each FCD opening degree was computed at a predefined time step of 30 s to properly capture the fast runoff processes and the quick response time of the case-study catchments, varying between 0% (fully closed) and 100% (fully open). The CENTAUR control algorithm was linked with the SWMM model in the Matlab environment, as described by [37].
2.4. Selection of Optimal SuDS and FCD Locations
A scenario-based analysis was conducted to evaluate the effectiveness of flow control devices and SuDS in mitigating overflow volumes as well as to investigate the hydraulic interaction between the two different technologies when managing stormwater volumes during rainfall events. Three scenarios are thus presented based on the type of solution implemented: RTC only, SuDS only, and RTC coupled with SuDS. The analysis was carried out for different numbers of installed FCDs and/or SuDS zones, reducing the overflow volumes discharged at a single CSO in the two case-study catchments during the synthetic storm events. The placement schemes were then validated over continuous rainfall series. The overflow spill volume reduction was calculated by comparing the CSO spill volumes with and without the FCDs and/or SuDS implemented within the sewer network models.
2.4.1. Genetic Algorithm
The spatial allocation of SuDS and/or FCDs within the urban drainage systems was optimized using a genetic algorithm (GA). While the type, size, and location of SuDS can be optimized simultaneously [38], more simplified approaches can be used for a rapid assessment of potential intervention schemes for decentralized runoff management solutions, such as fixed combinations of BMPs [39,40] or fixed-size BMP units with constant design configurations [23,24]. Moreover, a significant reduction in the computational load and the level of complexity was achieved by representing the implementation of BMP/LID with a binary 0/1 decision variable (0 = measure not implemented; 1 = measure implemented) [41,42,43]. The type selection, design, and sizing could also be completely screened out, solely optimizing the location of BMPs in a binary optimization approach [44]. A similar approach has been implemented by [29,30] to identify optimal FCD placement schemes for overflow spill mitigation in sewer networks, combining a genetic algorithm with an SWMM model: the implementation of an FCD at a potential control location was represented with the binary decision variable (0 = FCD not implemented; 1 = FCD implemented), providing a simple screening-level methodology to design FCD placement schemes for a wide range of sewer systems.
In this study, the implementation of a flow controller in a given potential installation site (i.e., a manhole) or an SuDS in a given cluster of subcatchments (i.e., an SuDS zone), was represented by a binary 0/1 integer variable (0 = FCD/SuDS not implemented; 1 = FCD/SuDS implemented). In the case of a benchmark network with RTC, FCD placement schemes were represented by the one-dimensional binary array , in which corresponds to the i-th FCD location tested by the GA within the sewer network model. In the case of a benchmark network with SuDS, placement schemes were represented by the one-dimensional binary array (impervious area decreased in the i-th SuDS zone). In the case of an RTC combined with SuDS, the two binary arrays were combined into a single binary one-dimensional string (Figure 3) optimized by the GA to minimize a single-objective function (CSO spill volume (m3)). In each scenario (RTC only, SuDS only, and RTC coupled with SuDS), the number of flow controllers and/or SuDS zones that were implemented was forced using the following linear equality constraints: number of FCDs implemented (m was equal to the total number of FCD locations evaluated) and number of SuDS zones implemented (n was equal to the total number of SuDS zones evaluated). Through initial trials, a population size per GA generation equal to 200 was found to provide an efficient trade-off between computational time, search space, and the rate of convergence. The GA solver was implemented using the Global Optimization Toolbox available in Matlab 2018a [45] to solve the mixed-integer constrained optimization problem. The mutation rates and crossover were 0.1 and 0.9, respectively. The GA optimization runs stopped if the average relative change in the CSO spill volume was less than 1 m3 or if the number of GA generations was greater than 20.
The performance of potential RTC and/or SuDS placement schemes was evaluated through hydraulic analysis, linking the GA solver to the MatSWMM hydraulic simulation interface in the Matlab environment. The optimization was performed using standard computational resources (Windows 10 computer, Intel E5-2637 processor, and 32GB of RAM). Hydraulic simulations were carried out using the dynamic wave routing method (routing step set to 15 s and minimum variable time step set to 0.5 s), so the backwater effect, flow reversal, and pressurized flow generated by partially or fully closed actuators were considered during the hydraulic analysis.
2.4.2. FCD Locations Evaluated by GA
For the investigated case-study network, the wide range of possible combinations of the numbers and locations of FCDs and/or SuDS was found to significantly limit the capability of the optimization-based framework to select optimal placement schemes within a feasible timeframe. This was due to the computational runtime required to run a hydraulic simulation of a drainage model and assess potential candidates, which is by far the most time-consuming element for optimization problems in UDS [46]. Therefore, in order to reduce the search space of all feasible solutions evaluated by the GA solver, FCD locations with insufficient in-sewer storage capacity were discarded from the GA-based optimization. This prescreening analysis based on pipe storage potential, which is used in the early stages of RTC designs in sewer networks [18,28,29,30], results in a drastic reduction in computational load, as FCD locations judged to be highly unlikely to have significant impacts in reducing CSO spills are discarded prior to the GA optimization. In this study, the in-sewer storage capacity corresponded to the maximum pipe volume that could be mobilized by the actuator to store stormwater volumes, calculated as the sum of the in-pipe volumes upstream of the FCD location under the reference level, (m A.D.). For each FCD location that was evaluated, the reference level, , was computed under the static assumption (horizontal energy line) and was equal to the ground level decreased by a safety margin (0.1 m, see [28]).
In the Zona Central model, the prescreening analysis based on in-sewer storage potential reduced the number of FCD locations tested by the GA from 389 to 25 (minimum storage capacity set to 50 m3), as shown by [29]. On the contrary, the prescreening analysis showed a limited impact in reducing the number of FCD locations tested in the Arendonk model due to the mostly flat catchment (90% of the pipe slopes varied between 0 m/m and 0.006 m/m), which resulted in the homogeneous distribution of in-sewer storage capacity within the drainage system. Therefore, additional constraints were added to the selection based on the positions of the actuators within the sewer network, as proposed by [30]: FCD locations featuring in-sewer storage volumes greater than 100 m3 were selected along individual tributary branches only if positioned at the most downstream manholes or positioned further upstream along the branches if different in-sewer storage capacity was mobilized by the flow controllers. The total number of FCD locations tested by the GA in the Arendonk model was then decreased from 533 to 32. The total number of FCD locations and SuDS zones tested by the GA are summarized in Table 2.
2.5. Rainfall Events
The FCD and SuDS placement schemes were optimized by the GA to minimize the CSO spill volumes discharged during a synthetic storm event. In the Arendonk model, the synthetic storm was selected following the Flanders Environment Agency (VMM) design guidelines for sewer systems [47], with a return frequency of seven times per year (storm occurring seven times per year) and a duration of 48 h (time of aggregation: 5 min). In the Zona Central model, the synthetic storm was based on Portuguese IDF curves [36] and was obtained using the alternating block method [48], with a return period equal to 1 year and a duration of 30 min (time of aggregation: 5 min).
The effectiveness of the FCDs controlled by the RTC and SuDS in reducing CSO spill volumes was then evaluated during continuous rainfall time series. Different FCD-SuDS configurations were validated using regional long-term rainfall series (temporal resolution of 1 min): a 3-year continuous rainfall series for the Arendonk catchment model (January 2006–December 2008 [18]) and a 1-year continuous rainfall series for the Zona Central catchment model (January 2017–December 2017). Hydraulic simulations were carried out using regional rainfall data available at Waterinfo.be. (n.d.) (station ‘Herentals’) [49] and shared by the water utility Aqua de Coimbra (personal communication, 2 November 2021) in the Arendonk and Zona Central catchment models, respectively. The rainfall temporal resolution and the RTC resolution (frequency of water level reading) were found to be suitable to properly capture the fast runoff processes and response times of the sewage systems during storm events.
3. Results
3.1. Arendonk Catchment
The optimal FCDs and SuDS locations selected by the GA for the synthetic storm in the Arendonk model are shown in Figure 4 for each tested configuration. In each investigated RTC configuration, the FCDs were placed in different portions of the sewer network, with different pipe branches mobilized by the flow controllers to store stormwater volumes. The GA did not always favor FCD locations close to the CSO regulated by the RTC system. Flow controllers were instead placed in the upstream portion of the catchment in most of the investigated configurations. In the benchmark with SuDS scenario, SuDS were mostly located in the downstream and central portions of the catchment. When combining RTC with SuDS, flow controllers and SuDS zones were placed in separate portions of the catchment.
When reducing CSO spill volumes solely based on RTC, FCD placement schemes were found to be inclusive sets of solutions, such that FCDs could be deployed in stages while maintaining an optimal spatial layout. For example, FCD location #1 was selected by the GA regardless of the total number of FCDs implemented to reduce the CSO spill volumes. In contrast, non-inclusive sets of solutions were obtained in the benchmark with SuDS and benchmark with RTC + SuDS scenarios, in which the implementation schemes were found to drastically change depending on the types and numbers of intervention measures implemented. When combining the RTC with SuDS, different FCD locations were obtained, depending on the number of SuDS zones that were implemented. For example, when positioning one FCD within the catchment, FCD location #2 was selected by the GA when combining the RTC with two SuDS zones (configuration #8a), while FCD location #1 was preferred when combining the RTC with three SuDS zones (configuration #9a). Similarly, in the benchmark with RTC + SuDS scenario, different SuDS locations were found by the GA, depending on the number of FCDs that were implemented.
During the designed rainfall event, the spill volume at the target CSO was found to be 731 m3. The CSO spill volume reductions obtained in the Arendonk catchment for each configuration are shown in Figure 5 based on the number of FCDs and/or SuDS that were implemented. Overall, the implementation of RTC provided a higher CSO spill volume reduction compared to the implementation of SuDS. RTC enabled us to reduce CSO spill volumes by between 31% (one FCD) and 91% (three FCDs), while the implementation of simplified infiltration-based SuDS provided CSO spill volume reductions ranging between 5% and 21% (one SuDS zone and three SuDS zones, respectively). The performance of the existing drainage infrastructure could be significantly improved by combining both intervention measures, with CSO discharges completely prevented when coupling three FCDs with one SuDS zone.
The results shown in Figure 5 also demonstrate how the combined implementation of RTC and SuDS led to a CSO spill volume reduction greater than the sum of the individual performances obtained by the two intervention measures. For example, the overflow volumes discharged in the original network were reduced by 31% by implementing one FCD and by 5% by implementing one SuDS zone, while the placement scheme with one FCD and one SuDS provided a CSO spill volume reduction equal to 43%.
To consider the effectiveness of simultaneously optimizing RTC and SuDS in contrast to optimizing each system independently, the CSO spill volume reductions obtained in the benchmark with RTC + SuDS scenario were compared to the performances obtained by combining FCDs and SuDS zones placed at optimal locations found in the benchmark with RTC and benchmark with SuDS scenarios, respectively. As shown in Table 3, equal or higher CSO spill volume reductions were achieved when optimizing the spatial allocations of the two intervention measures simultaneously rather than individually. The simultaneous optimization of FCD and SUDS locations resulted in additional CSO spill volume reductions ranging between 4% (configuration #11a) and 10% (configuration #7a).
3.2. Zona Central Catchment
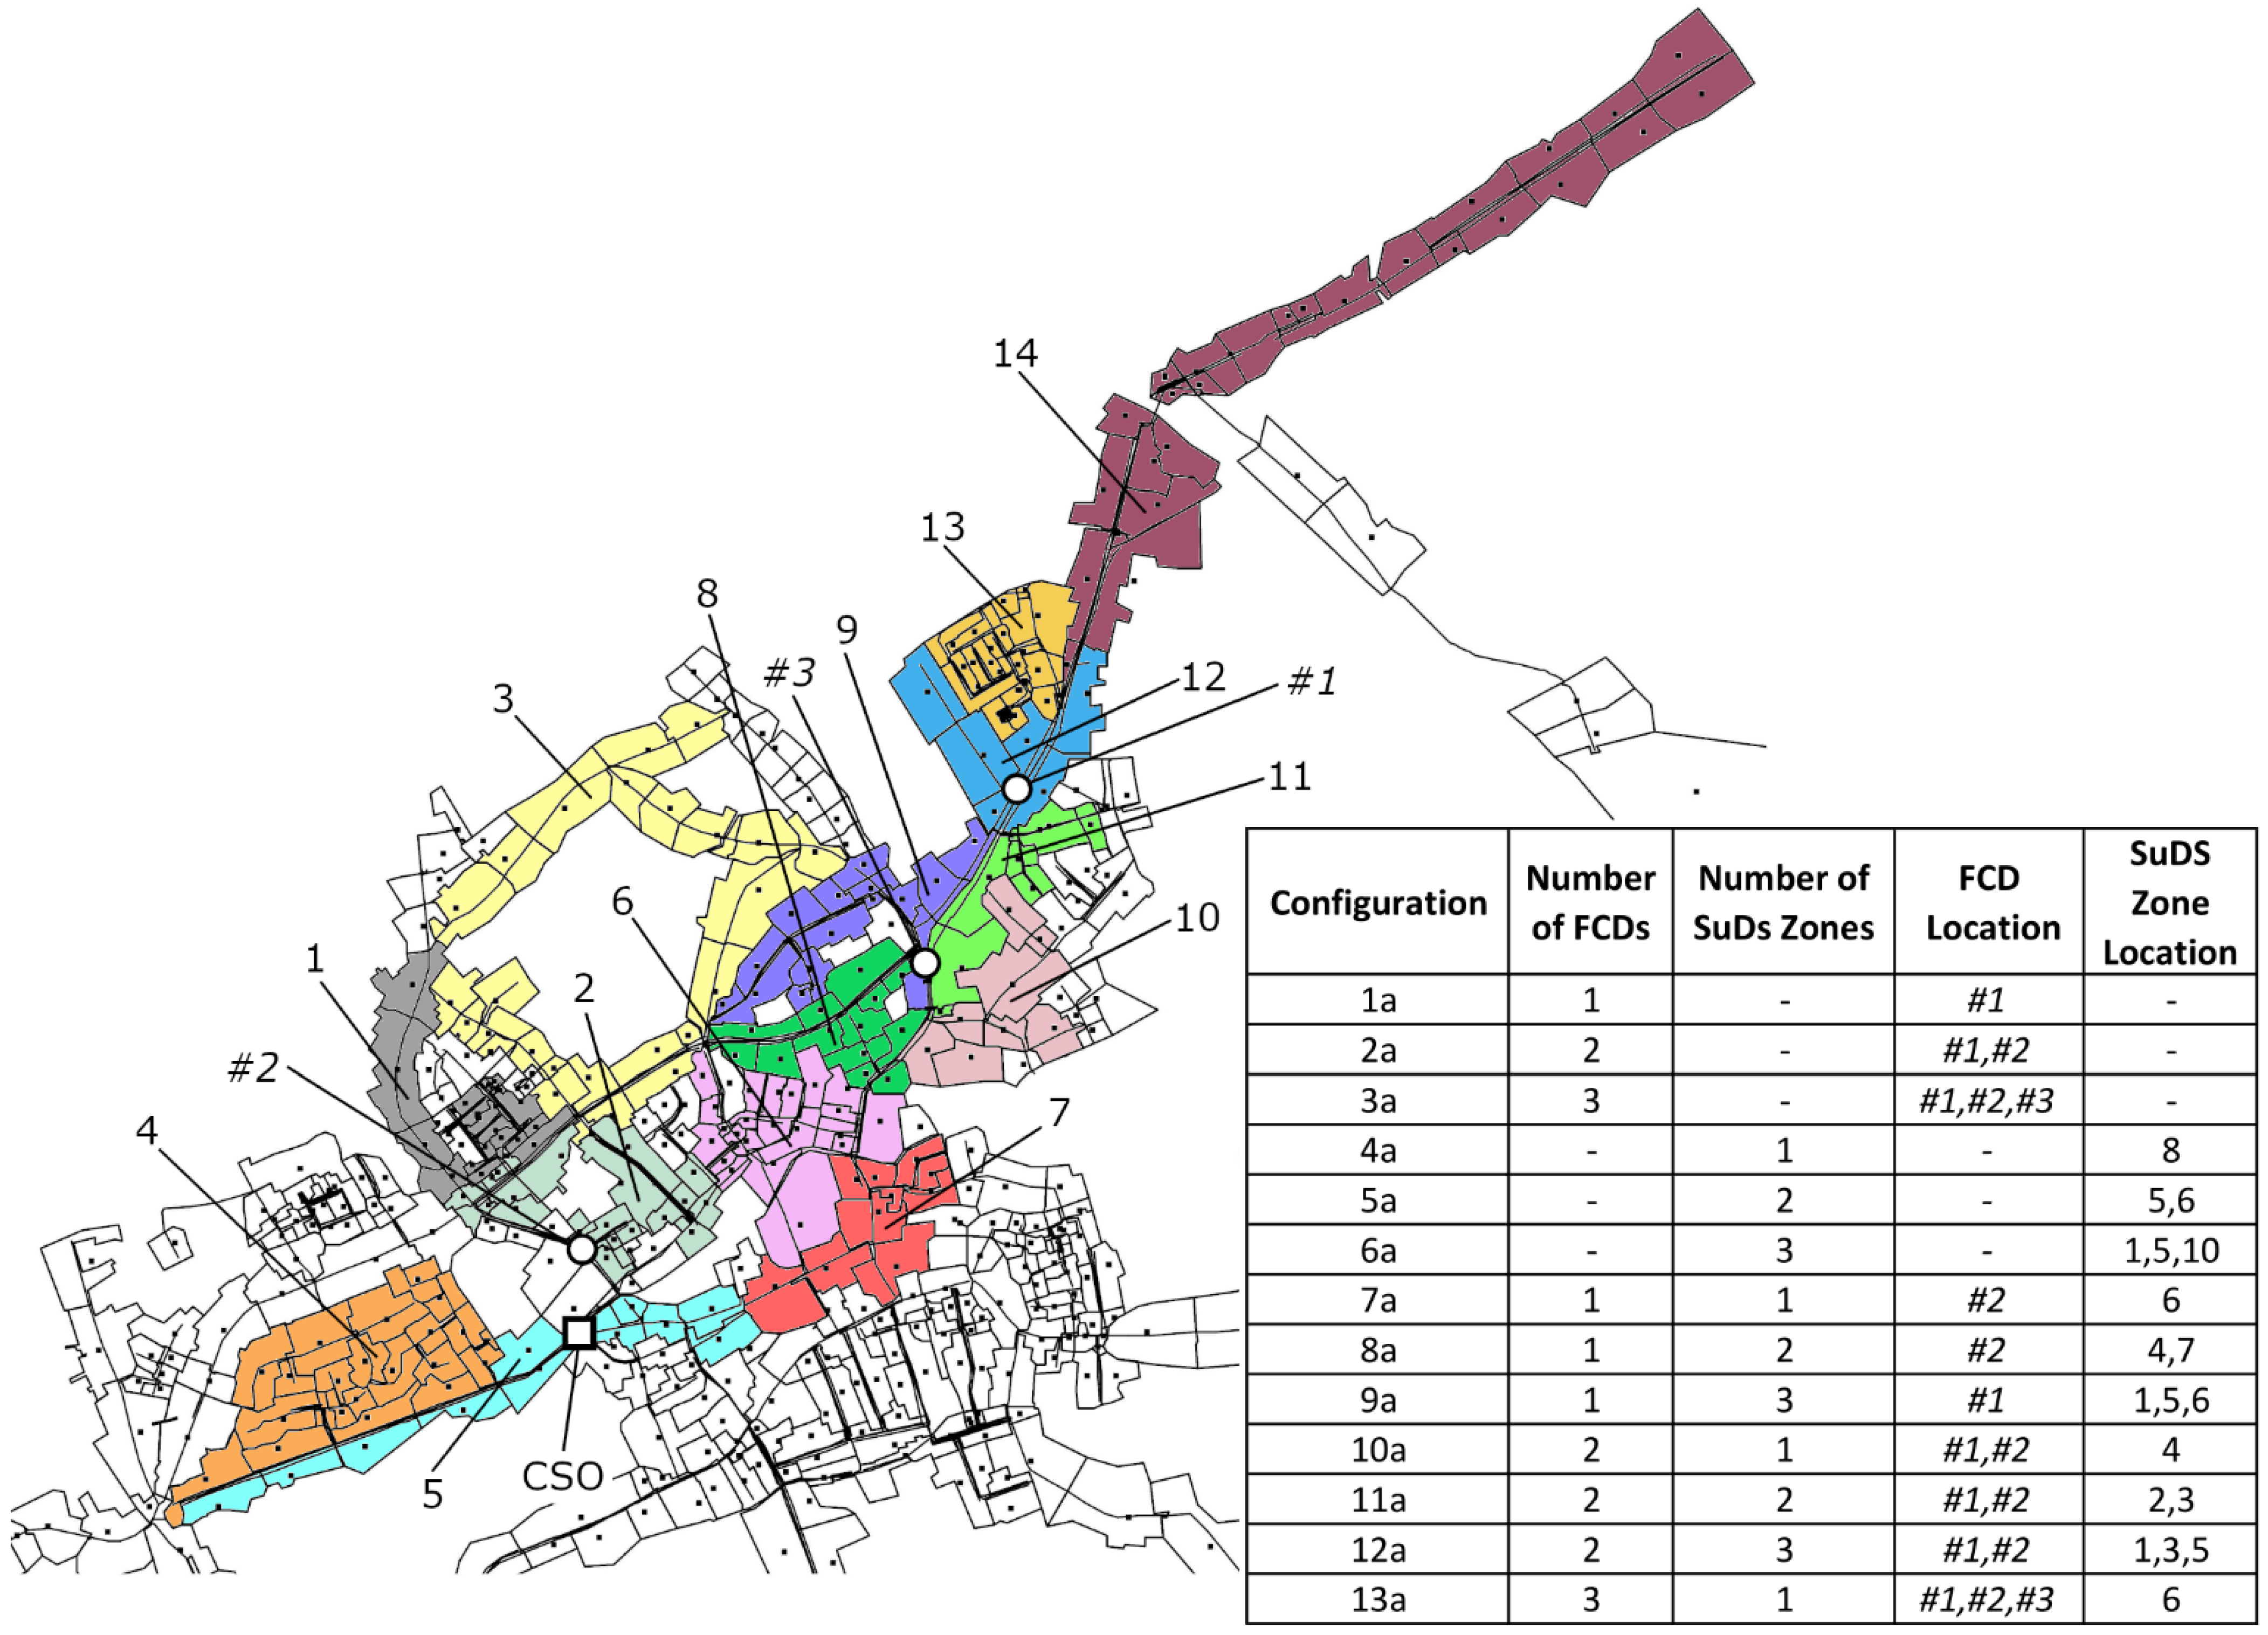
The FCD and SuDS locations found by the GA in the Zona Central catchment are shown in Figure 6. Selected FCD positions were always located along the pipe branch immediately upstream of the CSO regulated by the RTC, while SuDS were mostly positioned in the central/upper portion of the catchment. The placement schemes found by the GA in the benchmark with RTC and benchmark with SuDS scenarios still applied to a large extent when simultaneously optimizing the spatial allocations of the two intervention measures. For example, the FCD placement schemes obtained in the benchmark with RTC scenario still applied when combining one FCD with SuDS (configurations #7b, #8b, and #9b) as well as when combining two FCDs with one or two SuDS zones (configurations #10b and #11b). Similarly, solution with one FCD obtained in the benchmark with RTC scenario, together with the solutions with one SuDS and three SuDS obtained in the benchmark with SuDS scenario, still applied when combining FCDs and SuDS zones in the benchmark with RTC + SuDS scenario. When reducing CSO spill volumes solely based on SuDS, placement schemes were found to be inclusive sets of solutions, with SuDS zones potentially deployed in subsequent stages while maintaining an optimal spatial layout. Non-inclusive sets of solutions were obtained instead in the benchmark with RTC and benchmark with RTC + SuDS scenarios, in which the locations of the FCDs and/or SuDS zones could change, depending on the numbers and types of intervention measures that were implemented.
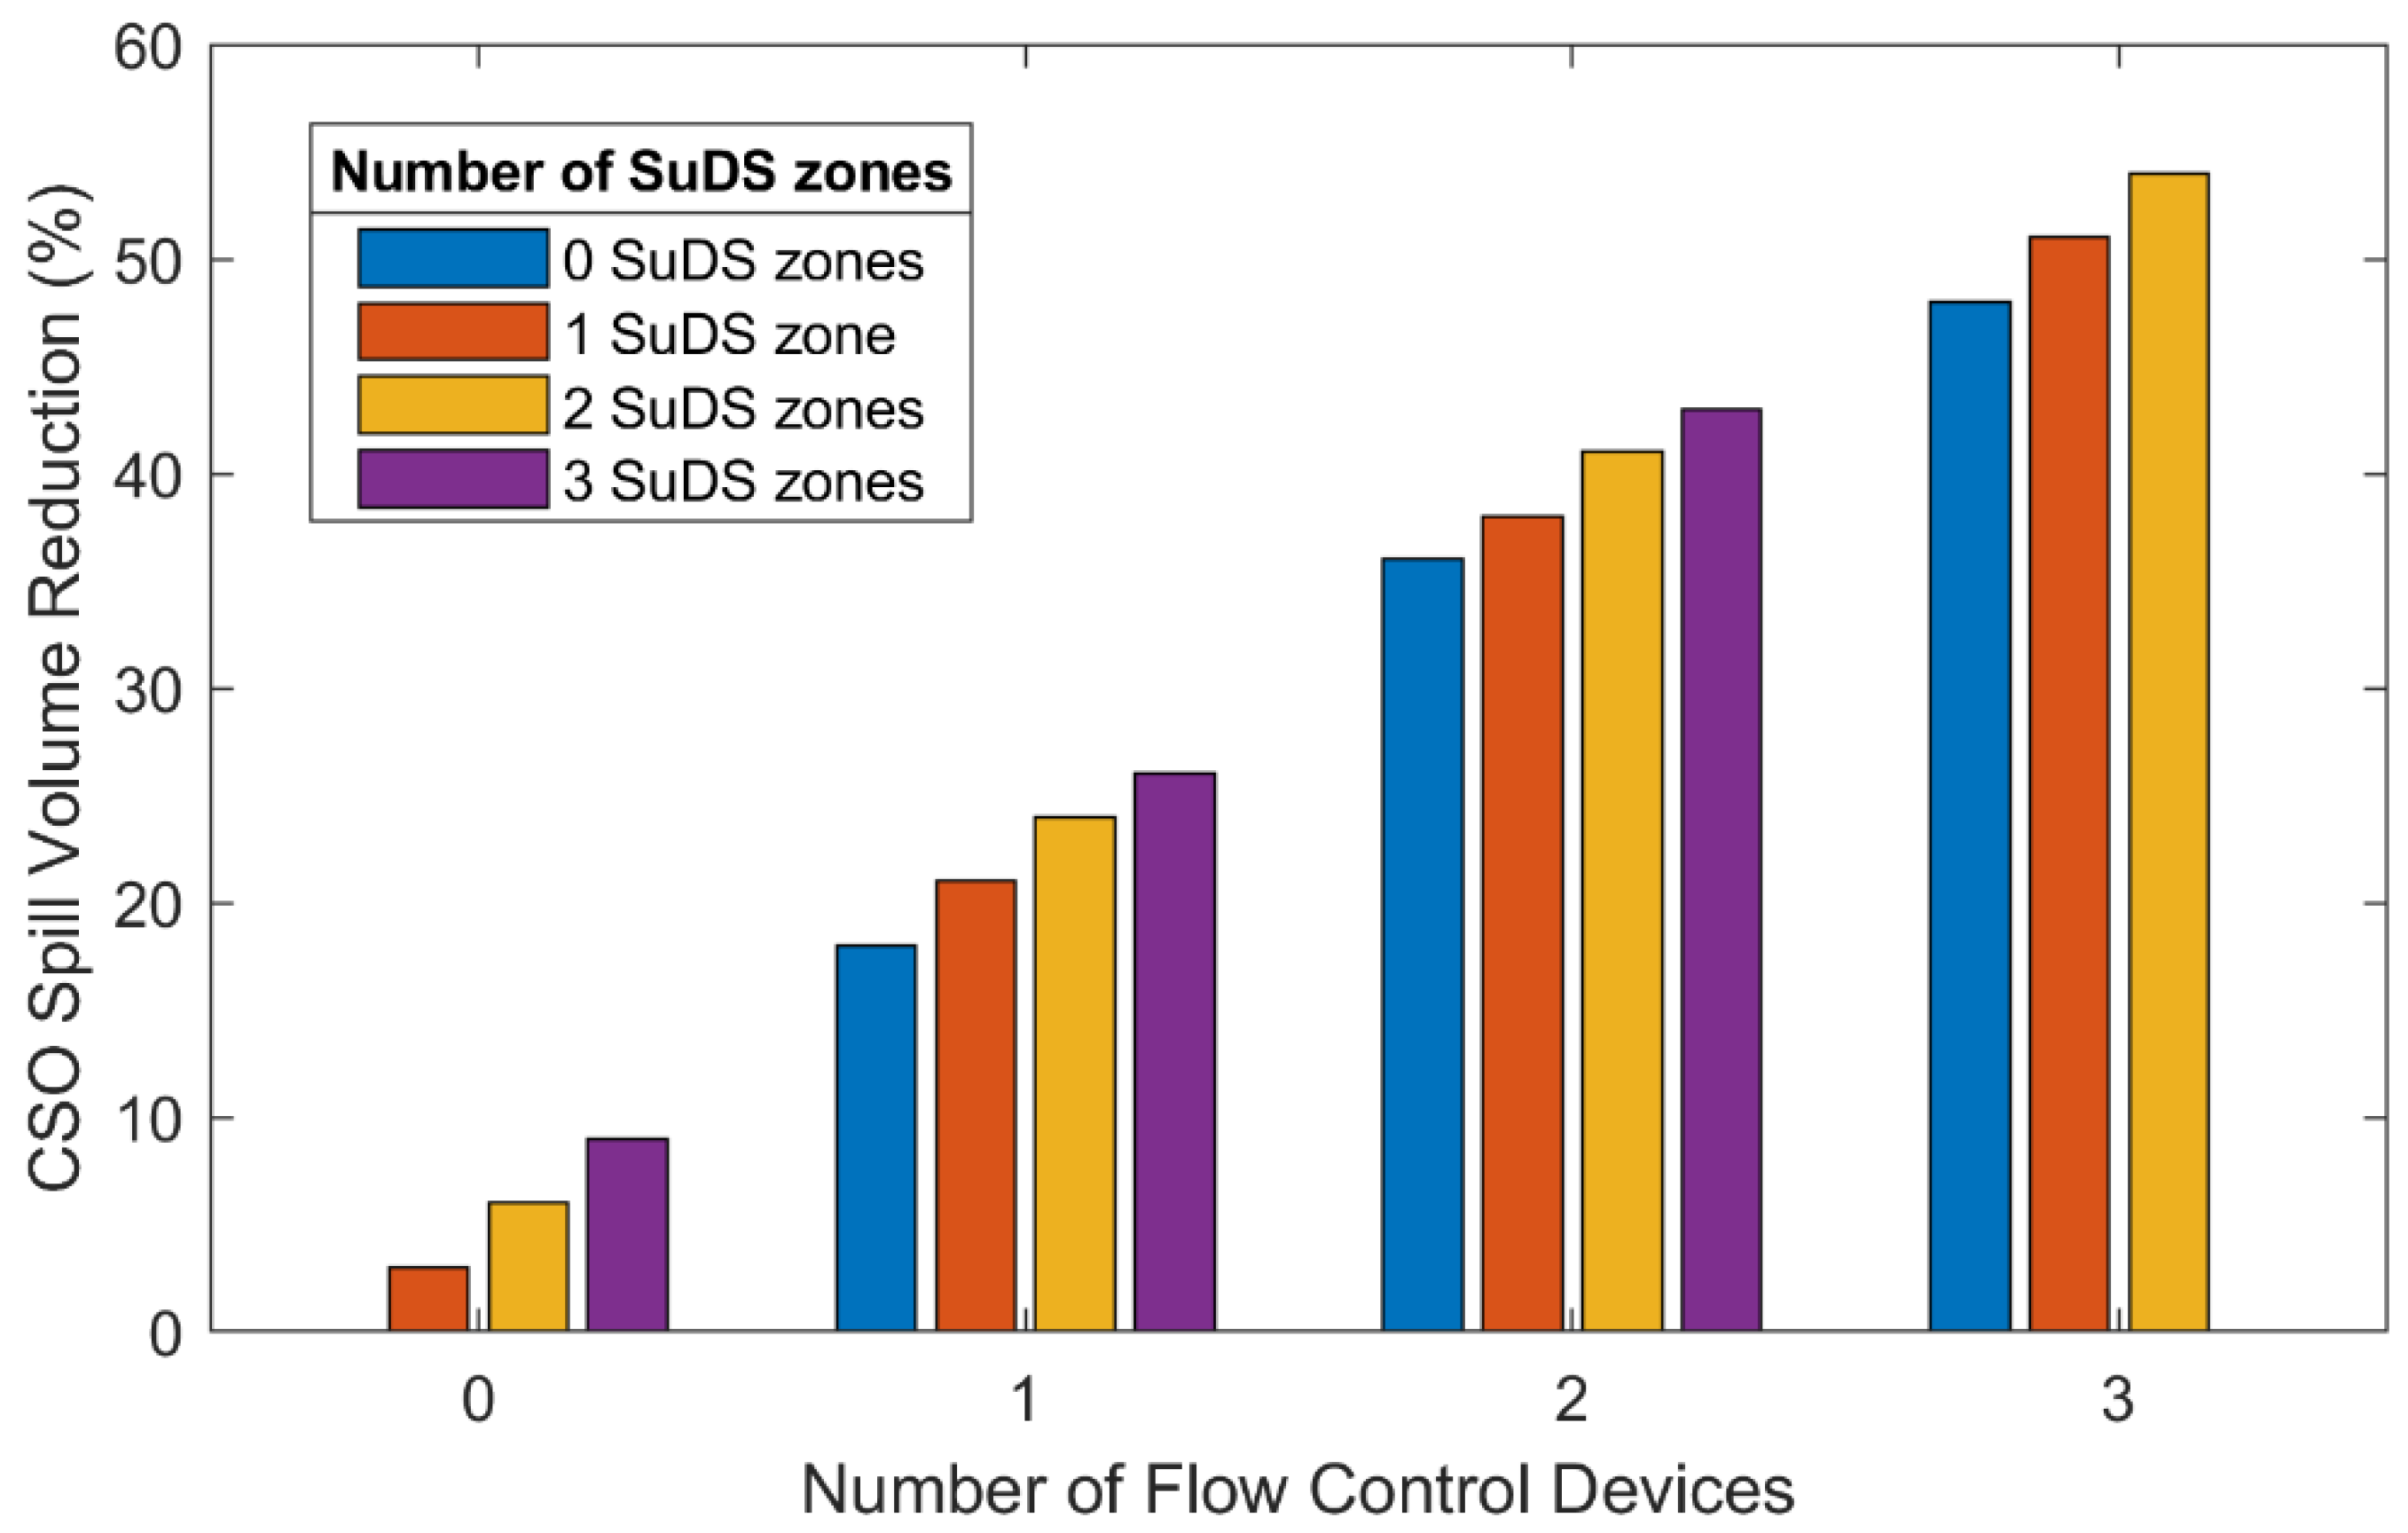
During the designed rainfall event, the spill volume at the target CSO was found to be 2287 m3. The CSO spill volume reduction obtained in the Zona Central catchment is shown in Figure 7 based on the number of FCDs and/or SuDS zones that were implemented. The overflow volumes discharged in the original network were thus reduced by between 18% and 48% in the benchmark with RTC scenario (up to three FCDs), while the CSO spill volume reductions achieved in the benchmark with SuDS scenario did not exceed 9% (with up to two SuDS zones). The performance of the existing drainage infrastructure could be further enhanced by combining both intervention measures, obtaining CSO spill volume reductions between 21% (one FCD combined with one SuDS zone) and 54% (three FCDs combined with two SuDS zones).
In Table 4, the CSO spill volume reductions obtained in the benchmark with RTC + SuDS scenario are compared to the performance obtained by placing FCDs and SuDS zones at the locations found by the GA in the benchmark with RTC and benchmark with SuDS scenarios, respectively. The capability of the RTC and SuDS zones to reduce overflow spills within the catchment could be maximized by optimizing their spatial allocation simultaneously rather than individually, resulting in additional CSO spill volume reductions ranging between 0% (configurations #7b and #9b) and 7% (configuration #11b).
3.3. Validation with Continuous Rainfall Series
The effectiveness of RTC and SuDS in reducing CSO spill volumes was evaluated during continuous rainfall time series (as described in Section 2.5). The total CSO spill volume reductions obtained in the Arendonk and Zona Central models are shown in Table 5 and Table 6, respectively, based on the numbers and types of intervention measures that were implemented.
In the Arendonk catchment, the placement scheme implementation with three SuDS enabled an 11% reduction in the overflow volumes discharged at the regulated CSO during the 3-year rainfall series, while higher CSO spill volume reductions were obtained by combining SuDS with FCDs: a 23% reduction by coupling one FCD with three SuDS zones and 36% reductions by coupling two FCDs with three SuDS zones or three FCDs with one SuDS zone. In the Zona Central catchment, the total CSO spill volume discharged during the 1-year rainfall series was reduced by 13% by implementing three SuDS zones, while the implementation of FCDs combined with SuDS provided total CSO spill volume reductions ranging between 30% (placement scheme with one FCD and three SuDS) and 45% (placement scheme with three FCDs and two SuDS). Overall, the results demonstrate how CSO spill volumes can be efficiently reduced by combining green infrastructure at the catchment level with FCDs controlled by the RTC system at the sewage level, with equivalent CSO spill volume reductions obtained by different numbers and types of intervention measures in the Arendonk catchment.
4. Discussion
In this study, the spatial allocation of locally controlled FCDs and simplified SuDS systems was optimized using a GA-based methodology to reduce CSO spill volumes in two case-study catchments. Three scenarios were evaluated: CSO spill reduction solely based on RTC, CSO spill reduction solely based on SuDS, and CSO spill reduction achieved by RTC combined with SuDS.
When reducing overflow spills with the local RTC, large differences in the spatial allocation of FCDs were obtained by GA, depending on the case-study catchment that was evaluated. This was mainly due to the different topographies, pipe geometries, and resulting distributions of storage capacity within the two case studies. In the flatter Arendonk catchment, the effect of a single partially or fully closed gate on flows and levels propagated far upstream along the pipe branches. The usage of the existing storage capacity was thus maximized by the GA by favoring FCDs positioned in different segments of the drainage system. In the Arendonk catchment, the GA did not always favor FCD locations close to the CSO regulated by the RTC system, which could increase the overflow spill volumes discharged at the other CSOs located in the central/upper portion of the catchment. The maximum capacity was reached in several segments of the sewer network immediately upstream of the CSO, preventing the FCDs from successfully mobilizing additional in-sewer storage capacity to store stormwater during rainfall events. In contrast, the Zona Central catchment featured a single combined sewer overflow, steep pipe gradients in the central/upper portion of the catchment, and flatter pipe gradients in the downstream area where the CSO was located. This uneven distribution of in-sewer storage capacity led FCDs to always be positioned along the pipe branch immediately upstream of the CSO, where the pipe diameters were significantly larger compared to other portions of the UDS. Due to the proximity between the FCDs, the joint storage volume capacity was partially mobilized by the gates along the same pipe branch when storing run-off volumes during rainfall events.
SuDS zones were generally located in the central/upper portion of the Zona Central catchment, while the central/lower catchment areas were preferred when allocating SuDS in the Arendonk model. This was mostly due to the different hydrological responses of the catchments to rainfall inputs. Zona Central had steeper slopes and a faster response time, with runoff attenuation in the upper part of the catchment resulting in efficient reductions in the overflow volumes discharged at the single downstream CSO at the time of the peak. Arendonk featured a flatter network with multiple CSOs in the central/upstream part of the catchment, with the highest reduction in overflow volumes achieved by SUDs located closer to the regulated CSO.
In this study, SuDS were implemented into clusters of subcatchments (i.e., SuDS zones), limiting the number of potential SuDS placement schemes tested by the GA through hydraulic analysis. The impact of the SuDS in reducing CSO spills was influenced by the subdivision of the watershed into clusters of subcatchments, with different zonations potentially leading to higher CSO spill volume reductions achieved by smaller SuDS zones. The choice of SuDS zone size is also expected to have a significant impact on the computational load required by the optimization–simulation framework. Smaller SuDS zones can provide more tailored solutions to efficiently manage runoff volumes at the catchment level, limiting the conversion of impervious area to pervious area needed to achieve a given level of performance. However, smaller SuDS zones result in a higher number of possible combinations between the number and position of SuDS zones within the catchment, and therefore more computational time is needed by the GA to identify near-optimal solutions. Larger clusters of subcatchments instead lead to lower computational loads at the expense of less refined SuDS placement schemes. In this study, the size of the SuDS zones was found through initial trials to provide an efficient balance between the number of potential placement schemes tested by the GA, the rate of convergence, and the computational time. The impact of the choice of SuDS zone size and location in reducing CSO spill volumes remains for future research, as this study mainly focused on developing a simulation–optimization framework to identify the optimal placement of RTC actuators combined with simplified SuDS systems within UDS.
SuDS were simulated as impervious areas converted to pervious areas, a highly simplified representation of green infrastructure that enhances the capability of the proposed GA-based method to identify optimal SuDS placement schemes in a reasonable timeframe. Nonetheless, the methodology can be extended to consider specific types of SuDS (e.g., infiltration trenches, green roofs, and detention basins). Following the experience from this paper, it is hypothesized that it may be quicker to optimize their location selection by simulating the effect of simplified SuDS as a small number of changes to the runoff hydrograph from the subcatchments (e.g., peak delay and/or reduction). After that, SuDS could be designed suiting the location selected by the optimization-based framework while providing a desired runoff hydrograph. This process is thought to be more efficient than simultaneously optimizing individual SuDS locations and design parameters, such as type selection, infiltration capacity, SuDS dimensions, and medium, especially when combining SuDS with FCDs controlled by RTC systems. The implementation of green infrastructure in highly urbanized areas is highly influenced by space availability and the opportunity for retrofitting (e.g., land and home/commercial area ownership). When optimizing specific types of SuDS, a more detailed spatial analysis of the landscape and topographic conditions of the catchment through geographic information systems (GIS) can be used to exclude unfeasible SuDS placement schemes due to practical or socioeconomic limitations (e.g., land use and land ownership), reducing the search space of all feasible solutions evaluated by the GA solver. As the solution time may rise exponentially, a sensitivity analysis is recommended to better investigate the trade-off between computational time and the number of SuDS decision variables included in the optimization-based method. This analysis remains for further research, as this study mainly focused on higher-level planning and the design case of infiltration-based structures.
In both case studies, the implementation of locally controlled FCDs always corresponded to higher CSO spill volume reductions compared to the implementation of simplified infiltration-based SuDS. Large portions of unused in-sewer storage capacity were mobilized by the flow controllers to regulate the water level at the CSO, with significant CSO spill volume reductions obtained in both the benchmark with RTC and benchmark with RTC + SuDS scenarios. The attenuation of runoff volumes obtained by SuDS resulted in limited CSO spill mitigation within the sewer networks, with SuDS performing slightly better during the less severe storm event in the Arendonk catchment (designed storm occurring seven times per year). FCD-SuDS configurations were also tested during continuous rainfall time series, resulting in reductions in the CSO spill volumes discharged from the baseline networks ranging between 23% and 45% when combining the local RTC with green infrastructure. In the Arendonk catchment model, during the 3-year rainfall series equivalent CSO spill volume reductions were achieved by different combinations of numbers and positions of FCDs and SuDS, providing alternatives to mitigate the impacts of CSO spills and fulfil environmental targets within the urban drainage system.
When coupling the local RTC with SuDS, higher performance was obtained when the spatial allocations of the two intervention measures were optimized simultaneously rather than individually, enhancing the combined benefits of FCDs and SuDS in managing runoff volumes. For example, in the Arendonk catchment, a CSO spill volume reduction equal to 71% achieved by two FCDs could be further increased by 8% by combining the RTC with one SuDS zone or by 21% by combining the RTC with two SuDS zones, preventing the sewer overflow spill in the baseline network. Moreover, comparable CSO spill volume reductions could be achieved by different FCD-SuDS configurations, widening the choice of potential intervention schemes with similar levels of performance.
In this study, the FCD and SuDS locations mostly changed depending on the number of intervention measures that were implemented, resulting in largely different unique optimal placement schemes. While installation site accessibility and road/traffic management might delay or restrict the deployment of FCDs at specific control sites (i.e., manholes), an advantage of FCDs controlled by local RTC is that implemented FCDs can generally be repositioned to different locations, so additional FCDs can be installed in the UDS while maintaining the optimal spatial layout. The GA-based optimization can also be rerun to cope with new urban development and rainfall trends, adjusting the locations of previously placed FCDs if needed. The locations of SuDS at the catchment level were instead largely influenced by the opportunity for retrofitting and other factors such as land use and home/commercial area ownership that may impede the implementation of optimal SuDS or RTC+SuDS configurations in stages. It would not be possible to relocate SuDS once implemented; it would only be possible to add more SuDS. However, compared to FCDs, SuDS can have various advantages, such as amenity [10], increasing biodiversity [50,51], water quality improvement [24,52], and the restoration of infiltration, interception, and detention/retention regimes [12].
5. Conclusions
In this paper, a novel simulation–optimization framework was developed to optimize the spatial allocation of FCDs and simplified SuDS for CSO spill mitigation. SuDS were simulated by converting impervious areas into pervious areas within clusters of subcatchments, allowing the rapid assessment of a high number of potential placement schemes in a reasonable timeframe. The impacts of FCDs and SuDS in reducing CSO spills were maximized by implementing the two intervention measures simultaneously rather than individually, enhancing the combined benefits achieved by the two decentralized systems. When combining the local RTC with SuDS in the two evaluated case-study networks, the CSO spill volumes discharged during synthetic storm events were reduced by between 21% and 100% by the efficient attenuation of runoff volumes achieved by green infrastructure at the catchment level and the optimized use of existing in-sewer storage capacity achieved by flow controllers at the drainage level. Placement schemes comprising FCDs coupled with SuDS were also validated by comparing performance relative to the uncontrolled networks during continuous rainfall time series, showing how the simultaneous implementation of the two intervention measures allowed an efficient reduction in overflow spill volumes over a wide range of rainfall inputs. Optimal FCDs and SuDS deployment was found to be largely influenced by the distribution of in-sewer storage capacity within the existing drainage infrastructure and the hydrological response of the catchment to rainfall inputs, especially in looped networks and flat catchments, where the hydraulic interaction between FCDs and SuDS can be difficult to predict. This method can be applied to mitigate the consequences of population growth, urbanization, and climate change, extending the range of applications of RTC combined with SuDS for CSO spill mitigation in urban drainage systems.
Author Contributions
Conceptualization, M.E., J.D.S. and A.S.; methodology, M.E., J.D.S. and A.S.; software, M.E.; validation, M.E., J.D.S., S.K. and A.S.; formal analysis, M.E.; writing—original draft preparation, M.E.; writing—review and editing, M.E., J.D.S., S.K., S.O., P.S. and A.S.; supervision, S.O., J.D.S. and A.S.; funding acquisition, J.D.S. and A.S. All authors have read and agreed to the published version of the manuscript.
Funding
This research was supported by an Engineering and Physical Sciences Research Council research studentship (EP/LO15412/1) as part of the STREAM Industrial Doctorate Centre for the water sector.
Data Availability Statement
The data are privately owned and therefore cannot be made publicly available; readers should contact the corresponding author for details.
Acknowledgments
The authors would like to thank Águas de Coimbra for providing the Zona Central SWMM model used in this study. The authors also gratefully acknowledge the support from Nuno Eduardo Simões (University of Coimbra) for providing the documentation of the Zona Central SWMM model and Will Shepherd (University of Sheffield) for technical support with the CENTAUR real-time control algorithm.
Conflicts of Interest
The authors declare no conflict of interest. The funders had no role in the design of the study; in the collection, analyses, or interpretation of data; in the writing of the manuscript; or in the decision to publish the results.
References
- Hosseinzadehtalaei, P.; Tabari, H.; Willems, P. Climate change impact on short-duration extreme precipitation and intensity–duration–frequency curves over Europe. J. Hydrol. 2020, 590, 125249. [Google Scholar] [CrossRef]
- Zhou, Q.; Leng, G.; Su, J.; Ren, Y. Comparison of urbanization and climate change impacts on urban flood volumes: Importance of urban planning and drainage adaptation. Sci. Total Environ. 2019, 658, 24–33. [Google Scholar] [CrossRef] [PubMed]
- Zittis, G.; Bruggeman, A.; Lelieveld, J. Revisiting future extreme precipitation trends in the Mediterranean. Weather Clim. Extrem. 2021, 34, 100380. [Google Scholar] [CrossRef] [PubMed]
- CEC. Council Directive of 21 May 1991 concerning urban waste water treatment (91/271/EEC). Off. J. Eur. Communities 1991. [Google Scholar]
- Environment Agency. Storm Overflow Assessment Framework. 2018. Available online: https://www.water.org.uk/wp-content/uploads/2018/12/SOAF.pdf (accessed on 25 February 2022).
- De Sousa, M.R.C.; Montalto, F.A.; Spatari, S. Using Life Cycle Assessment to Evaluate Green and Grey Combined Sewer Overflow Control Strategies. J. Ind. Ecol. 2012, 16, 901–913. [Google Scholar] [CrossRef]
- Liu, J.; Wang, J.; Ding, X.; Shao, W.; Mei, C.; Li, Z.; Wang, K. Assessing the mitigation of greenhouse gas emissions from a green infrastructure-based urban drainage system. Appl. Energy 2020, 278, 115686. [Google Scholar] [CrossRef]
- Altobelli, M.; Cipolla, S.S.; Maglionico, M. Combined Application of Real-Time Control and Green Technologies to Urban Drainage Systems. Water 2020, 12, 3432. [Google Scholar] [CrossRef]
- Gersonius, B.; Ashley, R.; Pathirana, A.; Zevenbergen, C. Climate change uncertainty: Building flexibility into water and flood risk infrastructure. Clim. Chang. 2013, 116, 411–423. [Google Scholar] [CrossRef]
- Fletcher, T.D.; Shuster, W.; Hunt, W.F.; Ashley, R.; Butler, D.; Arthur, S.; Trowsdale, S.; Barraud, S.; Semadeni-Davies, A.; Bertrand-Krajewski, J.; et al. SUDS, LID, BMPs, WSUD and more—The evolution and application of terminology surrounding urban drainage. Urban Water J. 2015, 12, 525–542. [Google Scholar] [CrossRef]
- Woods Ballard, B.; Wilson, S.; Udale-Clarke, H.; Illman, S.; Scott, T.; Ashley, R.; Kellagher, R. The SuDS Manual; CIRIA: London, UK, 2015; ISBN 979-0-86017-760-9. [Google Scholar]
- Zhang, K.; Chui, T.F.M. A comprehensive review of spatial allocation of LID-BMP-GI practices: Strategies and optimization tools. Sci. Total Environ. 2018, 621, 915–929. [Google Scholar] [CrossRef]
- Mandarano, L.; Meenar, M. Equitable distribution of green stormwater infrastructure: A capacity-based framework for implementation in disadvantaged communities. Local Environ. 2017, 22, 1338–1357. [Google Scholar] [CrossRef]
- Montalto, F.A.; Bartrand, T.A.; Waldman, A.M.; Travaline, K.A.; Loomis, C.H.; McAfee, C.; Geldi, J.M.; Riggall, G.J.; Boles, L.M. Decentralised green infrastructure: The importance of stakeholder behaviour in determining spatial and temporal outcomes. Struct. Infrastruct. Eng. 2013, 9, 1187–1205. [Google Scholar] [CrossRef]
- EPA. Real Time Control of Urban Drainage Networks; Technical report EPA/600/R-06/120; U.S. Environmental Protection Agency: Washington, DC, USA, 2006. Available online: https://cfpub.epa.gov/si/si_public_record_Report.cfm?Lab=NRMRL&dirEntryID=159366 (accessed on 25 February 2022).
- Schütze, M.; Erbe, V.; Haas, U.; Scheer, M.; Weyand, M. Sewer system real-time control supported by the M180 guideline document. Urban Water J. 2008, 5, 69–78. [Google Scholar] [CrossRef]
- García, L.; Barreiro-Gomez, J.; Escobar, E.; Téllez, D.; Quijano, N.; Ocampo-Martinez, C. Modeling and real-time control of urban drainage systems: A review. Adv. Water Resour. 2015, 85, 120–132. [Google Scholar] [CrossRef] [Green Version]
- Kroll, S.; Weemaes, M.; Van Impe, J.; Willems, P. A Methodology for the Design of RTC Strategies for Combined Sewer Networks. Water 2018, 10, 1675. [Google Scholar] [CrossRef] [Green Version]
- Beeneken, T.; Erbe, V.; Messmer, A.; Reder, C.; Rohlfing, R.; Scheer, M.; Schuetze, M.; Schumacher, B.; Weilandt, M.; Weyand, M. Real time control (RTC) of urban drainage systems—A discussion of the additional efforts compared to conventionally operated systems. Urban Water J. 2013, 10, 293–299. [Google Scholar] [CrossRef]
- Mounce, S.R.; Shepherd, W.; Ostojin, S.; Abdel-Aal, M.; Schellart, A.N.A.; Shucksmith, J.D.; Tait, S.J. Optimisation of a fuzzy logic-based local real-time control system for mitigation of sewer flooding using genetic algorithms. J. Hydroinform. 2020, 22, 281–295. [Google Scholar] [CrossRef]
- Ostojin, S.; Shepherd, W.; Williams, K.; Simões, N.; Steinhardt, J. CENTAUR: Smart Utilisation of Wastewater storage capacity to prevent flooding. In Proceedings of the CIWEM Urban Drainage Group Autumn Conference & Exhibition 2017, Blackpool, UK, 8 November 2017; pp. 1–8. [Google Scholar]
- Giacomoni, M.H.; Joseph, J. Multi-Objective Evolutionary Optimization and Monte Carlo Simulation for Placement of Low Impact Development in the Catchment Scale. J. Water Resour. Plan. Manag. 2017, 143, 04017053. [Google Scholar] [CrossRef]
- Mao, X.; Jia, H.; Yu, S.L. Assessing the ecological benefits of aggregate LID-BMPs through modelling. Ecol. Modell. 2017, 353, 139–149. [Google Scholar] [CrossRef]
- Wu, J.; Kauhanen, P.G.; Hunt, J.A.; Senn, D.B.; Hale, T.; Mckee, L.J. Optimal Selection and Placement of Green Infrastructure in Urban Watersheds for PCB Control. J. Sustain. Water Built Environ. 2019, 5, 04018019. [Google Scholar] [CrossRef]
- Zhen, J.X.; Yu, S.L.; Zhai, Y. A Planning Tool for Watershed LID-BMP Implementation. In Proceedings of the 2004 World Water and Environmetal Resources Congress: Critical Transitions in Water and Environmetal Resources Management, Salt Lake City, UT, USA, 27 June 27–1 July 2004; American Society of Civil Engineers: Reston, VA, USA, 2004. [Google Scholar] [CrossRef]
- Islam, A.; Hassini, S.; El-dakhakhni, W. A systematic bibliometric review of optimization and resilience within low impact development stormwater management practices. J. Hydrol. 2021, 599, 126457. [Google Scholar] [CrossRef]
- Campisano, A.; Schilling, W.; Modica, C. Regulators’ setup with application to the Roma-Cecchignola combined sewer system. Urban Water J. 2000, 2, 235–242. [Google Scholar] [CrossRef]
- Leitão, J.P.; Carbajal, J.P.; Rieckermann, J.; Simões, N.E.; Sá Marques, A.; de Sousa, L.M. Identifying the best locations to install flow control devices in sewer networks to enable in-sewer storage. J. Hydrol. 2017, 556, 371–383. [Google Scholar] [CrossRef]
- Eulogi, M.; Ostojin, S.; Skipworth, P.; Shucksmith, J.D.; Schellart, A. Hydraulic optimisation of multiple flow control locations for the design of local real time control systems. Urban Water J. 2021, 18, 91–100. [Google Scholar] [CrossRef]
- Eulogi, M.; Ostojin, S.; Skipworth, P.; Kroll, S.; Shucksmith, J.D.; Schellart, A. Comparing methods to place adaptive local RTC actuators for spill volume reduction from multiple CSOs. J. Hydroinformatics 2022, 24, 78–92. [Google Scholar] [CrossRef]
- Brasil, J.; Macedo, M.; Lago, C.; Oliveira, T.; Júnior, M.; Oliveira, T.; Mendiondo, E. Nature-Based Solutions and Real-Time Control: Challenges and Opportunities. Water 2021, 13, 651. [Google Scholar] [CrossRef]
- Gaborit, E.; Muschalla, D.; Vallet, B.; Vanrolleghem, P.A.; Anctil, F. Improving the performance of stormwater detention basins by real-time control using rainfall forecasts. Urban Water J. 2013, 10, 230–246. [Google Scholar] [CrossRef]
- Shen, P.; Deletic, A.; Bratieres, K.; Mccarthy, D.T. Real time control of biofilters delivers stormwater suitable for harvesting and reuse. Water Res. 2020, 169, 115257. [Google Scholar] [CrossRef]
- Rossman, L.A. Storm Water Management Model User’s Manual Version 5.1; National Risk Management Research Laboratory, Office of Research and Development, US Environmental Protection Agency: Cincinnati, OH, USA, 2015.
- Riaño-Briceño, G.; Barreiro-Gomez, J.; Ramirez-Jaime, A.; Quijano, N.; Ocampo-Martinez, C. MatSWMM—An open-source toolbox for designing real-time control of urban drainage systems. Environ. Model. Softw. 2016, 83, 143–154. [Google Scholar] [CrossRef] [Green Version]
- RGSPPDADAR. Regulamento Geral de Sistemas Públicos e Prediais de Distribuição de Águas e de Drenagem de Águas [In Portuguese]. 1995. Available online: https://dre.pt/dre/detalhe/decreto-regulamentar/23-1995-431873 (accessed on 21 November 2022).
- Shepherd, W.; Ostojin, S.; Mounce, S.; Skipworth, P.; Tait, S. CENTAUR: Real time flow control system for flood risk reduction. In Proceedings of the CIWEM Urban Drainage Group Autumn Conference & Exhibition 2016, Blackpool, UK, 9–11 November 2016. [Google Scholar]
- Eckart, K.; McPhee, Z.; Bolisetti, T. Multiobjective optimization of low impact development stormwater controls. J. Hydrol. 2018, 562, 564–576. [Google Scholar] [CrossRef]
- Shen, Z.; Chen, L.; Xu, L. A Topography Analysis Incorporated Optimization Method for the Selection and Placement of Best Management Practices. PLoS ONE 2013, 8, 1–12. [Google Scholar] [CrossRef] [PubMed] [Green Version]
- Srivastava, P.; Hamlett, J.M.; Robillard, P.D.; Day, R.L. Watershed optimization of best management practices using AnnAGNPS and a genetic algorithm. Water Resour. Res. 2002, 38, 1–14. [Google Scholar] [CrossRef] [Green Version]
- Arabi, M.; Govindaraju, R.S.; Hantush, M.M. Cost-effective allocation of watershed management practices using a genetic algorithm. Water Resour. Res. 2006, 42, 1–14. [Google Scholar] [CrossRef]
- Bakhshipour, A.E.; Dittmer, U.; Haghighi, A.; Nowak, W. Hybrid green-blue-gray decentralized urban drainage systems design, a simulation-optimization framework. J. Environ. Manag. 2019, 249, 109364. [Google Scholar] [CrossRef]
- Damodaram, C.; Zechman, E.M. Simulation-optimization approach to design low impact development for managing peak flow alterations in urbanizing watersheds. J. Water Resour. Plan. Manag. 2013, 139, 290–298. [Google Scholar] [CrossRef]
- Perez-Pedini, C.; Limbrunner, J.F.; Vogel, R.M. Optimal location of infiltration-based best management practices for storm water management. J. Water Resour. Plan. Manag. 2005, 131, 441–448. [Google Scholar] [CrossRef]
- Matlab. Global Optimization Toolbox; Version 9.4.0.813654 (R2018a); The MathWorks Inc.: Natick, MA, USA, 2018; Available online: https://uk.mathworks.com/help/gads/ga.html (accessed on 28 June 2022).
- Butler, D.; James, D.C.; Makropoulos, C.; Davies, J.W. Urban Drainage, 4th ed.; Taylor & Francis Group: Boca Raton, FL, USA, 2018. [Google Scholar]
- Coördinatiecommissie Integraal Waterbeleid. Code of Good Practice for the Design, Construction and the Maintenance of Drainage Systems [in Dutch]; Erembodegem, Belgium. 2012. Available online: https://www.integraalwaterbeleid.be/nl/publicaties/code-goede-praktijk-rioleringssystemen/copy4_of_deel-1-juridisch-kader-technische-toelichting-bij-cvgp-rioleringssystemen (accessed on 21 November 2022).
- Chow, V.T.; Maidment, D.R.; Mays, L.W. Applied Hydrology; McGraw-Hill: New York, NY, USA, 1988; ISBN 0-07-100174-3. [Google Scholar]
- Waterinfo.be. WATERINFO.be—Download Section. Available online: https://www.waterinfo.be/default.aspx?path=NL/Rapporten/Downloaden (accessed on 25 February 2022). (In Dutch).
- Pinho, P.; Correia, O.; Lecoq, M.; Munzi, S.; Vasconcelos, S.; Gonçalves, P.; Rebelo, R.; Antunes, C.; Silva, P.; Freitas, C.; et al. Evaluating green infrastructure in urban environments using a multi-taxa and functional diversity approach. Environ. Res. 2016, 147, 601–610. [Google Scholar] [CrossRef]
- Snäll, T.; Lehtomäki, J.; Arponen, A.; Elith, J.; Moilanen, A. Green Infrastructure Design Based on Spatial Conservation Prioritization and Modeling of Biodiversity Features and Ecosystem Services. Environ. Manag. 2016, 57, 251–256. [Google Scholar] [CrossRef] [Green Version]
- Yang, G.; Best, E.P.H. Spatial optimization of watershed management practices for nitrogen load reduction using a modeling-optimization framework. J. Environ. Manag. 2015, 161, 252–260. [Google Scholar] [CrossRef]
Figure 1.
SuDS zones selected within the SWMM Arendonk sewer network model (0.6 hectares of impervious area were converted to pervious area in each SuDS zone).
Figure 1.
SuDS zones selected within the SWMM Arendonk sewer network model (0.6 hectares of impervious area were converted to pervious area in each SuDS zone).
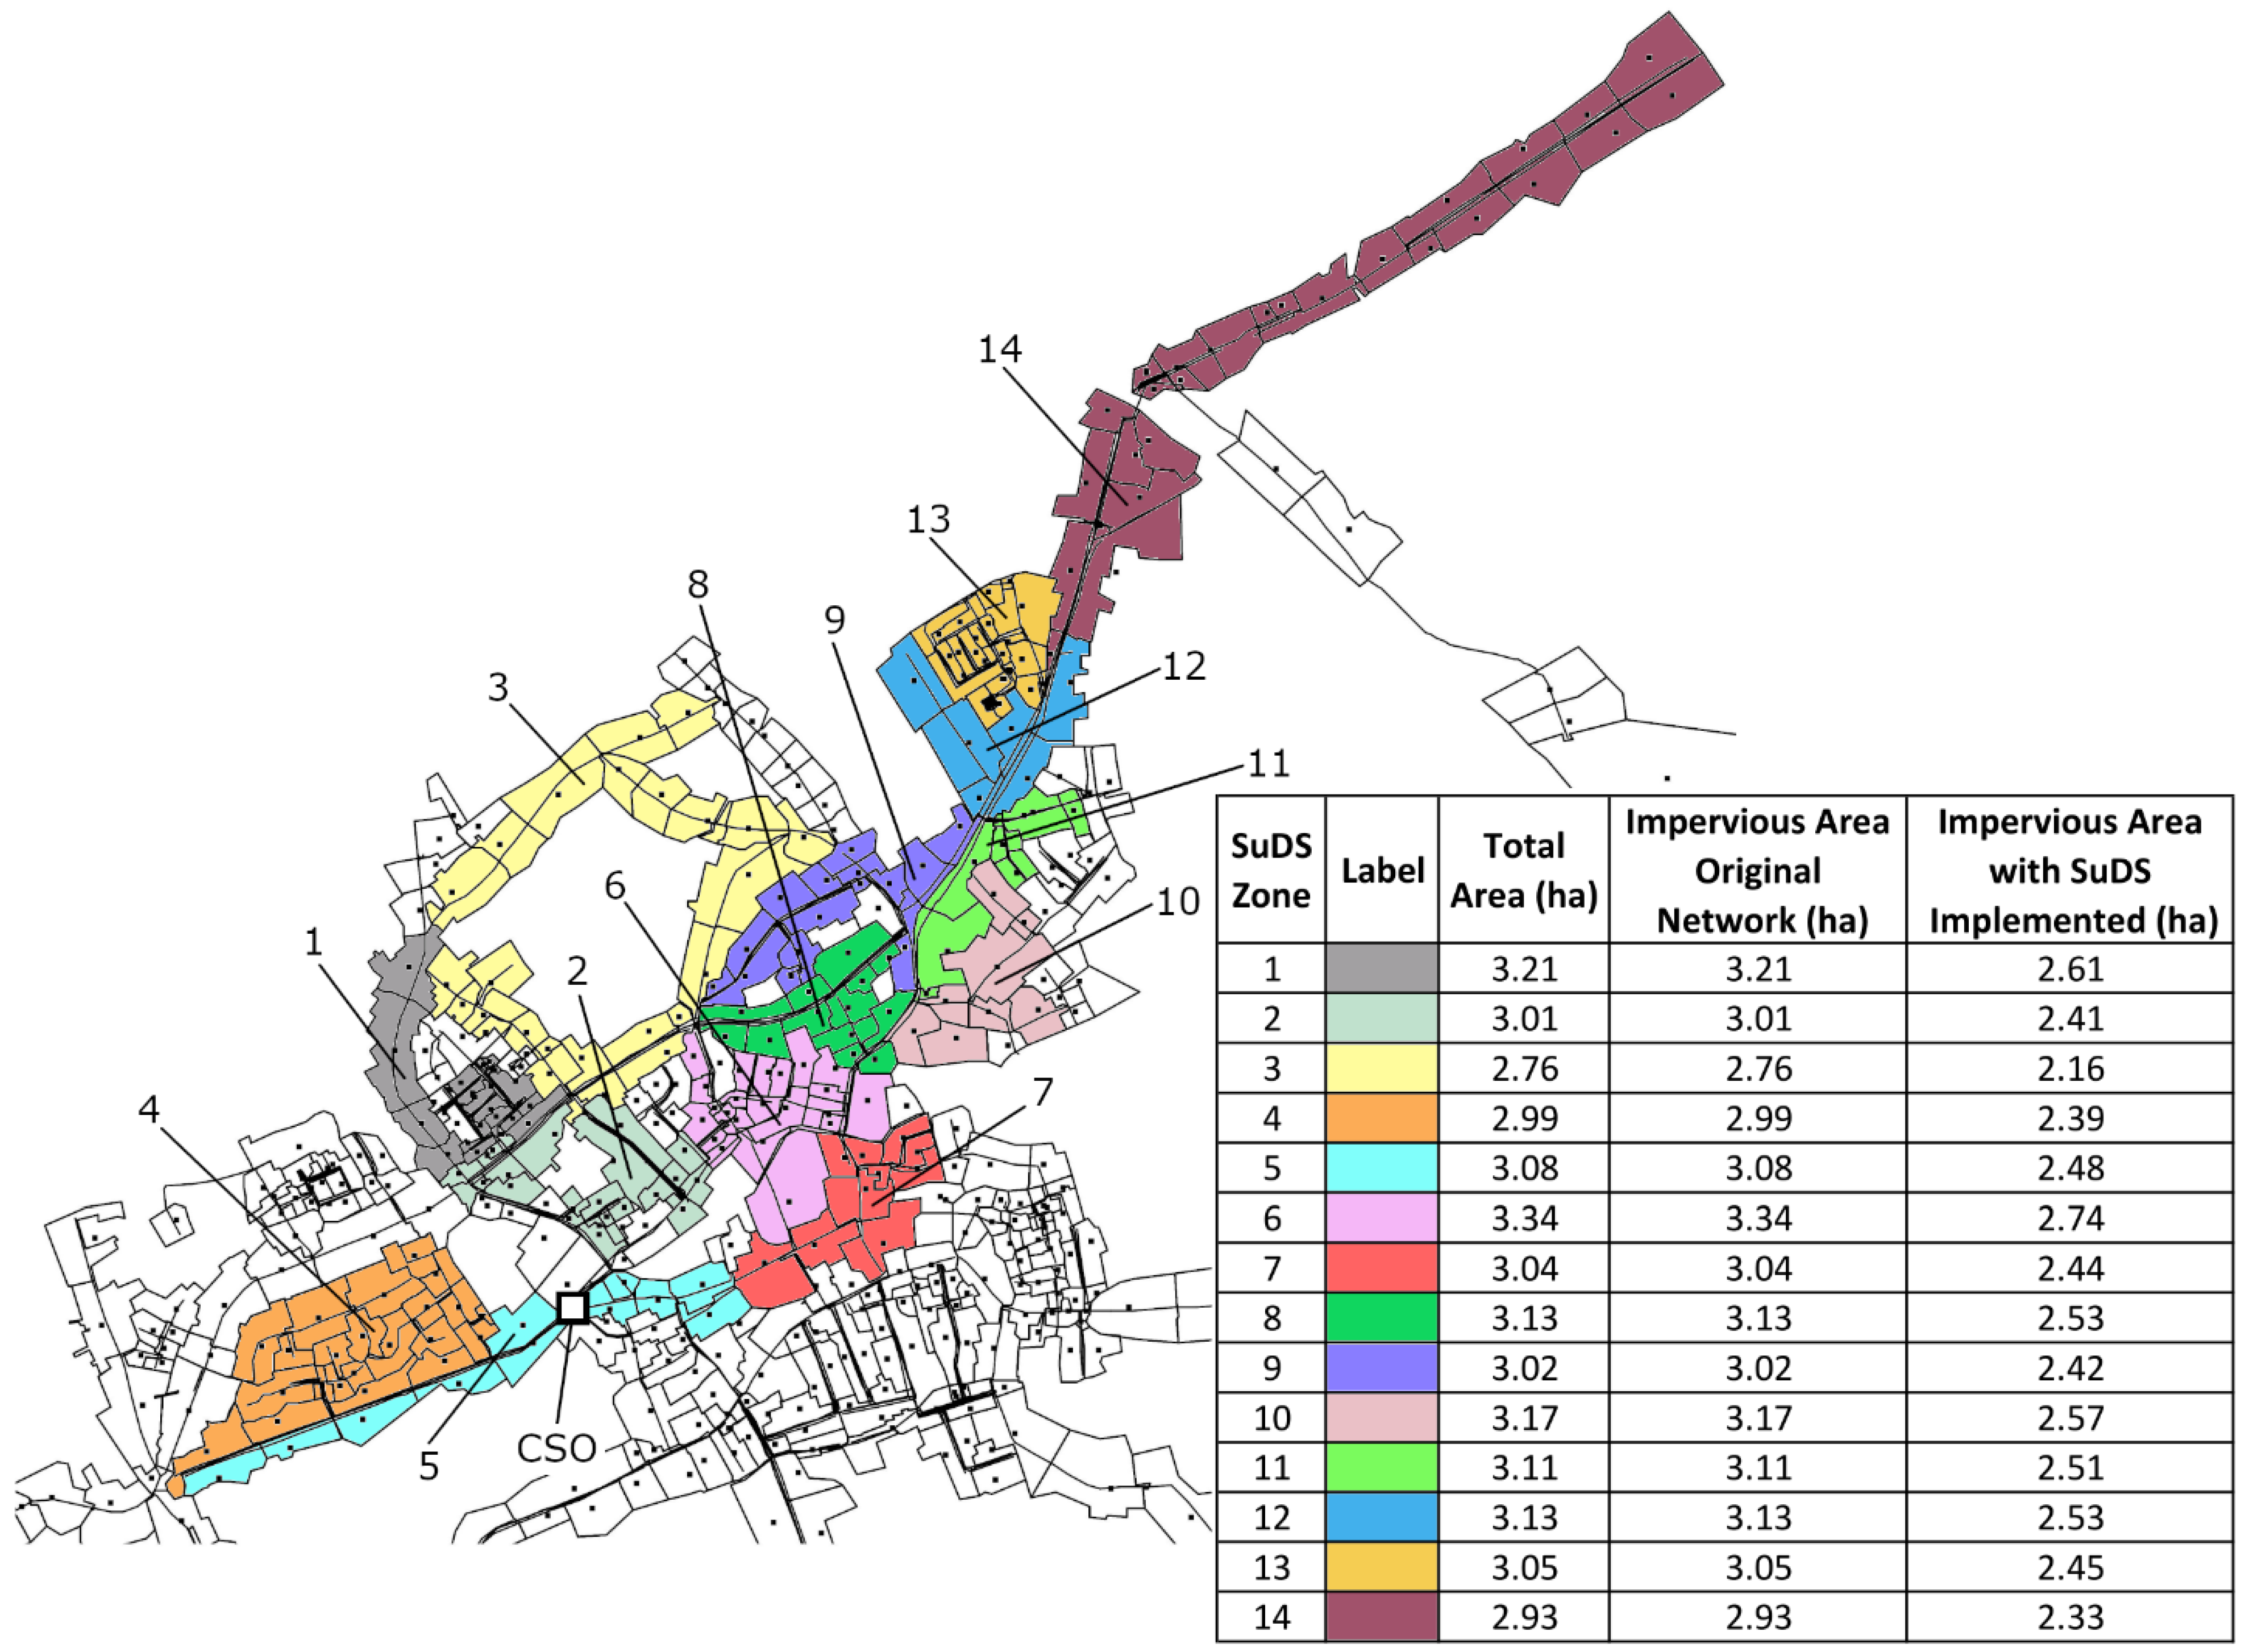
Figure 2.
SuDS zones selected within the SWMM Zona Central sewer network model (0.8 hectares of impervious area were converted to pervious area in each SuDS zone).
Figure 2.
SuDS zones selected within the SWMM Zona Central sewer network model (0.8 hectares of impervious area were converted to pervious area in each SuDS zone).

Figure 3.
Binary optimization string representing a unique intervention scheme featuring FCDs coupled with SuDS zones; m and n are equal to the number of FCD locations and SuDS zones evaluated by the GA solver, respectively.
Figure 3.
Binary optimization string representing a unique intervention scheme featuring FCDs coupled with SuDS zones; m and n are equal to the number of FCD locations and SuDS zones evaluated by the GA solver, respectively.
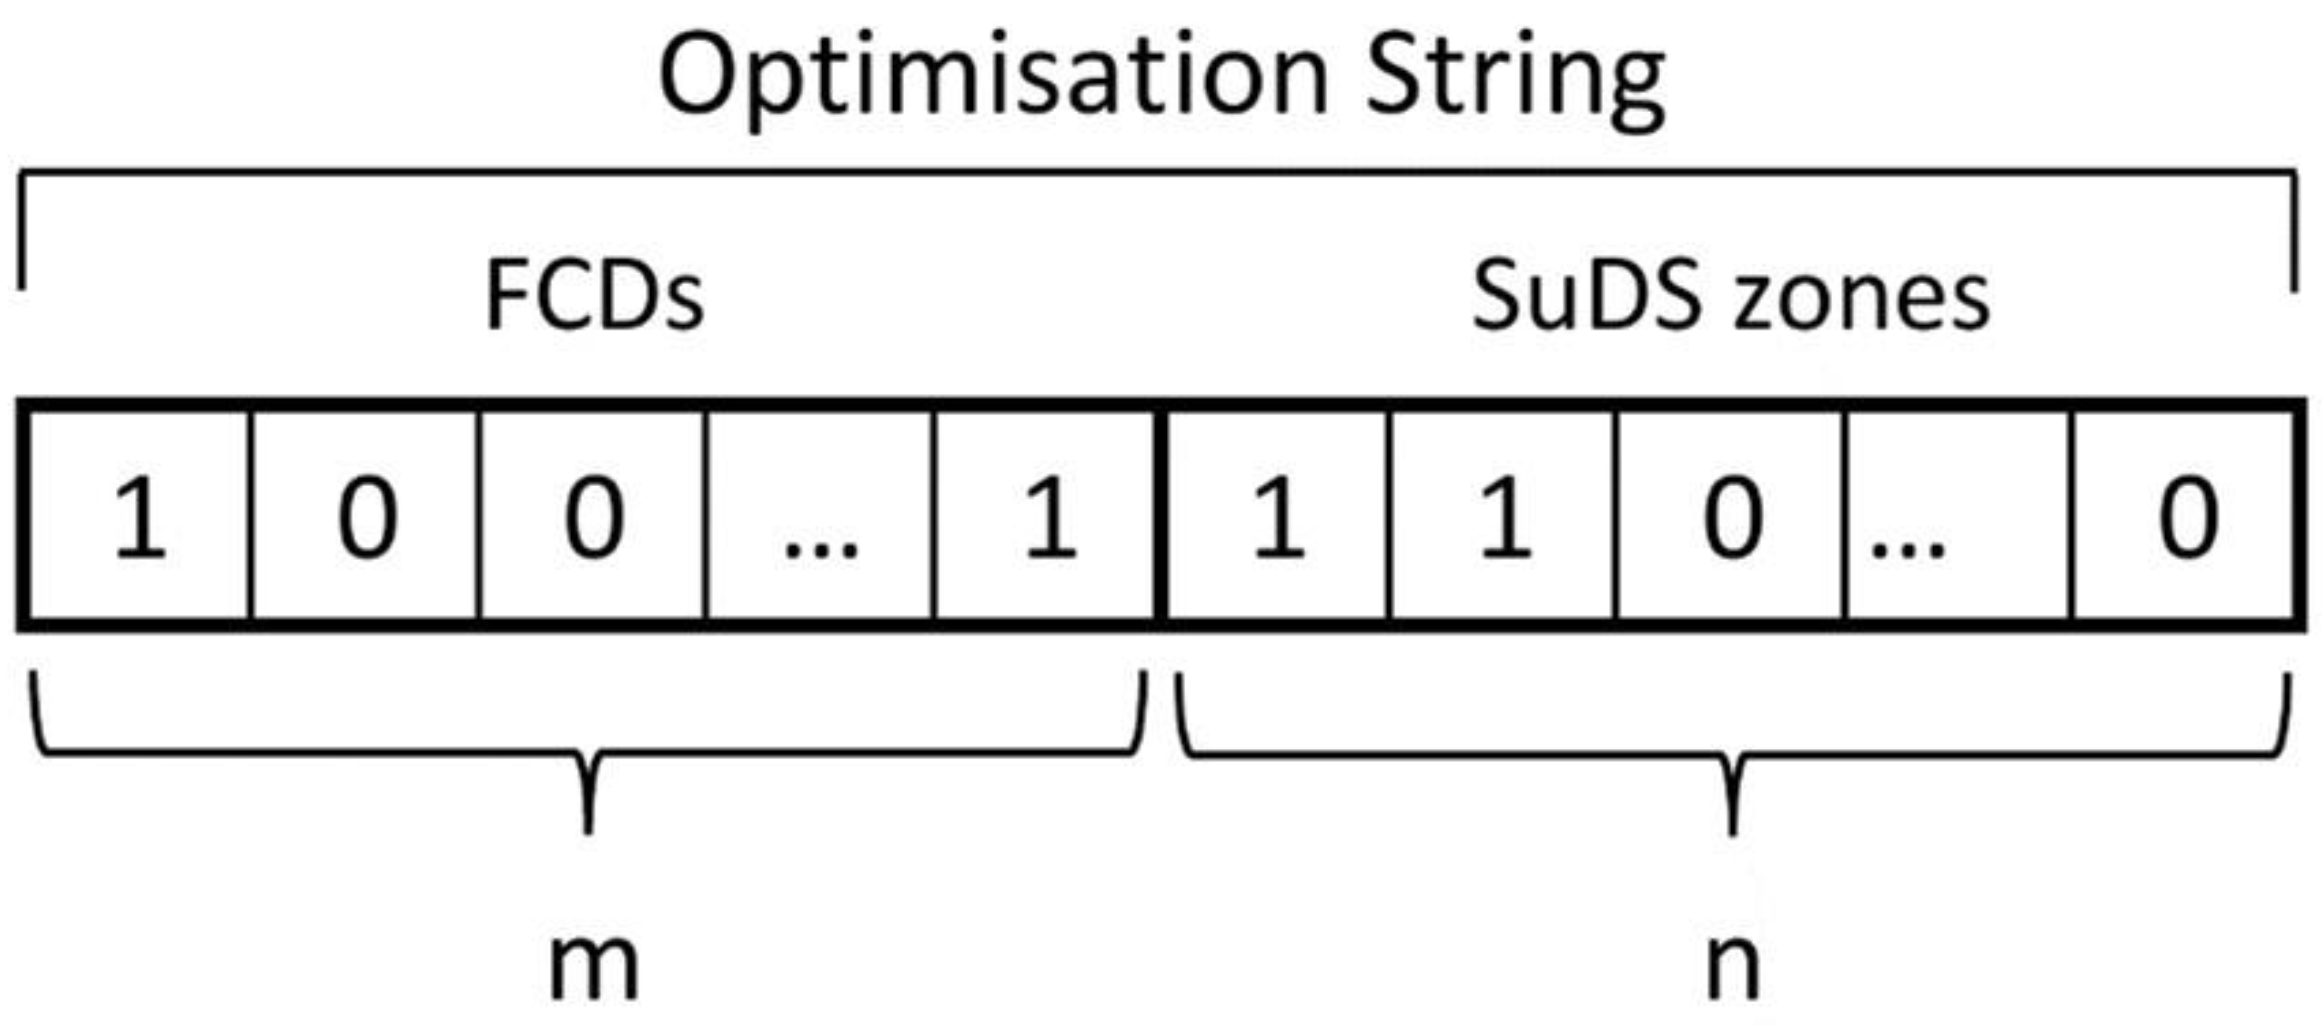
Figure 4.
Optimal FCD and/or SuDS locations selected by the GA in the Arendonk catchment.

Figure 5.
CSO spill volume reduction obtained in the Arendonk catchment for different combinations of intervention measures (the CSO spill volume in the baseline network was equal to 731 m3).
Figure 5.
CSO spill volume reduction obtained in the Arendonk catchment for different combinations of intervention measures (the CSO spill volume in the baseline network was equal to 731 m3).
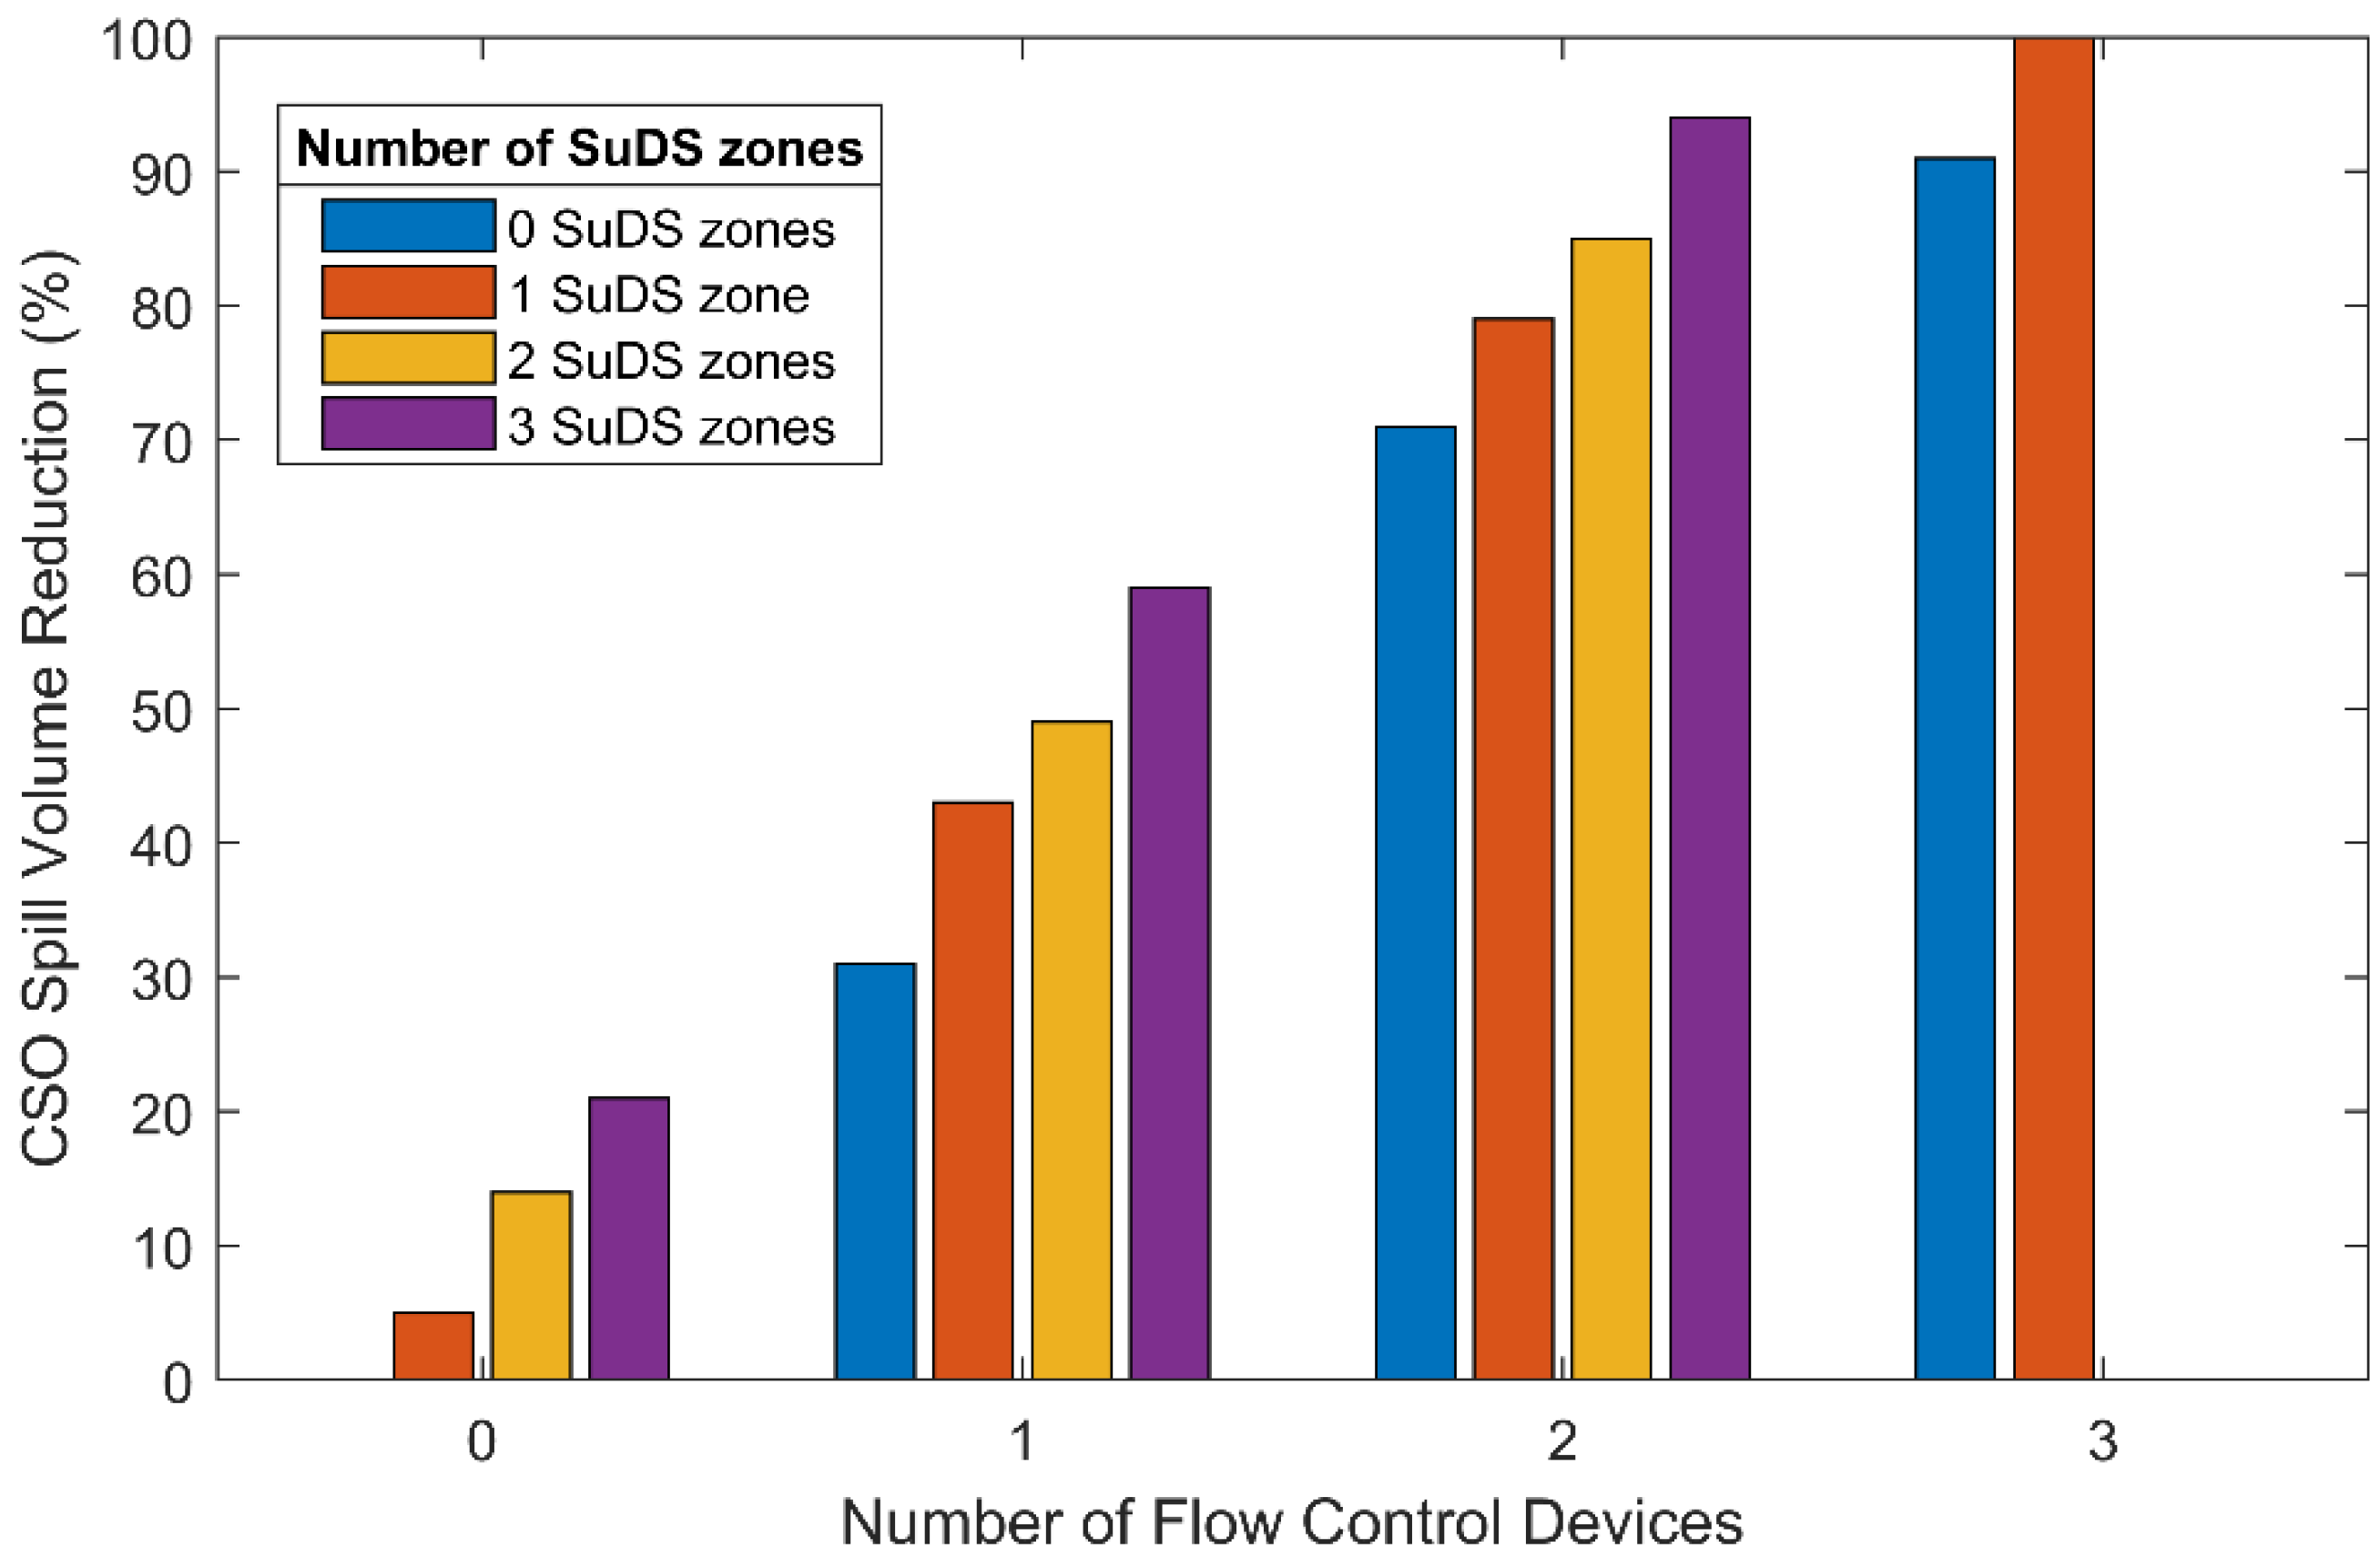
Figure 6.
Optimal FCD and/or SuDS locations selected by the GA in the Zona Central catchment.
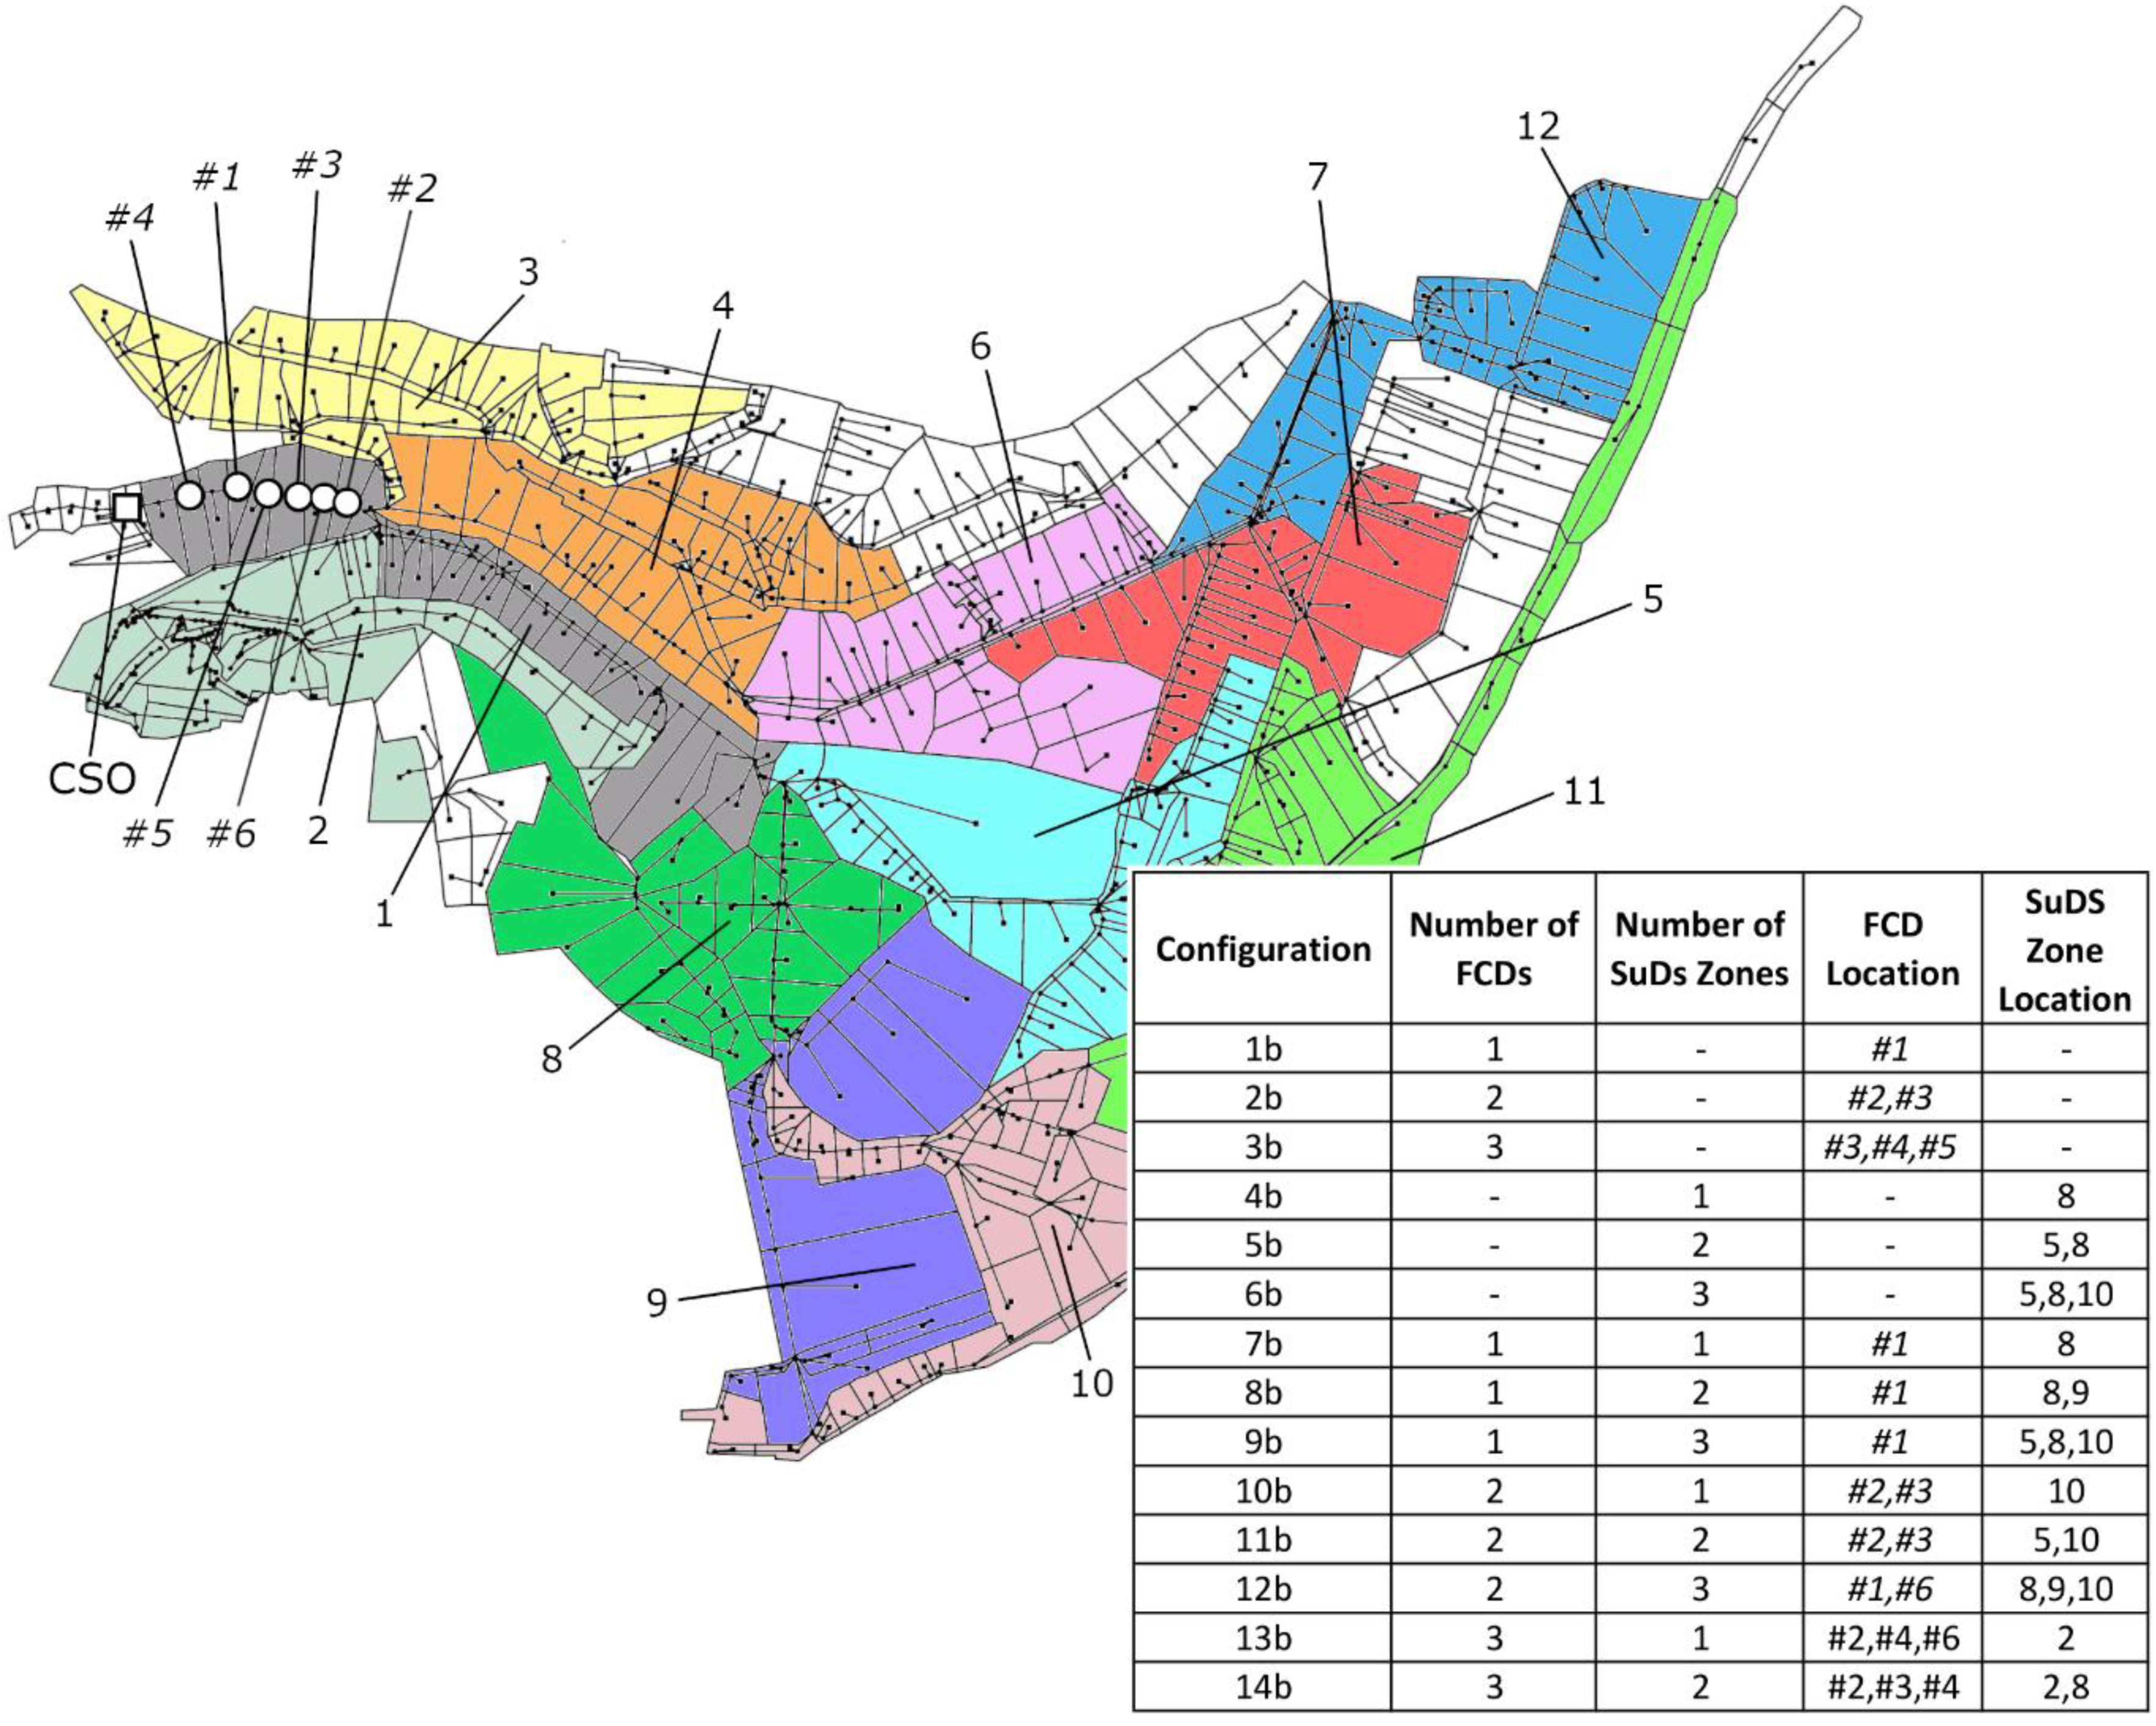
Figure 7.
CSO spill volume reduction obtained in the Zona Central catchment for different combinations of intervention measures (the CSO spill volume in the baseline network was equal to 2287 m3).
Figure 7.
CSO spill volume reduction obtained in the Zona Central catchment for different combinations of intervention measures (the CSO spill volume in the baseline network was equal to 2287 m3).

Table 1.
Summary of characteristics of the selected case-study catchments, including population equivalents (P.E.).
Table 1.
Summary of characteristics of the selected case-study catchments, including population equivalents (P.E.).
| Case Study | P.E. | Nodes | Links | Subcatchments | Contributing Area (ha) | Pipe Diameter (m) | Pipe Slope (m/m) | CSOs | ||
|---|---|---|---|---|---|---|---|---|---|---|
| Min | Max | Min | Max | |||||||
| Arendonk | 15,100 | 1572 | 1563 | 572 | 113 | 0.1 | 2 | −0.04 | 0.88 | 16 |
| Zona Central | - | 536 | 538 | 434 | 89 | 0.2 | 1.7 | −0.51 | 2.26 | 1 |
Table 2.
Number of SuDS zones and FCD locations tested by the GA for each case-study catchment that was investigated.
Table 2.
Number of SuDS zones and FCD locations tested by the GA for each case-study catchment that was investigated.
| Case Study | Number of FCD Locations in the Baseline Network | Number of FCD Locations Evaluated by the GA | Number of SuDS Zones Evaluated by the GA |
|---|---|---|---|
| Zona Central | 389 | 25 | 12 |
| Arendonk | 533 | 32 | 14 |
Table 3.
Comparison between CSO spill volume reductions obtained by simultaneous and separate optimizations of FCD and SuDS locations within the Arendonk catchment.
Table 3.
Comparison between CSO spill volume reductions obtained by simultaneous and separate optimizations of FCD and SuDS locations within the Arendonk catchment.
| FCD and SuDS Locations Obtained by GA in Benchmark with RTC + SuDS Scenario | FCD and SuDS Locations Obtained by GA in Benchmark with RTC and Benchmark with SuDS Scenarios, Respectively | |||
|---|---|---|---|---|
| No. of FCDs | No. of SuDS Zones | Configuration | CSO Spill Volume Reduction (%) | |
| 1 | 1 | 7a | 43 | 33 |
| 1 | 2 | 8a | 49 | 49 |
| 1 | 3 | 9a | 59 | 51 |
| 2 | 1 | 10a | 79 | 74 |
| 2 | 2 | 11a | 85 | 81 |
| 2 | 3 | 12a | 94 | 87 |
| 3 | 1 | 13a | 100 | 100 |
Table 4.
Comparison between CSO spill volume reductions obtained by simultaneous and separate optimizations of FCD and SuDS locations within the Zona Central catchment.
Table 4.
Comparison between CSO spill volume reductions obtained by simultaneous and separate optimizations of FCD and SuDS locations within the Zona Central catchment.
| FCD and SuDS Locations Obtained by GA in Benchmark with RTC + SuDS Scenario | FCD and SuDS Locations Obtained by GA in Benchmark with RTC and Benchmark with SuDS Scenarios, Respectively | |||
|---|---|---|---|---|
| No. of FCDs | No. of SuDS Zones | Configuration | CSO Spill Volume Reduction (%) | |
| 1 | 1 | 7b | 21 | 21 |
| 1 | 2 | 8b | 24 | 23 |
| 1 | 3 | 9b | 26 | 26 |
| 2 | 1 | 10b | 38 | 32 |
| 2 | 2 | 11b | 41 | 34 |
| 2 | 3 | 12b | 43 | 37 |
| 3 | 1 | 13b | 51 | 50 |
| 3 | 2 | 14b | 54 | 51 |
Table 5.
Overflow spill volume reduction achieved in the Arendonk catchment model for the 3-year rainfall series based on the numbers and types of intervention measures that were implemented (the overflow spill volume discharged at the regulated CSO in the baseline network was equal to 86,230 m3).
Table 5.
Overflow spill volume reduction achieved in the Arendonk catchment model for the 3-year rainfall series based on the numbers and types of intervention measures that were implemented (the overflow spill volume discharged at the regulated CSO in the baseline network was equal to 86,230 m3).
| Configuration | Number of FCDs | Number of SuDS Zones | Spill Volume Reduction Compared with Baseline Network (%) |
|---|---|---|---|
| 6a | - | 3 | 11 |
| 9a | 1 | 3 | 23 |
| 12a | 2 | 3 | 36 |
| 13a | 3 | 1 | 36 |
Table 6.
Overflow spill volume reduction achieved in the Zona Central catchment model for the 1-year rainfall series based on the numbers and types of intervention measures that were implemented (the overflow spill volume discharged at the regulated CSO in the baseline network was equal to 23,650 m3).
| Configuration | Number of FCDs | Number of SuDS Zones | Spill Volume Reduction Compared with Baseline Network (%) |
|---|---|---|---|
| 6b | - | 3 | 13 |
| 9b | 1 | 3 | 30 |
| 12b | 2 | 3 | 38 |
| 14b | 3 | 2 | 45 |
Publisher’s Note: MDPI stays neutral with regard to jurisdictional claims in published maps and institutional affiliations. |
© 2022 by the authors. Licensee MDPI, Basel, Switzerland. This article is an open access article distributed under the terms and conditions of the Creative Commons Attribution (CC BY) license (https://creativecommons.org/licenses/by/4.0/).
Share and Cite
MDPI and ACS Style
Eulogi, M.; Ostojin, S.; Skipworth, P.; Kroll, S.; Shucksmith, J.D.; Schellart, A. Optimal Positioning of RTC Actuators and SuDS for Sewer Overflow Mitigation in Urban Drainage Systems. Water 2022, 14, 3839. https://doi.org/10.3390/w14233839
AMA Style
Eulogi M, Ostojin S, Skipworth P, Kroll S, Shucksmith JD, Schellart A. Optimal Positioning of RTC Actuators and SuDS for Sewer Overflow Mitigation in Urban Drainage Systems. Water. 2022; 14(23):3839. https://doi.org/10.3390/w14233839
Chicago/Turabian StyleEulogi, Marco, Sonja Ostojin, Pete Skipworth, Stefan Kroll, James D. Shucksmith, and Alma Schellart. 2022. "Optimal Positioning of RTC Actuators and SuDS for Sewer Overflow Mitigation in Urban Drainage Systems" Water 14, no. 23: 3839. https://doi.org/10.3390/w14233839
Note that from the first issue of 2016, this journal uses article numbers instead of page numbers. See further details here.