
Risk Analysis of Reservoir Resettlers with Different Livelihood Strategies

1
School of Water Resources and Hydropower Engineering, North China Electric Power University, Changping District, Beijing 102206, China
2
School of New Energy, North China Electric Power University, Changping District, Beijing 102206, China
*
Author to whom correspondence should be addressed.
Water 2022, 14(21), 3530; https://doi.org/10.3390/w14213530
Submission received: 7 October 2022
/
Revised: 31 October 2022
/
Accepted: 31 October 2022
/
Published: 3 November 2022
Abstract
:With the increase of economic strength and technological advancement, financial and technical issues are becoming less and less constraining for the construction of water conservancy and hydropower projects, and the resettlement of reservoir resettlers has become the most critical factor in determining the success or failure of the construction. This study constructs a risk analysis framework for reservoir resettlers’ livelihood strategy transformation from the perspective of “resilient livelihoods”, characterizing their risk exposure with a comprehensive risk index and testing the effectiveness of the framework through robustness analysis. The framework was used to analyze the risk of reservoir resettlers in Guangdong Province, from which we found that the degree of risk and the type of vulnerability faced by resettlers with different livelihood strategies differed significantly, and we discussed each of them to help resettlers minimize the possible harm that they might suffer from. Thus, this framework can help reservoir resettlers to achieve sustainable development to a certain extent and also provide useful suggestions for policy makers to ensure the smooth construction of water conservancy and hydropower projects.
1. Introduction
Engineering resettlers (involuntary displacement of population caused by the construction of the project) occupies a pivotal position in China’s resettlers category, of which the subcategory of reservoir resettlers (i.e., water engineering resettlers) is an important part. The definition of reservoir resettlers is “people who have to be relocated to other places according to government arrangements due to the needs of water conservancy projects”. According to the existing classification standards, the vast majority of reservoir resettlers belong to the category of involuntary domestic engineering resettlers [1]. The spatial area of their relocation is mainly from rural areas to other rural areas. This change in spatial area leads to significant changes in the natural capital of reservoir resettlers [2]. For example, the loss of original arable land can cause the marginal labor output rate of agriculture to plummet or even fall to zero, and resettlers experience more serious human–land conflict than ordinary farmers [3]. This has undoubtedly aggravated the status quo of China’s dualistic economic structure, which has resulted in a large labor surplus [4]. The most effective way to resolve the so-called “Three Rural Issues” is to break the dual economic structure between urban and rural areas [5].
What are these “Three Rural Issues”? In brief, these are the problems of agricultural production, rural backwardness, and the need to protect farmers’ rights and income growth [6]. The issue of landless peasants has gradually become a new theme of the “Three Rural Issues” in the new era [7]. Some scholars have proposed that the issue of reservoir resettlers should be considered in conjunction with the issue of landless farmers [8,9,10,11]. However, in view of the special characteristics and sensitivity of this group, more scholars have focused on how to improve their livelihoods [12,13,14]. The choice of livelihood restoration strategies is crucial to increasing the amount of livelihood capital available.
When considering the livelihood strategies of reservoir resettlers, it can be readily perceived that they are gradually shifting from traditional agricultural production to nonagricultural production, and this shift is spatially manifested in the form of surplus labor mobility, which supports Lewis’s theory that the core problem of dual economic structure is the flow of labor from rural to urban areas [4]. Domestic and foreign scholars alike have studied labor mobility from various perspectives. Todaro focuses on the mobility motive and argues that the labor force population flowing into cities is positively related to the difference in expected income between urban and rural areas [15]. Ravenstein, Bagne, and E.S. Lee proposed and improved the “push–pull theory”, which provides a more general model for the study of population mobility [16,17,18]. Chen Jiyuan constructed a push–pull model of rural surplus labor transfer in the context of China’s national conditions. [19] Zhang Kun modified the “Todaro Model” by combining the actual situation of rural population mobility and the push–pull theory in China [20]. For his part, Zheng Chunyong argued that the push–pull model is no longer applicable to the new situation of rural labor flow in China and accordingly proposed the “Five Forces Model” [21].
Under the “Rural Revitalization Strategy” proposed in the 19th National Congress, the comprehensive promotion of rural revitalization has become the next priority after poverty eradication [22]. The trend of labor mobility has also changed significantly. According to the results of the seventh national census, the population of separated households in China was 492.76 million; of these, 116.94 million were in municipal areas and 375.82 million were part of the mobile population. Compared with 2010, the population of separated households increased by 88.52% overall, with the population of separated households in municipal areas increasing by 192.66%, while the mobile population increased by 69.73%. From the above data, it is clear that the population moving within the city jurisdiction has increased dramatically in recent years, far exceeding the growth rate of the cross-city population, a significant portion of which is a returning population. Population return flow is considered to be an important engine of promoting the development of urbanization nearby and in place in central and western China. Ren Yuan proposes that labor force return flow, as an endogenous reverse flow in the urbanization process, represents a supplementary mechanism for rural–urban mobility and labor market balance, as it promotes urbanization and balanced urban–rural development together with rural–urban mobility [23]. Cheng Guangshuai contends that some returned entrepreneurs promote the development of county economies [24]. Jing Xiaofen and Li Nan studied the influencing factors of the labor force’s willingness to return to their hometowns [25,26]. For their part, Gao Genghe, Wang Liwei, and Lin Liyue analyzed the influencing factors of the spatial choice intention of labor returning [27,28,29,30].
The rural–urban mobility and urban–rural return patterns of the remaining labor force of reservoir resettlers are the spatial manifestation of income deagrarianization, which relates to decisions resettlers have made after considering their social, family, and personal conditions and making what they perceive to be the best available choice. In this paper, we take the special group of reservoir resettlers as the research object and study the potential risks to this group from the perspective of income deagrarianization. Specifically, we compare the risks associated with three livelihood strategies (pure-agricultural employment: over 80% of farm income; agriculture-and-employment resettlement: 20–80% of farm income; nonagricultural employment: less than 20% of farm income), measure the comprehensive risk index, in order to help reservoir resettlers minimize the possible harm, help them achieve sustainable development, and ensure the smooth implementation of water conservancy and hydropower projects.
We constructed a schematic diagram of the change in household livelihoods of reservoir resettlers over time as shown in the Figure 1. The remaining chapters are organized as follows. In Section 2, we compare the relevant domestic and foreign studies and outlines the shortcomings of the existing research; in Section 3, we focus on the construction of the risk analysis framework, including the establishment of the index system and the construction of the comprehensive risk index measurement model; in Section 4, we use Guangdong reservoir resettlers as the data source for the case study, calculate the comprehensive risk index, conduct risk–benefit analysis, and make corresponding recommendations according to different resettler livelihood strategies; and finally, in Section 5, we discuss the problems identified during the case study and attempt to find suitable solutions.
2. Literature Review
The “resilient livelihoods” was first introduced as part of “sustainable livelihoods” [31], which means that households respond to challenges by shifting their livelihood patterns in the face of change [32,33], and the change in livelihood strategies of reservoir resettlers is a tangible expression of “resilient livelihoods”. Most of the existing studies focus on how to measure household livelihood resilience, for example, Marschke and Berkes proposed using local residents’ satisfaction to measure resilience [34]; Fang Yiping et al. proposed to use practical methods to measure livelihood quality, livelihood promotion, livelihood provision, and disaster stress [35]; Sina et al. proposed a framework for livelihood resilience that includes four dimensions: individual livelihood coping ability, individual well-being, access to livelihood resources, and sociophysical robustness of the local community [36]. Meanwhile, a number of scholars have extended resilience to other research areas, such as Drago and Gatto, who suggested that energy policies are crucial to maintain the sustainability of renewable energy [37,38,39]; Aldieri et al. pointed out that developing countries suffer from greater energy vulnerability and need to enhance national energy by improving renewable energy innovation to resilience [40].
This study does not focus on the measurement of “resilience” per se but rather on the analysis of the challenges that reservoir resettlers may face in the process of livelihood recovery (changing livelihood strategies) and make appropriate recommendations to reduce the potential harm caused by these challenges. However, due to the differences in national conditions, the focus of research into migration (resettlers) at China and abroad differs greatly. Foreign scholars (scholars not from China) mostly take international immigration or refugees as research objects, and their research results have certain reference value for China’s resettlers research; for their part, domestic scholars (scholars from China) focus more on research related to engineering resettlers. Thus, in this section, we review the results of research conducted by foreign and domestic scholars respectively.
Foreign scholars have conducted more comprehensive studies on migration-related risks. The most authoritative of these is the impoverishment risks and reconstruction model (IRR) proposed by Cernea, which starts from the three core concepts of risk, poverty, and reconstruction, then goes on to reveal eight major poverty risks that involuntary migrants may encounter (loss of land, unemployment, loss of housing, marginalization, food insecurity, morbidity and increased mortality, loss of access to public property and services, and social disintegration), along with measures for avoiding each of these risks [41]. Vromans, who studied women as a vulnerable group in the context of international immigration (specifically refugees), interviewed different migrant women through dialogues in focus groups and drew several conclusions: that current resettlement strategies have failed to help them gain access to new social networks; that gender, background, and cultural barriers lead to a risk of social disconnection; and that severe economic hardship and limited financial literacy leave women and their families in chronic poverty [42]. Nikuze suggests that stress and fear in the prerelocation phase, along with insecurity of tenure in informal settlements, financial instability, social fragmentation, and food insecurity in the postrelocation phase, can lead to serious risks of impoverishment [43]. For his part, Xu Hongzhang focuses on the process of hydropower development to argue that asymmetric rights and conflicting resources between the local government as a stakeholder and the resettlers can lead to a poverty trap, and moreover that sustainable resettlement can only be a tool for just governance if there is sufficient consensus among all stakeholders on a transparent, accountable, and cooperative approach [44].
Some domestic scholars have made significant modifications to the IRR model based on the national conditions of China. Wei Shan pointed out that it is difficult to measure the social loss experienced by resettlers using the IRR model and accordingly introduced the control right of resettlers and created the RCR model [45]. The model of “Risk, Reconstruction and Responsibility” was proposed by Xun Houping, who combines the assumption of continuous development risk and the IRR model from the perspective of “responsibility” in the process of resettler reconstruction [46]. Some other scholars have studied the risks that resettlers may encounter from other perspectives. For example, Chen Shaojun incorporated a large number of empirical analyses to point out that the main reasons for the risk of poverty among resettlers are defects in resettlement planning, the loss of land and other means of production, unreasonable benefit distribution mechanisms, a weak economic base, difficulties in resettlement, social discrimination, poor psychological quality of migrants, great psychological pressure, and the general low level of cultural knowledge and skills among migrants, in addition to other factors [47]. Xu Guoliang points out that if land is treated as part of property only from a profit perspective, there may be a risk of neglecting resettlers’ vernacular ties [48]. Tang Jianjun believes that in transitioning from a village and agriculture-based lifestyle to an urban one, there is a risk that resettlers will find it difficult to integrate into the new environment [49]
From the above literature review, it can be observed that the existing analyses of risks related to resettlers focuses primarily on the study of the risks that may lead resettlers to fall into poverty during resettlement, while a few scholars have conducted a more multidimensional risk analysis. In this paper, we argue that reservoir resettlers, to some extent, sacrifice their own interests for national development and should accordingly be compensated and assisted throughout the entire resettlement life cycle; thus, the analysis of risks arising after their resettlement is also highly necessary.
3. Risk Analysis Framework
The risk assessment framework comprises three major parts: risk assessment, risk management, and risk communication. The risk analysis framework used in this paper is illustrated in the Figure 2.
3.1. Risk Assessment
It is generally accepted that risk is a system consisting of two parts: the probability of future occurrence of an adverse event and the loss resulting from the adverse event [50,51]. Adverse events, the possibility of future occurrence of adverse events, and losses caused by adverse events are the three elements of risk [52]. This section analyzes the first two elements of the three elements, divided into two parts: risk perception and risk identification. Risk perception mainly involves sorting out the possible sources of risk and is used to initially construct the risk source index system of reservoir resettlers in this paper; moreover, risk identification involves using qualitative and quantitative analysis methods to classify the possibility and severity of risk occurrence on the basis of clarifying each risk source.
3.1.1. Risk Perception
Risk perception is the most fundamental aspect of risk analysis; as it determines both the completeness and the accuracy of the subsequent analysis, its importance cannot be overstated. When scholars study resettler-related issues, they often begin from a multidimensional perspective. However, depending on the specific research content, there are certain differences in the way these dimensions are classified. Among the foreign scholars who have studied the integration of international migrants into the societies of their place of migration, Spencer proposes that social, structural, cultural, political, and identity-related factors should be considered influential [53]; Caselli uses culture, society, economy, and politics as indicators [54]; for his part, Fajth argues for the integration of economic, social, and identity factors [55]. In contrast, Harder argues that six aspects should be included: psychological, economic, political, social, linguistic, and navigational [56]. In the study of poverty risk among involuntary resettlers, domestic scholars usually focus on both economic and social aspects [57,58]. After comparing the research results of various scholars with the characteristics of the research object of this paper, in this paper, we ultimately select economic, social, and psychological factors as the primary indicators of risk sources. A brief description of these primary indicators is provided below.
- (1)
- Economic risk
Economic risk refers to the risk that differences in livelihood strategies may cause economic stress to reservoir resettlers. Some scholars define it as “livelihood risk”, and most of them analyze it only from the perspective of income; however, expenditure may also lead to the risk of poverty for resettlers [59]. Accordingly, in this paper, both income and expenditure are considered. For pure-agricultural-employment resettlers, low income is the main economic pressure they face, and low income inevitably leads to limited funds available for living expenses, resulting in a lower standard of living. For nonagricultural-employment resettlers, the economic risk they face is mainly their own lack of ability, resulting in weak employment competitiveness; most of them work in lower-paid, poorer environments and face a greater risk of unemployment, while at the same time, the high cost of living outside the workplace further increases their economic pressures. Agriculture-and-employment resettlers are more balanced in all aspects. Combined with the above analysis, in this paper, we assess income risk in terms of income level and income stability, while the expenditure risk mainly relates to the level of living expenses and the proportion of expenses to income.
- (2)
- Social risk
Social risk refers to the risk that differences in livelihood strategies may cause a rupture in the social networks of reservoir resettlers, which in this paper refers mainly to socially constructed social networks, i.e., the connections and interactions between resettlers and members of other relevant social groups, which belong to the category of individual–personal interactions [60]. In recent years, many scholars have conducted research into the social stability risk assessment of major engineering projects [61,62], which involves a wide range of aspects but lacks analysis from the perspective of resettlers. In this paper, from the perspective of resettlers, social risk is divided into external and internal dimensions: here, external refers to the degree of rapport between resettlers and neighbors, and the secondary index corresponds to “neighborhood relationships”; moreover, internal refers to the degree of rapport between resettlers and family members, and the secondary index corresponds to “family relationships.”
- (3)
- Psychological risk
The common definition of psychological risk is “a risk factor that increases the chance of risky accidents and expands the degree of loss due to people’s carelessness and indifference”. However, in this paper, we use a different definition of psychological risk, stating that “differences in livelihood strategies may bring psychological harm to individuals and families of reservoir resettlers”, and noting that this harm is sometimes experienced after a certain delay. Since there are few studies on this topic, in this paper, we use self-evaluation of resettlers’ satisfaction with their current life and optimism about their future life as indicators of psychological risk.
Through the above analysis, the reservoir resettlement risk source index system is constructed and presented in Table 1 below.
3.1.2. Risk Identification
The main components of risk identification are the magnitude of the likelihood of an adverse event and the severity of the adverse event after it occurs. These are referred to as risk probability (P) and risk impact (C), respectively, and are analyzed using quantitative calculation methods.
While there are many methods of quantitative risk analysis, the two main approaches are the relative value method and the absolute value method [63]. The reliability of these methods is influenced by the type of risk and the purpose of the study. In this paper, we mainly use the multifactor weighted evaluation method. The first step is to establish indicators at each level (the risk perception part has been established) based on the composition of risk elements. The lower-level indicators are weighted and summed to obtain the upper-level indicator values, and the primary-level indicators are used to obtain the comprehensive risk index values by employing a specific algorithm [64]. This method is more commonly used in the analysis of relative risk values, as the system of indicators is constructed with full consideration of operability and feasibility [65].
The determination of weights in weighted evaluation is important; thus, sufficient care should be taken when choosing the method of weight determination. Huang Chongfu believes that the commonly used AHP is simply a mathematical packaging of the subjective judgment method [66]. However, risk itself is subjective, and the use of purely objective weight calculation methods tends to focus only on the information of the data itself; thus, this paper uses the combined AHP–Entropy weighting method, which combines subjective and objective evaluation methods to make the weight establishment more scientific, as has been confirmed by scholars [67].
The detailed steps of the multifactor weighted evaluation method are as follows:
- Data standardization
Here, Yij is the standardized value of the jth indicator of the ith object; Xij is the original value of the jth indicator of the ith object; Xmin and Xmax are the minimum and maximum values of the jth indicator, respectively.
- 2.
- Entropy weighting method to determine objective weights
Here, pij is the indicator characteristic weight; m is the total number of objects; n is the total number of indicators; Ej is the entropy value of the jth indicator; Wj1 is the objective weight.
- 3.
- AHP determines subjective weights
The judgment weight matrix is constructed on the basis of determining objective weights via the entropy weighting method according to the numerical scale of relative importance [68]. Since this paper involves secondary indicators, two-layer judgment weight matrices need to be constructed separately. Moreover, in order to ensure the logical self-consistency of the judgment matrix, a consistency test is required, the formula for which is as follows:
Here, CI is the consistency index; λmax is the maximum characteristic root; RI is the random consistency index (the standard value is shown in Table 2 below); moreover, CR is the random consistency ratio, and when CR < 0.1, this indicates that the judgment matrix has good consistency.
- 4.
- Determine the portfolio weights
The combination weights are the weighting of the objective and subjective weights with the following formula:
Here, Wj is the combination weight, Wj1 is the objective weight, and Wj2 is the subjective weight.
- 5.
- Calculate the composite risk index
From the weights, each P and C value is calculated, after which the Ri value is obtained by the following equation:
Since risk is often characterized by a certain “bucket effect” (i.e., the single risk factor with the greatest degree of risk tends to have a much greater impact on the composite risk level than other risk factors), the “mean and root mean square” formula, which focuses more on the maximum value, is introduced [69]:
- 6.
- Risk Level Classification
Due to the introduction of weight coefficients, the commonly used risk classification criteria (Table 3) are no longer applicable. In this paper, the K-means clustering method is employed to cluster the calculated comprehensive risk index of the sample to determine the grading criteria; this approach better reflects the relative nature of risk.
The K-means clustering method is a distance-based clustering algorithm that uses distance as an evaluation index of similarity: i.e., the closer two objects are to each other, the higher their similarity. The idea behind the implementation is that a given sample set is divided into K clusters according to the size of the distance between each sample data point, and the points within each cluster are closely linked together, while the clusters are as far away from each other as possible; in this way, compact and independent clusters can be obtained. The calculation steps are as follows:
① Determine the number of clusters K according to the actual demand.
② The initial K mean points m1, …, mK are given according to the data set distribution.
③ Assign each data point to a cluster such that the sum of squares within the group is minimized; i.e., find the cluster Si that satisfies
where mi is the mean value of all points in Si.
④ For each cluster obtained in the previous step, the center of the graph in the cluster is used as the new mean point:
where t is the number of iterations calculated.
⑤ Repeat ③ until convergence is reached (i.e., when the observations assigned to each cluster no longer change). The K mean values m at this point are used as the grading criteria.
3.2. Risk Management
This section focuses on the last of the three elements of risk, i.e., the analysis of possible losses due to adverse events. A more detailed discussion of the data obtained in the risk assessment section is also provided, and corresponding strategies to address and prevent risks are proposed.
3.3. Risk Communication
Why do reservoir resettlers choose to make a change in their livelihood strategy? The fundamental reason is to pursue a better life, but the question of whether the risks and benefits of livelihood strategy change are matched merits investigation. Risk communication is mainly performed to analyze the benefits and risks of livelihood strategy change for reservoir resettlers, as well as to measure the benefits of different livelihood strategies by calculating the average risk–return rate of resettlers, which will help resettlers judge whether they should make a livelihood strategy change and what livelihood strategy will be the most suitable for their current and future lives.
3.4. Robustness Analysis
Robustness originates from engineering and refers to the ability of a system to maintain continuous system operation when subjected to unanticipated external perturbations or uncertainty in internal set parameters [70], and is considered in the fields of ecosystem resilience, automatic selection for the evolution of biological complexity, distributed feedback in immune systems, and economic gaming in economic and social systems. In this paper, we refer to the evaluation sample capacity method in the evaluation model robustness metric by Zhang Lijun [71], and the steps are as follows.
- Select the initial sample capacity m and the benchmark sample capacity m1.
- Starting from the initial sample capacity m and gradually decreasing to m1, (m − m1 + 1) results are obtained according to the calculation Equations (1) to (12), where the risk level is assigned from 1 to 5 from very low to very high, respectively.
- Calculate the Kendall’s concordance coefficient according to the following equations.
- 4.
- When the sample size changes, the more obvious the change in wj is, the less robust the model is, and the opposite is true.
4. Case Study
4.1. Data Sources
Guangdong Province is the economically strongest province in China, its gross domestic product has ranked first in the country for many years, the number of reservoir resettlers in the province is large, and livelihood strategies in the region are diverse. Since 2011, my project team has visited Guangdong Province every year to conduct monitoring and evaluation surveys, and the data are comprehensive and real, so the monitoring and evaluation data of the implementation of the late support policy for large and medium-sized reservoir resettlers in Guangdong Province in 2020 were selected as the data source of this paper. Data of this survey involving a total of 330 reservoirs (including 32 large reservoirs and 298 medium-sized reservoirs) and a total of 1,544,600 resettlers. Subsequently, 300 resettlers (100 each of pure-agricultural-employment, agriculture-and-employment, and nonagricultural-employment reservoir resettlers) were selected for the questionnaire survey. The risk probability of income stability was calculated with reference to the urban registered unemployment rate and the crop disaster rate, while the remaining factors were scored with reference to data from the resettlers sample (Xi and Yi according to different indicators). To facilitate participant understanding, the questionnaire employed a 10-point scale. The correspondence between the content of the questionnaire and the indicators of risk sources of reservoir resettlers, along with the risk probability and risk impact calculation formulae for each indicator, are shown in Table 4 below.
The urban registered unemployment rate in Table 4 above uses the average value of the urban registered unemployment rate of 2.45% from the 2010–2020 Guangdong Statistical Bulletin of National Economic and Social Development, while the crop damage rate uses the average value of the ratio of crop damage area to crop planting area of 12.64% from the 2010–2020 Guangdong Statistical Yearbook; notably, the 2011 and 2012 crop planting area data are missing from this sample, so the average value of the remaining nine years is used as the agricultural income risk coefficient. The data for each year are shown in Table 5 below.
4.2. Analysis of Results
4.2.1. Comprehensive Risk Index Measurement
By applying Equations (1)–(8) to the data, the weights of each indicator were obtained and are listed in Table 6 below.
According to the above table, by applying Equations (9) and (10) to calculate the weighted average of the comprehensive risk index of resettlers with different livelihood strategies respectively, we obtain the following: the comprehensive risk index of resettlers with pure-agricultural employment is 0.0283, the comprehensive risk index of agriculture-and-employment resettlers is 0.0240, and the comprehensive risk index of resettlers with non-agricultural employment is 0.0248. These findings show that the risk associated with pure-agricultural employment is the largest, followed by nonagricultural employment, and that the agriculture-and-employment livelihood strategy is the least risky.
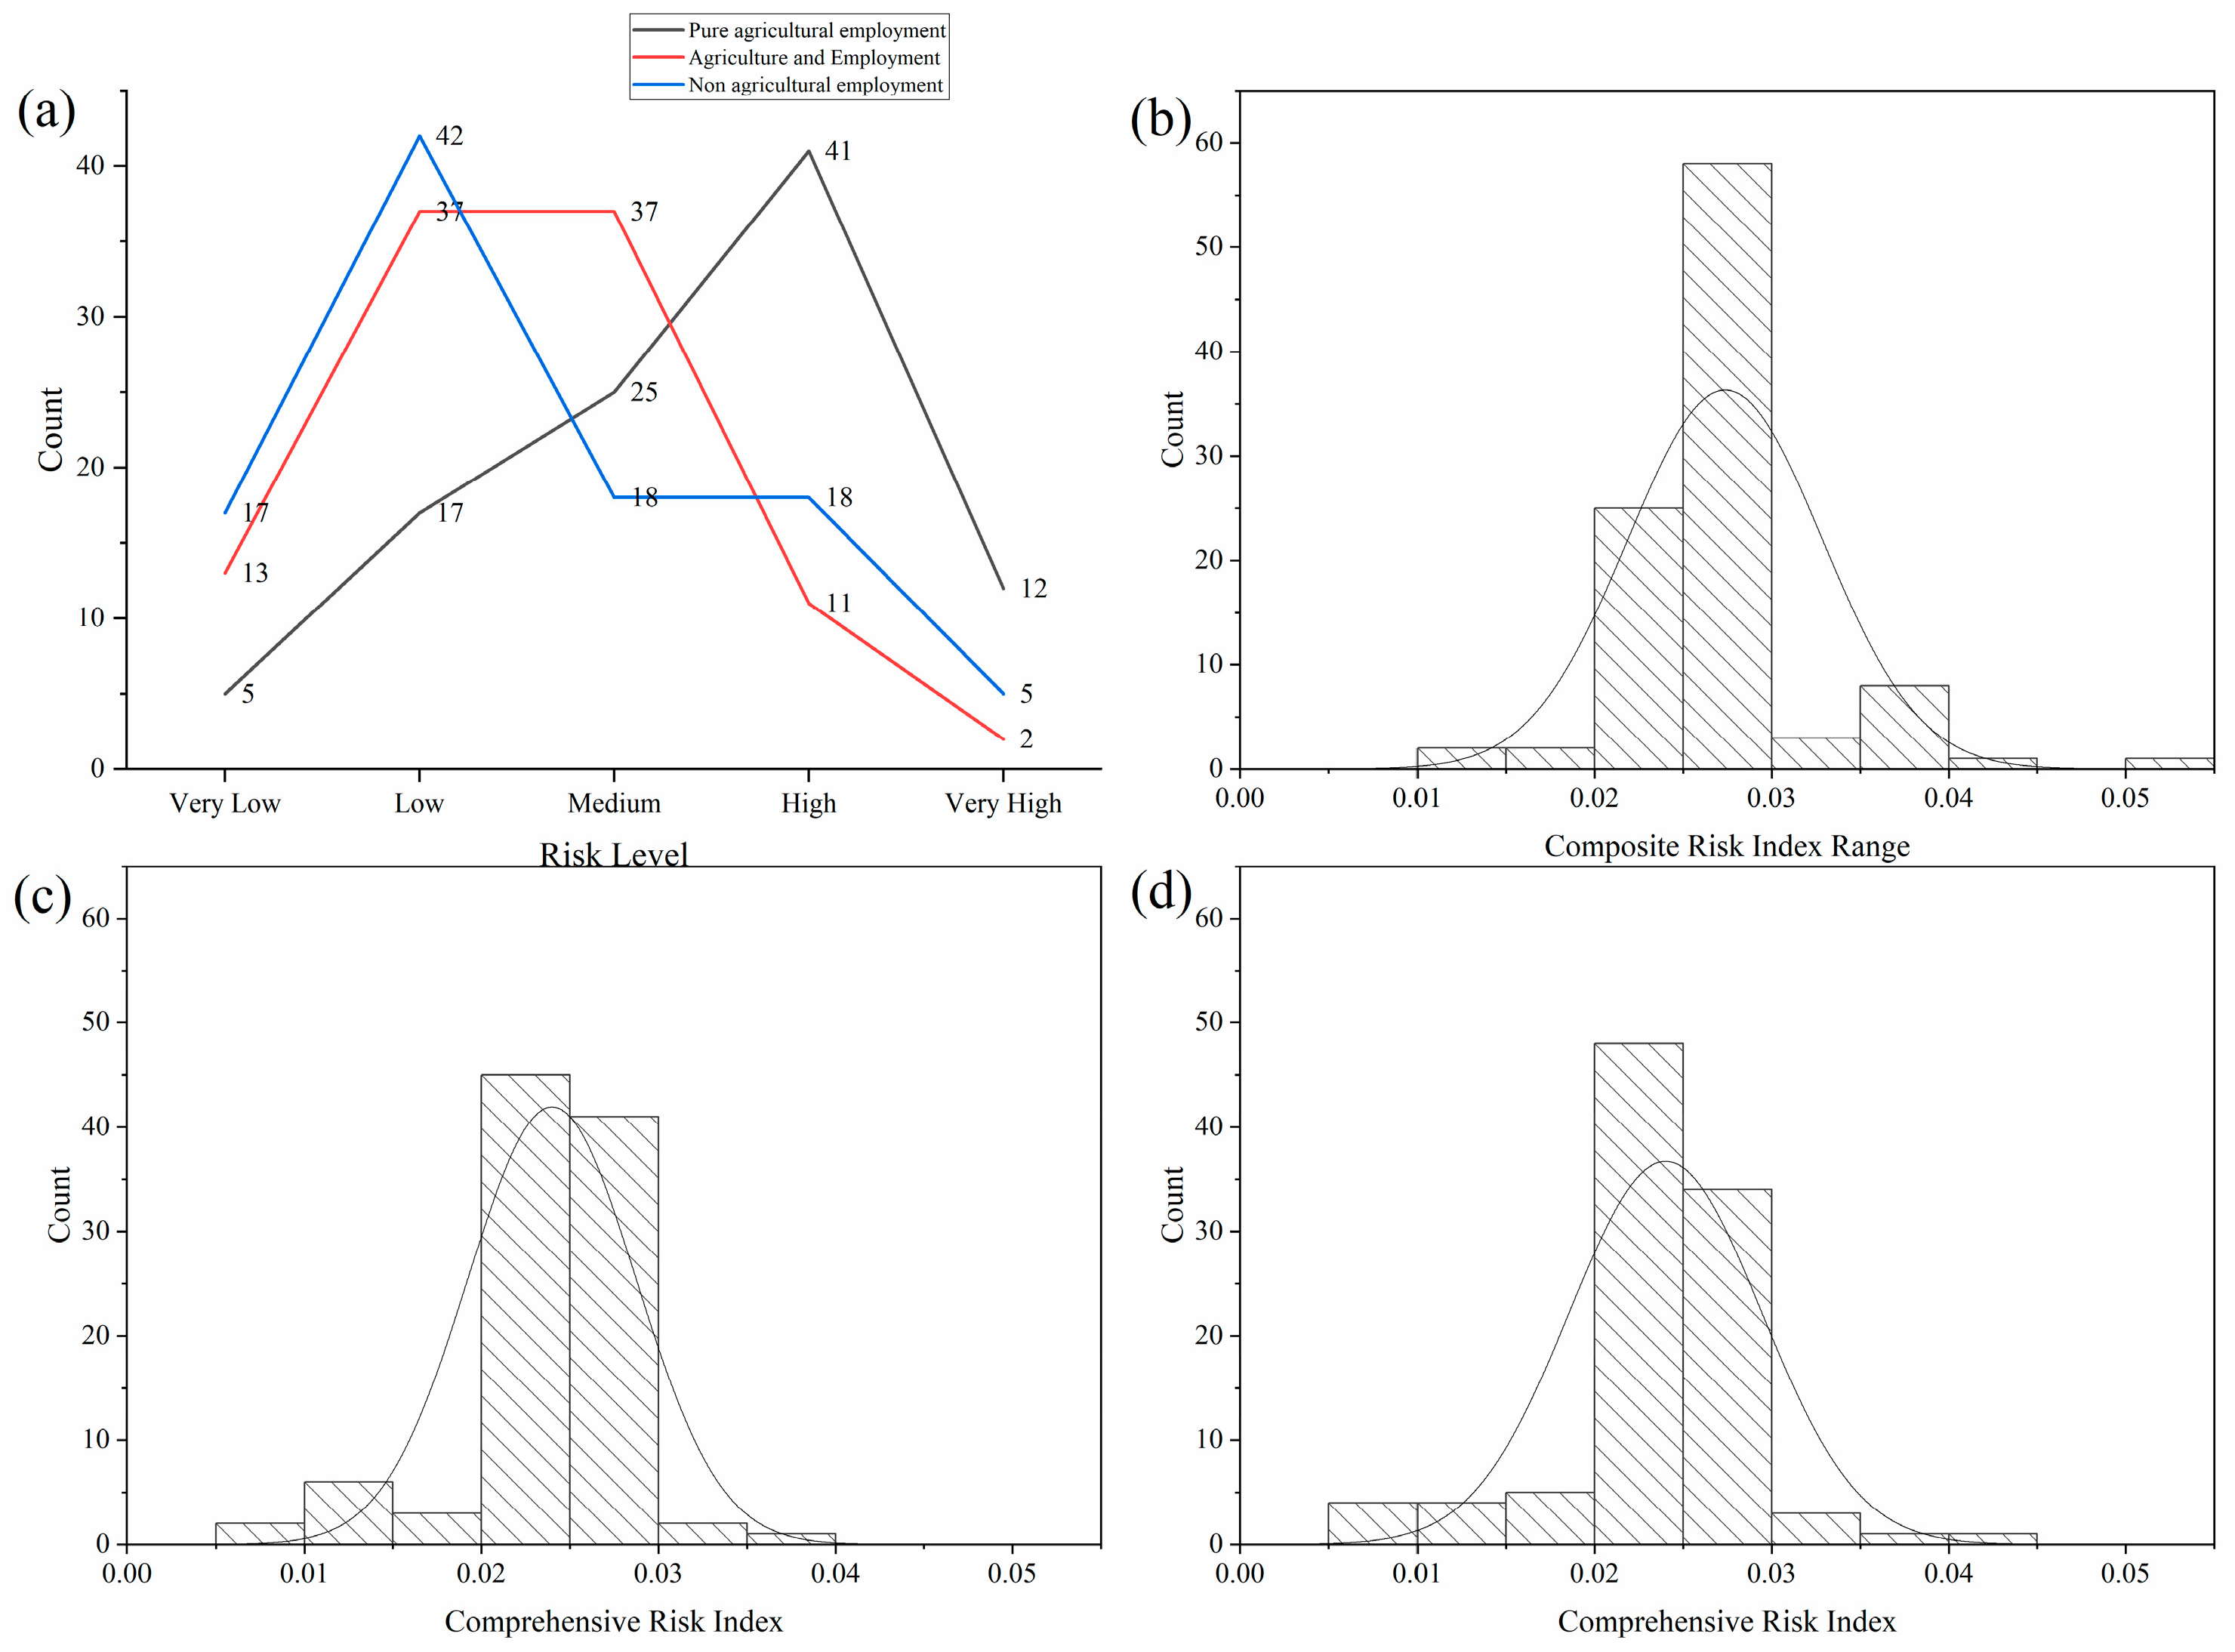
Similarly, Equations (1)–(10) were applied to obtain each migrant sample for comprehensive risk index calculation, and K-means cluster analysis in the SPSS software package was applied to classify the resulting comprehensive risk index of 300 migrant households. A K value of 5 was obtained, corresponding to five levels of comprehensive risk (very low, low, medium, high, and very high); the final cluster centers were 0.0211, 0.0235, 0.0257, 0.0286, and 0.0314, and the data were classified according to livelihood strategies to obtain the data in Table 7 below. The statistical table and the comprehensive risk indices of resettlers with different livelihood strategies were also plotted as a graph (Figure 3).
From the above graphical data, it can be seen that the distribution of the comprehensive risk index of reservoir resettlers with different livelihood strategies exhibits different patterns. The majority of resettlers with pure-agricultural employment (78%) are in the middle of and above the comprehensive risk level, with an obvious right shift from the center of the standard normal distribution of “high in the middle and low on both sides”, and the overall risk level is at a high level; the majority of agriculture-and-employment resettlers (87%) are in the middle of and below the comprehensive risk level, with a slight left shift from the center of the standard normal distribution; the majority of resettlers with nonagricultural employment (77%) are in the middle of and below the comprehensive risk level. Notably, there are significantly more nonagricultural-employment resettlers in the below-moderate risk region than agriculture-and-employment resettlers, as well as significantly more nonagricultural-employment resettlers in the above-moderate risk region than agriculture-and-employment resettlers, indicating that the polarization of resettlers with nonagricultural employment in the comprehensive risk level is more serious.
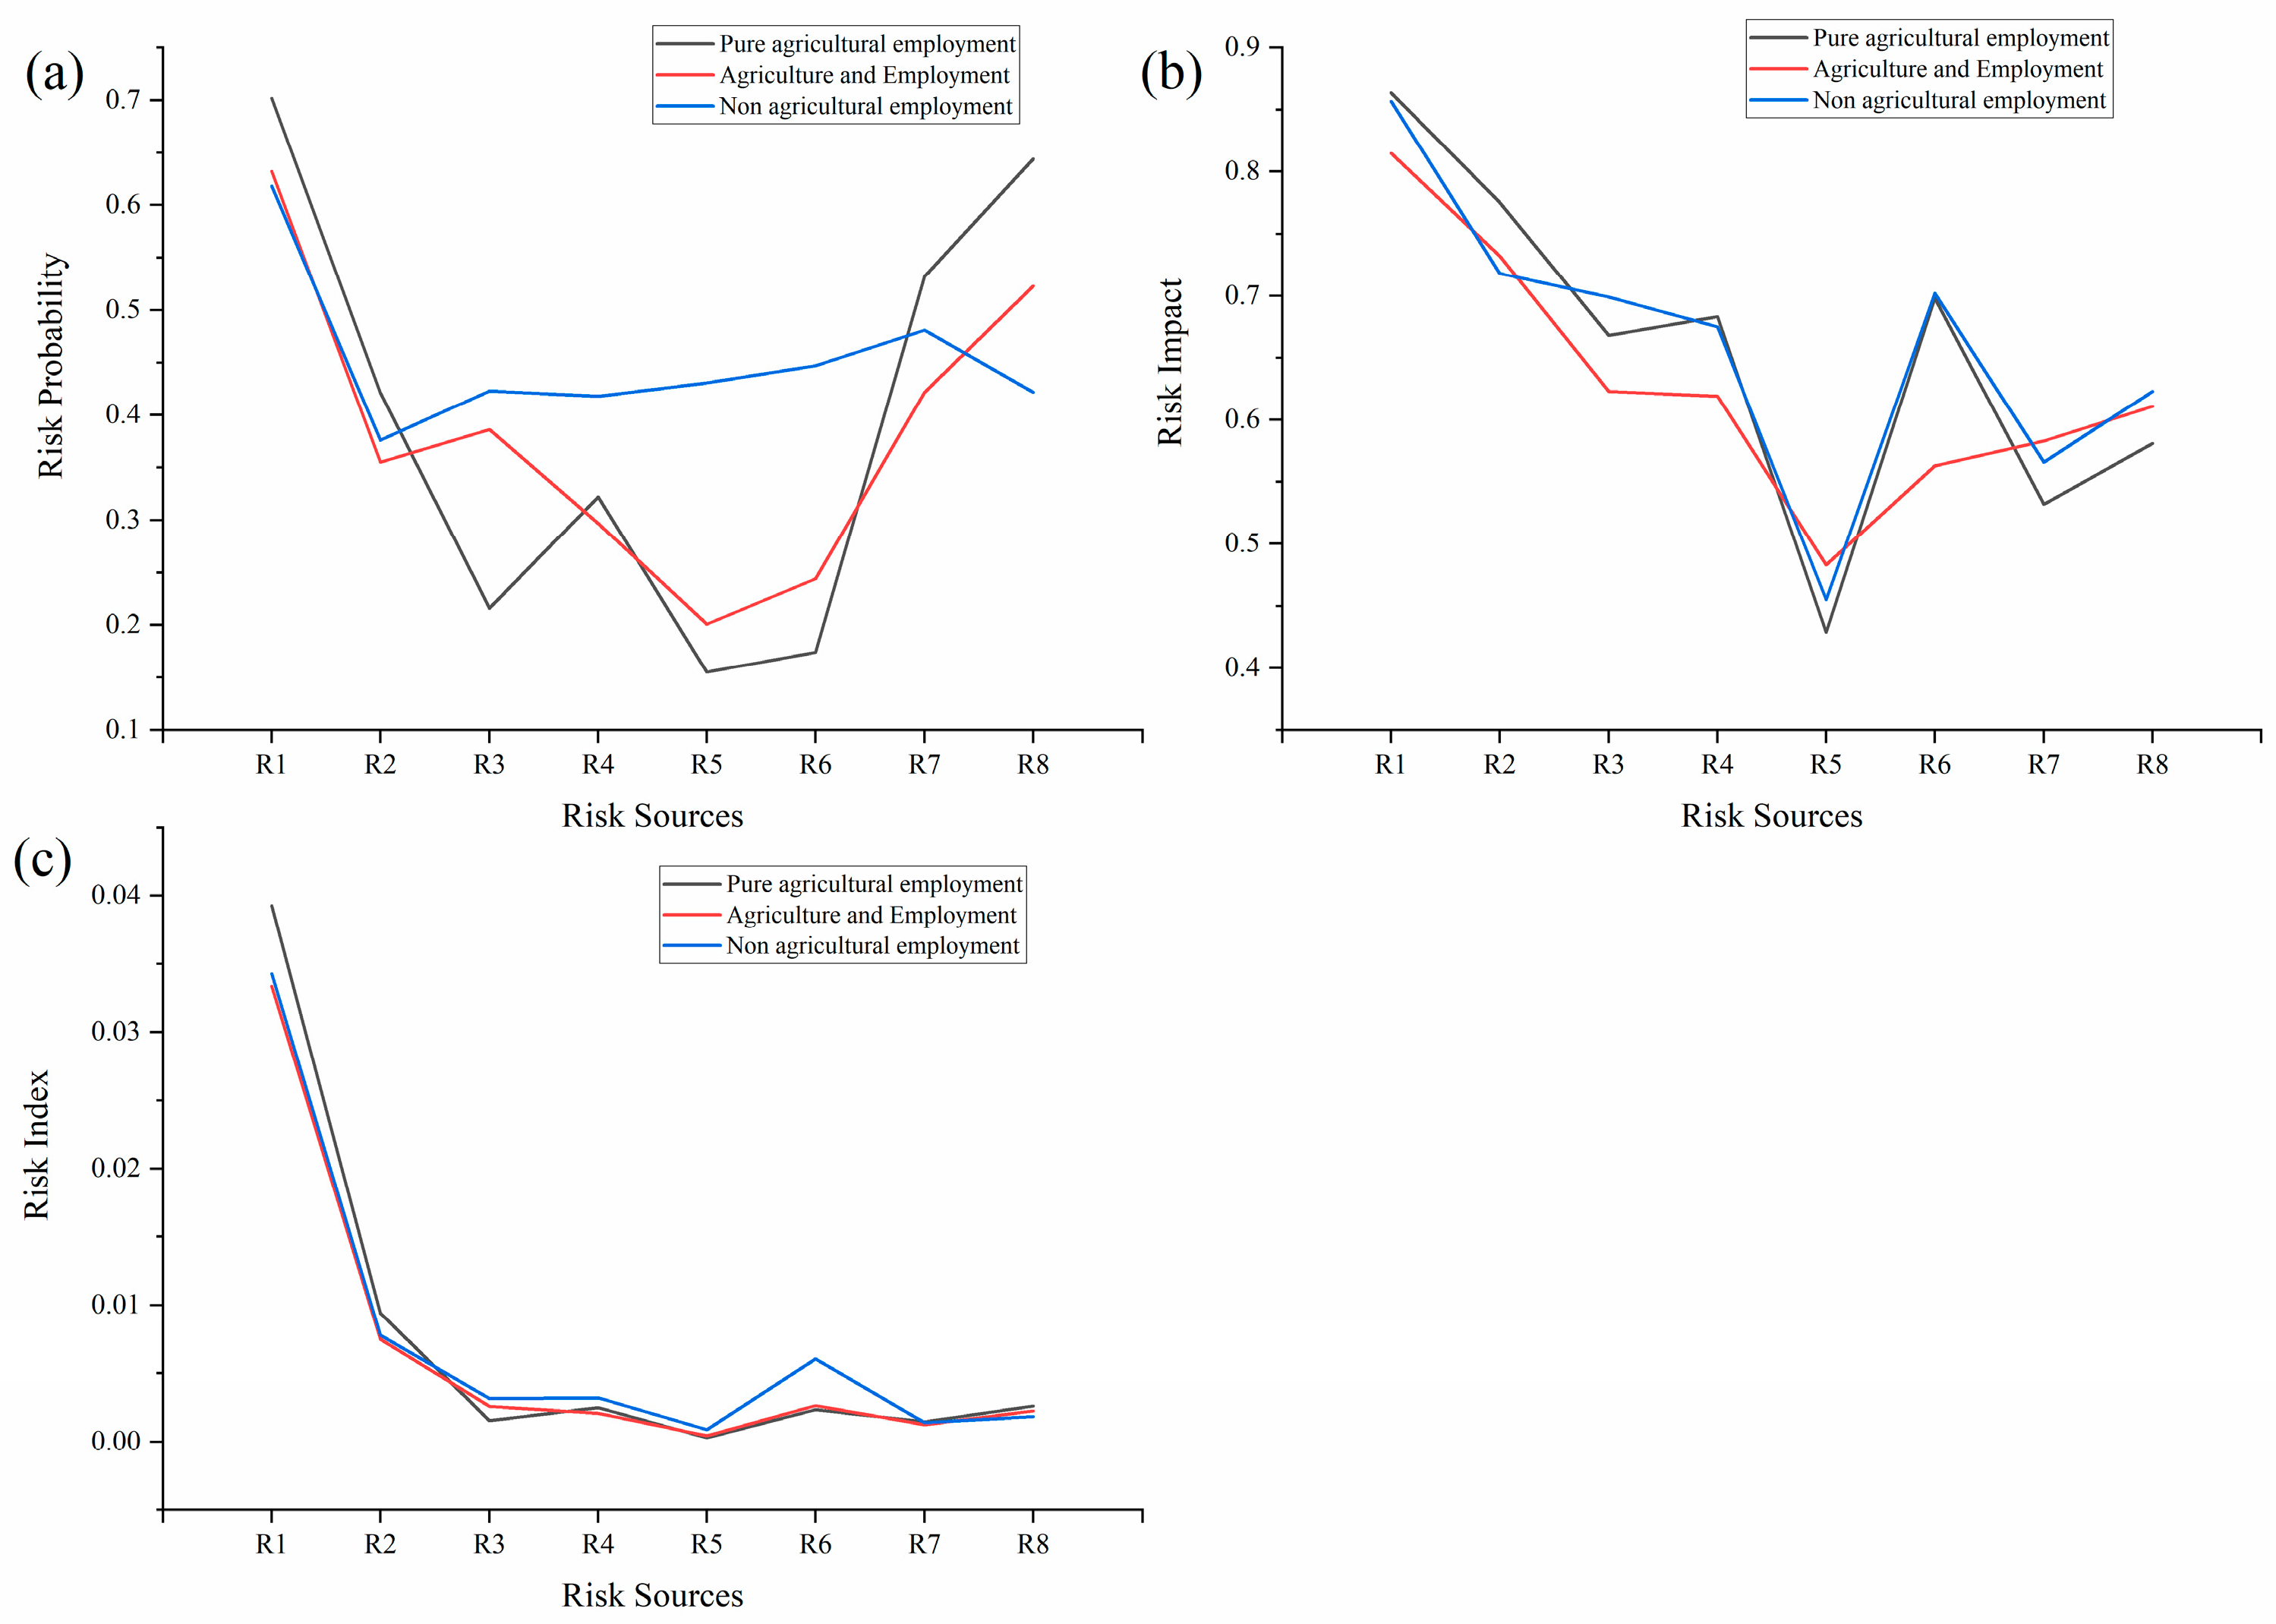
A more in-depth analysis reveals that there are also large differences in the risk indices corresponding to each source of risk for resettlers with different livelihood strategies (Figure 4). In terms of income level R1, the risk index, risk probability, and risk impact of pure-agricultural-employment resettlers are both the highest and significantly higher than the other two categories, while the risk index and risk probability of agriculture-and-employment and nonagricultural-employment resettlers are essentially comparable; moreover, the risk impact of nonagricultural-employment resettlers is significantly higher than that of agriculture-and-employment resettlers, indicating that the likelihood of risk and sensitivity to risk in terms of the income of pure-agricultural-employment resettlers are at the highest level, while agriculture-and-employment resettlers are better off overall than nonagricultural-employment resettlers. In terms of income stability R2, the pattern is essentially similar to R1. In terms of the expenditure level R3, the risk index of pure-agricultural-employment resettlers decreases significantly, while the overall risk level of non-agricultural-employment resettlers is significantly higher than that of the other two categories. In terms of expenditure as a share of income R4, the risk level of nonagricultural-employment resettlers is still at the highest level at this time, although the risk level of pure-agricultural-employment resettlers has also increased to a greater extent. In terms of neighborhood relations R5 and family relations R6, nonagricultural-employment resettlers are both at the vulnerable level, while pure-agricultural-employment resettlers are better off than agriculture-and-employment resettlers. In terms of satisfaction with current life R7 and optimism about future life R8, each of the three resettler livelihood strategy categories has advantages and disadvantages in terms of risk index, risk probability, and risk impact; the overall pattern shows that nonagricultural-employment resettlers are the best, agriculture-and-employment resettlers are the second best, and pure-agricultural-employment resettlers are the worst.
4.2.2. Robustness Analysis
The initial sample size was selected to be 300, the baseline sample size was 270, and the sample households of each of the three livelihood strategies were randomly reduced by one at a time to obtain the change in risk level as shown in Table 8 below.
From the above table, it can be seen that the Kendall’s concordance coefficient of the framework changes insignificantly when the sample size changes, so the robustness of the framework is excellent.
4.2.3. Risk-Benefit Analysis
As discussed in the previous section, the main reason why reservoir resettlers change their livelihood strategy is to improve their family’s standard of living, which is most intuitively reflected by the change of family income. Thus, in this section, the annual per capita disposable income of resettler families is used as the indicator of benefit. These data are obtained from the monitoring and evaluation survey on the implementation of the late support policy for large and medium-sized reservoir resettlers in Guangdong Province in 2020. The annual per capita disposable income of resettler families obtained from the survey is used as the benefit data, the annual per capita disposable income of rural residents in Guangdong Province is used as the cost data, and the risk–return rate is calculated by the following equation:
Here, Rr is the risk–benefit rate of individual resettler families, Income is the corresponding annual per capita disposable income of households, Cost is the annual per capita disposable income of rural residents in Guangdong Province, and is the average risk–benefit rate of resettler families with different livelihood strategies.
The average risk–benefit rates—of 4.6% for pure-agricultural-employment resettler families, 14.1% for agriculture-and-employment resettler families, and 19.8% for nonagricultural-employment resettler families—were obtained by calculation. These figures indicate that the shift in livelihood strategy to nonfarming has effectively and efficiently increased the income of reservoir resettlers.
5. Discussion
In the course of conducting the case study, it was found that the sensitivity of resettlers to different sources of risk varied considerably across livelihood strategies. When combined with the data obtained in the field survey, these findings led to the following reflections.
- Pure-agricultural-employment resettlers face greater income risks
From Figure 3, both in terms of income level and income stability, pure-agricultural-employment resettlers are significantly lower than the other two resettler livelihood strategy categories.
From the viewpoint of income level, due to the poor quantity and quality of the resettlement compensation land compared to their original arable land (however, even under the original production conditions, the income from pure agriculture is not high), the resettlers are unable to meet their family’s living expenses by farming alone. Although there are some logical contradictions, this is exactly the dilemma faced by some resettlers, who have no labor force to go out to work (either no young people or no competitiveness in employment), so they can only “actively” choose pure-agricultural-employment. Of course, there is also a small group of resettlers who have a strong sense of the countryside and believe that land is the guarantee of life (most resettlers have this idea, so they are generally willing to choose land resettlement, but this group of pure-agricultural-employment resettlers has a deeper sense).
From the viewpoint of income stability, the model of family-based farming and the low level of modernization of agriculture and rural areas lead to low levels of agricultural productivity and weak resistance to natural disasters, which is a common situation in China, and it is difficult to change without changing the employment strategy of resettlers, so we can start from the following two approaches. First, in the process of resettlement, different resettlement policies (under the premise that resettlers’ wishes are respected) could be adopted according to the different conditions of resettler families: for example, encouraging resettlers with better family economic conditions to choose landless resettlement while resettlers with poorer family economic conditions are encouraged to choose land resettlement; allocating the land of resettlers who choose landless resettlement to resettlers with land resettlement; and appropriately allocating the monetary compensation of resettlers with land resettlement to resettlers without land resettlement, i.e., “exchanging money for land” (the second is not intended to change the resettlement policy). In addition, the local government could actively promote and coordinate the planning of land transfer for nonagricultural-employment resettlers, making full use of arable land and improving agricultural intensification while safeguarding resettlers’ interests, and adjust the agricultural industry structure of pure-agricultural-employment resettlers according to local natural conditions, so that the agriculture and forestry activities performed are appropriate.
Overall, pure-agricultural-employment resettlers have greater nonautonomy in choosing livelihood strategies, they do not have the ability to choose other livelihood strategies, and are thus compelled to select pure-agricultural-employment. This proportion of resettlers is in a disadvantaged position relative to the group of resettlers as a whole, meaning that they require more support, such as providing them with long-term compensation and some local jobs that do not require skills (e.g., cleaners, janitors, etc.).
- 2.
- Agriculture and employment is a transitional livelihood strategy
From the previous analysis, it can be seen that agriculture-and-employment resettlers are in a more balanced position in terms of risk and return, which is in line with the current livelihood situation of resettlers. However, agriculture-and-employment resettlement does to some extent restrict settlers’ choice of employment, such as local odd jobs; moreover, with the passage of time, the growth rate of the agricultural income of resettlers engaged in small-scale farming will be slower than that of their nonfarm income, meaning that the disadvantages of agriculture-and-employment resettlement will gradually become obvious. At the same time, small-scale farming is also a waste of land resources for the country. Therefore, in this paper, we argue that while the agriculture-and-employment strategy is a transitional livelihood strategy and a pragmatic and wise choice for resettlers, the body responsible for resettler management has the obligation to remind them to prepare for possible changes, such as further increasing the proportion of household nonfarm income through the application of rural revitalization strategy.
- 3.
- Higher social network risks for nonagricultural-employment resettlers
Nonagricultural-employment resettlers work outside their home area for long periods of time, and the separation between each individual and their family members is significant, making it difficult to avoid the destruction of their social networks and exacerbating a series of social problems such as “aging” and “empty nesting” in rural areas. While it is true that working in urban rather than rural areas has effectively increased the income of resettlers, the price paid is disharmony in family relations; it is difficult to accurately evaluate the balance between gains and losses in short term. Under the strategy of rural revitalization, the development of urban–rural integration is bound to enter a new stage of rapid advancement, which is expected to achieve a balance between the income of resettlers and their families. The author believes that, on the one hand, the local government should actively coordinate to provide resettlers with a certain degree of entrepreneurial support and create more jobs, while on the other hand, resettlers also need to strengthen their own employment skills training to improve their own employment competitiveness.
- 4.
- Need to be alert to the possible excessive gap between rich and poor in nonagricultural employment
From the data in Table 7, it can be observed that nonagricultural employment is more prone to uneven development than the other two livelihood strategies, and the excessive gap between rich and poor resettlers is likely to cause social instability in resettlement areas. Therefore, the relevant departments should pay continuous attention to low-income resettlers and take necessary measures to increase their family income; these may include providing jobs, preventing the generation of class divide due to an excessive income gap, and providing resettlers with a harmonious and stable production living environment.
6. Conclusions
China’s water governance history is extremely long. Past water project construction has often existed in a “focus on engineering, not resettlement” situation; with the deepening of people-oriented consciousness, however, investment in resettlement has come to account for an increasing proportion of total water project construction investment, even exceeding 90% for some projects in recent years. Thus, the study of resettlers has important practical significance.
In this paper, we aimed to study the possible risks posed by different livelihood strategies to the livelihood systems of reservoir resettlers. Accordingly, we constructed a risk analysis framework for reservoir resettlers from three aspects (risk assessment, risk management, and risk communication), analyzed the robustness of the framework by evaluating the sample size method, and introduced the average risk–benefit ratio to the analysis of resettlers’ risks and benefits. Through the case study of reservoir resettlers in Guangdong Province, it was verified that the risk analysis framework proposed in this paper has good feasibility and validity, and it was found that there are significant differences in the types and degrees of risk to which resettlers with different livelihood strategies are vulnerable, among which resettlers with pure-agricultural-employment have the highest degree of risk and face greater income risk and resettlers with agricultural-and-employment are more balanced in all aspects, while resettlers with nonagricultural-employment face greater social risk.
It shall be acknowledged that our paper has several weaknesses that could be addressed in further research. First, the impact indicators of the risk analysis framework proposed in this paper are limited, and the complexity of livelihood systems leads to the inevitable existence of many indicators that are not considered in this paper for various reasons. Moreover, the data for the case study are for one year (cross-sectional analysis), and there is a lack of relevant research on resettlers livelihood strategies over time longitudinally. Therefore, future research should focus on the construction of the indicator system to find more appropriate and comprehensive influencing factors, while panel data should be selected for case study to further improve the accuracy of risk analysis and possibly derive the footprint of reservoir resettlers livelihood strategy changes.
Author Contributions
Conceptualization, F.W. and K.Y.; data curation, F.W., B.L. and D.Z.; formal analysis, F.W.; investigation, F.W. and B.L.; methodology, F.W.; supervision, K.Y. and D.Z.; writing—original draft, F.W.; writing—review and editing, K.Y. and D.Z. All authors have read and agreed to the published version of the manuscript.
Funding
This research received no external funding.
Institutional Review Board Statement
Not applicable.
Informed Consent Statement
Not applicable.
Data Availability Statement
Not applicable.
Conflicts of Interest
The authors declare no conflict of interest.
References
- Zhang, Y.; Wen, C.; Sun, X. Research on the classification of imresettlers. J. Yan’an Univ. Soc. Sci. Ed. 2013, 35, 66–70. [Google Scholar]
- Jia, G.; Zhu, Z.; Wang, X.; Deng, H.; Pei, Y. Study on the change of migrant livelihood strategies and their ecological effects: An example from Hongsiabao District, Ningxia. Agric. Mod. Res. 2016, 37, 505–513. [Google Scholar]
- Gong, H. The new situation of human-land conflict in rural China and its management. J. Shanxi Agric. Univ. Soc. Sci. Ed. 2016, 15, 323–329. [Google Scholar]
- Lewis, W.A. Economic Development with Unlimited Supplies of Labour. Manch. Sch. 1954, 22, 139–191. [Google Scholar] [CrossRef]
- Lu, X.; Yang, G. The fundamental way to solve the “three rural problems” is to break the dual structure of urban and rural areas. J. China Agric. Univ. Soc. Sci. Ed. 2013, 30, 5–11. [Google Scholar]
- Ma, B. China’s Three Rural Issues: Present and Future. Shandong Soc. Sci. 2005, 10, 124–130. [Google Scholar]
- Meng, K.; Wang, D. The current situation of research on the “three rural issues” in China and the evaluation of its results: An econometric analysis of the National Social Science Foundation projects and their papers. J. Chongqing Univ. Soc. Sci. Ed. 2018, 24, 103–116. [Google Scholar]
- Shao, H.; Zhang, C.; Zeng, Q. Transforming reservoir resettlers into semi-displaced farmers. Water Econ. 2008, 01, 55–56, 74, 77–78. [Google Scholar]
- Yi, G.; Shao, H. Exploring the transformation of reservoir resettlers from total landless farmers to semi-landless farmers. Anhui Agric. Sci. 2007, 29, 9388, 9414. [Google Scholar]
- Chen, S.; Gu, M. The necessity and feasibility study of social security for reservoir resettlers. People’s Chang. 2013, 44, 100–102, 106. [Google Scholar]
- Yu, X. Research on the management of resettlement of resettlers based on the security of landless farmers: The case of Danjiangkou Reservoir resettlers. Anhui Agric. Sci. 2019, 47, 261–263. [Google Scholar]
- Chen, S.; Wang, L.; Fan, M. Research on livelihood restoration strategies of landless farmers under the sustainable livelihood framework—A survey based on 374 farming households in Anhui Province. People’s Chang. 2016, 47, 97–102. [Google Scholar]
- Chen, H.; Chen, X.; Xie, Y. Occupational differentiation of landless farmers in the urbanization process and its influencing factors. China Popul. Resour. Environ. 2013, 23, 72–79. [Google Scholar]
- Zhou, Y.; Fu, S. Study on the relationship between livelihood capital and livelihood strategies of landless farmers: A case study in Yangling District, Shaanxi Province. Guangdong Agric. Sci. 2012, 39, 192–194. [Google Scholar]
- Todaro, M.P. A Model of Labor Migration and Urban Unemployment in Less Developed Countries. Am. Econ. Rev. 1969, 59, 138–148. [Google Scholar]
- Ravenstein, E.G. The Laws of Migration. J. Stat. Soc. Lond. 1885, 48, 167–235. [Google Scholar] [CrossRef] [Green Version]
- Bagne, D.J. Principles of Demography; Johnson Wiley and Sons: New York, NY, USA, 1969. [Google Scholar]
- Lee, E.S. A Theory of Migration. Demography 1996, 3, 47–57. [Google Scholar] [CrossRef]
- Chen, J.; Hu, B. The triadic economic structure of China and the transfer of surplus agricultural labor. Econ. Stud. 1994, 04, 14–22. [Google Scholar]
- Zhang, K. Influencing Factors and Implementation Measures of Rural Mobility in China—A Todaro Correction Model Based on Push-Pull Theory. Stat. Inf. Forum 2014, 29, 22–28. [Google Scholar]
- Zheng, C. Analysis of rural labor mobility and urbanization process in China based on “five forces model”. J. Theory 2016, 12, 81–84. [Google Scholar]
- Gao, Q. The integration of poverty eradication and rural revitalization: Situation, task and strategic transformation. J. Renmin Univ. China 2020, 34, 29–39. [Google Scholar]
- Ren, Y.; Shi, W. Influencing factors and return effects of rural migrant labor. Popul. Stud. 2017, 41, 71–83. [Google Scholar]
- Cheng, G.; Tan, Y. Study on the factors influencing the entrepreneurial decision of returning rural migrant workers. China Popul. Resour. Environ. 2013, 23, 119–125. [Google Scholar]
- Jing, X.; Ma, F. Life course perspective on migrant workers’ willingness to stay in and return to their hometowns: A survey based on Chongqing and Pearl River Delta. Popul. Econ. 2012, 03, 57–64. [Google Scholar]
- Li, N. Analysis of factors influencing the willingness of rural migrant workers to stay in and return to their hometowns. China Popul. Sci. 2010, 06, 102–108, 112. [Google Scholar]
- Gao, C.; Zeng, W.; Liu, M. Inter-provincial migrant workers’ return location and influencing factors: A case study of 12 villages in Henan Province. Econ. Geogr. 2017, 37, 151–155+170. [Google Scholar]
- Gao, Q.; Wang, Y.; Xu, Z.; Guo, Y.; Niu, N. A study on the location of migrant workers returning to work—A case study of 45 villages in Henan Province. Adv. Geogr. Sci. 2020, 39, 2083–2093. [Google Scholar]
- Wang, L.; Feng, C.; Xu, S. Willingness to return to traditional farming areas and planning response—Based on questionnaire data from Zhoukou City, Henan Province. Adv. Geogr. Sci. 2014, 33, 990–999. [Google Scholar]
- Lin, L.; Zhu, Y.; Ke, W. Spatial willingness of migrant population to return in the context of coordinated regional development and its policy implications. Geogr. Stud. 2021, 40, 1515–1528. [Google Scholar]
- Chambers, R.; Conway, G. Sustainable Rural Livelihoods: Practical Concepts for the 21st Century; Institute of Development Studies: Brighton, UK, 1992; ISBN 978-0-903715-58-4. [Google Scholar]
- Nyamwanza, A.M. Livelihood Resilience and Adaptive Capacity: A Critical Conceptual Review. Jàmbá J. Disaster Risk Stud. 2012, 4, 6. [Google Scholar] [CrossRef] [Green Version]
- Brand, F.S.; Jax, K. Focusing the Meaning(s) of Resilience: Resilience as a Descriptive Concept and a Boundary Object. Ecol. Soc. 2007, 12, 23. [Google Scholar] [CrossRef] [Green Version]
- Marschke, M.J.; Berkes, F. Exploring Strategies That Build Livelihood Resilience: A Case from Cambodia. Ecol. Soc. 2006, 11, 42. [Google Scholar] [CrossRef] [Green Version]
- Fang, Y.; Zhu, F.; Qiu, X.; Zhao, S. Effects of Natural Disasters on Livelihood Resilience of Rural Residents in Sichuan. Habitat Int. 2018, 76, 19–28. [Google Scholar] [CrossRef]
- Sina, D.; Chang-Richards, A.Y.; Wilkinson, S.; Potangaroa, R. A Conceptual Framework for Measuring Livelihood Resilience: Relocation Experience from Aceh, Indonesia. World Dev. 2019, 117, 253–265. [Google Scholar] [CrossRef]
- Gatto, A. Polycentric and Resilient Perspectives for Governing the Commons: Strategic and Law and Economics Insights for Sustainable Development. Ambio 2022, 51, 1921–1932. [Google Scholar] [CrossRef]
- Drago, C.; Gatto, A. An Interval-Valued Composite Indicator for Energy Efficiency and Green Entrepreneurship. Bus. Strateg. Environ. 2022, 31, 2107–2126. [Google Scholar] [CrossRef]
- Drago, C.; Gatto, A. Policy, Regulation Effectiveness, and Sustainability in the Energy Sector: A Worldwide Interval-Based Composite Indicator. Energy Policy 2022, 167, 112889. [Google Scholar] [CrossRef]
- Aldieri, L.; Gatto, A.; Vinci, C.P. Is There Any Room for Renewable Energy Innovation in Developing and Transition Economies? Data Envelopment Analysis of Energy Behaviour and Resilience Data. Resour. Conserv. Recycl. 2022, 186, 106587. [Google Scholar] [CrossRef]
- Cernea, M.M. Risks, Safeguards and Reconstruction: A Model for Population Displacement and Resettlement. Econ. Political Wkly. 2000, 35, 3659–3678. [Google Scholar]
- Vromans, L.; Schweitzer, R.D.; Farrell, L.; Correa-Velez, I.; Brough, M.; Murray, K.; Lenette, C. ‘Her Cry Is My Cry’: Resettlement Experiences of Refugee Women at Risk Recently Resettled in Australia. Public Health 2018, 158, 149–155. [Google Scholar] [CrossRef] [Green Version]
- Nikuze, A.; Sliuzas, R.; Flacke, J.; van Maarseveen, M. Livelihood Impacts of Displacement and Resettlement on Informal Households—A Case Study from Kigali, Rwanda. Habitat Int. 2019, 86, 38–47. [Google Scholar] [CrossRef]
- Xu, H.; Pittock, J.; Daniell, K. ‘Sustainability of What, for Whom? A Critical Analysis of Chinese Development Induced Displacement and Resettlement (DIDR) Programs. Land Use Policy 2022, 115, 106043. [Google Scholar] [CrossRef]
- Wei, S.; Yu, J. Sustainable Resettlement of Involuntary Resettlers: A Normative Analysis Based on the Distribution of Resettlement Control. China Popul.—Resour. Environ. 2009, 19, 76–81. [Google Scholar]
- Xun, H. A model of involuntary migration in China. Zhongzhou J. 2005, 06, 119–122. [Google Scholar]
- Chen, S.; Shi, G. Poverty Analysis of Involuntary Migration in China. Gansu Soc. Sci. 2003, 05, 114–117. [Google Scholar]
- Xu, G.; Liu, Y.; Huang, X.; Xu, Y.; Wan, C.; Zhou, Y. How Does Resettlement Policy Affect the Place Attachment of Resettled Farmers? Land Use Policy 2021, 107, 105476. [Google Scholar] [CrossRef]
- Tang, J.; Xu, Y.; Qiu, H. Integration of Resettlers in Poverty Alleviation Resettlement to Urban China. Cities 2022, 120, 103501. [Google Scholar] [CrossRef]
- Liu, X.; Shi, P. Theory and practice of regional flood risk assessment models. J. Nat. Hazards 2001, 02, 66–72. [Google Scholar]
- Kaplan, S.; Garrick, B.J. On The Quantitative Definition of Risk. Risk Anal. 1981, 1, 11–27. [Google Scholar] [CrossRef]
- Jin, J.; Li, J.; Zhou, Y.; Fei, Z.; Jiang, S.; Yuan, X.; He, J. A preliminary theoretical framework for drought risk assessment. Disaster Sci. 2014, 29, 1–10. [Google Scholar]
- Spencer, S.; Charsley, K. Conceptualising Integration: A Framework for Empirical Research, Taking Marriage Migration as a Case Study. Comp. Migr. Stud. 2016, 4, 18. [Google Scholar] [CrossRef] [PubMed] [Green Version]
- Caselli, M. Measuring the Integration of Imresettlers: Critical Notes from an Italian Experience. Int. Migr. 2015, 53, 107–119. [Google Scholar] [CrossRef]
- Fajth, V.; Bilgili, Ö. Beyond the Isolation Thesis: Exploring the Links between Residential Concentration and Immigrant Integration in the Netherlands. J. Ethn. Migr. Stud. 2020, 46, 3252–3276. [Google Scholar] [CrossRef]
- Harder, N.; Figueroa, L.; Gillum, R.M.; Hangartner, D.; Laitin, D.D.; Hainmueller, J. Multidimensional Measure of Immigrant Integration. Proc. Natl. Acad. Sci. USA 2018, 115, 11483–11488. [Google Scholar] [CrossRef] [PubMed] [Green Version]
- Cernea, M.; Guo, J.; Shi, G. Risk, security and reconstruction: A model of resettlement of resettlers. J. Riverhead Univ. Philos. Soc. Sci. Ed. 2002, 02, 1–15. [Google Scholar]
- Huang, L. Research on early warning mechanism of social stability risk of reservoir resettlers. Hydroelectricity 2011, 37, 5–8. [Google Scholar]
- Gong, Y.; Yao, K.; Zhang, D.; Zhu, D. Study on expenditure-based poverty of reservoir resettlers’ families. Hydropower 2019, 45, 6–11, 92. [Google Scholar]
- Qin, C. Social Networks and the Divergent Development of Resettlers’ Livelihoods; Huazhong Normal University: Wuhan, China, 2014. [Google Scholar]
- Wang, S. Jiangxi Development and Reform Commission Project Team. Research on the construction of social stability risk assessment mechanism for major engineering projects. Price Mon. 2011, 12, 1–14. [Google Scholar]
- Wang, B.; Huang, D.; Hua, J.; Zhang, C. Social stability risk assessment and empirical study of water conservancy project construction. China Popul.–Resour. Environ. 2015, 25, 149–154. [Google Scholar]
- Liu, X.; Shang, C. Review of the main analysis methods of natural disaster risk and their applicability. Adv. Geogr. Sci. 2014, 33, 1486–1497. [Google Scholar]
- Kappes, M.S.; Papathoma-Köhle, M.; Keiler, M. Assessing Physical Vulnerability for Multi-Hazards Using an Indicator-Based Methodology. Appl. Geogr. 2012, 32, 577–590. [Google Scholar] [CrossRef]
- Yin, J.; Yin, Z.; Xu, S. Composite Risk Assessment of Typhoon-Induced Disaster for China’s Coastal Area. Nat. Hazards 2013, 69, 1423–1434. [Google Scholar] [CrossRef]
- Huang, C. Exploring basic methods for risk analysis. J. Nat. Hazards 2011, 20, 1–10. [Google Scholar]
- Wang, G.; Shang, L.; Liu, X.; Tang, L.; Cheng, Q. A study on the causes of poisoning and asphyxiation in roadway openings using the AHP-entropy weight method. Chin. J. Saf. Sci. 2021, 31, 187–192. [Google Scholar]
- Saaty, T.L. Decision Making with the Analytic Hierarchy Process. Int. J. Serv. Sci. 2008, 1, 83–98. [Google Scholar] [CrossRef] [Green Version]
- Wu, Q. Research on Social Risk Analysis and Assessment during the Vacuum Period of Housing Expropriation and Compensation Policy Adjustment. China Eng. Consult. 2012, 10, 39–41. [Google Scholar]
- Carlson, J.M.; Doyle, J. Complexity and Robustness. Proc. Natl. Acad. Sci. USA 2002, 99 (Suppl. 1), 2538–2545. [Google Scholar] [CrossRef]
- Zhang, L.; Tao, L. Research on the robustness measure of multi-indicator integrated evaluation model. Stat. Inf. Forum 2011, 26, 16–20. [Google Scholar]
Figure 1.
Change in resettlers’ livelihoods over time under different livelihood strategies. L0 is the livelihood change curve, assuming that resettlers do not relocate; is the change curve of unassisted livelihoods of resettlers after the occurrence of relocation; L1 is the livelihood change curve with support and nonagricultural employment; L2 is the livelihood change curve with support and the agriculture-and-employment strategy; L3 is the livelihood change curve with support and pure-agricultural employment after relocation. Source: Author’s design.
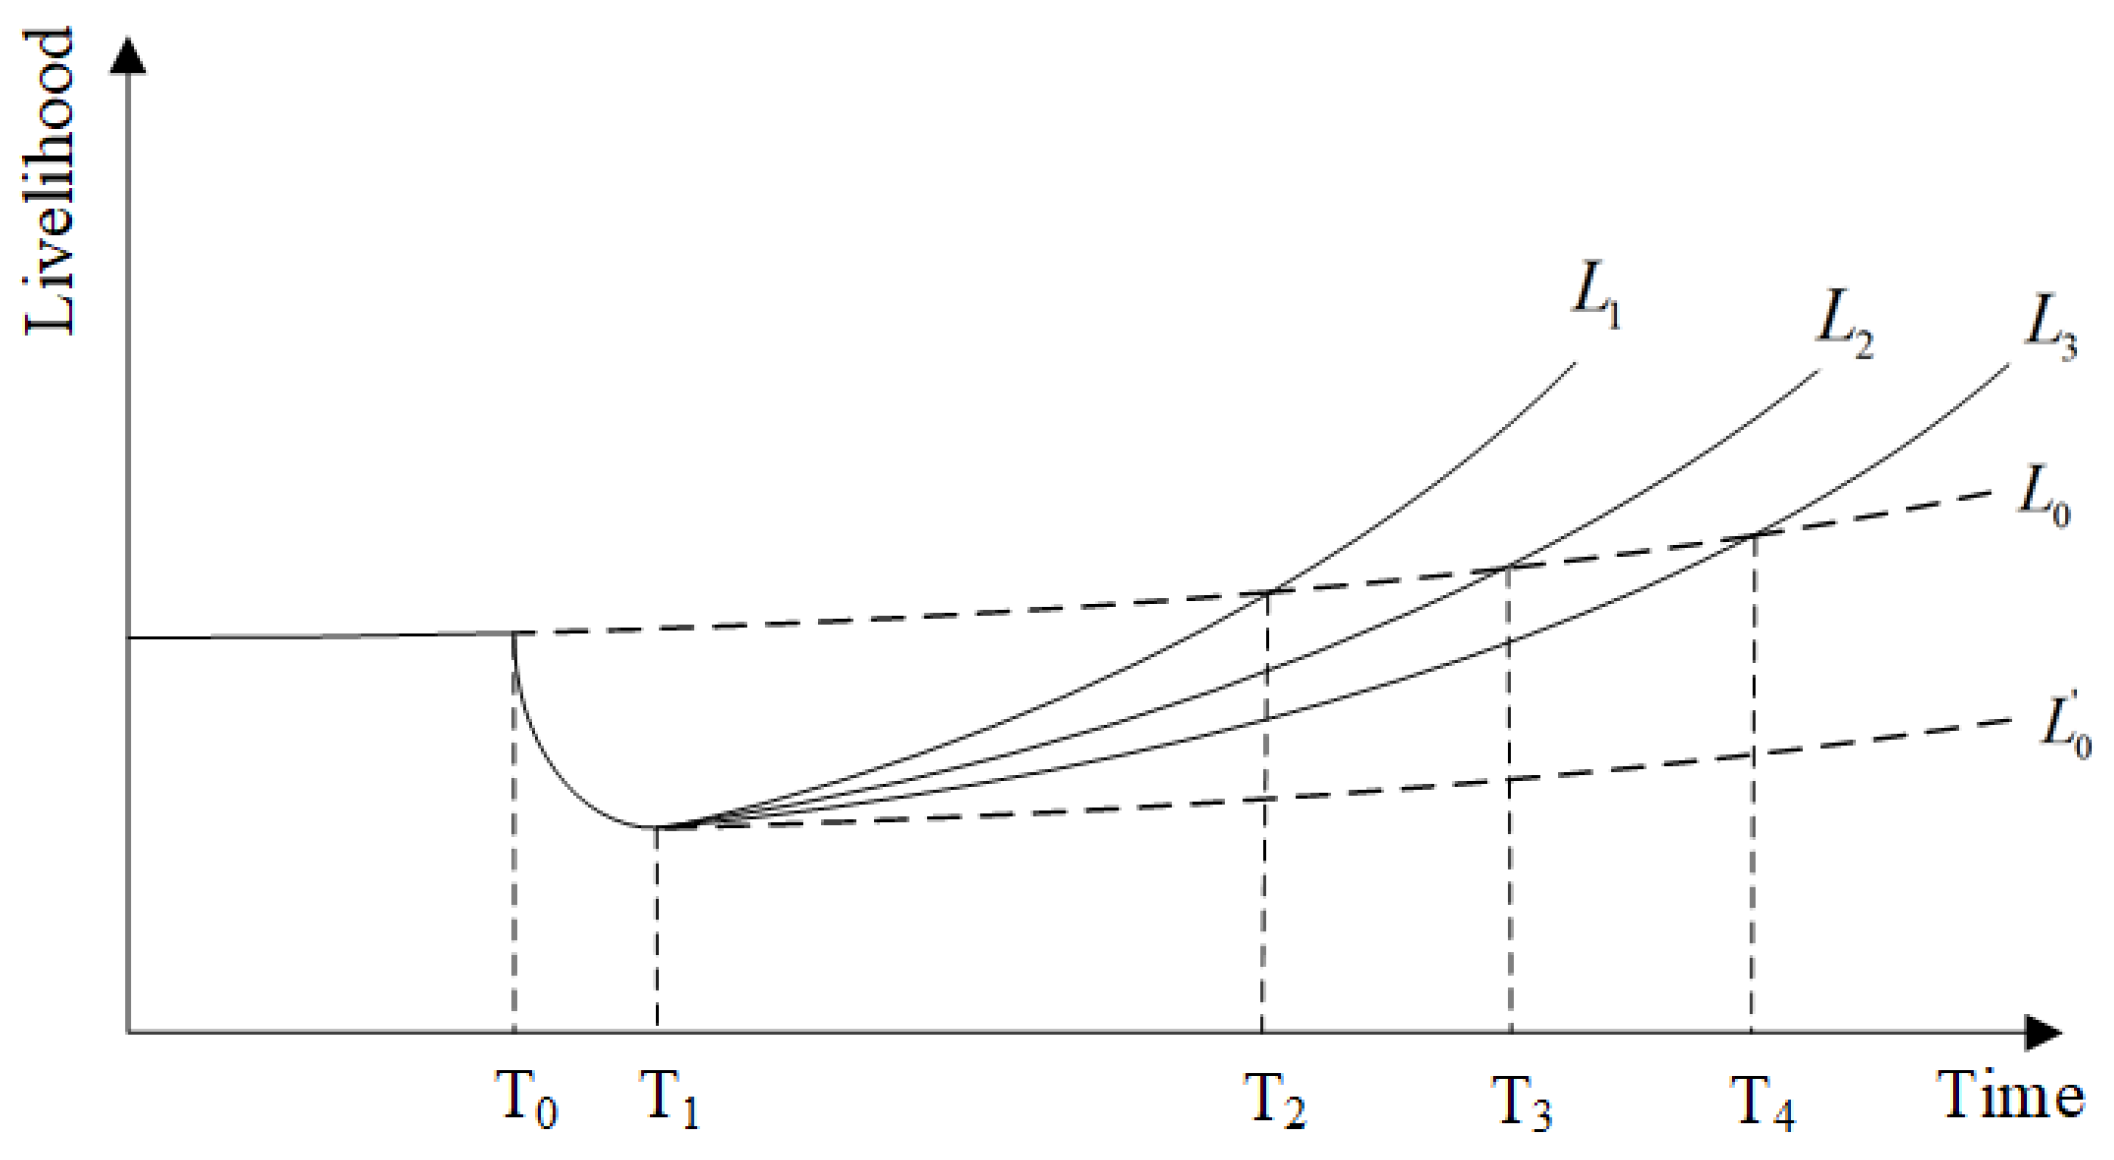
Figure 2.
Risk analysis framework for reservoir resettlers. Source: Designed by the authors.
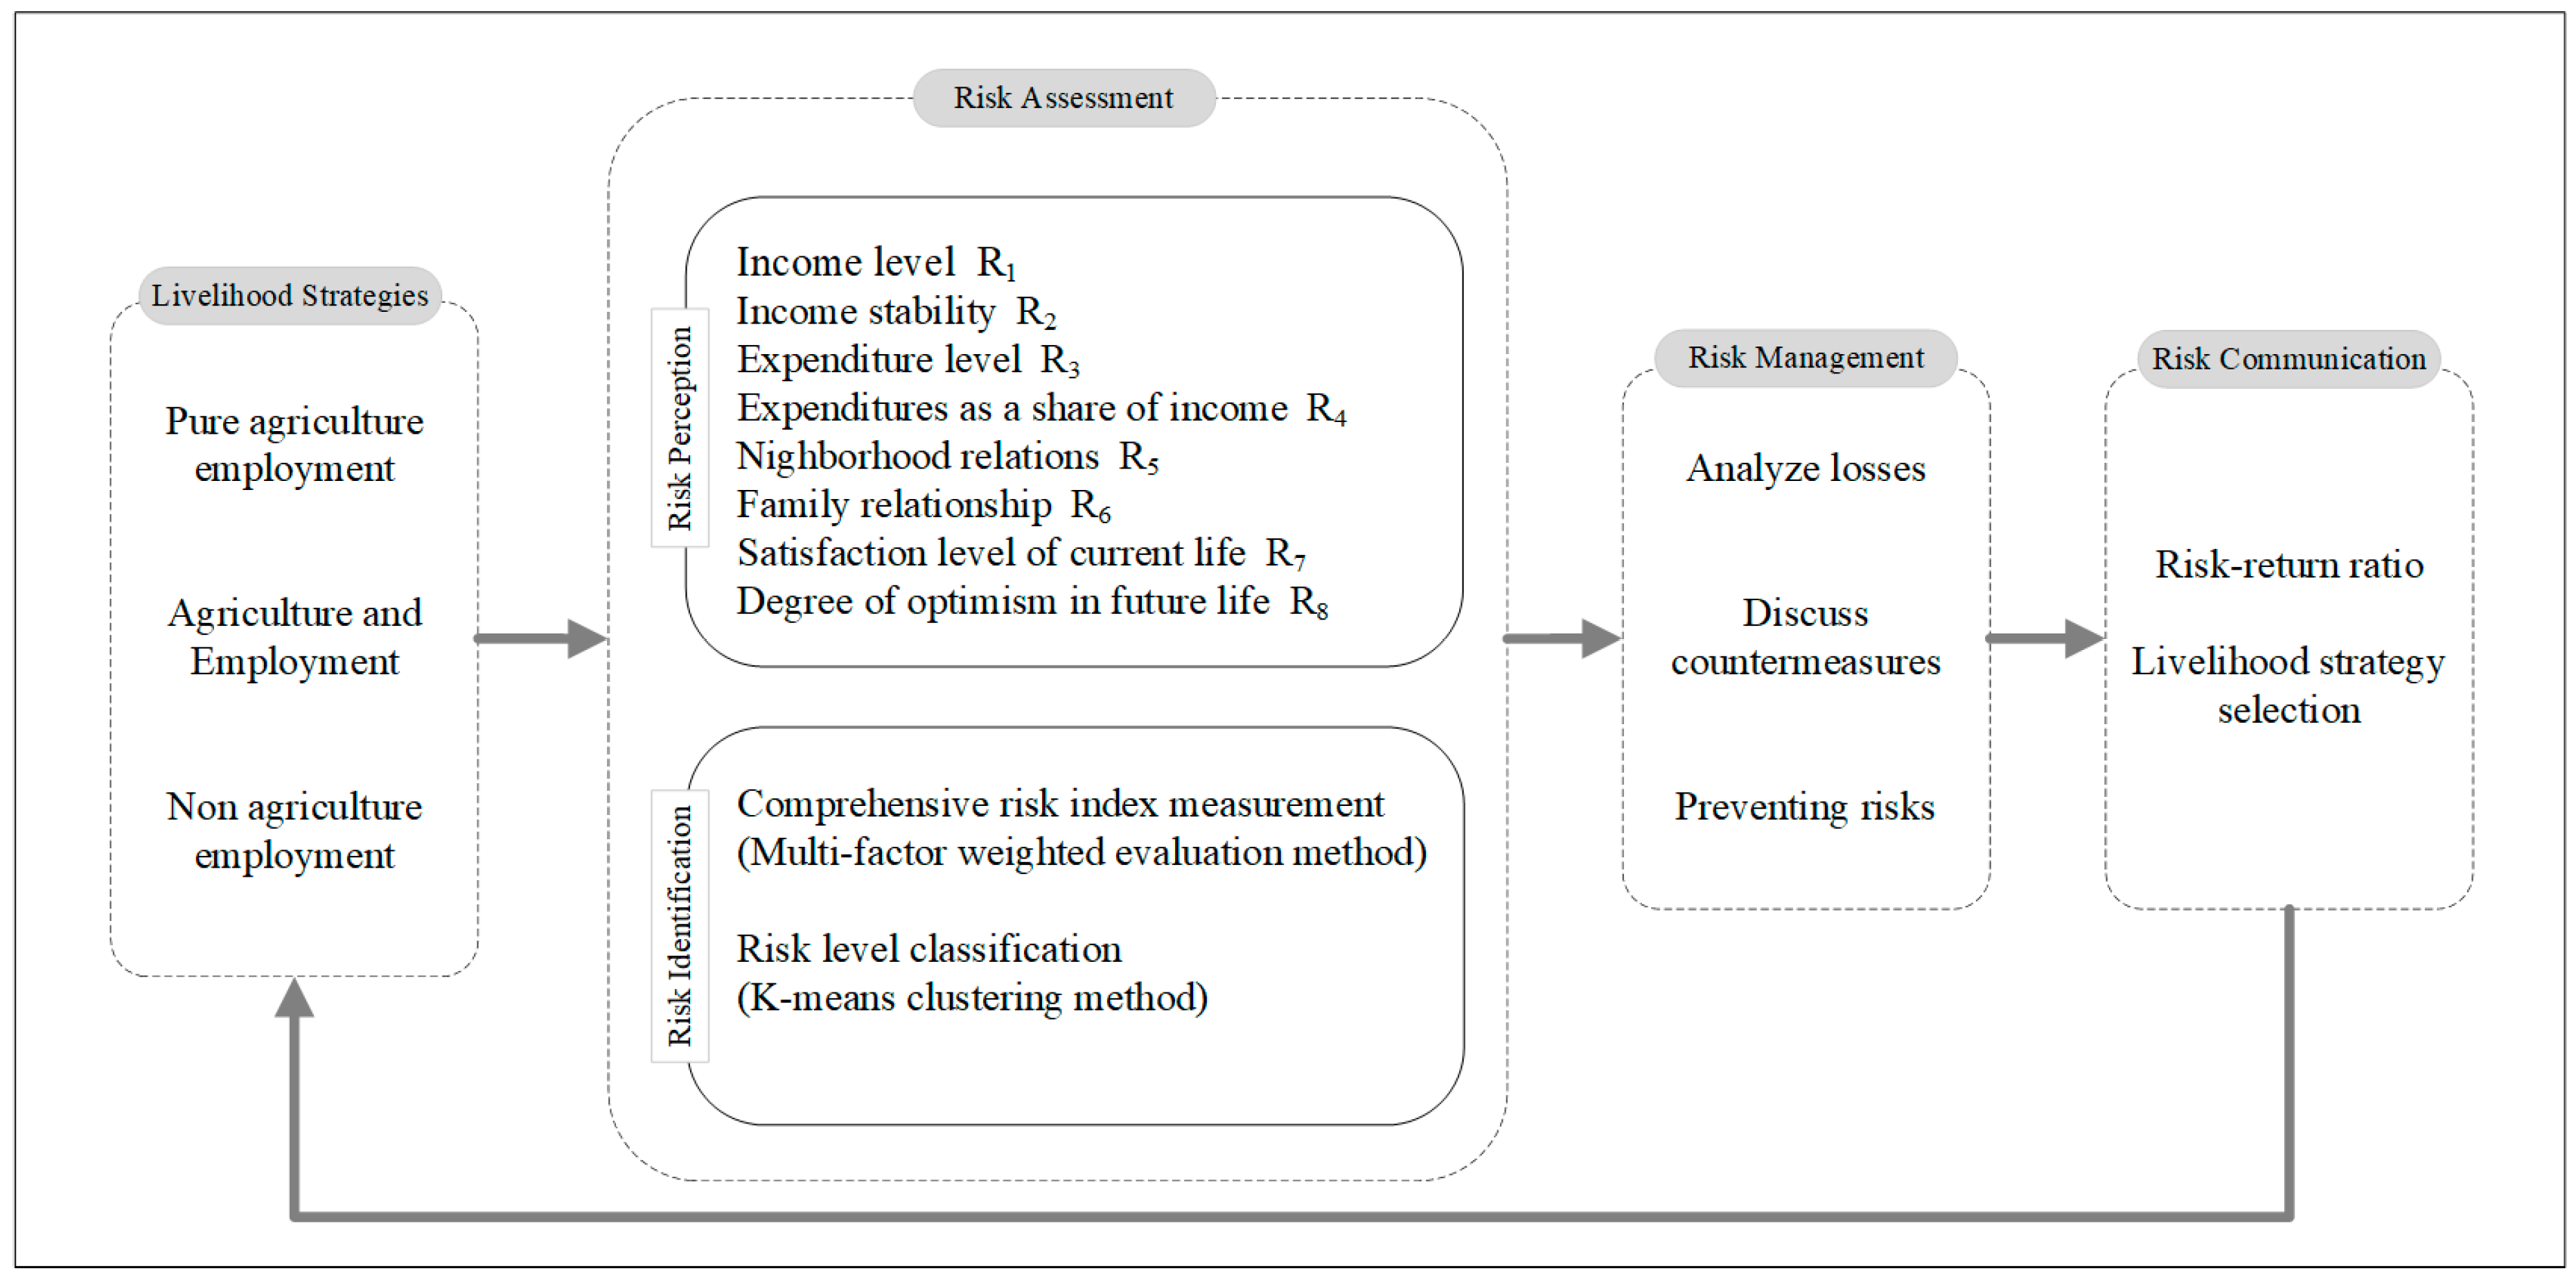
Figure 3.
Distribution of risk levels and composite risk index of resettlers with different livelihood strategies. (a) Line graph of risk levels of resettlers with different livelihood strategies. (b) Composite risk index distribution of resettlers with pure-agricultural employment. (c) Composite risk index distribution of agriculture-and-employment resettlers. (d) Composite risk index distribution of resettlers with nonagricultural employment.

Figure 4.
Line graphs for the 300 resettlers’ risk probability, risk impact, and risk index. (a) Resettlers’ risk probability line graph. (b) Resettlers’ risk impact line graph. (c) Resettlers’ risk index line graph.
Figure 4.
Line graphs for the 300 resettlers’ risk probability, risk impact, and risk index. (a) Resettlers’ risk probability line graph. (b) Resettlers’ risk impact line graph. (c) Resettlers’ risk index line graph.


Table 1.
Reservoir resettlement risk source index system.
| Primary Indicators | Secondary Indicators | Indicator Descriptions |
|---|---|---|
| Economic risk | Income level R1 | Evaluation of resettlers’ satisfaction with household income level |
| Income stability R2 | Average unemployment rate of the actual participating workforce (disaster rate) | |
| Expenditure level R3 | Evaluation of resettlers’ satisfaction with their level of household expenditure | |
| Expenditure as a share of revenue R4 | Resettlers’ evaluation of household expenditure as a share of income | |
| Social risk | Neighborhood R5 | Resettlers’ self-evaluation of neighborhood relations |
| Family relations R6 | Resettlers’ self-assessment of family relationships | |
| Psychological risk | Existing life satisfaction level R7 | Evaluation of resettlers’ satisfaction with their current life |
| Future life optimism level R8 | Evaluation of resettlers’ optimism about their future life |
Table 2.
Mean random consistency index RI standard values.
| Matrix Order | 1 | 2 | 3 | 4 | 5 | 6 | 7 | 8 | 9 | 10 |
|---|---|---|---|---|---|---|---|---|---|---|
| RI | 0 | 0 | 0.52 | 0.89 | 1.12 | 1.26 | 1.36 | 1.41 | 1.46 | 1.49 |
Table 3.
Common risk level classification criteria.
| Risk Level | Very Low | Low | Moderate | High | Very High |
|---|---|---|---|---|---|
| R | 0 < R ≤ 0.04 | 0.04 < R ≤ 0.16 | 0.16 < R ≤ 0.36 | 0.36 < R ≤ 0.64 | 0.64 < R ≤ 1 |
Table 4.
Initial data source table.
| Indicators | Questionnaire Content | Risk Probability P | Risk Impact C |
|---|---|---|---|
| Income level R1 | Are you satisfied with the overall income of your family? How much would a low income affect your family’s life? | P1 = 1 − X1/10 | C1 = Y1/10 |
| Income stability R2 | Calculate the probability of risk from the unemployment rate and the crop damage rate; How much do you think your family’s life would be affected if you lost your job (suffered a disaster)? | P2 | C2 = Y2/10 |
| Expenditure level R3 | Are you satisfied with your family’s overall consumer spending? How much of an impact would higher spending have on your family’s life? | P3 = 1 − X3/10 | C3 = Y3/10 |
| Expenditure as a share of revenue R4 | Do you think your household consumption expenditure is a significant proportion of your income? If it is high, how much does it affect your family life? | P4 = X4/10 | C4 = Y4/10 |
| Neighborhood R5 | Do you feel that you have a good relationship with your neighbors? If not, how much does it affect your family life? | P5 = 1 − X5/10 | C5 = Y5/10 |
| Family Relations R6 | Do you feel that your family members have a good relationship with each other? If not, how much does it affect your family life? | P6 = 1 − X6/10 | C6 = Y6/10 |
| Existing life satisfaction level R7 | Are you satisfied with your current living situation? If not, how much does it affect your family life? | P7 = 1 − X7/10 | C7 = Y7/10 |
| Future life optimism level R8 | Do you feel optimistic about your future? If not, how much does this affect your family life? | P8 = 1 − X8/10 | C8 = Y8/10 |
Table 5.
Urban registered unemployment rate and crop damage rate in Guangdong Province by year.
| Crop Damage Area (Million Mu) | Crop Cultivation Area (Million Mu) | Urban Registered Unemployment Rate (%) | |
|---|---|---|---|
| 2010 | 916.21 | 6394.16 | 2.52% |
| 2011 | 694.9145 | - | 2.46% |
| 2012 | 625.844 | - | 2.48% |
| 2013 | 1726.65 | 7047.125 | 2.43% |
| 2014 | 1265.723 | 7117.43 | 2.44% |
| 2015 | 1268.9 | 7177.08 | 2.45% |
| 2016 | 1121.25 | 7246.252 | 2.47% |
| 2017 | 427.7 | 6341.26 | 2.47% |
| 2018 | 823.4 | 6419.04 | 2.41% |
| 2019 | 162.54 | 6536.07 | 2.25% |
| 2020 | 126.15 | 6677.71 | 2.53 |
| Risk Probability | 12.64% | 2.45% | |
Note(s): mu is a Chinese unit of area, one mu equal to 1/6 an acre.
Table 6.
Weight of each indicator.
| Tier 1 Indicators | Secondary Indicators | Risk Probability Weighting | Risk Impact Weighting |
|---|---|---|---|
| Economic risk | Income level R1 | 0.238 | 0.272 |
| Income stability R2 | 0.154 | 0.187 | |
| Expenditure level R3 | 0.101 | 0.106 | |
| Expenditure as a share of revenue R4 | 0.115 | 0.099 | |
| Social risk | Neighborhood R5 | 0.087 | 0.052 |
| Family relations R6 | 0.141 | 0.137 | |
| Psychological risk | Existing life satisfaction level R7 | 0.075 | 0.068 |
| Future life optimism level R8 | 0.089 | 0.079 |
Table 7.
Risk level statistics under different livelihood strategies.
| Pure-Agricultural Employment | Agriculture and Employment | Nonagricultural Employment | |
|---|---|---|---|
| Very low | 5 | 13 | 17 |
| Low | 17 | 37 | 42 |
| Medium | 25 | 37 | 18 |
| High | 41 | 11 | 18 |
| Very high | 12 | 2 | 5 |
Table 8.
Robustness analysis of risk analysis framework.
| Risk Level | 1 | 2 | 3 | 4 | 5 | wj | |
|---|---|---|---|---|---|---|---|
| Sample Size | |||||||
| 300 | 35 | 96 | 80 | 70 | 19 | 1.65 × 10⁻⁴ | |
| 297 | 35 | 94 | 79 | 71 | 18 | 1.05 × 10⁻⁵ | |
| 294 | 34 | 92 | 80 | 70 | 18 | 3.47 × 10⁻⁶ | |
| 291 | 33 | 92 | 77 | 69 | 20 | 1.78 × 10⁻⁶ | |
| 288 | 34 | 91 | 74 | 70 | 19 | 1.08 × 10⁻⁶ | |
| 285 | 32 | 91 | 76 | 68 | 18 | 7.08 × 10⁻⁷ | |
| 282 | 32 | 90 | 74 | 67 | 19 | 5.22 × 10⁻⁷ | |
| 279 | 32 | 88 | 72 | 67 | 20 | 4.06 × 10⁻⁷ | |
| 276 | 31 | 86 | 72 | 66 | 21 | 3.23 × 10⁻⁷ | |
| 273 | 32 | 84 | 71 | 67 | 19 | 2.62 × 10⁻⁷ | |
| 270 | 32 | 84 | 70 | 66 | 18 | 2.17 × 10⁻⁷ | |
Publisher’s Note: MDPI stays neutral with regard to jurisdictional claims in published maps and institutional affiliations. |
© 2022 by the authors. Licensee MDPI, Basel, Switzerland. This article is an open access article distributed under the terms and conditions of the Creative Commons Attribution (CC BY) license (https://creativecommons.org/licenses/by/4.0/).
Share and Cite
MDPI and ACS Style
Wang, F.; Yao, K.; Liu, B.; Zhang, D. Risk Analysis of Reservoir Resettlers with Different Livelihood Strategies. Water 2022, 14, 3530. https://doi.org/10.3390/w14213530
AMA Style
Wang F, Yao K, Liu B, Zhang D. Risk Analysis of Reservoir Resettlers with Different Livelihood Strategies. Water. 2022; 14(21):3530. https://doi.org/10.3390/w14213530
Chicago/Turabian StyleWang, Feilong, Kaiwen Yao, Bingwen Liu, and Dan Zhang. 2022. "Risk Analysis of Reservoir Resettlers with Different Livelihood Strategies" Water 14, no. 21: 3530. https://doi.org/10.3390/w14213530
Note that from the first issue of 2016, this journal uses article numbers instead of page numbers. See further details here.