
Study on Ecological Compensation of Inter-Basin Water Transfer Based on Evolutionary Game Theory
College of Hydraulic Science and Engineering, Yangzhou University, Yangzhou 225009, China
*
Author to whom correspondence should be addressed.
Water 2022, 14(21), 3498; https://doi.org/10.3390/w14213498
Submission received: 22 September 2022
/
Revised: 29 October 2022
/
Accepted: 31 October 2022
/
Published: 1 November 2022
(This article belongs to the Special Issue Advance in Water Management and Water Policy Research)
Abstract
:Ecological compensation for inter-basin water transfer is an effective way of coordinating regional ecological environment protection and balancing the interest relationship between the water-source area and the water-receiving area. However, there are still some deficiencies in the research on the evolutionary game analysis and the compensation behavior of stakeholders. To this end, a replication dynamic model of evolutionary game analysis was established to analyze the behavior and mutual influence of the governments of the water-source area and the water-receiving area. We examined the dynamic evolution process of each strategy, discussed the stability of the evolution result, and calculated the penalty amount of the superior supervision department through the market value method and the willingness-to-pay method. The results show that in the process of independent selection of local governments, the social optimal environmental protection strategy (protection, compensation) will not reach a balanced and stable state, and the constraint elements of the superior supervision department must be introduced. If the penalty amount is greater than the maximum value between the wealth lost in the water-source area due to ecological protection and the money the local residents in the water-receiving area is willing to pay, the optimal stability strategy can be achieved most easily. Taking Yangzhou, the water-source area of the east route of the South-to-North Water Transfer Project, and Jinan, the water-receiving area, as an example, it is calculated that the loss cost of Yangzhou is 1.304 billion RMB (USD 189 million), and Jinan is willing to pay 1.753 billion RMB (USD 254 million). Therefore, in order to stabilize the optimal strategy (protection, compensation) between the governments of Yangzhou and Jinan, the penalty amount of the superior supervision department should be greater than 1.753 billion RMB (USD 254 million). Our results could provide a reference for regulating the relationship between stakeholders and promoting the innovation of ecological compensation system for inter-basin water transfer.
1. Introduction
With the development of the economy, global drinking water resources are facing the great challenge of unequal distribution [1]. The inter-basin water transfer project has begun to play a role, but problems concerning the balance of interest between the water-source area and the water-receiving area have followed [2]. The tradeoff between economic development and ecological protection is becoming increasingly acute in China [3,4,5] The uneven spatial distribution of river basin resources and economic goals leads to unsustainable development in regions [6], resulting in the spatial separation of resource-based product production and consumption. Inter-basin water transfer projects transfer water resources from relatively rich areas to relatively poor areas, which alleviates water shortages in water-receiving areas to increase the economic growth and social welfare of the regions [7,8,9]. However, while water-receiving areas enjoy the clean water resources brought by the water diversion projects, and create huge social and economic benefits, the water-source areas bear the huge cost of the protection of water resources. Due to ecological protection, the development of water-source areas is restricted, and the industrial layout is greatly adjusted, resulting in the reduction of local tax sources. Enterprise emission standards have risen, resulting in higher production costs. The construction of water conservancy facilities, sewage treatment, wetland restoration and protection, as well as a series of compensation, enterprise relocation and personnel resettlement, has resulted in increased pressure on fiscal expenditure. The development gap between water-source and water-receiving areas is widening, seriously endangering social harmony and public security [10,11].
As an important mechanism for the fair protection of water resources and land, ecological compensation is based on the protection and sustainable use of environmental services to regulate and protect the interests of stakeholders [12]. In the ecological protection and compensation of inter-basin water transfer, the water-source areas are responsible for protecting the water source environment, bearing direct investment and related losses. The water-receiving areas benefit from the water source protection and make ecological compensation to the water-source area. The ecological compensation of the water-source areas and the water- receiving areas have the typical characteristics of a game [13,14]. Only by adjusting the relationship between the protectors of the water-resource areas and the beneficiaries of the water-receiving areas, regulating the various stakeholders to enjoy their rights and bear corresponding economic and social responsibilities, realizing their own interests, can we achieve a positive development situation of mutual benefit. Solving the interest demands between the water-source areas and the water-receiving areas, coordinating the development of the two are the current practical problems that need to be solved urgently [15]. As a model method to study the behavior of the decision-makers and the decision-making equilibrium, game theory can better simulate the conflicts of interests in different aspects, combine the characteristics of conflicts, and thus obtain feasible conflict resolutions [16]. Therefore, applying game theory to the study of ecological compensation for inter-basin water transfer is particularly important for balancing the interests of water-source areas and water-receiving areas, and establishing and improving the ecological compensation mechanism.
Game theory was launched by John von Neumann, a great mathematician, and Oskar Morgenstern in 1944. Game theoretical modelling concept and reasoning have been widely applied in economic, commercial, social, political, biological, and other sciences to help people analyze social and behavioral phenomena [17,18,19,20,21]. However, the applications of game theory to solve conflicts in water resources management are comparatively few. Over the years, few scholars have studied the application of game theory in watershed water resources management. Ansink et al. [22] evaluated the stability of water resource allocation agreements by using game theory models, and considered the impact of climate change and different cooperation conditions on stability. Wang et al. [23] explored how to distribute water resources fairly in the basin, based on the cooperative game theory method, to achieve the optimal allocation of water resources. Shi et al. [24] proposed a cost model of transboundary pollutant emission reduction in the basin, and discussed the fairness and stability of the four cost-sharing mechanisms. Hu et al. [25] analyzed the stakeholder decision-making between the upstream and downstream groups of ecological compensation in the basin by establishing the “reward-punishment” evolutionary game model. Wei et al. [26] built a differential game between the government and enterprises in the basin ecosystem and analyzed the optimal dynamic strategy by applying the maximum value principle. Yi et al. [27] used the Stackelberg game model to study pollution control and ecological compensation of transboundary basins. The constraint mechanism is introduced into evolutionary game analysis in our study, which can provide policy recommendations for regulating the relationship between various stakeholders and building water resources market system. Our paper has a high research value and application prospects in ecological compensation of inter-basin water transfer.
The main contributions of this work can be summarized as follows:
- Ecological compensation mechanism of inter-basin water transfer project between the water-source area and the water-receiving area is not clear, and game analysis is rarely applied to it.
- Based on the interest demand of the water-source area and the water-receiving area, an evolutionary game model is constructed to predict the behavioral choice of the relevant stakeholders, and further introduce the constraint mechanism.
- Using the market value method and willingness-to-pay method to calculate the range of the penalty amount of the superior supervision department under the constraint mechanism can better establish and improve the fair compensation mechanism.
- It can provide a reference for the ecological compensation mechanism of the east route of the South-to-North Water Diversion Project (ER-SNWDP) or other inter-basin water transfer projects.
2. Methodology
2.1. Background
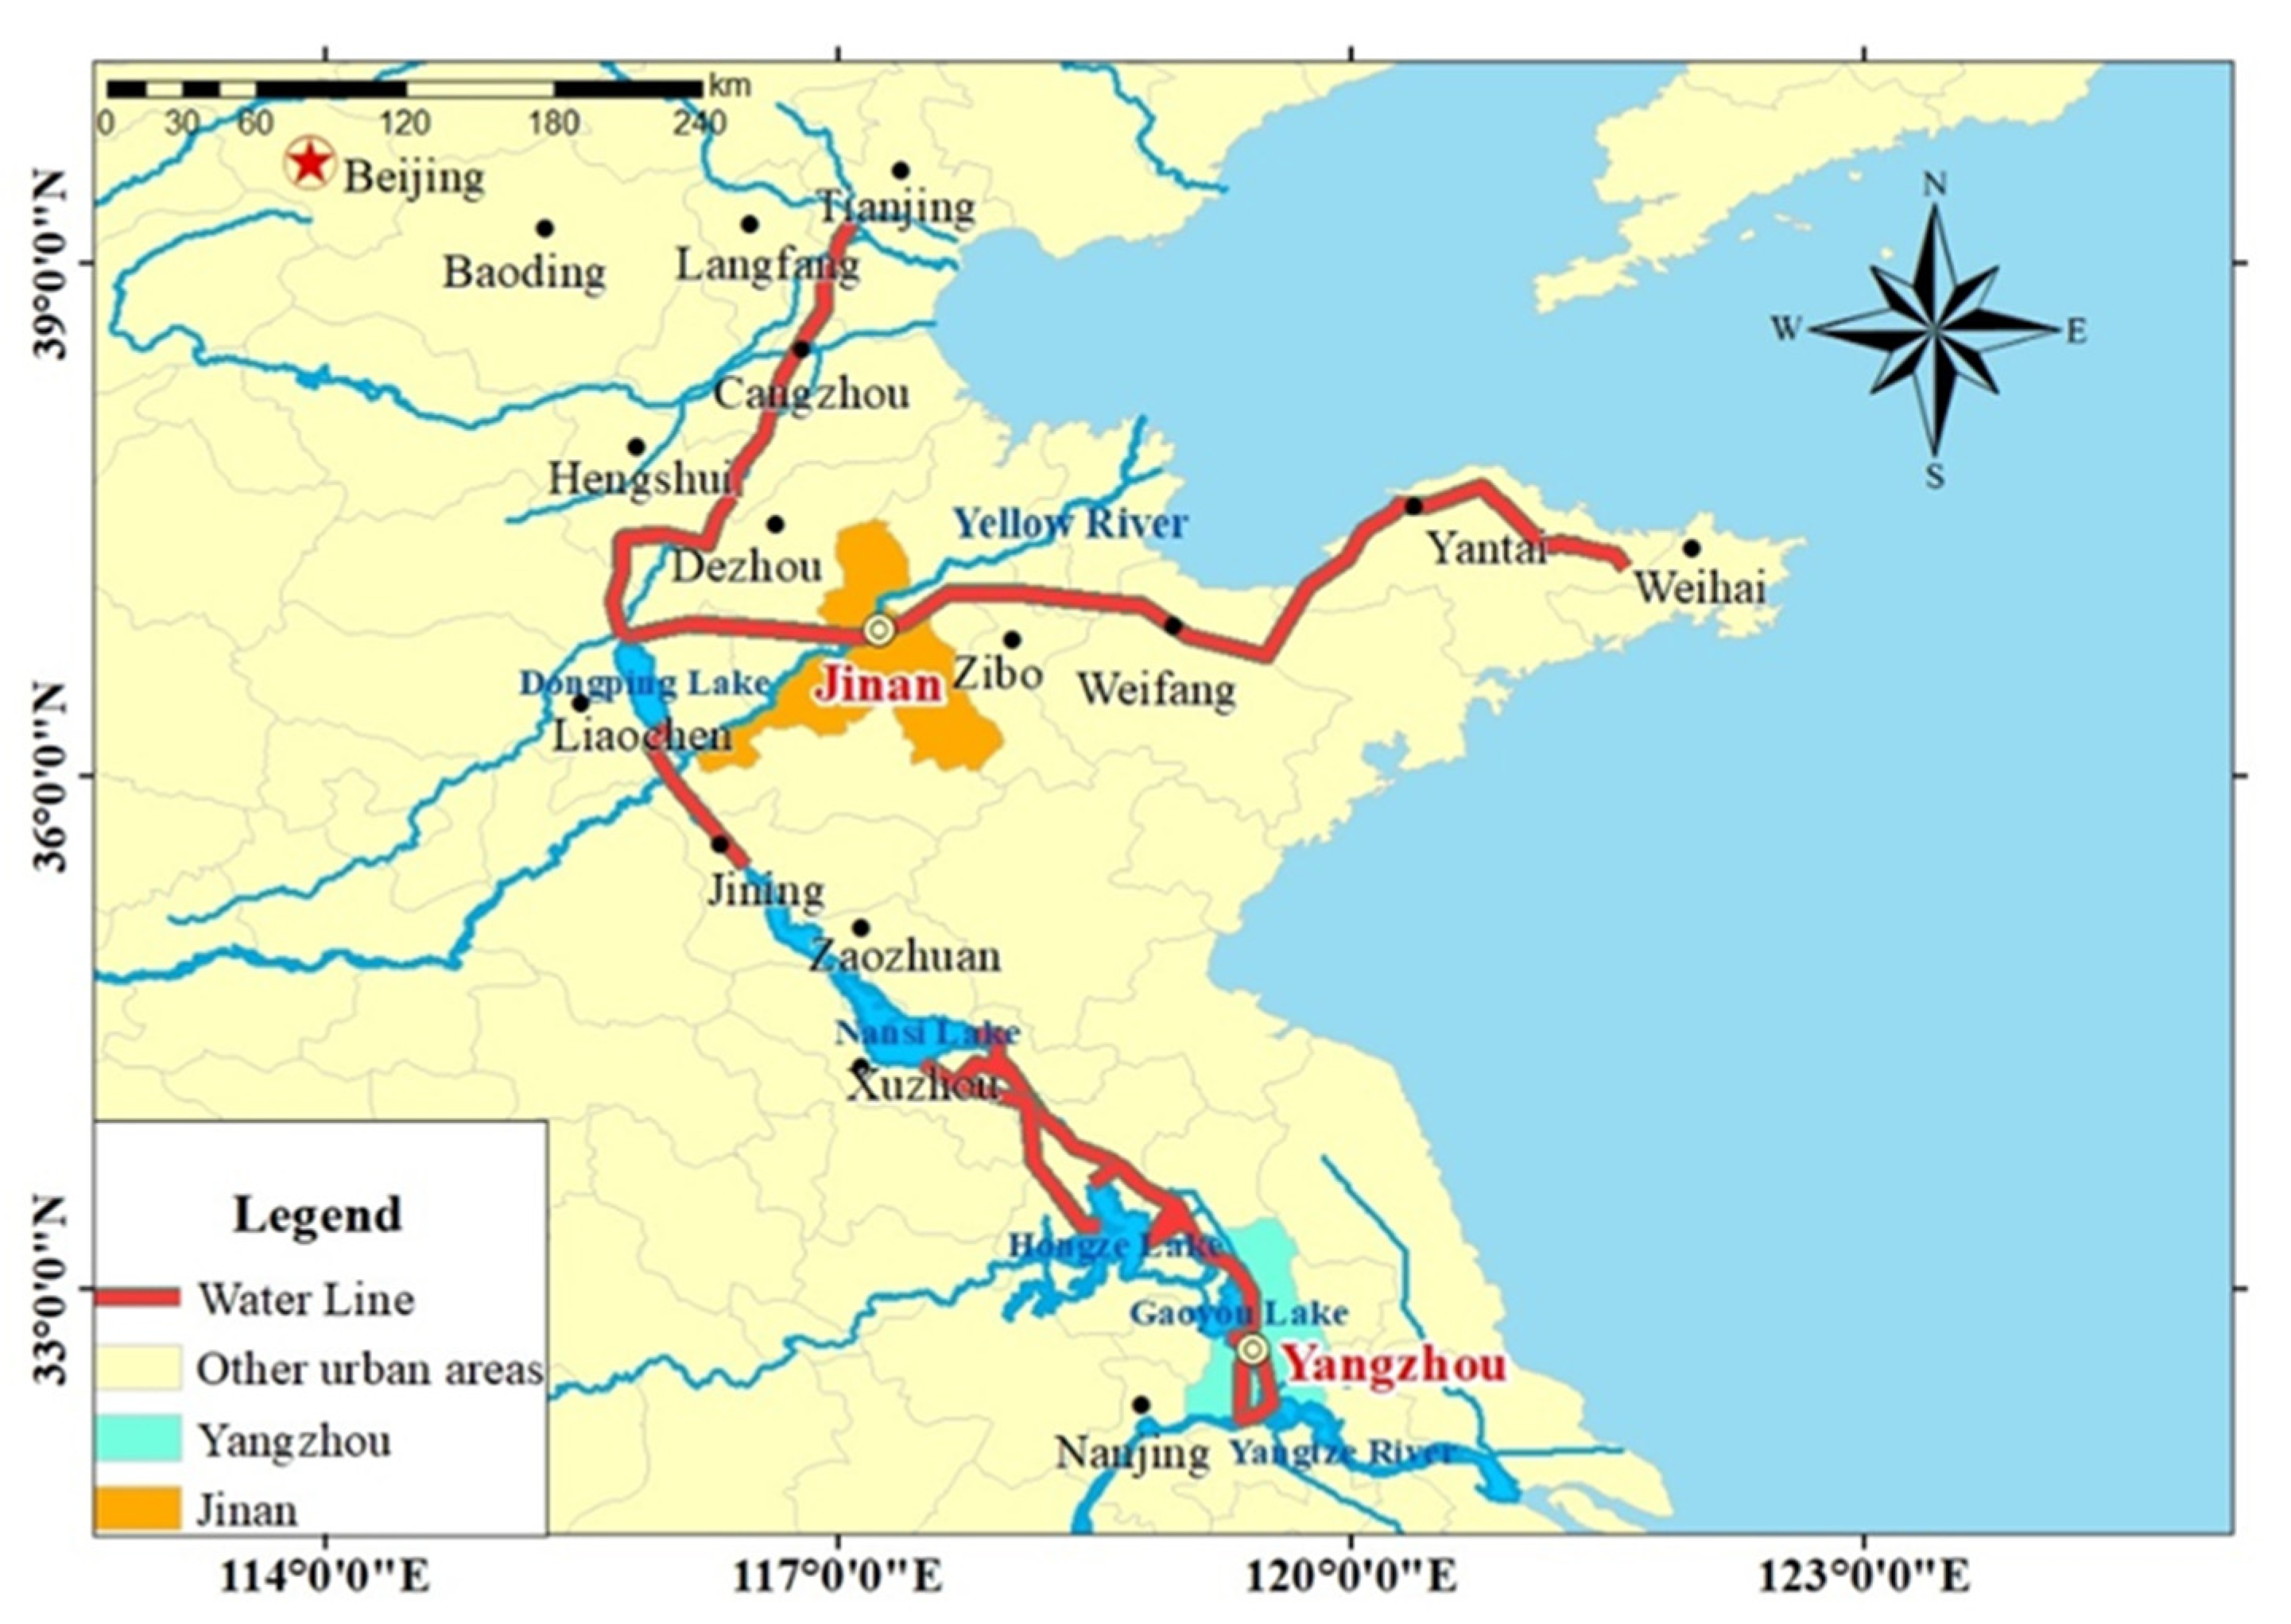
As China’s major strategic infrastructure, the South-to-North Water Diversion Project (SNWDP) has effectively alleviated the water shortage and ecological environment deterioration in northern China [28]. The project is divided into three lines: east, middle and west. ER-SNWDP was officially started in December 2002 and completed in November 2013 [29]. As shown in Figure 1, the project takes water from the Sanjiangying section of Yangzhou in the lower reaches of the Yangtze River, and uses the Beijing–Hangzhou Grand Canal and its parallel newly dredged river channels as the water transmission routes to provide production and domestic water to the east of the Huang-Huai-Hai Plain, Jiaodong area and Beijing-Tianjin-Hebei area [30,31]. The first-class water lifting scale along the Yangtze River reaches 500 m3/s, and the annual pumping capacity is 8.77 billion m3. Since the supply of water, ER-SNWDP has alleviated the uneven distribution of water resources from the north to the south, and promoted the coordinated development of the ecological environment and regional economy in the northern water-receiving area [32]. Meanwhile, however, the development of the areas surrounding the water transmission channel and the control area has been affected, in order to protect the ecological environment of the water-receiving area.
2.2. Game Theory
The interests of all parties are very complex in the process of ecological compensation for ER-SNWDP, so the conflict of interests is the most direct reason for the formation and intensification of various contradictions. We applied game theory to build a specific evolutionary game model.
2.2.1. Model Assumptions
Two stakeholders were set up: the government of the water-source area and the government of the water-receiving area.
- (1)
- Compared with the water-receiving area, the impact of water quality on people’s production and living conditions in the water-source area is relatively small. The water quality in the water-source area is relatively good. In the choice of regional economic development, the water-source area is more likely to affect the rapid economic development by damaging the natural environment, as it is easy to cause serious damage to the ecological environment of the basin. Although the benefits of basin ecological environment protection are high, the water-receiving area government has a relatively low preference for basin ecological environment improvement and generally does not take the initiative in purchasing ecological environment protection products, compared with the regional economic benefits lost in ecological environment protection. The government of the water-source area is the main body of interests in the water-source area, and the strategy chosen in the process of implementing ecological environment protection is to protect or not protect.
- (2)
- Compared with the water-source area, the production and living conditions of the people in the water-receiving area are more affected by the water quality of the basin. The water quality of the production and living water source has to some extent been affected by the production and living of the people in the water-source area. Therefore, the people in the water-receiving area have a higher demand for the improvement of the water environment in the basin than the water-source area. They are more willing to contribute for eco-environmental protection products and have a higher preference for the improvement of the ecological environment in the basin [33,34]. The government of the water-receiving area is the interest subject of the water-receiving area, and the strategy chosen is to compensate or not to compensate in the process of implementing ecological environment protection.
- (3)
- The water-source area government and the water-receiving area government pursue the maximization of their own interests, and the protection-compensation strategy is the best strategy expected by the society.
The strategic choices of the water-source area government are to implement ecological protection or not to implement ecological protection. The government in the water-receiving area has two strategic choices: implementing ecological compensation or not implementing ecological compensation. Assuming that the probability of the government of the water-source area implementing ecological protection is , the probability of not implementing ecological protection is (). If the probability of the government of the water-receiving area implementing ecological compensation is , the probability of not implementing ecological compensation is (). The government of the water-source area and the water-receiving area are the main stakeholders. Different strategies chosen by both parties will have different consequences.
2.2.2. Model Building
The replication dynamic equation is the basis of the evolutionary game model. The average expected revenue can be calculated, according to the strategic choice of the stakeholders, and the replication dynamic equation of each participant is then obtained. The payoff matrix of the water-source area and the water-receiving area is shown in Table 1 and Table 2 shows the description of the parameters in the model.
- (1)
- The expected revenue of implementing ecological protection in the water-source area can be calculated from the following:
When ecological protection is not implemented in the water-source area, the expected revenue can be calculated from:
where is the expected revenue when ecological protection is not implemented in the water-source area.
The average expected revenue of water-source area can be calculated from
where is the average expected revenue of water-source area.
- (2)
- The expected revenue of implementing ecological compensation in the water-receiving area can be calculated from the following:
The expected revenue without ecological compensation in the water-receiving area can be calculated from:
where is the ecological revenue without ecological compensation in the water-receiving area.
The average expected revenue of the water-receiving area can be calculated from:
where is the average expected revenue of the water-receiving area.
From Equations (3) and (6), we obtain the replication dynamic equations when ecological protection is implemented in the water-source area and ecological compensation is carried out in the water-receiving area:
2.2.3. Stability Analysis
Can the optimal (protection, compensation) strategy expected by the society become a stable state? The stability analysis of the local equilibrium points of the Jacobi matrix proposed by Frideman [35] can be applied to the test of the stable state of the game system. For the group dynamic system of the above game, the Jacobi matrix can be calculated as:
The values of the matrix determinant and trace can be calculated from:
According to Friedman’s ideology, if the strategy is a stable equilibrium strategy, then there is , . If the optimal strategy (protection, compensation) is in a stable state, should be substituted to meet the following:
According to and , we can obtain , then , and it is obvious that the equations have no solution. It can be seen that without the interference of other factors, it is impossible to achieve the optimal strategy (protection, compensation) only by relying on the independent choice between the governments of the water-source area and the water-receiving area. It is necessary to introduce the supervision of the third-party higher-level government or the relevant administrative departments at the higher level, and achieve the optimal stability strategy by establishing the corresponding constraint mechanism.
2.2.4. Introducing Constraint Mechanism into Evolutionary Game Analysis
The corresponding constraint mechanism is introduced, based on the previous model. The superior supervision department should impose economic punishment on the government of the water-receiving area if the government of the water-source area chooses the ecological protection strategy and the government of the water-receiving area does not make any ecological compensation. The superior supervision department should impose economic punishment on the government of the water-source area if the government of the water-receiving area chooses the ecological compensation strategy and the government of the water-source area does not protect the ecological environment. Clearly, the governments of the water-source area and the water- receiving area will restrain their own behavior if the restraint mechanism of the superior department is set appropriately.
Assuming that the government of the water-source area does not protect the ecological environment and the government of the water-receiving area gives ecological compensation, or the government of the water-source area protects the environment and the government of the water-receiving area does not give ecological compensation, the government of the water-source area or the water-receiving area will be subject to economic punishment. Table 3 shows the payoff matrix with the constraint mechanism.
In Table 3, F refers to the penalty amount of the superior supervision department. At this point, when the government in the water-source area chooses to carry out ecological protection, the replication dynamic equation can be expressed as:
The solutions of are , . , when , there is . At this point, the protection strategy adopted by the government of the water-source area is stable. When F is large and the proportion of ecological compensation by the government of the water-receiving area is reasonable, the condition of will be easier to meet, and the government of the water-source area will also be more inclined to adopt an ecological protection strategy.
When the government of the water-receiving area selects ecological compensation, the replication dynamic equation can be expressed as:
Similarly, , when F is large and the ecological protection strategies adopted by the government of the water-source area is reasonable, the condition of will be easier to meet, and the government of the water-receiving area will also tend to adopt ecological compensation strategy.
To determine F, the Jacobi matrix can be calculated from:
The purpose of establishing the basin ecological compensation constraint mechanism is to ensure that the optimal strategy (protection, compensation) is a stable equilibrium point. That is, the following equations hold:
By solving the above equations, the range of F of the superior supervision department to the government of the water-source area or the water-receiving area is obtained as following:
can be regarded as the wealth lost in the water-source area due to the adoption of ecological strategy; can be regarded as the amount of ecological compensation that the water-receiving area is willing to pay. It can be seen from Equation (17) that F must be greater than the maximum value of and .
2.3. Contingent Value Method
The contingent value method (CVM) is based on a questionnaire survey, which uses the good conditions assumed at the beginning to guide people to put forward their willingness-to-pay (WTP) for protecting or improving something, or the willingness-to-accept (WTA) to ensure their own interests, so as to evaluate the public value and public property of resources [36,37]. The advantage of using CVM lies in its wide range of availability, clear purpose and high feasibility [38]. Affected by personal factors, the conclusions may have some deviations. In order to solve this problem properly, the questionnaire design should be comprehensive, reliable, scientific and reasonable.
The questionnaire should generally include the following aspects. The first part is the description of the questionnaire. In this part, the interviewees should be briefed on the interviewer’s identity, the purpose and significance of this survey, and they are expected to cooperate actively. The second part is the influencing factors of the survey objectives, including the respondents’ social background, environmental awareness, current life satisfaction and so on, which is used to calculate the amount of payment of the sample at the end. The third part contains the hypothetical conditions of this survey, which give appropriate guidance to the respondents who enjoy or protect the ecological environment to show their WTP.
The calculation of WTP is based on the parametric method and nonparametric method.
- (1)
- Nonparametric estimation
For the interval value, according to the reasonableness of statistics, the median value of each interval is used instead, A value of 2000 RMB and above is replaced by an endpoint value of 2000. Combining the nonparametric calculation method and the cumulative frequency distribution of respondents’ WTP, the expected values of WTP can be calculated using the following model:
where represents the bid value selected by the respondents; represents the probability that the respondents choose the bid value.
Considering that any rational person pursues the maximization of their own interests, simple arithmetic means are susceptible to extreme values at both ends of the sample, so certain corrections are needed to obtain a more representative overall mean. Therefore, our study adopts the 5% trimmed average value to represent the overall mean of the sample. The 5% trimmed average value means removing the top and bottom 5% of the data and then calculating the mean so that it is less susceptible to extreme values and more representative of the population.
- (2)
- Parameter estimation
Expected value of WTP can be calculated from:
In the above formula, the median value within the range of the selected areas of the respondents is taken as their WTP for ecological compensation, which will cause errors to a certain extent. In this study, the above formula is modified and the probability model with double boundaries is used for analysis [39].
The probability that the respondents will answer “yes” can be calculated from:
The probability that WTP falls within is , where is defined as the minimum value of WTP of the respondents, is defined as the maximum value of WTP of the respondents, so the interval of WTP of the respondent is .
The log likelihood function is obtained as following:
It can be obtained from the Equation (21) that , , Where is the standard normal cumulative frequency distribution function, and can be obtained by Equation (19). According to the distribution of , the mean WTP of the respondents can be obtained by the following formula:
where is the socio-economic characteristic attribute of the respondent; is the mean value of the independent variable; is the standard deviation of normal distribution; is the coefficient to be estimated, is a random variable subject to normal distribution of also obey the distribution of .
2.4. Market Value Method
From different analysis angles, the accounting methods of the value of water resources can be divided into the following categories: the hierarchical accounting method and the comprehensive accounting method [40,41]. From the quantitative evaluation of the economic value of resources, by judging whether the market information of resources is complete, the accounting of water resources value can be divided into the market value method, the alternative market method, and the hypothetical market method, etc. Among these methods, the market value method is used to determine the value of environment and resources based on the market price. The water-source area in the SNWDP provides clean water resources, so the market price can be monetized directly. Therefore, the market value method was selected to calculate the value of water resources in our work.
According to the market value method, the calculation formula is as following:
where is the water ecological compensation amount, is the water-transfer volume, is the market price of water resources, is the water quality discrimination coefficient (when the water quality is better than class III, = 1; when the water quality is lower than class V, = −1; otherwise = 0).
We used the market value method to calculate the amount of ecological compensation, and believed that the water-receiving area should compensate the efforts made by the water-source area to protect the ecological environment by implementing the inter-basin ecological compensation policy. According to the Surface Water Quality Standards, it is determined that the quality of the water supplied by the water- source area should reach class III. If the water quality supplied by the water-source area to the water-receiving area reaches class III, no compensation will be made between the water-source area and the water-receiving area. If the water quality is better than class III, the water-receiving area should compensate the water-source area. If the water quality is lower than class III, the water-source area should compensate the water-receiving area.
3. Results and Discussion
3.1. Evolutionary Game Analysis
This study took Yangzhou, the water-source area of ER-SNWDP, and Jinan, the water-receiving area, as examples to calculate the penalty amount. The Yangzhou government and Jinan government, the two stakeholders, make decisions on ecological environmental protection and compensation from the perspective of maximizing interests.
From the results of the evolutionary game model, it can be seen that the penalty amount (F) is mainly related to the wealth lost () of the water-source area due to the ecological environment protection strategy and the amount of ecological compensation () that the water-receiving area is willing to pay. Therefore, in order to determine the stability conditions of the evolutionary game, it was necessary to determine the range of the penalty amount (F) when realizing the optimal stability strategy in the constraint mechanism.
It can be seen from the result of the above model that the range of F can be obtained when the optimal stability strategy is realized in the constraint mechanism, according to the amount of ecological compensation that Jinan is willing-to-pay and the wealth lost by Yangzhou due to the ecological environment protection strategy.
3.2. Estimation of Ecological Compensation Amount in Jinan
3.2.1. Questionnaire Investigation
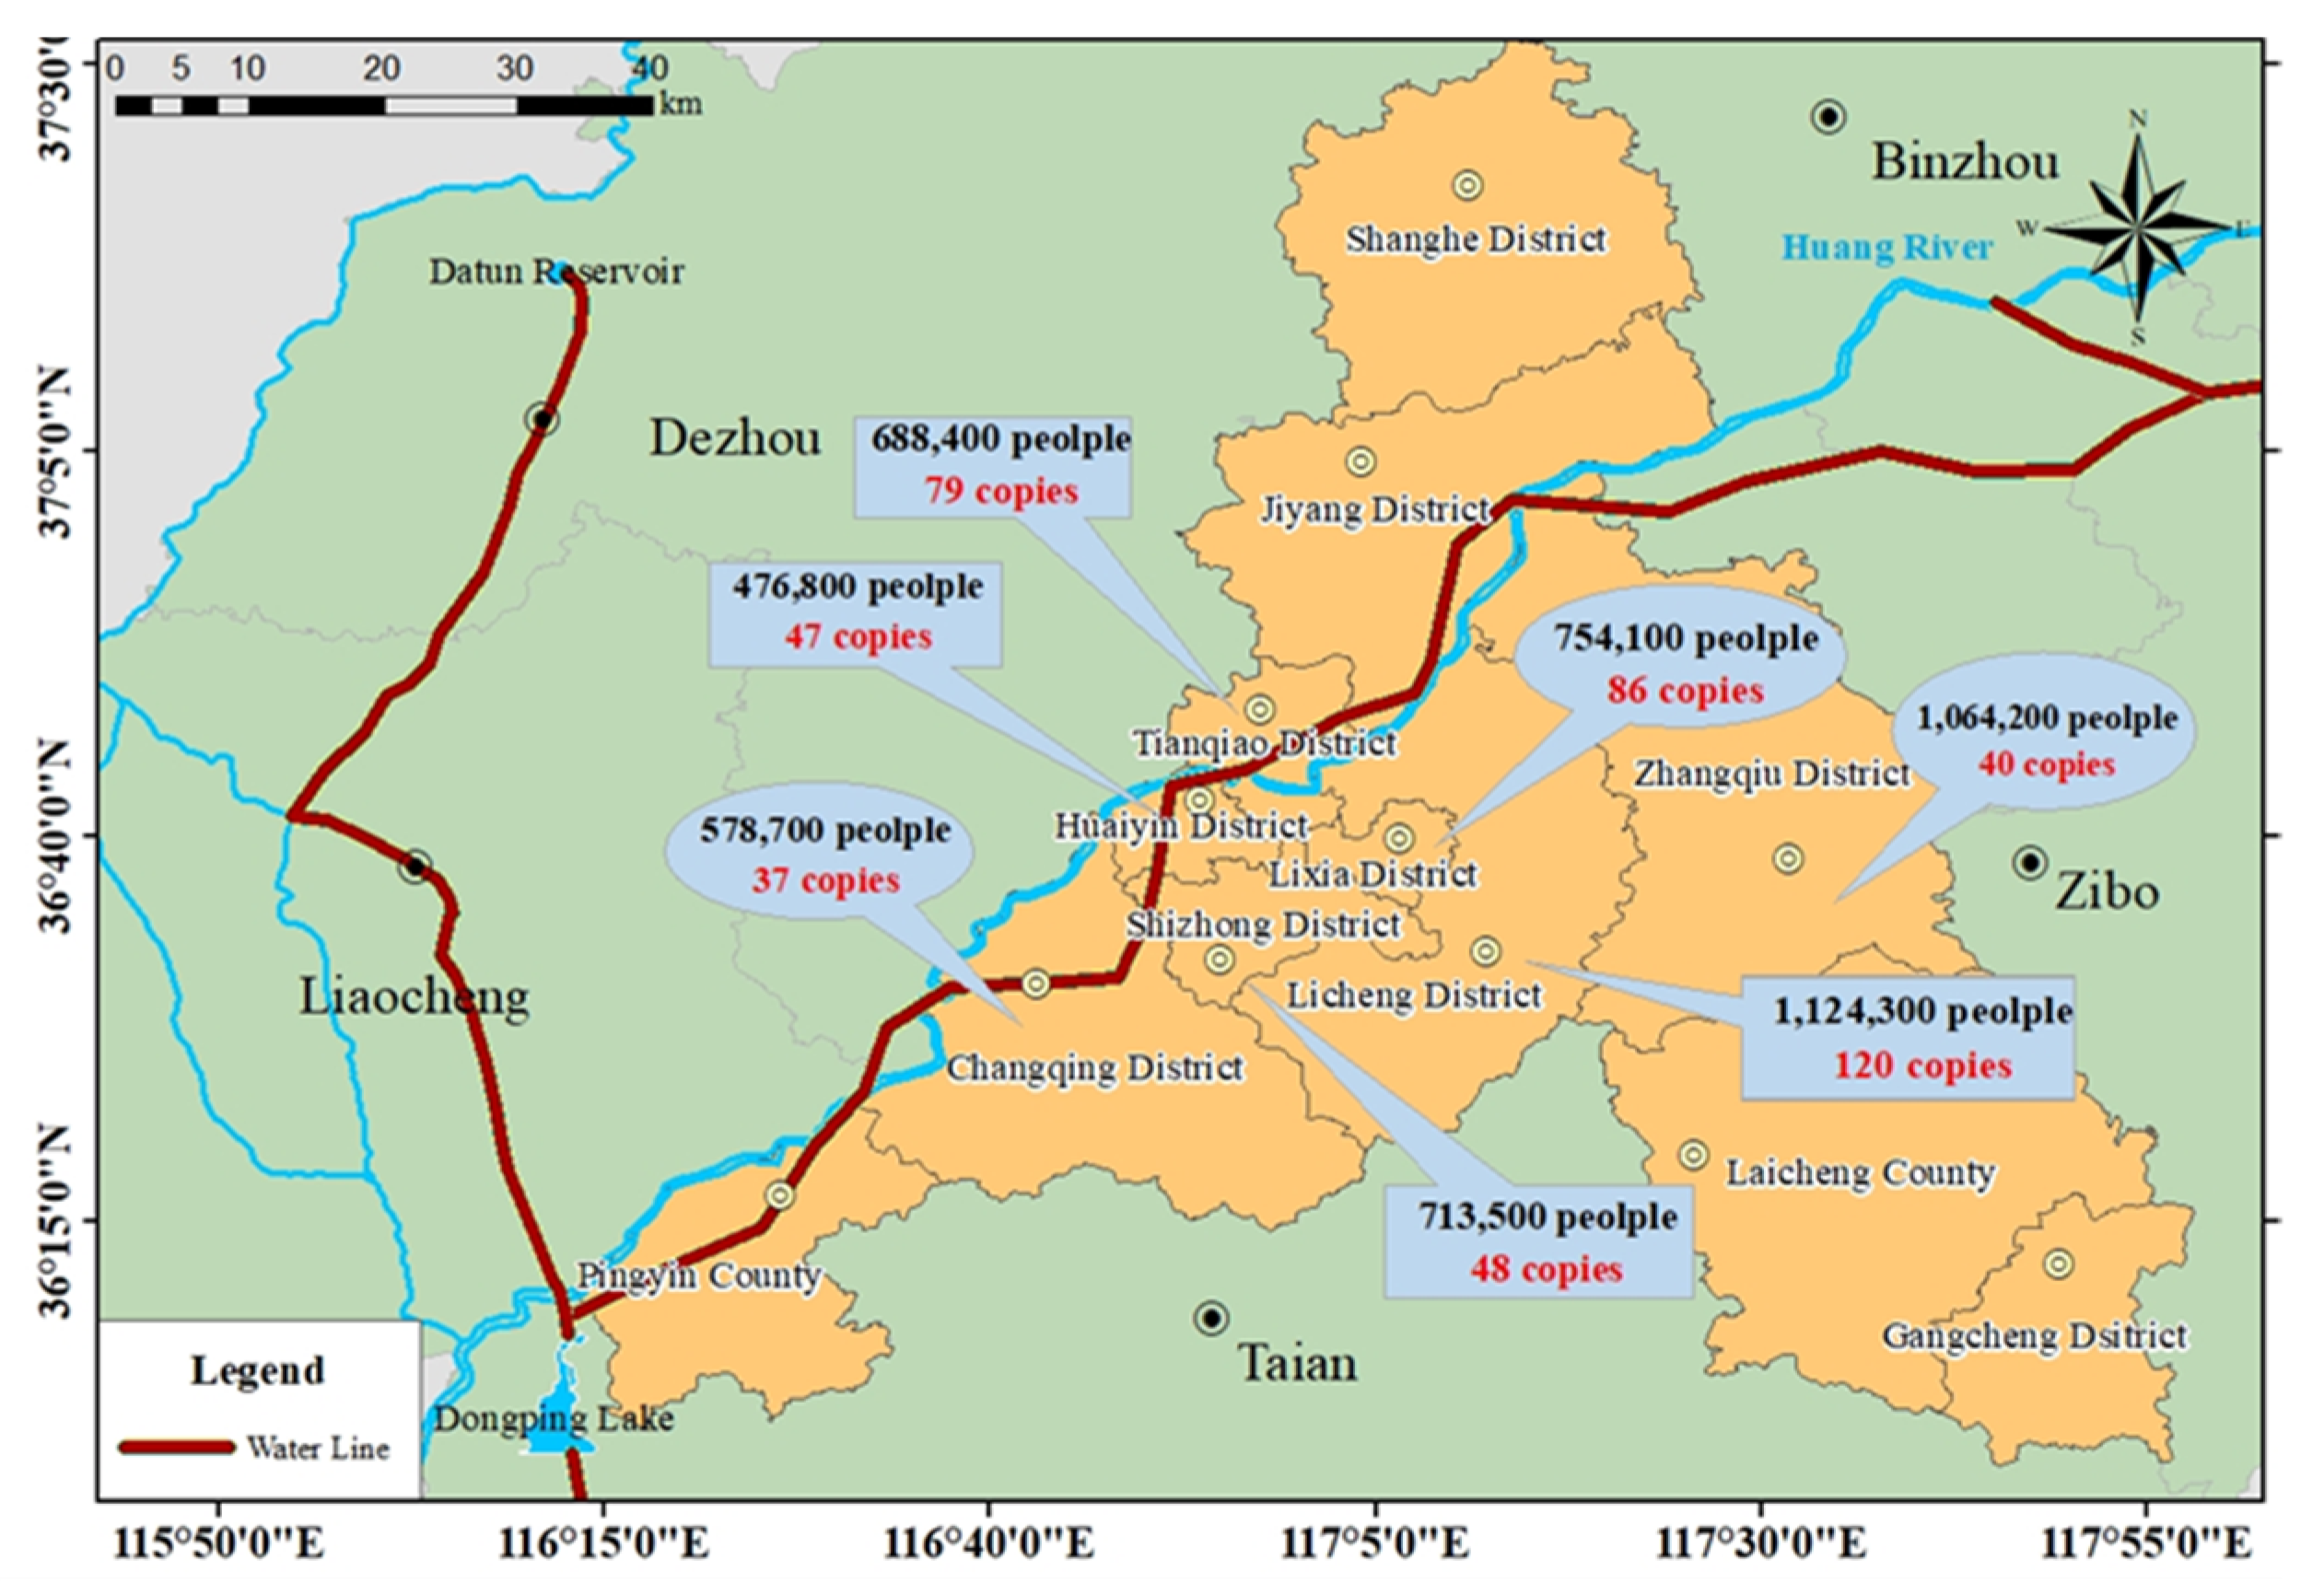
In May 2021, the CVM was used to conduct a questionnaire survey on the residents of the areas greatly affected by the project in Jinan (Shizhong District, Lixia District, Tianqiao District, Huaiyin District, Licheng District, Changqing District and Zhangqiu District). These seven areas basically cover the area of the water transfer line. A total of 457 questionnaires were distributed in this survey, including 48 in Shizhong District, 86 in Lixia District, 79 in Tianqiao District, 47 in Huaiyin District, 120 in Licheng District, 37 in Changqing District and 40 in Zhangqiu district. Figure 2 shows the distribution of questionnaires. Three hundred and eighty-three valid questionnaires were collected in this survey, with an effective rate of 83.81%.
Although the labor cost and time cost of face-to-face survey are higher than other methods (telephone and Internet), the results of face-to-face survey can reflect the public willingness more truly and effectively. Therefore, the face-to-face questionnaire survey method was adopted (Supplementary Material). Seven surveyors had also received professional training. The importance of truthful answers was clearly emphasized to reduce hypothetical market bias [42].
3.2.2. Calculation of WTP Value
The cumulative frequency distribution of respondents’ WTP is shown in Table 4. The adjusted frequency refers to the ratio of the number of residents whose WTP falls within a certain interval to all residents who are willing to pay, and the cumulative frequency refers to the ratio of the number of residents whose WTP is less than or equal to a certain interval to all residents who are willing to pay. Among 383 valid samples in Jinan, 254 respondents had WTP, accounting for 66.3%, among which 88.6% of residents had WTP less than 599 RMB per person per year.
The average value of WTP calculated by the nonparametric method is 228.33 RMB per year, according to Equation (19). The average value of 5% trimming is 170.11 RMB per year, considering the influence of extreme values at both ends. The average value of WTP calculated by the parametric method is 164.88 RMB per year, according to Equations (20)~(23). The nonparametric method obtains two results of the average value and the 5% trimmed average value, and the parametric method obtains one result of the model estimated average value. The three results were added and the average value taken, in order to describe quantitatively and make the results more scientific and reasonable. Table 5 shows the results.
The mean value of WTP was estimated to be 187.77 RMB per year by combining nonparametric method and parametric method, accounting for 4% of the disposable income of the people in Jinan. Some papers on ecological compensation of water resources show that the average value of WTP is between 150 and 350 RMB per year [43,44,45,46], so it is considered that the results of this study are within the acceptable range. There are studies that show that in China, the mean value of WTP for smog mitigation was 1590.36 RMB per year [46], while the mean value of WTP for the development of solar energy was 70 RMB per year [47], perhaps the degree of scarcity and substitutability of goods will have an impact on the WTP [48,49]. In addition, we found that there was no significant difference between developed and developing countries in the WTP for water resource improvement [50,51,52,53,54,55]. In 2021, the permanent resident population of Jinan at the end of the year was 9.336 million, and the average WTP obtained in this study was 187.77 RMB per year. Therefore, it is estimated that the total amount that the permanent residents of Jinan are willing to pay each year is 1.753 billion RMB.
3.3. Cost Evaluation of Ecological Protection in Yangzhou
The amount of water transferred from ER-SNWDP in Jinan in 2020 was 790.31 million m3, according to Jinan Water Resources Bulletin in 2020. The water supply price of SNWDP in Jinan was 1.65 RMB/m3. On 13 December 2020, the water quality of water diversion source protection area in Yangzhou Sanjiangying reached class II in 12 months of the year, which is the drinking water standard, according to Yangzhou Water Resources Bulletin. The corresponding water resources compensation can be calculated by substituting the relevant data into Equation (23), and the result was 1.304 billion RMB.
According to the market value method, the cost paid by Yangzhou to protect water quality was 1.304 billion RMB. The methods used to calculate wealth loss in water-source areas include opportunity cost method [55], hydro-ecological response method [56] and ecosystem service values method, etc. These methods have their own characteristics. In this study, we adopted a relatively simple method to study the loss cost of the water-source area. Compared to the methods mentioned above, market value method was simple, with less input data. However, the market value is not equal to economic value. We estimated loss cost of the water-source area by means of the market value approach, but the method does have some limitations. The water in the water-source area may still have significant potential value for various purposes, such as recharging groundwater, transporting sediment and fertilizing inundated areas. These values are not dependent on alternative uses and not considered in this study. It was reasonable in terms of residents’ WTP for ecological compensation in Jinan. The results were also relatively close to the benefit per unit discharge of ecological base flow in the Wei River obtained by Yue et al. [57], which were USD 0.19–0.87/m3, so it can be assumed that the results of this method were basically rational.
4. Conclusions
According to the setting of the game scenario between the government of the water-source area and the water-receiving area, an evolutionary game model of ecological compensation for inter-basin water transfer was constructed after the constraint mechanism was introduced. The range of penalty amount (F) when the state of the social optimal environmental protection strategy (protection, compensation) is stable was determined theoretically: which is greater than the maximum of and ? Our work took ER-SNWDP as the research object, taking Yangzhou and Jinan as the representatives of the water-source area and the water-receiving area, respectively. The loss cost of Yangzhou and the compensation amount of Jinan were calculated by using the market value method and the willingness-to-pay method. The cost paid by Yangzhou for the protection of water quality was 1.304 billion RMB (USD 189 million), and the amount of willing-to-pay by Jinan residents was 1.753 billion RMB (USD 254 million). Therefore, in order to stabilize the strategy (protection, compensation), the penalty amount should be greater than 1.753 billion RMB (USD 254 million).
5. Suggestions
In order to better carry out the ecological governance of inter-basin water transfer, the superior supervision department can set up a certain reward mechanism while supervising and punishing. In China, there is a game between local governments and developers regarding the construction of sponge communities. The policy objectives can be achieved by adopting incentive measures to guide developers to build high-quality sponge communities. The ecological incentive mechanism of “Award by bird numbers“ in Nanji Wetland of Poyang Lake is a new mode of ecological protection in China. Through activities such as “Award by bird numbers“, the loss of community fishermen is compensated, and the enthusiasm of community people to participate in bird protection is improved. The activities also engendered trust between managers and community people. Therefore, when the government of the water-source area chooses ecological protection and the government of the water-receiving area chooses ecological compensation, it can give a certain reward and compensation, which will greatly help the improvement of the ecological environment of the river basin.
In order to solve the problem of inter-basin water pollution, the United States promulgated the Clean Water Act. The Clean Water Act has special provisions that emphasize the responsibility of each state to its neighboring states. The upstream states need to consider the water quality standards of the downstream states and jointly comply with the sewage discharge standards. The downstream states can require licensing standards in upstream states that affect downstream water quality. States can consult with each other, but consultation is only a part of it. More importantly, it is guaranteed by law. The Clean Water Act gives the United States Environmental Protection Agency the regulatory power [58,59,60,61]. And the National Environmental Policy Act is a law that supervises and restricts administrative decision-making. It supplements the legal obligations and responsibilities of all federal administrative agencies to protect the environment [61]. China’s Environmental protection law, the Law on the Prevention and Control of Water Pollution, and other laws or regulations all propose establishing and improving the ecological compensation mechanism for water environment in water source areas, but have not made clear provisions for specific implementation and supervision. The lack of legal guarantee hinders the smooth progress of ecological compensation. Therefore, in order to ensure the strategic development (protection and compensation) of both the water-source area and the water-receiving area in the inter basin water transfer project, it is necessary to further improve the laws and regulations on ecological compensation and improve the legal guarantee of the ecological compensation system.
The stakeholders involved in the ecological compensation of inter-basin water transfer are relatively complex, and it is difficult to calculate the compensation amount with a unified method. In our study, the market value method and willingness-to pay-method also have certain limitations, so it is necessary to further strengthen the research on the calculation method.
Supplementary Materials
The following supporting information can be downloaded at: https://www.mdpi.com/article/10.3390/w14213498/s1, Public Opinion Survey Questionnaire on “Residents’ Ecological Compensation Willingness for the East Route of South-to-North Water Diversion Project”.
Author Contributions
Conceptualization, Z.P.; data curation, H.P. and Y.L.; funding acquisition, Z.P.; investigation, Z.P., H.P. and Y.L.; methodology, Z.P.; resources, H.P. and Y.L.; visualization, H.P.; writing — original draft, H.P. and Y.L.; writing — review & editing, Z.P. All authors have read and agreed to the published version of the manuscript.
Funding
This research was funded by Natural Science Foundation of Jiangsu Province, China, grant number BK20200942; Natural Science Research Project of Higher Education Institutions of Jiangsu Province, China, grant number 20KJB570003.
Institutional Review Board Statement
Not applicable.
Informed Consent Statement
Not applicable.
Data Availability Statement
Not applicable.
Conflicts of Interest
The authors declare no conflict of interest.
References
- Shakhashiri, B.Z.; Sedlak, D.L.; Schnoor, J.L. ACS Global Water Initiative: The Grand Challenge Of Water. Chem. Eng. News 2014, 91, 37. [Google Scholar] [CrossRef]
- Liu, M.; Guo, J. Comparisons and improvements of eco-compensation standards for water resource protection in the Middle Route of the South-to-North Water Diversion Project. Water Supply 2020, 20, 2988–2999. [Google Scholar] [CrossRef]
- Chen, W.; Wu, S.; Lei, Y.; Li, S. China’s water footprint by province, and inter-provincial transfer of virtual water. Ecol. Indic. 2017, 74, 321–333. [Google Scholar] [CrossRef]
- Wang, H.; Zhang, C.; Yao, X.; Yun, W.; Ma, J.; Gao, L.; Li, P. Scenario simulation of the tradeoff between ecological land and farmland in black soil region of Northeast China. Land Use Policy 2022, 114. [Google Scholar] [CrossRef]
- Liu, J.; Li, Y.; Huang, G.; Yang, Y.; Wu, X. A Factorial Ecological-Extended Physical Input-Output Model for Identifying Optimal Urban Solid Waste Path in Fujian Province, China. Sustainability 2021, 13, 8341. [Google Scholar] [CrossRef]
- Liu, Y.; Bi, J.; Lv, J.; Ma, Z.; Wang, C. Spatial multi-scale relationships of ecosystem services: A case study using a geostatistical methodology. Sci. Rep. 2017, 7, 1–12. [Google Scholar] [CrossRef] [Green Version]
- Tian, J.; Liu, D.; Guo, S.; Pan, Z.; Hong, X. Impacts of Inter-Basin Water Transfer Projects on Optimal Water Resources Allocation in the Hanjiang River Basin, China. Sustainability 2019, 11, 2044. [Google Scholar] [CrossRef] [Green Version]
- Ling, K.; He, X. Risk analysis of rich–poor rainfall encounter in inter-basin water transfer projects based on Bayesian networks. Water Sci. Technol. Water Supply 2011, 11, 451. [Google Scholar] [CrossRef]
- Xu, H.; Li, M.; Li, G.; Zhang, S.; Dong, Y.; Yang, Z. Impact Of The South-To-North Water Diversion Project On Groundwater Resources: A Case Study in Pinggu Basin, Beijing, China. Environ. Eng. Manag. J. 2013, 12, 2239–2247. [Google Scholar] [CrossRef]
- Adeba, D.; Kansal, M.L.; Sen, S. Economic evaluation of the proposed alternatives of inter-basin water transfer from the Baro Akobo to Awash basin in Ethiopia. Sustain. Water Resour. Manag. 2016, 2, 313–330. [Google Scholar] [CrossRef]
- Yan, B.; Guo, S.; Xiao, Y. Synchronous-asynchronous encounter probability of rich-poor precipitation between water source area and water receiving areas in the Middle Route of South-to-North Water Transfer Project. J. Hydraul. Eng. 2007, 38, 1178–1185. [Google Scholar]
- Clot, S.; Andriamahefazafy, F.; Grolleau, G.; Ibanez, L.; Méral, P. Compensation and Rewards for Environmental Services (CRES) and efficient design of contracts in developing countries. Behavioral insights from a natural field experiment. Ecol. Econ. 2015, 113, 85–96. [Google Scholar] [CrossRef]
- Wei, S.; Yang, H.; Abbaspour, K.; Mousavi, J.; Gnauck, A. Game theory based models to analyze water conflicts in the Middle Route of the South-to-North Water Transfer Project in China. Water Res. 2010, 44, 2499–2516. [Google Scholar] [CrossRef]
- Wei, S.; Lei, A.; Gnauck, A. Application of game theoretic models to solve the benefit conflicts in water resources management. J. Hydraul. Eng. 2009, 40, 910–918. [Google Scholar]
- Quan, Y.; Wang, C.; Yan, Y.; Wu, G.; Zhang, H. Impact of Inter-Basin Water Transfer Projects on Regional Ecological Security from a Telecoupling Perspective. Sustainability 2016, 8, 162. [Google Scholar] [CrossRef] [Green Version]
- Madani, K. Game theory and water resources. J. Hydrol. 2010, 381, 225–238. [Google Scholar] [CrossRef]
- Brugière, P. Utility Functions and the Theory of Choice. In Quantitative Portfolio Management; Springer Texts in Business and Economics; Springer: Cham, Switzerland, 2020; pp. 19–25. [Google Scholar] [CrossRef]
- Gerber, A. The Nash Solution as a von Neumann–Morgenstern Utility Function on Bargaining Games. Homo Oeconomicus J. Behav. Inst. Econ. 2020, 37, 87–104. [Google Scholar] [CrossRef] [Green Version]
- Francis, J.C. Reformulating prospect theory to become a von Neumann–Morgenstern theory. Rev. Quant. Financ. Account. 2020, 56, 965–985. [Google Scholar] [CrossRef]
- Souza, W.; Malavazi, M.C. Game theory: An approach through history and its applications. Sci. Electron. Arch. 2019, 12, 138. [Google Scholar] [CrossRef]
- Herfeld, C.; Doehne, M. The diffusion of scientific innovations: A role typology. Stud. Hist. Philos. Sci. Part A 2017, 77, 64–80. [Google Scholar] [CrossRef]
- Ansink, E.; Ruijs, A. Climate Change and the Stability of Water Allocation Agreements. Environ. Resour. Econ. 2008, 41, 249–266. [Google Scholar] [CrossRef]
- Wang, L.; Fang, L.; Hipel, K.W. Basin-wide cooperative water resources allocation. Eur. J. Oper. Res. 2008, 190, 798–817. [Google Scholar] [CrossRef]
- Shi, G.-M.; Wang, J.-N.; Zhang, B.; Zhang, Z.; Zhang, Y.-L. Pollution control costs of a transboundary river basin: Empirical tests of the fairness and stability of cost allocation mechanisms using game theory. J. Environ. Manag. 2016, 177, 145–152. [Google Scholar] [CrossRef] [PubMed]
- Hu, D.; Liu, H.; Chen, X.; Chen, Y. Research on the ecological compensation standard of the basin pollution control project based on evolutionary game theory and by taking Xiangjiang River as a case. Front. Eng. Manag. 2019, 6, 575–583. [Google Scholar] [CrossRef]
- Wei, C.; Luo, C. A differential game design of watershed pollution management under ecological compensation criterion. J. Clean. Prod. 2020, 274, 122320. [Google Scholar] [CrossRef]
- Yi, Y.; Wei, Z.; Fu, C. A Differential Game of Transboundary Pollution Control and Ecological Compensation in a River Basin. Complexity 2020, 2020, 1–13. [Google Scholar] [CrossRef]
- Peng, Z.; Wu, H.; Ding, M.; Li, M.; Huang, X.; Zheng, R.; Xu, L. Ecological Compensation Standard of a Water-Receiving Area in an Inter-Basin Water Diversion Based on Ecosystem Service Value and Public Willingness: A Case Study of Beijing. Sustainability 2021, 13, 5236. [Google Scholar] [CrossRef]
- Peng, Z.; Pu, H.; Huang, X.; Zheng, R.; Xu, L. Study on public willingness and incentive mechanism of ecological compensation for inter-basin water transfer in China in the carbon neutral perspective. Ecol. Indic. 2022, 143, 109397. [Google Scholar] [CrossRef]
- Yang, W.; Cheng, J.; Li, X.; Wang, K.; Qiang, C.; Yan, C.; Gao, Z. A Research of the Section Layout of the Second Phase of the Eastern Route of South-to-North Water Diversion Project: From Hongze Lake to Luoma Lake. IOP Conf. Ser. Earth Environ. Sci. 2021, 676, 012110. [Google Scholar] [CrossRef]
- Guo, C.; Chen, Y.; Liu, H.; Lu, Y.; Qu, X.; Yuan, H.; Lek, S.; Xie, S. Modelling fish communities in relation to water quality in the impounded lakes of China’s South-to-North Water Diversion Project. Ecol. Model. 2019, 397, 25–35. [Google Scholar] [CrossRef]
- Guo, C.; Chen, Y.; Wei, L.; Xie, S.; Lek, S.; Li, Z. Food web structure and ecosystem properties of the largest impounded lake along the Eastern Route of China’s South-to-North Water Diversion Project. Ecol. Inf. 2018, 43, 174–184. [Google Scholar] [CrossRef]
- He, Z.; Asami, Y. How Do Landowners Price their Lands during Land Expropriation and the Motives Behind It: An Explanation from a WTA/WTP Experiment in Central Beijing. Urban Stud. 2014, 51, 412–427. [Google Scholar] [CrossRef]
- Sehreen, F.; Masud, M.M.; Akhtar, R.; Masum, R.A. A contingent valuation approach to evaluating willingness to pay for an improved water pollution management system in Dhaka City, Bangladesh. Environ. Monit. Assess. 2019, 191, 457. [Google Scholar] [CrossRef] [PubMed]
- Friedman, D. Evolutionary Games in Economics. Econometrica 1991, 59, 637–666. [Google Scholar] [CrossRef] [Green Version]
- Xie, B.-C.; Zhao, W. Willingness to pay for green electricity in Tianjin, China: Based on the contingent valuation method. Energy Policy 2018, 114, 98–107. [Google Scholar] [CrossRef]
- Guo, X.; Liu, H.; Mao, X.; Jin, J.; Chen, D.; Cheng, S. Willingness to pay for renewable electricity: A contingent valuation study in Beijing, China. Energy Policy 2014, 68, 340–347. [Google Scholar] [CrossRef]
- Peng, Z.; Zhang, L.; Yin, J.; Wang, H. Study of impact factors of willingness to pay regarding water reserve of South-to-North Water Diversion Project in Beijing based on Bayesian network model. J. Clean. Prod. 2018, 184, 569–578. [Google Scholar] [CrossRef]
- Cameron, T.A.; Huppert, D.D. OLS versus ML estimation of non-market resource values with payment card interval data. J. Environ. Econ. Manag. 1989, 17, 230–246. [Google Scholar] [CrossRef]
- Guo, B.; Huang, X.; Ma, K.; Gao, L.; Wang, Y. Discussion on water resources value accounting and its application. Proc. Int. Assoc. Hydrol. Sci. 2018, 379, 279–286. [Google Scholar]
- Chen, B.; Fan, Y. Optimization of coordinated water resource management in Beijing-Tianjin-Hebei Region from the perspective of water accounting. China Financ. Econ. Rev. 2019, 8, 112–118. [Google Scholar]
- Zografakis, N.; Sifaki, E.; Pagalou, M.; Nikitaki, G.; Psarakis, V.; Tsagarakis, K.P. Assessment of public acceptance and willingness to pay for renewable energy sources in Crete. Renew. Sustain. Energy Rev. 2010, 14, 1088–1095. [Google Scholar] [CrossRef]
- Sheild, L.D.; Gopalakrishnan, C.; Chan-Halbrendt, C. Aligning Stakeholders’ Preferences with Public Trust in Managing In-stream Flow: The Case of Hawai’i. Int. J. Water Resour. Dev. 2009, 25, 657–679. [Google Scholar] [CrossRef]
- Mohamed, N.; Shamsudin, M.; Ghani, A.; Radam, A.; Kaffashi, S.; Rahim, N.; Bin Hassin, N. Willingness to Pay for Watershed Conservation at Hulu Langat, Selangor. J. Appl. Sci. 2012, 12, 1859–1864. [Google Scholar] [CrossRef]
- Markantonis, V.; Dondeynaz, C.; Latinopoulos, D.; Bithas, K.; Trichakis, I.; M’Po, Y.N.; Moreno, C.C. Values and Preferences for Domestic Water Use: A Study from the Transboundary River Basin of Mékrou (West Africa). Water 2018, 10, 1232. [Google Scholar] [CrossRef] [Green Version]
- Sun, C.; Yuan, X.; Yao, X. Social acceptance towards the air pollution in China: Evidence from public’s willingness to pay for smog mitigation. Energy Policy 2016, 92, 313–324. [Google Scholar] [CrossRef]
- Jin, J.; Wan, X.; Lin, Y.; Kuang, F.; Ning, J. Public willingness to pay for the research and development of solar energy in Beijing, China. Energy Policy 2019, 134. [Google Scholar] [CrossRef]
- Zhao, J.; Kling, C.L. A new explanation for the WTP/WTA disparity. Econ. Lett. 2001, 73, 293–300. [Google Scholar] [CrossRef] [Green Version]
- Martín-Fernández, J.; Ariza-Cardiel, G.; Pea-Longobardo, L.M.; Polentinos-Castro, E.; Oliva-Moreno, J.; Gil-Lacruz, A.I.; Medina-Palomino, H.; Cura-González, I.D. “Gaining or losing”: The importance of the perspective in primary care health services valuation. PLoS ONE 2017, 12, e0188969. [Google Scholar] [CrossRef] [Green Version]
- Tanellari, E.; Bosch, D.; Boyle, K.; Mykerezi, E. On consumers’ attitudes and willingness to pay for improved drinking water quality and infrastructure. Water Resour. Res. 2015, 51, 47–57. [Google Scholar] [CrossRef]
- Behailu, S.; Kume, K.; Desalegn, B. Household’s willingness to pay for improved water service: A case study in Shebedino District, Southern Ethiopia. Water Environ. Res. 2012, 26, 429–434. [Google Scholar] [CrossRef]
- del Saz-Salazar, S.; García-Rubio, M.A.; González-Gómez, F.; Picazo-Tadeo, A.J. Managing Water Resources Under Conditions of Scarcity: On Consumers’ Willingness to Pay for Improving Water Supply Infrastructure. Water Resour. Manag. 2016, 30, 1723–1738. [Google Scholar] [CrossRef]
- Tumer, E.I. Willingness to pay for increasing river water quality in Aksu River, Turkey. Environ. Dev. Sustain. 2022, 22, 6495–6503. [Google Scholar] [CrossRef]
- Dey, N.C.; Parvez, M.; Saha, R.; Islam, M.R.; Akter, T.; Rahman, M.; Barua, M.; Islam, A. Water quality and willingness to pay for safe drinking water in Tala Upazila in a Coastal District of Bangladesh. Expos. Health 2019, 11, 297–310. [Google Scholar] [CrossRef]
- Yue, S.; Li, H.; Cheng, B. Variation of economic value produced by environmental flow in water-scarce basins of Northwest China. J. Water Clim. Chang. 2021, 12, 955–968. [Google Scholar] [CrossRef]
- Akter, S.; Grafton, R.Q.; Merritt, W.S. Integrated hydro-ecological and economic modeling of environmental flows: Macquarie Marshes, Australia. Agric. Water Manag. 2014, 145, 98–109. [Google Scholar] [CrossRef]
- Yue, S.; Li, H.; Cheng, B.; Gao, Z. The Value of Environmental Base Flow in Water-Scarce Basins: A Case Study of Wei River Basin, Northwest China. Water 2018, 10, 848. [Google Scholar] [CrossRef] [Green Version]
- Ruhl, J.B. Ecosystem services and the clean water act: Strategies for fitting new science into old law. Environ. Law 2010, 40, 1381–1399. [Google Scholar] [CrossRef] [Green Version]
- Frost, C.D.; Mailloux, J.M. Establishing appropriate water quality numeric standards under the clean water act: Lessons from a case study of coalbed methane produced water discharge to the Powder River, Wyoming and Montana. Wyo. Law Rev. 2011, 11, 1. [Google Scholar]
- Fesenmyer, K.A.; Wenger, S.J.; Leigh, D.S.; Neville, H.M. Large portion of USA streams lose protection with new interpretation of Clean Water Act. Freshw. Sci. 2021, 40, 252–258. [Google Scholar] [CrossRef]
- Rieder, J.M. An evaluation of two environmental acts: The National Environmental Policy Act and the Environment Protec-tion and Biodiversity Conservation Act. Asia Pac. J. Environ. Law 2011, 14, 105. [Google Scholar]
Figure 1.
Route map of the east route of the South-to-North Water Transfer Project.

Figure 2.
The specific distribution of questionnaires in Jinan.

Table 1.
Payoff matrix of water-source area and water-receiving area.
| Water-Source Area | Water-Receiving Area | |
|---|---|---|
| Compensation | No Compensation | |
| Protection | ||
| No protection | ||
Table 2.
Description of parameters in the model.
| Parameters | Description |
|---|---|
| The cost of protecting the ecological environment in the water-source area. | |
| The monetary amount given as compensation by the water-receiving area to the water-source area. | |
| The ecological benefits obtained by the water-source area due to environmental protection. | |
| The total benefit obtained by the water-receiving area when the water-source area protects the ecological environment. | |
| The total benefit obtained by the water-receiving area when the water-source area does not protect the ecological environment. |
Note: These five parameters are used in algebraic operations in the model. Assuming that the parameters themselves are greater than 0, the relevant losses take the opposite number of the corresponding benefits.
Table 3.
Payoff matrix with constraint mechanism.
| Water-Source Area | Water-Receiving Area | |
|---|---|---|
| Compensation | No Compensation | |
| Protection | ||
| No protection | ||
Table 4.
Cumulative frequency of WTP of respondents.
| WTP (RMB) | Absolute Frequency/Person | Relative Frequency/% | Frequency of Adjustment/% | Cumulative Frequency/% |
|---|---|---|---|---|
| Over 100 RMB | 62 | 16.19 | 24.41 | 24.41 |
| 100–199 RMB | 61 | 15.93 | 24.02 | 48.43 |
| 200–299 RMB | 32 | 8.36 | 12.60 | 61.02 |
| 300–399 RMB | 28 | 7.31 | 11.02 | 72.05 |
| 400–499 RMB | 10 | 2.61 | 3.94 | 75.98 |
| 500–599 RMB | 32 | 8.36 | 12.60 | 88.58 |
| 600–699 RMB | 9 | 2.35 | 3.54 | 92.13 |
| 700–799 RMB | 2 | 0.52 | 0.79 | 92.91 |
| 800–899 RMB | 0 | 0.00 | 0.00 | 92.91 |
| 900–999 RMB | 1 | 0.26 | 0.39 | 93.31 |
| 1000–1499 RMB | 9 | 2.35 | 3.54 | 96.85 |
| 1500–1999 RMB | 1 | 0.26 | 0.39 | 97.24 |
| 2000 RMB and above | 7 | 1.83 | 2.76 | 100 |
| Willing to pay (WTP > 0) | 254 | 66.32 | 100 | |
| Refuse to pay (WTP = 0) | 129 | 33.68 | ||
| total | 383 | 100 |
Table 5.
Nonparametric and parametric estimation results.
| Evaluation Method | WTA (RMB Per Year) | |
|---|---|---|
| Nonparametric method | Average value | 228.33 |
| Average value after 5% correction | 170.11 | |
| Parametric method | Mean value of model estimation | 164.88 |
| Nonparametric method + parametric method (mean) | 187.77 | |
Publisher’s Note: MDPI stays neutral with regard to jurisdictional claims in published maps and institutional affiliations. |
© 2022 by the authors. Licensee MDPI, Basel, Switzerland. This article is an open access article distributed under the terms and conditions of the Creative Commons Attribution (CC BY) license (https://creativecommons.org/licenses/by/4.0/).
Share and Cite
MDPI and ACS Style
Peng, Z.; Pu, H.; Liang, Y. Study on Ecological Compensation of Inter-Basin Water Transfer Based on Evolutionary Game Theory. Water 2022, 14, 3498. https://doi.org/10.3390/w14213498
AMA Style
Peng Z, Pu H, Liang Y. Study on Ecological Compensation of Inter-Basin Water Transfer Based on Evolutionary Game Theory. Water. 2022; 14(21):3498. https://doi.org/10.3390/w14213498
Chicago/Turabian StylePeng, Zhuoyue, Hangrong Pu, and Yubin Liang. 2022. "Study on Ecological Compensation of Inter-Basin Water Transfer Based on Evolutionary Game Theory" Water 14, no. 21: 3498. https://doi.org/10.3390/w14213498
Note that from the first issue of 2016, this journal uses article numbers instead of page numbers. See further details here.