Article

Attribution of Changes in Streamflow to Climate Change and Land Cover Change in Yangtze River Source Region, China

1
Key Laboratory of Mountain Surface Process and Ecological Regulations, Institute of Mountain Hazards and Environment, Chinese Academy of Sciences, Chengdu 610041, China
2
University of Chinese Academy of Sciences, Beijing 100049, China
3
State Key Laboratory of Hydraulics and Mountain River Engineering, College of Water Resource and Hydropower, Sichuan University, Chengdu 610065, China
4
State Key Laboratory of Hydrology Water Resources and Hydraulic Engineering, College of Hydrology and Water Resources, Hohai University, Nanjing 210098, China
5
Water Engineering and Management Group, Faculty of Engineering Technology, University of Twente, 7522 Enschede, The Netherlands
6
Faculty of Forestry, Universitas Gadjah Mada, Yogyakarta 55281, Indonesia
7
Department of Agricultural Extension and Rural Development, Bangabandhu Sheikh Mujibur Rahman Agricultural University, Gazipur 1706, Bangladesh
8
Department of Civil Engineering, National University of Computer and Emerging Sciences, Foundation for Advancement of Science and Technology, Lahore 54000, Pakistan
9
School of Environmental and Municipal Engineering, Xi’an University of Architecture and Technology, Xi’an 710055, China
*
Author to whom correspondence should be addressed.
Water 2022, 14(2), 259; https://doi.org/10.3390/w14020259
Submission received: 16 November 2021 / Revised: 20 December 2021 / Accepted: 4 January 2022 / Published: 17 January 2022
(This article belongs to the Section Hydrology)

Abstract

:
The quantitative attribution of changes in streamflow to climate change (CC) and land cover change (LCC) for the Yangtze River Source Region (YRSR), China, was assessed. We used a combination of the SWAT model along with the statistical technique one factor at a time (OFAT) and innovative trend analysis (ITA) to achieve the study objectives. The climate and hydrology data from 1961 to 2016 and land-cover maps of 5 years’ difference from 1985 to 2015 were used. The model was calibrated (1964–1989) using a land-cover map of 1985 and validated for 1990–2016. This validated model was further validated for all other land-cover maps used in this study. The SWAT model simulation showed that streamflow had been significantly influenced by CC compared to LCC using land-cover maps of 1985–1990, 1990–1995. However, the SWAT model simulations did not result in further changes in streamflow for land cover maps of 2000–2005, 2005–2010, and 2010–2015 because there have not been any significant changes in land cover after 2000 while the main contributing factor was climate change. The SWAT model simulations showed that the main driver of changes in streamflow in the Yangtze River Source Region is climate change. This study shows that the individual impacts are more critical than combined impacts for designing hydraulic structures, water resources planning and management, and decision-making policies at the regional/basin scale.

1. Introduction

Land cover/land use and climate are two fundamental and often independent components influencing hydrological processes in any river basin. The land-cover change (LCC) has impacts on the flood frequency as reported by [1,2], the severity of floods [3], annual mean discharge [4] and base flow [5,6]. On the other hand, climate change (CC) may impact peak flows, low flows, volumes, and the time of flow routing [7]. Climate change may impact the spatio-temporal variation in precipitation, which will eventually lead to changes in runoff [8,9,10]. In contrast, human activities can directly influence the land-cover change which ultimately disorder the on hydrological processes [9,11,12]. There is limited information available between CC and LCC which restricts the detailed understandings of changes in streamflow [13]. However, changes in hydrological processes due to CC and LCC in the source areas of a river basin will ultimately affect the water yield in the middle and the lower reaches of the river basin.
The identification of CC and LCC impacts imposed on the streamflow variations in the arid to semi-arid regions is always very interesting [14]. Most studies evaluated the impact of climate change on hydrological components [15,16], and only a few studies have been conducted in which the combined impacts of CC and LCC change on the water resources of a river basin were evaluated [17,18,19]. Most studies analyze the variations in hydrological processes at the river-basin scale using hydrological modeling [20,21,22]. Some studies used hydrological models and traditional statistical methods to determine the attribution of these variations in streamflow in a river basin [23,24,25,26,27,28].
A few researchers separated historical CC and LCC impacts on streamflow, and their findings are different. For example, in subtropical regions, land-cover changes have a more significant effect on streamflow change than climate change [29,30,31,32,33]. The changes in runoff are significantly influenced by climate change in the Anyangcheon watershed in Korea, and similar outcomes were reported by Chung, et al. [34] for another Korean (urban) catchment. The CC is more influence than LCC to streamflow in the upper reaches of the Yellow River [35]. The changes in streamflow on the Loess Plateau in China are primarily because of land-cover changes, as concluded by [27,36]. Similar results have been presented by [37] for the Yangtze River Delta Region. These contradictory findings showed that different river basins have different land-cover changes, climate change patterns, and topographical conditions, leading to varying impacts on streamflow.
The Yangtze River Basin is vital for China because of its vast dependency on agricultural and industrial production. The Yangtze River Source Region (YRSR) faces climate change impacts on water resources [38,39]. No study has been previously conducted on the attribution of streamflow changes because of CC and LCC in the Yangtze River Source Region (YRSR). Therefore, there is a need to investigate the contribution of CC and LCC to streamflow changes. This study used the Soil and Water Assessment Tool (SWAT) to simulate the streamflow for multiple land-cover change scenarios and climate change scenarios combined with the statistical technique. The innovative trend analysis (ITA) on the annual and monthly scale has been carried out, and the correlation between streamflow, precipitation, and temperature has been calculated. The resulting individual impacts of CC and LCC on YRSR streamflow will contribute to a better understanding of the downstream flow regimes for sustainable water resources management of the Yangtze River Basin rather than the combined impacts of climate change and land-cover change. Water resources planning and management can be tuned towards the significant driver of streamflow changes towards a more balanced and sustainable ecosystem [40]. We assumed that as the YRSR is located in the Qinghai Tibetan Plateau and, being hotspot of the climate change outside the polar region [41], the main driver of attribution in changes in streamflow is climate change rather than land cover in this region. Moreover, the quantifications of variations in the streamflow for this region simulated by a distributed hydrological model (i.e., SWAT model) have not been investigated so far in this region.

2. Materials and Methods
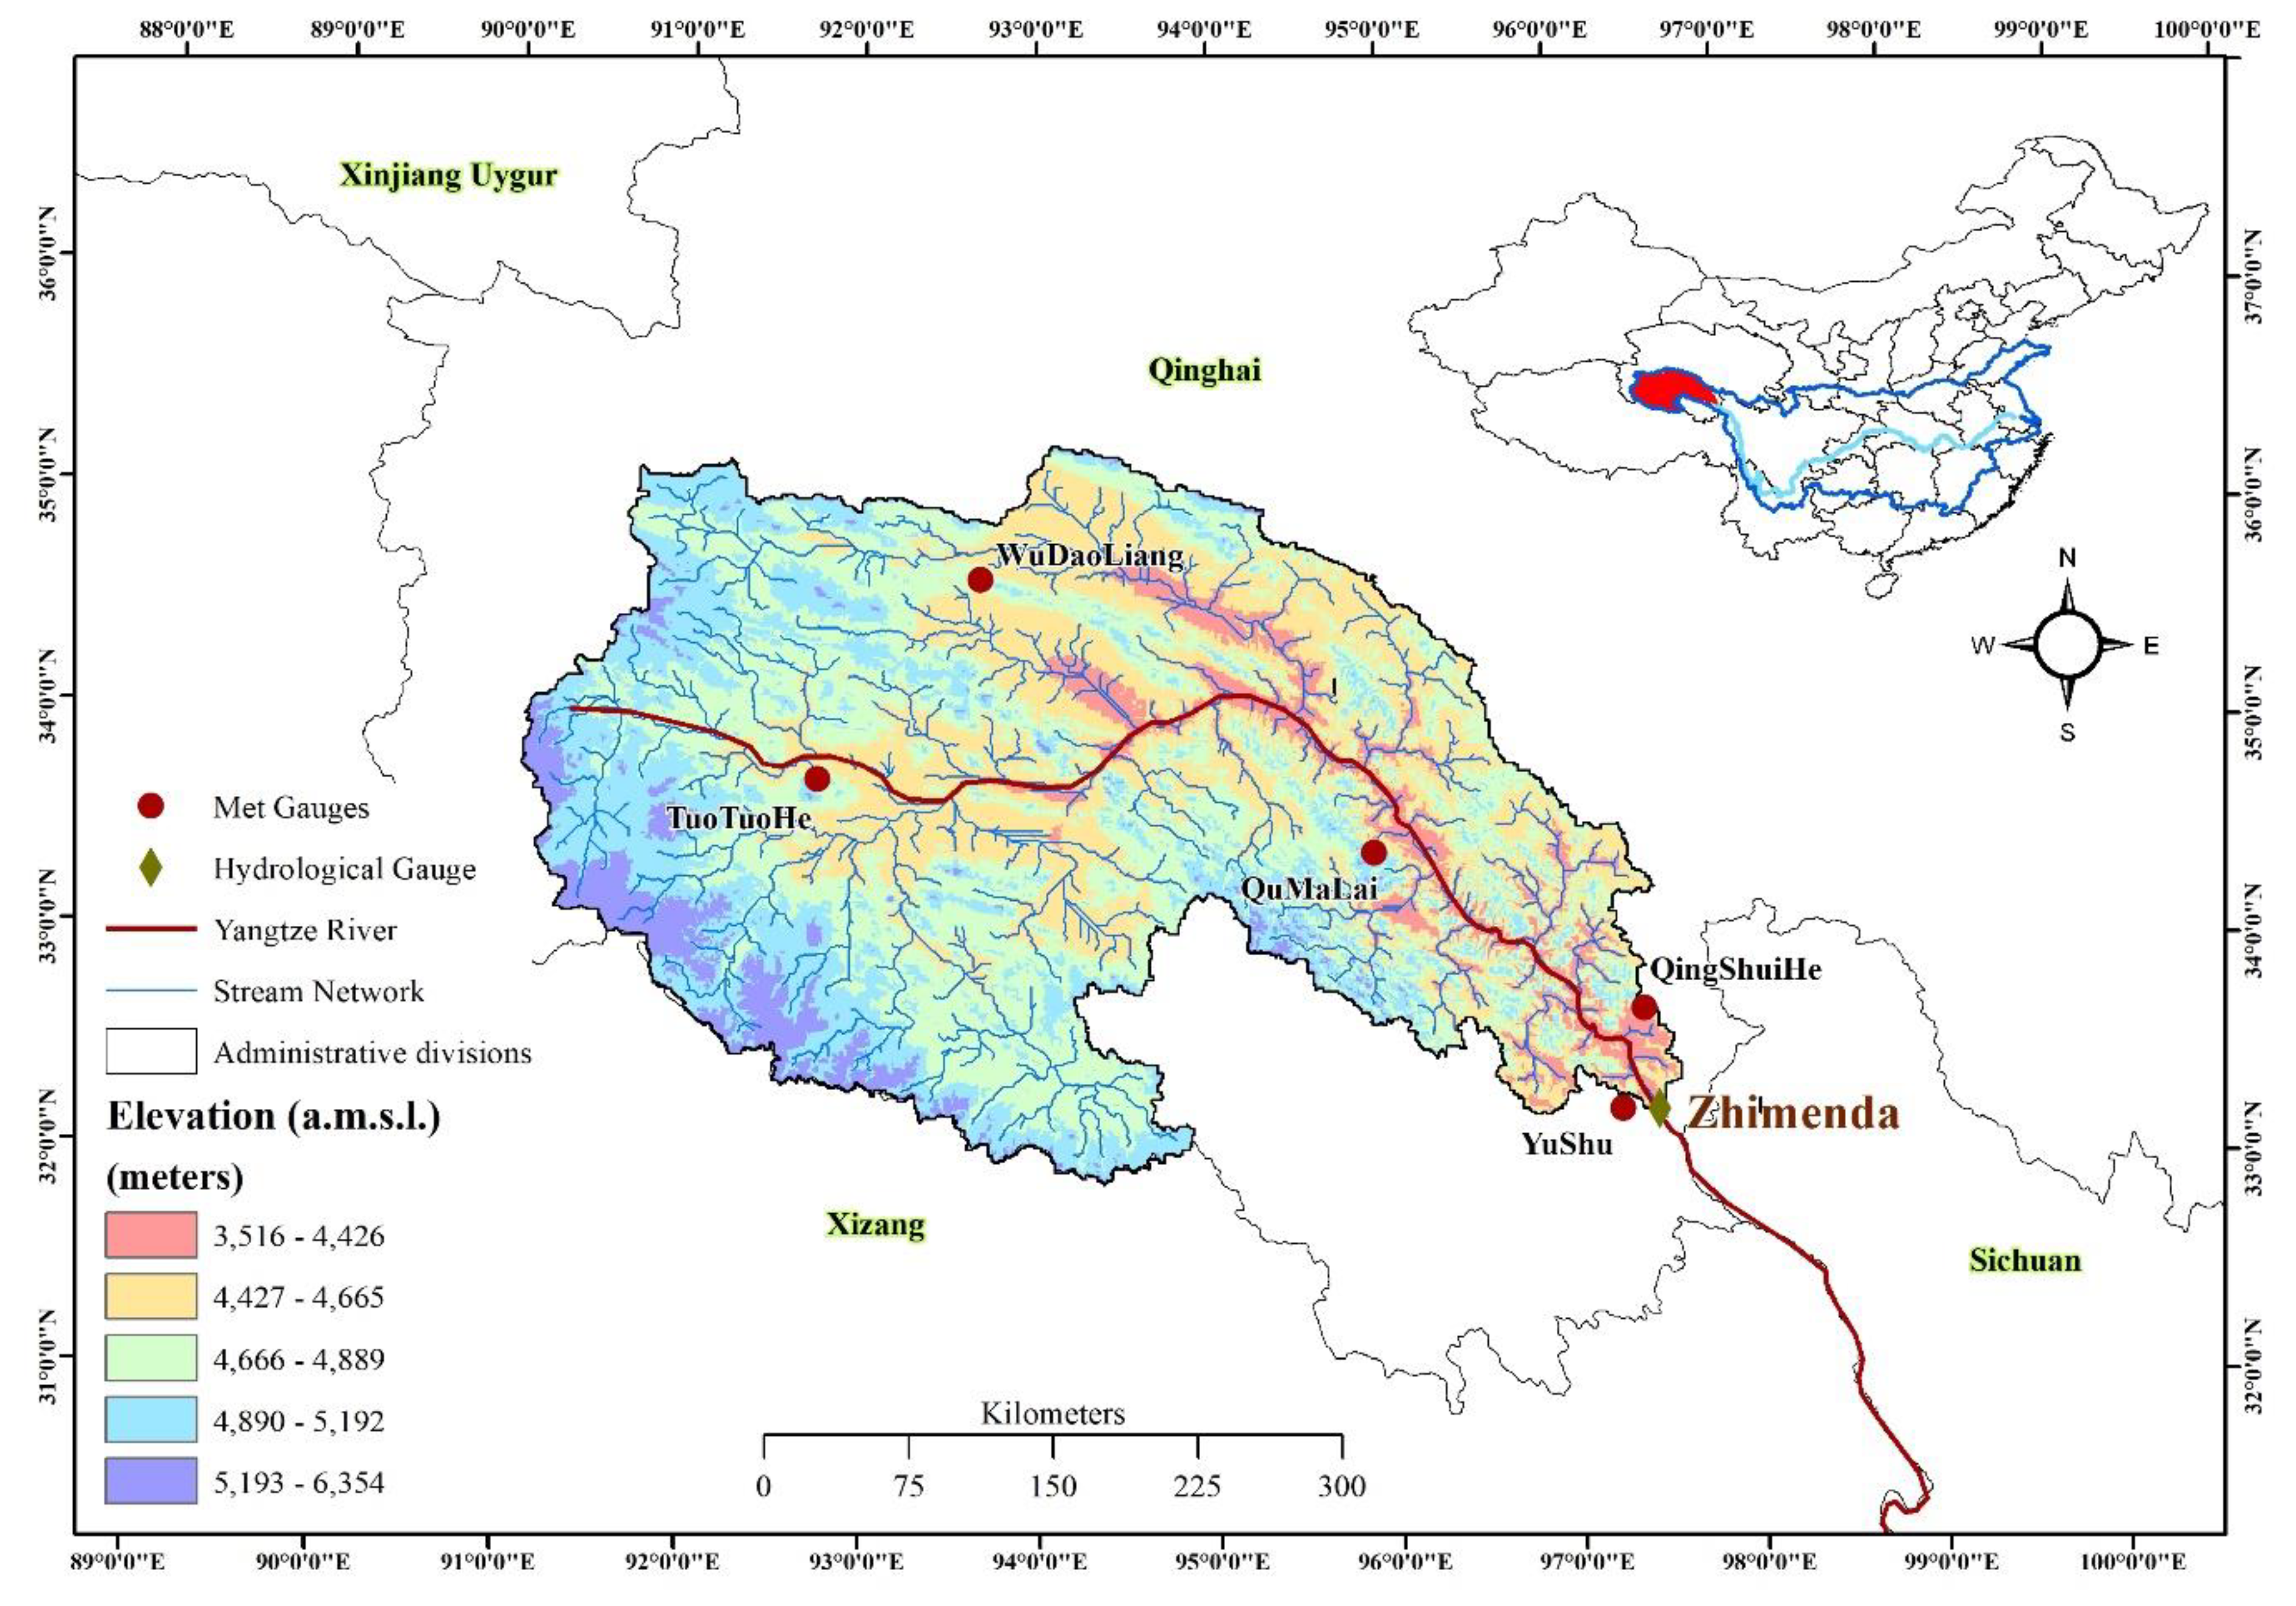
2.1. Catchment Area

The length of the Yangtze River is 6300 km making it the longest river in China and third-longest in the world. The catchment area upstream of the Zhimenda hydrological station is referred to as the Yangtze River Source Region (YRSR), located in the middle of the Qinghai-Tibetan Plateau [41]. The average elevation of YRSR is 4500 m above sea level, and it is located between longitudes 90°30′ E–97°15′ E, and latitudes 32°30′ N–35°50′ N. The YRSR catchment area is 137,000 km2, which is 7.6% of the total area of the Yangtze River Basin and it contributed 20% to the total volume of water of Yangtze River Basin. The dominant land-cover types are natural forests, glaciers, wetlands, natural lakes, and permanently and seasonally frozen grounds [42,43,44,45,46,47]. The catchment area’s climate is subtropical monsoon, and historical records showed that it has been getting warmer since 1989 due to an increase in temperature [41]. The precipitation of YRSR also increased by a rate of 1.3 mm/year [48] during 1961–2015. The Zhimenda hydrological station’s streamflow records are significantly more correlated with precipitation than temperature [48]. The YRSR with the hydro-meteorological stations used in this study is shown in Figure 1. Most of the soils in the area are Gleysols, Arenosols, Leptosols, and Cambisols. According to Zhao and Wu [49], 80% of the total area of the YaRSR is covered by permafrost, whereas the seasonally frozen ground lies on 20%.

2.2. Data Sources

The input datasets used in this study consists of a Digital Elevation Model (DEM), historic land-cover maps, soil raster map, and hydro-meteorological time series. The details of each input data are given below:
The Digital Elevation Model (DEM) was obtained from the China Archive (http://www.igsnrr.ac.cn (accessed on 2 July 2019)) having a scale of 1:250,000; The land-cover raster files for the years 1985, 1990, 1995, 2000, 2005, 2010, and 2015 were obtained from the Data Center for Resources and Environmental Sciences, Chinese Academy of Sciences (http://www.igsnrr.ac.cn (accessed on 2 July 2019)) with a scale of 1:100,000.
Raster files for soil data (having a scale of 1:1,000,000) were collected from the Food and Agriculture Organization (FAO) of the United Nations, Harmonized World Soil Database V 1.2 (HWSD), which is a 30 arc-second database (http://webarchive.iiasa.ac.at/Research/LUC/External-World-soil-database (accessed on 2 July 2019));
The monthly streamflow data of one hydrological gauging station (Zhimenda station) was acquired from the Yangtze River Authority from 1961–2016;
The daily climatic variables (precipitation, maximum temperature, minimum temperature, mean temperature, wind speed, solar radiation, and relative humidity) from 1961–2016 were collected from the China Meteorological Administration (http://data.cma.cn (accessed on 18 September 2019)).

2.3. Methodology

In summary, we adopted ITA for the assessment of trends in precipitation, temperature and streamflow time series in the YZSR and Pearson’s correlation analysis was also adopted to analyze these parameters. Moreover, the physically based semi-distributed hydrological model (Soil Water Assessment Tool) was used for the estimation of attribution of changes in streamflow to CC and LCC in YRSR during the entire study period. The details of these methods are described in subsequent sections.

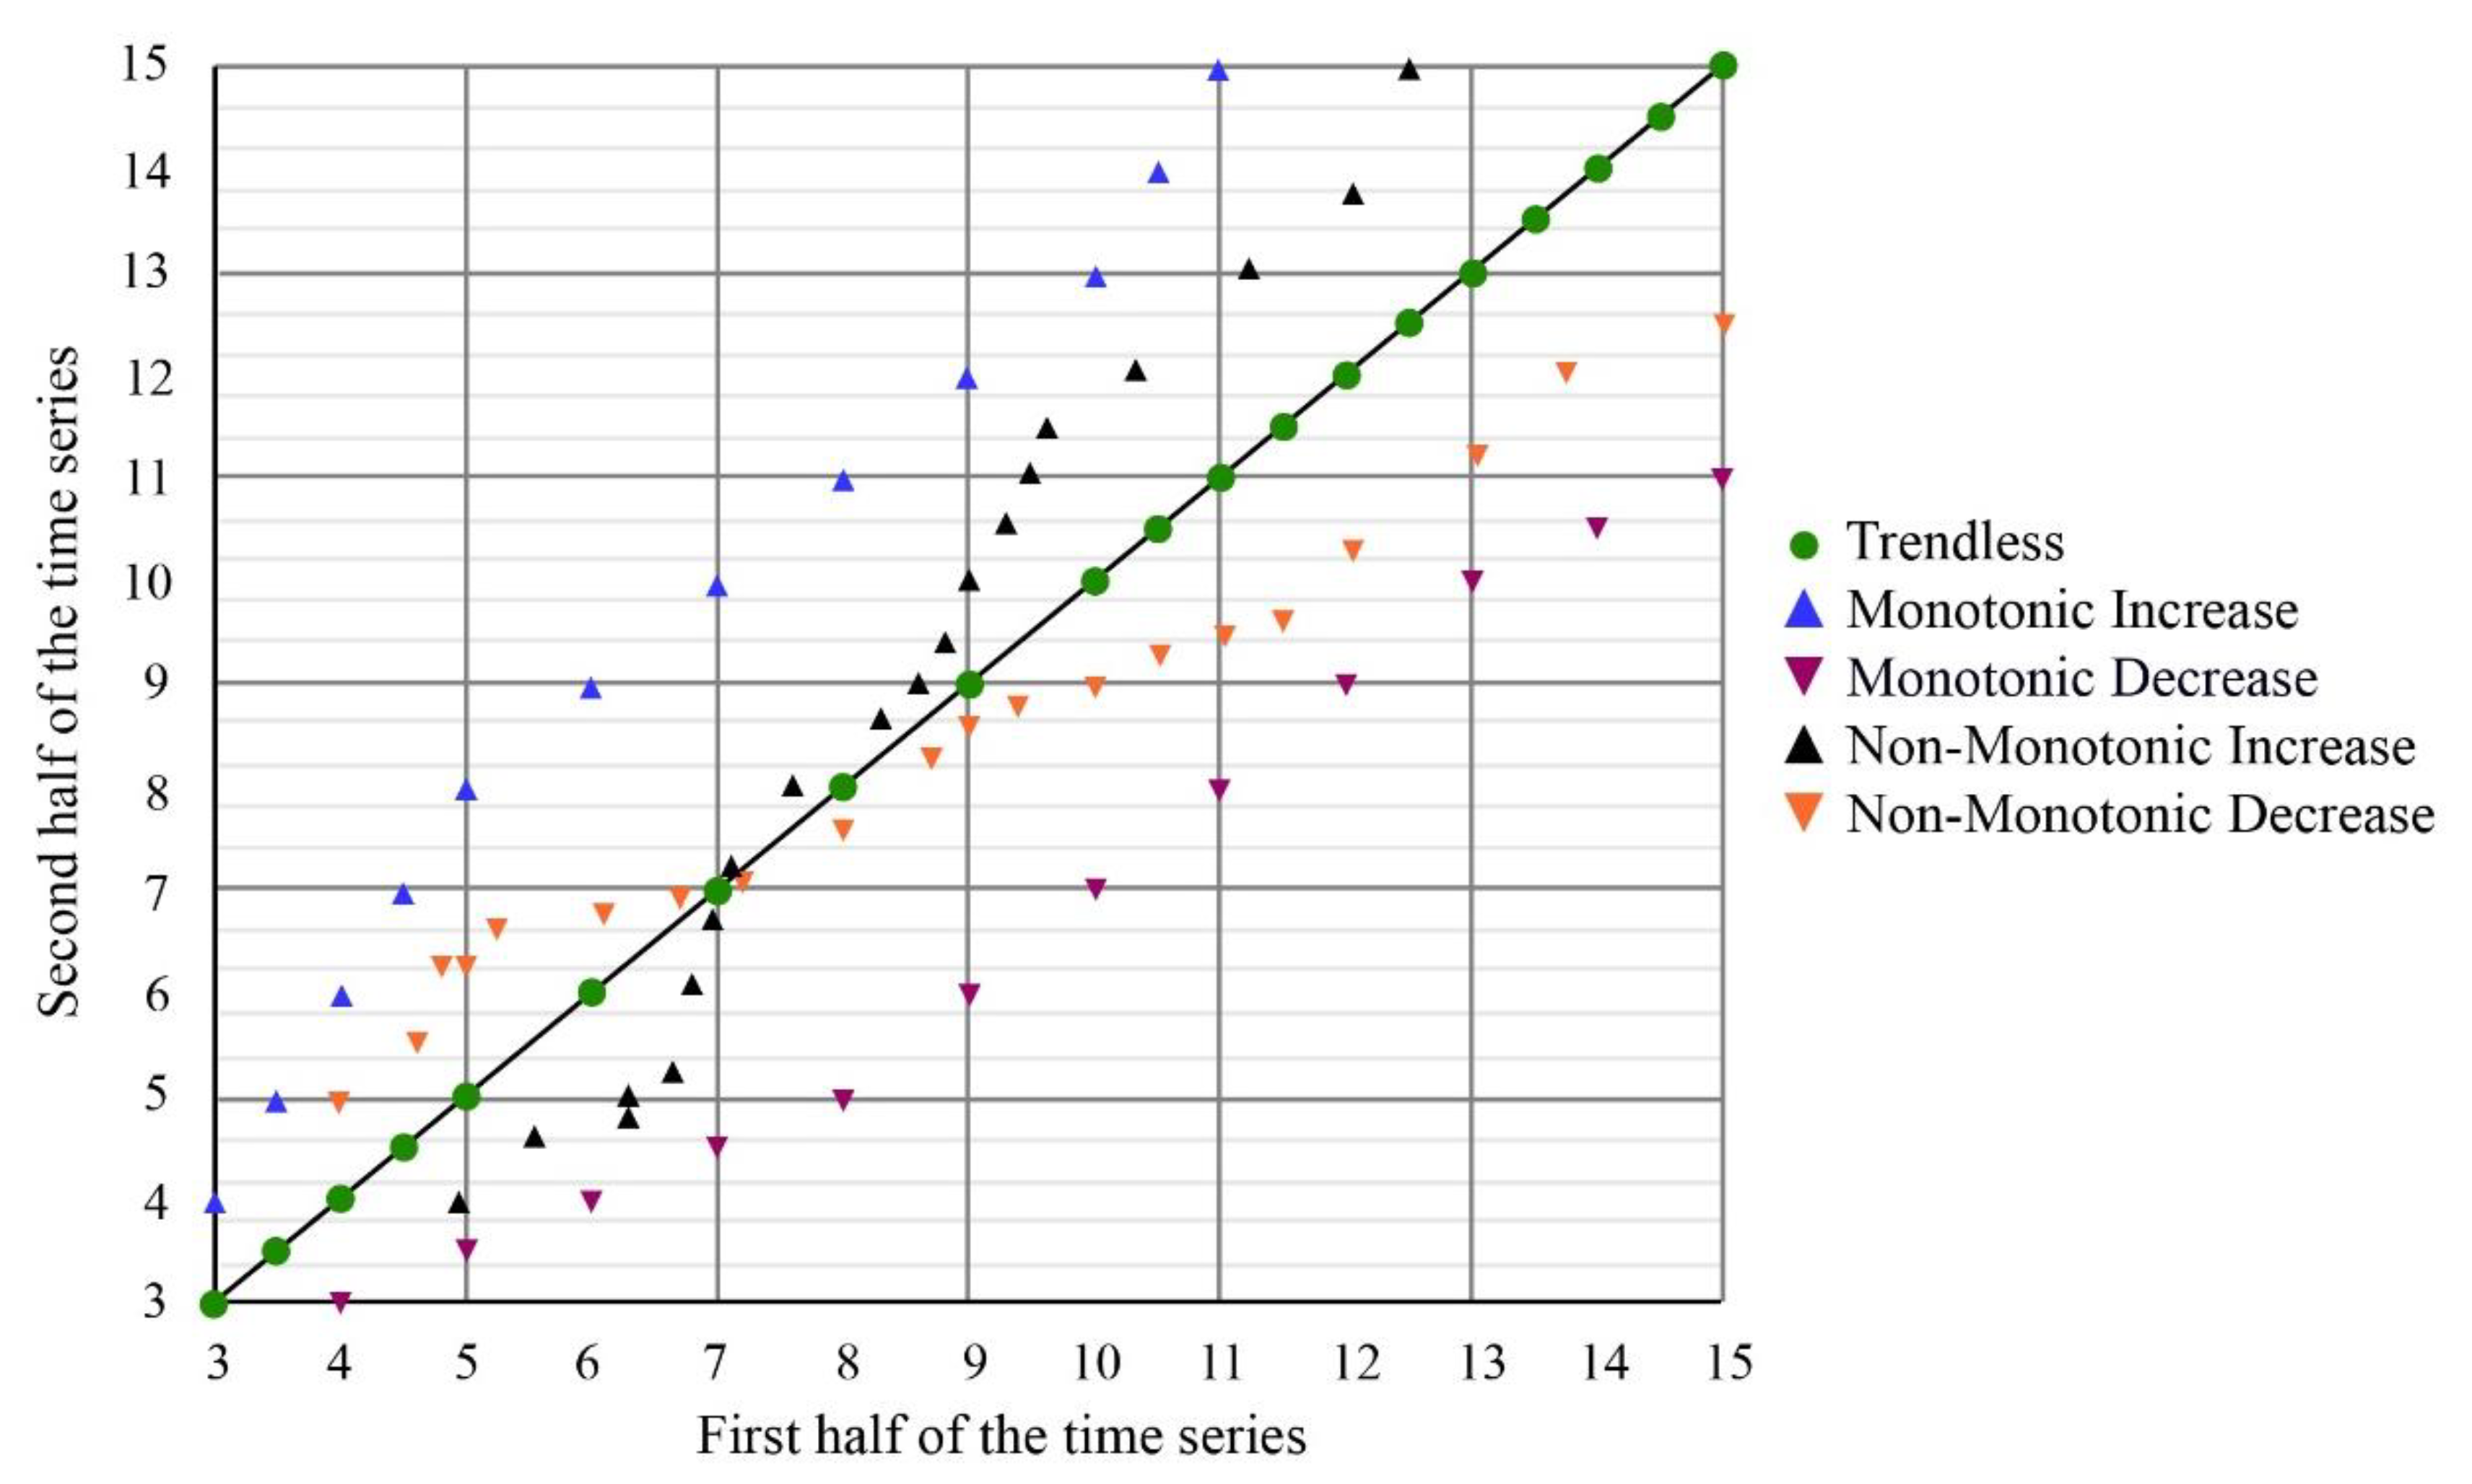
2.4. Innovative Trend Analysis

ITA was introduced by Sen [50] and has been increasingly applied and gaining attention across the world [51,52,53,54,55]. The ITA is simple to apply and a new form of trend analysis compared to traditional Mann–Kendall trend analysis [56]. A hydrological or meteorological time series is divided into two equal periods and arranged in ascending order. The x-axis contains the first half of the time series (xi), whereas the second half of the time series (yi) is located on the y-axis on a cartesian coordinate system. If the data points are located on the 1:1 line, there is no trend in the time series, whereas the upper (lower) region indicates increasing (decreasing) trends as presented in Figure 2. The ITA is a non-holistic [51,54,57,58] and sophisticated compared to traditional Mann–Kendall and linear regression. The ITA method has already been used in different regions and river basins of China [53,54,55,59,60,61].

2.5. Soil Water Assessment Tool (SWAT)

The Soil and Water Assessment Tool (SWAT) was developed by Arnold and Fohrer [62]. It is a semi-distributed hydrological model with the capability to simulate from daily to monthly and annual scales. The SWAT has been widely used for large and complex river basins across the world [32,34,63,64,65,66,67]. The SWAT model divides a basin into small units known as sub-basins, and these sub-basins are further divided into hydrological response units (HRUs). An HRU is a homogeneous lumped area that combines a unique slope, soil, and land cover for which the water balance is simulated [68]. The SWAT is a conceptual model based on the water balance approach, and its details are provided in Abbaspour, et al. [69,70]. The SWAT-2012 version combined with Arc-GIS 10.5 was used for streamflow simulation in the Yangtze River Source Region (YRSR).

2.6. SWAT Calibration

The purpose of calibration is to develop a robust SWAT model for the identification of CC and LCC impacts on streamflow. The Sequential Uncertainty Fitting version 2 (SUFI-2) provided in SWAT-CUP version 2019 was used to identify sensitive parameters for calibration. The calibration guidelines provided in Abbaspour, et al. [71] were adopted. The monthly simulated streamflow was compared with the observed monthly streamflow at the Zhimenda hydrological station in YRSR. For calibration, the model was run for nine iterations with 1000 simulations for each iteration in order to obtain an acceptable value of the objective function. The Nash-Sutcliffe efficiency (NSE) coefficient was used as an objective function, and we stopped the calibration when NSE > 0.80, because according to Moriasi et al. [72] this value indicates a good model performance.
NSE = 1 i = 1 N [ Q obs , i Q sim , i ] 2 i = 1 N [ Q obs , i Q ¯ obs ] 2
where Q mean , Q obs , i and Q sim , i are the mean observed streamflow, observed streamflow, and simulated streamflow, respectively, for any “i” time step while “N” is the total number of time steps. The calibration period was 1961–1989, including three years as a model spin-up period (1961–1963), whereas the validation period was 1990–2016.

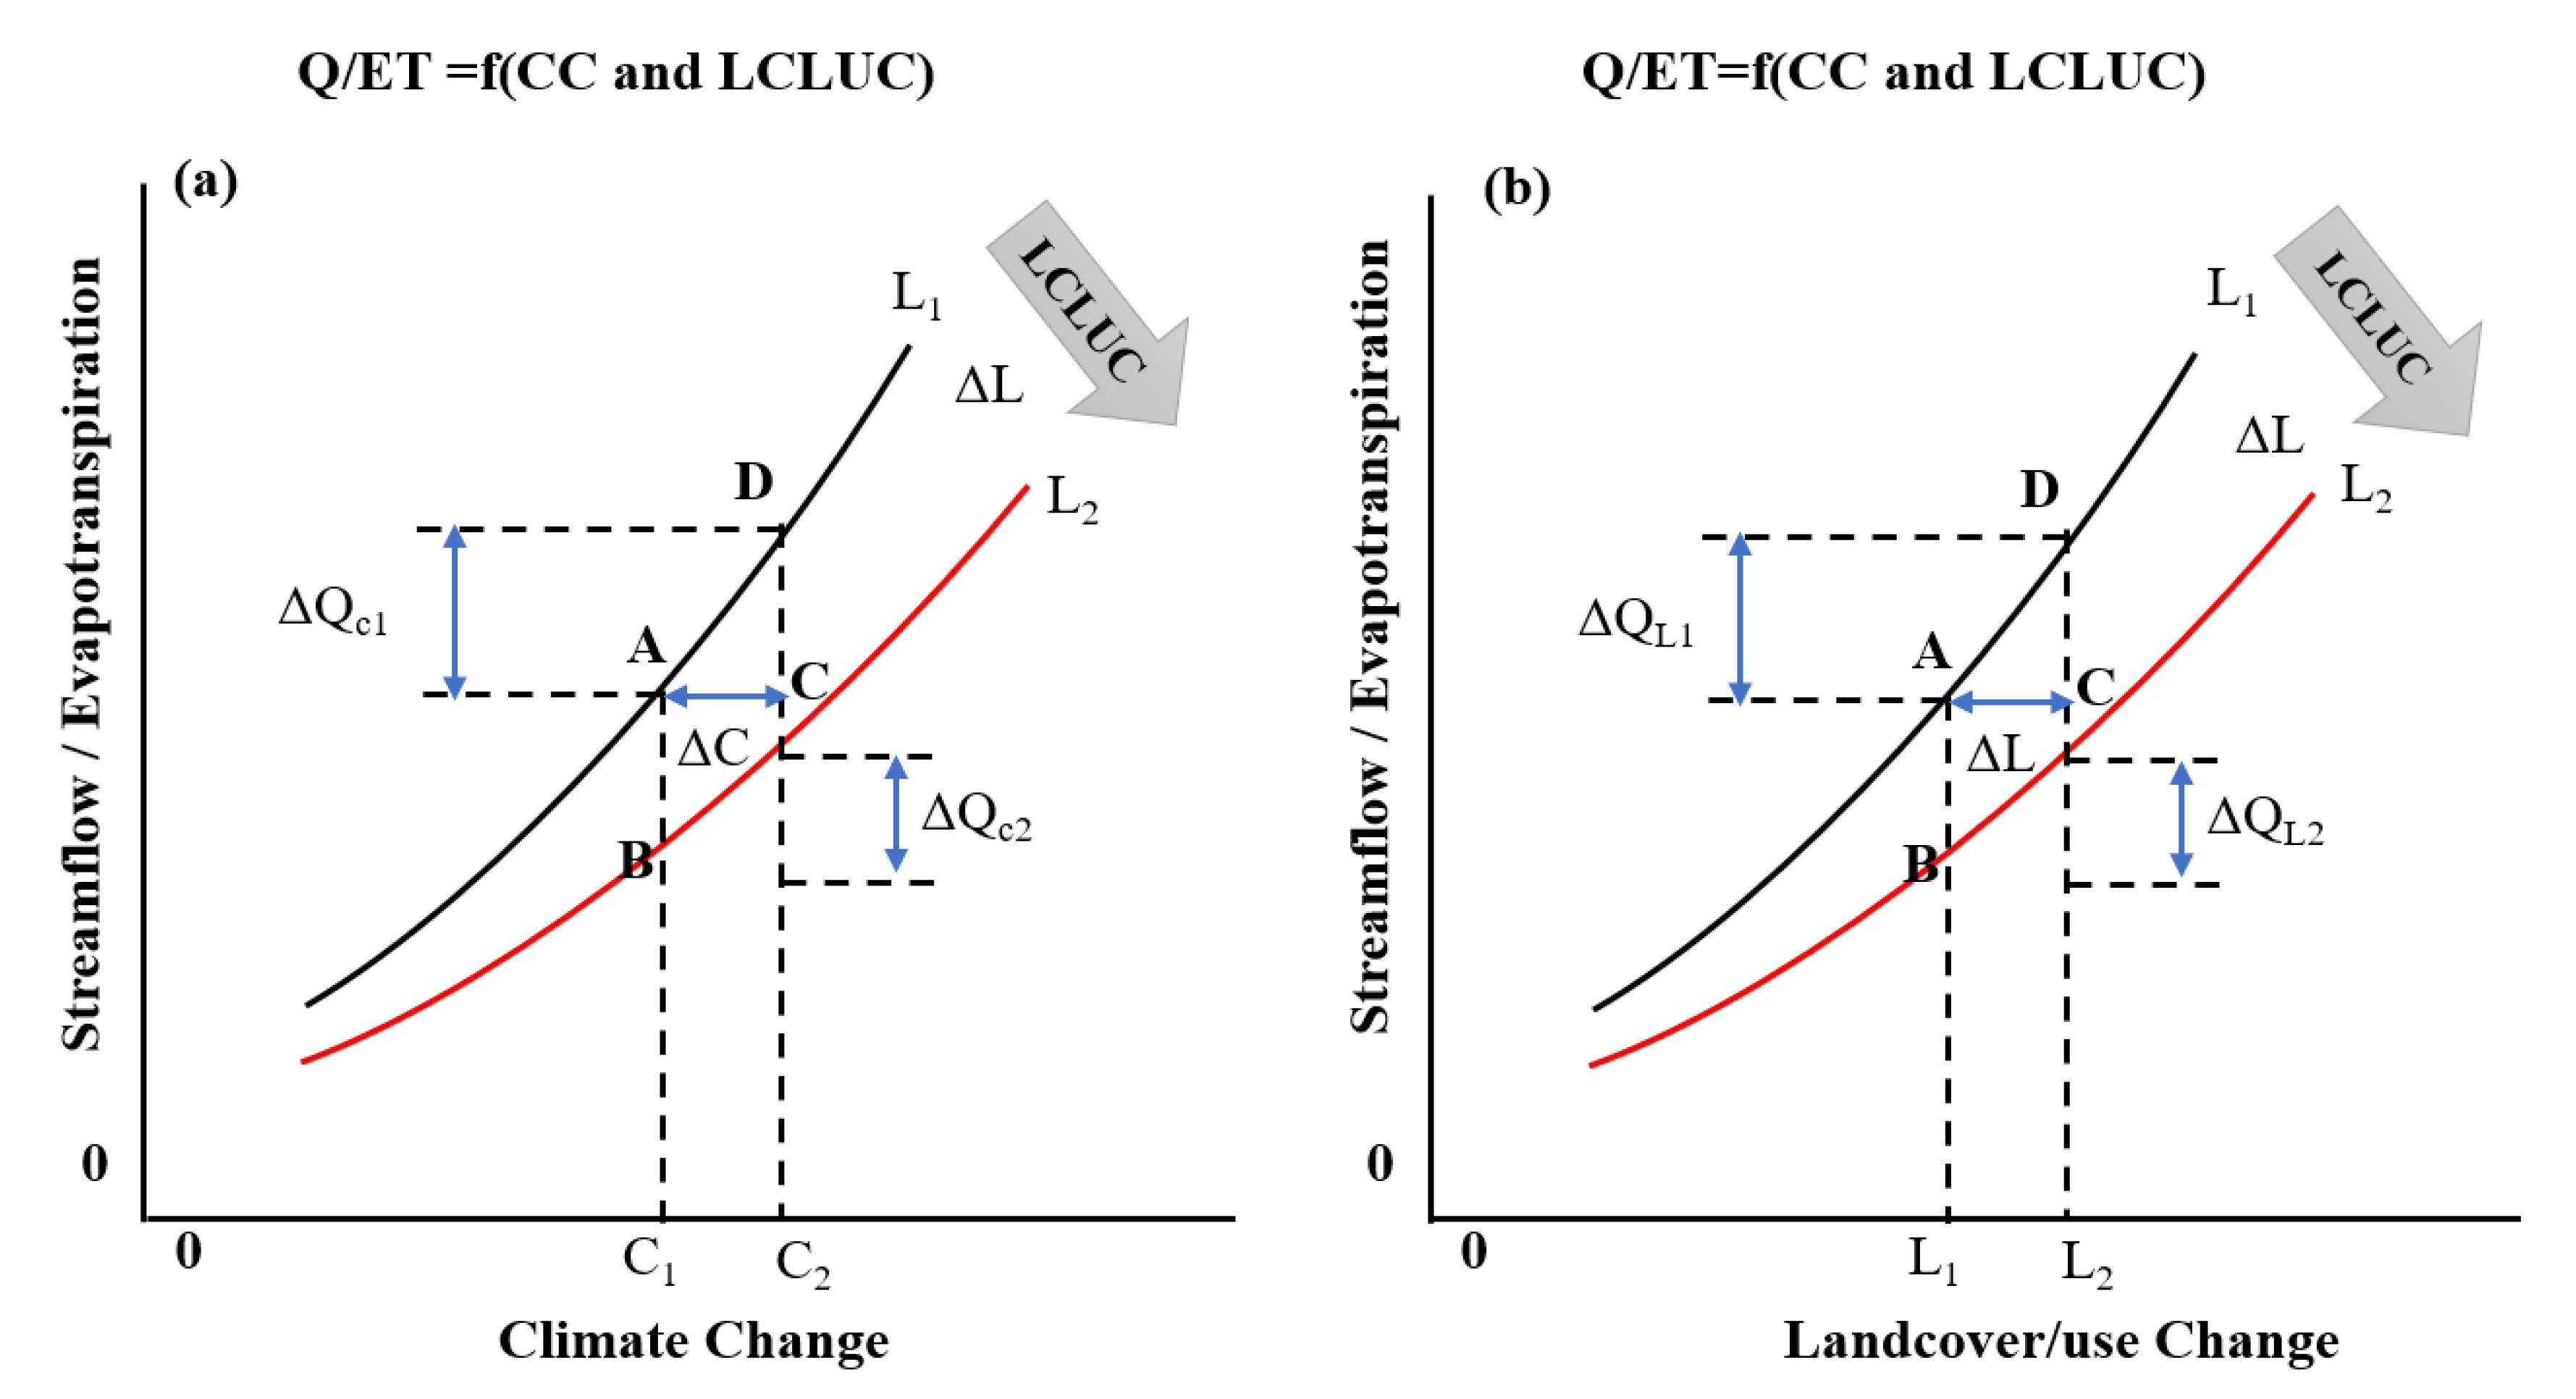
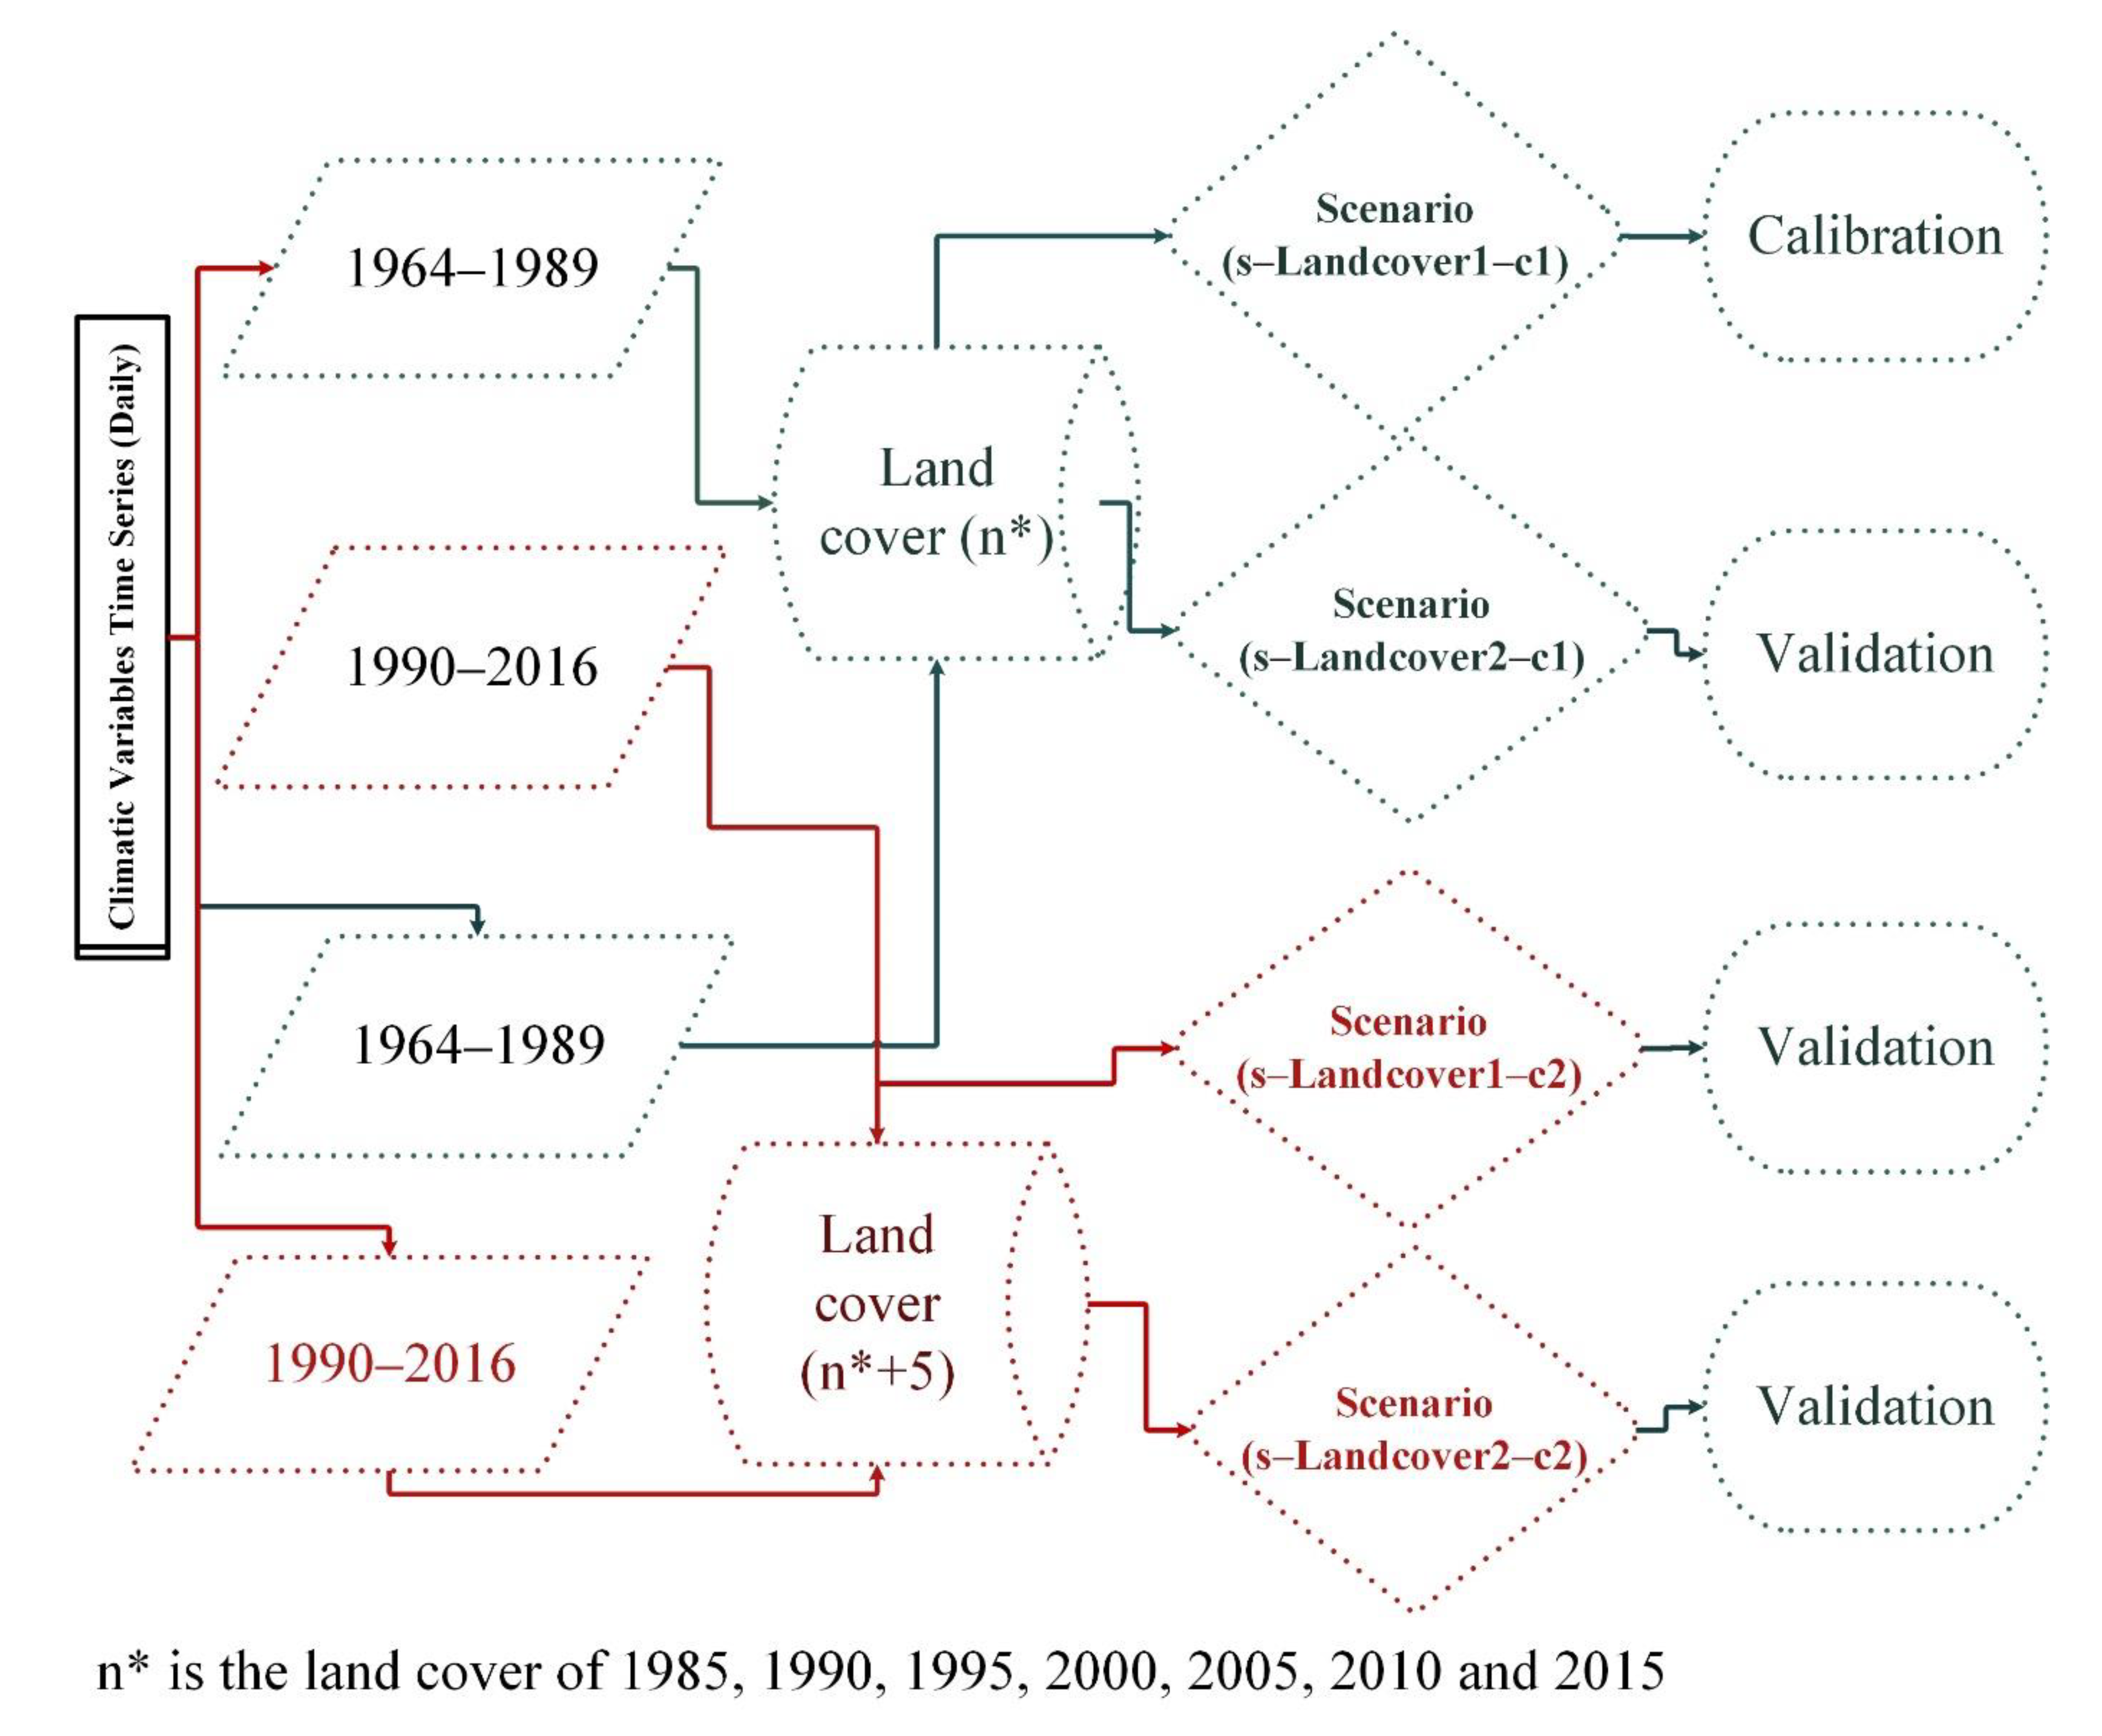
2.7. Attribution of Changes in Streamflow

The quantitative impact of CC and LCC on streamflow should be carried out with an appropriate method [14,73]. The SWAT model simulation results were used for the attribution of changes in streamflow with the statistical technique adopted by Yang et al. [74]. Figure 3 shows the statistical technique used to quantify the contribution of each factor (i.e., climate change and land-cover change) to streamflow changes. The climate time series from 1964–2016 was divided into periods (i.e., 1964–1989 and 1990–2016), whereas land cover of 1985–1990, 1990–1995, 1995–2000, 2000–2005, 2005–2010, and 2010–2015 was used for each climate period (i.e., 1964–1989 and 1990–2016). Thus, two consecutive years’ land-cover maps with two climatic periods produced four scenarios; therefore, six pairs of land-cover maps produced 24 SWAT model simulation scenarios (see Table 1).
Q C = 1 2 ( Q C 1 + Q C 2 ) = 1 2 ( Q C 2 L 1 Q C 1 L 1 ) + ( Q C 2 L 2 Q C 1 L 2 )
Q L = 1 2 ( Q L 1 + Q L 2 ) = 1 2 ( Q C 1 L 2 Q C 1 L 1 ) + ( Q C 2 L 2 Q C 2 L 1 )
Q = Q L + Q C = Q C 2 L 2 Q C 1 L 1
The attribution of changes in streamflow for each SWAT simulated scenario is determined using Equations (2) and (3). ΔQC1 is the result of land cover 1 (L1) SWAT simulations, whereas ΔQC2 is the result of land cover 2 (L2) SWAT simulations, and ΔQC is the quantification of streamflow impacted by climate change as given in Equation (2). The impact of land-cover change was quantified by using Equation (3), ΔQL is the streamflow impacted by land-cover change, while ΔQL1 and ΔQL2 represent the land cover 1 (L1) and land cover 2 (L2) scenarios. Equation (4) quantifies the total change in streamflow. For example, in the first pair of land covers (1985–1990), the land cover of 1985 is L1 and 1990 is L2, while the climate time series from 1964–1989 is C1 and from 1990–2016 it is C2. This model was used for the quantification of changes in streamflow in each scenario, as shown in Table 1. The SWAT model was calibrated from 1964–1989 (three years from 1961–1963 used for model spin-up period) and validated from 1990–2016 for each land cover of 1985, 1990, 1995, 2000, 2005, 2010 and 2015.
Figure 4 describes the sequence of SWAT Model simulations for identification of attribution of changes in streamflow due to climate change and land-cover change. The climate data from 1964–1989 and land cover of 1985 was used to develop the Scenario-I (i.e., s-1985-(1964–1989) and this model was calibrated using SWAT-CUP SUFI2 algorithms. This calibrated model was validated for the other three scenarios as illustrated in Figure 4. A similar strategy was adopted for all sets of climate and land-cover data sets in this study.

3. Results and Discussion

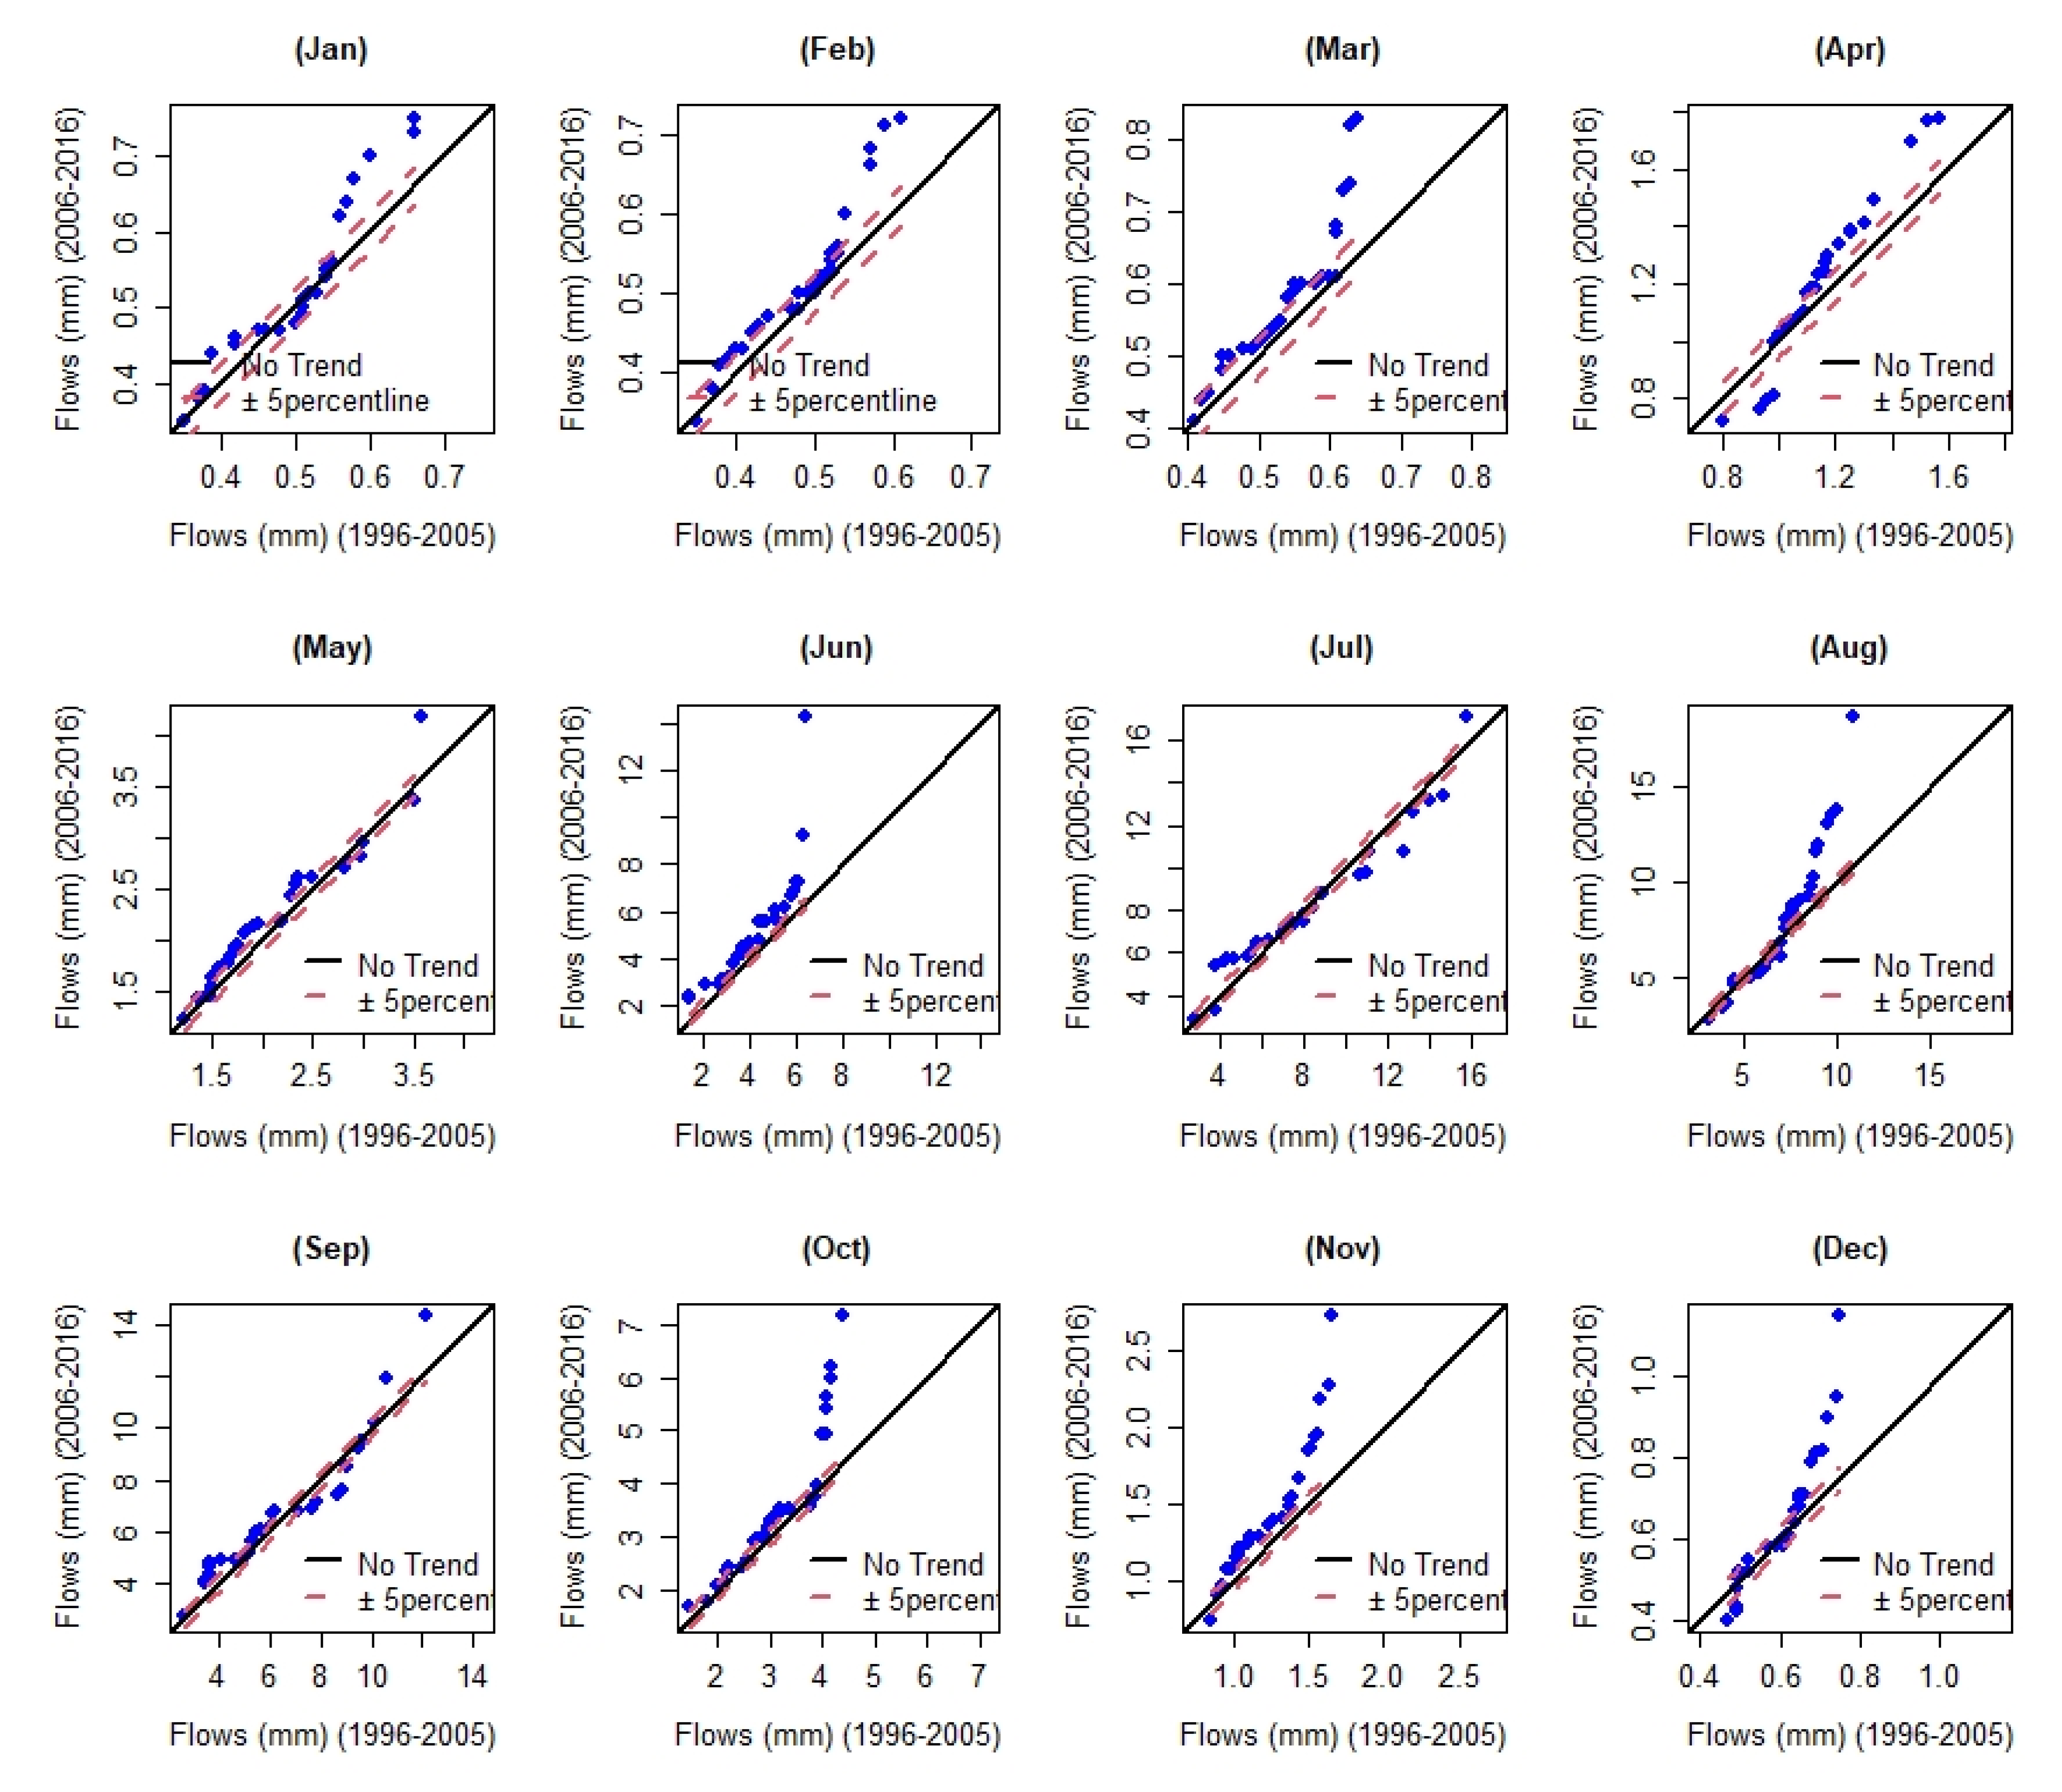
3.1. Innovative Trend Analysis

Temperature, precipitation and streamflow are the essential hydrological variables [48,75,76] and their variations in any river basin can be analyzed on an annual and monthly scale using ITA. The ITA results for annual time series of temperature, precipitation, and streamflow are presented in Figure 5. The results show that the mean temperature is increasing monotonically in the second half of the time series (1990–2016) as compared to the first half of the time series (1961–1989). The magnitude of this rising trend is 0.4 °C/decade (Table 2). Ahmed, Wang, Booij, Oluwafemi, Hashmi, Ali and Munir [48] concluded that the temperature is increasing with a rate of 0.3 °C/decade using linear regression as well as the Modified Mann-Kendall trend test. The precipitation is also monotonically increasing in the second half (1990–2016) as compared to the first half (1961–1989) in the YRSR, with a value of 10.6 mm/decade (Table 2). However, traditional linear regression methods and the modified Mann–Kendall trend test showed an increase in precipitation with a magnitude of 13 mm/decade and 3.4 mm/decade, respectively [48]. The streamflow time series also shows an increasing magnitude of 0.23 mm/decade in the second half of the time series (1990–2016) compared to the first half (1961–1989).
The monthly results of the ITA test are presented in Table 2. Increasing trends are observed for the mean temperature during all months except April to June, which show no trends (see also Figure 6). However, higher slopes are found for December, followed by November and January (Table 2). This shows that the climate of the YRSR is getting warmer, particularly in the winter months, as reported by Ahmed, Wang, Oluwafemi, Munir, Hu, Shakoor and Imran [41]. Ahmed, Wang, Oluwafemi, Munir, Hu, Shakoor and Imran [41] determined mean temperature trends and concluded that the trends were positive after 1989, which agrees with our findings using the ITA method.
Figure 7 graphically illustrates the trends of monthly precipitation time series using the ITA method. There is a monotonically increasing trend from January to March and May–June, whereas the rest of the months show non-monotonically increasing/decreasing trends and trendless behavior. A larger positive trend was found for June (4.1 mm per decade) followed by May (2.4 mm per decade) as shown in Table 2.
The ITA results for streamflow are visualized in Figure 8, which shows that only for July streamflow is non-monotonically decreasing; while for the other months it is increasing with different slopes. During April, August and December, the increasing trend was non-monotonical, however the highest increasing trends were observed in June and August with a slope of 0.38 mm/decade and 0.35 mm/decade, respectively.

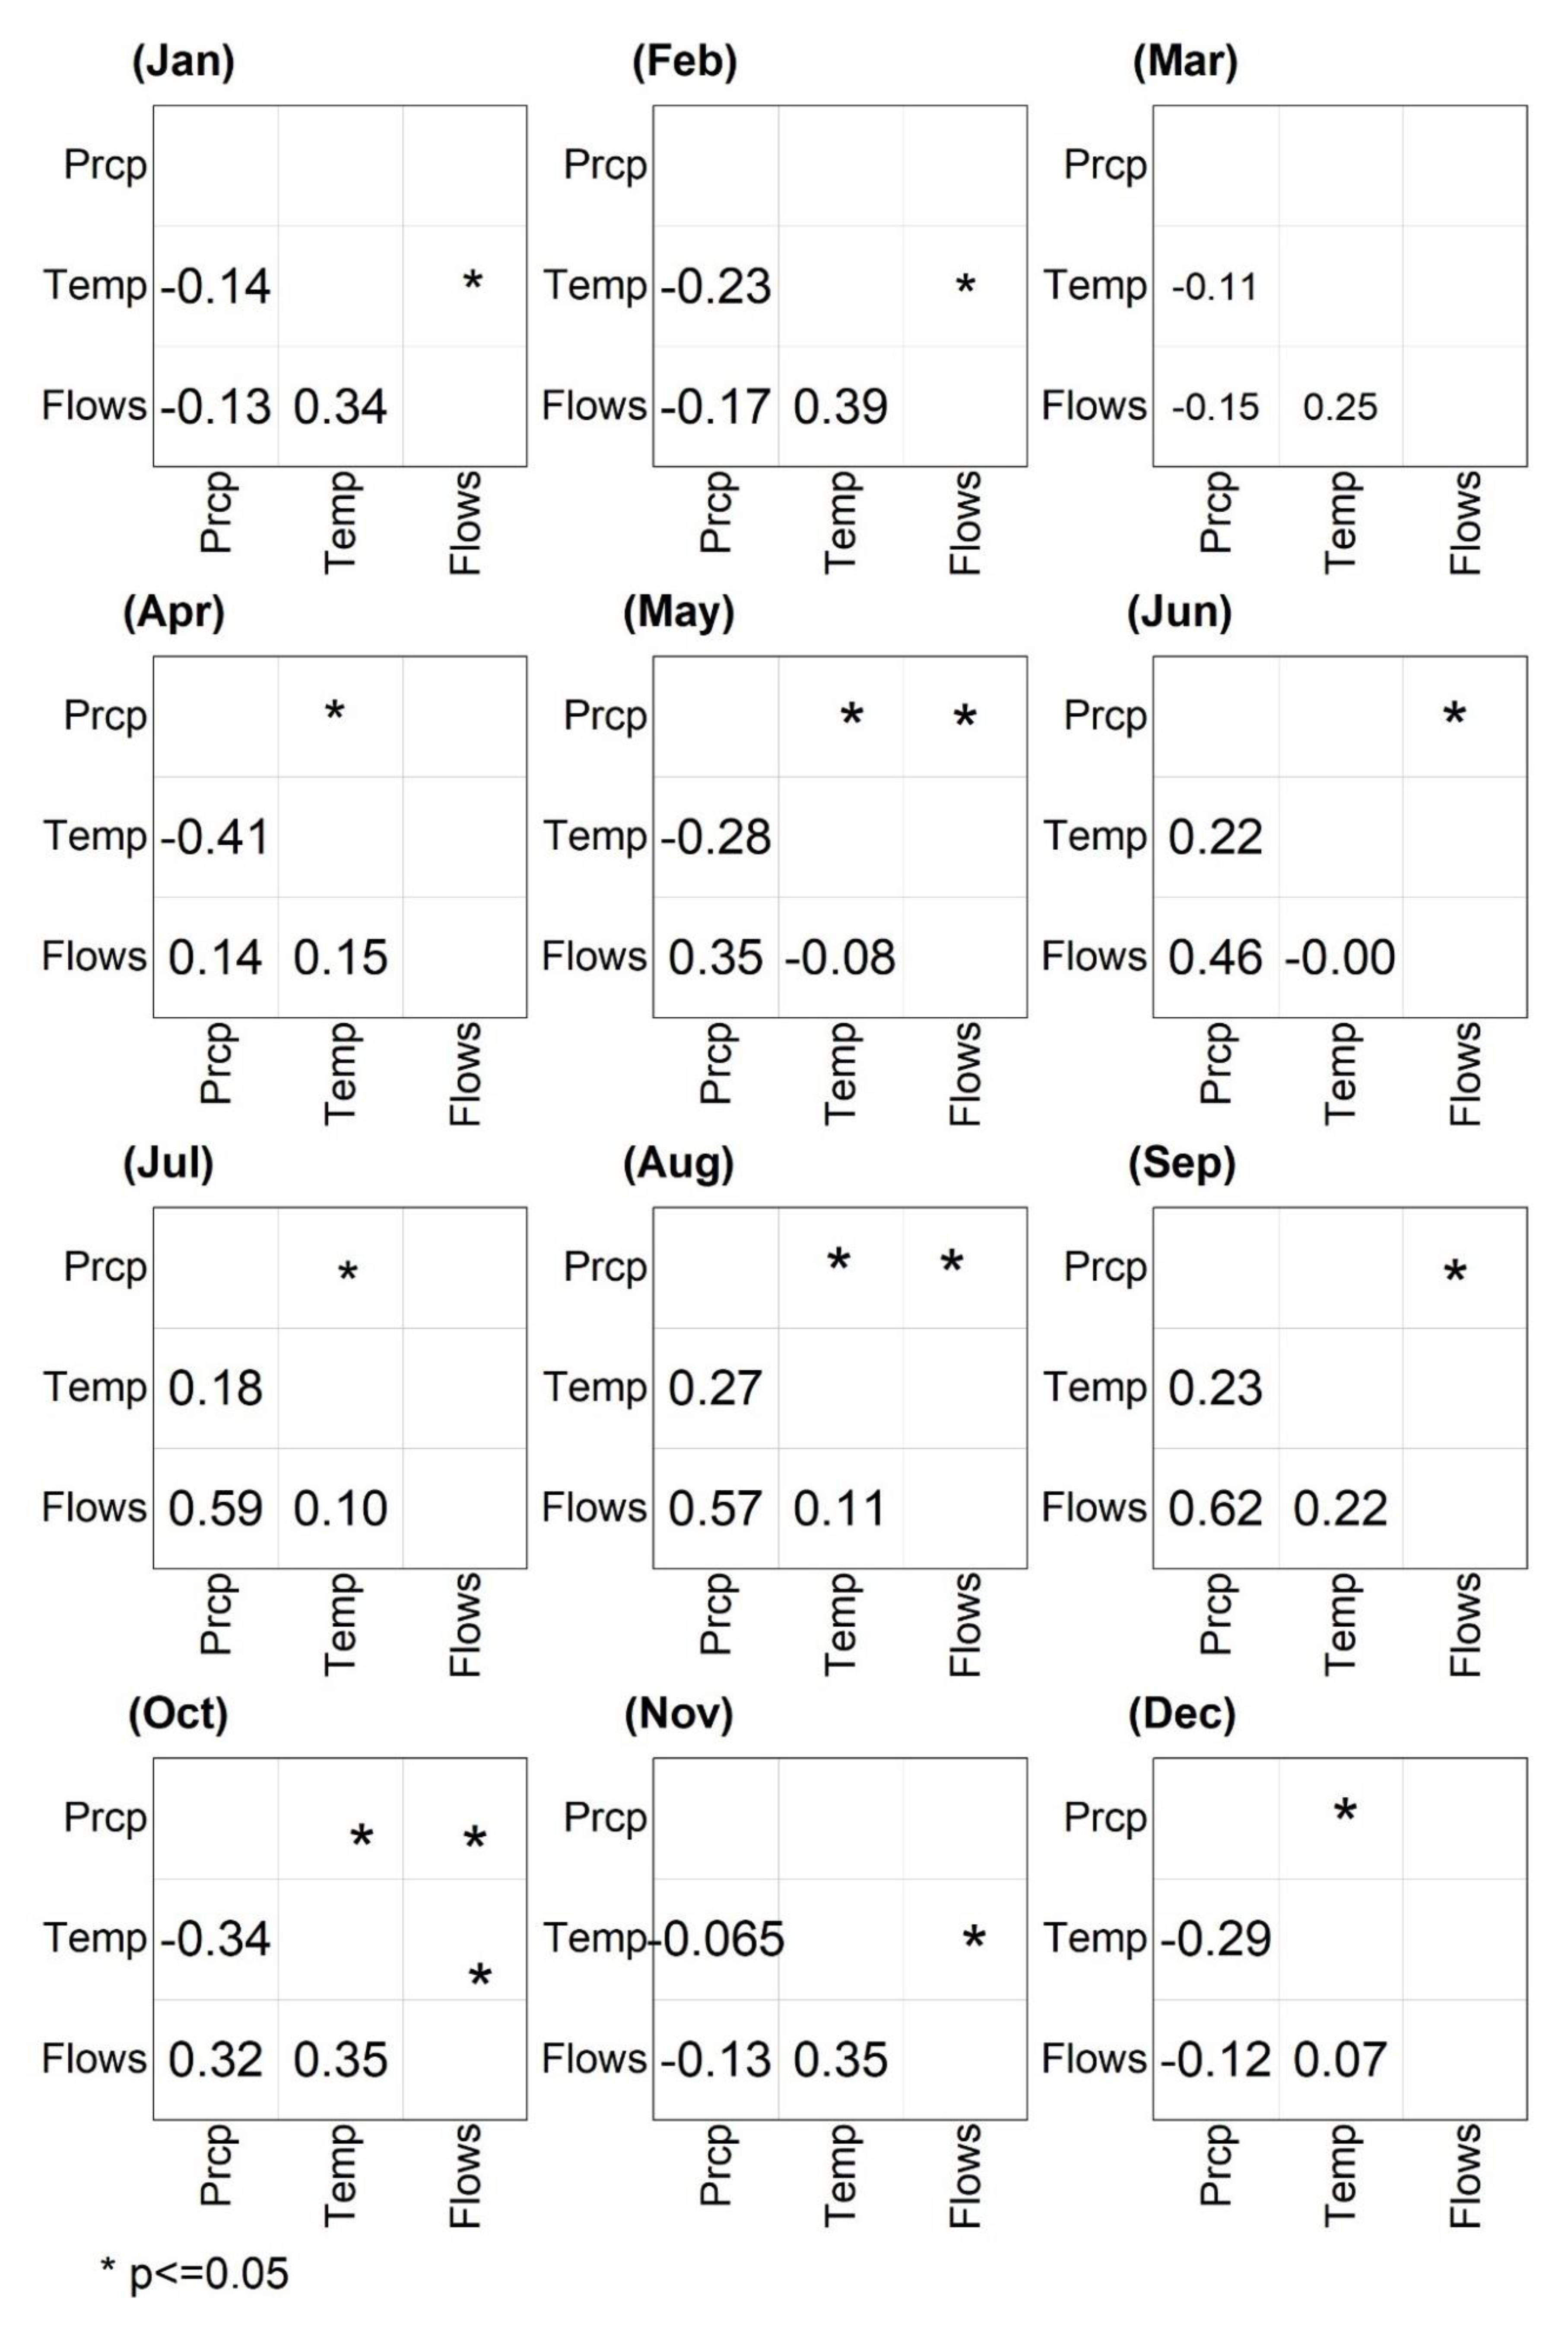
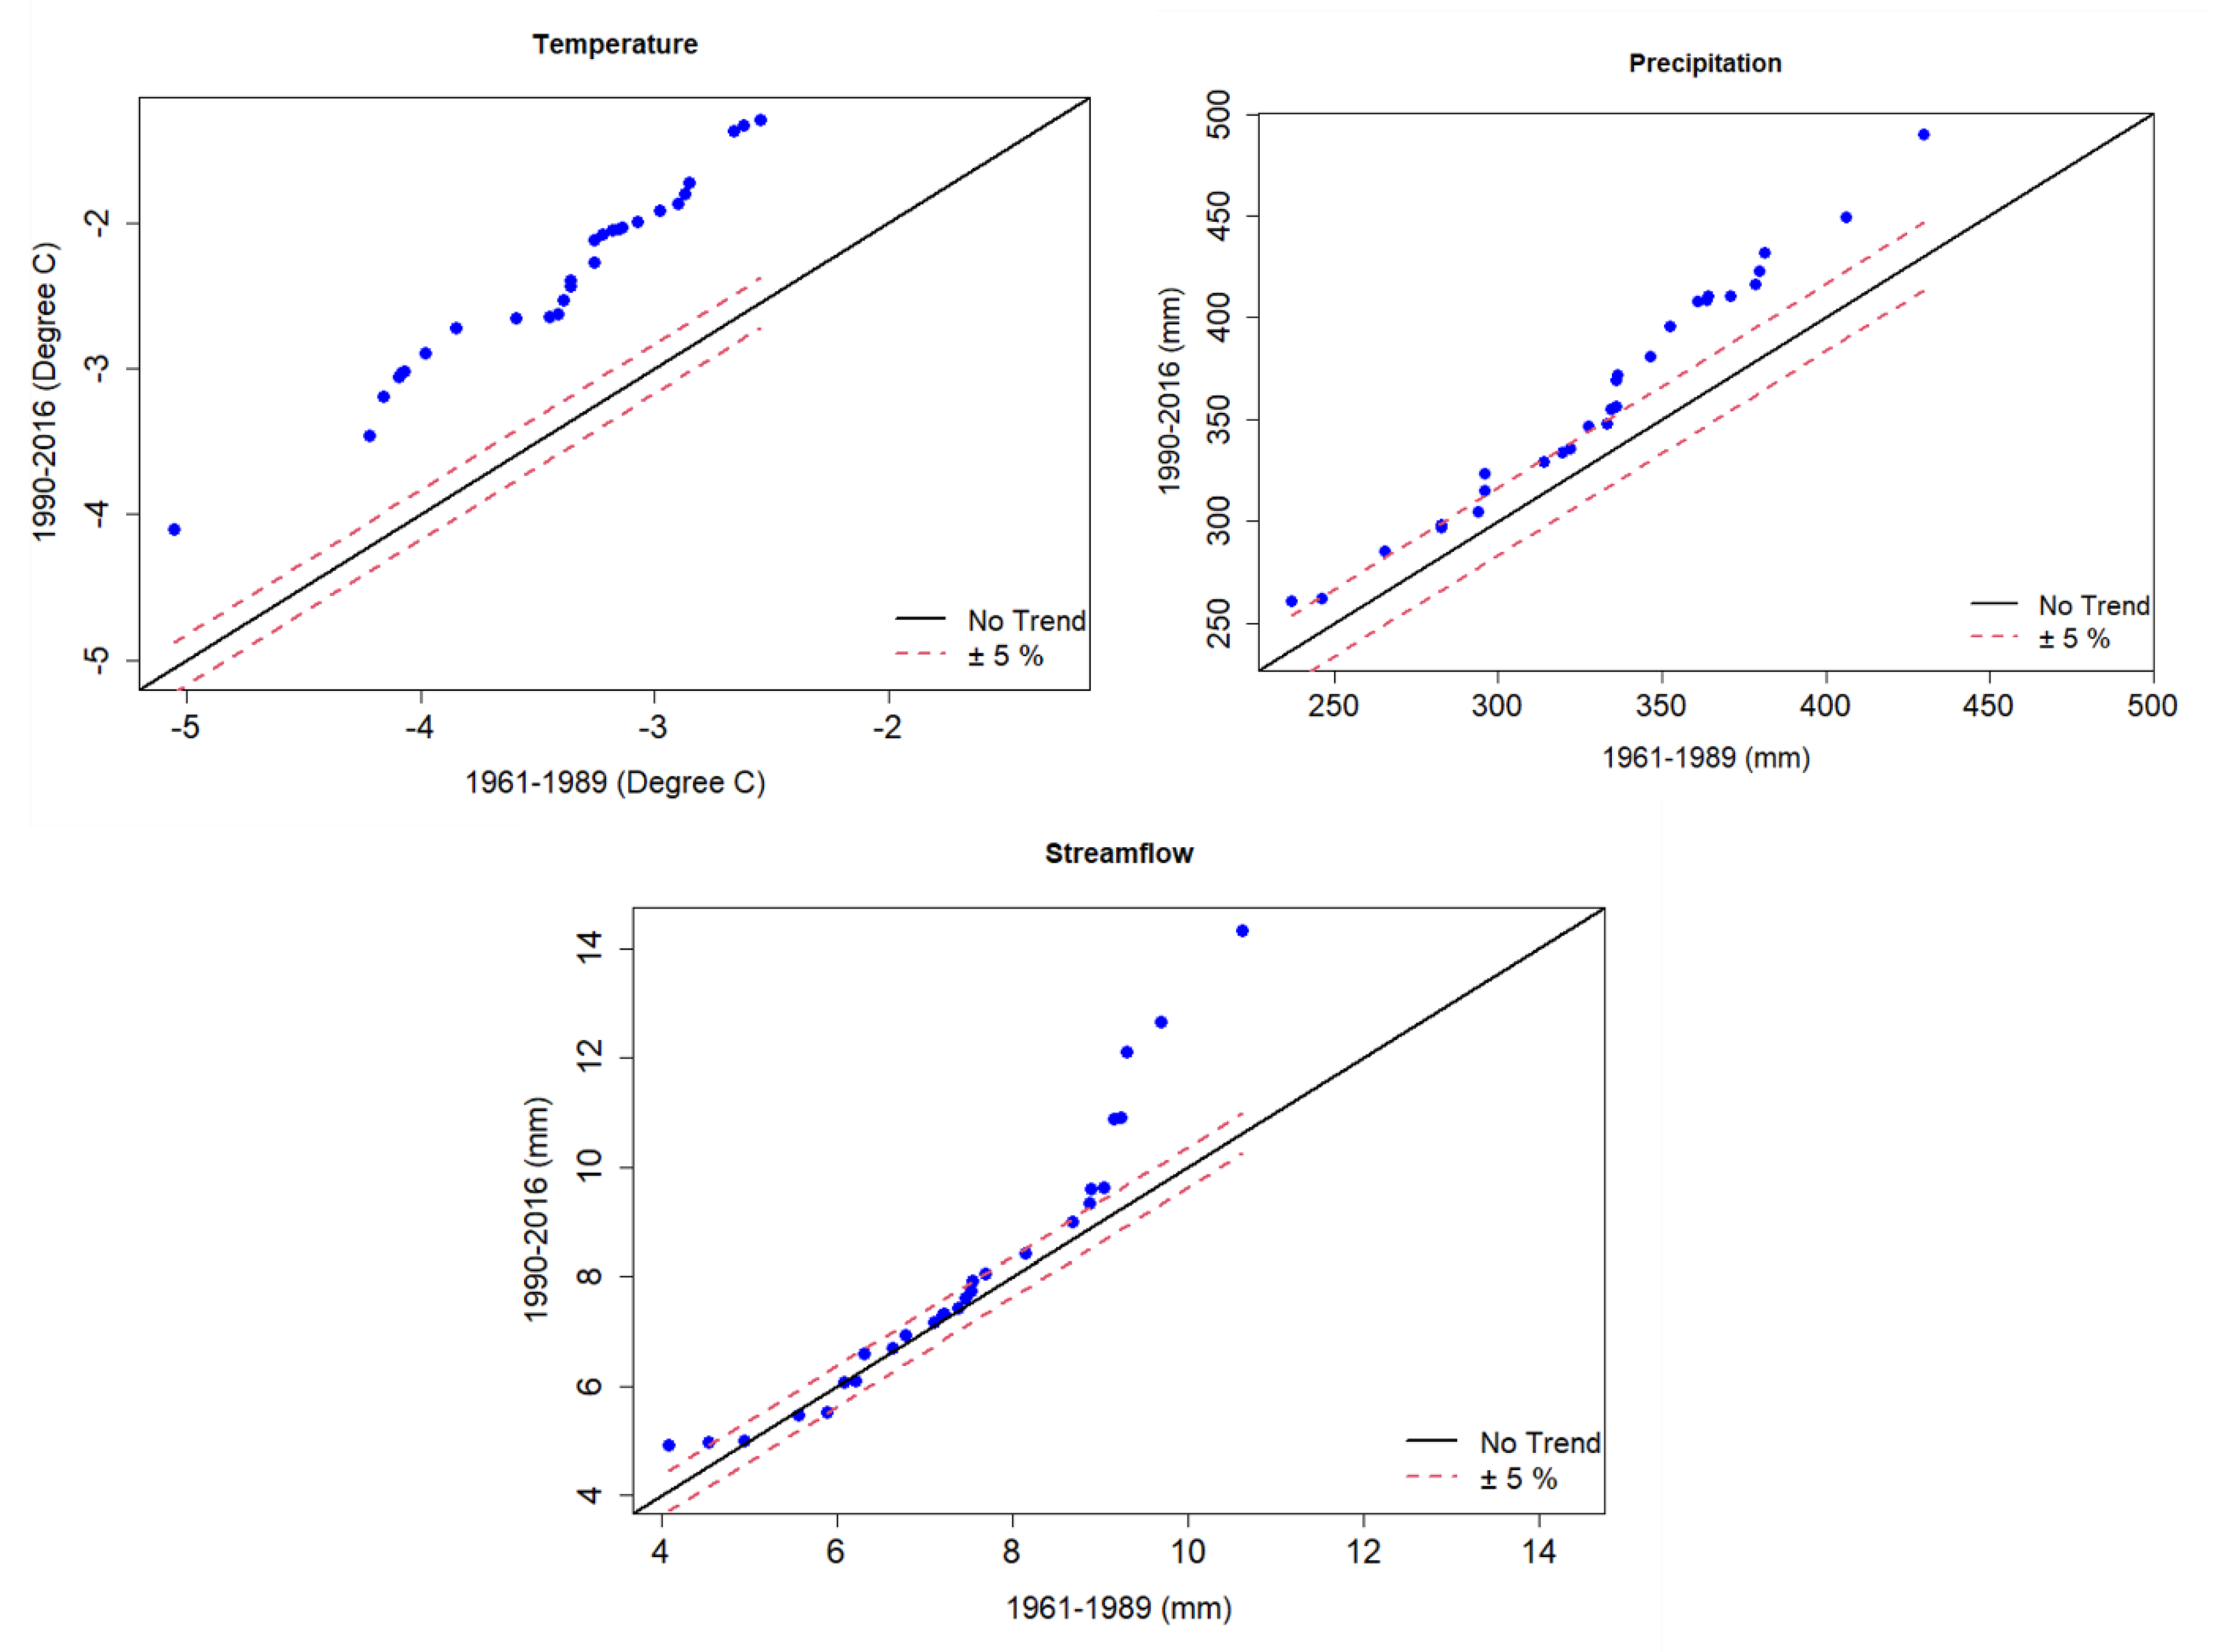
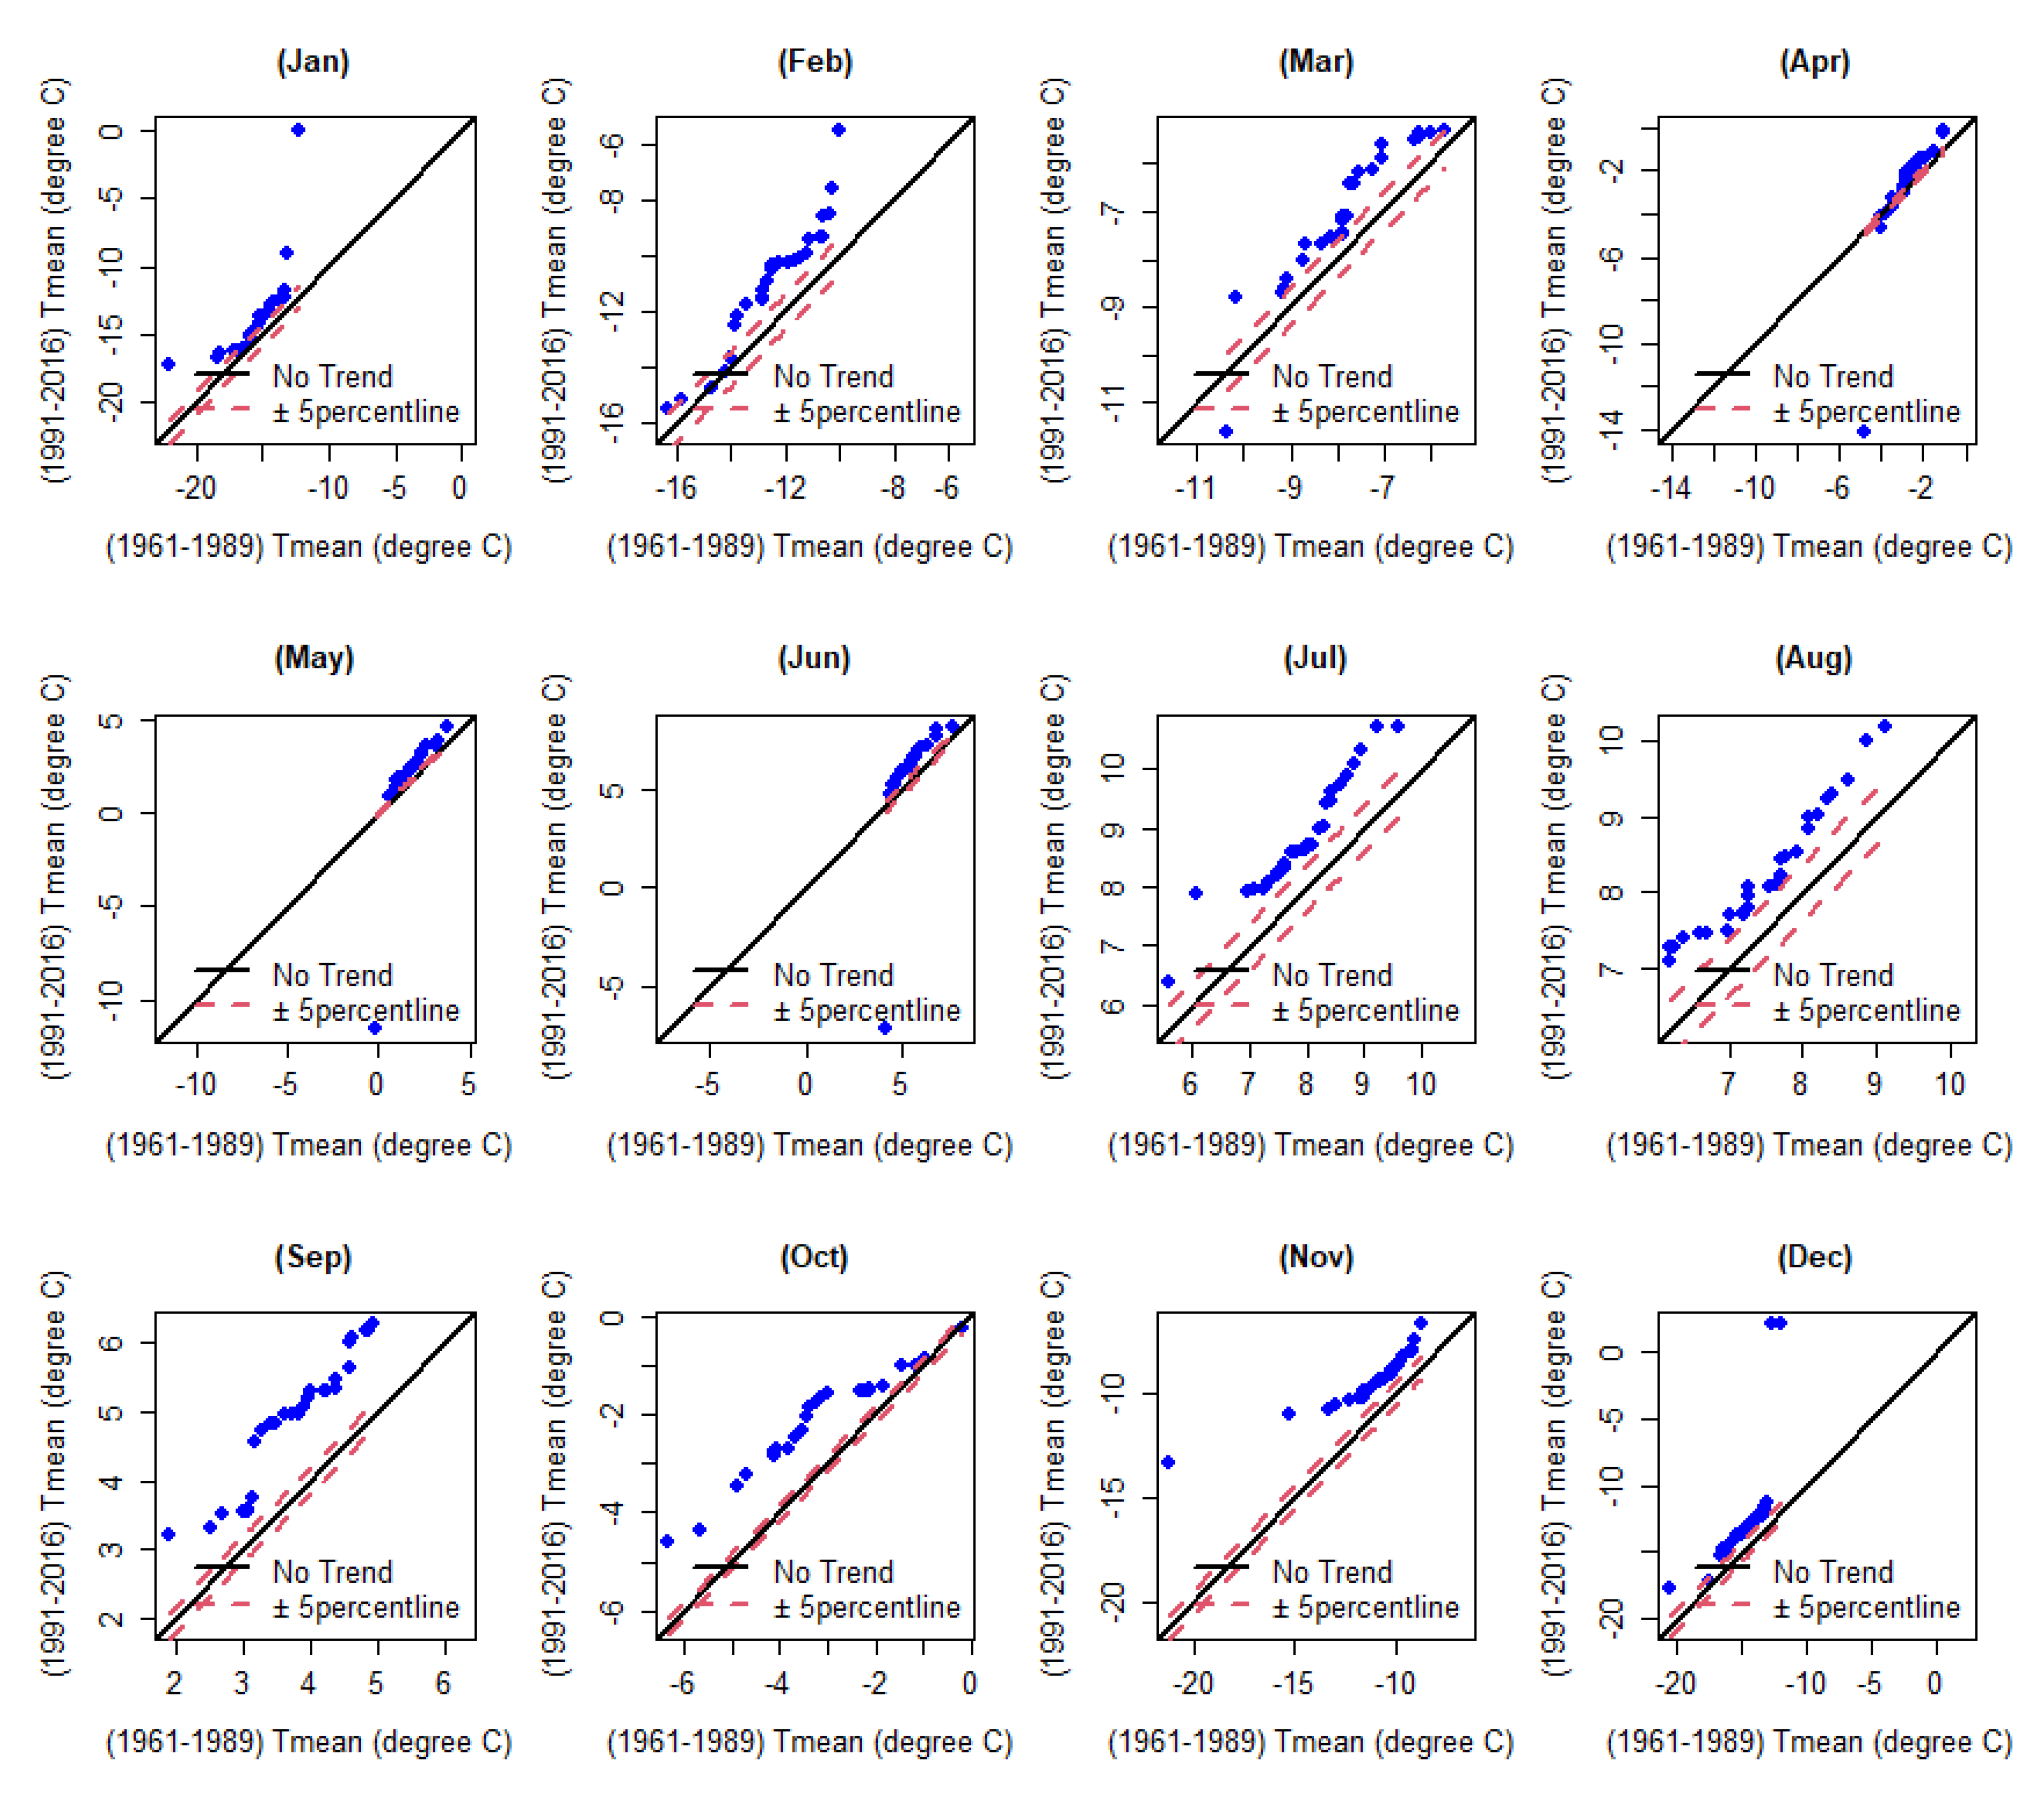
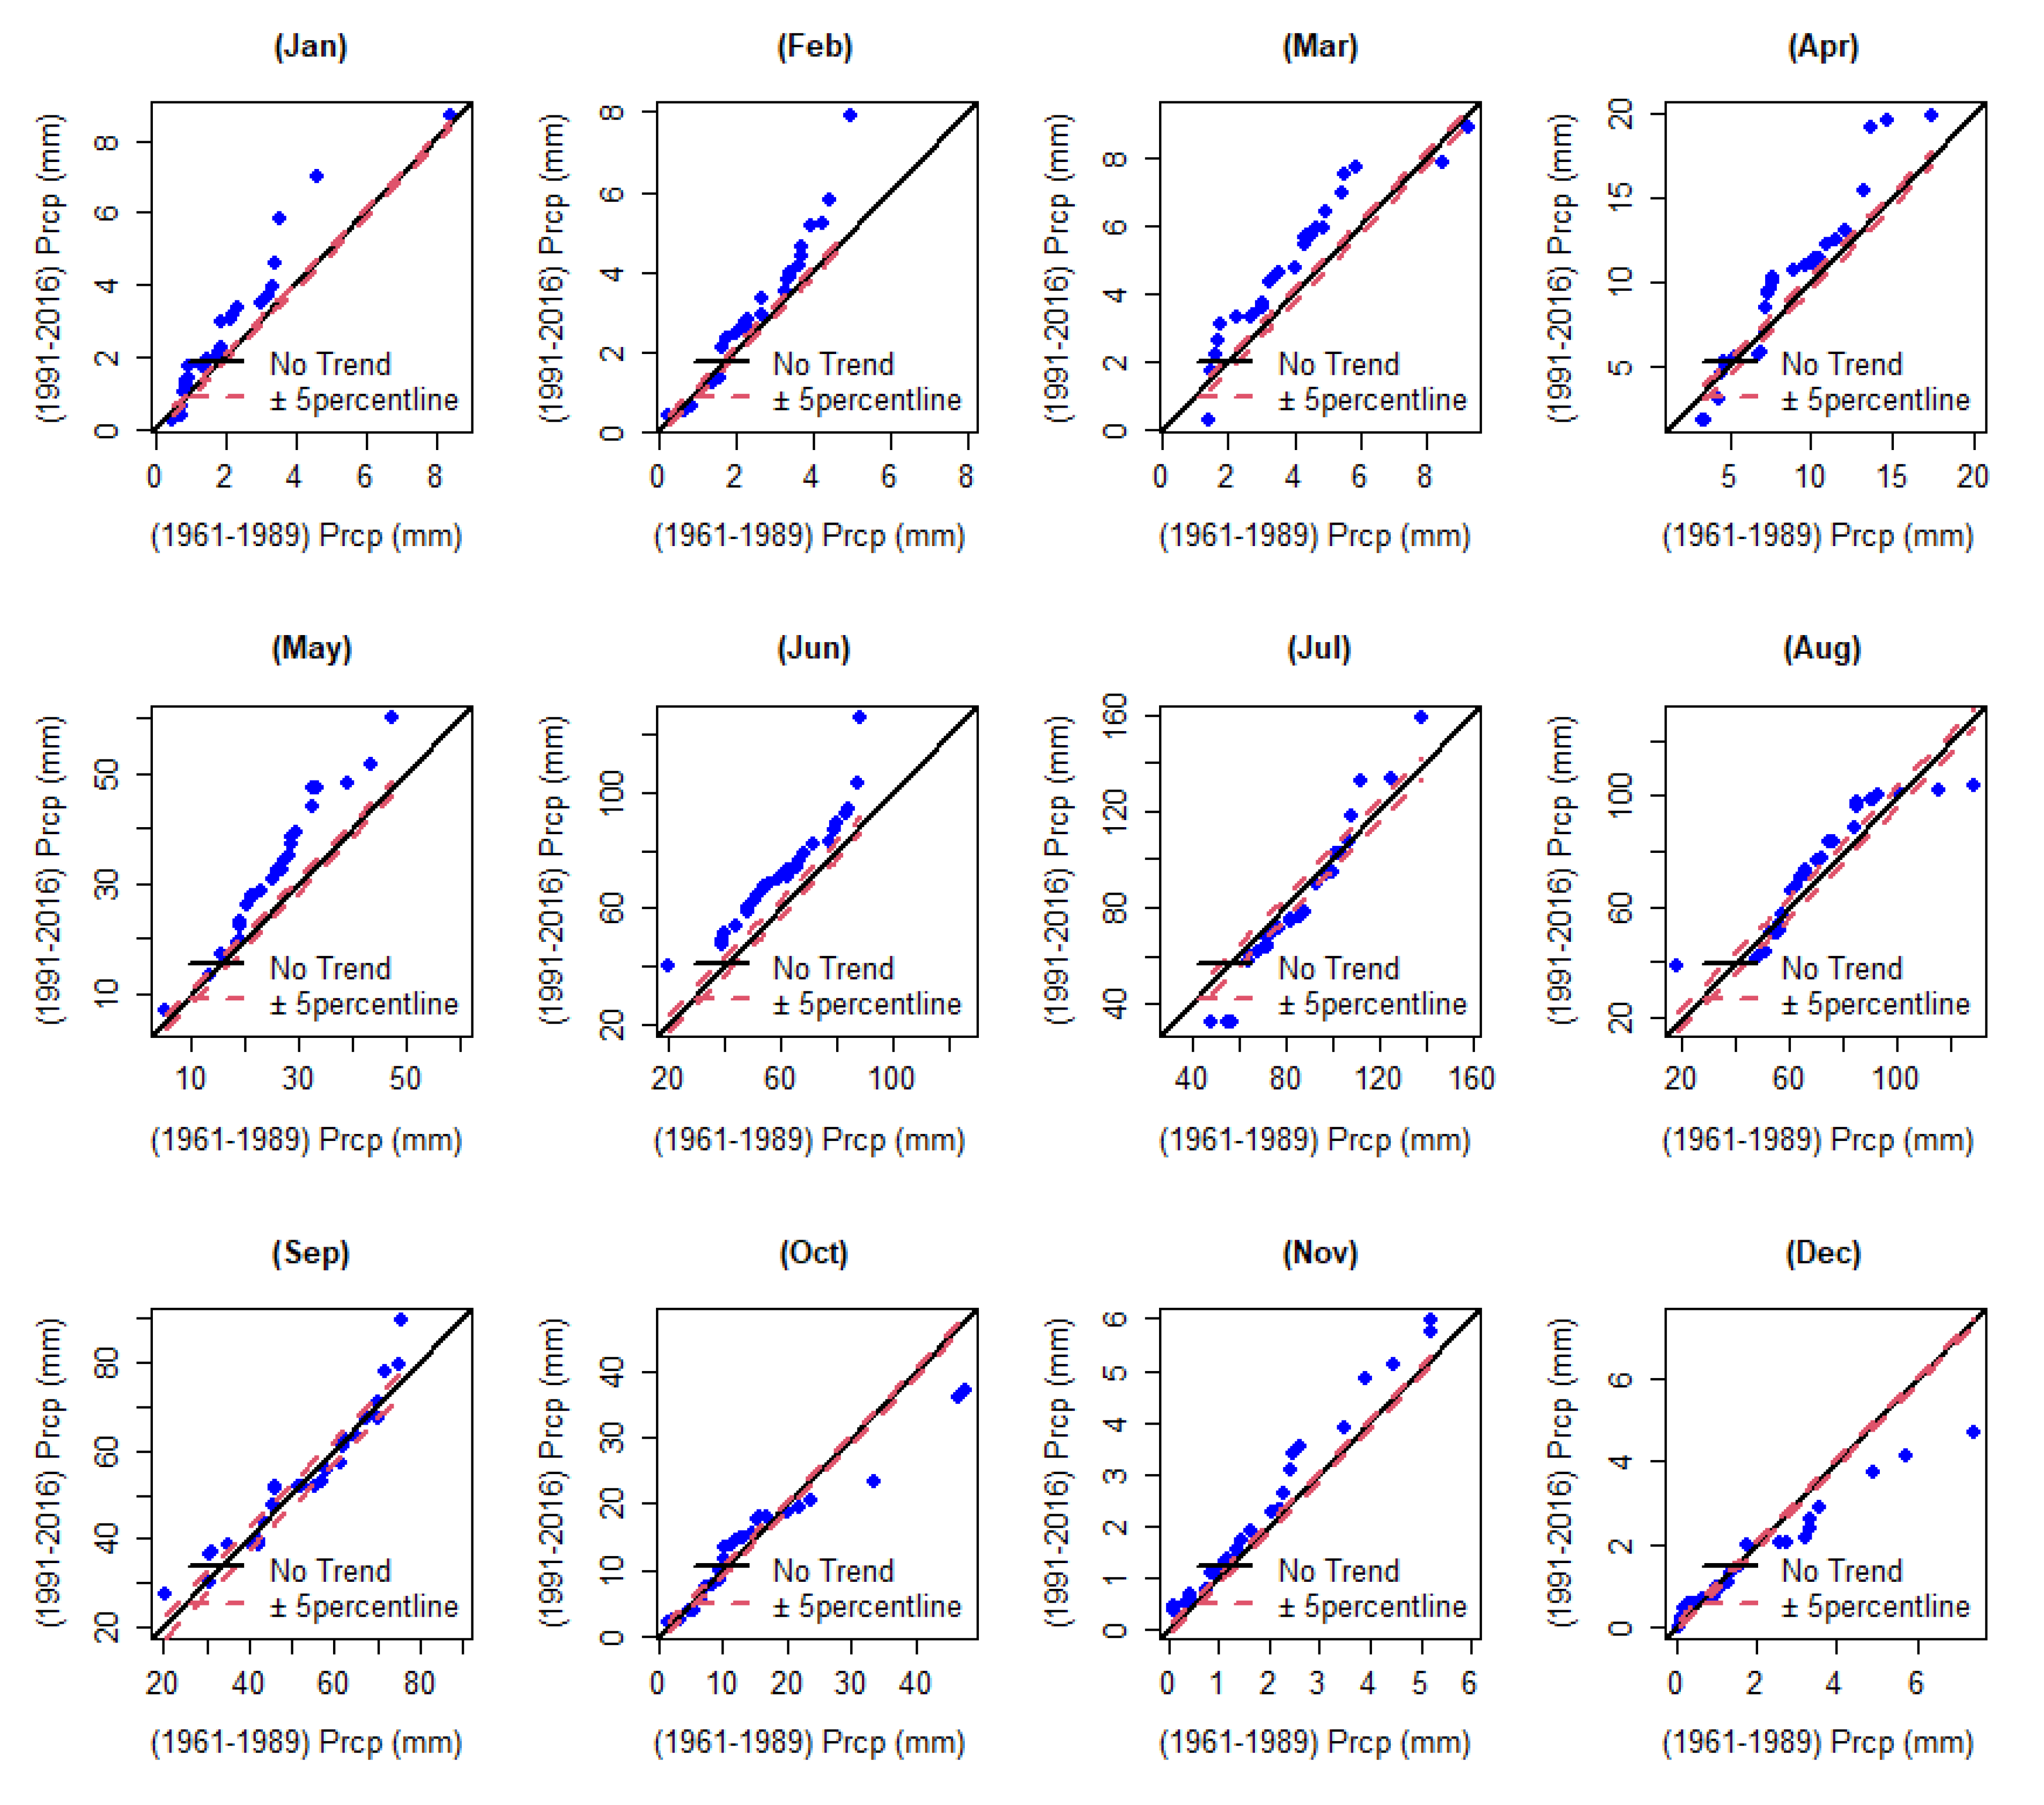
3.2. The Relationship among Precipitation, Temperature and Streamflow

In order to further understand the relationship between temperature, precipitation and streamflow, Pearson correlation analysis was used and monthly results are presented in Figure 9. In January and February temperature is positively correlated with streamflow (0.34 and 0.39 respectively), while precipitation is negatively correlated (−0.13, and −0.17). During April, June, July, August–October temperature and precipitation are both positively correlated with streamflow (Figure 9). However, during the low flow season (October/November to March), there is a negative correlation between precipitation and temperature. These results are different from the findings of global studies by Trenberth and Shea [77] and for Europe as concluded by Berg, et al. [78]. In the monsoon months (July and August), both temperature and precipitation are positively correlated with each other as well as with streamflow. The highest statistically significant correlation values between precipitation and streamflow are found in July, August, and September (0.59, 0.57, and 0.62, respectively; p < 0.05) while the temperature correlation is relatively weaker. This is an agreement with the findings of Guo, et al. [79] in the upstream area of the Weihe River in China. Similar findings are also reported by [48] for the Tuotuohe sub-basin of the Yangtze River.
The annual correlation between precipitation, temperature, and streamflow shows (Table 3) that precipitation and temperature are significantly positively correlated with streamflow while the correlation is stronger with precipitation (0.79; p < 0.05).

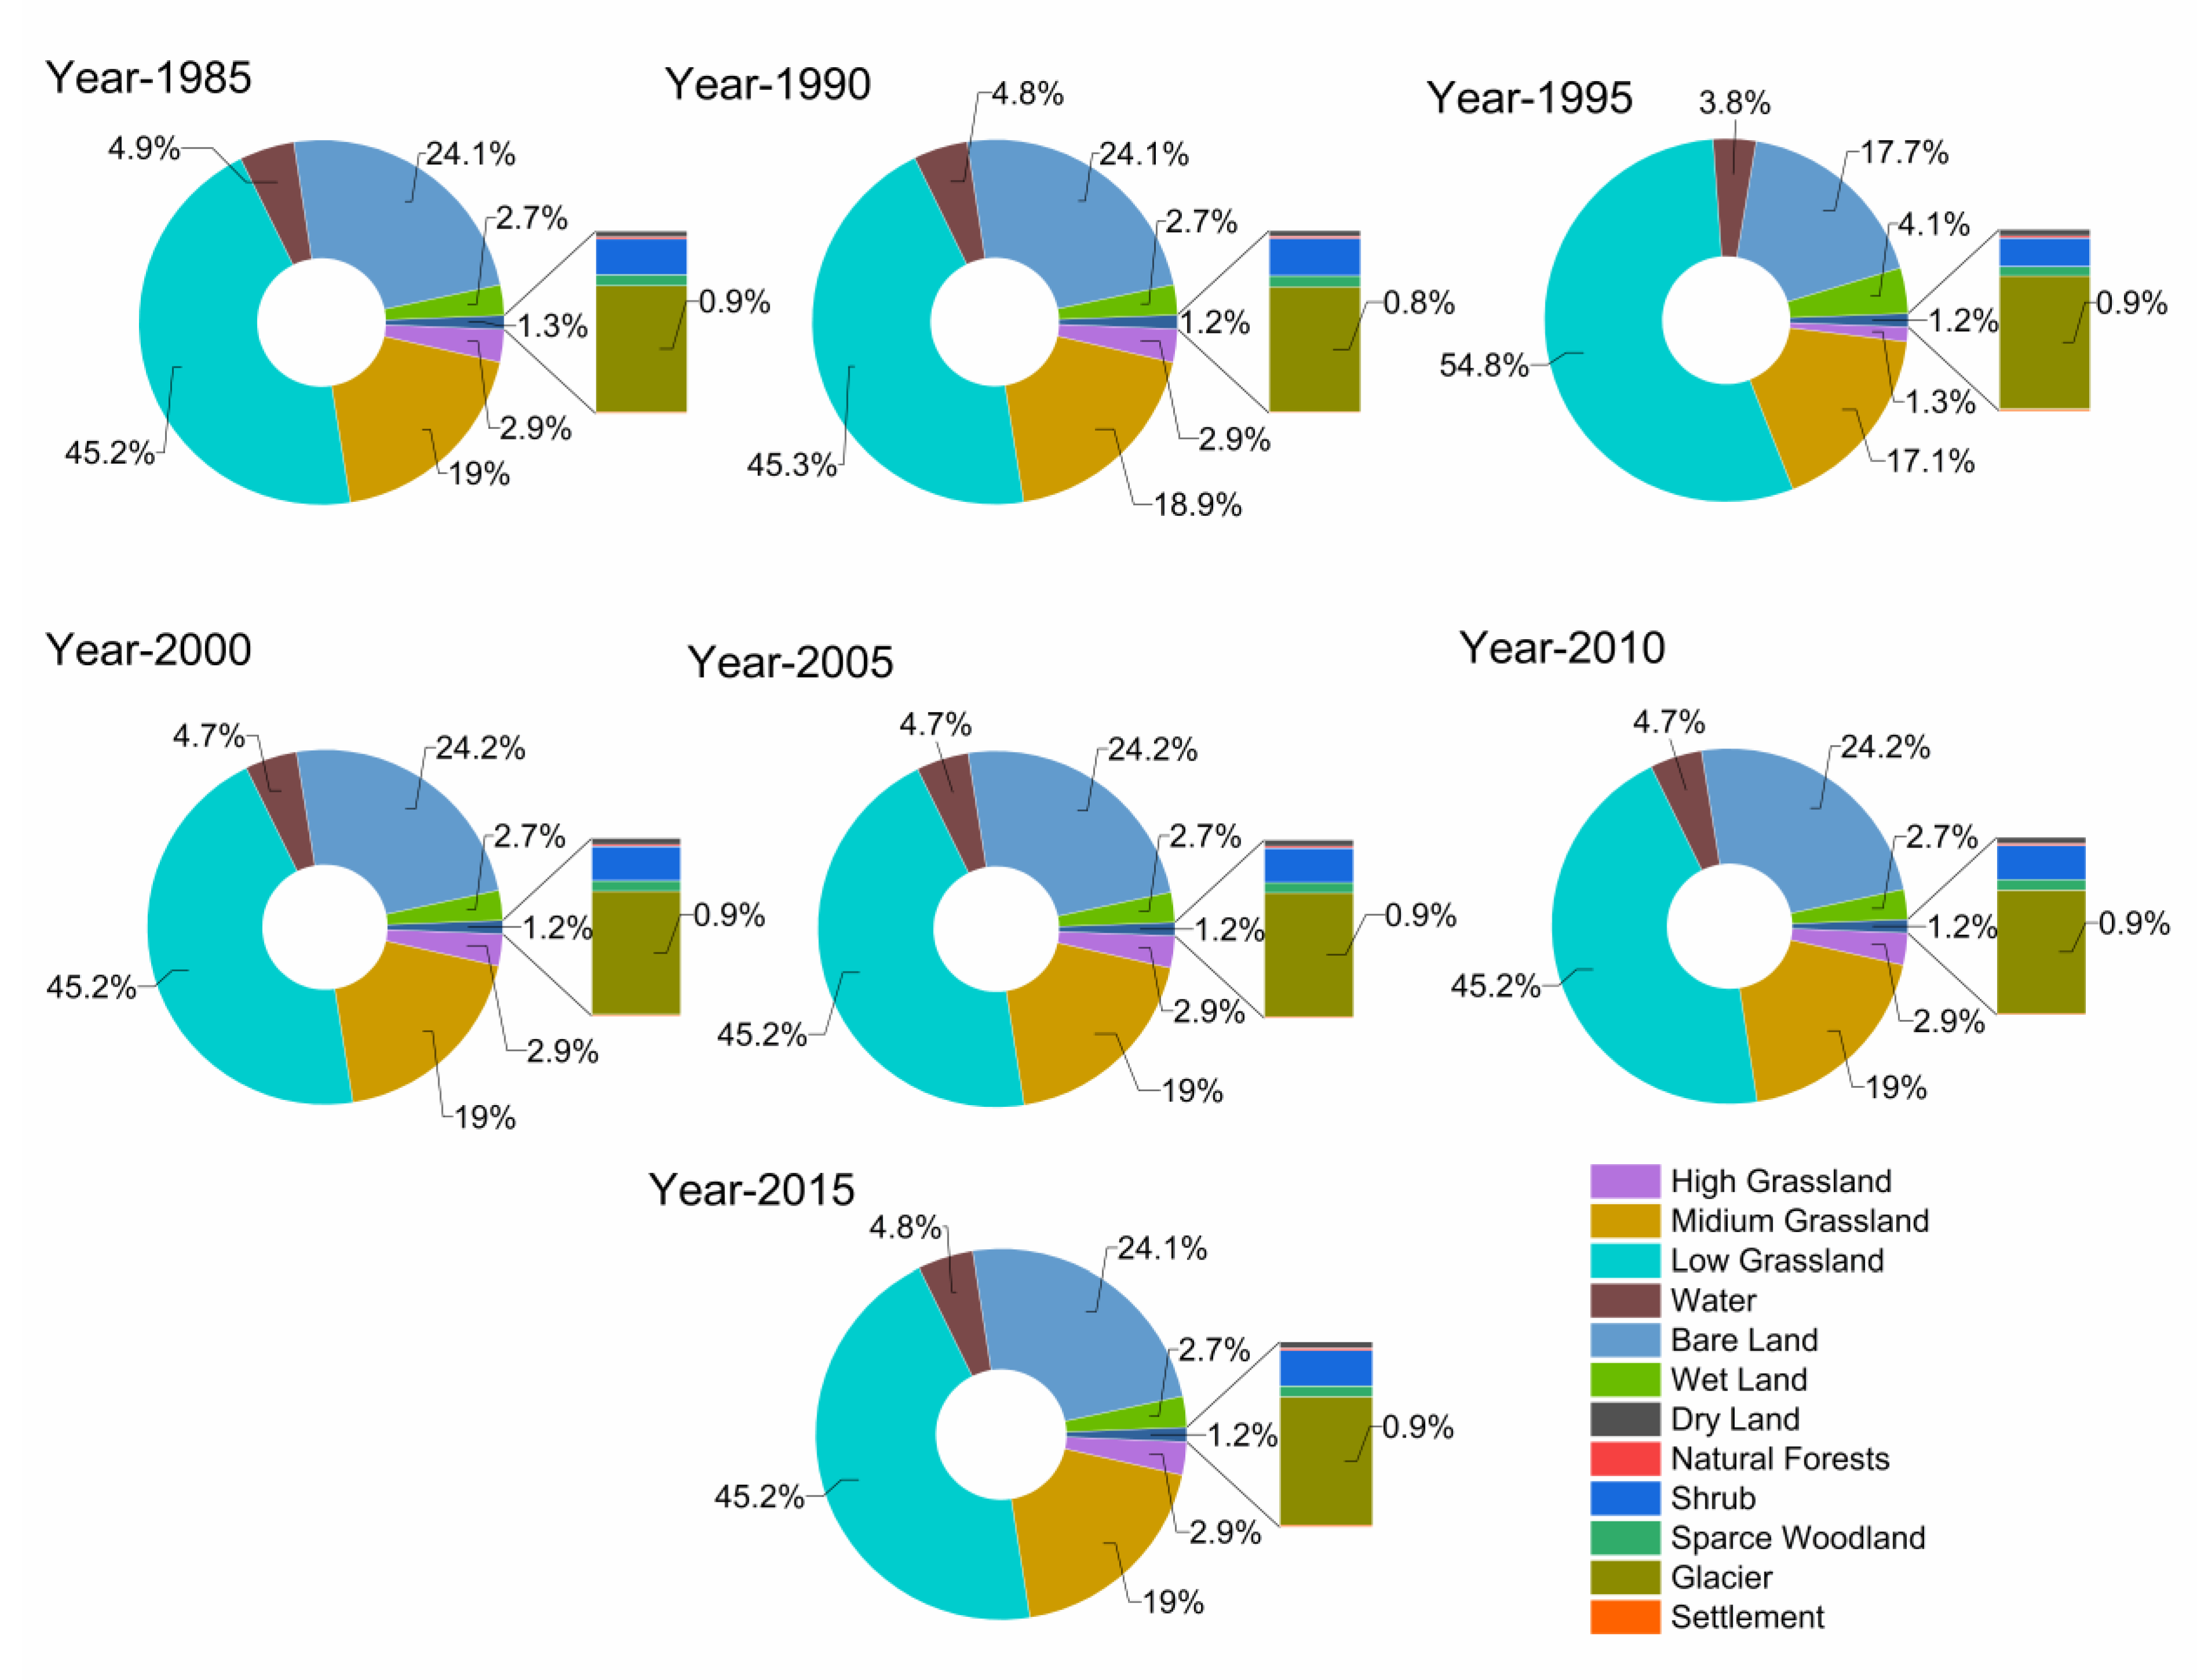
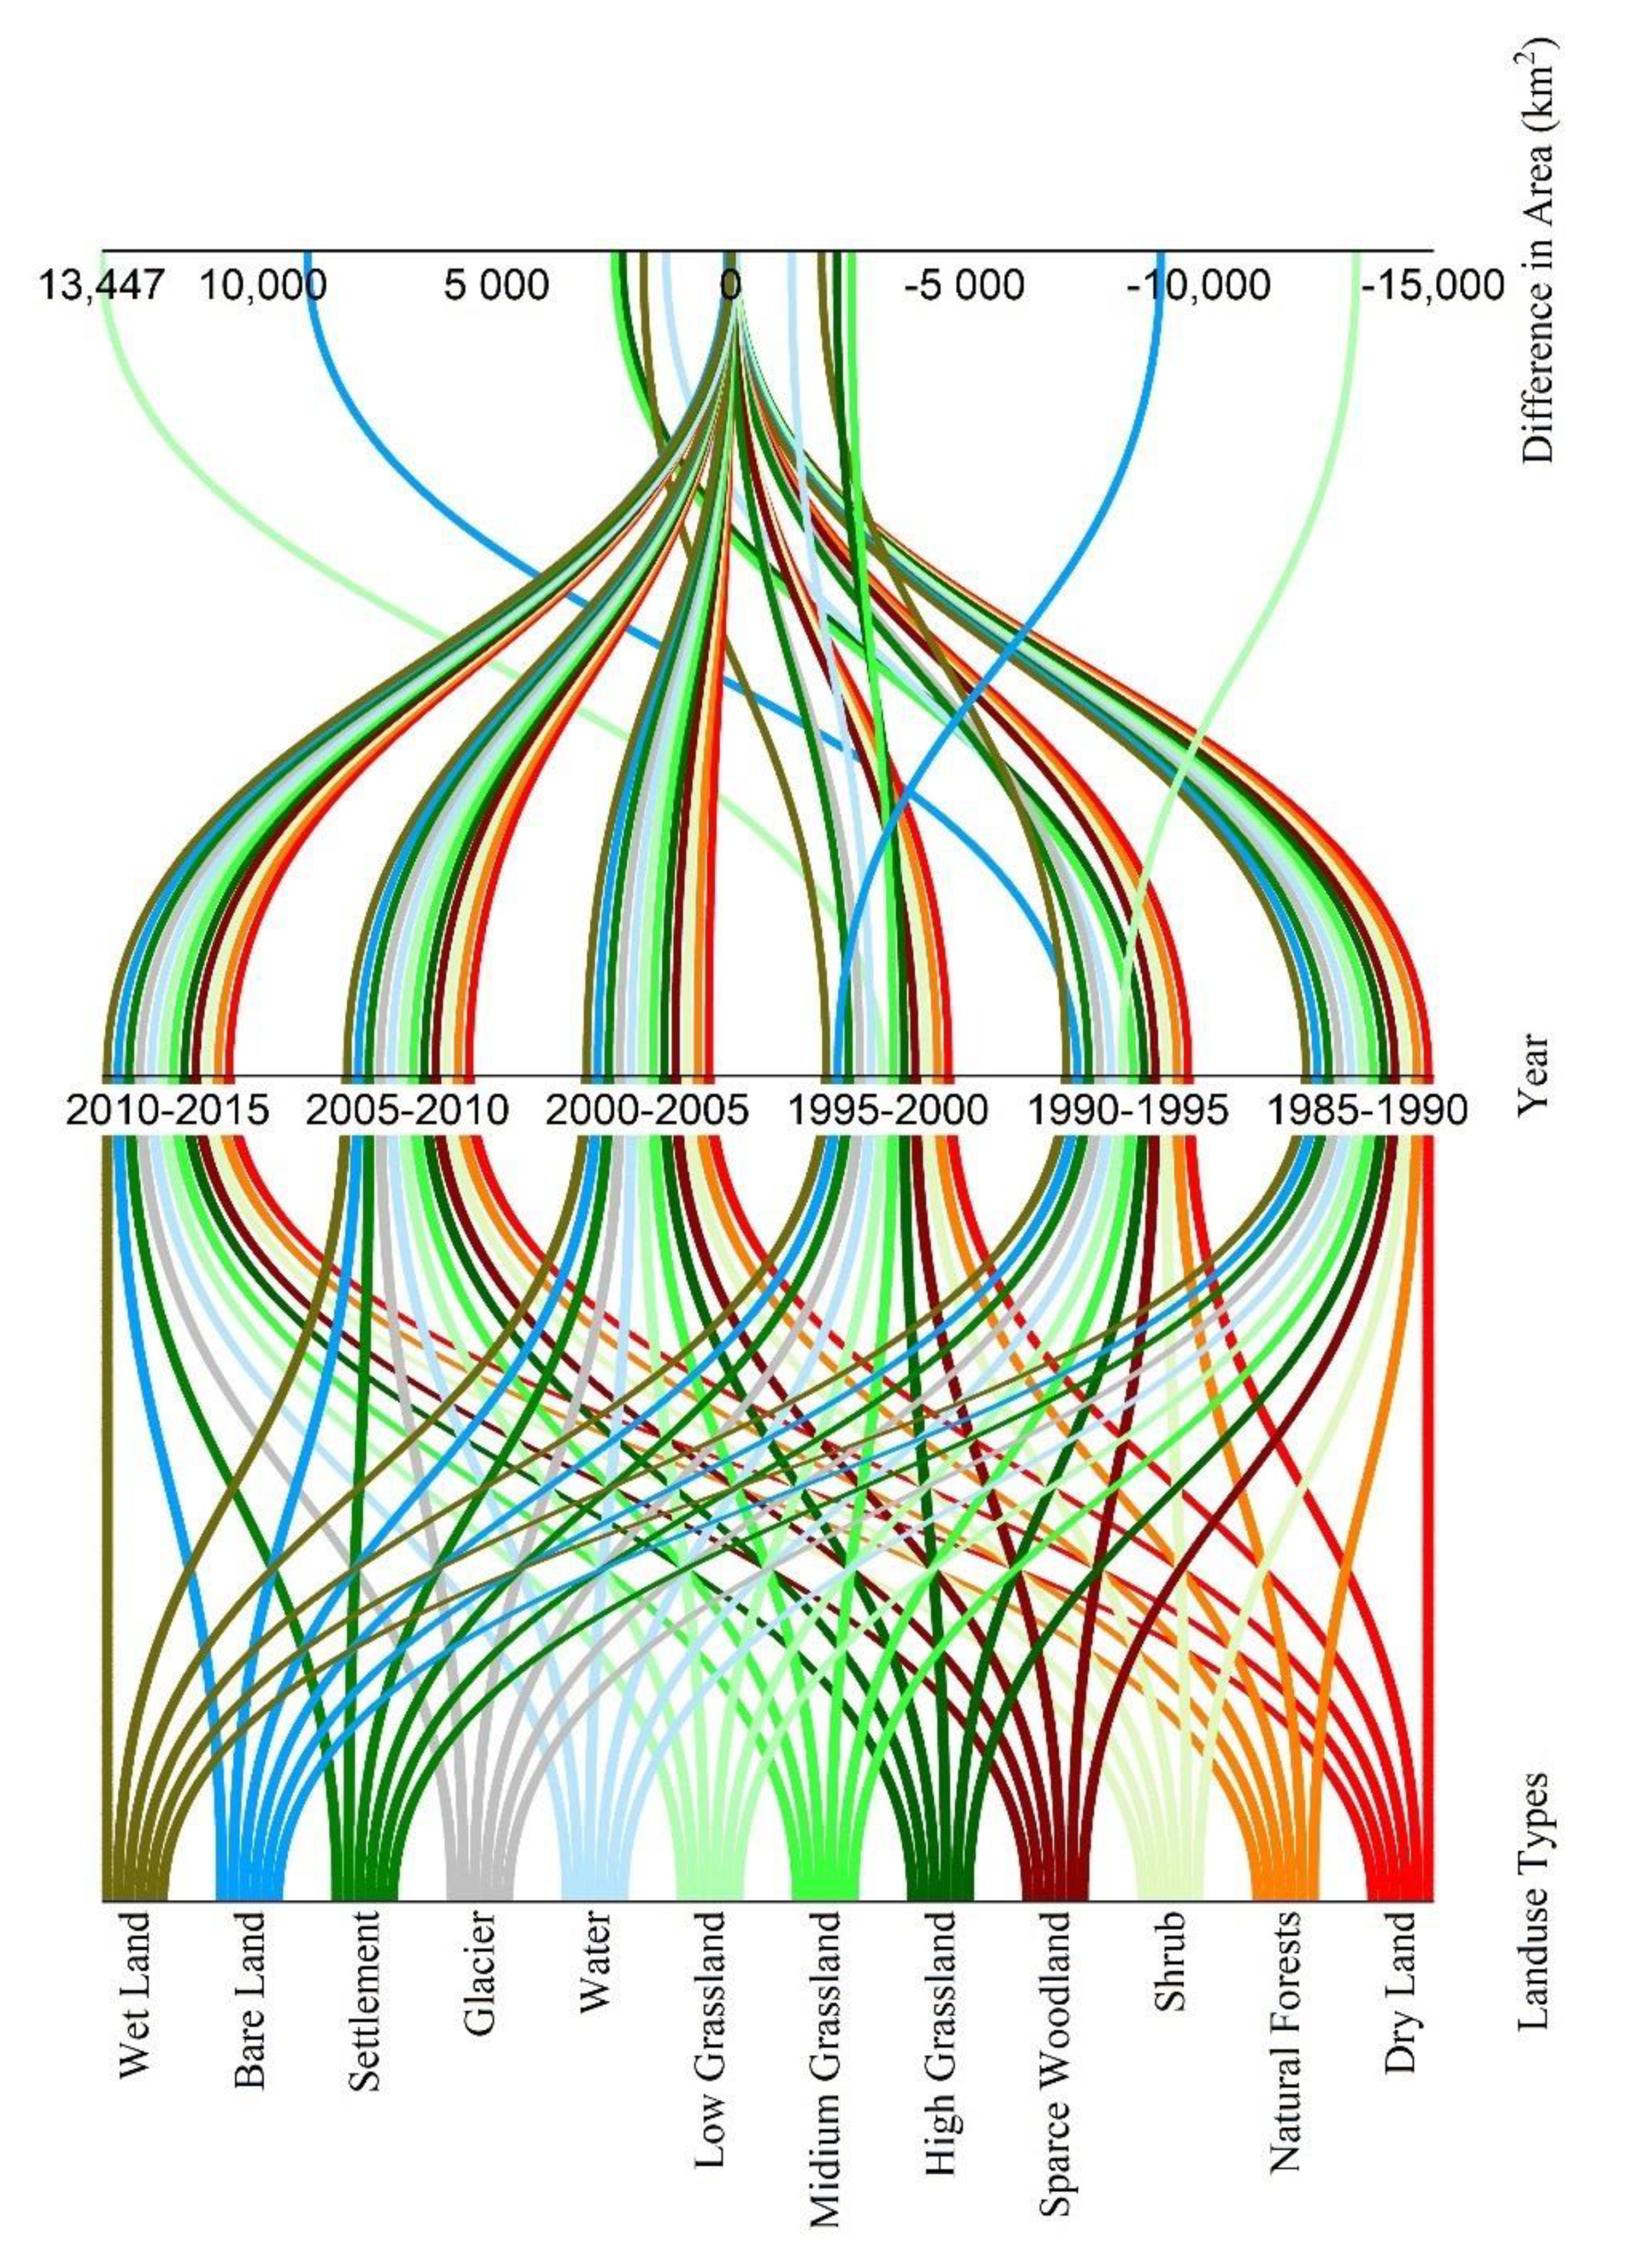
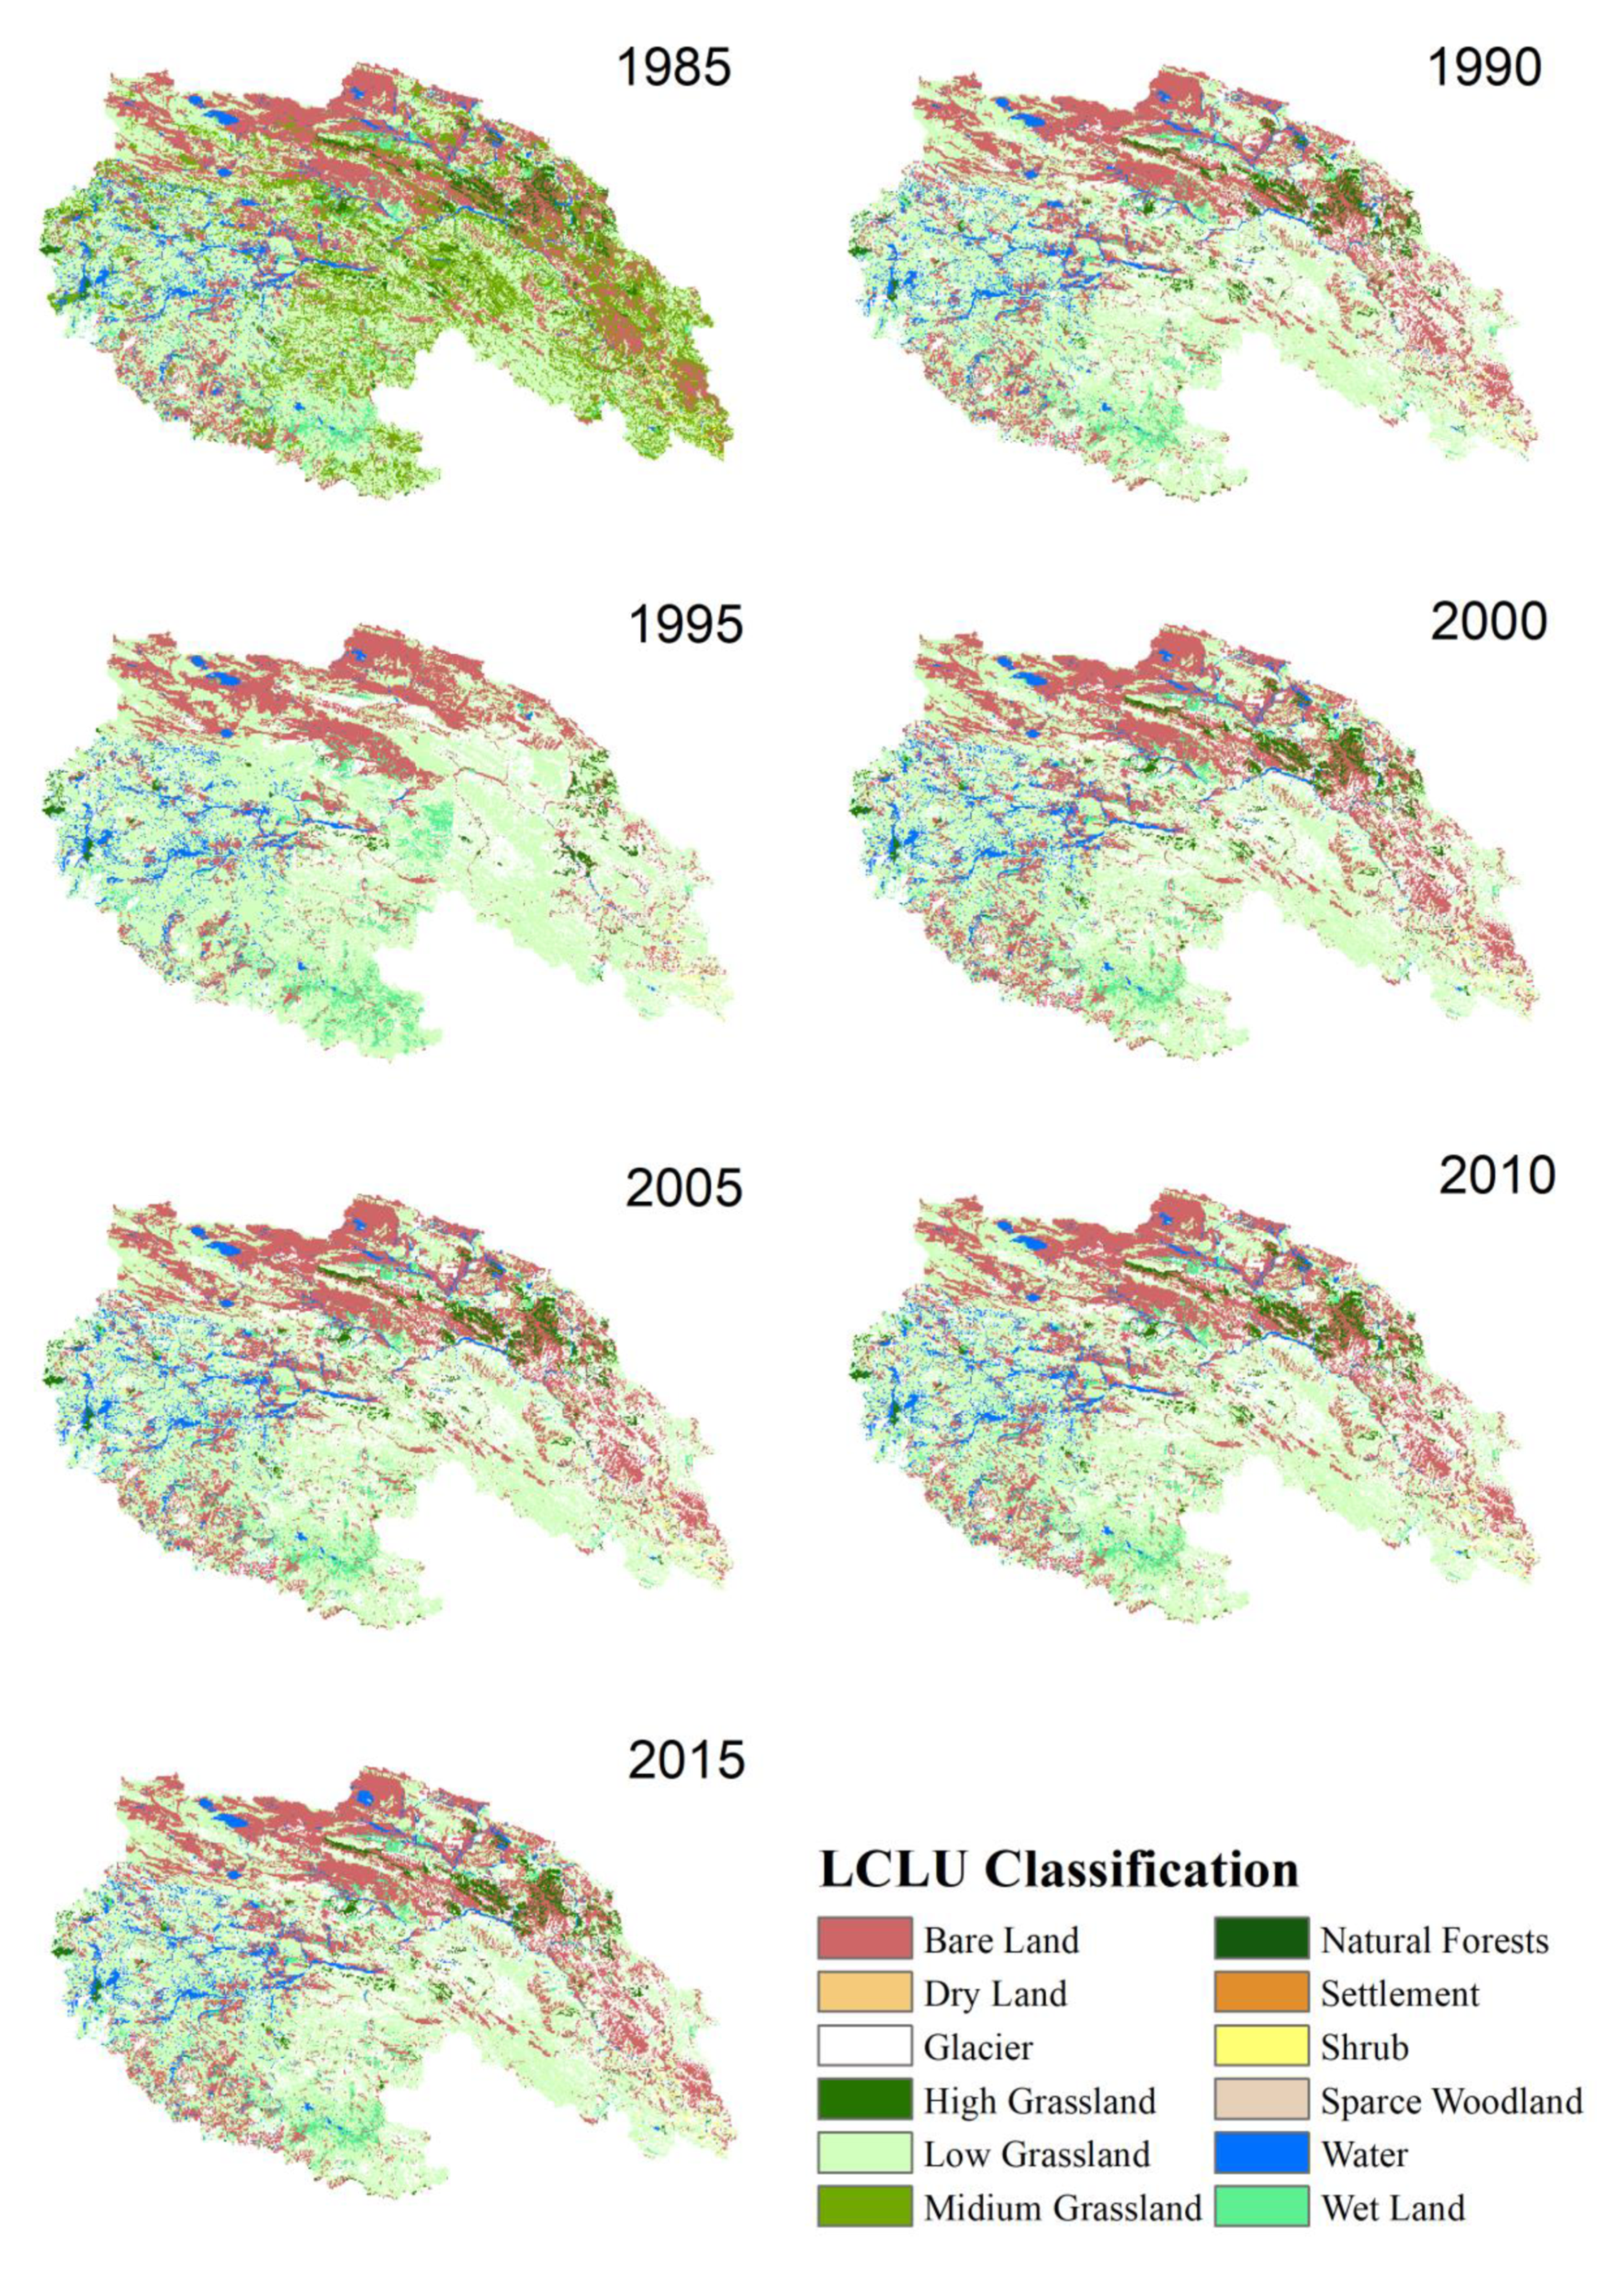
3.3. Land–Cover Change Detection and Spatial Distribution

The land–cover types with their percentage areal coverage for each year used in this study are presented in Figure 10 and the relative change in each land–cover type for each year in Figure 11. The largest areas were covered by low grassland (63,449.6 km2), bare land (33,846.6 km2), medium grassland (26,605.7 km2), water (6812.8 km2), high grassland (4039 km2) and wetland (3779.3 km2) in 1985. There were minor changes in these land–cover/land-use types from 1985 to 1990. However, more considerable changes in land–cover areas occurred from 1990–1995. For example, low grassland decreased by 13,352.4 km2, bare land increased by 9047.9 km2, medium grassland increased by 2484.4 km2, water increased by 1390.8 km2, high grassland increased by 2328.3 km2, and wetland decreased by 1927.1 km2. From 1995 to 2000, once again, some land-cover areas changed remarkably while the spatial distribution of land-cover data sets is provided in Figure 12.

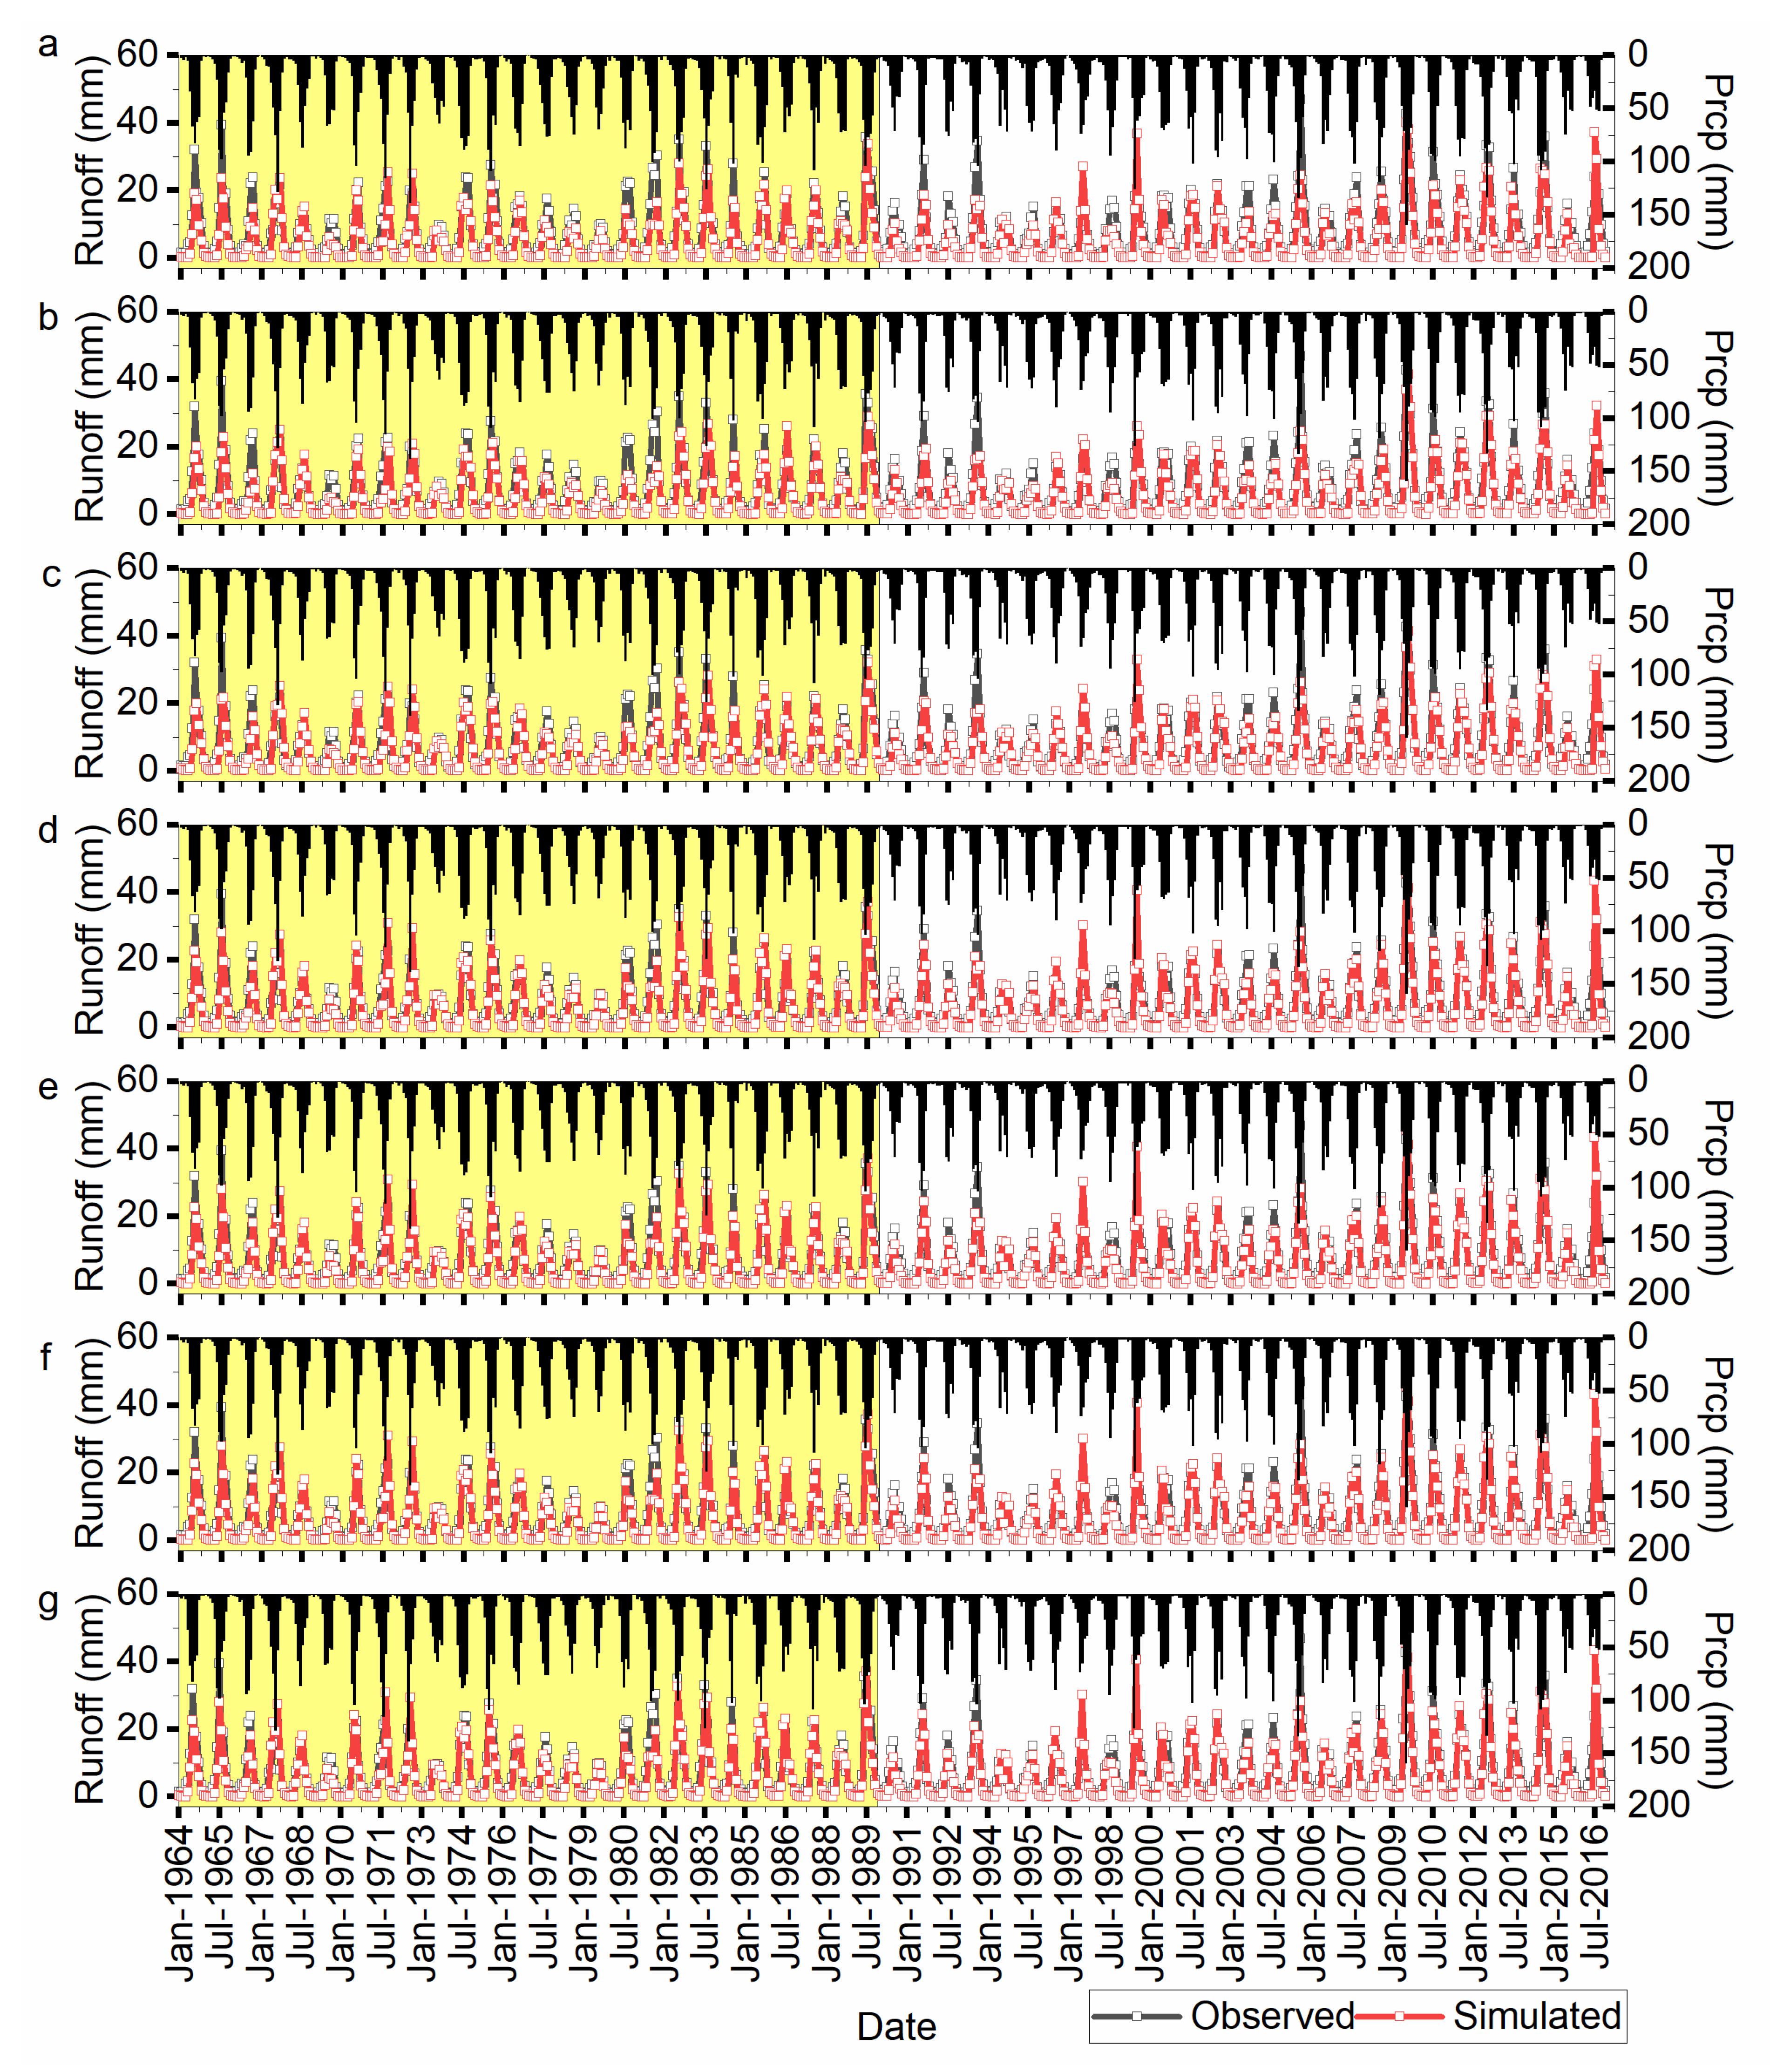
3.4. SWAT Model Simulation Results for Calibration and Validation

The SWAT model was calibrated using 1985 land-cover and climatic data from 1961–1989 (including 3 years as a spin-up period) and the results are presented in Figure 13. The model is over-estimated during low flow periods (October to March), particularly in the validation period (1990–2016).
The optimal values of sensitive parameters are presented in Appendix A and were determined using the SUFI-2 algorithm in SWAT-CUP using the land cover of 1985 for the calibration period (1961–1989). All other simulations were performed using the same parameter values. The NSE values for all land-cover data sets in the calibration and validation periods are given in Table 4. It shows the robustness of the model for each land-cover/land use data year (Moriasi, G. Arnold, W. Van Liew, L. Bingner, D. Harmel and L. Veith [72]. The NSE values for 1985 land cover were 0.82 and 0.84 for calibration and validation periods, respectively. However, the highest value (NSE = 0.93) was obtained for the 2000 LCC. Thus, the calibrated model captured well the higher flows with changing land-cover conditions (see Figure 13). The NSE values did not change for 2005, 2010, and 2015 LCC data sets because there was no significant change in the land-cover types from 2000 to 2015 because of vegetation restoration programs in this region [80].

3.5. Attribution of Changes in Streamflow and Evapotranspiration to Climate Change and Land-Cover Change

The attribution of changes in streamflow to CC and LCC using land-cover maps of 1985, 1990, 1995, 2000, 2005, 2010, and 2015, while CC data from 1964–2016 for YRSR are shown in Table 5. The results revealed that using the LCC of 1985–1990, changes in streamflow were mainly due to CC (11.4 mm) as compared to LCC (9.4 mm), accounting for 54.8 % and 45.2 % of the total combined impact of 20.7 mm during 1964–2016. The evapotranspiration (ET) increased from 273.6 mm during 1964–1989 to 279.8 mm during 1990–2016 for the LC of 1985–1990, where evapotranspiration has increased by 7.9 mm due to CC and has decreased by 1.3 mm due to LCC. (Table 5).
The LCC of 1990–1995 shows that 6.4 mm change in streamflow is due to CC and 8.1 mm is due to LCC, which accounts for 44.5% and 55.5% of the results with a total change of 14.5 mm of streamflow. CC increased ET by 10 mm while LCC decreased ET by 6.8 mm resulting in a combined increased evapotranspiration of 3.3 mm. For the LCC of 1995–2000, CC increased streamflow by 5.9 mm while LCC increased streamflow by 0.3 mm, which combined accounts for an increase in streamflow of 6.2 mm. For the same LCC, the evapotranspiration is decreased by 83.1 mm (46.3 %) and 96.1 mm (53.7%) due to CC and LCC, respectively, resulting in a combined decrease in evapotranspiration of 179.1 mm. Thus, for 1995–2000 land cover, the main contributor to streamflow changes is climate change, as reported by Nie, et al. [81] for the Yangtze River Basin as well (Table 5).
The simulated streamflow for land-cover maps of 2000–2005, 2005–2010, and 2010–2015 revealed no change in streamflow because there is no change in the land cover in the Yangtze River Source Region [80] after 2000. Table 5 shows that the main driver of streamflow changes for these land-cover data sets is climate change, and the evapotranspiration is also slightly influenced by climate change compared to land-cover change. Similar findings have been reported by Hu, Wang, Wang, Hong and Zheng [31] for the Yellow River middle reaches. The findings of our study are similar to the findings of other studies which determined the impacts of climate change and land-cover change on streamflow for different regions in China [74,82,83,84,85,86]. This study quantified the impacts of climate change and land-cover change on streamflow; however, the selection of an appropriate hydrological model and statistical technique is very important [74].

4. Limitations and Uncertainties

The major contingency of the method used in this study is the assumption that interactions among various factors were neglected while separating the effect of two factors (CC and LCC) [81]. However, climate change and land-cover change can change the regional hydrology. Additionally, the choice of hydrological models, length of the data sets available, and hydro-meteorological data quality may also affect the results [40,81,87]. The method used in this study is known as one-factor-at-a-time by considering the difference between two scenarios with only one factor changed, as applied by Yang, Feng, Yin, Wen, Si, Li and Deo [74], Nie, Zhang, Liu, Chen and Zhao [81]; this is a limitation of this study. Moreover, another uncertainty source is the hydrological modeling (e.g., uncertainties exist in the hydrological and meteorological time series, modeling parameters, etc.) and SWAT is a conceptual model with high parameterization during calibration resulting in uncertainties [88,89,90,91].

5. Conclusions

The present study describes the impacts of a changing climate and land-cover change on streamflow in the Yangtze River Source Region using the semi-distributed SWAT model. The climate showed a warming trend after 1989 based on an innovative trend analysis, while precipitation and temperature also increased in the second half of the study period (1990–2016) compared to the first half (1961–1989) of the study period. Precipitation and temperature are positively correlated during high flow months and negatively correlated during the winter months in the low flow season.
The SWAT model simulation showed that using LCC of 1985–1990, streamflow was mainly impacted by climate change (11.4 mm) compared to LCC (9.4 mm with the total combined impact of 20.7 mm. There is an increase in streamflow (6.4 mm) due to CC and LCC contributing 8.05 mm in streamflow for land cover of 1990–1995 which accounts for 44.5% and 55.5% with a net change of 14.5 mm of streamflow. The increased ET by 10 mm because of climate change while the change in land cover decreased ET by 6.8 mm. The combined effect of LCC and CC increased evapotranspiration by 3.3 mm for the data set of LCC 1990–1995.
The SWAT model simulated results of streamflow and evapotranspiration using LCC of 1995–2000 shows increased streamflow by 5.9 mm while the land-cover change increased streamflow by 0.3 mm, together accounting for 6.2 mm of increase in streamflow Thus, it shows that for 1995–2000 land-cover change mainly contributes to streamflow changes in climate. The simulated streamflow for land-cover maps of 2000–2005, 2005–2010, and 2010–2015 revealed no change in the streamflow because there is no change in the land cover in the Yangtze River Source Region after 2000. The results of the SWAT model simulations showed that the main driver of changes in streamflow in the Yangtze River Source Region is climate change, while evapotranspiration is also mainly influenced by climate change as compared to land-cover change.

Author Contributions

N.A. designed the research, highlighted the problem, and formulated the research plan. N.A. and M.J.B. analyzed the data. H.L., S.A. and H.M. helped with the interpretation of the results. G.W., M.J.B. and H.M. supervised the study. G.W. also provided the financial resources used in this study. F.A.P., M.A.I. and H.M. helped in the model development and analysis of results. N.A. wrote the original draft, whereas G.W., H.M. and M.J.B. reviewed the draft paper. All authors confirm the final version of the article for submission to the journal. All authors have read and agreed to the published version of the manuscript.

Funding

This work was financially supported by Joint Grant from Chinese Academy of Sciences-People’s Government of Qinghai Province on Sanjiangyuan National Park (LHZX-2020-10).

Data Availability Statement

The data (climatic, hydrological, terrain, and land cover) used during the study were provided by a third party. Direct requests for these materials may be made to the provider as indicated in the data and acknowledgments sections. However, the SWAT model, DEM, and soil raster data are freely available (details mentioned in the data section of this manuscript).

Acknowledgments

The present study was conducted in the Key Laboratory of Mountain Surface Process and Ecological Regulations, Institute of Mountain Hazards and Environment, Chinese Academy of Sciences, Chengdu, Sichuan, China. The authors are thankful to the Yangtze River Authority and China Meteorological Administration for sharing data used in this study.

Conflicts of Interest

The authors declared that they have no conflict of interest in this study.

Appendix A

Optimal values of sensitive parameters.
No.ParametersOptimal ValueMin. ValueMax. ValueExplanation
1.r__CN2.mgt−0.5−0.70.2Moisture condition-II, SCS curve number
2.v__ALPHA_BF.gw0.1200.5Baseflow recession constant
3.v__GW_DELAY.gw18.13525Groundwater delay coefficient (days)
4.v__GWQMN.gw0.8602Threshold water level in shallow aquifer for base flow (mm)
5.v__SMTMP.bsn1.7802.5Snow melt base temperature (°C);
6.v__SFTMP.bsn0.9502Snowfall temperature (°C);
7.v__TIMP.bsn0.7201Snowpack temp lag factor
8.v__HRU_SLP.hru0.601Average slope steepness
9.r__SOL_K.sol0.120.51.5Saturated hydraulic conductivity (mm/h)
10.r__SOL_BD.sol1.40.51.5Soil bulk density (g/cm−3)
11.v__SNOCOVMX.bsn71.350150Areal snow coverage threshold at 100%
“v” and “r” at the start of each parameter represent parameter value is “replaced a given value” and “multiplied by (1+ a given value),” respectively.

References

  1. Crooks, S.; Davies, H. Assessment of land use change in the Thames catchment and its effect on the flood regime of the river. Phys. Chem. Earth Part B Hydrol. Ocean. Atmos. 2001, 26, 583–591. [Google Scholar] [CrossRef]
  2. Brath, A.; Montanari, A.; Moretti, G. Assessing the effect on flood frequency of land use change via hydrological simulation (with uncertainty). J. Hydrol. 2006, 324, 141–153. [Google Scholar] [CrossRef]
  3. De Roo, A.; Odijk, M.; Schmuck, G.; Koster, E.; Lucieer, A. Assessing the effects of land use changes on floods in the Meuse and Oder catchment. Phys. Chem. Earth Part B Hydrol. Ocean. Atmos. 2001, 26, 593–599. [Google Scholar] [CrossRef]
  4. Marhaento, H.; Booij, M.J.; Hoekstra, A.Y. Attribution of changes in stream flow to land use change and climate change in a mesoscale tropical catchment in Java, Indonesia. Hydrol. Res. 2017, 48, 1143–1155. [Google Scholar] [CrossRef]
  5. Wang, G.; Zhang, Y.; Liu, G.; Chen, L. Impact of land-use change on hydrological processes in the Maying River basin, China. Sci. China Ser. D Earth Sci. 2006, 49, 1098–1110. [Google Scholar] [CrossRef]
  6. Busico, G.; Ntona, M.M.; Carvalho, S.C.P.; Patrikaki, O.; Voudouris, K.; Kazakis, N. Simulating Future Groundwater Recharge in Coastal and Inland Catchments. Water Resour. Manag. 2021, 35, 3617–3632. [Google Scholar] [CrossRef]
  7. Prowse, T.; Beltaos, S.; Gardner, J.; Gibson, J.; Granger, R.; Leconte, R.; Peters, D.; Pietroniro, A.; Romolo, L.; Toth, B. Climate change, flow regulation and land-use effects on the hydrology of the Peace-Athabasca-Slave system; Findings from the Northern Rivers Ecosystem Initiative. Environ. Monit. Assess. 2006, 113, 167–197. [Google Scholar] [CrossRef] [Green Version]
  8. Jun, X.; Chunzhen, L.; Guoyu, R. Opportunity and challenge of the climate change impact on the water resource of China. Adv. Earth Sci. 2011, 26, 1–12. [Google Scholar]
  9. Zhang, L.; Karthikeyan, R.; Bai, Z.; Srinivasan, R. Analysis of streamflow responses to climate variability and land use change in the Loess Plateau region of China. Catena 2017, 154, 1–11. [Google Scholar] [CrossRef]
  10. Joo, J.; Zhang, A.; Li, X.; Zheng, C. Hydrological responses to climate shifts for a minimally disturbed mountainous watershed in northwestern China. Hydrol. Sci. J. 2017, 62, 1440–1455. [Google Scholar] [CrossRef]
  11. Liu, J.; Zhang, Q.; Deng, X.; Ci, H.; Cheng, X. Quantitative analysis the influences of climate change and human activities on hydrological processes in Poyang Basin. J. Lake Sci. 2016, 28, 432–443. [Google Scholar] [CrossRef] [Green Version]
  12. Birkinshaw, S.J.; Guerreiro, S.B.; Nicholson, A.; Liang, Q.; Quinn, P.; Zhang, L.; He, B.; Yin, J.; Fowler, H.J. Climate change impacts on Yangtze River discharge at the Three Gorges Dam. Hydrol. Earth Syst. Sci. 2017, 21, 1911. [Google Scholar] [CrossRef] [Green Version]
  13. Allan, J.D. Influence of land use and landscape setting on the ecological status of rivers. Limnetica 2004, 23, 187–197. [Google Scholar] [CrossRef]
  14. Gao, L.; Zhang, Y. Spatio-temporal variation of hydrological drought under climate change during the period 1960–2013 in the Hexi Corridor, China. J. Arid. Land 2016, 8, 157–171. [Google Scholar] [CrossRef] [Green Version]
  15. Lee, M.-H.; Bae, D.-H. Climate Change Impact Assessment on Green and Blue Water over Asian Monsoon Region. Water Resour. Manag. 2015, 29, 2407–2427. [Google Scholar] [CrossRef]
  16. Zhang, Q.; Liu, J.; Singh, V.P.; Shi, P.; Sun, P. Hydrological responses to climatic changes in the Yellow River basin, China: Climatic elasticity and streamflow prediction. J. Hydrol. 2017, 554, 635–645. [Google Scholar] [CrossRef]
  17. Li, L.J.; Zhang, L.; Wang, H.; Wang, J.; Yang, J.W.; Jiang, D.J.; Li, J.Y.; Qin, D.Y. Assessing the impact of climate variability and human activities on streamflow from the Wuding River basin in China. Hydrol. Processes Int. J. 2007, 21, 3485–3491. [Google Scholar] [CrossRef]
  18. Zhang, A.-J.; Wang, B.-D.; Cao, M.-L. Influence research of climate change and human activities on runoff contribution. Water Resour. Hydropower Northeast. China 2012, 1. Available online: https://en.cnki.com.cn/Article_en/CJFDTotal-DBSL201201001.htm (accessed on 15 November 2021).
  19. Zhang, Y.; Guan, D.; Jin, C.; Wang, A.; Wu, J.; Yuan, F. Impacts of climate change and land use change on runoff of forest catchment in northeast China. Hydrol. Process. 2014, 28, 186–196. [Google Scholar] [CrossRef]
  20. Fossey, M.; Rousseau, A.N.; Savary, S. Assessment of the impact of spatio-temporal attributes of wetlands on stream flows using a hydrological modelling framework: A theoretical case study of a watershed under temperate climatic conditions. Hydrol. Process. 2016, 30, 1768–1781. [Google Scholar] [CrossRef]
  21. Sajikumar, N.; Remya, R.S. Impact of land cover and land use change on runoff characteristics. J. Environ. Manag. 2015, 161, 460–468. [Google Scholar] [CrossRef]
  22. Marhaento, H.; Booij, M.J.; Rientjes, T.H.M.; Hoekstra, A.Y. Attribution of changes in the water balance of a tropical catchment to land use change using the SWAT model. Hydrol. Process. 2017, 31, 2029–2040. [Google Scholar] [CrossRef]
  23. Wagner, P.D.; Waske, B. Importance of spatially distributed hydrologic variables for land use change modeling. Environ. Model. Softw. 2016, 83, 245–254. [Google Scholar] [CrossRef]
  24. Woldesenbet, T.A.; Elagib, N.A.; Ribbe, L.; Heinrich, J. Hydrological responses to land use/cover changes in the source region of the Upper Blue Nile Basin, Ethiopia. Sci. Total Environ. 2017, 575, 724–741. [Google Scholar] [CrossRef] [PubMed]
  25. Xiaolian, S. On hydrological response to land-use/cover change in Luanhe River basin. Adv. Water Sci. 2014, 25, 21–27. [Google Scholar]
  26. Yan, B.; Fang, N.F.; Zhang, P.C.; Shi, Z. Impacts of land use change on watershed streamflow and sediment yield: An assessment using hydrologic modelling and partial least squares regression. J. Hydrol. 2013, 484, 26–37. [Google Scholar] [CrossRef]
  27. Yan, R.; Zhang, X.; Yan, S.; Zhang, J.; Chen, H. Spatial patterns of hydrological responses to land use/cover change in a catchment on the Loess Plateau, China. Ecol. Indic. 2017, 92, 151–160. [Google Scholar] [CrossRef]
  28. Zhang, C.; Zhang, B.; Li, W.; Liu, M. Response of streamflow to climate change and human activity in Xitiaoxi river basin in China. Hydrol. Process. 2014, 28, 43–50. [Google Scholar] [CrossRef]
  29. Ma, X.; Xu, J.; Luo, Y.; Aggarwal, S.P.; Li, J. Response of hydrological processes to land-cover and climate changes in Kejie watershed, south-west China. Hydrol. Process. 2009, 23, 1179–1191. [Google Scholar] [CrossRef]
  30. Tomer, M.D.; Schilling, K.E. A simple approach to distinguish land-use and climate-change effects on watershed hydrology. J. Hydrol. 2009, 376, 24–33. [Google Scholar] [CrossRef]
  31. Hu, Z.; Wang, L.; Wang, Z.; Hong, Y.; Zheng, H. Quantitative assessment of climate and human impacts on surface water resources in a typical semi-arid watershed in the middle reaches of the Yellow River from 1985 to 2006. Int. J. Climatol. 2015, 35, 97–113. [Google Scholar] [CrossRef]
  32. Karlsson, I.B.; Sonnenborg, T.O.; Refsgaard, J.C.; Trolle, D.; Borgesen, C.D.; Olesen, J.E.; Jeppesen, E.; Jensen, K.H. Combined effects of climate models, hydrological model structures and land use scenarios on hydrological impacts of climate change. J. Hydrol. 2016, 535, 301–317. [Google Scholar] [CrossRef]
  33. Marhaento, H.; Booij, M.; Hoekstra, A. Hydrological response to future land-use change and climate change in a tropical catchment. Hydrol. Sci. J. 2018, 63, 1368–1385. [Google Scholar] [CrossRef] [Green Version]
  34. Chung, E.; Park, K.; Lee, K.S. The relative impacts of climate change and urbanization on the hydrological response of a Korean urban watershed. Hydrol. Process. 2011, 25, 544–560. [Google Scholar] [CrossRef]
  35. Daofeng, L.; Ying, T.; Changming, L.; Fanghua, H. Impact of land-cover and climate changes on runoff of the source regions of the Yellow River. J. Geogr. Sci. 2004, 14, 330–338. [Google Scholar] [CrossRef]
  36. Zuo, D.; Xu, Z.; Yao, W.; Jin, S.; Xiao, P.; Ran, D. Assessing the effects of changes in land use and climate on runoff and sediment yields from a watershed in the Loess Plateau of China. Sci. Total Environ. 2016, 544, 238–250. [Google Scholar] [CrossRef]
  37. Wang, Q.; Xu, Y.P.; Xu, Y.; Wu, L.; Wang, Y.F.; Han, L.F. Spatial hydrological responses to land use and land cover changes in a typical catchment of the Yangtze River Delta region. Catena 2018, 170, 305–315. [Google Scholar] [CrossRef]
  38. Zhang, Y.; Liu, S.; Xu, J.; Shangguan, D. Glacier change and glacier runoff variation in the Tuotuo River basin, the source region of Yangtze River in western China. Environ. Geol. 2008, 56, 59–68. [Google Scholar] [CrossRef]
  39. Yao, Z.; Liu, Z.; Huang, H.; Liu, G.; Wu, S. Statistical estimation of the impacts of glaciers and climate change on river runoff in the headwaters of the Yangtze River. Quat. Int. 2014, 336, 89–97. [Google Scholar] [CrossRef]
  40. Dey, P.; Mishra, A. Separating the impacts of climate change and human activities on streamflow: A review of methodologies and critical assumptions. J. Hydrol. 2017, 548, 278–290. [Google Scholar] [CrossRef]
  41. Ahmed, N.; Wang, G.-X.; Oluwafemi, A.; Munir, S.; Hu, Z.-Y.; Shakoor, A.; Imran, M.A. Temperature trends and elevation dependent warming during 1965–2014 in headwaters of Yangtze River, Qinghai Tibetan Plateau. J. Mt. Sci. 2020, 17, 556–571. [Google Scholar] [CrossRef]
  42. Fujita, K.; Ageta, Y. Effect of summer accumulation on glacier mass balance on the Tibetan Plateau revealed by mass-balance model. J. Glaciol. 2000, 46, 244–252. [Google Scholar] [CrossRef] [Green Version]
  43. Wang, G.; Cheng, G. Characteristics of grassland and ecological changes of vegetations in the source regions of Yangtze and Yellow Rivers. J. Desert Res. 2001, 21, 101–107. [Google Scholar]
  44. Dong, S.; Zhou, C.; Wang, H. Ecological crisis and countermeasures of the Three Rivers Headstream Regions. J. Nat. Resour. 2002, 17, 713–720. [Google Scholar]
  45. Yang, J.P.; Ding, Y.J.; Chen, R.S.; Shen, Y.P. Permafrost change and its effect on eco-environment in the source regions of the Yangtze and Yellow Rivers. J. Mt. Sci. 2002, 22, 33–39. [Google Scholar]
  46. Wang, G.; Li, Y.; Wang, Y.; Shen, Y. Impacts of alpine ecosystem and climate changes on surface runoff in the headwaters of the Yangtze River. J. Glaciol. Geocryol. 2007, 29, 159–168. [Google Scholar]
  47. Ahmed, N.; Wang, G.; Booij, M.J.; Xiangyang, S.; Hussain, F.; Nabi, G. Separation of the Impact of Landuse/Landcover Change and Climate Change on Runoff in the Upstream Area of the Yangtze River, China. Water Resour. Manag. 2021, 1–21. [Google Scholar] [CrossRef]
  48. Ahmed, N.; Wang, G.; Booij, M.J.; Oluwafemi, A.; Hashmi, M.Z.; Ali, S.; Munir, S. Climatic Variability and Periodicity for Upstream Sub-Basins of the Yangtze River, China. Water 2020, 12, 842. [Google Scholar] [CrossRef] [Green Version]
  49. Zhao, D.; Wu, S. Projected Changes in Permafrost Active Layer Thickness Over the Qinghai-Tibet Plateau under Climate Change. Water Resour. Res. 2019, 55, 7860–7875. [Google Scholar] [CrossRef]
  50. Sen, Z. Innovative Trend Analysis Methodology. J. Hydrol. Eng. 2012, 17, 1042–1046. [Google Scholar] [CrossRef]
  51. Gedefaw, M.; Yan, D.; Wang, H.; Qin, T.; Girma, A.; Abiyu, A.; Batsuren, D. Innovative Trend Analysis of Annual and Seasonal Rainfall Variability in Amhara Regional State, Ethiopia. Atmosphere 2018, 9, 326. [Google Scholar] [CrossRef] [Green Version]
  52. Tosunoglu, F. Trend analyses of turkish euphrates basin streamflow by innovative sen’s trend method and traditional mann-kendall test. Fresenius Environ. Bull. 2018, 27, 446–458. [Google Scholar]
  53. Li, J.; Wu, W.; Ye, X.; Jiang, H.; Gan, R.; Wu, H.; He, J.; Jiang, Y. Innovative trend analysis of main agriculture natural hazards in China during 1989-2014. Nat. Hazards 2019, 95, 677–720. [Google Scholar] [CrossRef]
  54. Girma, A.; Qin, T.; Hao, W.; Yan, D.; Gedefaw, M.; Abiyu, A.; Dorjsuren, B. Study on Recent Trends of Climate Variability Using Innovative Trend Analysis: The Case of the upper Huai River Basin. Pol. J. Environ. Stud. 2020, 29, 2199–2210. [Google Scholar] [CrossRef]
  55. Wang, Y.; Xu, Y.; Tabari, H.; Wang, J.; Wang, Q.; Song, S.; Hu, Z. Innovative trend analysis of annual and seasonal rainfall in the Yangtze River Delta, eastern China. Atmos. Res. 2020, 231, 104673. [Google Scholar] [CrossRef]
  56. Şen, Z. Innovative Trend Analyses. In Innovative Trend Methodologies in Science and Engineering; Springer International Publishing: Cham, Germany, 2017; pp. 175–226. [Google Scholar]
  57. Guclu, Y.S. Comments on “Comparison of Mann-Kendall and innovative trend method for water quality parameters of the Kizilirmak River, Turkey (Kisi and Ay, 2014)” and “An innovative method for trend analysis of monthly pan evaporations (Kisi, 2015)”. J. Hydrol. 2016, 538, 878–882. [Google Scholar] [CrossRef]
  58. Phuong, D.N.D.; Tram, V.N.Q.; Nhat, T.T.; Ly, T.D.; Loi, N.K. Hydro-meteorological trend analysis using the Mann-Kendall and innovative-Sen methodologies: A case study. Int. J. Glob. Warm. 2020, 20, 145–164. [Google Scholar] [CrossRef]
  59. Cui, L.; Wang, L.; Lai, Z.; Tian, Q.; Liu, W.; Li, J. Innovative trend analysis of annual and seasonal air temperature and rainfall in the Yangtze River Basin, China during 1960–2015. J. Atmos. Sol. Terr. Phys. 2017, 164, 48–59. [Google Scholar] [CrossRef]
  60. Wu, H.; Qian, H. Innovative trend analysis of annual and seasonal rainfall and extreme values in Shaanxi, China, since the 1950s. Int. J. Climatol. 2017, 37, 2582–2592. [Google Scholar] [CrossRef]
  61. Zhou, Z.; Wang, L.; Lin, A.; Zhang, M.; Niu, Z. Innovative trend analysis of solar radiation in China during 1962–2015. Renew. Energy 2018, 119, 675–689. [Google Scholar] [CrossRef]
  62. Arnold, J.G.; Fohrer, N. SWAT2000: Current capabilities and research opportunities in applied watershed modelling. Hydrol. Process. 2005, 19, 563–572. [Google Scholar] [CrossRef]
  63. Abbas, S.A.; Xuan, Y.Q. Development of a New Quantile-Based Method for the Assessment of Regional Water Resources in a Highly-Regulated River Basin. Water Resour. Manag. 2019, 33, 3187–3210. [Google Scholar] [CrossRef] [Green Version]
  64. Oliveira, V.A.; de Mello, C.R.; Beskow, S.; Viola, M.R.; Srinivasan, R. Modeling the effects of climate change on hydrology and sediment load in a headwater basin in the Brazilian Cerrado biome. Ecol. Eng. 2019, 133, 20–31. [Google Scholar] [CrossRef]
  65. Jin, X.; Jin, Y.X.; Mao, X.F. Land Use/Cover Change Effects on River Basin Hydrological Processes Based on a Modified Soil and Water Assessment Tool: A Case Study of the Heihe River Basin in Northwest China’s Arid Region. Sustainability 2019, 11, 1072. [Google Scholar] [CrossRef] [Green Version]
  66. Jin, X.; Jin, Y.X.; Yuan, D.H.; Mao, X.F. Effects of land-use data resolution on hydrologic modelling, a case study in the upper reach of the Heihe River, Northwest China. Ecol. Model. 2019, 404, 61–68. [Google Scholar] [CrossRef]
  67. Li, F.P.; Zhang, G.X.; Li, H.Y.; Lu, W.X. Land Use Change Impacts on Hydrology in the Nenjiang River Basin, Northeast China. Forests 2019, 10, 476. [Google Scholar] [CrossRef] [Green Version]
  68. Arnold, J.G.; Srinivasan, R.; Muttiah, R.S.; Williams, J.R. Large area hydrologic modeling and assessment part I: Model development 1. JAWRA J. Am. Water Resour. Assoc. 1998, 34, 73–89. [Google Scholar] [CrossRef]
  69. Abbaspour, K.C.; Yang, J.; Maximov, I.; Siber, R.; Bogner, K.; Mieleitner, J.; Zobrist, J.; Srinivasan, R. Modelling hydrology and water quality in the pre-alpine/alpine Thur watershed using SWAT. J. Hydrol. 2007, 333, 413–430. [Google Scholar] [CrossRef]
  70. Zhang, L.M.; Meng, X.Y.; Wang, H.; Yang, M.X. Simulated Runoff and Sediment Yield Responses to Land-Use Change Using the SWAT Model in Northeast China. Water 2019, 11, 915. [Google Scholar] [CrossRef] [Green Version]
  71. Abbaspour, K.C.; Rouholahnejad, E.; Vaghefi, S.; Srinivasan, R.; Yang, H.; Kløve, B. A continental-scale hydrology and water quality model for Europe: Calibration and uncertainty of a high-resolution large-scale SWAT model. J. Hydrol. 2015, 524, 733–752. [Google Scholar] [CrossRef] [Green Version]
  72. Moriasi, D.N.; Arnold, J.G.; Van Liew, M.W.; Bingner, R.L.; Harmel, R.D.; Veith, T.L. Model Evaluation Guidelines for Systematic Quantification of Accuracy in Watershed Simulations. Trans. ASABE 2007, 50, 885–900. [Google Scholar] [CrossRef]
  73. Zhang, X.; Zhang, L.; Zhao, J.; Rustomji, P.; Hairsine, P. Responses of streamflow to changes in climate and land use/cover in the Loess Plateau, China. Water Resour. Res. 2008, 44. [Google Scholar] [CrossRef]
  74. Yang, L.; Feng, Q.; Yin, Z.; Wen, X.; Si, J.; Li, C.; Deo, R.C. Identifying separate impacts of climate and land use/cover change on hydrological processes in upper stream of Heihe River, Northwest China. Hydrol. Process. 2017, 31, 1100–1112. [Google Scholar] [CrossRef]
  75. Adeyeri, O.E.; Laux, P.; Lawin, A.E.; Ige, S.O.; Kunstmann, H. Analysis of hydrometeorological variables over the transboundary Komadugu-Yobe basin, West Africa. J. Water Clim. Chang. 2019, 11, 1339–1354. [Google Scholar] [CrossRef]
  76. Adeyeri, O.E.; Laux, P.; Arnault, J.; Lawin, A.E.; Kunstmann, H. Conceptual hydrological model calibration using multi-objective optimization techniques over the transboundary Komadugu-Yobe basin, Lake Chad Area, West Africa. J. Hydrol. Reg. Stud. 2020, 27, 100655. [Google Scholar] [CrossRef]
  77. Trenberth, K.E.; Shea, D.J. Relationships between precipitation and surface temperature. Geophys. Res. Lett. 2005, 32. [Google Scholar] [CrossRef]
  78. Berg, P.; Haerter, J.; Thejll, P.; Piani, C.; Hagemann, S.; Christensen, J. Seasonal characteristics of the relationship between daily precipitation intensity and surface temperature. J. Geophys. Res. Atmos. 2009, 114. [Google Scholar] [CrossRef]
  79. Guo, Y.; Li, Z.; Amo-Boateng, M.; Deng, P.; Huang, P. Quantitative assessment of the impact of climate variability and human activities on runoff changes for the upper reaches of Weihe River. Stoch. Environ. Res. Risk Assess. 2014, 28, 333–346. [Google Scholar] [CrossRef]
  80. Li, J.; Liu, D.; Wang, T.; Li, Y.; Wang, S.; Yang, Y.; Wang, X.; Guo, H.; Peng, S.; Ding, J. Grassland restoration reduces water yield in the headstream region of Yangtze River. Sci. Rep. 2017, 7, 2162. [Google Scholar] [CrossRef]
  81. Nie, N.; Zhang, W.; Liu, M.; Chen, H.; Zhao, D. Separating the impacts of climate variability, land-use change and large reservoir operations on streamflow in the Yangtze River basin, China, using a hydrological modeling approach. Int. J. Digit. Earth 2020, 14, 1–19. [Google Scholar] [CrossRef]
  82. Zhang, Y.; Guan, D.; Jin, C.; Wang, A.; Wu, J.; Yuan, F. Analysis of impacts of climate variability and human activity on streamflow for a river basin in northeast China. J. Hydrol. 2011, 410, 239–247. [Google Scholar] [CrossRef]
  83. Zhang, L.; Nan, Z.; Yu, W.; Ge, Y. Modeling land-use and land-cover change and hydrological responses under consistent climate change scenarios in the Heihe River Basin, China. Water Resour. Manag. 2015, 29, 4701–4717. [Google Scholar] [CrossRef]
  84. Yin, Z.; Feng, Q.; Zou, S.; Yang, L. Assessing variation in water balance components in mountainous inland river basin experiencing climate change. Water 2016, 8, 472. [Google Scholar] [CrossRef] [Green Version]
  85. Zhang, A.; Liu, W.; Yin, Z.; Fu, G.; Zheng, C. How will climate change affect the water availability in the Heihe River Basin, Northwest China? J. Hydrometeorol. 2016, 17, 1517–1542. [Google Scholar] [CrossRef]
  86. Zhang, L.; Nan, Z.; Xu, Y.; Li, S. Hydrological impacts of land use change and climate variability in the headwater region of the Heihe River Basin, Northwest China. PLoS ONE 2016, 11, e0158394. [Google Scholar] [CrossRef] [PubMed] [Green Version]
  87. Wang, X. Advances in separating effects of climate variability and human activity on stream discharge: An overview. Adv. Water Resour. 2014, 71, 209–218. [Google Scholar] [CrossRef]
  88. Arnold, J.G.; Moriasi, D.N.; Gassman, P.W.; Abbaspour, K.C.; White, M.J.; Srinivasan, R.; Santhi, C.; Harmel, R.; van Griensven, A.; Van Liew, M.W. SWAT: Model use, calibration, and validation. Trans. ASABE 2012, 55, 1491–1508. [Google Scholar] [CrossRef]
  89. Omer, A.; Wang, W.; Basheer, A.K.; Yong, B. Integrated assessment of the impacts of climate variability and anthropogenic activities on river runoff: A case study in the Hutuo River Basin, China. Hydrol. Res. 2017, 48, 416–430. [Google Scholar] [CrossRef] [Green Version]
  90. Ma, X.; Lu, X.; van Noordwijk, M.; Li, J.; Xu, J. Attribution of climate change, vegetation restoration, and engineering measures to the reduction of suspended sediment in the Kejie catchment, southwest China. Hydrol. Earth Syst. Sci. 2014, 18, 1979. [Google Scholar] [CrossRef] [Green Version]
  91. Ott, B.; Uhlenbrook, S. Quantifying the impact of land-use changes at the event and seasonal time scale using a process-oriented catchment model. Hydrol. Earth Syst. Sci. 2004, 8, 62–78. [Google Scholar] [CrossRef] [Green Version]
Figure 1. The Yangtze River Source Region (YRSR) with hydrological and meteorological stations.
Water 14 00259 g001
Figure 2. A generalized illustration of innovative trend analysis showing different trends of any given time series.
Water 14 00259 g002
Figure 3. Schematic diagram for the quantification of impacts of climate change (a) and land-cover change (b) streamflow. C1, C2, L1, and L2 are climate and land cover, while 1 and 2 are different periods. ΔC and ΔL are climate change, and land-cover change in two periods. The hydrological components (i.e., streamflow or evapotranspiration) value at point A, B, C, and D are Q C 1 L 1 , Q C 1 L 2 , Q C 2 L 2 , and Q C 2 L 1 , respectively, modified from [74].
Water 14 00259 g003
Figure 4. Flowchart for estimation of attribution of changes in streamflow to climate change and land-cover change.
Water 14 00259 g004
Figure 5. Innovative trend analysis (ITA) results for annual mean temperature, precipitation and streamflow during 1961–2016.
Water 14 00259 g005
Figure 6. Monthly graphical representation of ITA results for mean temperature time series (1961–2016).
Water 14 00259 g006
Figure 7. Monthly graphical representation of ITA results for precipitation time series (1961–2016).
Water 14 00259 g007
Figure 8. Mean monthly graphical representation of ITA results for streamflow at the Zhimenda hydrological station (1961–2016).
Water 14 00259 g008
Figure 9. Monthly correlation plots of precipitation, temperature, and streamflow during 1961–2016 in the Yangtze River Source Region. The asterisk (*) sign shows the significance at 95% confidence level (p < 0.05).
Water 14 00259 g009
Figure 10. Percentage of area coverage by each land cover from 1985 to 2015 in the YRSR.
Water 14 00259 g010
Figure 11. Area difference (km2) of each land cover from 1985–2015 in the YRSR.
Water 14 00259 g011
Figure 12. Spatial distribution of land-cover types during 1985 to 2015 in the YRSR.
Water 14 00259 g012
Figure 13. Calibration period 1964–1989 (light yellow background) and validation period 1990–2016 for land cover/land use of 1985 (a), 1990 (b), 1995 (c), 2000 (d), 2005 (e), 2010 (f) and 2015 (g).
Water 14 00259 g013
Table 1. Hypothetical scenarios for attribution of streamflow changes to climate change and land-cover change.
LC (1985, 1990)
CC (1964–1989, 1990–2016)
LC (2000, 2005),
CC (1964–1989, 1990–2016)
ScenariosLCLUClimateScenariosLCLUClimate
s1985-c119851964–1989s2000-c120001964–1989
s1990-c119901964–1989s2005-c120051964–1989
s1985-c219851990–2016s2000-c220001990–2016
s1990-c219901990–2016s2005-c220051990–2016
LC (1990, 1995)
CC (1964–1989, 1990–2016)
LC (2005, 2010)
CC (1964–1989, 1990–2016)
ScenariosLCLUClimateScenariosLCLUClimate
s1990-c119901964–1989s2005-c120051964–1989
s1995-c119951964–1989s2010-c120101964–1989
s1990-c219901990–2016s2005-c220051990–2016
s1995-c219951990–2016s2010-c220101990–2016
LC (1995, 2000)
CC (1964–1989, 1990–2016)
LC (2010, 2015)
CC (1964–1989, 1990–2016)
ScenariosLCLUClimateScenariosLCLUClimate
s1995-c119951964–1989s2010-c120101964–1989
s2000-c120001964–1989s2015-c120151964–1989
s1995-c219951990–2016s2010-c220101990–2016
s2000-c220001990–2016s2015-c220151990–2016
Table 2. Annual and monthly slopes per decade using ITA test for mean temperature, precipitation and streamflow time series.
Annual and Monthly ScaleMeanTemperature (°C)Precipitation (mm)Streamflow(mm)
Annually0.410.60.23
Jan0.60.20.008
Feb0.50.20.013
Mar0.30.30.016
Apr00.40.02
May0.12.40.038
Jun0.14.10.38
Jul0.3−1.6−0.02
Aug0.30.70.35
Sep0.40.40.07
Oct0.4−0.30.18
Nov0.70.10.08
Dec0.8−0.10.01
Table 3. Annual Pearson correlation between precipitation, temperature and streamflow during 1961–2016 (bold values show the significance at 95%).
VariablesPrecipitationMean TemperatureStreamflow
Precipitation1
Mean Temperature0.311
Streamflow0.790.251
Table 4. Nash-Sutcliffe efficiency (NSE) values for each land-cover LCC map, calibration, and validation period.
Nash-Sutcliffe Efficiency Values for Each Land Cover
Climate Data1985199019952000200520102015
Cali.1964–19890.82------
Vali.1990–20160.840.800.850.930.930.930.93
Vali.1964–1989 0.870.910.930.930.930.93
Table 5. Quantification of attribution of streamflow changes due to climate change and land-cover change for all scenarios using 1985, 1990, 1995, 2000, 2005, 2010 and 2015 land-cover data sets.
LCC1985–1990
SCENARIOSClimateLand Cover Change (LCC)Precipitation (mm)Runoff (mm) Runoff Change (%)ET
(mm)
Runoff Change (%)
S11964–19891985324.455.9 273.7
S21964–19891990335.769.6ΔQc11.454.8270.6ΔQc7.9120.1
S31990–20161985346.271.6ΔQL9.445.2279.8ΔQL−1.3−20.1
S41990–20161990352.576.6ΔQ20.7100280.3ΔQ6.6100
LCC1990–1995
SCENARIOSClimateLCCPrecipitation (mm)Runoff (mm) Runoff Change (%)ET (mm) Runoff Change (%)
S11964–19891990335.769.6 270.6
S21964–19891995335.778.2ΔQc6.4544.5263.5ΔQc10308.2
S31990–20161990352.576.6ΔQL8.0555.5280.3ΔQL−6.8−208.2
S41990–20161995352.584.1ΔQ14.5100273.8ΔQ3.3100
LCC1995–2000
SCENARIOSClimateLCCPrecipitation (mm)Runoff (mm) Runoff Change (%)ET
(mm)
Runoff Change (%)
S11964–19891995335.778.2 263.5
S21964–19892000335.778.5ΔQc5.995.1260.7ΔQc−8346.3
S31990–20161995352.584.1ΔQL0.34.9273.8ΔQL−96.153.7
S41990–20162000352.584.4ΔQ6.210084.4ΔQ−179.1100
LCC2000–2005
SCENARIOSClimateLCCPrecipitation (mm)Runoff (mm) Runoff Change (%)ET (mm) Runoff Change (%)
S11964–19892000335.778.5 260.7
S21964–19892005335.778.5ΔQc5.999.7260.7ΔQc10.6100.2
S31990–20162000352.584.4ΔQL00.3271.2ΔQL−0.1−0.2
S41990–20162005352.584.4ΔQ6100271.2ΔQ10.5100
LCC2005–2010
SCENARIOSClimateLCCPrecipitation (mm)Runoff (mm) Runoff Change (%)ET (mm) Runoff Change (%)
S11964–19892005335.778.5 260.7
S21964–19892010335.778.5ΔQc5.9100260.7ΔQc10.6100
S31990–20162005352.584.4ΔQL00271.2ΔQL0.00
S41990–20162010352.584.4ΔQ5.9100271.2ΔQ10.6100
LCC2010–2015
SCENARIOSClimateLCCPrecipitation (mm)Runoff (mm) Runoff Change (%)ET (mm) Runoff Change (%)
S11964–19892010335.778.5 260.7
S21964–19892015335.778.4ΔQc5.9100.7260.9ΔQc10.697.5
S31990–20162010352.584.4ΔQL0−0.7271.2ΔQL0.32.5
S41990–20162015352.584.4ΔQ5.9100271.5ΔQ10.9100
Publisher’s Note: MDPI stays neutral with regard to jurisdictional claims in published maps and institutional affiliations.

