
Multivariate Dam-Site Flood Frequency Analysis of the Three Gorges Reservoir Considering Future Reservoir Regulation and Precipitation


Abstract
:1. Introduction
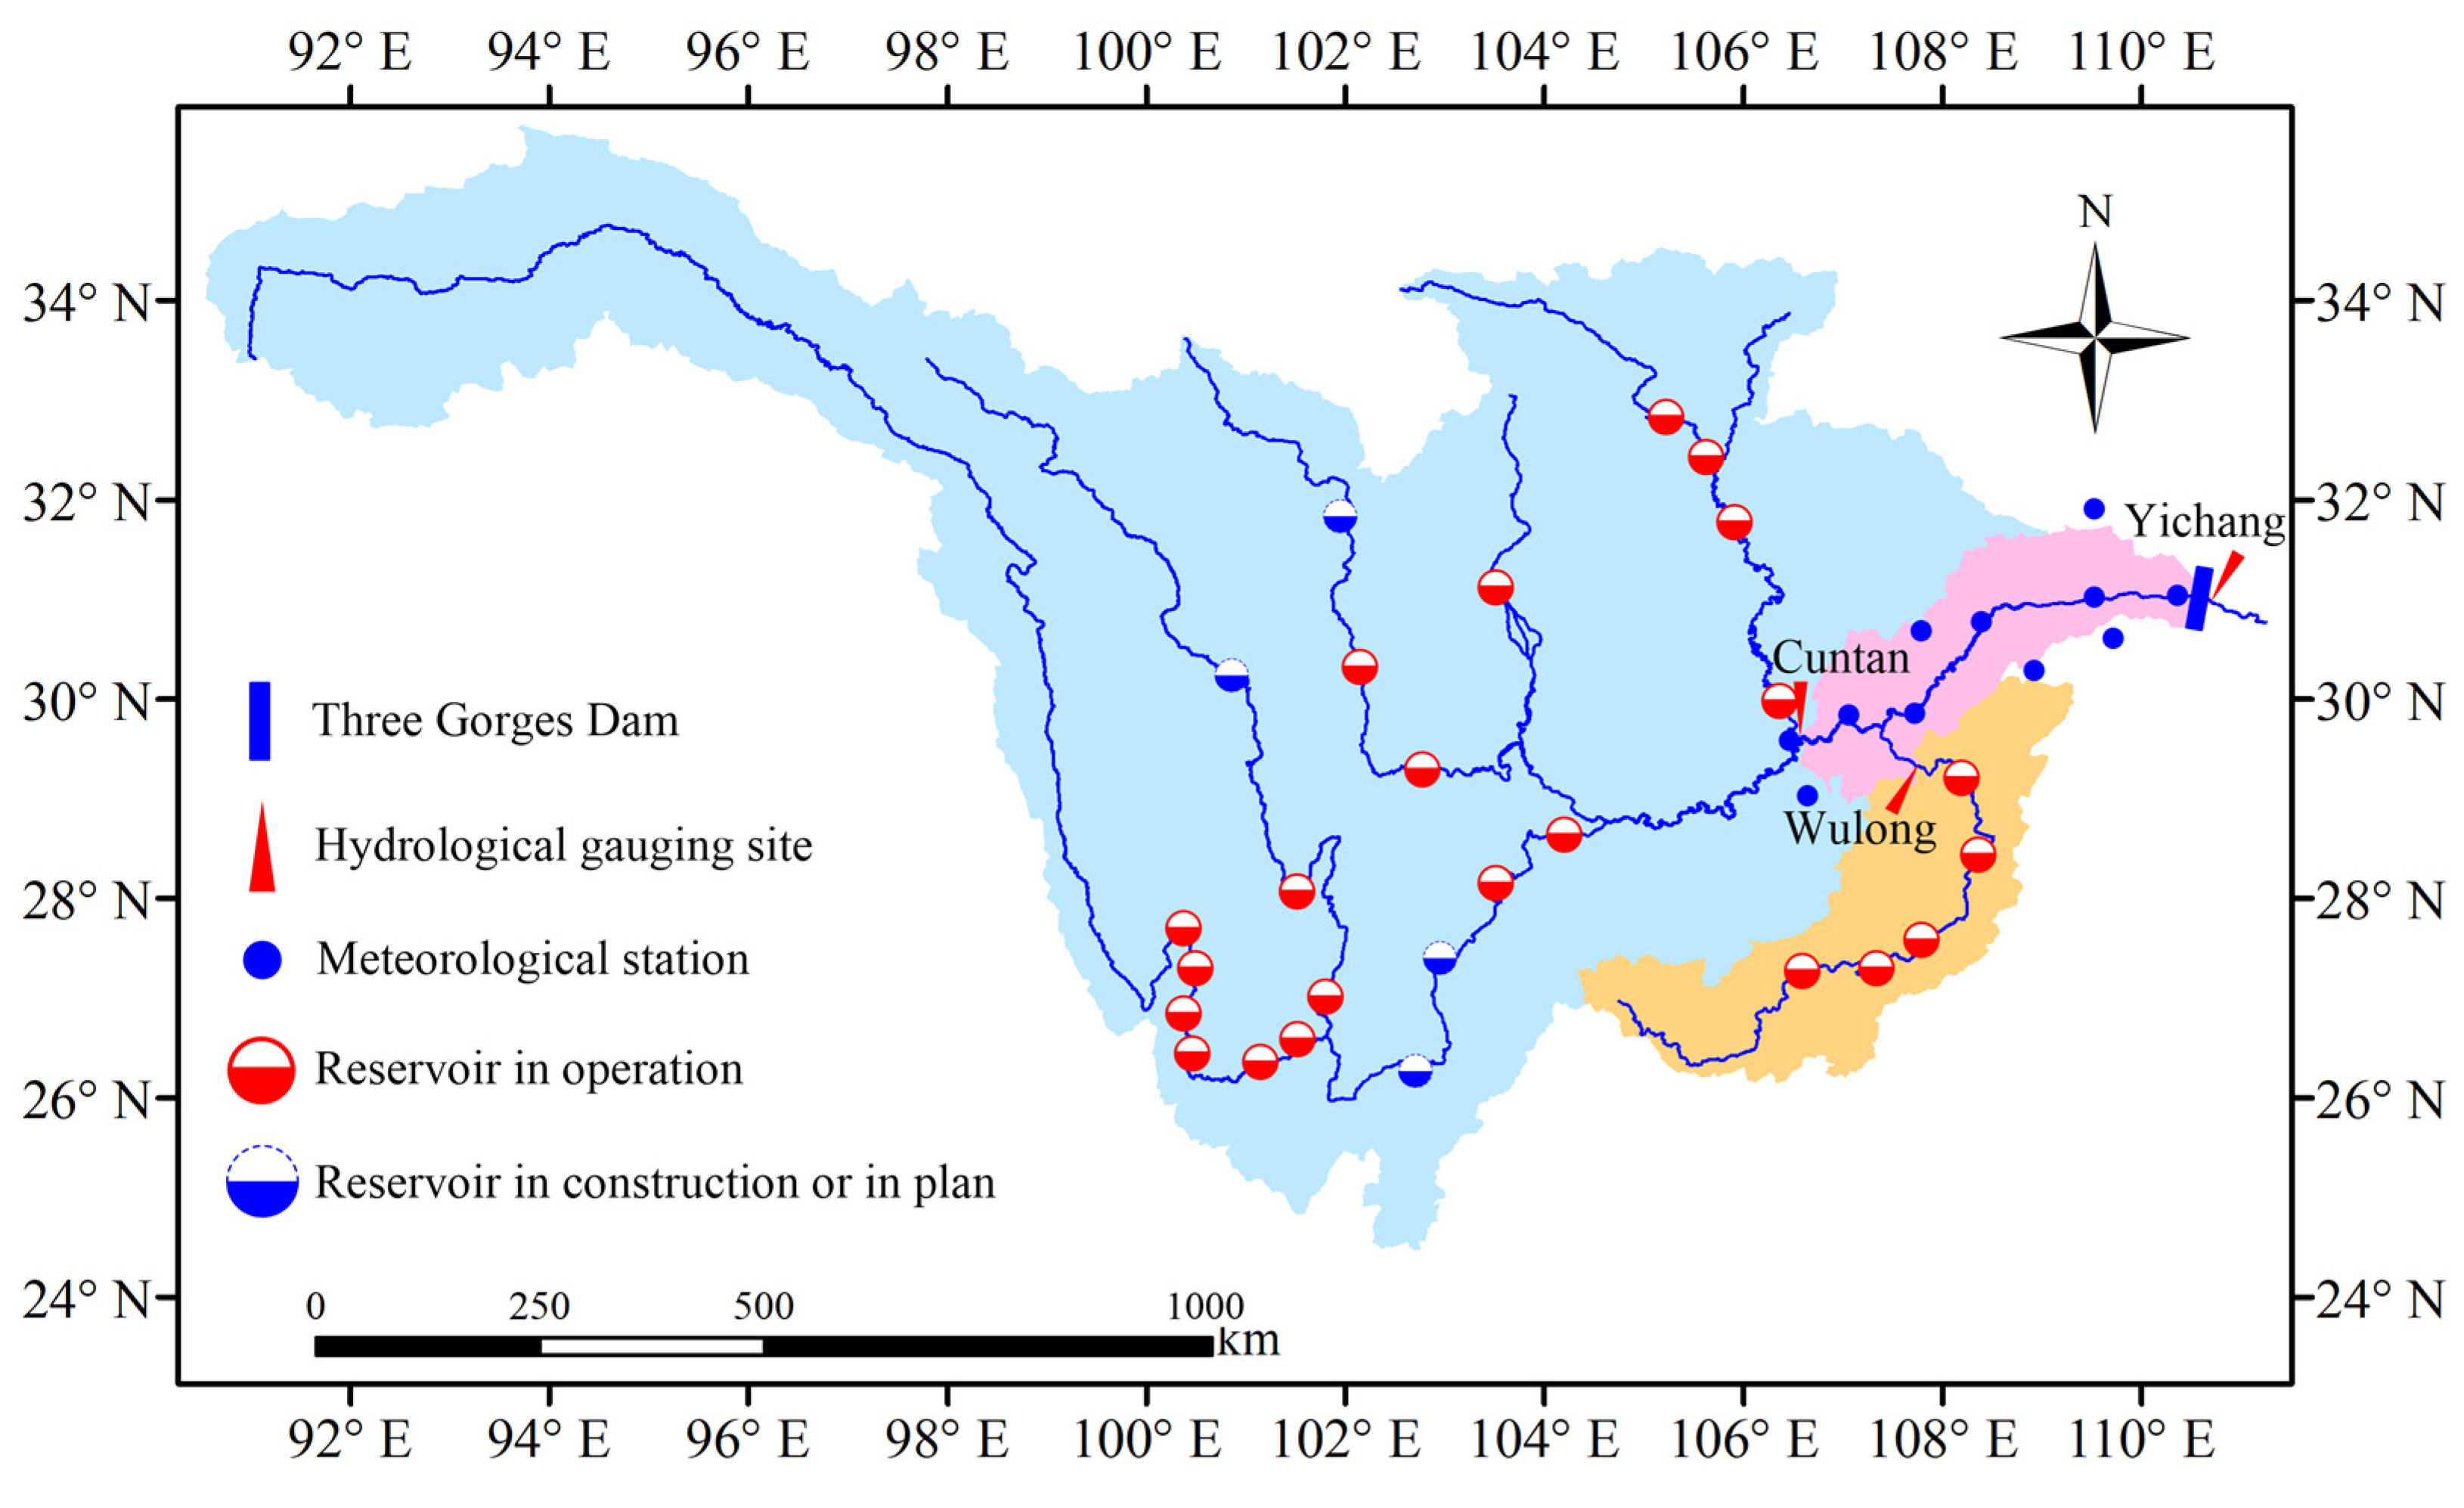
2. Study Region and Dataset
3. Methods
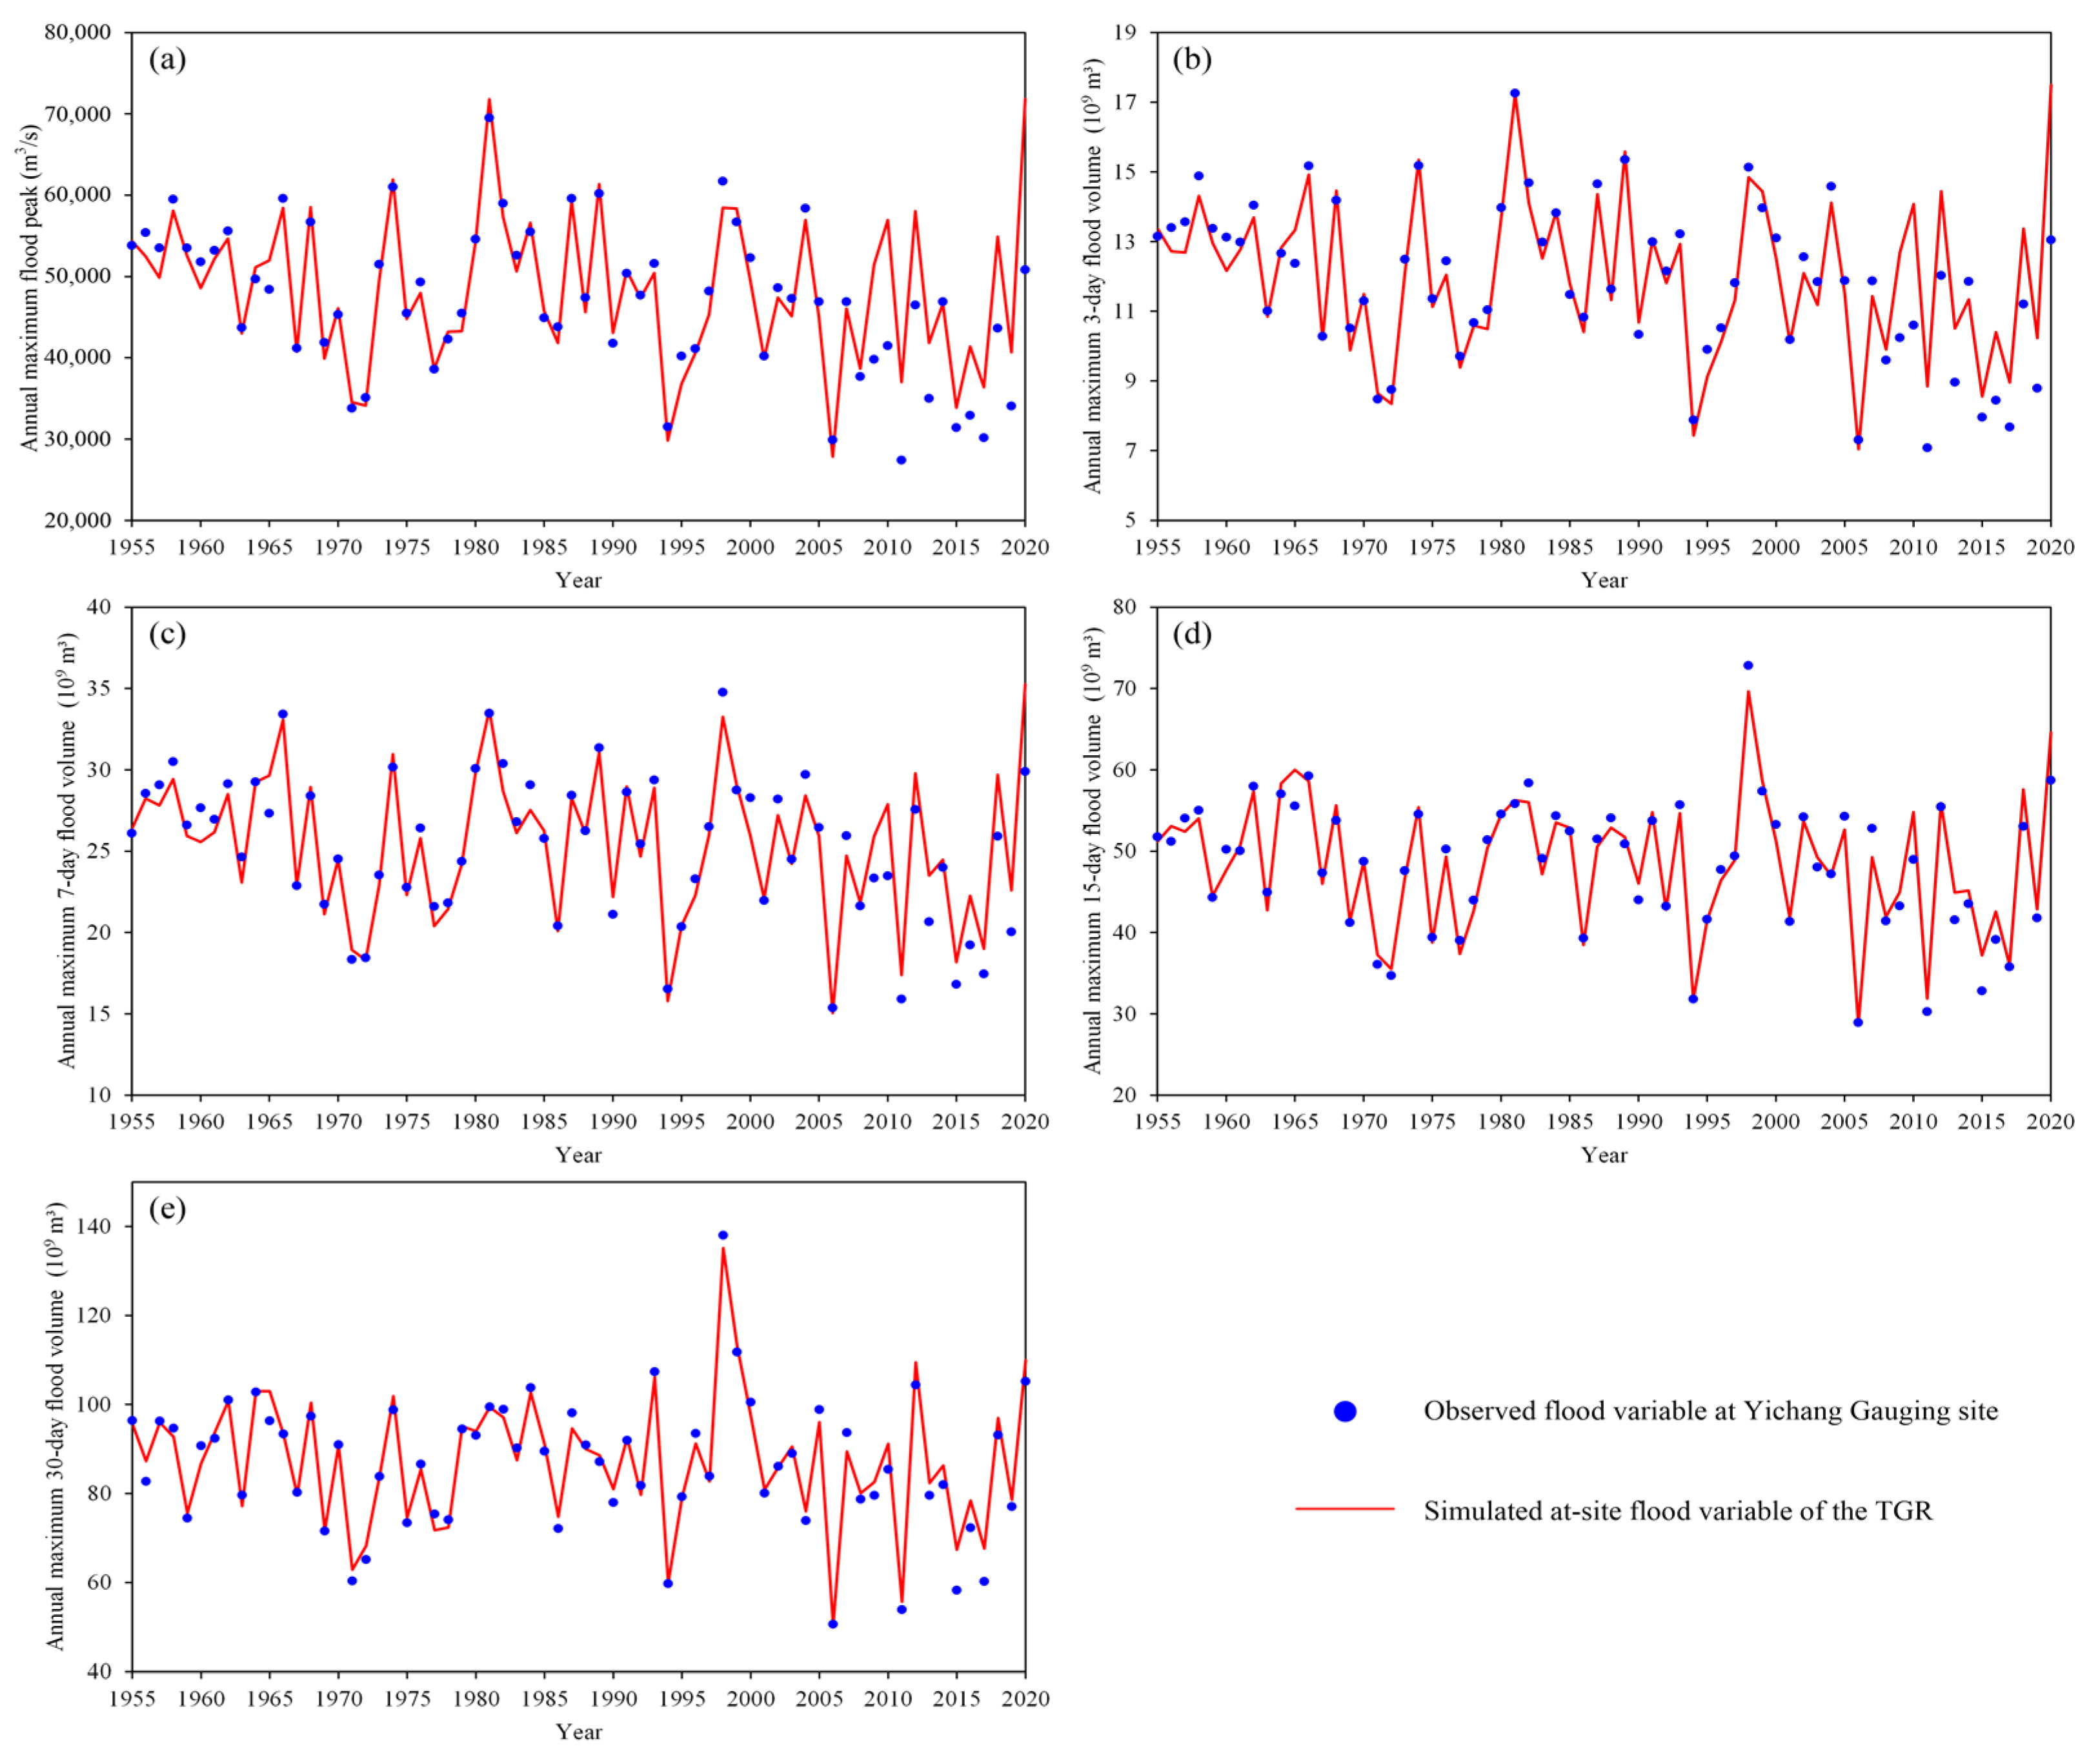
3.1. Reconstruction of the Dam-Site Floods of the TGR
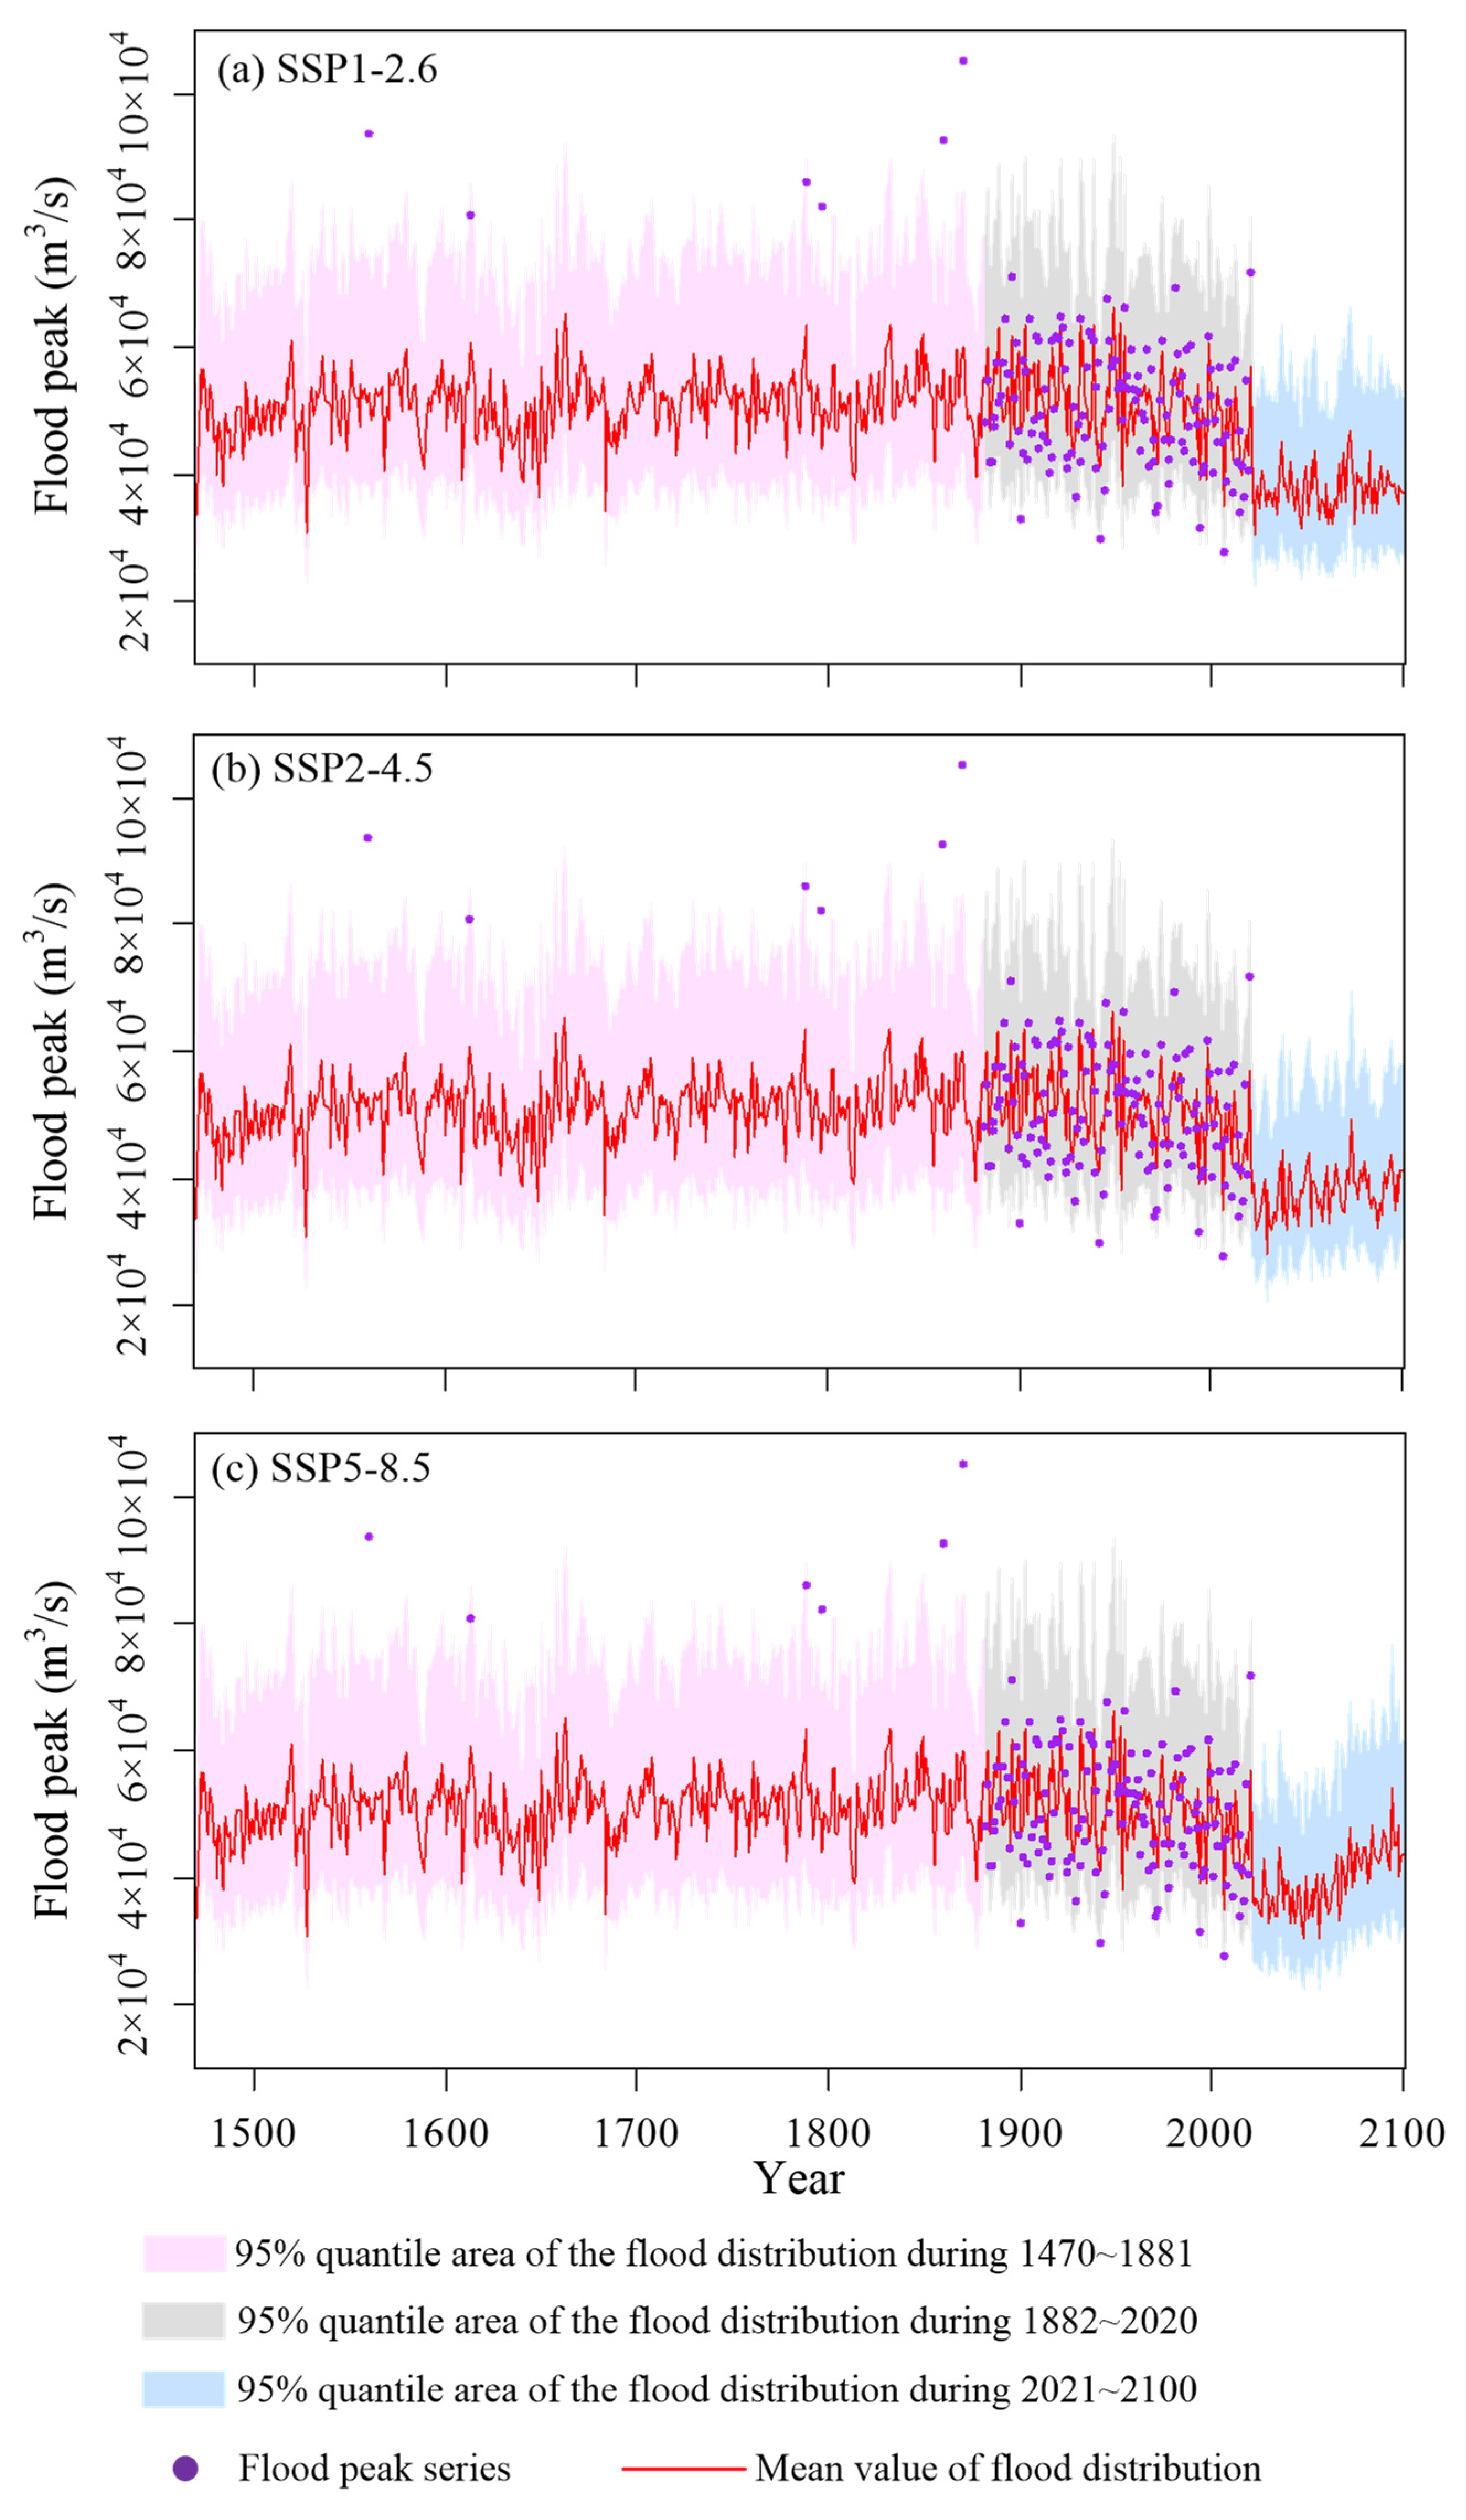
3.2. Time-Varying Multivariate Flood Distribution
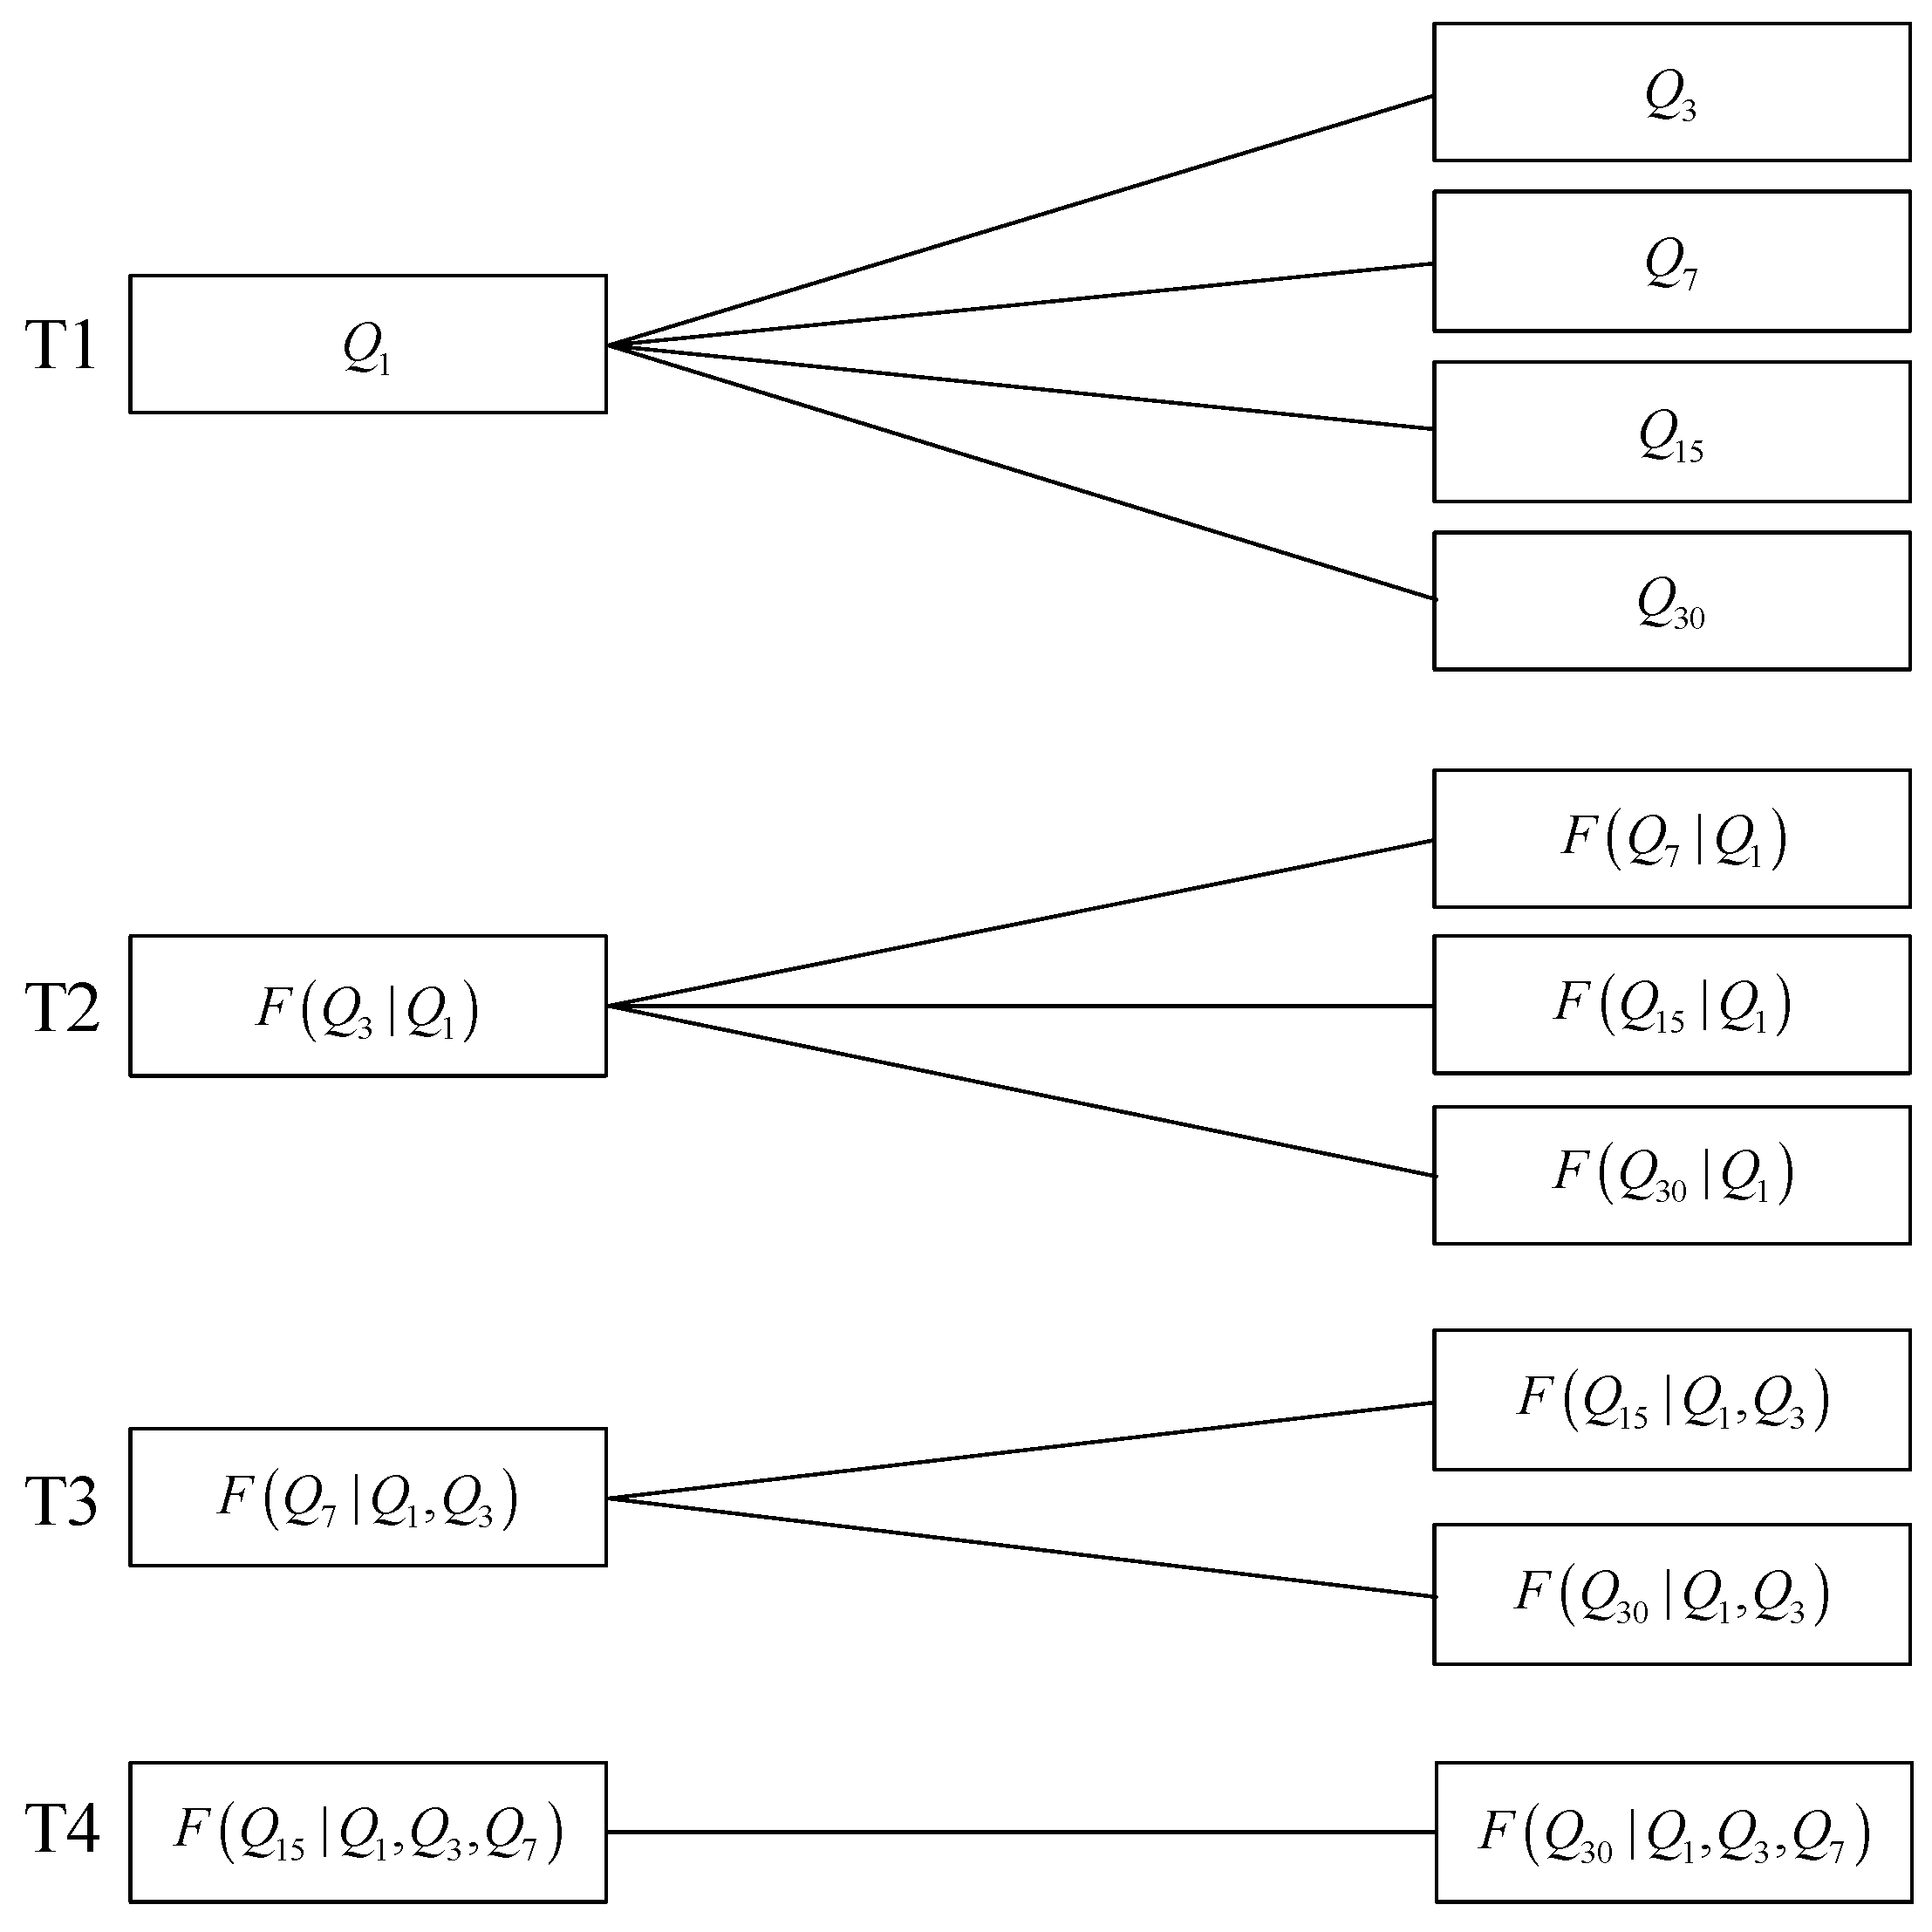
3.3. Construction of Multivariate Flood Distribution Using Vine Copula
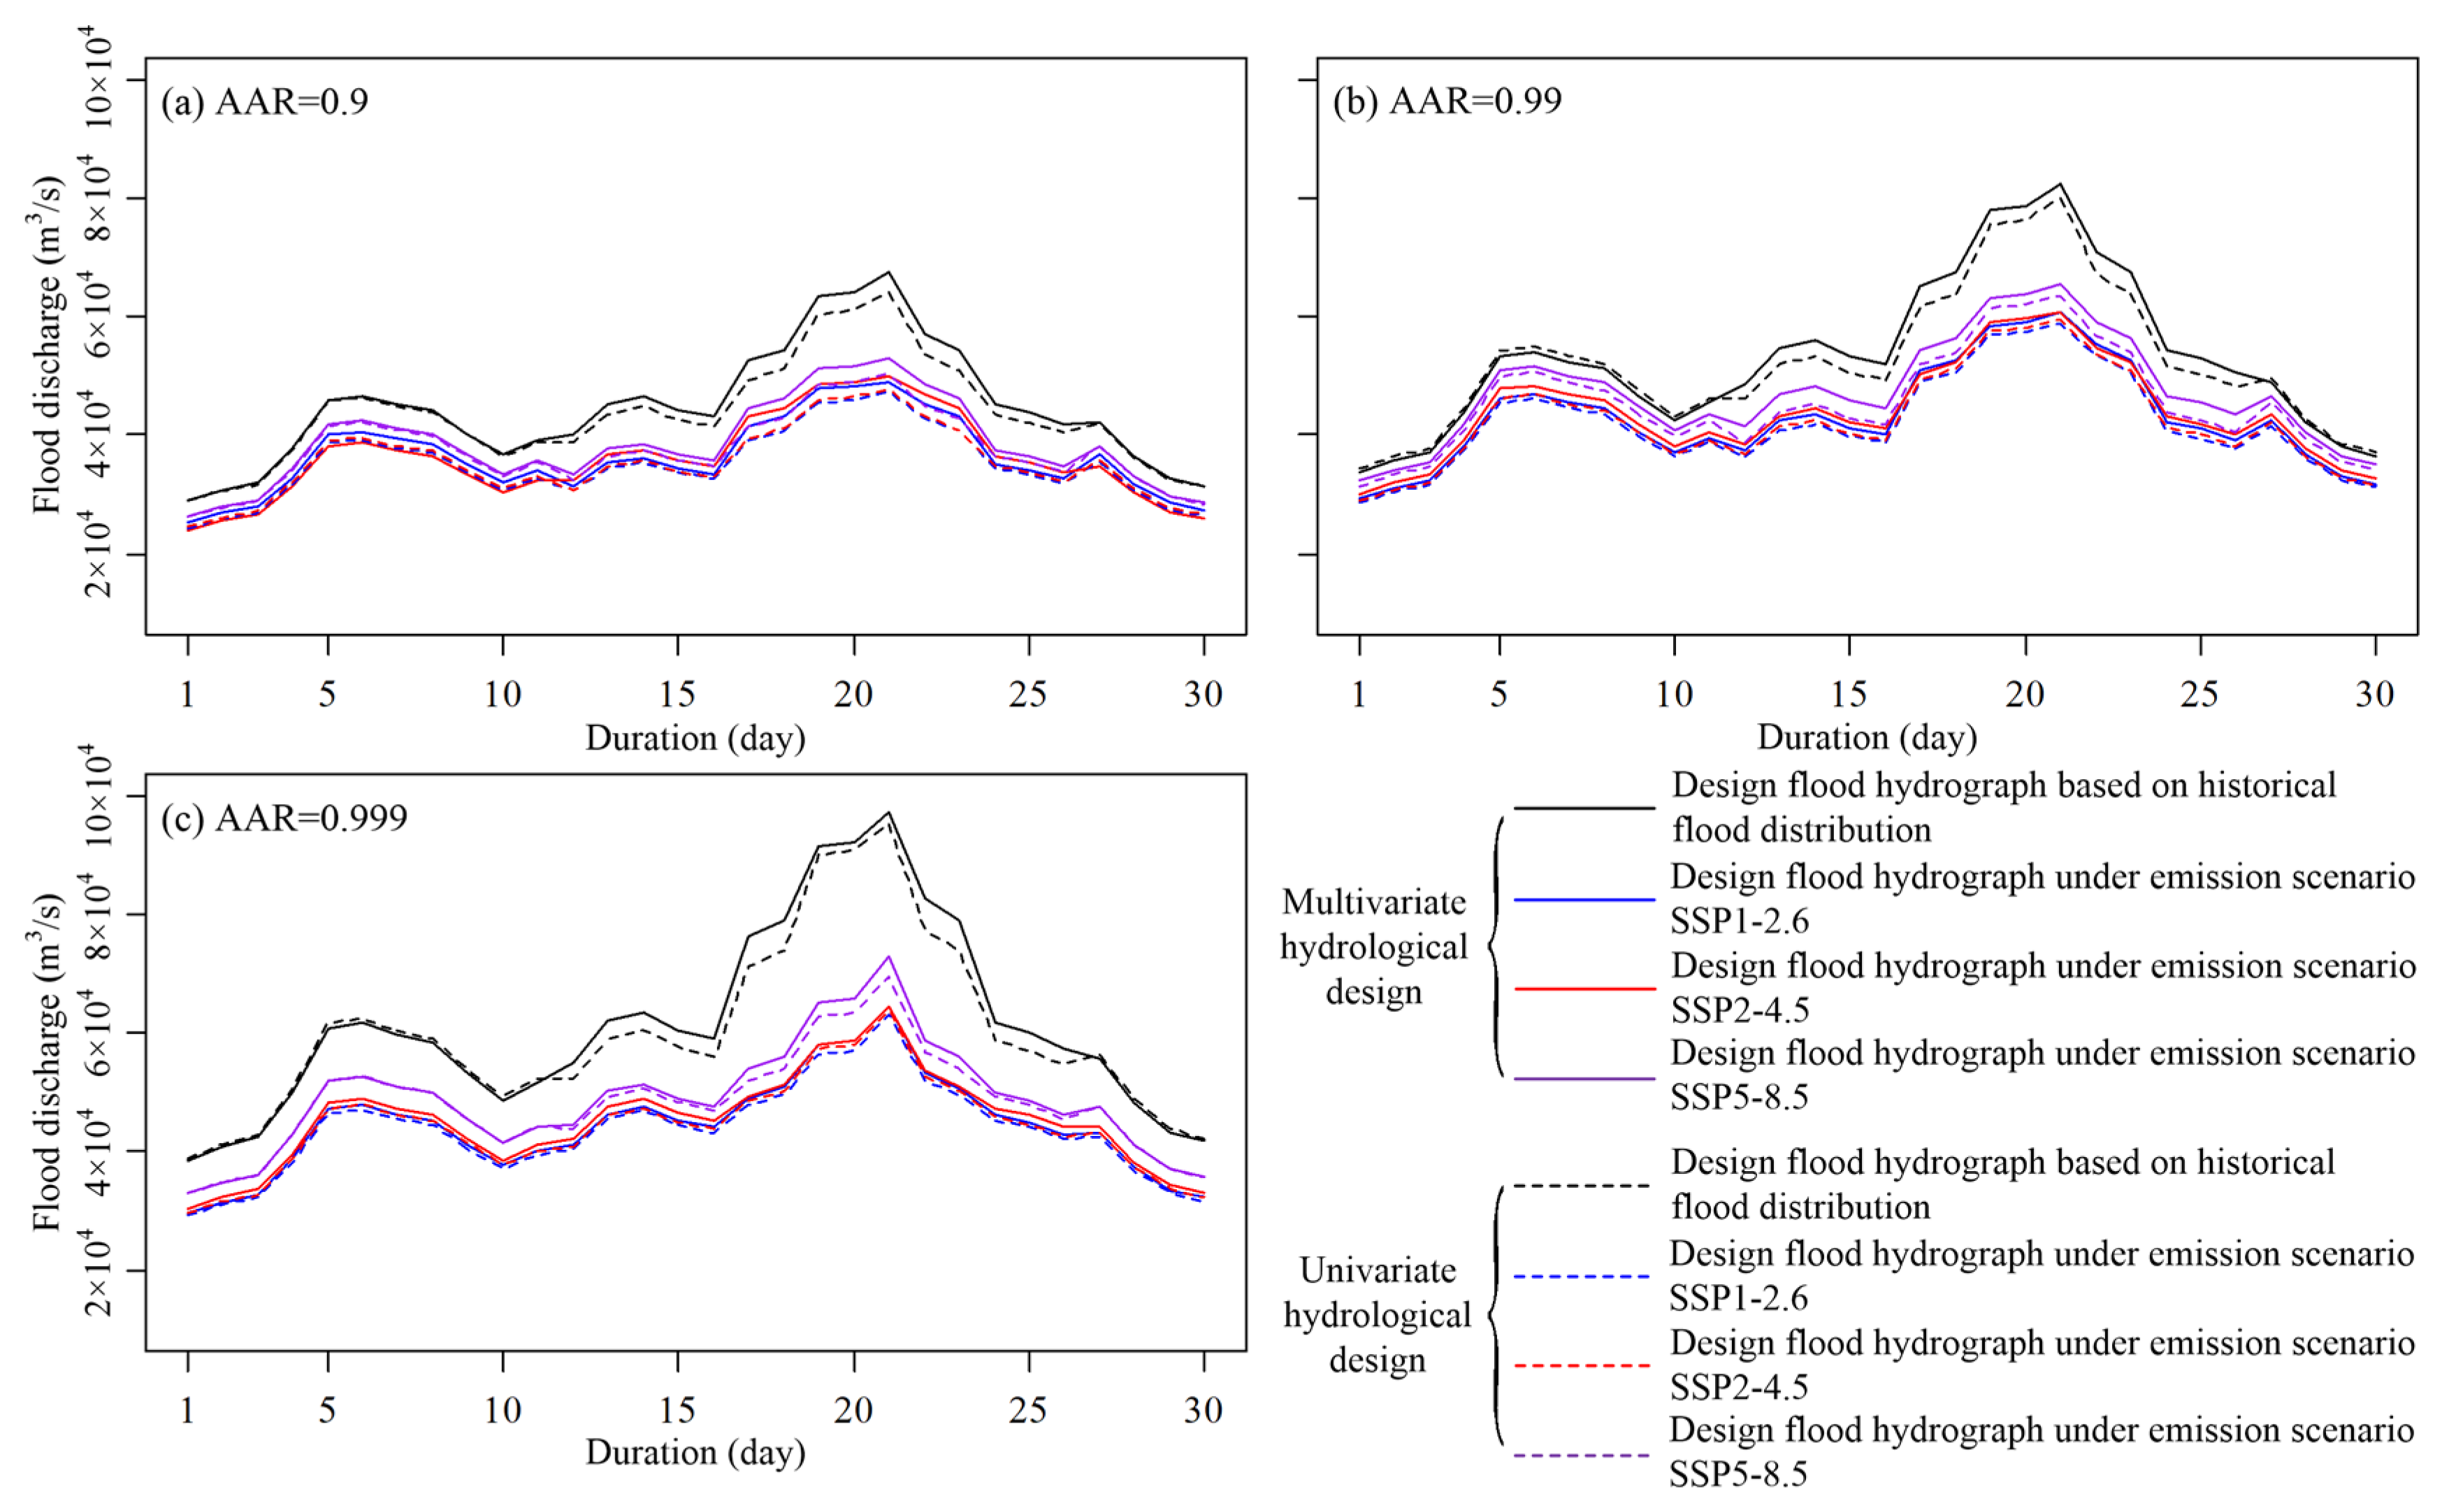
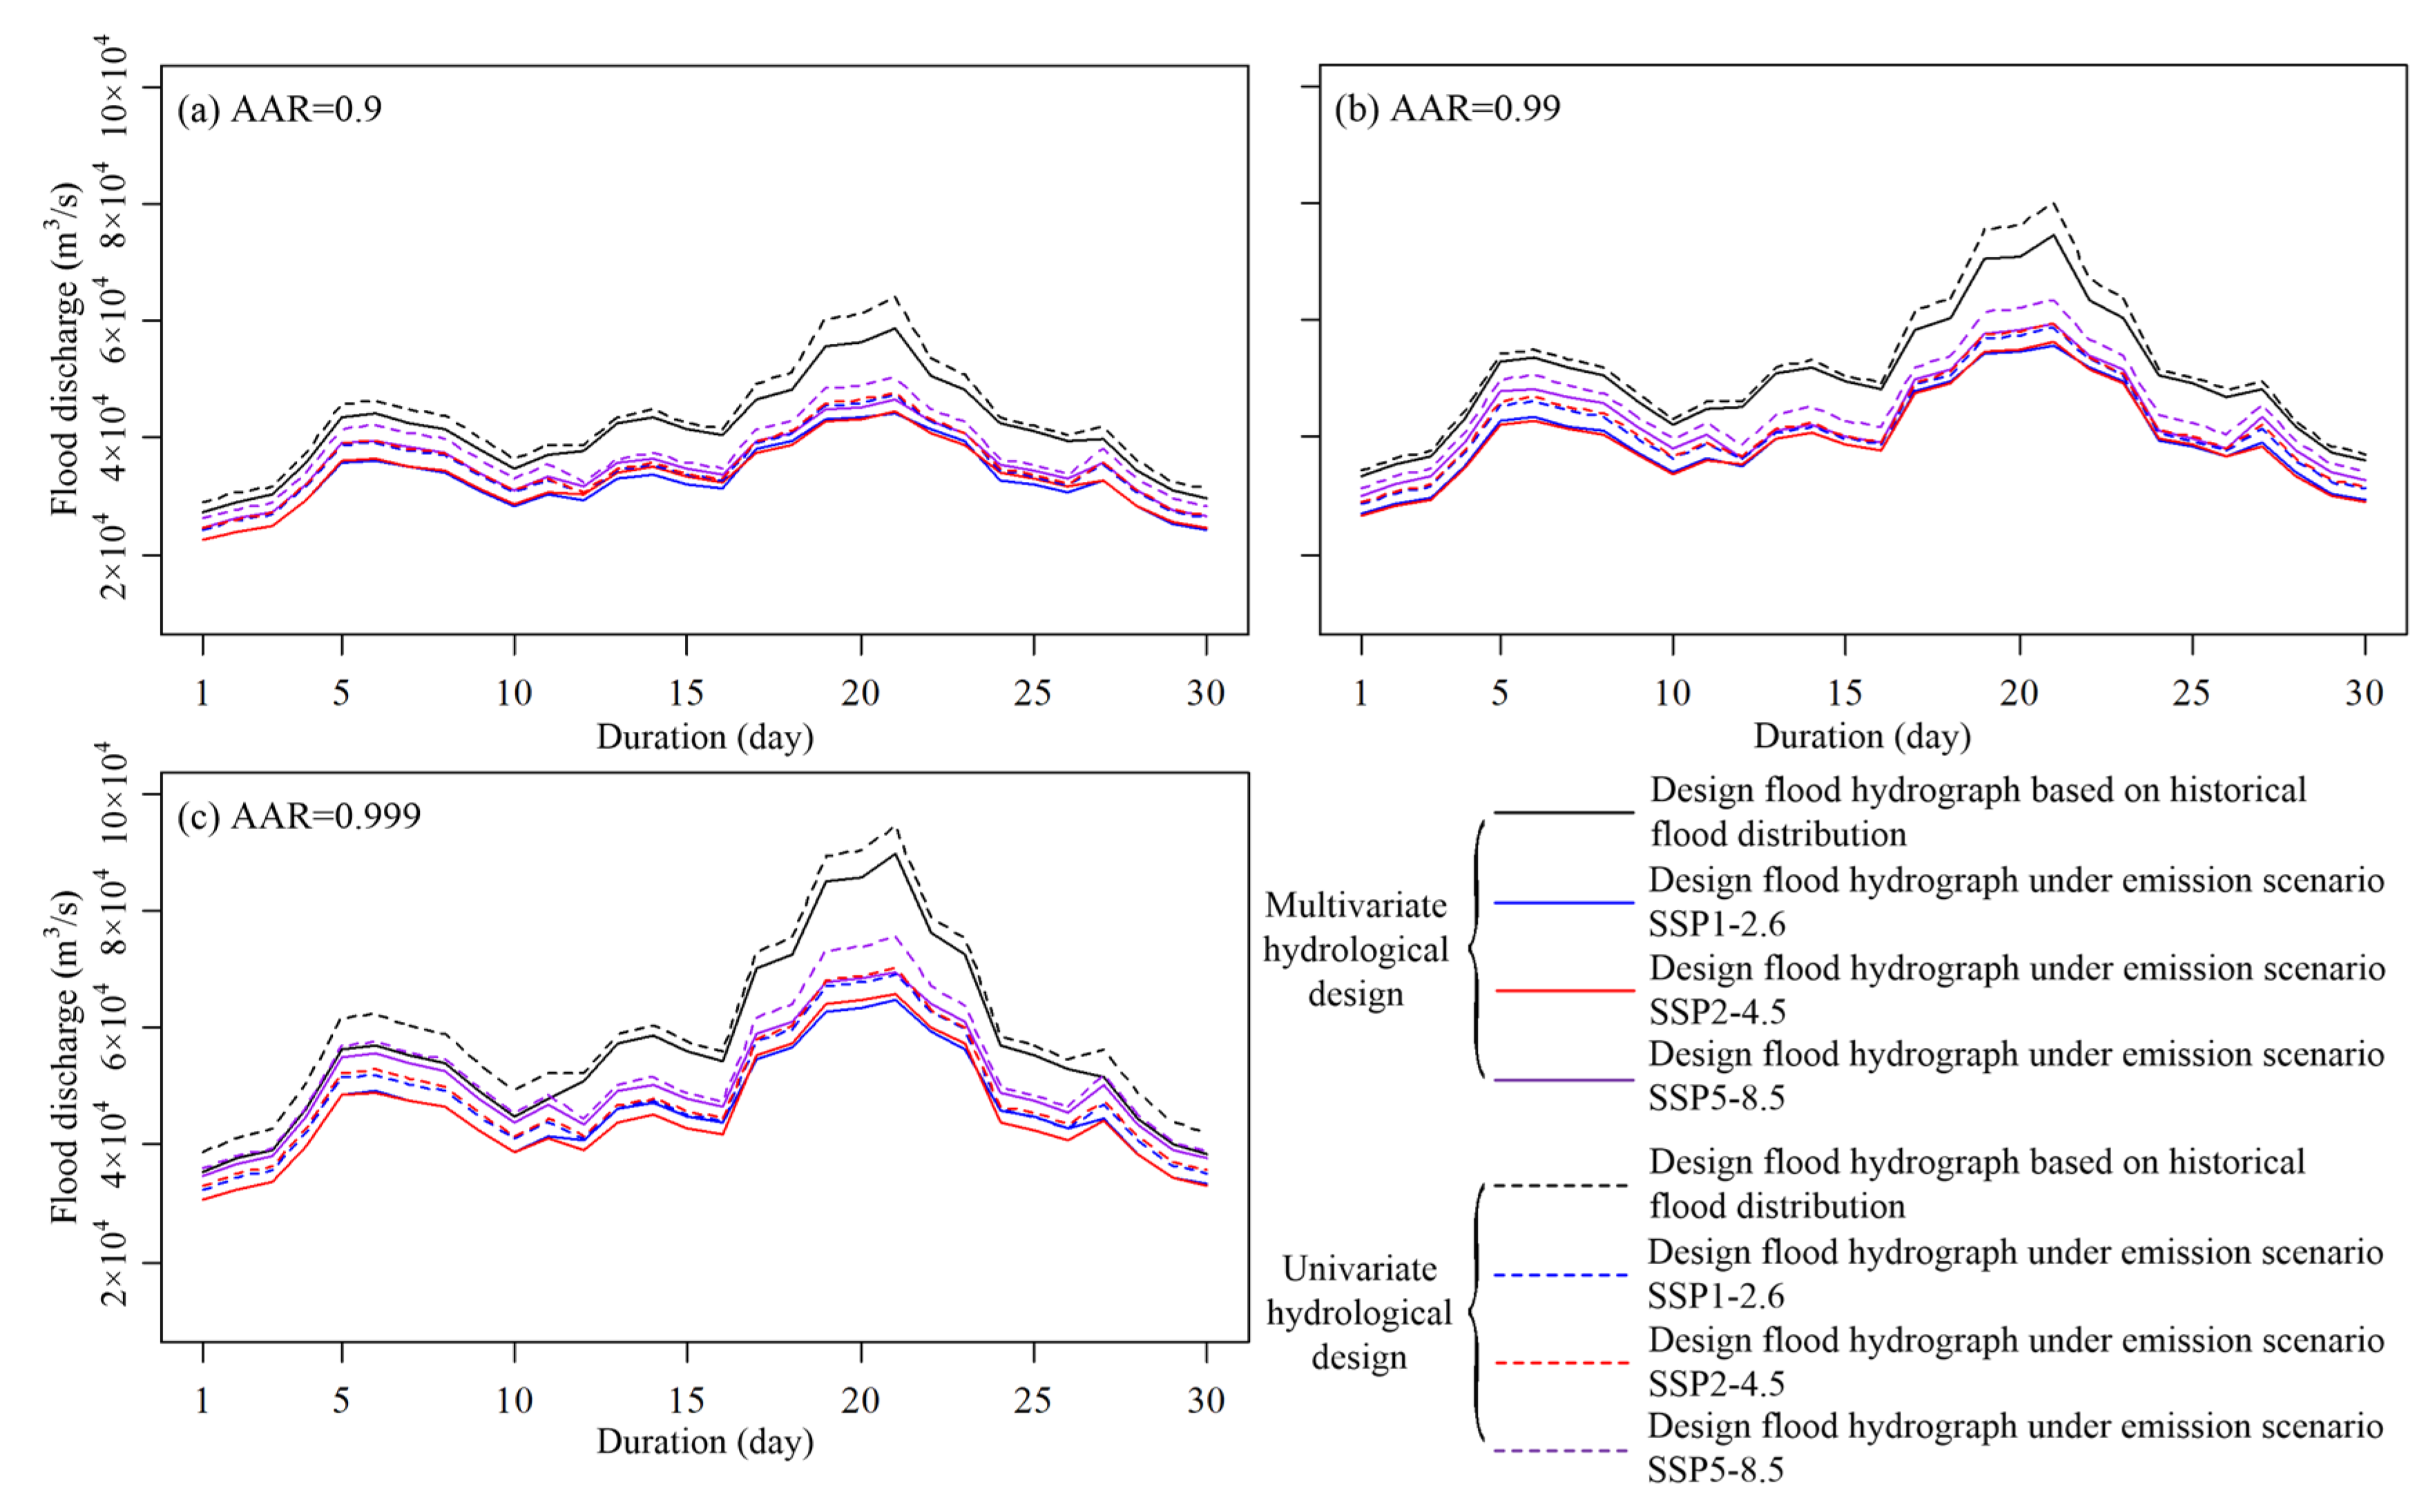
3.4. Multivariate Hydrological Design under Nonstationary Conditions
4. Results and Analysis
4.1. Dam-Site Flood Series
4.2. Multivariate Dam-Site Flood Distribution of the TGR
4.3. Multivariate Dam-Site Design Floods for the TGR
5. Conclusions and Discussion
Author Contributions
Funding
Institutional Review Board Statement
Informed Consent Statement
Data Availability Statement
Conflicts of Interest
References
- Gao, B.; Yang, D.; Yang, H. Impact of the Three Gorges Dam on flow regime in the middle and lower Yangtze River. Quat. Int. 2013, 304, 43–50. [Google Scholar] [CrossRef]
- Cheng, J.; Xu, L.; Wang, X.; Jiang, J.; You, H. Assessment of hydrologic alteration induced by the Three Gorges Dam in Dongting Lake, China. River Res. Appl. 2018, 34, 686–696. [Google Scholar] [CrossRef]
- Li, S.; Xiong, L.; Dong, L.; Zhang, J. Effects of the Three Gorges Reservoir on the hydrological droughts at the downstream Yichang station during 2003–2011. Hydrol. Process. 2013, 27, 3981–3993. [Google Scholar] [CrossRef]
- Mei, X.; Dai, Z.; van Gelder, P.H.A.J.M.; Gao, J. Linking Three Gorges Dam and downstream hydrological regimes along the Yangtze River, China. Earth Space Sci. 2015, 2, 94–106. [Google Scholar] [CrossRef]
- Wang, Y.; Rhoads, B.L.; Wang, D. Assessment of the flow regime alterations in the middle reach of the Yangtze River associated with dam construction: Potential ecological implications. Hydrol. Process. 2016, 30, 3949–3966. [Google Scholar] [CrossRef]
- Guo, H.; Hu, Q.; Zhang, Q.; Feng, S. Effects of the Three Gorges Dam on Yangtze River flow and river interaction with Poyang Lake, China: 2003–2008. J. Hydrol. 2012, 416, 19–27. [Google Scholar] [CrossRef]
- Xiong, B.; Xiong, L.; Guo, S.; Xu, C.; Xia, J.; Zhong, Y.; Yang, H. Nonstationary frequency analysis of censored data: A case study of the floods in the Yangtze River from 1470 to 2017. Water Resour. Res. 2020, 56, e2020WR027112. [Google Scholar] [CrossRef]
- Jiang, C.; Zhang, Q.; Luo, M. Assessing the effects of the Three Gorges Dam and upstream inflow change on the downstream flow regime during different operation periods of the dam. Hydrol. Process. 2019, 33, 2885–2897. [Google Scholar] [CrossRef]
- Guo, S.; Xiong, F.; Wang, J.; Zhong, Y.; Tian, J.; Yin, J. Preliminary exploration of design flood and control water level of Three Gorges Reservoir in operation period. J. Hydraul. Eng. 2019, 50, 1311–1317. (In Chinese) [Google Scholar]
- Jiang, C.; Xiong, L.; Xu, C.Y.; Yan, L. A river network-based hierarchical model for deriving flood frequency distributions and its application to the Upper Yangtze basin. Water Resour. Res. 2021, 57, e2020WR029374. [Google Scholar] [CrossRef]
- Zhong, W.; Guo, J.; Chen, L.; Zhou, J.; Zhang, J.; Wang, D. Future hydropower generation prediction of large-scale reservoirs in the upper Yangtze River basin under climate change. J. Hydrol. 2020, 588, 125013. [Google Scholar] [CrossRef]
- Birkinshaw, S.J.; Guerreiro, S.B.; Nicholson, A.; Liang, Q.; Quinn, P.; Zhang, L.; He, B.; Yin, J.; Fowler, H.J. Climate change impacts on Yangtze River discharge at the Three Gorges Dam. Hydrol. Earth Syst. Sci. 2016, 21, 1911–1927. [Google Scholar] [CrossRef] [Green Version]
- Olsen, J.R.; Lambert, J.H.; Haimes, Y.Y. Risk of extreme events under nonstationarity conditions. Risk Anal. 1998, 18, 497–510. [Google Scholar] [CrossRef]
- Salas, J.D.; Obeysekera, J. Revisiting the concepts of return period and risk for nonstationary hydrologic extreme events. J. Hydrol. Eng. 2014, 19, 554–568. [Google Scholar] [CrossRef] [Green Version]
- Yan, L.; Xiong, L.; Guo, S.; Xu, C.-Y.; Xia, J.; Du, T. Comparison of four nonstationary hydrologic design methods for changing environment. J. Hydrol. 2017, 551, 132–150. [Google Scholar] [CrossRef]
- Hu, Y.; Liang, Z.; Singh, V.P.; Zhang, X.; Wang, J.; Li, B. Concept of Equivalent Reliability for Estimating the Design Flood under Non-stationary Conditions. Water Resour. Manag. 2018, 32, 997–1011. [Google Scholar] [CrossRef]
- Read, L.K.; Vogel, R.M. Reliability, return periods, and risk under nonstationarity. Water Resour. Res. 2015, 51, 6381–6398. [Google Scholar] [CrossRef]
- Jiang, C.; Xiong, L.; Yan, L.; Dong, J.; Xu, C. Multivariate hydrologic design methods under nonstationary conditions and application to engineering practice. Hydrol. Earth Syst. Sci. 2019, 23, 1683–1704. [Google Scholar] [CrossRef] [Green Version]
- Salvadori, G.; De Michele, C.; Durante, F. On the return period and design in a multivariate framework. Hydrol. Earth Syst. Sci. 2011, 15, 3293–3305. [Google Scholar] [CrossRef] [Green Version]
- Wen, T.; Jiang, C.; Xu, X. Nonstationary Analysis for Bivariate Distribution of Flood Variables in the Ganjiang River Using Time-Varying Copula. Water 2019, 11, 746. [Google Scholar] [CrossRef] [Green Version]
- Guo, A.J.; Chang, J.X.; Wang, Y.M.; Huang, Q.; Guo, Z.H.; Zhou, S. Bivariate frequency analysis of flood and extreme precipitation under changing environment: Case study in catchments of the Loess Plateau, China. Stoch. Environ. Res. Risk Assess. 2007, 32, 2057–2074. [Google Scholar] [CrossRef]
- Sarhadi, A.; Burn, D.H.; Wiper, M.P. Time varying nonstationary multivariate risk analysis using a dynamic Bayesian copula. Water Resour. Res. 2016, 52, 2327–2349. [Google Scholar] [CrossRef]
- Grimaldi, S.; Serinaldi, F. Asymmetric copula in multivariate flood frequency analysis. Adv. Water Resour. 2006, 29, 1155–1167. [Google Scholar] [CrossRef]
- Li, T.; Guo, S.; Chen, L.; Guo, J. Bivariate flood frequency analysis with historical information based on copula. J. Hydraul. Eng. 2013, 18, 1018–1030. [Google Scholar] [CrossRef] [Green Version]
- Aas, K.; Czado, C.; Frigessi, A.; Bakken, H. Pair-copula constructions of multiple dependence. Insur. Math. Econ. 2009, 44, 182–198. [Google Scholar] [CrossRef] [Green Version]
- Changjiang Water Resources Commission (CWRC). Hydrologic Inscription Cultural Relics in Three Gorges Reservoir Area; Science Press: Beijing, China, 1996. (In Chinese) [Google Scholar]
- López, J.; Francés, F. Non-stationary flood frequency analysis in continental Spanish rivers, using climate and reservoir indices as external covariates. Hydrol. Earth Syst. Sci. 2013, 17, 3189–3203. [Google Scholar] [CrossRef] [Green Version]
- Shi, F.; Zhao, S.; Guo, Z.; Goosse, H.; Yin, Q. Multi-proxy reconstructions of May-September precipitation field in China over the past 500 years. Clim. Past. 2017, 13, 1919–1938. [Google Scholar] [CrossRef] [Green Version]
- Wu, J.; Shi, Y.; Xu, Y. Evaluation and projection of surface wind speed over China based on CMIP6 GCMs. J. Geophys. Res. Atmos. 2020, 125, e2020JD033611. [Google Scholar] [CrossRef]
- Chow, V.T.; Maidment, D.R.; Mays, L.W. Applied Hydrology; McGraw-Hill: New York, NY, USA, 1988. [Google Scholar]
- Zhao, R. The Xinanjiang model applied in China. J. Hydrol. 1992, 135, 371–381. [Google Scholar]
- Duan, Q.; Gupta, V.K.; Sorooshian, S. A shuffled complex evolution approach for effective and efficient optimization. J. Optim. Theory Appl. 1993, 76, 501–521. [Google Scholar] [CrossRef]
- Sklar, M. Fonctions de Répartition an Dimensions et Leurs Marges; University Paris: Paris, France, 1959; p. 8. [Google Scholar]
- Ministry of Water Resources of China. Design Criterion of Reservoir Management; Chin. Water Resources and Hydropower Press: Beijing, China, 1996. (In Chinese) [Google Scholar]
- Strupczewski, W.G.; Singh, V.P.; Feluch, W. Non-stationary approach to at-site flood frequency modeling I. Maximum likelihood estimation. J. Hydrol. 2001, 248, 123–142. [Google Scholar] [CrossRef]
- Akaike, H. A new look at the statistical model identification. IEEE Trans. Autom. Control 1974, 19, 716–723. [Google Scholar] [CrossRef]
- Massey, E.J. The Kolmogorov-Smirnov test of goodness of fit. J. Am. Stat. Assoc. 1951, 46, 68–78. [Google Scholar] [CrossRef]
- Zhang, L.; Singh, V.P. Trivariate flood frequency analysis using the Gumbel–Hougaard copula. J. Hydrol. Eng. 2007, 12, 431–439. [Google Scholar] [CrossRef]


| Reservoir | Catchment Area (106 km2) | Flood control Capacity (109 m3) | Completation Year |
|---|---|---|---|
| Bikou | 0.026 | 0.083 | 1976 |
| Ertan | 0.1164 | 0.9 | 1998 |
| Baozhusi | 0.0284 | 0.28 | 1998 |
| Zipingpu | 0.0227 | 0.167 | 2006 |
| Pubugou | 0.0685 | 0.73 | 2008 |
| Silin | 0.0486 | 0.184 | 2009 |
| Pengshui | 0.069 | 0.232 | 2009 |
| Goupitan | 0.0433 | 0.2 | 2011 |
| Shatuo | 0.0545 | 0.209 | 2011 |
| Ahai | 0.2354 | 0.215 | 2012 |
| Jinanqiao | 0.2374 | 0.158 | 2012 |
| Longkaikou | 0.24 | 0.126 | 2013 |
| Ludila | 0.2473 | 0.564 | 2013 |
| Xiangjiaba | 0.4588 | 0.903 | 2013 |
| Jinping I | 0.1026 | 1.6 | 2014 |
| Xiluodu | 0.4544 | 4.651 | 2014 |
| Tingzikou | 0.0611 | 1.44 | 2014 |
| Liyuan | 0.22 | 0.173 | 2015 |
| Guanyinyan | 0.2565 | 0.253 | 2015 |
| Caojie | 0.1561 | 0.199 | 2015 |
| Changheba | 0.0559 | 0.12 | 2017 |
| Wudongde | 0.4061 | 2.44 | 2021 |
| Baihetan | 0.4303 | 7.5 | 2022 |
| Lianghekou | 0.0596 | 0.2 | 2023 |
| Shuangjiangkou | 0.0393 | 0.663 | 2024 |
| Flood Variable | Distribution Parameters | p-Value of KS Test | ||
|---|---|---|---|---|
| Q1 (m3/s) | 0.172 | 0.454 | 0.200 | |
| V3 (109 m3) | 0.174 | 0.456 | 0.474 | |
| V7 (109 m3) | 0.175 | 0.456 | 0.407 | |
| V15 (109 m3) | 0.162 | 0.364 | 0.758 | |
| V30 (109 m3) | 0.146 | 0.326 | 0.770 | |
| Bivariate Pair | Copula Parameter | Bivariate Pair | Copula Parameter | Bivariate Pair | Copula Parameter |
|---|---|---|---|---|---|
| 13.72 | 1.77 | 1.45 | |||
| 4.62 | 1.30 | 1.60 | |||
| 2.66 | 1.19 | ||||
| 2.19 | 1.93 |
| Flood Variable | AAR = 0.9 | AAR = 0.99 | AAR = 0.999 | |||||||||
|---|---|---|---|---|---|---|---|---|---|---|---|---|
| Historical | SSP1-2.6 | SSP2-4.5 | SSP5-8.5 | Historical | SSP1-2.6 | SSP2-4.5 | SSP5-8.5 | Historical | SSP1-2.6 | SSP2-4.5 | SSP5-8.5 | |
| Q1 (m3/s) | 67,583 | 48,925 | 49,894 | 52,924 | 82,332 | 60,710 | 60,770 | 65,580 | 97,146 | 70,523 | 72,662 | 77,138 |
| V3 (109 m3) | 16.8 | 12.5 | 12.7 | 13.5 | 20.6 | 15.4 | 15.5 | 16.6 | 24.3 | 18 | 18.6 | 19.7 |
| V7 (109 m3) | 35.7 | 27.5 | 28.2 | 29.5 | 44 | 33.7 | 33.6 | 36.2 | 51.6 | 39.6 | 39.9 | 42.8 |
| V15 (109 m3) | 66 | 51 | 52.7 | 54.6 | 80.6 | 61.9 | 62.5 | 67.5 | 93 | 71 | 72.1 | 78.7 |
| V30 (109 m3) | 115.2 | 93.9 | 93.5 | 99.5 | 137.8 | 111.6 | 113.6 | 122.2 | 158.1 | 126.7 | 128.2 | 141.2 |
| Flood Variable | AAR = 0.9 | AAR = 0.99 | AAR = 0.999 | |||||||||
|---|---|---|---|---|---|---|---|---|---|---|---|---|
| Historical | SSP1-2.6 | SSP2-4.5 | SSP5-8.5 | Historical | SSP1-2.6 | SSP2-4.5 | SSP5-8.5 | Historical | SSP1-2.6 | SSP2-4.5 | SSP5-8.5 | |
| Q1 (m3/s) | 58,617 | 44,196 | 44,401 | 46,578 | 74,561 | 55,696 | 56,423 | 59,444 | 89,647 | 64,802 | 65,967 | 69,347 |
| V3 (109 m3) | 14.7 | 11.3 | 11.3 | 11.8 | 18.7 | 14.2 | 14.3 | 15.2 | 22.5 | 16.5 | 16.8 | 17.8 |
| V7 (109 m3) | 31.5 | 25 | 24.8 | 25.9 | 39.6 | 31.4 | 31.4 | 33.1 | 47.7 | 36.1 | 36.7 | 39.0 |
| V15 (109 m3) | 59.9 | 47.1 | 47.6 | 49.7 | 73.6 | 57.9 | 58.1 | 60.6 | 85.9 | 66.9 | 66.1 | 71.8 |
| V30 (109 m3) | 106.5 | 85.2 | 86 | 91.6 | 130.2 | 103.8 | 103.3 | 111.8 | 146.2 | 118.9 | 117.9 | 130.6 |
| Flood Variable | AAR = 0.9 | AAR = 0.99 | AAR = 0.999 | |||||||||
|---|---|---|---|---|---|---|---|---|---|---|---|---|
| Historical | SSP1-2.6 | SSP2-4.5 | SSP5-8.5 | Historical | SSP1-2.6 | SSP2-4.5 | SSP5-8.5 | Historical | SSP1-2.6 | SSP2-4.5 | SSP5-8.5 | |
| Q1 (m3/s) | 61,929 | 45,502 | 45,911 | 48,982 | 79,589 | 56,674 | 57,897 | 61,405 | 93,683 | 66,561 | 67,838 | 73,077 |
| V3 (109 m3) | 15.5 | 11.5 | 11.6 | 12.4 | 19.9 | 14.5 | 14.8 | 15.6 | 23.5 | 17 | 17.3 | 18.6 |
| V7 (109 m3) | 33 | 25.6 | 25.6 | 27.2 | 41.9 | 31.9 | 32.1 | 33.9 | 49.6 | 36.8 | 38.2 | 40.6 |
| V15 (109 m3) | 61.8 | 48.5 | 48.6 | 51.1 | 76.1 | 58.3 | 59.6 | 62.1 | 88.2 | 66.7 | 69.8 | 74.2 |
| V30 (109 m3) | 108.2 | 88.1 | 88.5 | 93 | 130.4 | 105.1 | 106.3 | 113.9 | 153.7 | 118.9 | 123.6 | 133.7 |
| Flood Variable | AAR = 0.9 | AAR = 0.99 | AAR = 0.999 | |||||||||
|---|---|---|---|---|---|---|---|---|---|---|---|---|
| Historical | SSP1-2.6 | SSP2-4.5 | SSP5-8.5 | Historical | SSP1-2.6 | SSP2-4.5 | SSP5-8.5 | Historical | SSP1-2.6 | SSP2-4.5 | SSP5-8.5 | |
| Q1 (m3/s) | 64,221 | 47,119 | 47,568 | 50,338 | 80,236 | 58,766 | 59,420 | 63,533 | 94,651 | 69,258 | 70,128 | 75,508 |
| V3 (109 m3) | 16.0 | 12.0 | 12.1 | 12.8 | 20.1 | 15.0 | 15.1 | 16.2 | 23.7 | 17.7 | 17.9 | 19.2 |
| V7 (109 m3) | 33.8 | 26.1 | 26.3 | 27.7 | 42.2 | 32.6 | 32.9 | 34.9 | 49.8 | 38.4 | 38.8 | 41.4 |
| V15 (109 m3) | 62.9 | 49.1 | 49.5 | 52.1 | 76.9 | 59.9 | 60.5 | 64.2 | 89.3 | 69.3 | 70.1 | 74.9 |
| V30 (109 m3) | 111.8 | 90.5 | 91.3 | 96.6 | 135.1 | 108.7 | 109.9 | 117.6 | 155.2 | 124.4 | 126 | 135.9 |
Publisher’s Note: MDPI stays neutral with regard to jurisdictional claims in published maps and institutional affiliations. |
© 2022 by the authors. Licensee MDPI, Basel, Switzerland. This article is an open access article distributed under the terms and conditions of the Creative Commons Attribution (CC BY) license (https://creativecommons.org/licenses/by/4.0/).
Share and Cite
Xiong, L.; Jiang, C.; Guo, S.; Li, S.; Li, R.; Li, W. Multivariate Dam-Site Flood Frequency Analysis of the Three Gorges Reservoir Considering Future Reservoir Regulation and Precipitation. Water 2022, 14, 138. https://doi.org/10.3390/w14020138
Xiong L, Jiang C, Guo S, Li S, Li R, Li W. Multivariate Dam-Site Flood Frequency Analysis of the Three Gorges Reservoir Considering Future Reservoir Regulation and Precipitation. Water. 2022; 14(2):138. https://doi.org/10.3390/w14020138
Chicago/Turabian StyleXiong, Lihua, Cong Jiang, Shenglian Guo, Shuai Li, Rongrong Li, and Wenbin Li. 2022. "Multivariate Dam-Site Flood Frequency Analysis of the Three Gorges Reservoir Considering Future Reservoir Regulation and Precipitation" Water 14, no. 2: 138. https://doi.org/10.3390/w14020138