
GALDIT Modification for Seasonal Seawater Intrusion Mapping Using Multi Criteria Decision Making Methods


1
School of Civil and Environmental Engineering, Kookmin University, Seoul 02707, Korea
2
Department of Architecture, Sejong University, Seoul 05006, Korea
*
Author to whom correspondence should be addressed.
Water 2022, 14(14), 2258; https://doi.org/10.3390/w14142258
Submission received: 24 May 2022
/
Revised: 5 July 2022
/
Accepted: 15 July 2022
/
Published: 19 July 2022
(This article belongs to the Section Hydrogeology)
Abstract
:Recently, coastal aquifers have been found to be increasingly exposed to seawater intrusion (SWI) due to climate change and anthropogenic activities. Various method exists for coastal aquifer vulnerability mapping and the one most commonly used is GALDIT because of its simplicity. The present study modified the original GALDIT ratings and weights using Shannon’s entropy theory to study the seasonal vulnerability of coastal aquifer in the coastal region of Benin, West Africa. Thus, the monthly GALDIT index for the study region was computed using 5 years of (2015–2019) average data of GALDIT dynamic input parameters. The original and modified GALDIT approaches were validated using total dissolved solid (TDS) concentration. Pearson’s correlation and Spearman coefficient correlations were calculated, and generally the modification of the GALDIT parameters’ relative weight using entropy has improved the method as this gave a better correlation with TDS concentration (0.739). From the calculated monthly GALDIT index, the most vulnerable period was identified using TOPSIS method. Based on TOPSIS results, the coastal aquifer of Benin is more vulnerable to seawater intrusion in February due to the decrease of groundwater level in that period and less vulnerable in July. The performed sensitivity analysis showed that height of groundwater level above the mean sea level, distance from shore, and thickness of the saturated aquifer have the most influence in vulnerability to SWI assessment in the study area.
1. Introduction
Groundwater resources represent a high percent of the world’s liquid freshwater and are essential for the sustenance of rivers, wetlands, lakes, and ecological systems [1] (gw-project.org). It is, specifically, the most important source of water in arid and semi-arid regions. In the recent decades, a variety of research has proved that this precious resource is vulnerable to contamination, and once it is contaminated the remediation is extremely difficult; therefore, it urges to prevent groundwater contamination [2]. Groundwater contamination come from natural source of contamination and/or anthropogenic activities, both contamination sources affect water quality and consequently reduce the quantity of available groundwater resource. Seawater intrusion in the coastal areas is accelerating due to extensive groundwater use and sea level rise
The 20th century has seen a development of several groundwater quality assessment and vulnerability mapping methods, such as index-based methods [3], statistical approach [4], data driven models [5,6], and numerical models. There are several index-based methods for groundwater intrinsic vulnerability to commination mapping: SINTACS (S: Water table depth; I: Effective infiltration; N: Unsaturated zone; T: Soil media; A: Aquifer media; C: Hydraulic conductivity; and S: Topographic slope), DRASTIC (D: Depth to groundwater; R: Recharge rate; A: Aquifer; S: Soil; T: Topography; I: Vadose zone’s impact; and C: Aquifer’s hydraulic conductivity), PI (Protective cover, Infiltration factor), SI (Susceptibility Index), GOD (Groundwater occurrence, Overall aquifer class, Depth table of the groundwater), EPIK (E: Epikarst; P: Protective Cover; I: Infiltration Conditions; and K the Degree of Karstic Network Development), AVI (Aquifer Vulnerability Index), and GALDIT. Each of these methods is developed based on different datasets and for specific conditions [7]. The choice of the appropriate index-based method is based on the research goals and the geological conditions of the study area. Among those, few are specifically adapted to seawater intrusion assessment and GALDIT is the one mostly and generally used. GALDIT is a representative index-based method for groundwater vulnerability to seawater intrusion assessment developed based on six parameters: G is groundwater occurrence, A is the aquifer hydraulic conductivity, L is the height of groundwater level above the mean sea level, D is the distance from the shore, I is the impact of the existing status of seawater intrusion, and T is the thickness of the saturated aquifer [8]. The GALDIT method does not include the groundwater abstraction rate or groundwater/seawater interface into the mapping process, but its simplicity makes it attractive [9], and it has been used in different geographical location by various geological units all over the world, e.g., India [10,11], South Korea [12], Germany [13], Morocco [14], USA [15], and Portugal [16].
Few previous studies have modified the GALDIT method to improve the resulting seawater intrusion map. Kim et al. [17] has modified the GALDIT ratings to assess seawater intrusion in the western coastal region of South Korea. Bordbar et al. [18] used statistical and entropy models to modify GALDIT framework to assess coastal aquifer vulnerability in the Gharesoo-Gorgan Rood basin. GALDIT was improved by Kazakis et al. [19] using fuzzy method to modify GALDIT classic weight in order to map Northern Greece’s coastal aquifers vulnerability to seawater intrusion. In most of the cases, the modified methods were validated using seawater intrusion indicators and statistical methods, in general the modifications have improved the classic GALDIT framework.
GALDIT is the most representative seawater intrusion mapping approach, and its reliability is ensured by ongoing research. Much previous research has modified the GALDIT approach, but seasonality was not considered. Therefore, the main goal of this study is to use the modified GALDIT to study the seasonal vulnerability of coastal aquifers to the seawater intrusion in Benin. Taking steps from previous research, the present study first modified the original GALDIT using Shannon’s entropy theory; the modified method is used to compute the monthly GALDIT index of the study area and the most vulnerable period to seawater intrusion is identified using a multicriteria decision-making approach (TOPSIS (The Technique for Order of Preference by Similarity to Ideal Solution)).
2. Materials and Methods
2.1. Study Area
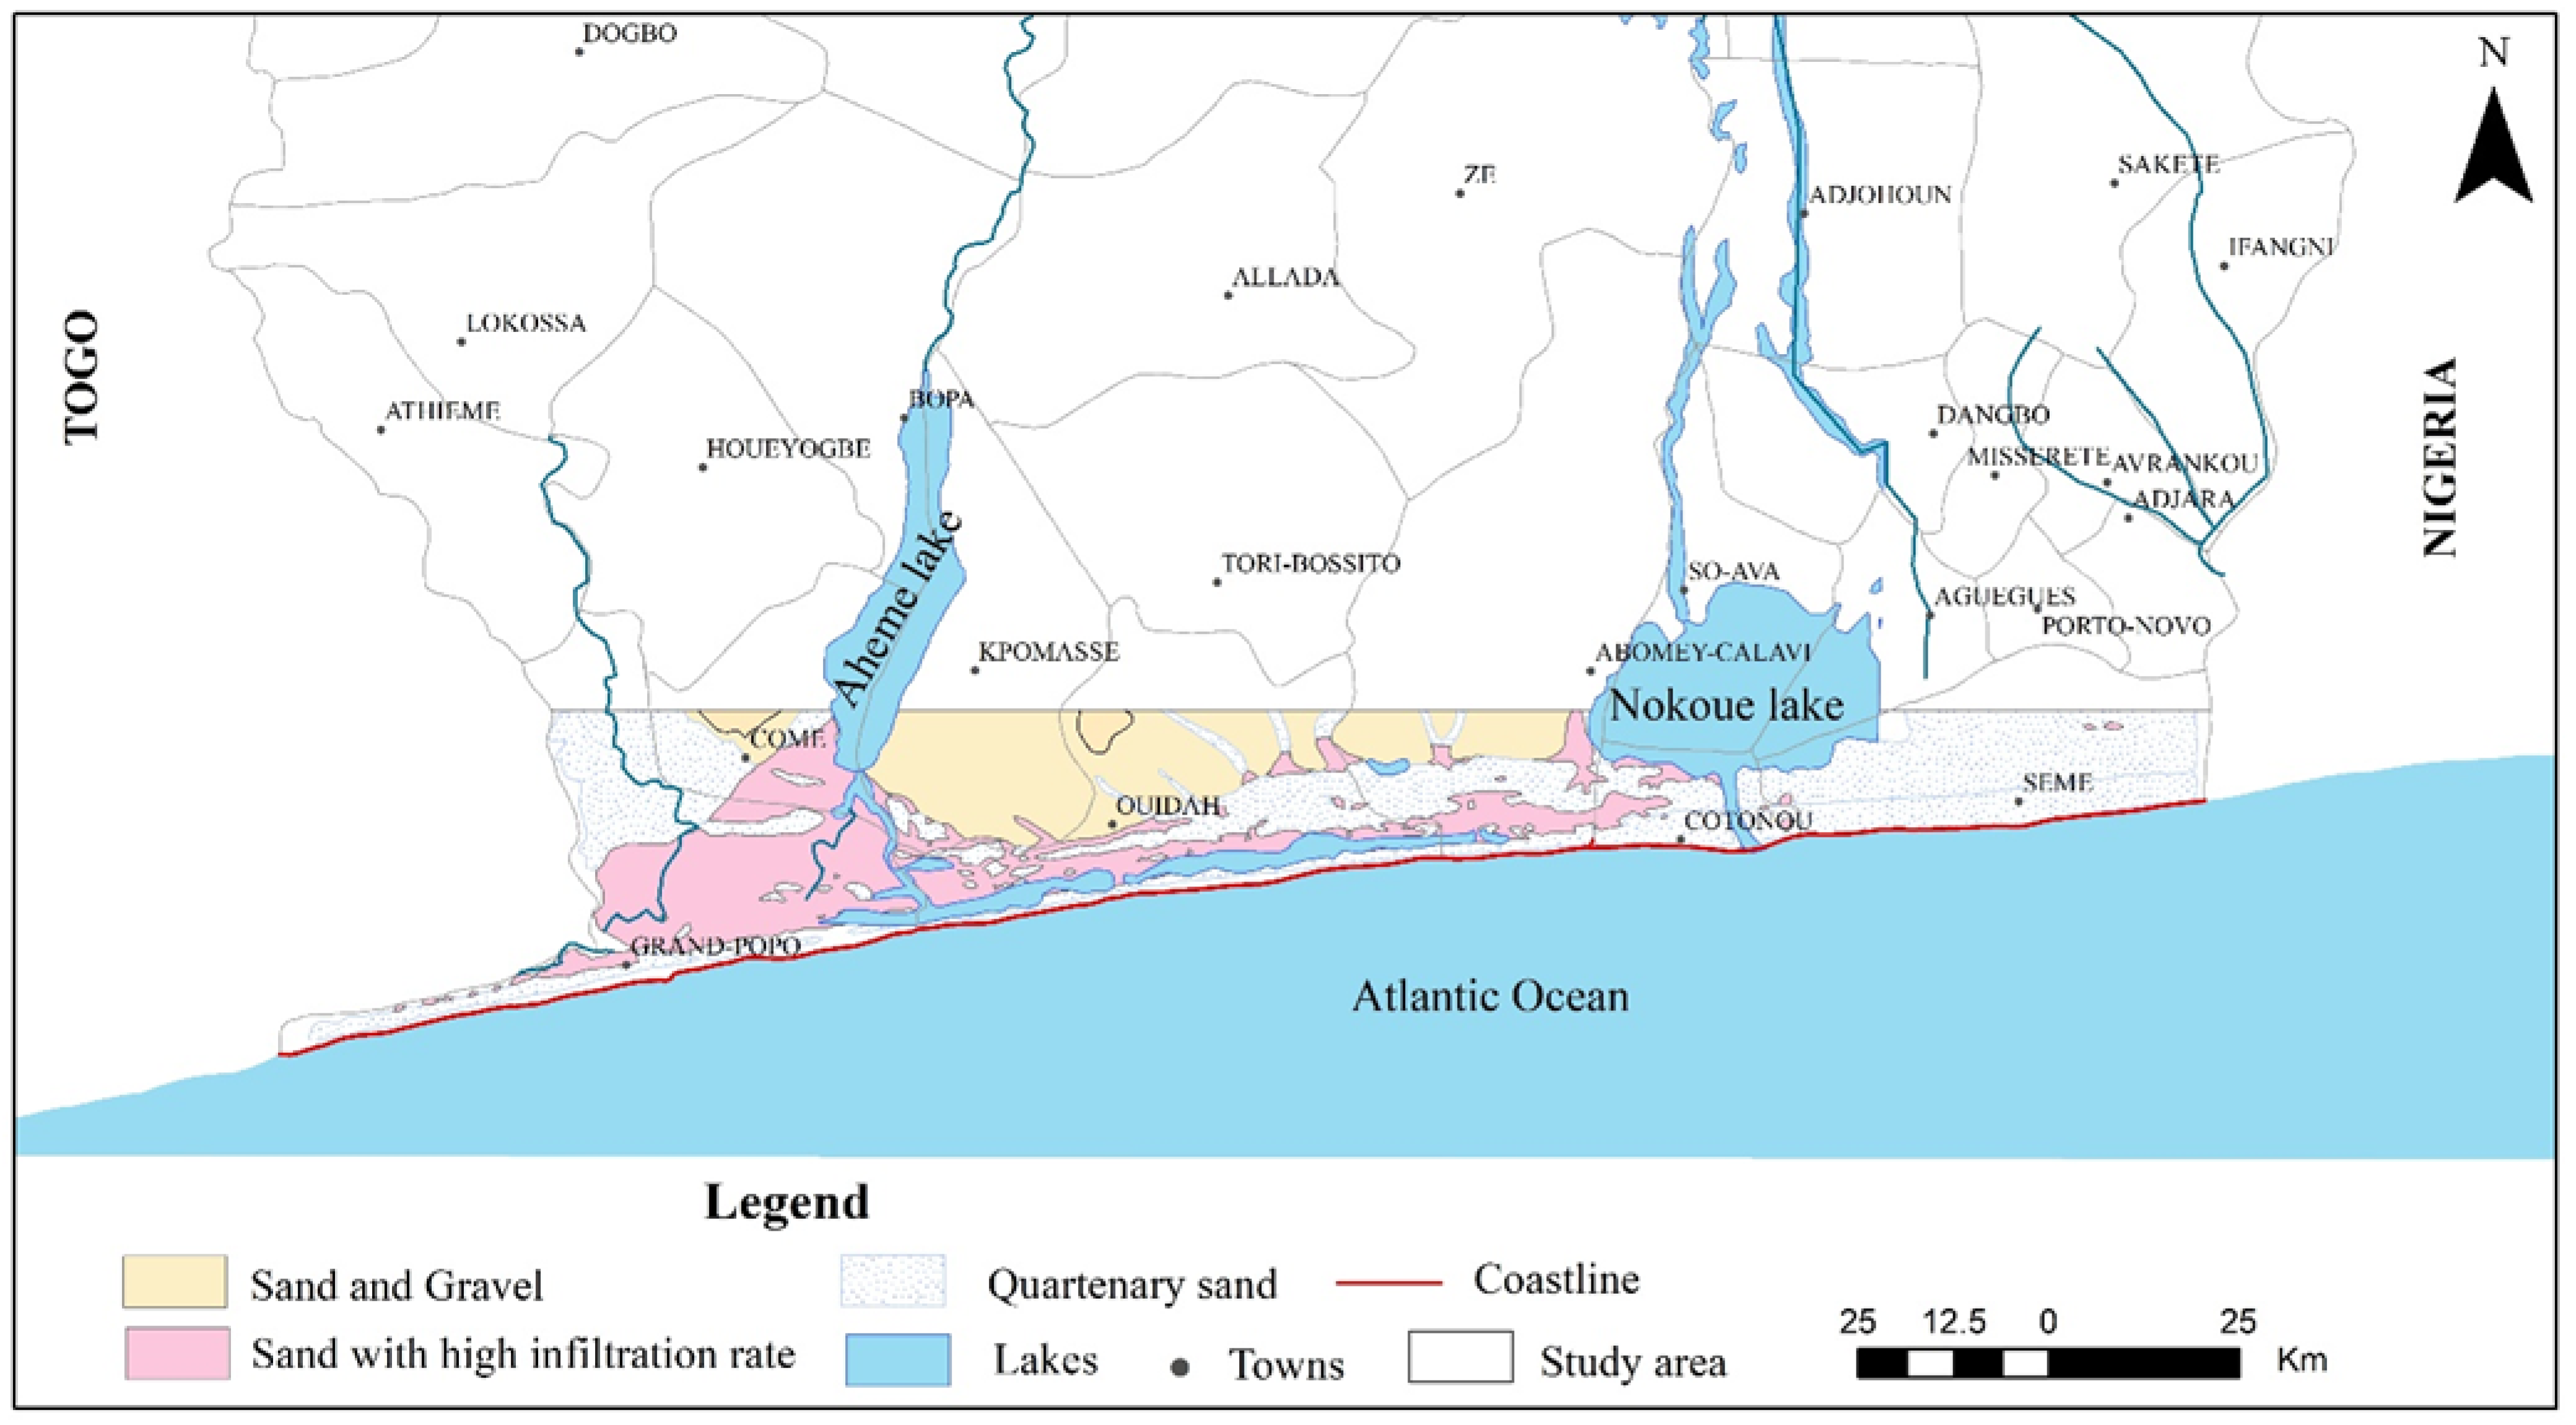
The study region is located in the south of Benin, West Africa, with an average area of 1140 km2 and a coastal line long of 121 km. In the study area, the manufacturing industry is expanding and urbanization is accelerating, resulting in a continuous increase of population. It consists of shallow lagoons with flat sandy beaches and tidal areas. The area is characterized by a sub-equatorial climate of two dry seasons and two rainy seasons. Land usage ranges from big metropolitan developments (Cotonou) to tiny rural communities. Significant areas of the land surface inside Cotonou have been modified, resulting in diminished local recharge and increased runoff. As a result, during the rainy season, the southern areas of the metropolitan zone see significant surface flooding. In and outside of the metropolitan region, large sections of land remain open wetlands. These open regions are interspersed with little villages where extensive infilling has occurred to facilitate the production of land surface for home construction, salt manufacturing, and agricultural activities.
The geological units found within the area have been previously described by Boukari et al. [20] and are classified into three different groups: Quaternary sands are the most dominant units, followed by sand with high infiltration rate and sand-gravel deposits. Quaternary sand covers the area along the coastline, the east region, and northwestern region. Sand–gravel formations are found in the center of the study region at few kilometers from the shoreline and the sand with high infiltration rate deposits are mainly located in the western region of the study area (Figure 1). Most of these geological units are potentially exposed to the influence of seawater because they extend below the bight of Benin. Furthermore, the area contains the Nokoué lake, which is connected to the ocean by an artificial canal with variable salinity that varies from higher than 10,000 mg/L in the dry season to lower than 1000 mg/L in the rainy season. The aquifer system in the study area is mostly accessed via a number of hands dug borehole and wells, specifically the wells station of Godomey (in the south just few kilometers from Nokoué lake), which represents the source of water supplying Cotonou and surrounding regions. Due to the importance of this region in freshwater supply system to megacities in the south of Benin, this study discusses the vulnerability of this aquifer system to seawater intrusion, which could be a severe threat.
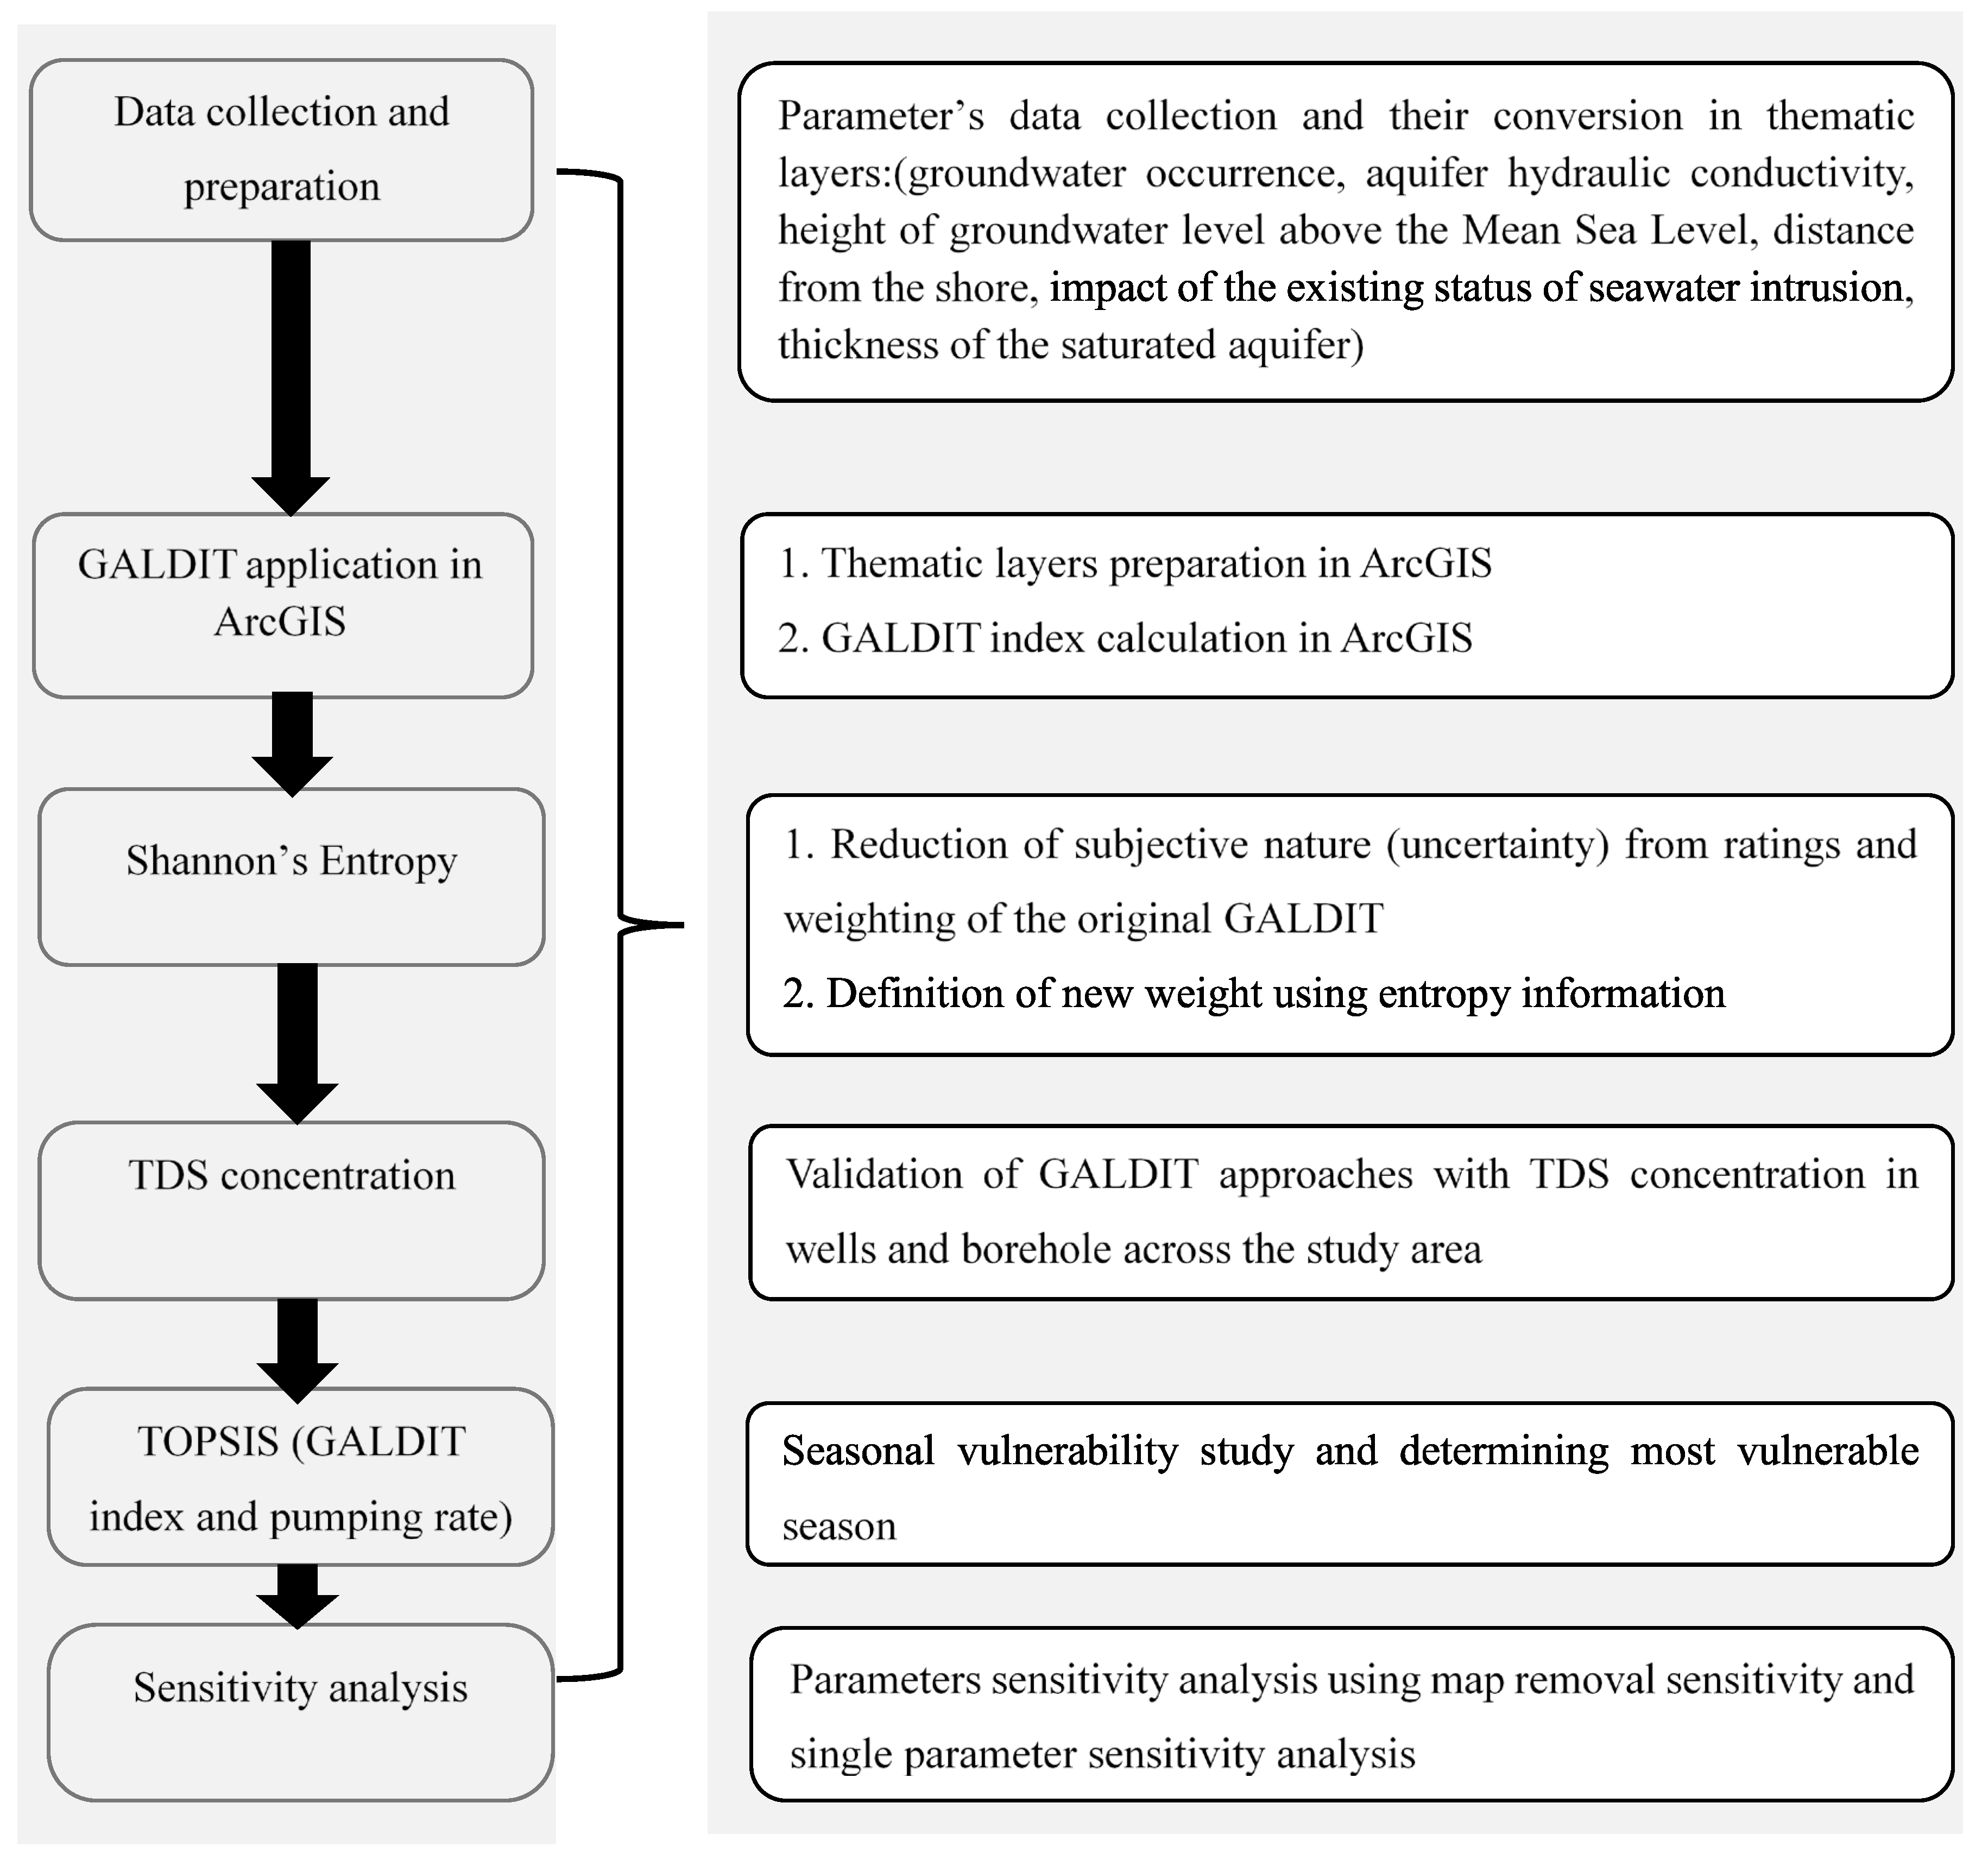
2.2. Research Methodology
The methodology used in this study is described in Figure 2. DGEau Benin (Direction Générale de l’Eau du Benin) provided the depth to water table, drill log, and report of groundwater survey’s data, which were used to estimate the saturated aquifer thickness, and the height of water level above the mean sea level. Data related to aquifer type and other hydrogeological parameters were collected from previous research.
2.2.1. GALDIT Method
GALDIT is an index-based method which uses six most important parameters controlling seawater intrusion to assess the vulnerability of coastal aquifers to seawater intrusion. Its nomination is from the combination of letters from the six parameters: G is groundwater occurrence, A is the aquifer hydraulic conductivity, L is the height of groundwater level above the mean sea level, D is the distance from the shore, I is the impact of the existing status of seawater intrusion, and T is the thickness of the saturated aquifer. In this study, the method is used to evaluate the actual monthly seawater intrusion in the coastal region of Benin. The method provides a numerical rating and weighting mechanism to assess the vulnerability of coastal aquifers. Furthermore, the GALDIT framework takes into account the physical properties that influence seawater contamination in a hydrological environment [21]. According to Chachadi’s table [22], for each parameter in this system, four rates are proposed: 2.5, 5, 7.5, and 10, with the higher rate representing greater vulnerability and vice versa. In this study, the modified rating strategy suggested by Kim et al. [17] is used, where the highest score of 10 was divided using the decile method and the modified rating was assigned a score between 1 and 10. The modified ratings for the six parameters are showed in Table 1. The GALDIT index is calculated using Equation (1):
where Wi is parameter weight and Ri is parameter rates.
Furthermore, in this study, the classic GALDIT weight was modified. Weight and ratings from the original GALDIT have been discussed by many researchers due to the subjective nature in the ratings assigning procedure. Bordbar et al. [18] modified GALDIT framework using statistical and entropy models; the modification has improved the method for better groundwater vulnerability to seawater intrusion mapping in the eastern part of the Alborz Mountains. Kim et al. [17] modified the original GALDIT ratings by considering the highest score from the original GALDIT, which is 10, and divides it using the decile method; thus, a rate was assigned for the modified rating between 1 and 10. Taking steps from previous research, the present study modified original GALDIT weight using Shannon’s entropy theory. In comparison to Bordbar et al. [18], the modification from this research used ratings as input of the entropy matrix to consider the variance in parameters value, ratings, and weights. The modified ratings from Kim et al. [17] are used in this study. Table 1 lists the original and modified ratings.
To assess monthly vulnerability to seawater intrusion, the input parameters are divided into two groups. The first group consists of parameters which temporally change: L and T. The second one is a group of static parameters which do not change: G, A, D, and I. Distance from shore should be classified as dynamic parameter due to the SLR (sea level rise), which causes its fluctuation, but in this study, monthly SLR fluctuation was neglected and D is considered as static. I is a dynamic parameter, but because of continuous relative data missing, it was considered as static parameter in this study. In the absence of anthropogenic activities, groundwater occurrence, and saturated aquifer thickness parameters are considered relatively static factors. Monthly data of dynamic parameters (L and T) were collected for a period of 5 years from 2015 to 2019, and the five years monthly average was used to calculate the seasonal GALDIT index.
2.2.2. Weight Modification
This step of the study attempted to modify the original GALDIT parameters’ weight using entropy theory to reduce the uncertainty in the subjective nature and improve the method. Entropy is defined in information theory as the average level of uncertainty associated with a variable’s potential outcomes. It was introduced by Shannon as follows (Mishra and Ayyub [23]):
Pi denotes the probability of signal i appearing in the information and logPi is the information associated with each specific outcome. H represents the expected value of all the signals’ content and C is a coefficient. The entropy approach used in this study is described in Yu et al. [24]. The approach is applied in three steps.
- Step 1: Normalization
Using the administrative map, the research area is split into districts. In this case, each district represents a target zone. Assuming that the assessment technique has n target zones and m parameters, a variable value matrix X is constructed using ratings. The matrix is a collection of ratings that identify the various subzone features for a particular metric, where xij is the average value of subzone i rating for parameter j.
The matrix is normalized as follows:
where max(xj) is the greatest value of xj, min(xj) is the minimum value and rij is the normalization value of parameter j in subzone i. Following normalization, X is transformed into the R matrix.
- Step 2: Entropy computation
The computation of entropy begins with the calculation of the percentage Pij. The percentage represents the vulnerability probability of subzone i to parameter j.
Variance was integrated into the new weight modification method because more diverse aspects should be given greater importance in the evaluation system. A parameter with a higher variance may be given a higher weight. The variation (ej) is computed as follows. 1/log(m) is used for C coefficient.
- Step 3: Modified weight
This phase consists of altering the relative weight assigned by GALDIT to define a new weight. The variance in weight specification in the classic GALDIT and the variance in parameter ratings are considered in the estimation of new weight (Yu et al. [24]). The new modified weight for each parameter j is the product of the relative variation in the ratings and the GALDIT classic weight.
This weight adjustment is utilized to lessen the influence of the “subjective nature”, and the new vulnerability is computed using Equation (1) by substituting the modified weight (wj) for the original weight (Wj) of original GALDIT.
To calculate wj, the study area is divided into small areas using the administrative map. The average rating of each small area was generated in ArcGIS and used as input for the matrix.
2.2.3. Seasonal Vulnerability
The goal of the seasonal vulnerability study is to identify the period in which the region is more vulnerable to seawater intrusion. GALDIT index was calculated for each month and combined with groundwater abstraction rate across the area, TOPSIS (The Technique for Order of Preference by Similarity to Ideal Solution) was used to evaluate the most vulnerable season. TOPSIS is a multicriteria decision-making approach which was introduced for the first time by Hwang et al. [25]. It is based on the notion that the selected alternative must have the longest geometric distance from the negative ideal solution and the shortest from the positive ideal solution.
The methodology used here is described by Zulqarnain et al. [26]. It is generally described in seven steps:
- Step 1: Matrix construction
The first step consists of creating a decision matrix with n criteria and m alternatives.
- Step 2: Normalization
The matrix is normalized as below:
i = 1,2, …, m j = 1,2, …, n
- Step 3: Weight normalization
- Step 4: Determine positive and negative ideal solutions
- Step 5: Calculate the separation distance
Distance from the positive ideal solution is defined as follows:
Distance from the negative ideal solution is defined as follows:
- Step 6: Calculate the shortest ideal solution
The shortest ideal solution is computed as
- Step 7: Rank the preference order
The alternatives ranking is based on the values and the rank preference is ascendant in order to select the most vulnerable season.
3. Results
3.1. GALDIT Parameters
To compute the monthly GALDIT index, the six parameters were prepared into thematic layers. The dynamic parameters were prepared using monthly data collected from 2015 to 2019.
3.1.1. Type of Aquifer
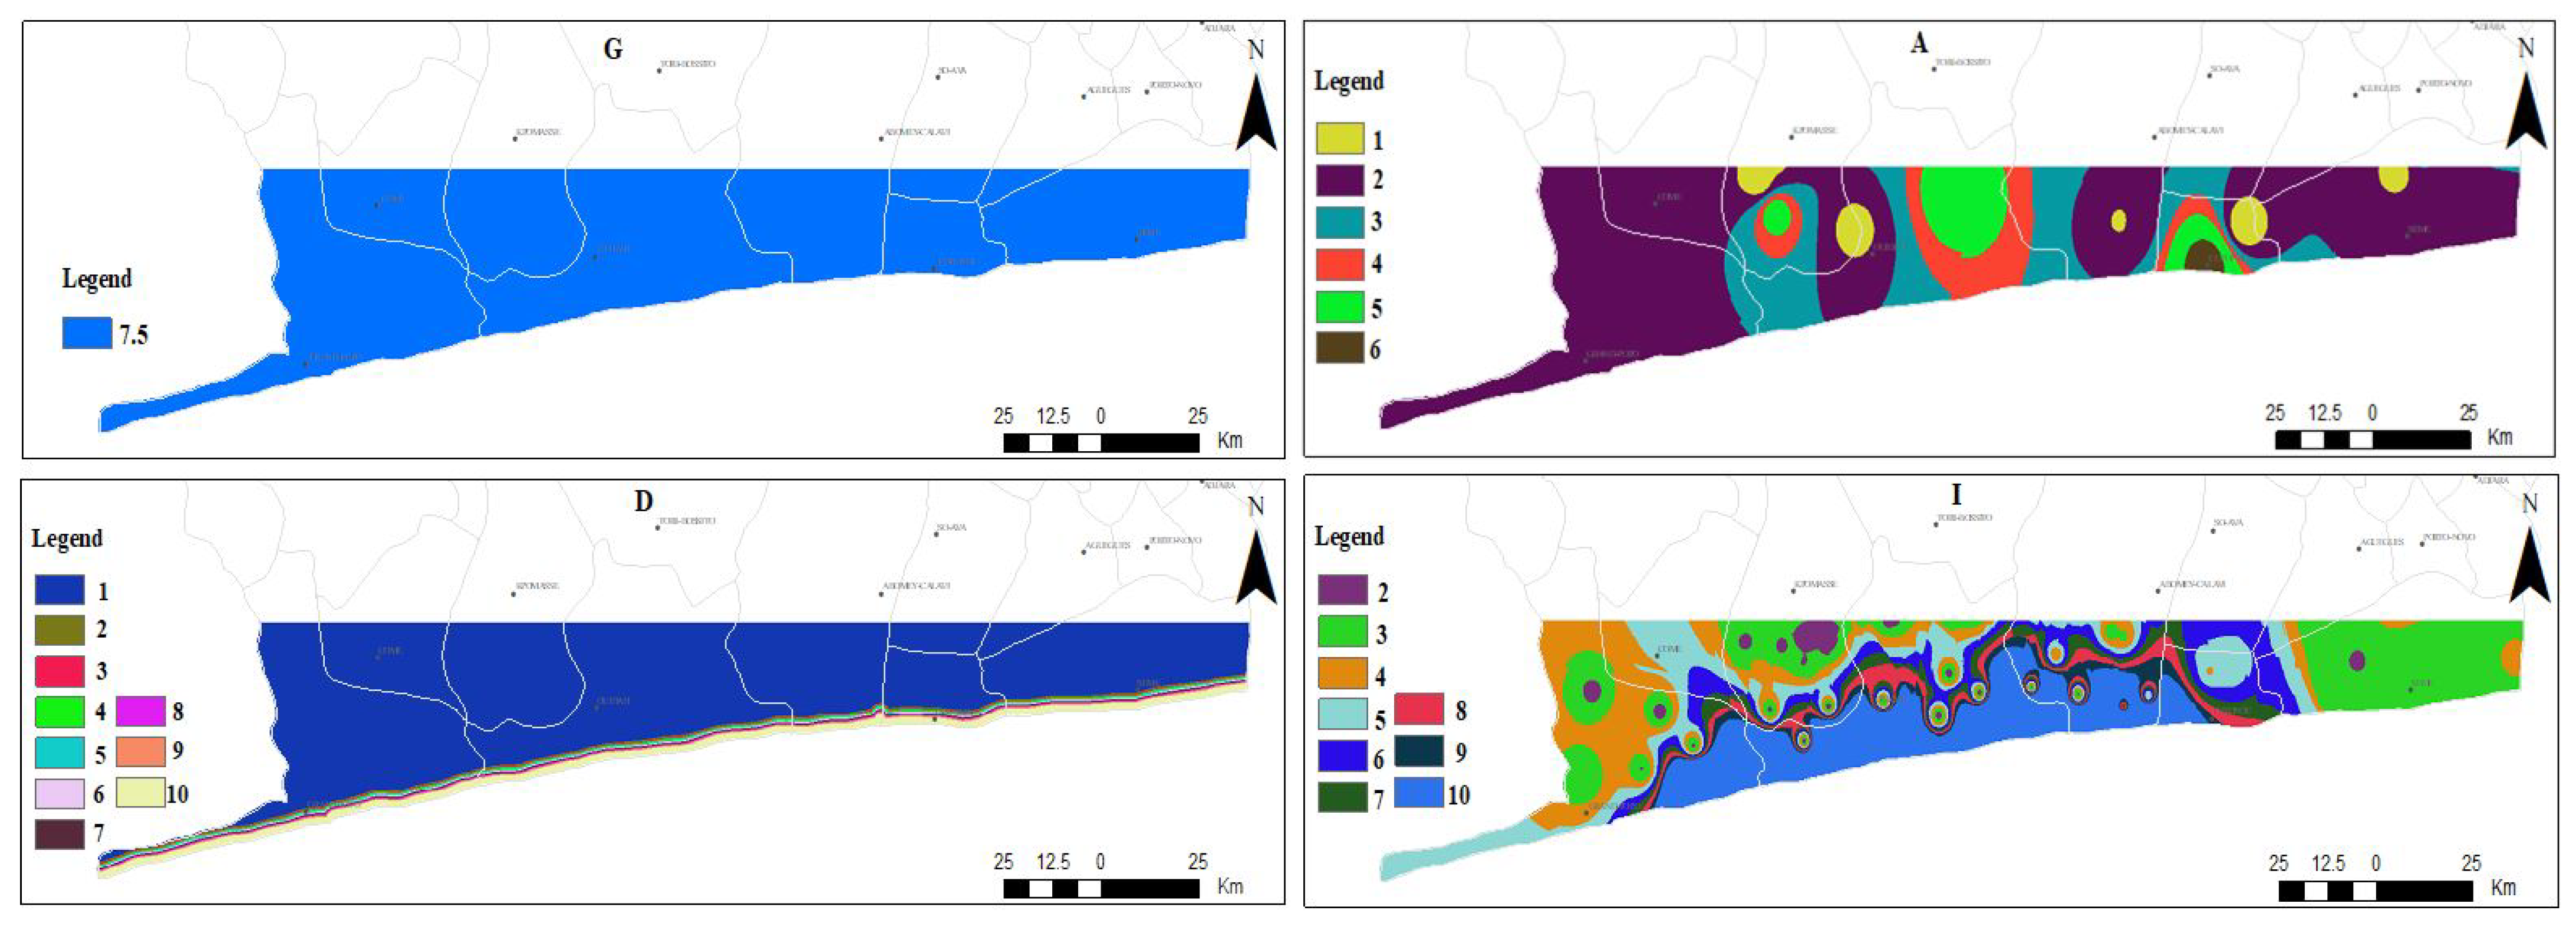
Seawater intrusion level is influenced by the aquifer’s performance (Chachadi and Lobo Ferreira [8]). Based on previous research and reports from DGEau Benin, the study area is covered by an unconfined aquifer which was rated 7.5.
3.1.2. Aquifer’s Hydraulic Conductivity
This parameter indicates the ability of the aquifer to transmit water. It is an important parameter that controls aquifer vulnerability to seawater intrusion. A higher conductivity smooths the groundwater movement and consequently increases the aquifer vulnerability to seawater intrusion. In this study, the highest score (six) is assigned to the highest hydraulic conductivity. A score of one was assigned when the aquifer hydraulic conductivity was less than 4 m/day. The highest hydraulic conductivity values are found in the center and the south of the area. Ratings were assigned to hydraulic conductivity values across the area and are shown in Figure 3.
3.1.3. Distance from Shore
This parameter was prepared in ArcGIS using the coastline map of Benin. The closest area to the beach is more prone to seawater intrusion; hence, the farther away from the coast, the less vulnerable the region is to seawater intrusion. The lowest score was assigned to distance value greater than 1000 m and the highest assigned when the distance is less than 5 m from the coast. In the present research, this parameter is considered constant by neglecting the sea level monthly fluctuations (Figure 3).
3.1.4. Impact of the Existing Status of Seawater Intrusion
In this study, the electrical conductivity was used instead of the ratio Cl/HCO3, which is more commonly utilized. Due to missing data, the ratio data collected could not satisfy the required continuous relative data for the study period; instead, the electrical conductivity was collected from the national groundwater monitoring direction in Benin. Chang et al. [12] has suggested a rating ranges for the electrical conductivity in groundwater vulnerability to seawater intrusion assessment. Based on the suggested ratings ranges, the highest rating of 10 was assigned to electrical conductivity greater than 3000 μs/m and a lowest score of 2 was assigned to values lower than 200 μs/m. Highest values extend from south toward the center, while the west and east parts showed lower values. The average electrical conductivity was rated within the study area and is shown in Figure 3.
3.1.5. Height of Groundwater Level above the Sea Level
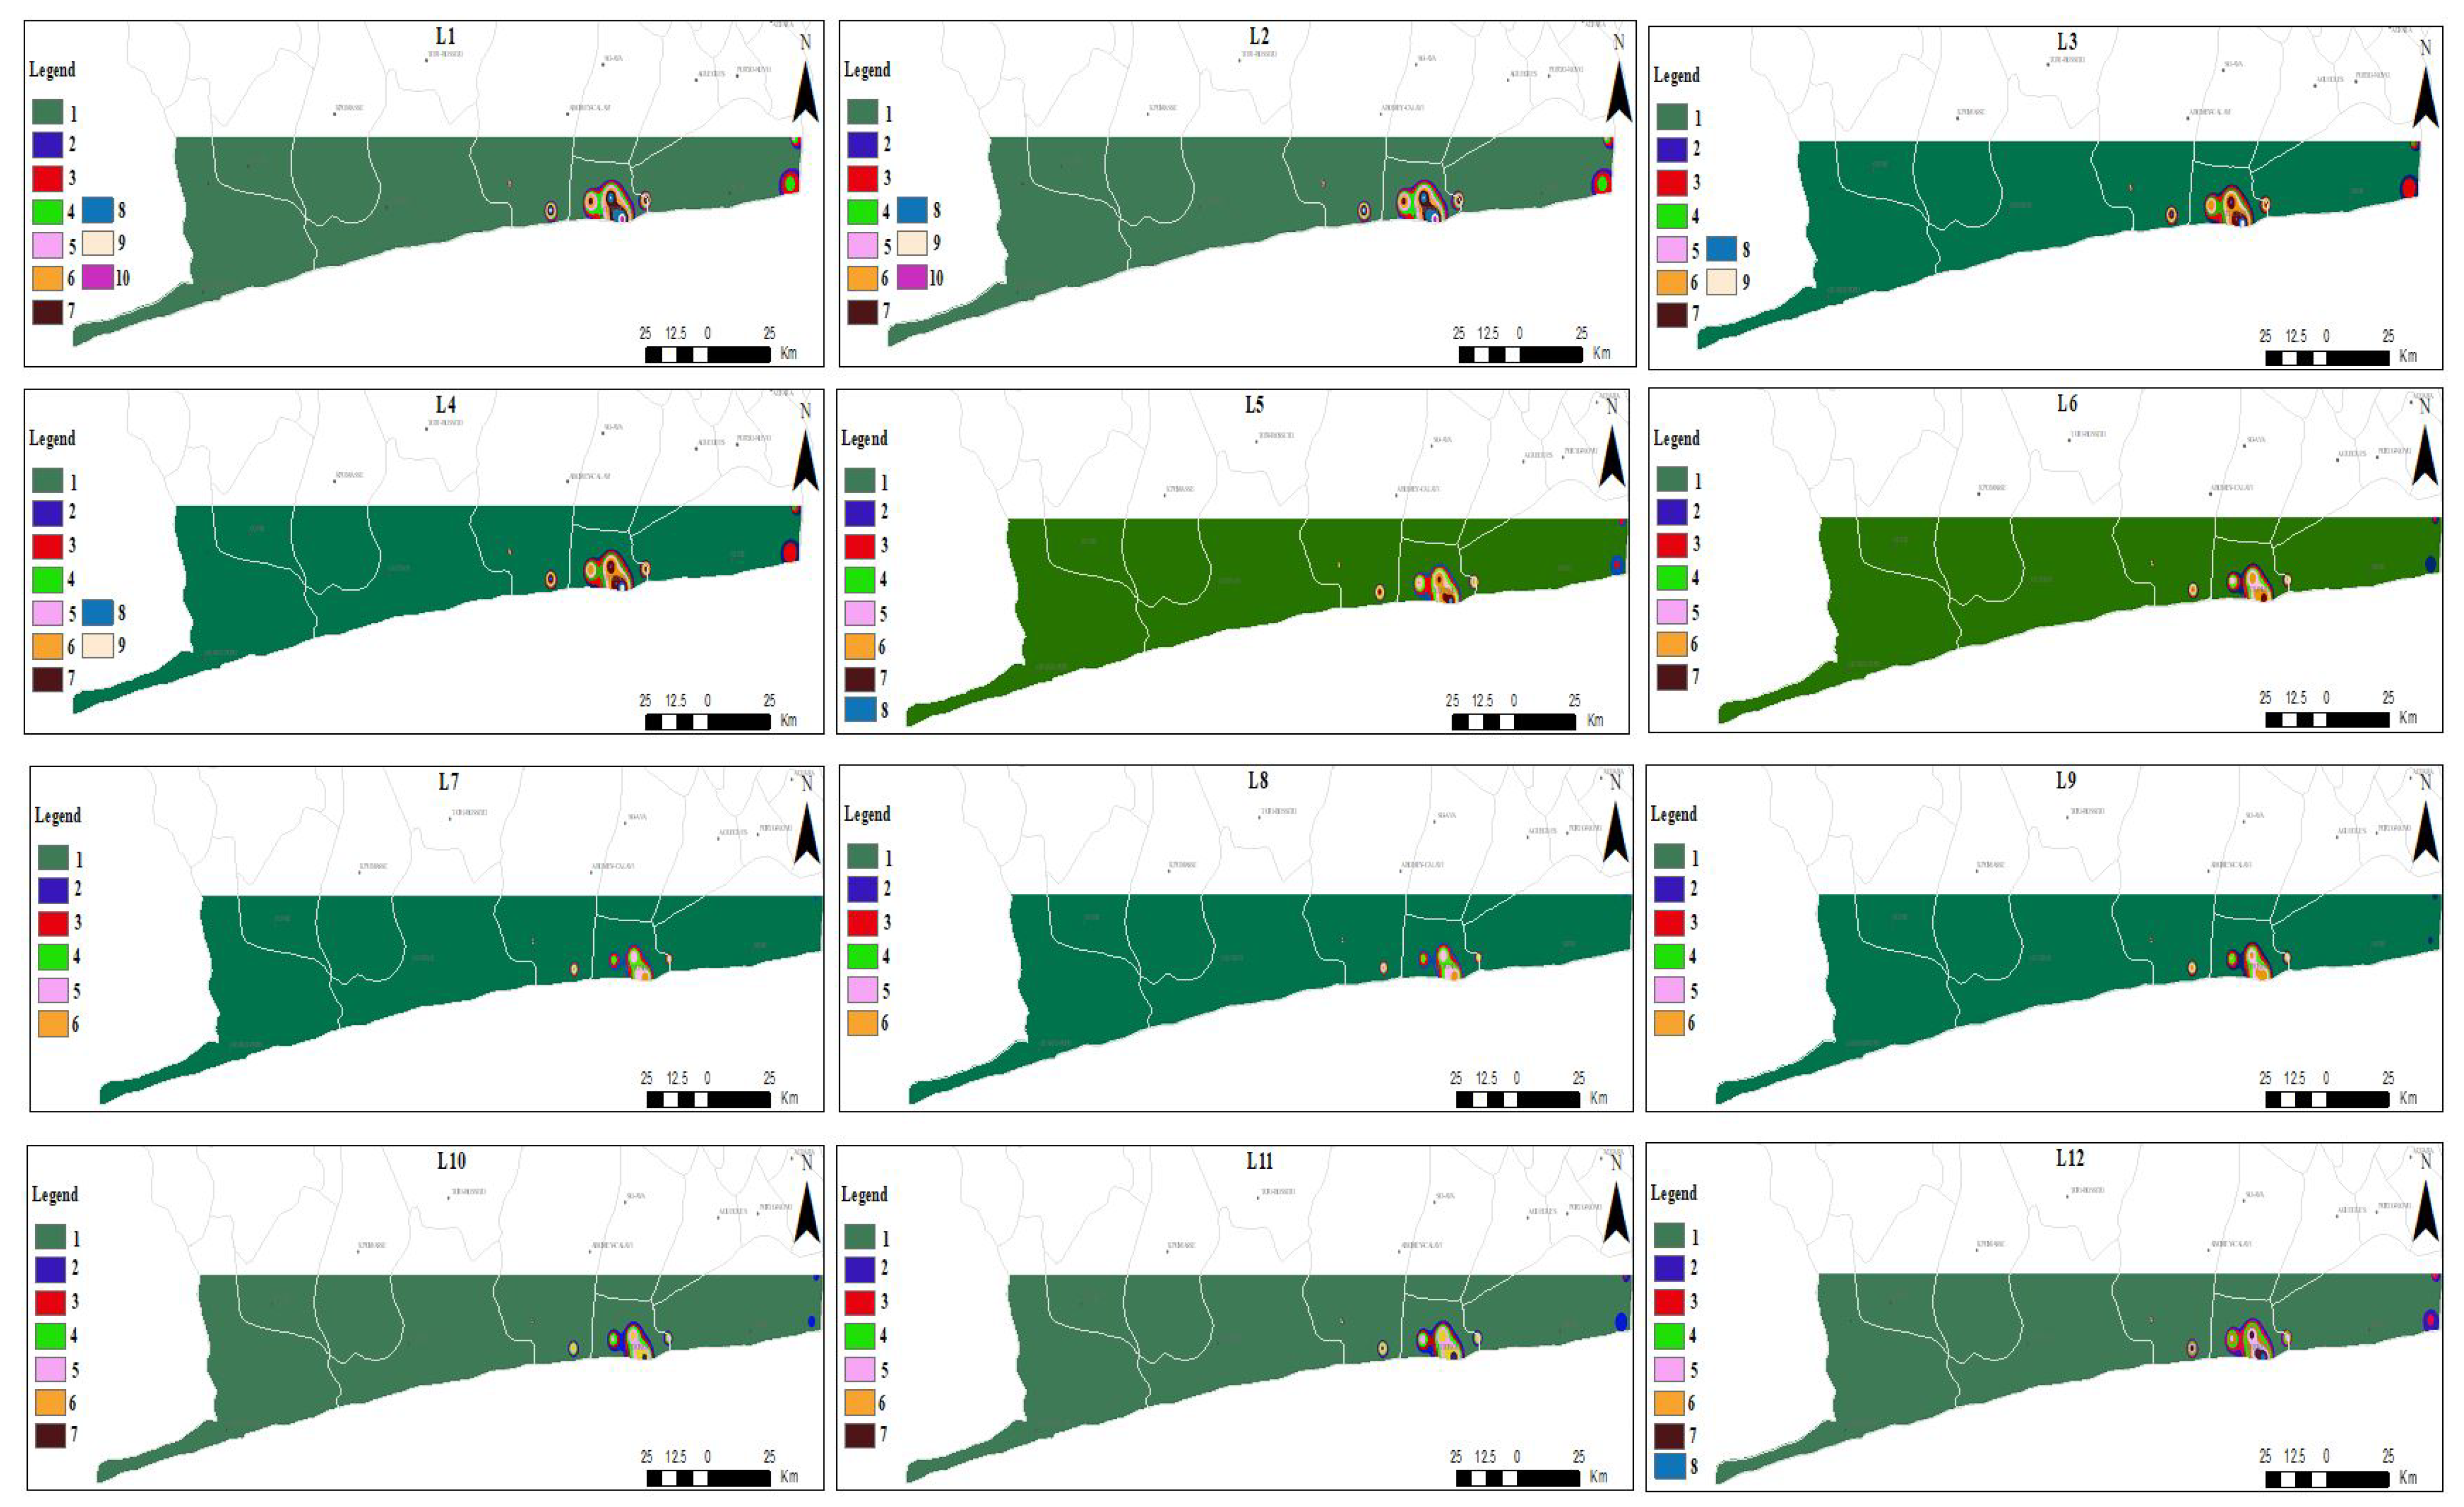
This is one of the most important parameters in aquifer vulnerability to seawater intrusion assessment. It defines the height of groundwater above mean sea level. The aquifer is more vulnerable when L value is less than 1 m if 10 is assigned, and if the level is higher than 2.6 m, the lowest score is assigned. The parameter was considered a dynamic parameter due to its monthly variation. The score in this study was calculated by comparing the observed groundwater level from the sea level with the monthly sea level height obtained at the sea water level stations. The highest average groundwater level above sea level in the research region was 17.60 m in July, while the lowest average was 16.78 m in February. Across the study region, the unconfined aquifer’s groundwater level rises during the rainy season or when there is heavy rainfall from mid-March to mid-August in the main rain season and from mid-September to November in the short rain season. The fluctuations in groundwater level varied by area; however, the highest value is observed approximately during the same period. Because of the minimal rainfall from December to March, and the strong usage of groundwater, the groundwater level lowers rapidly, making it a particularly vulnerable season to SWI. Figure 4 shows the ratings assigned to a five-year average of the L parameter across the study region.
3.1.6. Thickness of the Saturated Aquifer
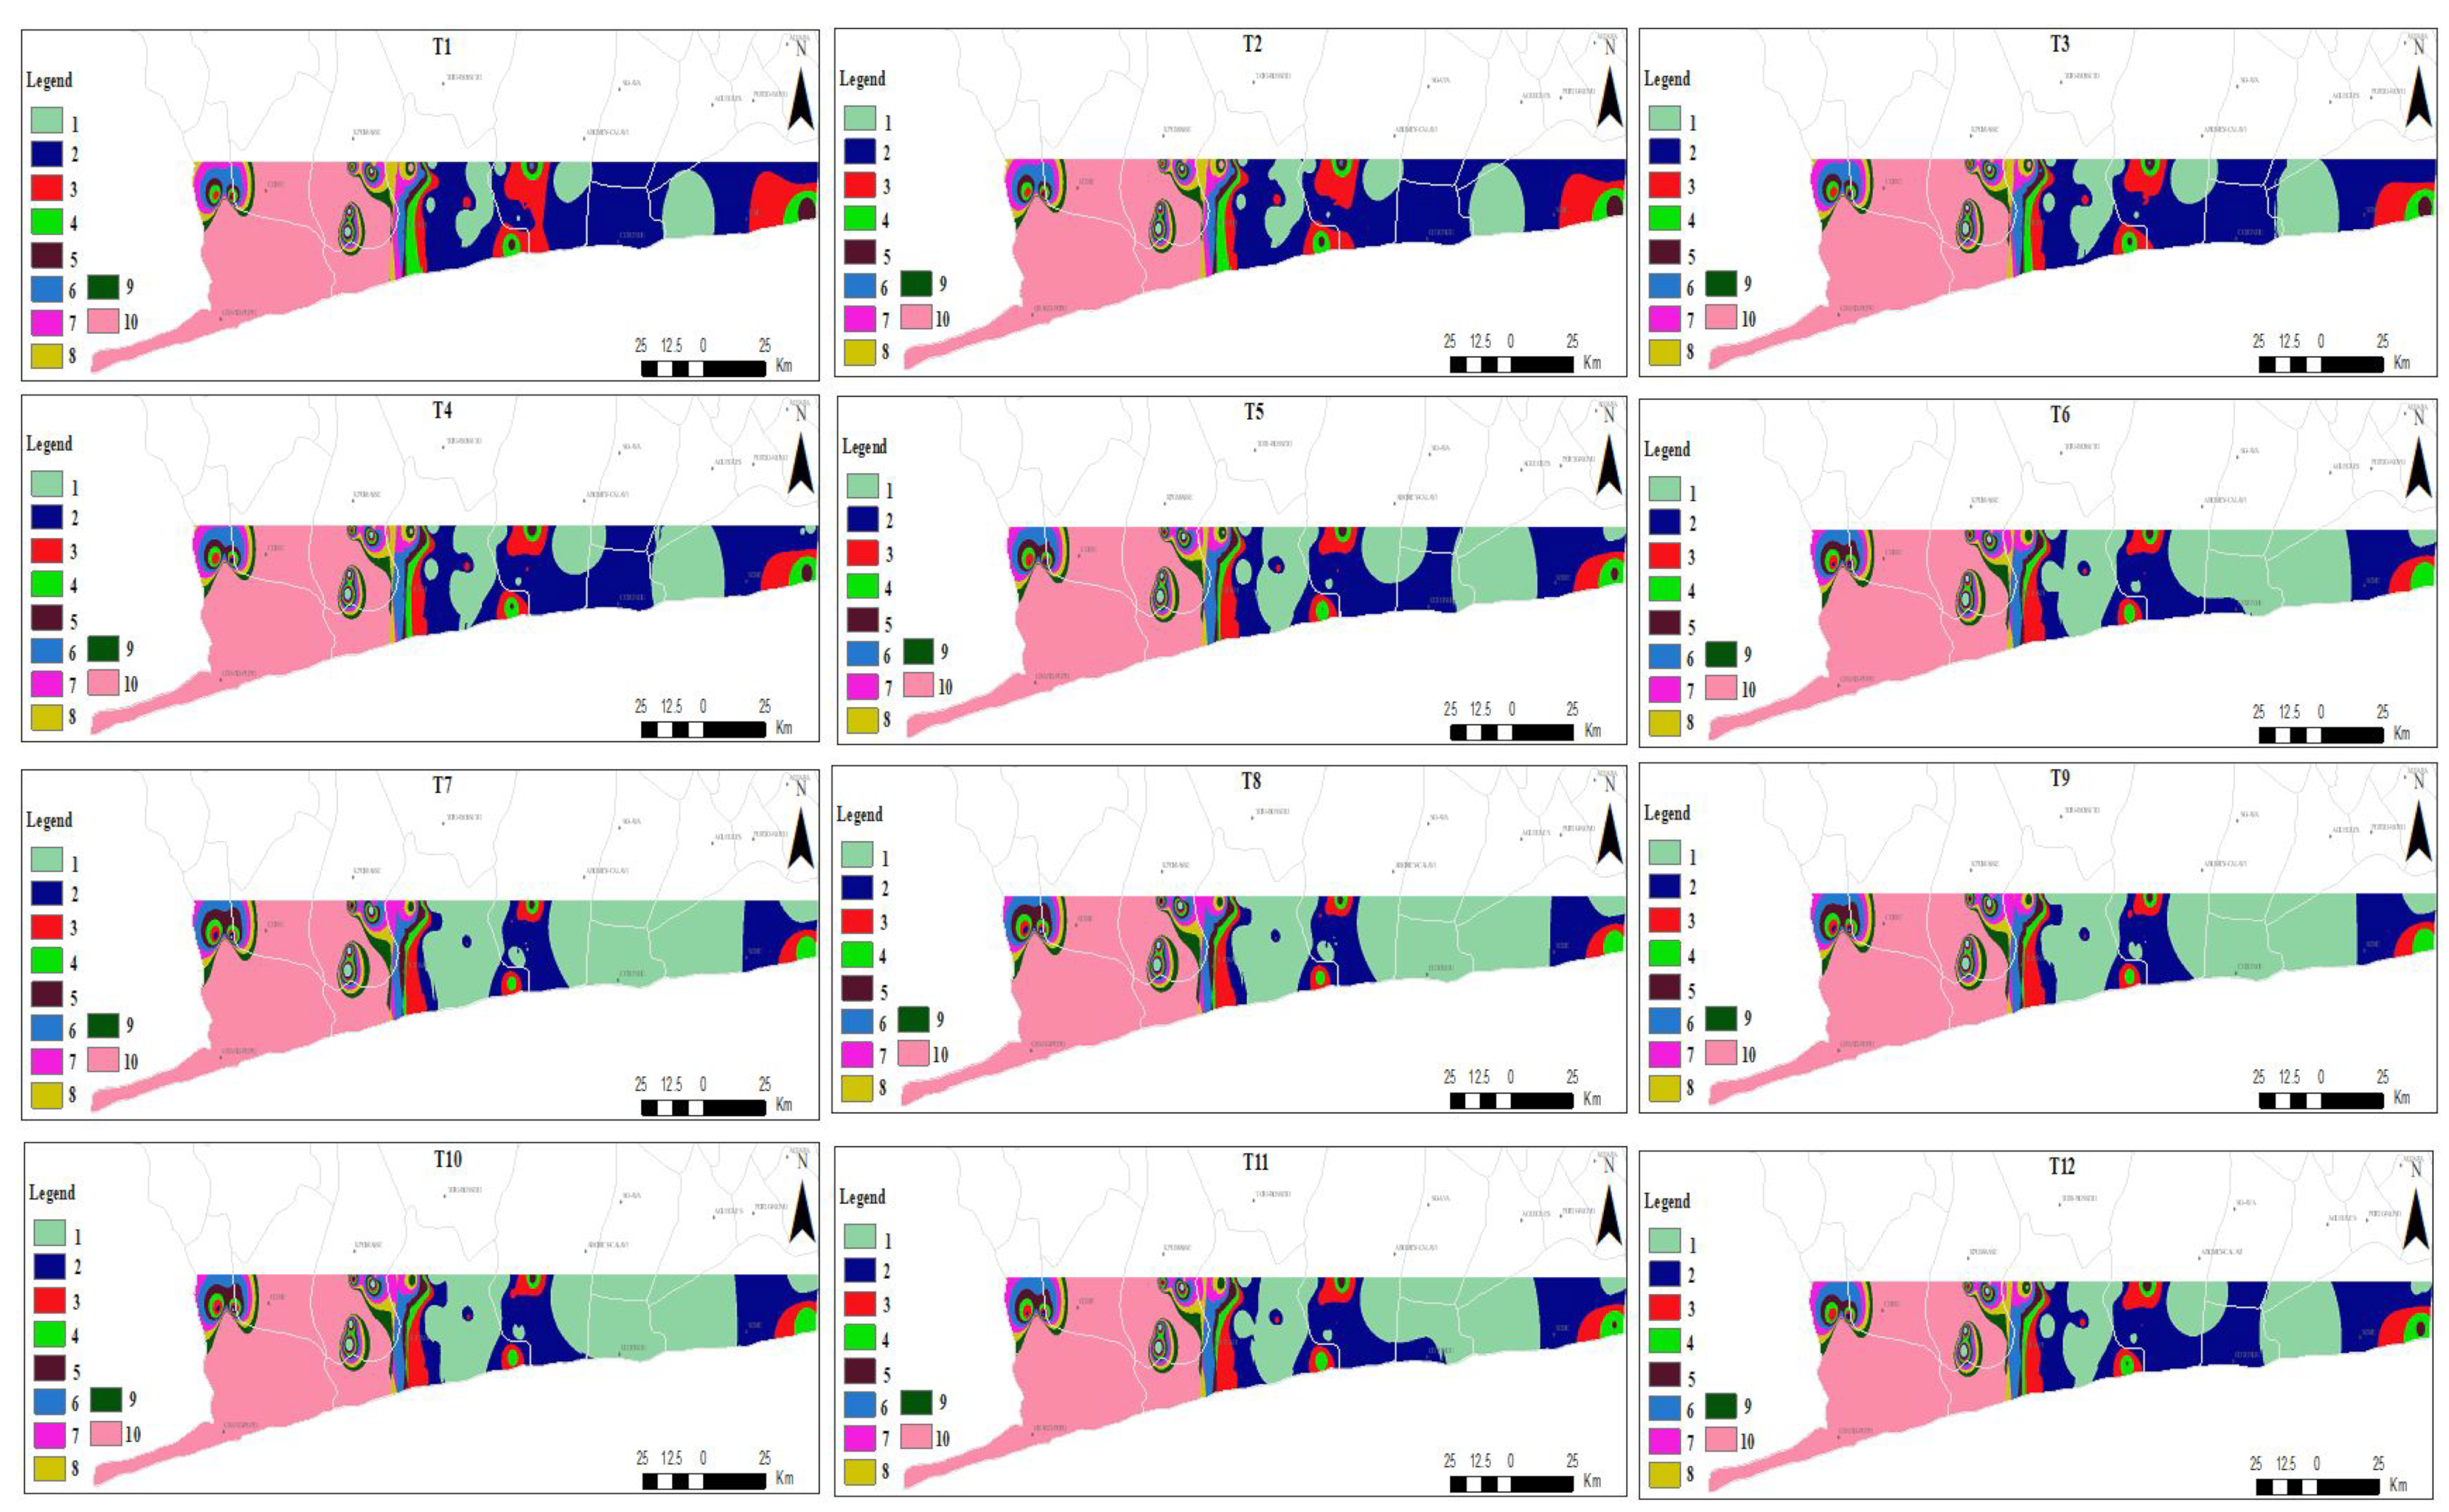
This parameter is estimated by the difference between groundwater level and aquifer’s bottom. The aquifer is most vulnerable to seawater intrusion when the saturation area thickness is higher than 10 m, in which case a score of 10 is assigned, and when the thickness is less than 2 m, the lowest score of 1 is assigned. January was the most susceptible month with an average score of 4.54, while April was the least, with a score of 1.92. T is a groundwater level index that is updated in real time. T is thought to increase between July and August when there is large recharge owing to rainfall and declines from December to March when there is less rainfall and increasing groundwater pumping. The parameter rating for each month is shown in Figure 5.
3.2. GALDIT Index Computation
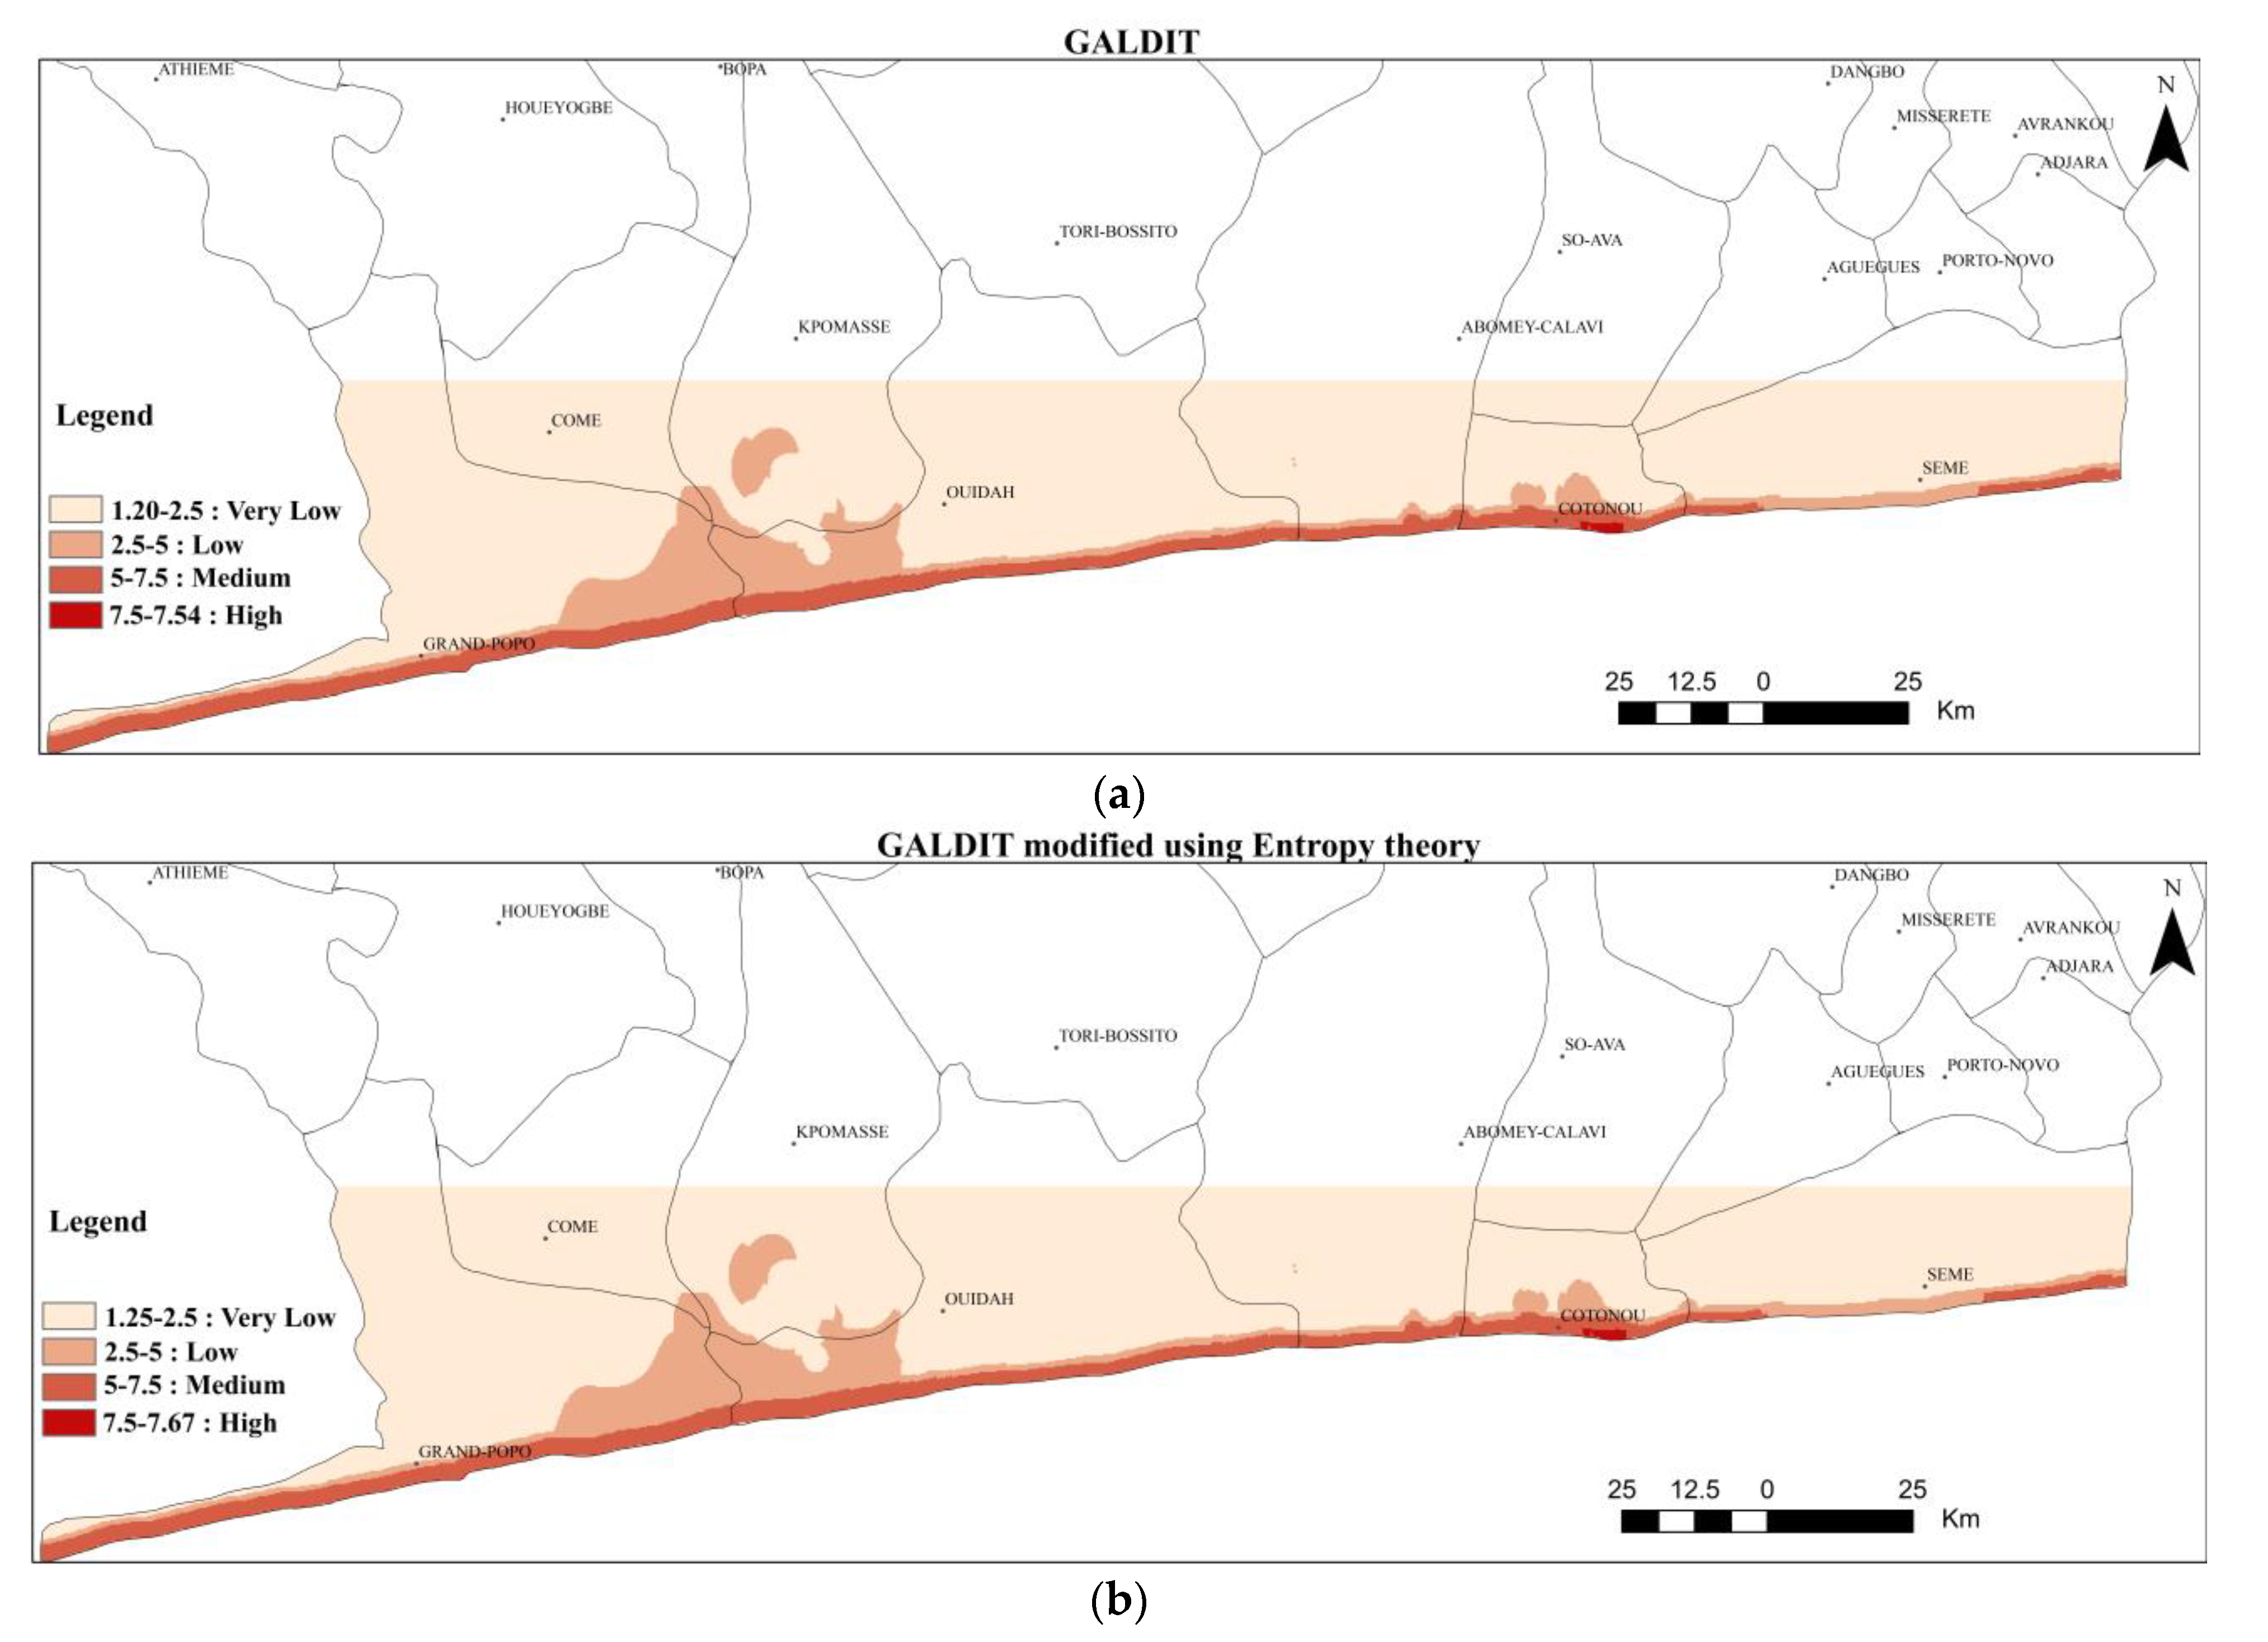
GALDIT vulnerability index represents the average GALDIT index, which was computed using a 5-year average of the dynamic parameters. Figure 6 showed the vulnerability map of average GALDIT index. The average GALDIT was generated, and the vulnerability of the seawater intrusion map was classified into four groups: very low (<2.5), low (2.5–5), medium (5–7.5) and high (>7.5). Based on the average GALDIT map, the whole area extending from about 3 km from the coastline toward the northern part was classified as having very low vulnerability, which covers 917.80 km2 (Table 2). Low vulnerability covers about 133.35 km2 and was found mainly in the southeastern region of the study area (cities of Come, Ouidah, and Grand popo), medium vulnerability was found along the coastal line within a distance less than 1.58 km from the coastline, and high vulnerability was found in a small area of about 1.32 km2 in the region of Cotonou.
3.3. GALDIT Modification Using Shannon’s Entropy Theory
In this section, the weights of GALDIT parameters were modified using entropy theory. To create an entropy matrix, the average rating of each parameter per administrative district was generated in ArcGIS using the “Zonal Statistics Table” tool. Using the methodology described in Section 2.2.2., new weights were generated for each parameter and the modified weights are presented in Table 3.
The modified weights using entropy theory showed that parameter L is the most important in terms of aquifer vulnerability because it has the largest weight, parameter D comes in second, while A comes in third. The impact of the existing status of seawater intrusion has the smallest entropy value, but in terms of modified weight, which shows the importance of each parameter, the aquifer type (G) emerged as the least important parameter in the vulnerability assessment within the study area. The original weight was then substituted by the new weight in Equation (1) and the entropy weight GALDIT vulnerability map was produced in ArcGIS. The vulnerability map is shown in Figure 6. The map is classified into four zones (very low, low, medium, and high vulnerability) based on the vulnerability classes suggested by GALDIT.
Figure 6 shows that more than 80 percent of the study area is classified as very low vulnerability (covering about 994.09 km2 of the study area). Low vulnerability is found along the coastline 1.52 km away from the ocean, covering an average area of 44.98 km2. The medium vulnerability covers an important area of more than 104 km2, extending from the ocean to more than 1.32 km away into the mainland, while high vulnerability is found in the region of Cotonou and Abomey-Calavi in the southeast of the study area, extending over an area of 3.22 km2 and up to 622 m away from the coastline.
3.4. Modified Monthly GALDIT Index
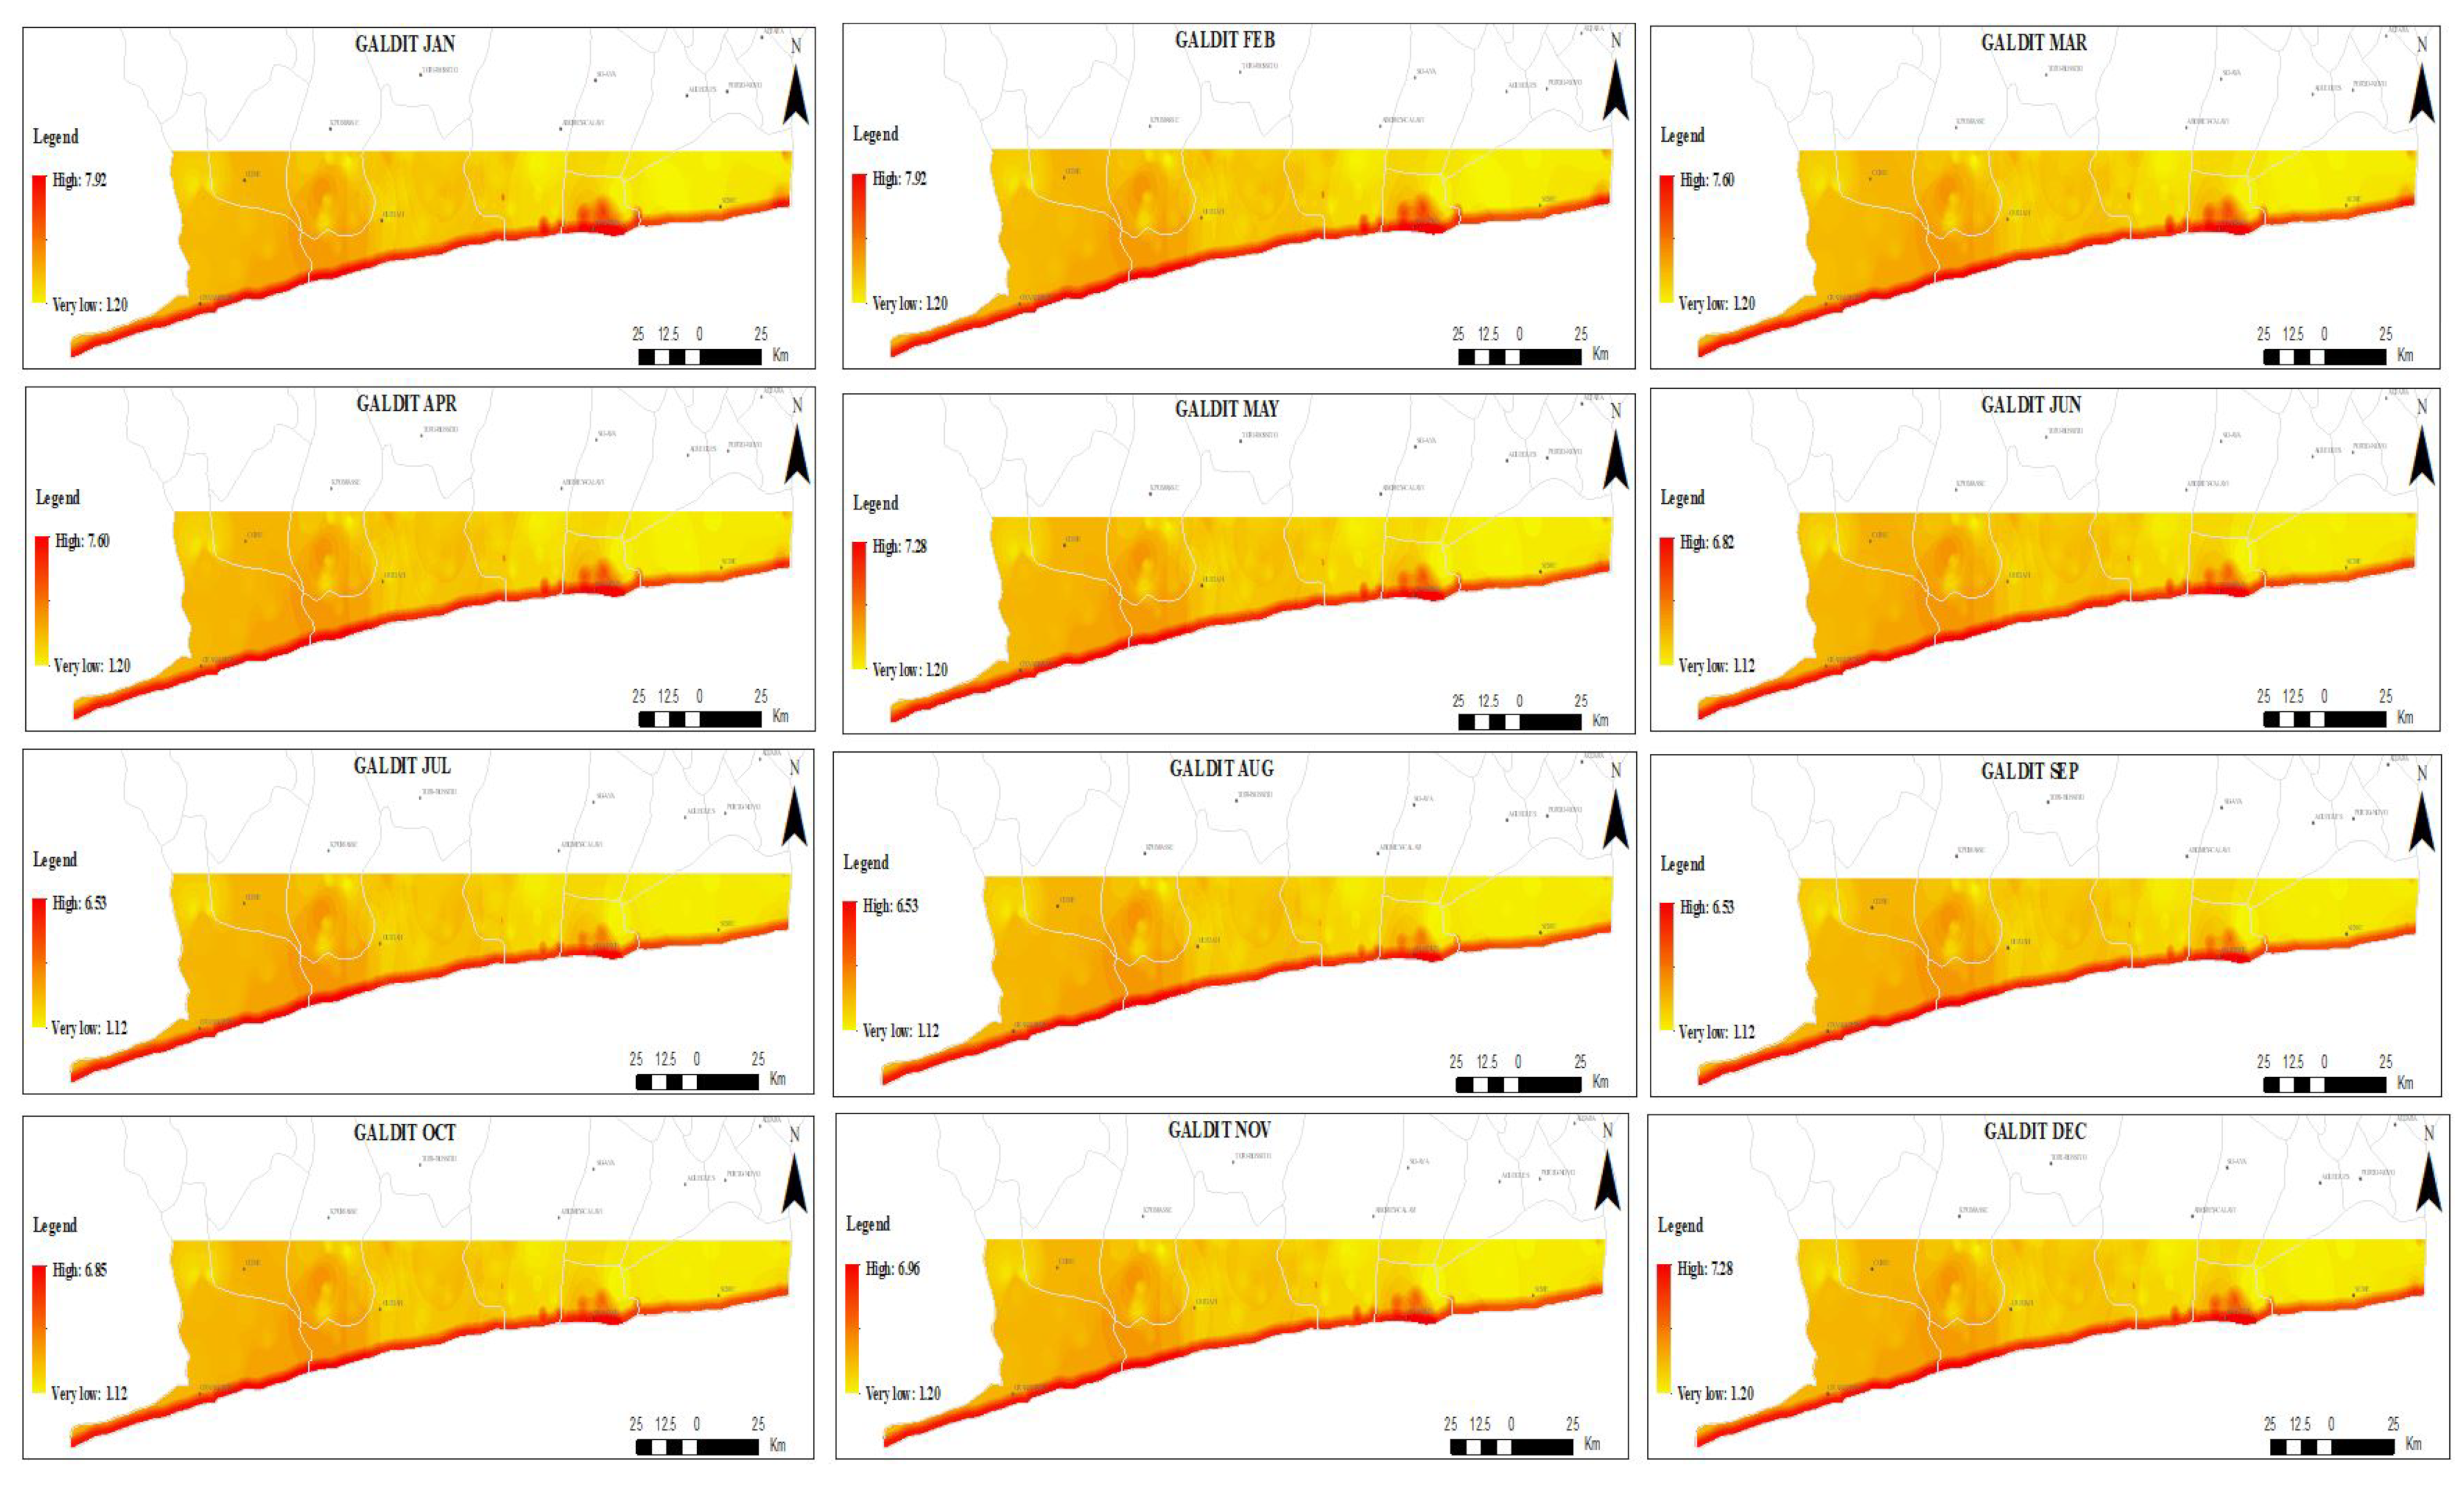
The monthly GALDIT index computation used five-year average monthly data of the dynamic parameters (L and T) and the average data of the constant parameters (G, A, D, and I). Figure 7 showed the GALDIT index of each month. The index value had showed few monthly variations; however, the highest value (up to 7.92) is observed in January and February while the lowest (up to 6.53) is observed from July to September. The period of the highest GALDIT index value corresponds to the main dry season, which is from December to March, and the period of lowest value corresponds to the main wet season, which generally lasts from mid-March to mid-August. In the main wet period, the height of freshwater above the mean sea level recorded by DGEau Benin showed an increase in groundwater level, which decreases a little in August before increasing again in September and finally decreases again in the main dry season. At the same time, the sea level recorded at the nearest stations in Ghana and Nigeria showed that sea level increased in the region in August and September; however, the increase in the sea level was smaller than the increase of the groundwater level. The study area is more vulnerable to seawater intrusion from December to March; a period which corresponds to the main dry season in Benin where the overall territory receives less rainfall and consequently less recharge because the main aquifer in the study region is recharged by direct rainfall infiltration. Less recharge and more exploitation of groundwater resources in that period for agricultural and domestic uses decrease the groundwater level, resulting in the diminution of the height of freshwater above the mean sea level and therefore making the aquifer more vulnerable to seawater intrusion.
3.5. Identifying Most Vulnerable Month Using TOPSIS
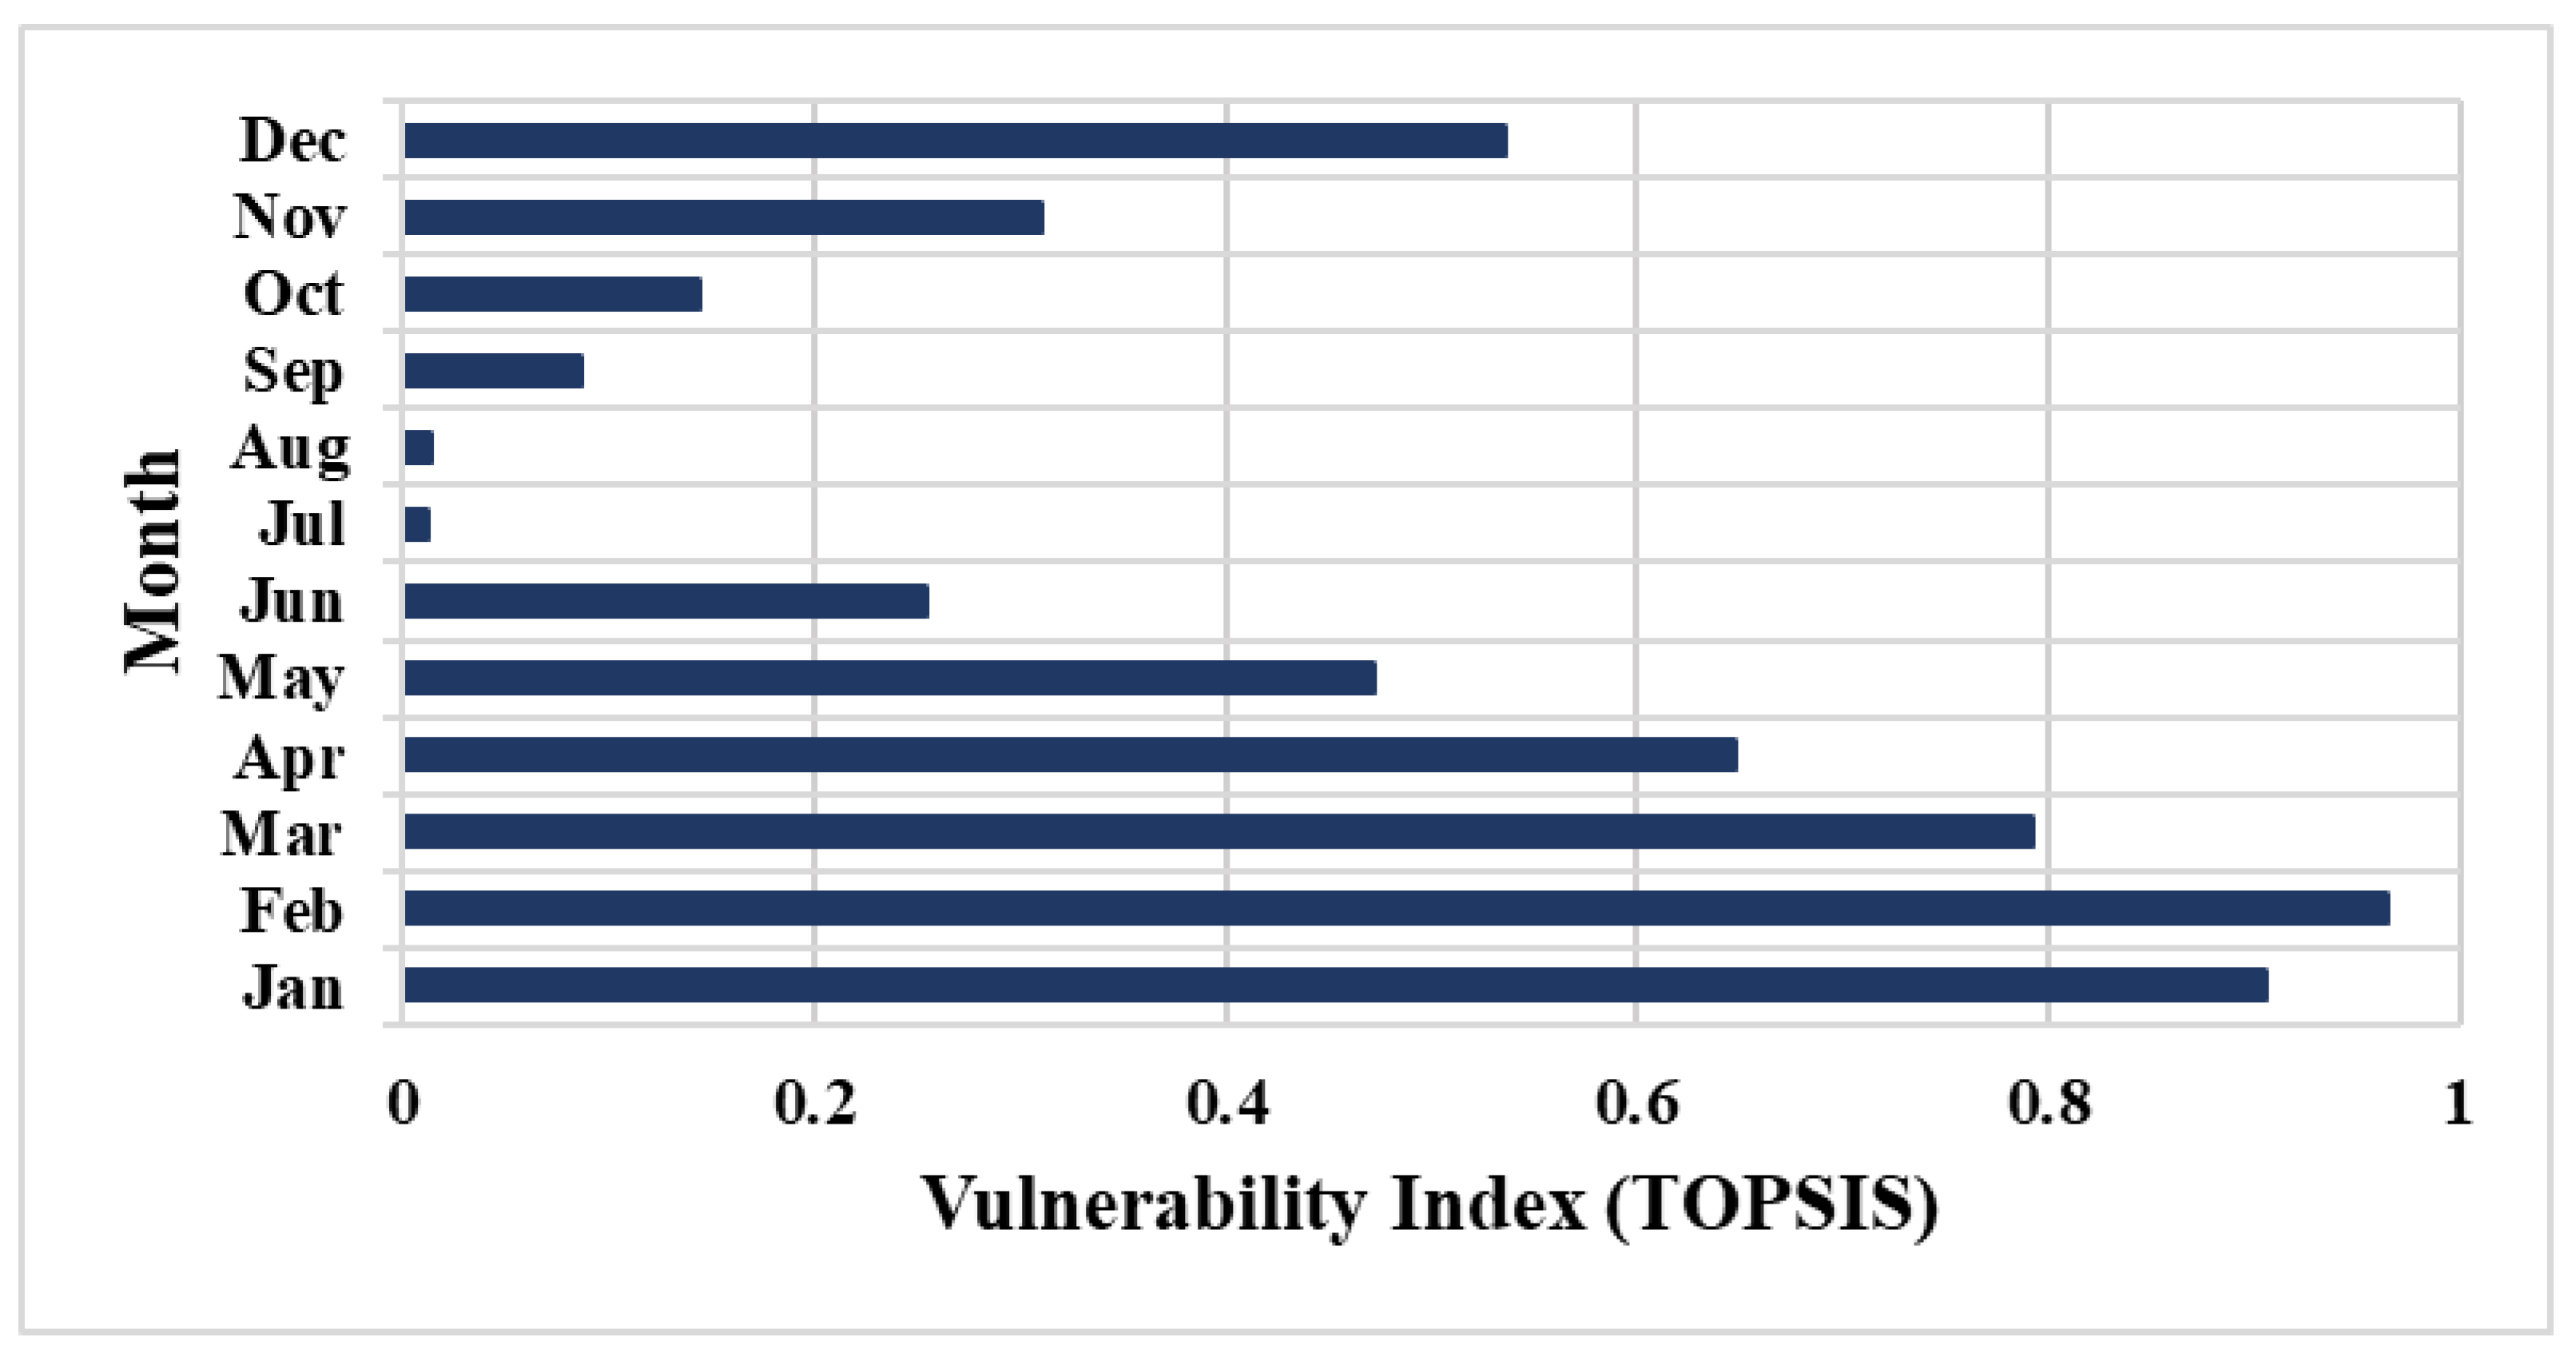
A multicriteria decision-making approach was used in this section to identify the month in which the study area is most vulnerable to seawater intrusion. In addition to the parameters used in this study, the groundwater abstraction rate was collected from integrated groundwater information service of Benin. The average GALDIT index value was generated for each small area in the administrative map of the study area and all the eight parameters were used as input for TOPSIS approach to identify the most vulnerable month. Based on the criteria used in this study for the TOPSIS approach, the highest TOPSIS weight indicate the most vulnerable month. The shortest ideal solution’s rank preference is ascendant in order to select month in which the study area is most vulnerable to seawater intrusion. Figure 8 presents the ideal solution of each month from January to December used for the ranking. The TOPSIS approach ranks February as the most vulnerable month followed by January in the second position and March in the third position. The safest month, in which the study region is less vulnerable to seawater intrusion, is July, followed by August.
3.6. GALDIT Approaches Validation
In order to compare the reliability in the performance of the original GALDIT and the modified GALDIT using entropy theory, TDS concentration data were collected over a recent period of six years. After calculating the average TDS concentration, Pearson’s correlation and Spearman’s rank correlation coefficients were calculated for GALDIT-TDS concentration and entropy weight GALDIT-TDS concentrations (Table 4). For both methods, the correlation between the entropy weight GALDIT and TDS concentration is greater than the correlation between GALDIT and TDS concentration. The highest correlation between the modified GALDIT and TDS concentration implies that the modified GALDIT performed better than GALDIT in presenting the vulnerability of the research region closer to reality.
3.7. Sensitivity Analysis
Sensitivity analysis is used in this section to determine the most relevant and influent variables in the assessment of groundwater vulnerability to seawater intrusion. This is crucial for both professionals who design vulnerability models and users who use vulnerability maps. It can help the vulnerability map users comprehend the vulnerability index more effectively. To assess the impact of each individual parameter on the final groundwater risk map, this article employed single parameter sensitivity and map removal sensitivity analysis.
3.7.1. Single Parameter Sensitivity Analysis
3.7.2. Map Removal Sensitivity Analysis
The principle of this method consists of calculating the sensitivity of each parameter by removing one parameter at once. It is calculated by the following equation (Babiker et al. [27]):
where V’ denotes the modified GALDIT index, V is the overall GALDIT index, and n and N denote the number of input layers used to calculate V’ and V, respectively. S denotes the sensitivity value. The sensitivity of each removal parameter is shown in Table 6.
Both sensitivity analysis methods identified three parameters which highly influence the overall vulnerability map: distance from shoreline, height of groundwater level above the mean sea level, and thickness of the saturated aquifer. These three parameters are important in the vulnerability to seawater intrusion assessment in the study region. Understanding their fluctuation is important for the better interpretation of the vulnerability map produced by GALDIT. The parameter with the least vulnerability to seawater intrusion assessment in the study region is the aquifer type (G). This parameter has the smallest weight and sensitivity according to both methods.
4. Discussion
The problem of groundwater salinity and saltwater intrusion induced by the overexploitation of natural resources is one of the elements determining aquifer vulnerability (Bordbar et al. [18]). Seawater incursion creates an imbalance between freshwater and seawater interface (Motevalli et al. [28]). Therefore, monitoring and prevention are now required to protect groundwater resources (Busico et al. [29]). Strategies, such as mapping the vulnerability of coastal aquifers to seawater intrusion, are crucial and necessary for groundwater quality and quantity preservation.
The actual paper assessed coastal aquifer vulnerability to seawater intrusion in the southern coastal region of Benin using GALDIT. Various research has modified the GALDIT index by modifying the original parameter’s weight, ratings, or by adding new parameters. Modifying this index method based on entropy theory improved the method by providing more reliable results for the vulnerability map. Bordbar et al. [18] confirmed the performance of the entropy theory. Combined, GALDIT modified using entropy and the Wilcoxon test provided a suitable vulnerability map. Yu et al. [24] also used entropy theory to modify the weights of DASTIC parameters based on the level of variance of parameters and the relative importance of each parameter. Agossou et al. [30] determined the weights of DRASTIC parameters based on entropy theory. Taking steps from the previous research, this study modified the weight of GALDIT parameters based on the importance of each parameter and the levels of variance. Entropy theory improved the method by reducing the uncertainty and provide more accurate results. The modified weight showed that L has the highest weight, followed by D and A, respectively. G is the parameter with the lowest weight. The results of this research proved that entropy theory improved the modified GALDIT and increased the correlation between modified GALDIT and TDS from 0.537 to 0.739. The correlations from this study are ranged in the same order with results from Bordbar et al. [18] and Agossou et al. [30]. For preliminary verification, our study was compared to the results of a geophysical investigations conducted by Sognon et al. [31] in the Continental Terminal aquifer near the southern side of Lake Nokoué, which is part of the study area. The geophysical survey results showed salt intrusion migrating from Lake Nokoué toward the GODOMEY pumping station (a few kilometers from the lake), which is consistent with the results of the present study, as shown in Figure 6, illustrating the salt migration peak in the region of Cotonou and Abomey-Calavi. Previous research by Boukari et al. [20] verified the geophysical results by revealing an effective salt intrusion at the GODOMEY pumping station from Lake Nokoué using just electrical conductivity. Furthermore, the high vulnerability to seawater intrusion found in this study was previously reported by various studies of the region, such as Sognon et al. [31], which discovered seawater incursion several kilometers inland using only groundwater major ion concentrations. According to the research, Abomey-Calavi’s Continental terminal aquifer contains high chloride ions values and TDS in the southern section at Godomey; the observed high value of chloride ions is due to saltwater contamination. Similarly, saltwater intrusion in the same area is determined by this study to be a significant issue.
The monthly GALDIT index demonstrated that the study region is less vulnerable to seawater intrusion from June to October. From December to March the GALDIT index showed the highest values, indicating that the area is more vulnerable in that period. The TOPSIS approach identified February as the most vulnerable month for coastal aquifer in the coastal region of Benin due to the decrease of groundwater level in that period and the increase of the mean sea level. It is worth noting that the most vulnerable month is also marked by the increase of the saturated aquifer, which increased the vulnerability to seawater intrusion. The less vulnerable period corresponds to the main wet season where the recharge of the aquifer by heavy rain increases the groundwater level to above the mean sea level. During that period the aquifer is less vulnerable due to the increase of water level, which is directly recharged by rainfall; however, the vulnerability starts to increase when groundwater starts decreasing due to less rainfall and more pumping for irrigation and domestic water supply. The study has first confirmed the seawater intrusion in the south of Benin, which had previously been highlighted by a few researchers, but its difference from other research is the study of the seasonality and use of TOPSIS to identify the most vulnerable month in the study area.
Various initiatives have recently been carried out to reduce and avoid harm caused by seawater intrusion. One method of reducing the impact of existing seawater intrusion is to establish seawater pumping or freshwater injection wells in the region where seawater intrusion has developed. Both seawater pumping at the bottom and freshwater injection at the area’s periphery are being researched as approaches to mitigate SWI damage in advance. SWI damage might be successfully reduced and sustainable groundwater consumption in coastal regions achieved if intensive response measures are deployed to vulnerable areas using the methodologies of this study and operational plans are developed with the most vulnerable time in mind. The results from this study will be particularly important and inevitable if planners and decision makers become concerned by the problem of seawater intrusion mitigation in the coastal area of Benin.
5. Conclusions
SWI into coastal aquifers is becoming a global problem which has been underlined by many researchers in various geographical locations. Therefore, for the sustainable and appropriate groundwater utilization in coastal areas, an accurate diagnostic of SWI vulnerability is required. Among the various SWI vulnerability mapping methods, GALDIT is generally used to produce representative values. The method is based on weights and ratings assigned to the input parameters. The present study used the modified rating and attempted to modify the relative weight using Shannon’s entropy theory to reduce the uncertainty in the subjective nature of assigning weights and ratings. The study used the classic GALDIT to assess SWI into the coastal region of Benin and after modifying the original method, the results are presented. The original and modified methods were validated using TDS concentration. Pearson’s correlation and Spearman rank correlation coefficient were calculated between GALDIT index and TDS concentration. The correlation coefficient ranged from 0.518 to 0.739, while the highest value was observed between GALDIT modified using entropy and TDS concentration. The modification of GALDIT parameter original weights using Shannon’s entropy improved the method.
The final map produced by GALDIT modified using Shannon’s entropy is more compatible with the actual pollution conditions of the research region. The vulnerability assessment revealed that the regions of Cotonou and Abomey-Calavi along the shoreline are more vulnerable to seawater intrusion.
The monthly GALDIT index calculated in this study has shown the seasonal SWI vulnerability in the study region. From 2015 to 2019, February emerged as the most vulnerable month when SWI intrusion is severe, due to the decrease of groundwater level from December to March, which is caused by less rainfall and increased groundwater pumping for domestic use and irrigation.
Sensitivity analysis was performed using the single parameter sensitivity and map removal sensitivity analysis methods. Based on both methods, the height of the groundwater level above the mean sea level, distance from shore, and aquifer hydraulic conductivity are the parameters with most impact on SWI vulnerability across the study area. Thus, for future research, the accuracy in these parameters data collection is important for better seawater intrusion vulnerability mapping and the better interpretation of the vulnerability map.
This research can help planning and management decisions to prevent groundwater pollution in the studied region. It may also be used to check the quality of groundwater. In general, the improved models can be successful in determining the areas impacted by saltwater intrusion and the most vulnerable period. Furthermore, it is a technique for assessing water resource management plans that takes into account sensitive periods for the long-term functioning of coastal groundwater.
Author Contributions
Conceptualization, A.A. and J.-B.L.; methodology, J.-S.Y.; software, A.A.; validation, J.-S.Y., Y.-W.J. and J.-S.S.; formal analysis, J.-S.Y.; investigation, Y.-W.J.; resources, J.-S.S.; data curation, J.-B.L.; writing—original draft preparation, A.A., J.-B.L. and J.-S.Y.; writing—review and editing, Y.-W.J.; visualization, J.-S.S.; supervision, J.-S.Y.; project administration, J.-S.Y.; funding acquisition, J.-S.Y. All authors have read and agreed to the published version of the manuscript.
Funding
This research was funded by the Korea Environmental Industry and Technology Institute (KEITI) through the Demand Responsive Water Supply Service Program (No. 146526), funded by the Korean Ministry of Environment (MOE). The project funding period is from 2020 to 2022.
Data Availability Statement
Please contact the first author. Dynamic parameter monthly data available from 2015 to 2019.
Acknowledgments
This study was conducted in the hydraulic laboratory of Kookmin University (Seoul, South Korea) to provide an update about seawater intrusion in Benin’s coastal region. Data sharing from DGEau and SONEB is appreciated, and future collaborations are expected.
Conflicts of Interest
The authors declare no conflict of interest.
References
- Poeter, E.P.; Woessner, W.W. Hydrologic Properties of Earth Materials and Principles of Groundwater Flow; The Groundwater Project: Guelph, ON, Canada, 2020. [Google Scholar]
- Boufekane, A. Assessment of groundwater pollution by nitrates using intrinsic vulnerability methods: A case study of the Nil valley groundwater (Jijel, North-East Algeria). Afr. J. Environ. Sci. Technol. 2013, 7, 949–960. [Google Scholar] [CrossRef]
- Taghavi, N.; Niven, R.K.; Paull, D.J.; Kramer, M. Groundwater vulnerability assessment: A review including new statistical and hybrid methods. Sci. Total Environ. 2022, 822, 153486, ISSN 0048-9697. [Google Scholar] [CrossRef] [PubMed]
- Barbulescu, A.; Dumitriu, C.S. Assessing Water Quality by Statistical Methods. Water 2021, 13, 1026. [Google Scholar] [CrossRef]
- Najafzadeh, M.; Homaei, F.; Mohamadi, S. Reliability Evaluation of Groundwater Quality Index Using Data-Driven Models. Environ. Sci. Pollut. Res. Int. 2021, 29, 8174–8190. [Google Scholar] [CrossRef]
- Kuo, Y.M.; Liu, C.W.; Lin, K.H. Evaluation of the Ability of an Artificial Neural Network Model to Assess the Variation of Groundwater Quality in an Area of Blackfoot Disease in Taiwan. Water Res. 2004, 38, 148–158. [Google Scholar] [CrossRef]
- Moghaddam, H.K.; Jafari, F.; Javadi, S. Vulnerability evaluation of a coastal aquifer via GALDIT model and comparison with DRASTIC index using quality parameters. Hydrol. Sci. J. 2017, 62, 137–146. [Google Scholar] [CrossRef]
- Chachadi, G.; Lobo-Ferreira, J.P. Sea water intrusion vulnerability mapping of aquifers using the GALDIT method. Coastin Newsl. 2001, 4, 7–9. [Google Scholar]
- Ivkovic, K.M.; Dixon-Jain, P.; Marshall, S.K.; Sundaram, B.; Clarke, J.D.A.; Wallace, L.; Werner, A.D. A National-Scale Vulnerability Assessment of Seawater Intrusion: Literature Review, Data Review, and Method Development. Record 2013/03; Geoscience Australia: Canberra, ACT, Australia, 2012. [Google Scholar]
- Chachadi, A.G.; Lobo-Ferreira, J.P.; Noronha, L.; Choudri, B.S. Assessing the Impact of Sea-Level Rise on Saltwater Intrusion in Coastal Aquifers using GALDIT, APRH/CEAS; Seminário Sobre Águas Subterrâneas: Lisbon, Portugal, 2003. [Google Scholar]
- Chachadi, A.G.; Lobo-Ferreira, J.P. Assessing aquifer vulnerability to seawater intrusion using GALDIT method: Part 2, GALDIT indicators description. Water Celt Ctries. Quant. Qual. Clim. Var. 2007, 310, 172–180. [Google Scholar]
- Chang, S.W.; Chung, I.-M.; Kim, M.-G.; Tolera, M.; Koh, G.-W. Application of GALDIT in Assessing the Seawater Intrusion Vulnerability of Jeju Island, South Korea. Water 2019, 11, 1824. [Google Scholar] [CrossRef] [Green Version]
- Recinos, N.; Kallioras, A.; Pliakas, F.; Schuth, C. Application of GALDIT index to assess the intrinsic vulnerability to seawater intrusion of coastal granular aquifers. Environ. Earth Sci. 2015, 73, 1017–1032. [Google Scholar] [CrossRef]
- Najib, S.; Grozavu, A.; Mehdi, K.; Breaban, I.G.; Guessir, H.; Boutayeb, K. Application of the method GALDIT for the cartography of groundwaters vulnerability: Aquifer of Chaouia coast (Morocco). Sci. Ann. Alexandru Ioan Cuza Univ. Iasi Geogr. Ser. 2012, 58, 77–88. [Google Scholar] [CrossRef]
- Tasnim, Z.; Tahsin, S. Application of the Method of Galdit for Groundwater Vulnerability Assessment: A Case of South Florida. Asian J. Appl. Sci. Eng. 2016, 5, 27–40. [Google Scholar]
- Lobo-Ferreira, J.P.; Chachadi, A.G.; Diamantino, C.; Henriques, M.J. Assessing aquifer vulnerability to seawater intrusion using the GALDIT method: Part 1, application to the Portuguese Monte Gordo aquifer. In Proceedings Water in Celtic Countries: Quantity, Quality and Climate Variability; IAHS Publication 310; Lobo-Ferreira, J.P., Viera, J.M., Eds.; International Association of Hydrological Sciences: Wallingford, UK, 2007; pp. 161–171. [Google Scholar]
- Ih, K.; Chung, I.; Chang, S.W. Development of monthly seawater intrusion vulnerability assessment method using GALDIT. 2021. Available online: https://www.authorea.com/users/406922/articles/517404-development-of-monthly-seawater-intrusion-vulnerability-assessment-method-using-galdit?commit=0faad366ac6a2532760d8c2b8fa1a765d421770d (accessed on 13 February 2022).
- Bordbar, M.; Neshat, A.; Javadi, S. Modification of the GALDIT framework using statistical and entropy models to assess coastal aquifer vulnerability. Hydrol. Sci. J. 2019, 64, 1117–1128. [Google Scholar] [CrossRef]
- Kazakis, N.; Voudouris, K.S. Groundwater vulnerability and pollution risk assessment of porous aquifers to nitrate: Modifying the DRASTIC method using quantitative parameters. J. Hydrol. 2015, 525, 13–25. [Google Scholar] [CrossRef]
- Boukari, M.; Viane, P.; Azonsi, F. Three-dimensional modeling of a coastal sedimentary basin of southern Benin (West Africa). In Applied Groundwater Studies in Africa, IAH Selected Paper on Hydrogeology; Adelana, S.M.A., MacDonald, A.M., Eds.; CRC Press: Boca Raton, FL, USA, 2008; Volume 13, pp. 437–456. [Google Scholar]
- Saidi, S.; Bouri, S.; Dhia, H.B. Groundwater management based on GIS techniques, chemical indices and vulnerability to seawater intrusion modelling: Application to the Mahdia–ksour Essaf aquifer, Tunisia. Environ. Earth Sci. 2013, 70, 1551–1568. [Google Scholar] [CrossRef]
- Chachadi, A.G. Seawater intrusion mapping using modified GALDIT indicator model-case study in Goa. Jalvigyan Sameeksha 2005, 20, 29–45. [Google Scholar]
- Mishra, S.; Ayyub, B.M. Shannon entropy for quantifying uncertainty and risk in economic disparity. Risk Anal. 2019, 39, 2160–2181. [Google Scholar] [CrossRef]
- Yu, C.; Zhang, B.X.; Yao, Y.Y.; Meng, F.H.; Zheng, C.M. A field demonstration of the entropy-weighted fuzzy DRASTIC method for groundwater vulnerability assessment. Hydrol. Sci. J. 2012, 57, 1420–1432. Available online: https://www.researchgate.net/publication/254241118 (accessed on 13 February 2022). [CrossRef] [Green Version]
- Hwang, C.L.; Yoon, K. Multiple Attribute Decision Making: Methods and Applications; Springer: New York, NY, USA, 1981. [Google Scholar] [CrossRef]
- Zulqarnain, R.M.; Saeed, M.; Ahmad, N.; Dayan, F.; Ahmad, B. Application of TOPSIS Method for Decision Making. Int. J. Sci. Res. Math. Stat. Sci. 2020, 7, 76–81. [Google Scholar]
- Babiker, I.S.; Mohamed, M.A.; Hiyama, T.; Kato, K. A GIS-based DRASTIC model for assessing aquifer vulnerability in Kakamigahara Heights, Gifu Prefecture, central Japan. Sci. Total Environ. 2004, 345, 127–140. [Google Scholar] [CrossRef]
- Motevalli, A.; Moradi, H.R.; Javadi, S. A Comprehensive evaluation of groundwater vulnerability to saltwater up-coning and sea water intrusion in a coastal aquifer (case study: Ghaemshahr-juybar aquifer). J. Hydrol. 2018, 557, 753–773. [Google Scholar] [CrossRef]
- Busico, G.; Kazakis, N.; Cuoco, E.; Colombani Nicolo Tedesco, D.; Voudouris, K.; Mastrocicco, M. A novel hybrid method of specific vulnerability to anthropogenic pollution using multivariate statistical and regression analyses. Water Res. 2020, 171, 115386. [Google Scholar] [CrossRef]
- Agossou, A.; Yang, J. Comparative study of groundwater vulnerability to contamination assessment methods applied to the southern coastal sedimentary basin of Benin. J. Hydrol. Reg. Stud. 2021, 35, 100803. [Google Scholar] [CrossRef]
- Sognon, L.M.; Yalo, N.; Lawson, F.A.; Alle, C. Geophysical characterization of salted bevel of the continental terminal aquifer at the southwestern edge of lake Nokoué in Benin. Larhyss J. 2018, 34, 69–95, ISSN 1112-3680. [Google Scholar]
Figure 1.
Study area geographical location and geologic units.

Figure 2.
Overall methodology flowchart.

Figure 3.
Map of constant parameters rating. G: groundwater occurrence; A: aquifer hydraulic conductivity; D: distance from shore; I: impact of existing status of seawater intrusion.
Figure 3.
Map of constant parameters rating. G: groundwater occurrence; A: aquifer hydraulic conductivity; D: distance from shore; I: impact of existing status of seawater intrusion.

Figure 4.
Map of dynamic parameter rating average monthly height of groundwater level above sea level (L); L1: January; L2: February; L3: March; L4: April; L5: May; L6: June; L7: July; L8: August; L9: September; L10: October; L11: November; L12: December.
Figure 4.
Map of dynamic parameter rating average monthly height of groundwater level above sea level (L); L1: January; L2: February; L3: March; L4: April; L5: May; L6: June; L7: July; L8: August; L9: September; L10: October; L11: November; L12: December.

Figure 5.
Map of dynamic parameter rating average monthly saturated thickness of aquifer (T). T1: January; T2: February; T3: March; T4: April; T5: May; T6: June; T7: July; T8: August; T9: September; T10: October; T11: November; T12: December.
Figure 5.
Map of dynamic parameter rating average monthly saturated thickness of aquifer (T). T1: January; T2: February; T3: March; T4: April; T5: May; T6: June; T7: July; T8: August; T9: September; T10: October; T11: November; T12: December.

Figure 6.
(a): SWI vulnerability map of average GALDIT; (b): SWI vulnerability map of average GALDIT modified using entropy.
Figure 6.
(a): SWI vulnerability map of average GALDIT; (b): SWI vulnerability map of average GALDIT modified using entropy.

Figure 7.
Monthly GALDIT index map.

Figure 8.
Rank of vulnerability of each month using TOPSIS.


Table 1.
Original and modified rates for GALDIT (Source Kim et al. [17]).
Table 1.
Original and modified rates for GALDIT (Source Kim et al. [17]).
| Parameter | Weight | GALDIT Factor Variable Range | Rating | Modified Rating | |
|---|---|---|---|---|---|
| Groundwater occurrence | 1 | Confined aquifer | 10 | - | |
| Unconfined aquifer | 7.5 | ||||
| Leaky confined aquifer | 5 | ||||
| Bounded aquifer | 2.5 | ||||
| Aquifer hydraulic conductivity (m/day) | 3 | >40 | 10 | >40 | 10 |
| 34–40 | 9 | ||||
| 28–34 | 8 | ||||
| 22–28 | 7 | ||||
| 16–22 | 6 | ||||
| 10–16 | 5 | ||||
| 10–40 | 7.5 | 8–10 | 4 | ||
| 6–8 | 3 | ||||
| 5–10 | 5 | 4–6 | 2 | ||
| <5 | 2.5 | <4 | 1 | ||
| Height of groundwater level above sea level (m) | 4 | <1.0 | 10 | <1.0 | 10 |
| 1.0–1.5 | 7.5 | 1.0–1.2 | 9 | ||
| 1.2–1.4 | 8 | ||||
| 1.5–2.0 | 5 | 1.4–1.6 | 7 | ||
| 1.6–1.8 | 6 | ||||
| >2.0 | 2.5 | 1.8–2.0 | 5 | ||
| 2.0–2.2 | 4 | ||||
| 2.2–2.4 | 3 | ||||
| 2.4–2.6 | 2 | ||||
| >2.6 | 1 | ||||
| Distance from shore (m) | 4 | <500 | 10 | <500 | 10 |
| 500–700 | 7.5 | 500–600 | 9 | ||
| 600–700 | 8 | ||||
| 750–1000 | 5 | 700–800 | 7 | ||
| 800–900 | 6 | ||||
| 900–1000 | 5 | ||||
| 1000–1100 | 4 | ||||
| >1000 | 2.5 | 1100–1200 | 3 | ||
| 1200–1300 | 2 | ||||
| >1300 | 1 | ||||
| Impact of existing status of seawater intrusion (μs/m) | 1 | >3000 | 10 | >3000 | 10 |
| 2000–3000 | 7.5 | 2600–3000 | 9 | ||
| 2200–2600 | 8 | ||||
| 1000–2000 | 5 | 1800–2200 | 7 | ||
| 1400–1800 | 6 | ||||
| 1000–1400 | 5 | ||||
| 600–1000 | 4 | ||||
| <1000 | 2.5 | 200–600 | 3 | ||
| <200 | 2 | ||||
| - | 1 | ||||
| Saturated thickness of aquifer (m) | 2 | >10 | 10 | >10 | 10 |
| 7.5–10 | 7.5 | 9–10 | 9 | ||
| 8–9 | 8 | ||||
| 5–7.5 | 5 | 7–8 | 7 | ||
| 6–7 | 6 | ||||
| <5 | 2.5 | 5–6 | 5 | ||
| 4–5 | 4 | ||||
| 3–4 | 3 | ||||
| 2–3 | 2 | ||||
| <2 | 1 | ||||
Table 2.
Vulnerability classes area.
| Vulnerability Class | Area (km2) | |
|---|---|---|
| GALDIT | GALDIT Modified Using Entropy | |
| Very low | 917.80 | 994.09 |
| Low | 133.35 | 44.98 |
| Medium | 94.68 | 104.87 |
| High | 1.32 | 3.22 |
Table 3.
GALDIT theoretical weight and modified weight using entropy.
| Factors | GALDIT | Entropy Weight GALDIT |
|---|---|---|
| G | 1 | 0.022 |
| A | 3 | 0.596 |
| L | 4 | 0.941 |
| D | 4 | 0.908 |
| I | 1 | 0.150 |
| T | 2 | 0.324 |
Table 4.
GALDIT and TDS correlation.
| Classic GALDIT and TDS | Entropy Weight GALDIT and TDS | |
|---|---|---|
| Pearson’s correlation | 0.518 | 0.739 |
| Spearman rank correlation coefficient | 0.537 | 0.592 |
Table 5.
Single parameter weight sensitivity analysis.
| Parameter | Entropy Weight | Entropy Weight (%) | Effective Weight | Rank | ||
|---|---|---|---|---|---|---|
| G | 0.022 | 0.74 | 0.286 | 1.75 | 0.97 | 6 |
| A | 0.702 | 20.26 | 20.29 | 148.06 | 65.58 | 2 |
| L | 0.955 | 31.99 | 45.89 | 146.52 | 66.28 | 1 |
| D | 0.91 | 30.87 | 21.32 | 205.68 | 57.84 | 3 |
| I | 0.216 | 5.10 | 8.61 | 94 | 37.15 | 5 |
| T | 0.12 | 11.01 | 15.44 | 172.52 | 43.26 | 4 |
Table 6.
Map removal sensitivity analysis.
| Removed Parameter | Min | Max | Mean | Rank |
|---|---|---|---|---|
| G | −7.75 | 1.65 | 0.11 | 6 |
| A | −5.08 | 4.51 | 1.28 | 3 |
| L | −4.58 | 5.68 | 2.58 | 1 |
| D | −6.67 | 8.91 | 1.31 | 2 |
| I | −1.66 | 4.46 | 0.28 | 5 |
| T | −2.65 | 6.3 | 1.2 | 4 |
Publisher’s Note: MDPI stays neutral with regard to jurisdictional claims in published maps and institutional affiliations. |
© 2022 by the authors. Licensee MDPI, Basel, Switzerland. This article is an open access article distributed under the terms and conditions of the Creative Commons Attribution (CC BY) license (https://creativecommons.org/licenses/by/4.0/).
Share and Cite
MDPI and ACS Style
Yang, J.-S.; Jeong, Y.-W.; Agossou, A.; Sohn, J.-S.; Lee, J.-B. GALDIT Modification for Seasonal Seawater Intrusion Mapping Using Multi Criteria Decision Making Methods. Water 2022, 14, 2258. https://doi.org/10.3390/w14142258
AMA Style
Yang J-S, Jeong Y-W, Agossou A, Sohn J-S, Lee J-B. GALDIT Modification for Seasonal Seawater Intrusion Mapping Using Multi Criteria Decision Making Methods. Water. 2022; 14(14):2258. https://doi.org/10.3390/w14142258
Chicago/Turabian StyleYang, Jeong-Seok, Yong-Wook Jeong, Amos Agossou, Jin-Sik Sohn, and Jae-Boem Lee. 2022. "GALDIT Modification for Seasonal Seawater Intrusion Mapping Using Multi Criteria Decision Making Methods" Water 14, no. 14: 2258. https://doi.org/10.3390/w14142258
Note that from the first issue of 2016, this journal uses article numbers instead of page numbers. See further details here.