
Comprehensive Evaluation of Water–Energy–Food System Security in the China–Pakistan Economic Corridor


1
State Key Laboratory of Desert and Oasis Ecology, Xinjiang Institute of Ecology and Geography, Chinese Academy of Sciences, Urumqi 830011, China
2
University of Chinese Academy of Sciences, Beijing 100049, China
*
Authors to whom correspondence should be addressed.
Water 2022, 14(12), 1900; https://doi.org/10.3390/w14121900
Submission received: 17 May 2022
/
Revised: 5 June 2022
/
Accepted: 9 June 2022
/
Published: 13 June 2022
(This article belongs to the Special Issue Water-Energy-Food Nexus Analysis for Sustainable Resources Management)
Abstract
:The safety of the water–energy–food (WEF) system in the China–Pakistan Economic Corridor (CPEC) is critical to the sustainable development of resources, the economy, and society in the region. This paper uses the projection pursuit model of a real-code accelerated genetic algorithm (RAGA-PP) to comprehensively evaluate the WEF system security of the CPEC for the period 2000–2016. The results show that from 2000 to 2016, the projection value of the WEF system was reduced from 2.61 to 0.53, and the overall system security showed a downward trend. Moreover, the CPEC increased by 6.13 × 10⁷ people, resulting in a rapid decrease in per capita water resources and decreased security of the water resources subsystem. With the rising social and economic development in recent years, the per capita energy consumption has likewise risen, leading to a decline in the energy subsystem. At the same time, the per capita grain output in the study area has increased from 185 to 205 kg, and the safety of the food subsystem has been enhanced. However, the significant increase in irrigated areas (from 1.82 × 10¹⁰ to 1.93 × 10¹⁰ hectares) has further highlighted the contradiction between the supply and demand of surface water resources, and the number of tube wells increased by 7.23 × 10⁵, resulting in the consumption of a large amount of electricity and diesel resources. The water–energy (WE) subsystem also became less safe. With the implementation of water resources management policies over the past few decades, the proportion of agricultural water consumption dropped from 95.06% in 2000 to 93.97% in 2016, and the safety of the water–food (WF) subsystem increased. Unfortunately, agricultural irrigation consumes a large amount of power resources, leading to a reduction in the security of the energy–food (EF) subsystem. The research results from the present study could provide a scientific basis for the coordinated development of WEF systems across the CPEC region.
1. Introduction
Water, energy, and food provide the basic materials for human survival and development. These three basic elements also have complex and dynamic relations, forming a cooperative and competitive water–energy–food (WEF) relationship system. Water extraction and sewage treatment need energy consumption, and water is important for energy production, power generation, and cooling. Meanwhile, the agricultural sector needs to consume water for irrigation and energy for mechanical operation, fertilizer production, water collection, and transportation in the process of food production. The close interrelationship of water, energy, and food makes it impossible for us to consider only one aspect in isolation, so we need to understand the complex relationship between all three [1,2,3]. Global climate change, population growth, and socio-economic development pose severe challenges to ensuring an adequate supply of water, energy, and food [4,5,6]. Hence, many researchers emphasize that the demand for these resources will increase significantly in the future [1]. It is estimated that the world population will reach 10 billion by 2025 [7], increasing the demand for water, energy, and food by more than 50% [8].
At the WEF Security Nexus Conference held in Bonn, Germany, in 2011, researchers first proposed that there is a complex mutual feedback relationship between water, energy, and food and that the relationship between them could be summarized as a “nexus” [9]. In 2013, the United Nations Asia-Pacific Economic and Social Council issued the “Report on the WEF Nexus in the Asia-Pacific Region”, which showed that the elements comprising the nexus are closely connected on a temporal and spatial scale and that other external factors also have an impact on it [10]. In 2014, the Food and Agriculture Organization of the United Nations (FAO) published the “WEF Report: New Ways to Support Food Security and Sustainable Agriculture”, which interpreted the nexus from the perspective of ensuring food security and achieving sustainable agricultural development. A “nexus method” of analysis and decision-making was also proposed at that time [11].
Over the years, scholars have put forward various expressions and opinions on the conceptual connotation of the nexus from different fields, different perspectives, and even on different scales. They have adopted a variety of research methods to carry out research on the nexus, such as evaluations based on the perspective of key processes, evaluations based on the overall perspective of the system, and comprehensive evaluations of the internal and external elements of the coupling system [12]. In terms of evaluations based on key processes, Zhao [13] used the SWAT (Soil and Water Assessment Tool) model to study the spatiotemporal variation characteristics of blue-green water resources in the Weihe River Basin under different land-use changes, agricultural irrigation expansions, and climate change scenarios. Ge [14] used the general equilibrium model (CGE) to evaluate and compare the economic, energy, and environmental effects of incentive policies to help the government choose the best policy to promote bioethanol in China.
In related research, Zhang et al. and Wang [15,16] systematically analyzed the key processes of WF and WE in the system, respectively. Ghani [17], by exploring the water, energy, and food nexus, as well as the impact of bioethanol on the environment of Pakistan, used the life cycle method to evaluate carbon footprints, ecological footprints, water scarcity footprints, and energy footprints. Deng [18] employed an input–output model and structural path analysis to explore the hidden relationship between water, energy, and food resources and to study the performance of these resources in the process of upstream production and downstream consumption of the supply chain. Li [19] proposed a water–energy–food relative index (WEFRI) based on different values of resource consumption and utilization efficiency of treatment systems and control systems and analyzed the synergistic effects of water resource utilization, energy consumption, and food supply of different planting systems at a farmland scale.
Furthermore, in terms of comprehensively evaluating internal and external elements of a coupling system, Chai [4] proposed a quantitative analysis framework of the nexus between water–energy–food–economy–society–environment based on a Bayesian model. In this framework, the causal relationship between water, energy, food, the economy, society, and the environment are studied and quantified. Bakhshianlamouki [20] developed a system dynamics model to simulate the WEF nexus in the Urmia Lake basin as a multi-sectoral system and to evaluate the impact of lake restoration measures. Okumu [21] adopted a performance index method based on the nexus approach to assess the impact of multiple aspects of the utilization and protection of forest, food, water, and energy resources.
At present, the areas that mainly focus on the nexus approach and sustainable development research are mostly concentrated in developed countries in Europe and the United States, Australia, China, Japan, and other regions in Asia [12]. However, there are relatively few studies on the relationship between water, energy, and food in Africa, Central Asia, and South Asia.
The China–Pakistan Economic Corridor (CPEC) is located at the intersection of the Silk Road Economic Belt and the 21st Century Maritime Silk Road. Therefore, it is the flagship project of the “One Belt and One Road” initiative [22]. Since its launch in 2015, the CPEC has connected China and Pakistan, promoted the development of the two countries, and also played an important role in regional integration and development [23]. Most of the areas along the CPEC are located in arid and semi-arid regions that have a fragile ecological environment and densely populated areas. Therefore, water, energy, and food resources in these regions are facing severe challenges [24].
In Pakistan, the demand for water has risen significantly as the population has grown. Statistics show that the population of Pakistan reached 200 million in 2016 and that the per capita annual water supply dropped from 5260 m3 in 1947 to less than 1000 m3 in 2016 [25], indicating that Pakistan’s water security has become a major issue. According to relevant research, about 47% of Pakistan’s population suffers from food insecurity and widespread malnutrition. In addition, food production relies heavily on irrigation [26]. The main irrigated areas in Pakistan are located in the Punjab and Sindh provinces. Wheat, corn, rice, cotton, and sugar cane comprise the primary crops in Pakistan. Alarmingly, although the agricultural sector contributes 20% to 25% to Pakistan’s gross domestic product (GDP), it consumes 95% of the nation’s total water resources [27]. Pakistan’s national electricity supply gap has reached 25–40%, which has caused the country’s economic growth to stagnate and led to political and social turmoil. The irony is that Pakistan has a large number of undeveloped natural resources, and these reserves can easily meet the country’s energy needs for at least the next few centuries [28]. In the past 15 years, the increase in arable land in Punjab, Pakistan, has resulted in a 31% increase in total crop production and an 80% increase in direct agricultural energy intensity [29]. Similar to Pakistan, agriculture also occupies an important position in the Xinjiang part of the CPEC, and it also consumes most of the area’s water resources. The current situation of water, energy, and food in the CPEC is not optimistic, which brings certain challenges to the sustainable development of the region. Although there are many problems with the WEF system in the CPEC, a comprehensive assessment of the system has not yet been conducted.
In this study, the construction of an index system, the principle of the analytic hierarchy process (AHP), and the projection pursuit model of a real-coded accelerated genetic algorithm (RAGA-PP) are used to analyze the security and driving factors of the water–energy–food (WEF) system in the CPEC from 2000 to 2016 [30,31,32]. This paper discusses the changing trend of the predicted value of WEF system security and analyzes the influencing factors of the overall and subsystem security of the WEF system [33]. These research results provide a scientific basis for an in-depth understanding of water, energy, and food utilization and security in the CPEC. They also have a far-reaching significance for the sustainable development of regional resources, the social economy, and the construction of the “Belt and Road”.
2. Methodology and Data
2.1. Study Area
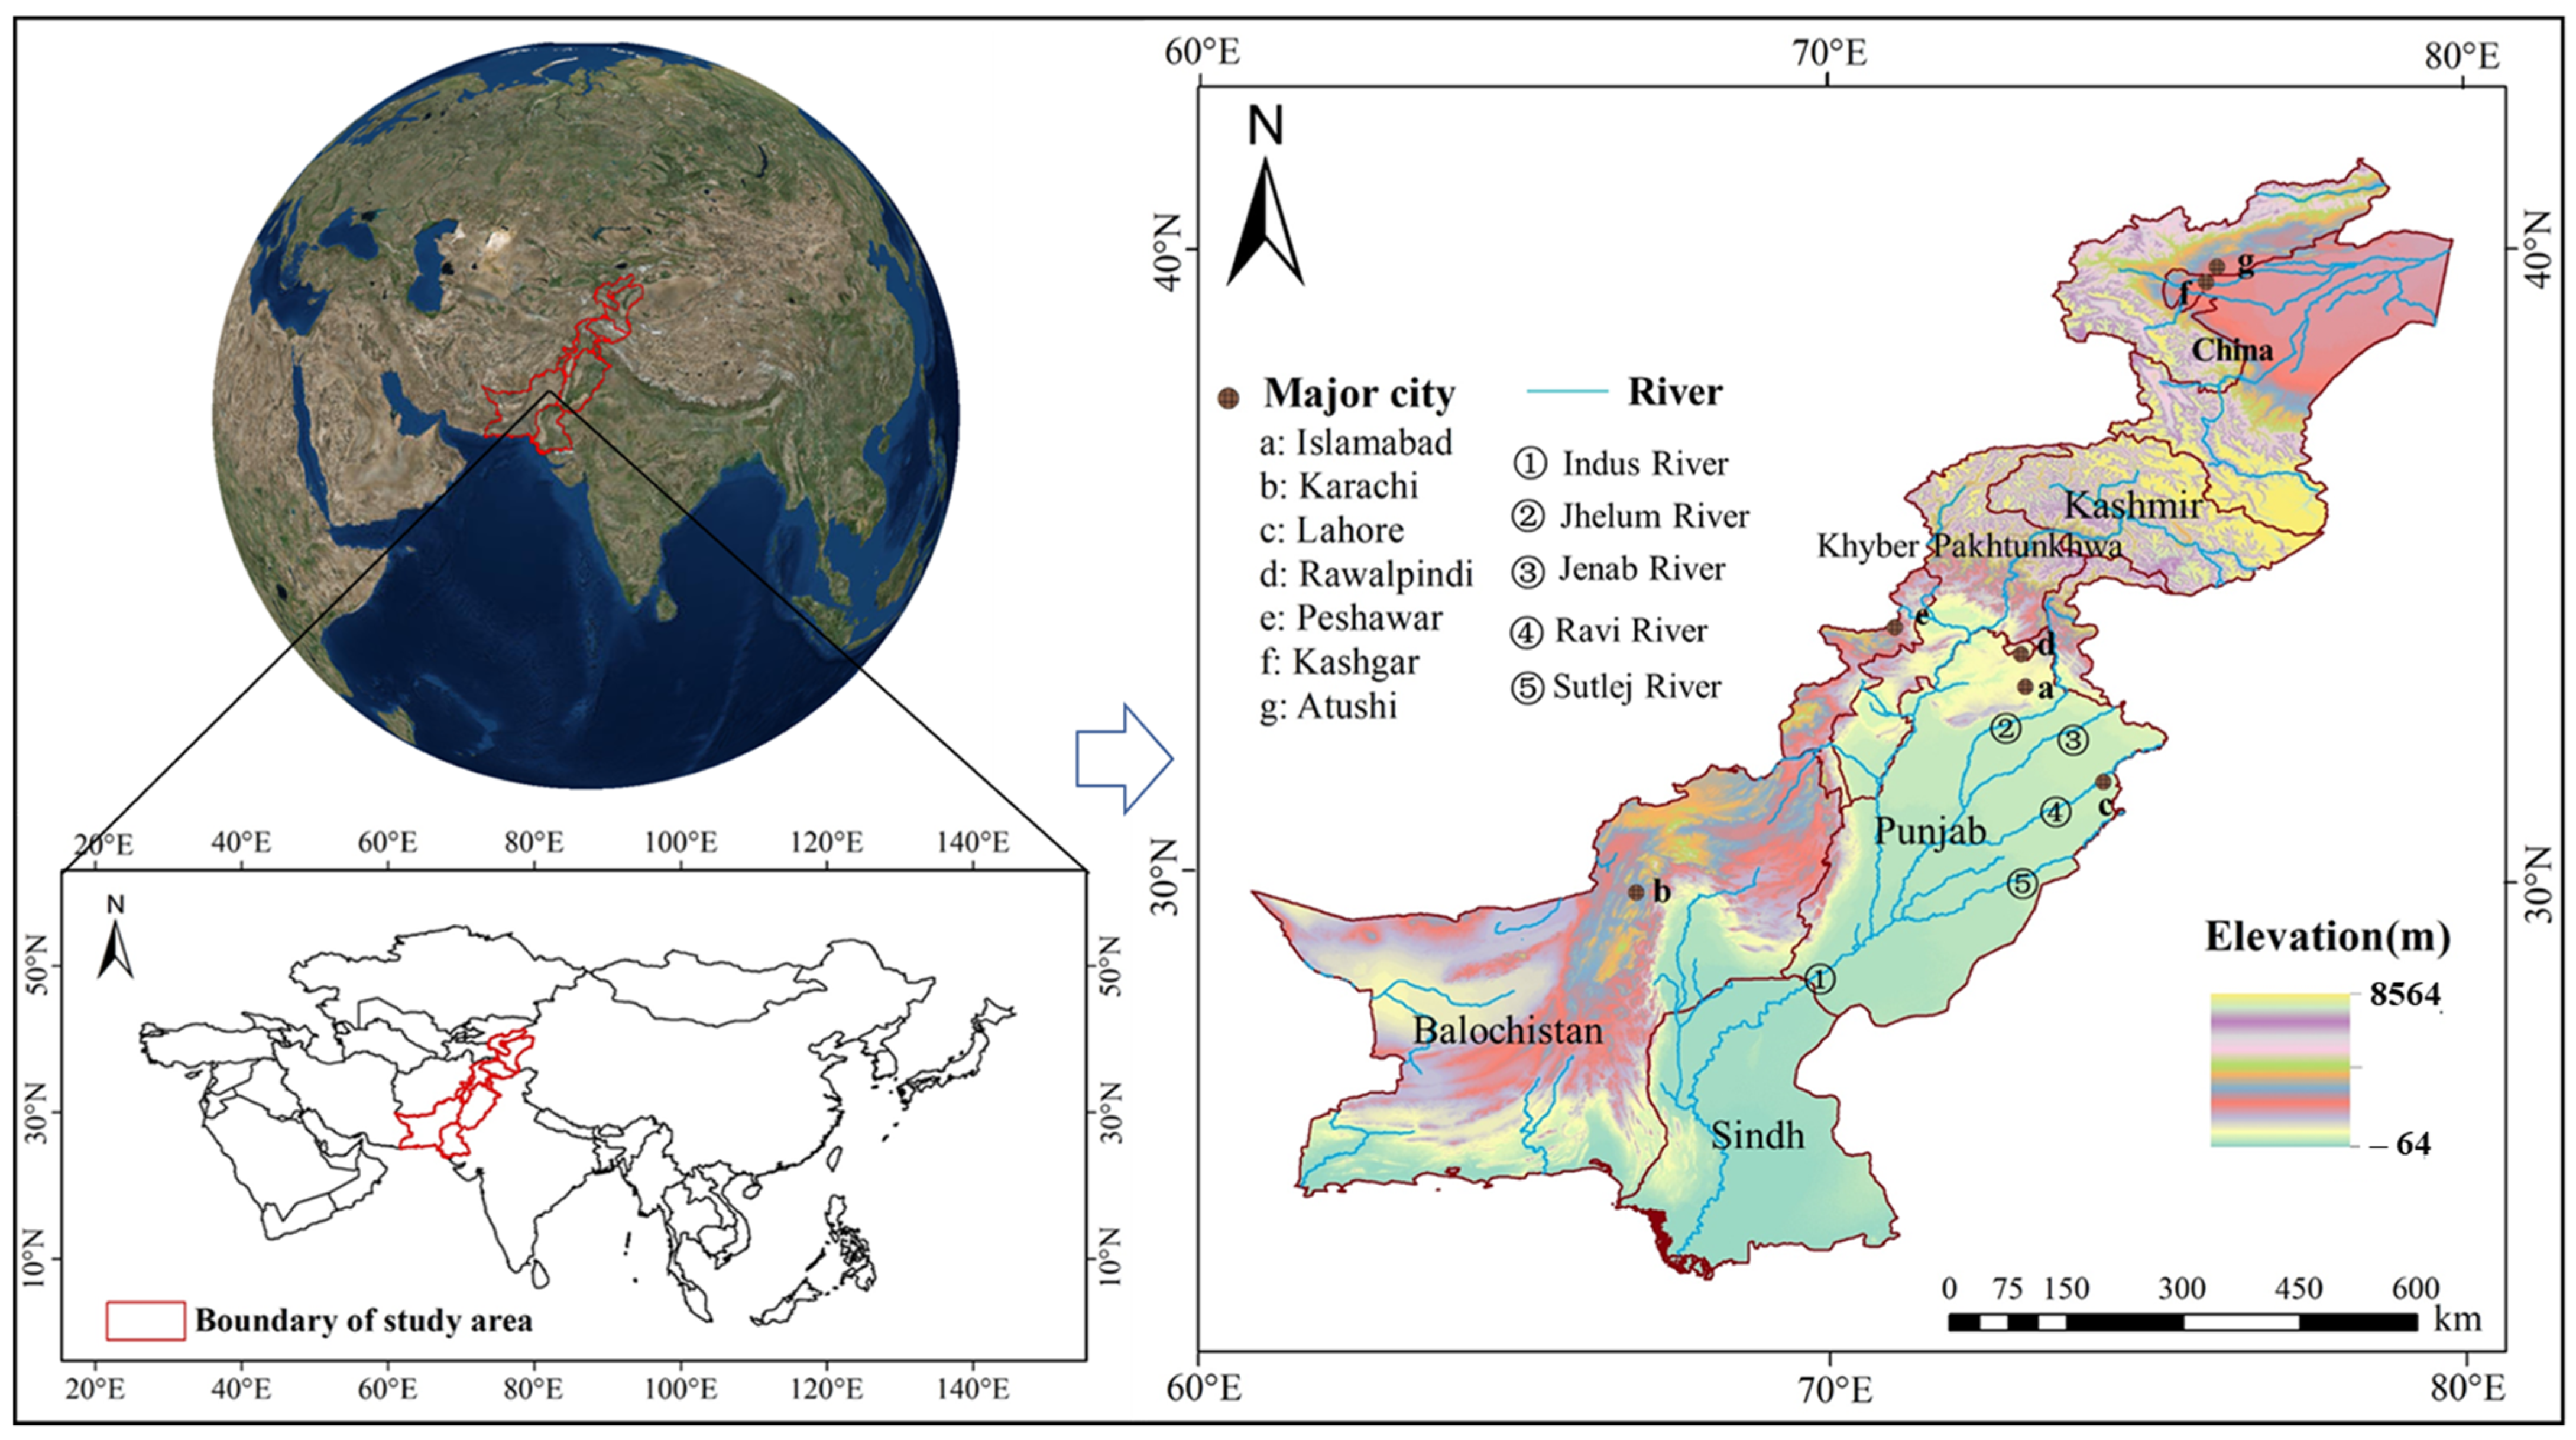
The China–Pakistan Economic Corridor is located in central and southern Asia (23°50′–40°16′ N, 61°00). It stretches from Kashgar in Xinjiang, China, in the north to the Gwadar port, Pakistan, in the south, spanning a total length of 3000 km and covering an area of approximately 1.32 × 10⁶ km2 (Figure 1). The CPEC is an economic hub and typical land–sea route that includes road traffic, oil pipelines, and optical cable channels [34,35]. The terrain fluctuates greatly but is generally high in the northeast and low in the southwest [36,37]. There are significant differences in temporal and spatial distribution in terms of precipitation and temperature, which are 100~3000 mm and 7~28 °C, respectively [38]. Most of the CPEC is located in arid and semi-arid areas, and the ecological environment is fragile [39,40]. The occurrence of extreme events under the influence of global warming will further negatively affect water reserves, agricultural production, and energy while also threatening the security of the WEF system and detrimentally affecting the sustainable development of the region’s social economy [41].
2.2. Data Sources
The data used in this study come from the Pakistan Statistical Yearbook, the Xinjiang Statistical Yearbook, the Pakistan Environmental Statistics Compendium, the Ministry of Finance Statistical Yearbook, the World Bank, and the FAO for the years 2000–2016 (Table 1). Missing data for years or regions are filled using linear interpolation and other data methods. (Note that since there is currently no way to obtain data for total water resources in Pakistan, the amount has been calculated as 90% of the total water resources in the rainy and dry seasons; the overall trend is the same.)
2.3. Methods
2.3.1. Synergy Competition Mechanism of the Regional WEF System
This study emphasizes the synergistic competition mechanism between water, energy, and food, in that water, energy, and food are both resource providers and resource consumers [43]. Moreover, because the WEF system is so complex, security analysis research should not consider only a single subsystem or a certain resource. Instead, to analyze the security of water, energy, and food systems based on the synergistic competition mechanism between the three (Figure 2), we should comprehensively consider the nexus between water, energy, and food.
2.3.2. Establishment of the Security Assessment Indicators System
Principles for the Establishment of the Indicators System
The security degree of the WEF system is closely related to the security of its subsystems. Therefore, to comprehensively consider system security, it is necessary to evaluate the security degree of the water, energy, and food systems, along with the overlapping subsystems of the water–energy (WE), water–food (WF), and energy–food (EF) systems. We follow the principle of AHP to construct the WEF system safety evaluation indicators system, dividing the system into three levels, as follows. The target layer is system safety (A1). The second layer is divided into six different security types, namely, water subsystem (B1) security, energy subsystem (B2) security, food subsystem (B3) security, WF subsystem (B4) security, WE subsystem (B5) security, and EF subsystem (B6) security. The third indicator layer includes C1–C23.
Indicator Selection
In the selection of indicators, the actual situation of the study area had to be considered, and all available indicators were listed. Under the premise of considering the influencing factors as much as possible, unreasonable and redundant (e.g., repeated) indicators were removed. At the same time, a correlation test of indicators for each subsystem was carried out. Indicators with a correlation coefficient greater than 0.5 were eliminated, leaving 23 indicators, including 11 positive indicators and 12 negative ones (Table 2).
2.3.3. Projection Pursuit Model Based on a Real-Code Accelerated Genetic Algorithm
At present, the comprehensive evaluation of the WEF system mostly adopts the weighted comprehensive method and the AHP. These methods have large subjective and human interference factors. Therefore, in order to evaluate the safety of the system more objectively, this paper uses the projection pursuit model. This approach projects the nonlinear multi-dimensional evaluation indicators’ value into one-dimensional data [44] and then couples it to a real-code accelerated genetic algorithm to optimize the projection indicator function, find the best projection direction, and calculate the size of the projection value [45]. The optimal projection direction and projection value reflect the weight of each indicator and the security of the system [46].
Model Implementation Process
- (1)
- Normalization of the assessment indicators system
To eliminate the dimension of each indicator value and unify the change range, it is necessary to standardize the positive and negative indicators.
Positive indicators
Negative indicators
where represents the normalized sequence of assessment indicators; is the i-th assessment indicator value of the -th sample; and represent the minimum and maximum values of the -th indicator.
- (2)
- Construction of the projection index function
The data dimensional is synthesized with as the projection direction, with a projection value of :
where is a unit vector. It is then classified and evaluated according to the one-dimensional scatter diagram of {}.
The projection index function is defined as follows:
where and are the standard deviation and local kernel density of . is the mean value of the projected eigenvalue ; is the window radius of the local density, in this paper, ; represents a unit step function.
- (3)
- Optimization of the projection indicator function based on the real-code accelerated genetic algorithm
When given the sample set of each indicator value of the WEF system for the CPEC, the projection indicator function only changes with the change in project direction . Different projection directions reflect different data structural features, and the best projection direction is the projection direction that is most likely to expose certain structural features of high-dimensional data. Therefore, the optimal projection direction can be estimated by solving the projection function maximization problem, namely:
Maximization objective function:
Constraint condition:
This is a complex nonlinear optimization problem with } as the optimization variable. An accelerated genetic algorithm based on real-number coding is applied to solve its high-dimensional global optimization problem so that the best projection direction can be obtained.
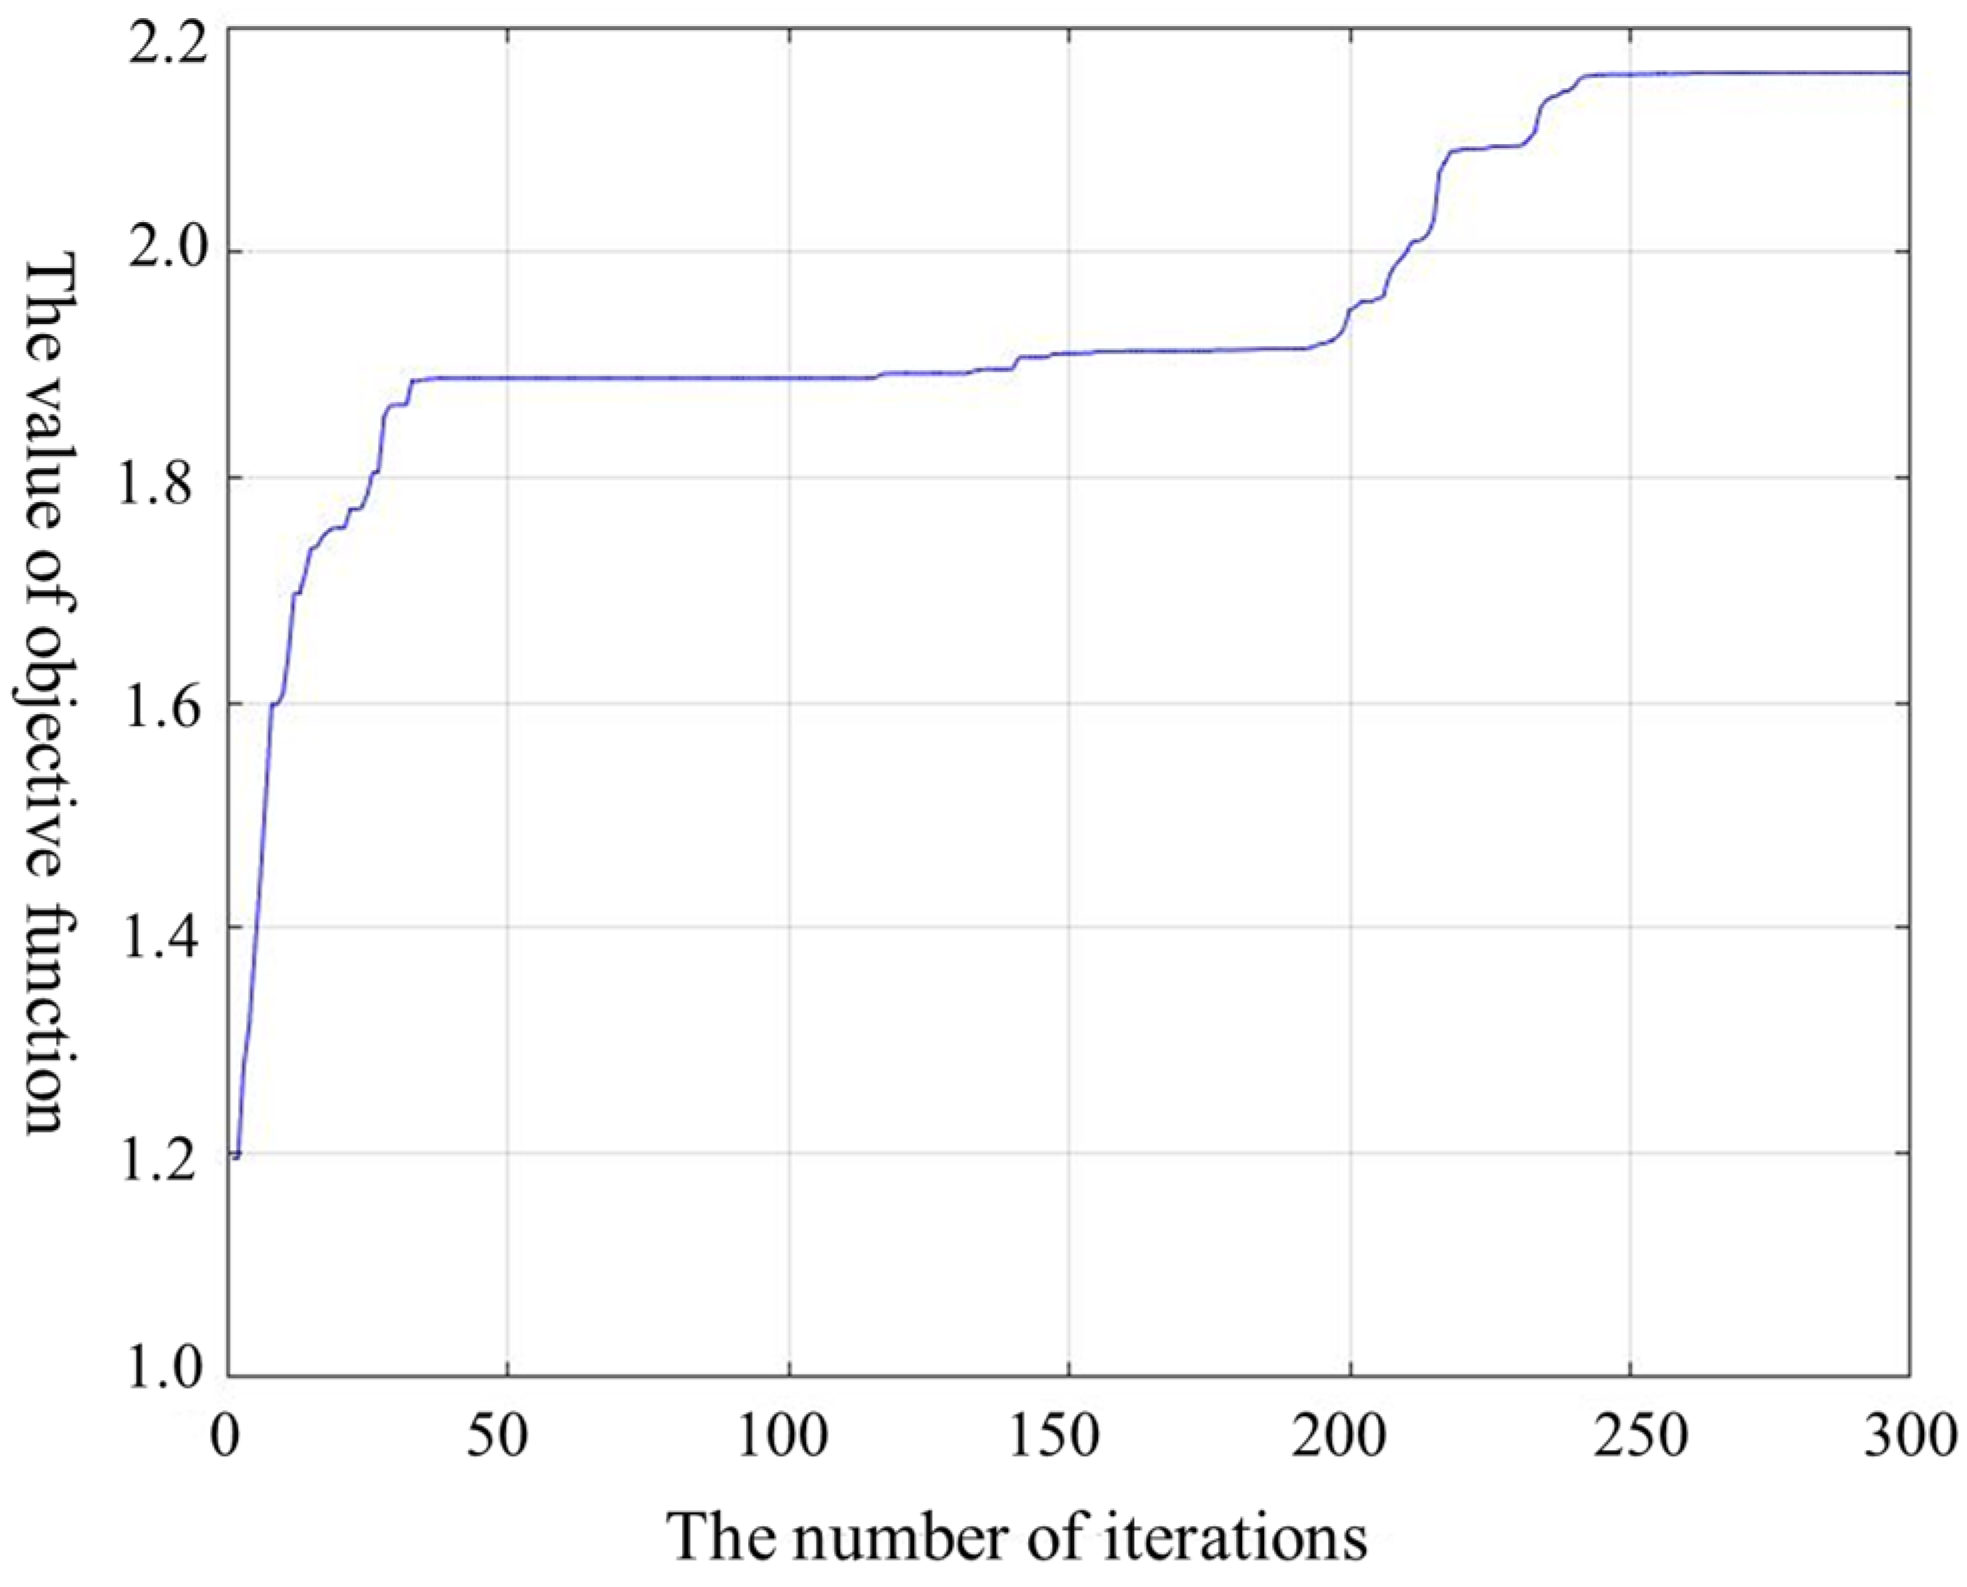
In this study, the parameters for the modeling data set are set as follows: the learning factor is c1 = c2 = 1.4962; the inertia weight is w = 0.98; the maximum number of iterations is 300; the population size is N = 200. Figure 3 shows the optimization process of the objective function, which reflects the relationship between the optimal value of the objective function and the number of iterations. The faster the model converges, the more accurate the results.
The evaluation indicator data set is stable after 240 iterations (Figure 3). The best projection objective function value is 2.182, and the best projection direction of each indicator is = (0.00033, 0.13613, 0.10933, 0.0013, 0.3307, 0.0001, 0.2948, 0.3457, 0.2605, 0.4272, 0.3457, 0.0064, 0.1724, 0.1161, 0.3406, 0.3485, 0.0001, 0.2353, 0.0016, 0.2422, 0.0015, 0.0002, 0.0909). The projection value of the 2000–2016 evaluation indicators data set is 2.6121, 2.6125, 2.6116, 2.6125, 2.5111, 2.2826, 1.9002, 1.6039, 1.3174, 0.9666, 1.2011, 1.1154, 1.1154, 0.9732, 1.0963, 0.9666, and 0.5331. The higher the predicted value, the higher the system security level of the current year.
Classification of Evaluation Results
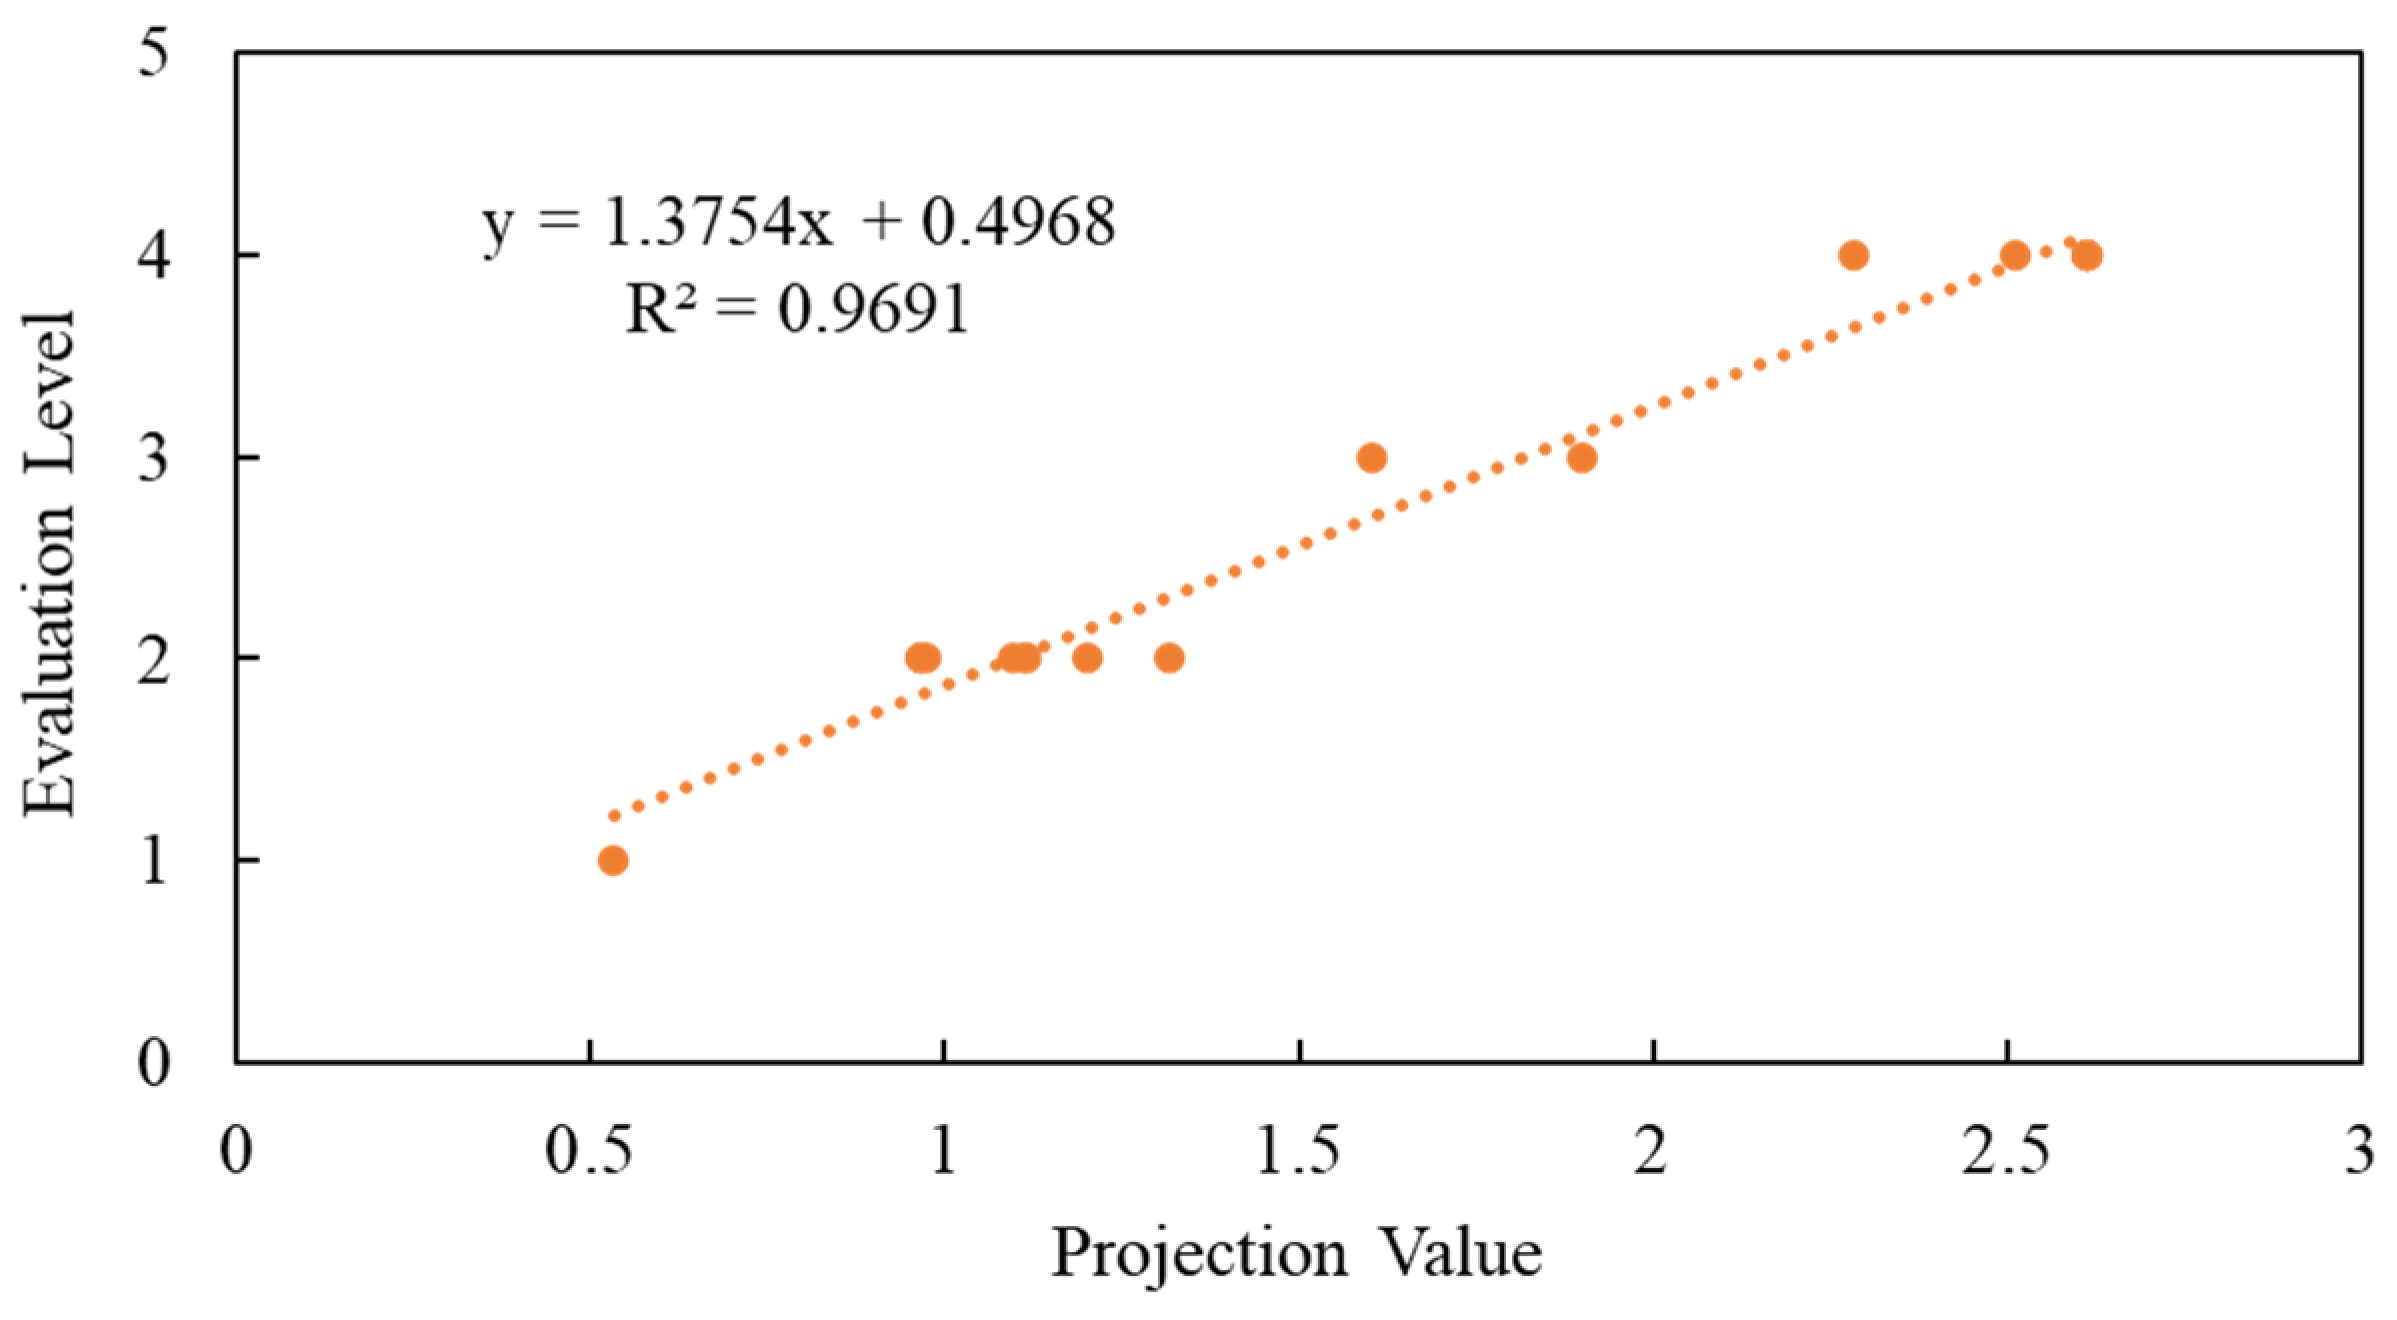
The projected value of each sample is obtained by bringing the best projected a value into Equation (4). At present, there is no unified classification of the evaluation standard of WEF system security in the CPEC. Therefore, this paper classifies according to the evaluation indicators themselves and the actual situation of the study area. Based on the above, the safety levels are divided into five levels: very safe (level V), relatively safe (level IV), basic safety (level III), unsafe (level II), and very unsafe (level I). Very safe means meeting the needs of water, energy, and food in many sectors, eliminating hunger, with the availability of clean water, adequate energy supply, etc., as pointed out in the SDG. In addition, water–energy–food can be well coordinated. The other four levels of security decrease in turn. The higher the level value, the higher the system security. Figure 4 shows a grade evaluation model and a scatter diagram that have been drawn according to the projection value and the evaluation grade.
2.3.4. Mann–Kendall (MK) Test
The MK test method, which was originally proposed by H.B. Mann and M.G. Kendall, is not affected by individual outliers and objectively reflects the trend of the time series [47]. Further, this approach can clarify the prominent time period and area according to the two output sequences (UF and UB). The specific calculation methods and parameters are as follows:
For a time series with sample sizes, construct a sequence:
Here, the sequence is the cumulative number of the value at time greater than the number at time. Thus, it can be seen that when , .
Under the assumption of the random independence of the time series, we can define the statistics as:
In the formula, = 0; and are the mean and variance of the cumulative number . When , , …, are independent of each other and have the same continuous distribution, the following formula can be used to calculate it:
Furthermore, is a standard normal distribution, which is a sequence of statistics calculated according to the time series order , , …, . According to the time series in reverse order , , …, , the above process can be repeated to construct the reverse sequence .
3. Results
For the CPEC, the long-time series security of the WEF system is calculated based on the evaluation indicators data set. Selected weights from the six subsystems of water resources, energy, food, WE, WF, and EF account for a relatively large indicator (Table 3) for analysis. Note that the square of the best projection direction a of each indicator is multiplied by 100 to get the weight of each indicator.
3.1. Single Subsystem Analysis
According to the indicators of per capita water resources and effective precipitation, which account for a relatively large weight in the water resources subsystem, the overall security of the system is on a downward trend. Per capita water resources is a very important indicator that reflects the population and total water resources. As illustrated in Figure 5a, the per capita water resources indicator for all of CPEC and Pakistan shows a steady downward trend, while the Kashgar region (KR) and Kizilsu Kirgiz Autonomous Prefecture (KKAP) show a fluctuating downward one. In 2016, the water resources per capita in KKAP was 12,093 m3, while those in KR and Pakistan were 1860 and 804 m3. From 2000 to 2016, the total population of Pakistan increased by 42.8%, and there was a serious shortage of various resources, especially water. During this period, the amount of water resources per capita dropped from 1167 to 804 m3, making Pakistan a severely water-scarce country. Data sources and calculations of evapotranspiration and effective precipitation are in-cluded in Supplementary Materials.
With global climate change, the ecological environment of arid and semi-arid regions is quite fragile and sensitive to external changes [48]. From 2000 to 2016, the average annual precipitation in the CPEC increased by 173 mm (Figure 5b). However, the area experiences significant evaporation, and the potential evapotranspiration can reach about 2000 mm. Therefore, increased precipitation cannot solve the serious water shortage problem [49]. In the CPEC, 70% of the precipitation mainly falls as rain between June and September. As the rainfall intensity far exceeds the available range, the construction of reservoirs is essential for the effective use of water resources.
According to the per capita energy consumption and carbon dioxide intensity of the energy subsystem, both of which account for a relatively significant weight, the system security shows a downward trend. The overall trend of per capita energy consumption in the CPEC (Figure 5c) shows rising volatility. Energy consumption rose from 6.23 × 10⁹ oil kilogram equivalents in 2000 to 9.37 × 10⁹ in 2016, increasing rapidly from 2000 to 2006. Pakistan also introduced a new investment policy in 1997 that stipulated that foreign investment should be given priority to encourage foreign investment in high value-added industries. This policy has laid the foundation for the development of the country’s energy industry.
After the “9/11” incident in 2001, Pakistan joined the anti-terrorism camp led by the United States and received economic assistance and support from the U.S. and other developed countries. This assistance promoted rapid economic development [50,51]. However, from 2007 to 2016, the rise in energy consumption tended to be slow. Moreover, after the global financial crisis in 2008, the economic development of the region was significantly affected, especially in Pakistan, where the government lacked an effective fiscal policy response [52,53]. Generally speaking, a large amount of energy is consumed in the process of economic development in this region. Although coal, oil, and natural gas reserves are abundant, the total amount is insufficient, given the nation’s huge population.
Carbon dioxide emission intensity refers to the amount of carbon dioxide emissions per unit of gross national product. It reflects production efficiency, with lower carbon dioxide emission intensity reflective of higher production efficiency. The carbon dioxide emission intensity of the China–Pakistan Economic Corridor (Figure 5d) has been on the rise since 2000. At the same time, however, the production efficiency of the region has not significantly improved with the development of the social economy, indicating that there are problems in its energy structure and in the optimization of the industrial structure.
According to per capita grain output and the area of saline–alkali land, which are relatively significant indicators in the food subsystem, the system shows a slow upward trend; however, it is still unsafe. The main food crops planted in the CPEC are wheat, rice, and corn. Rice is mainly distributed in Pakistan’s Punjab, Sindh, and Baluchistan provinces, with less rice being grown in KKAP and KR. Most areas of the CPEC are located in arid and semi-arid zones that are characterized by severe water shortages. Planting rice, a high-water-consuming crop, has brought certain challenges to the safety of the water system. Wheat and maize are mostly distributed in Punjab, where the “Five Rivers” converge and Pakistan’s largest river, the Indus, flows. Pakistan’s main economic activities and more than 50% of the population are distributed here.
As illustrated in Figure 5e, the 2019 United Nations (UN) World Population Outlook stated that the world’s per capita food consumption is 350 kg [54]. Pakistan’s consumption has risen from 179 kg in 2000 to 194 kg in 2016, but it still falls far short of the world average. The main reason for this shortfall is that Pakistan has high population density; at the same time, planting techniques, agricultural infrastructure, and the quality of cultivated land have not been well developed or improved over the years. In contrast, the per capita grain output in KKAP and KR has shown a significant upward trend and has always been above the per capita grain consumption level of the world, which is relatively safe.
Saline–alkali land is mainly distributed in arid, semi-arid, and coastal areas. It can lead to bare ground, soil and ecological degradation, reduced pastures and food production, and dust storms spreading harmful substances [55]. The global saline–alkali land area is about 1 × 10⁷ km2 [56], and the CPEC accounts for about 2.5% of this area. Due to the increase in cultivated land area and traditional irrigation methods, the degree of land salinization is increasing (Figure 5f). In 2016, the CPEC had a population of approximately 200 million and an area of arable land of approximately 2.33 × 10⁵ km2. Therefore, as the population has continued to grow in recent years, the food gap has continued to expand. Food security issues are related to people’s livelihoods, so salinization must be controlled if the area of arable land is to be expanded [57].
3.2. Two–Two Cooperative Subsystem Analysis
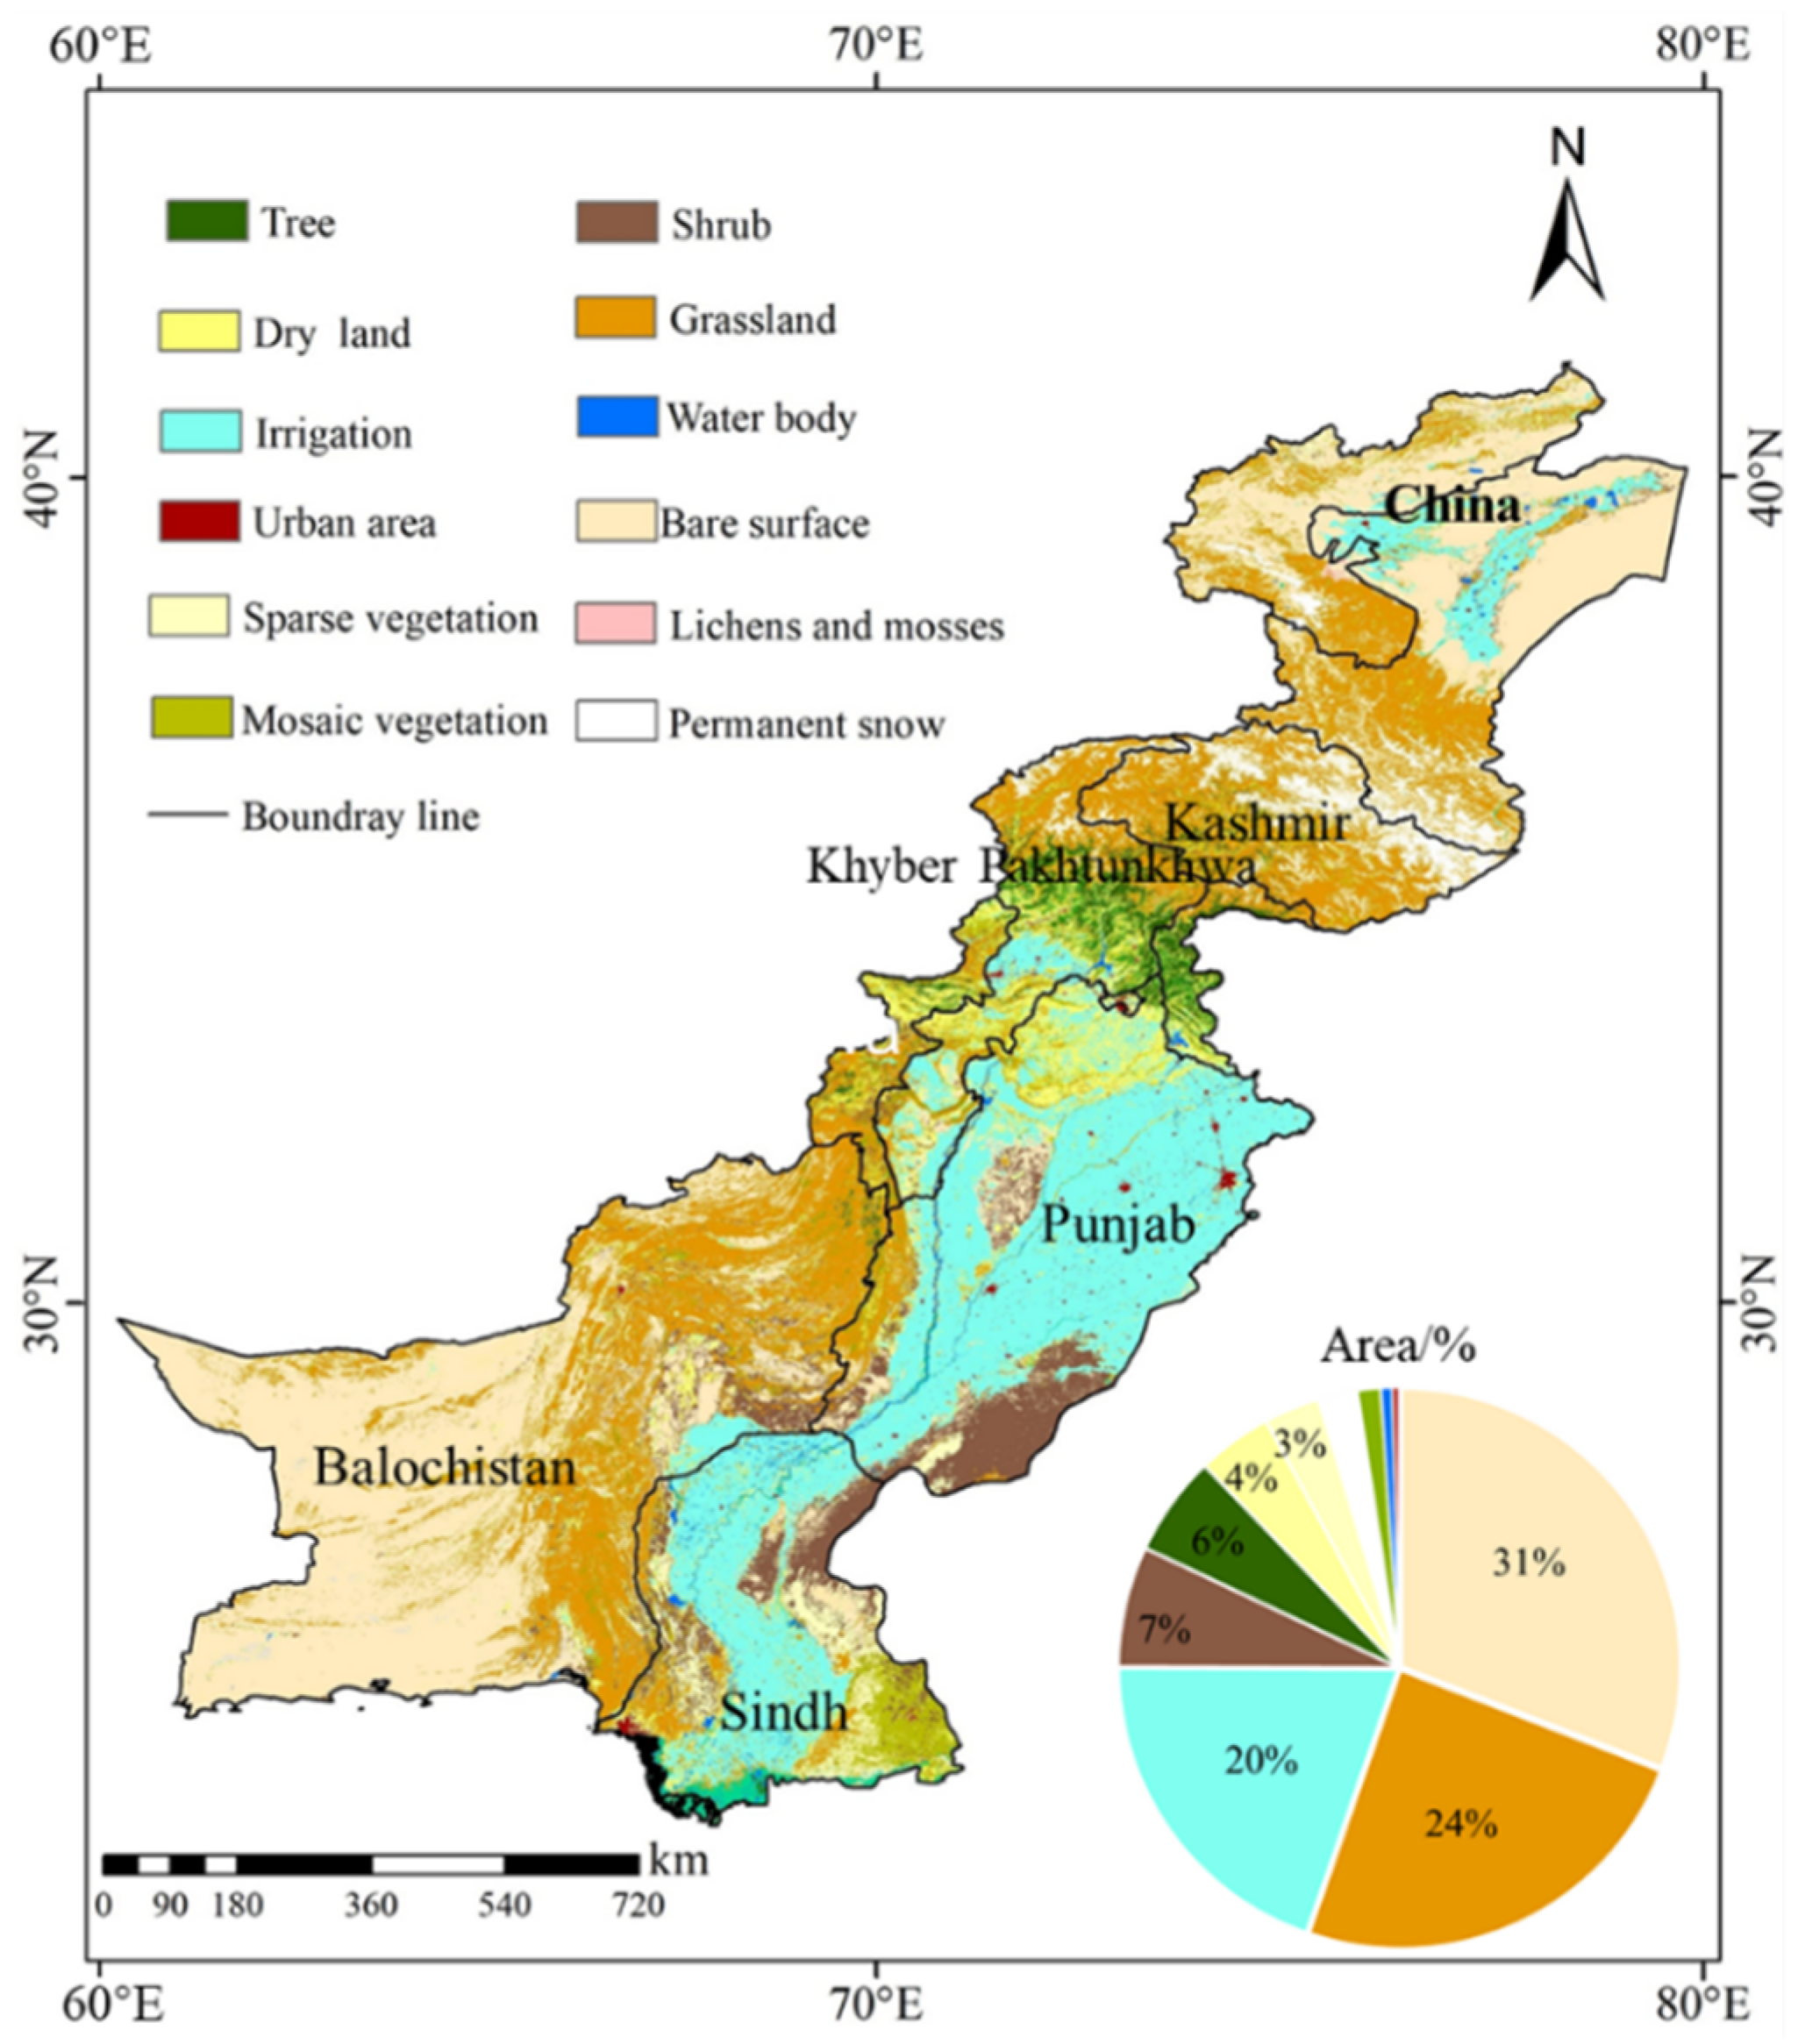
In the WE subsystem, two indicators that play an important role are well number and effective irrigation area. These indicators show that the system’s safety is on a downward trend in the CPEC. The irrigated portion of the study area (Figure 6a) has increased significantly, and most of it (Figure 7) is in the Indus Basin, namely, in the Punjab and Sindh provinces of Pakistan. The limited surface water resources in this region cannot meet the increasing demand for irrigation. Therefore, the contribution of groundwater resources to agricultural production is increasing, and the rapid spread of tube wells has followed.
Groundwater extraction requires energy to bring the water to the surface. In the CPEC, much of the direct energy use is driven by the extraction of groundwater. Moreover, due to climate change, population increase, and socio-economic development in recent years, excessive water consumption has caused surface water to be cut off in areas that rely on canals for irrigation, leaving farmers no choice but to turn to groundwater for irrigation. In areas with high groundwater levels, the cost of pumping water is relatively cheap, but as the groundwater level drops and energy prices rise, the cost of pumping water also rises. These price increases determine, to a certain extent, whether or not the farmers can irrigate. Such a decision not only affects crop yields but also the decision to plant either high- or low-water-consuming crops, ultimately impacting the development of the region’s agricultural economy [29].
According to the WF subsystem, which accounts for a relatively significant weight, the proportion of agricultural water used, along with the amount of fertilizer used, indicates that while the safety of the subsystem is increasing, it is still in an unsafe state. Regarding water consumption proportion (Figure 6b), agricultural water consumption dropped from 95.1% in 2000 to 93.9% in 2016, showing a gradual improvement in the system’s safety. However, because Pakistan’s water supply policy is not well regulated, irrigation efficiency in the region is quite low [58]. Therefore, it is necessary to improve the agricultural irrigation technology in the study area while also strengthening the implementation of water management and distribution policies.
Regarding the use of fertilizers, their consumption is generally too high, and the total amount is increasing year by year, causing the serious pollution of water resources. At the same time, as the amount of groundwater extracted by agricultural irrigation has increased in recent years, it has caused land subsidence and the formation of underground funnels. Furthermore, large areas of saline–alkali land are formed after flooding, which has caused a series of environmental problems.
According to the EF subsystem, which accounts for a relatively large proportion of agricultural power consumption, the security of the subsystem is declining. The energy consumed in food production is mainly diesel and electric power, and the power resources in this region are extremely scarce, especially in Pakistan. With the increase in regional electricity consumption, the proportion of agricultural electricity consumption has decreased (Figure 6c), which has transformed agricultural energy consumption from electricity resources to the use of diesel. The pollution emissions produced by diesel are very expensive to deal with and pose a certain threat to the environment.
Pakistan has a severe power shortage. On one hand, its power generation energy structure is unreasonable and is heavily dependent on imported oil and gas. On the other hand, the country’s infrastructure is backward, and power theft is rampant [59,60]. Pakistan is a typical agricultural country. The agricultural sector contributes 20% to 25% to GDP and provides livelihoods for about 40% of the labor force. However, frequent large-scale blackouts not only have an impact on the agricultural sector but also delay economic development. The power crisis has slowed the growth of GDP by 3% to 4% every year, which has a huge impact on production. At present, the daily power generation in Pakistan is about 12,000 million watt-hours (MWHs), while the domestic demand for electricity is about 16,000 MWHs, leaving a gap of about 4000 MWHs [61].
3.3. Security Analysis of the WEF System
3.3.1. MK Mutation Trend Analysis
The projection value of the CPEC 2000–2016 data set for the WEF system evaluation indicators has been analyzed using a linear trend method to obtain the inter-annual change curve (Figure 8a). As can be seen, the projection value is on a generally decreasing trend, at a rate of −1.38/10 a (Year). Specifically, the maximum projection value of 2.6125 occurred in 2001, while the minimum value of 0.5331 occurred in 2016.
The MK mutation test was performed on the same projection values, with UF and UB curves being drawn (Figure 8b). As shown in the figure, the UF and UB curves intersect in 2007–2008. Furthermore, the corresponding UF value is less than 0, indicating that the intersection is a sudden change point where the projection value increases. The UF value from 2000 to 2001 is greater than 0, which is an upward trend, and the UF value from 2001 to 2016 is less than 0, which is a downward trend. Overall, the UF value is less than −1.96 after 2007, indicating that the projected value has a significant downward trend.
3.3.2. WEF System Security Level in Each Year
From 2000 to 2016, the overall WEF system security evaluation level of the CPEC showed a downward trend (Figure 9), falling from relatively safe to very unsafe. The Pakistani portion of the CPEC includes the very large Indus River basin, while the Chinese portion includes the Yarkand and Kashgar rivers, which have relatively sufficient water resources. With the increase in population and social and economic development, the shortage of water resources and the intensification of water crises have intensified year by year. The energy and food problems surrounding water are also attracting increasing attention.
For the study period, the CPEC’s system security mainly involves four types of security: relatively safe, basic safe, unsafe, and very unsafe. From 2000 to 2005, system security was relatively safe, and the mutual development of water, energy, and food was relatively coordinated. By 2006–2008, however, system security had dropped precipitously from relatively safe to unsafe. According to the MK mutation point detection, there are two reasons for the occurrence of mutation points after 2007–2008: ① During the study period, the CPEC population began to increase at an annual growth rate of close to 4 million, which posed a certain challenge to the adequate supply of water, energy, and food resources. When this challenge reached a certain critical point, the collateral effect caused by the population increase was huge, leading to a significant decrease in the WEF system. ② The importance of water resources to arid and semi-arid areas is self-evident. From 2000 to 2007, especially after 9/11 and the subsequent support from Western developed countries, Pakistan underwent rapid economic development and had a large increase in population. The water resources were unable to support these increases, resulting in food and energy security issues. Thus, by 2016, WEF system security was further reduced to a very unsafe level. These changes indicate that population growth needs to be controlled, reasonable resource allocation policies need to be implemented, and resource allocation needs to be optimized.
4. Discussion
4.1. WEF System Optimization Suggestions
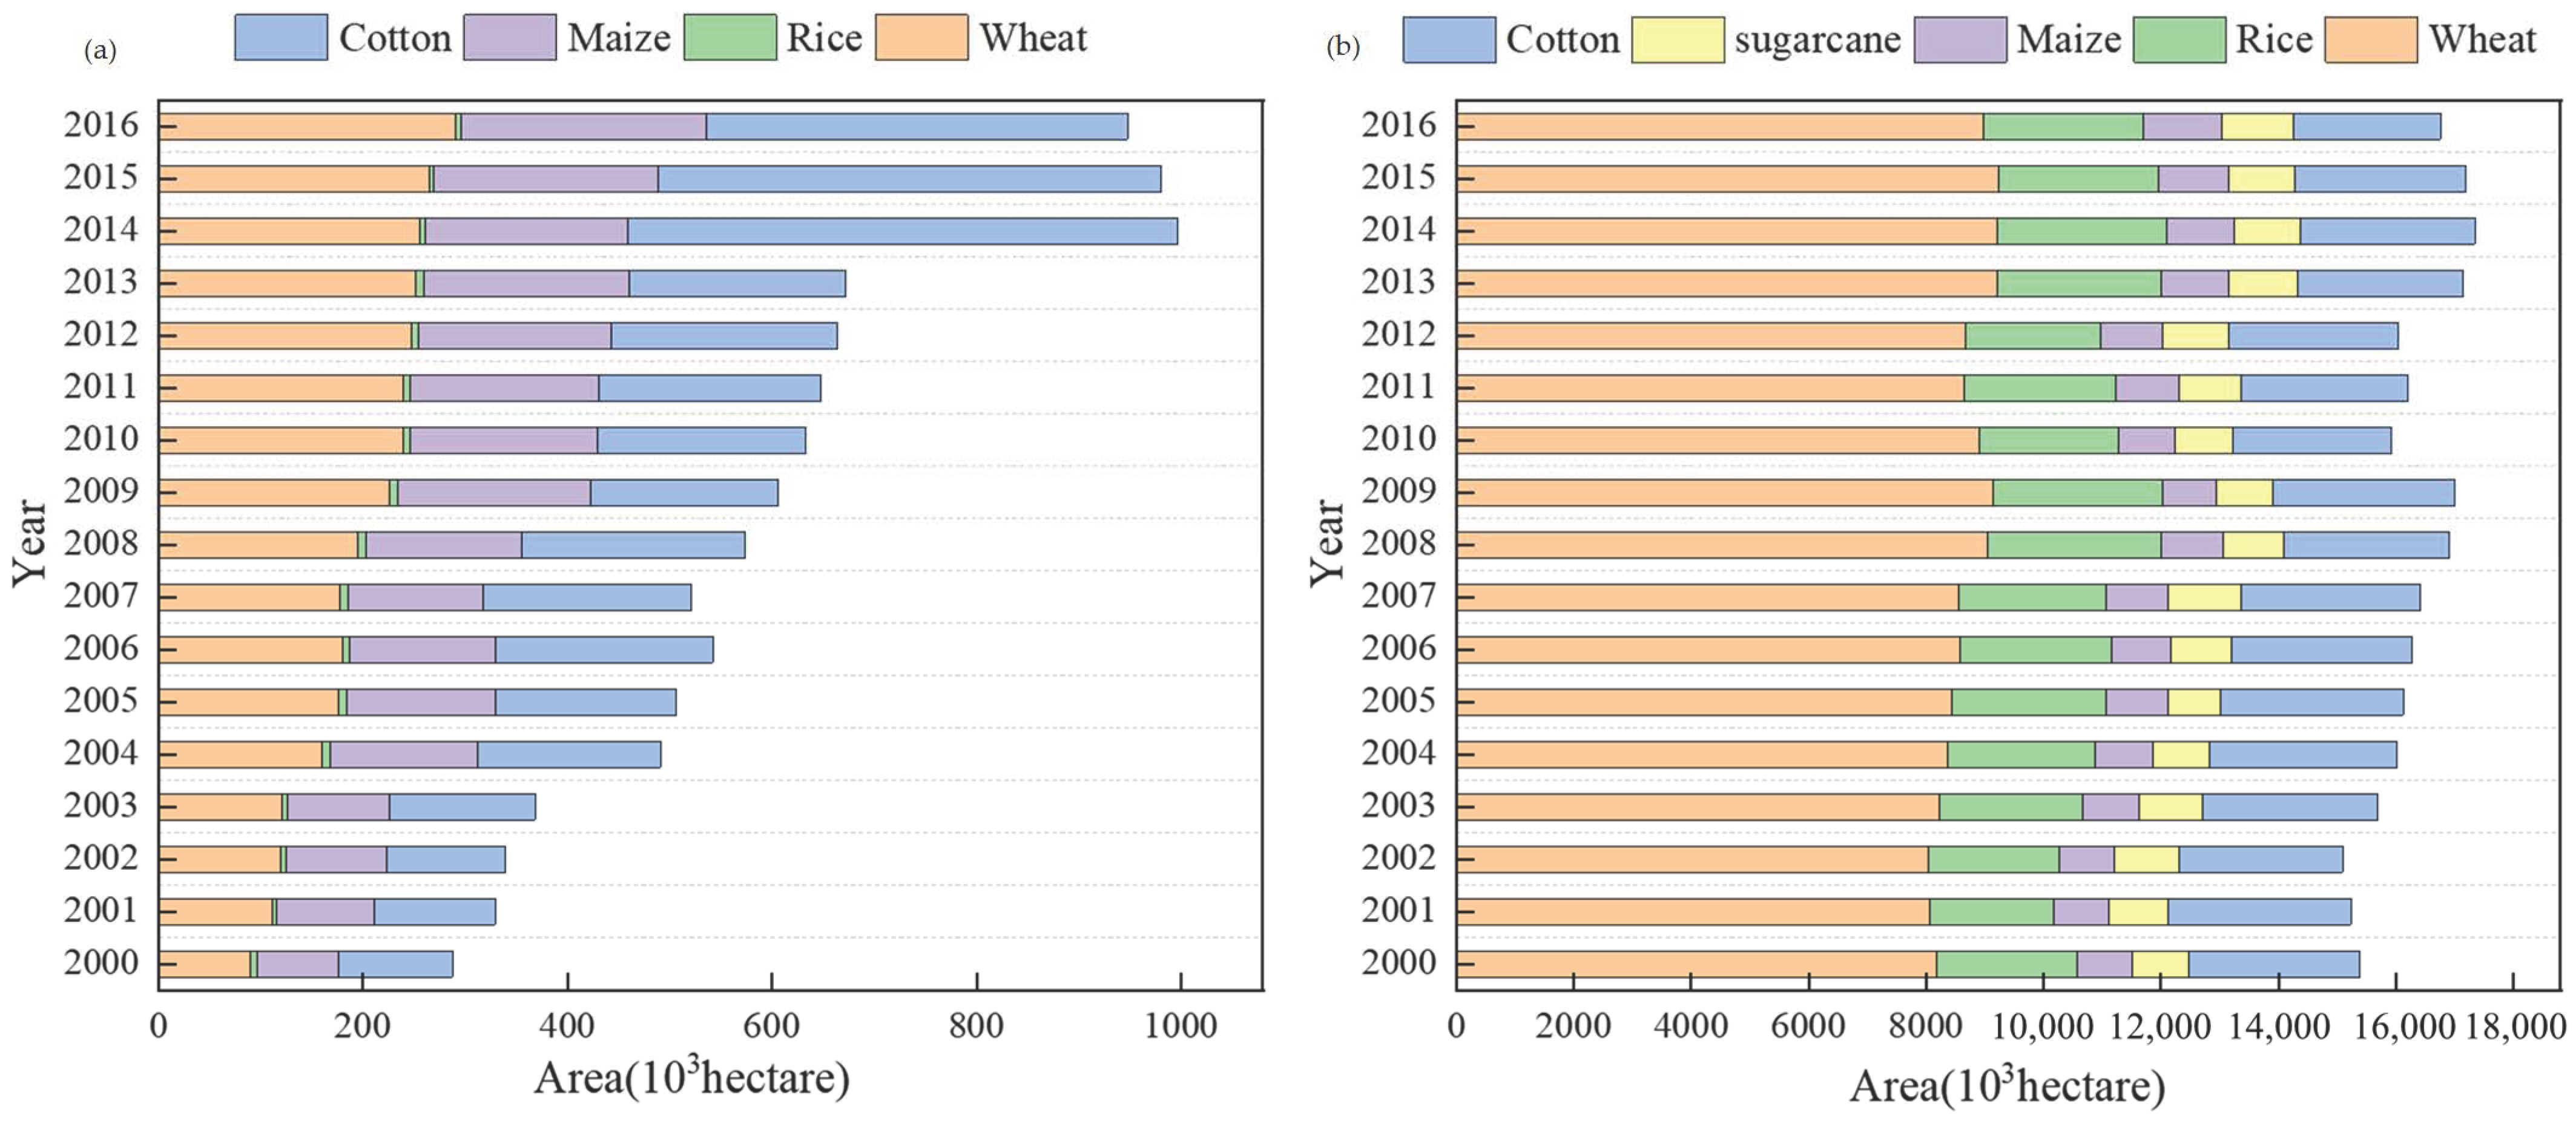
In the CPEC, water resources are under significant pressure from population growth, global climate change, and the continuous degradation of the ecosystem. The water crisis is exacerbated by improper integrated water resource management and planning. Some departments focus only on the distribution of water resources while ignoring the changes in planting patterns and weather patterns and do not manage the demand for stable growth. In Pakistan, the agricultural sector consumes most of the water resources. Crops with large water demands, such as rice, cotton, and sugarcane, account for a large proportion of the crop planting structure. Xinjiang is the driest inland agricultural irrigation area in China, and its agricultural water consumption accounts for more than 95% of the area’s total water consumption [62]. It is also an important cotton-producing area and has made important contributions to China’s cotton production and the economic development of northwest China [63].
As shown in Figure 10a, the planting area of major crops in Xinjiang during the study period increased by 6.6 × 10⁶ ha, and the planting area of cotton increased by 3.4 × 10⁶ ha. The expansion of the planting area of major crops stems from the demand for food security and economic growth, as well as the support of policies focused on the economic development of agricultural resources, national aid to Xinjiang, and poverty alleviation. Since 1995, the Xinjiang government has implemented the policy of “one black and one white”, and the textile industry has become the pillar of the regional economy, with the output value of cotton accounting for 40% of the total output value [64]. From 2001 to 2010, due to the poverty alleviation policy, the investment in water conservancy and farmland cultivation directly drove the expansion of agricultural planting areas. As shown in Figure 10b, however, neither the area nor the planting structure of main crops in Pakistan changed much from 2000 to 2016, with the planting area of rice, cotton, and sugarcane playing an important role in the planting structure of crops. Of the main crops, sugarcane consumes the most irrigation water, followed by cotton, rice, corn, and wheat. The International Crisis Group (ICG) Asia Report pointed out that cotton requires 8000–10,000 m3 of irrigation water per hectare, while wheat requires less than half of that [65].
Therefore, we believe that we can adjust the crop planting mode in the study area without affecting the income of farmers, reduce the planting area of high-water-consuming crops, and improve the proportion of agricultural water [66].
The Indus River Irrigation District of Pakistan has a large area of saline–alkali land due to traditional and unsustainable irrigation methods. With the increasing demand for food in Pakistan in recent years, the expansion of arable land has become a necessity, making the management of saline–alkali land an issue that needs to be urgently resolved. Saline–alkali land treatment requires large-scale water consumption, which is why, in Pakistan, it has not been controlled on a large scale in recent decades. Although the salinization area lacks water resources, it is rich in wind and electricity. Therefore, water can be indirectly replenished with wind and energy [67].
In the context of global warming, China, the European Union, the United States, and other countries have proposed the goal of achieving carbon neutrality around the middle of this century [68]. Although the carbon emission proportion of the CPEC accounts for less than 1% of the world’s emissions, the energy and carbon intensities of the CPEC have increased year by year since 2000 due to rapid social and economic development. Therefore, we should actively respond and formulate emission reduction policies for this region. For example, Pakistan plans to reduce its proportion of carbon emissions by 30% compared to 2008 by 2025 [69]. In addition, the CPEC should call on developed countries to provide financial and technical support to achieve reasonable emission reduction targets by promoting clean energy, reducing power loss, improving agricultural water efficiency, reducing diesel use, and using biogas energy.
4.2. WEF System Management Policy Recommendations
There are numerous problems in the resource management policy of the CPEC. Optimizing the WEF in this region requires a reasonable allocation of resources as an important measure. Improvements to current resource utilization efficiency and resource management could be made by considering the following aspect. First, most of the CPEC is situated in arid and semi-arid zones, where economic development and agricultural water use mainly rely on surface water resources. In addition, the entire region still uses traditional irrigation methods, and Pakistan still implements a nearly free water policy, resulting in an over-exploitation of surface water resources, with subsequent water shortages. In areas where surface water resources are scarce in Pakistan, groundwater is likewise being over-exploited on a large scale.
Based on the above water-use situation, it is necessary to carry out reasonable and unified management of groundwater and surface water in the region. This can be accomplished by accelerating the construction of a comprehensive water resource planning and management system [70], improving the existing water resource allocation mechanism, and coordinating water use to account for economic development, agriculture and other sectors, and ecological protection [71]. In addition, in order to meet the increasing demand for water resources, the optimal management of hydropower and irrigated agriculture should be strengthened; efforts should be made to improve and develop agricultural technologies and irrigation networks and to increase water efficiency and production technologies to maintain water resources and the safety of the food subsystem [72].
Finally, in terms of energy, the CPEC area should learn from the lessons of human economic development in the past, with high emissions, high pollution, and high energy consumption, and upgrade to a green economic development model with low emissions, low pollution, and low energy consumption. The region’s dependence on fossil energy is relatively high. Under the premise of healthy economic development and considering the diversity and carrying capacity of the region’s ecological environment, carbon dioxide emissions should be controlled as much as possible, energy utilization efficiency should be improved, and the economic and industrial structures should be adjusted. In other words, there should be a transformation of the mode of economic growth. Despite the shortage of water resources in arid areas, wind and solar energy are abundant. Therefore, the proportion of non-fossil energy and clean energy in energy consumption should be increased [69,73].
4.3. Deficiencies and Future Work
The present research scope suffers from some deficiencies that are specific to the CPEC region. As mentioned previously, the CPEC includes Kashmir. Due to ethnic and religious issues, Kashmir has traditionally been a core area of dispute between India and Pakistan. The Indian government has recently implemented a strict high-pressure policy in the Indian-controlled portion of Kashmir, which has increased the number of violent and terrorist incidents in the area and sparked social unrest [74]. Therefore, it is difficult to obtain accurate data and related materials on Kashmir. In addition, due to the peculiarities of the Pakistan Statistical Yearbook, the statistical data for each province are insufficient, so the present research is mainly based on time series and lacks spatial analysis.
Future work could focus on the impacts of global climate change in the CPEC region, along with the area’s continuous population growth and rapid economic development. Combined with relevant local policies, the security of the CPEC WEF system could be predicted for the next few years or even decades. According to the relevant data obtained by us and some work done in this research, we believe that if the population of the CEPC continues to rise, the comprehensive management of water, energy, and food will remain chaotic; without seeking the replacement of new energy, the safety of the WEF system will continue to decline. Other possible research topics include finding optimizing methods to help the region adapt to changing external factors so as to achieve the sustainable development of both the resources and the social economy.
5. Conclusions
This study comprehensively evaluated the safety of the WEF system of the CPEC from 2000 to 2016 and analyzed the main influencing factors of each subsystem based on the RAGA-PP model. In addition, we also established a series of optimization mechanisms to achieve the sustainable development of the WEF system. The main conclusions of this study are as follows:
- (1)
- In the single subsystem, due to the increase in population and economic development, the security of the water resources and energy subsystem of the CPEC shows a declining trend, while the increase in food output shows a rising trend in food subsystem security.
- (2)
- In the two–two cooperative subsystem, the security of the WE and EF subsystems of the CPEC has been declining due to poor resource coordination and management. In recent years, the security of the WF subsystem has been slowly increasing as the proportion of agricultural water consumption in the CPEC has declined.
- (3)
- From 2000 to 2016, the overall security of the CPEC WEF system showed a downward trend. From 2000 to 2005, the system was relatively safe (level IV); in 2006–2007, it was basically safe (level III); in 2008–2015, it was unsafe (level II); in 2016, it was very unsafe (level I).
- (4)
- The management of water, energy, food, and other resources in the CPEC is chaotic. However, strengthening comprehensive management will greatly improve the utilization efficiency of these resources and, at the same time, make the safety of the WEF system more stable. Therefore, strengthening the utilization and allocation of water resources, adopting reasonable water management policies, adjusting energy and industrial structures, and optimizing agricultural planting patterns are all vital to the sustainable development of water, energy, and food in the CPEC.
This research has achieved good results in the safety of the WEF system. The RAGA-PP model is widely used, and it has achieved steady results in the fields of energy, urban disaster prevention, ecological risk assessments, and so on. Therefore, we believe our research will provide some reference for the research of WEF system security and other economic fields.
Supplementary Materials
The following supporting information can be downloaded at: https://www.mdpi.com/article/10.3390/w14121900/s1.
Author Contributions
M.C. is responsible for writing and data processing. Y.C. is the supervisor of M.C.’s work and is responsible for the reviewing, editing, and conclusions of the data. W.D. helped in conceiving the research and ideas. Y.L. is responsible for helping with the data interpretation and conclusions. J.Q. is responsible for helping with the data interpretation and visualization. All authors have read and agreed to the published version of the manuscript.
Funding
This research was funded by the National Natural Science Foundation of China, grant number 52161145102.
Conflicts of Interest
The authors declare that they have no known competing financial interests or personal relationships that could have appeared to influence the work reported in this paper.
References
- El-Gafy, I. Water–food–energy nexus index: Analysis of water–energy–food nexus of crop’s production system applying the indicators approach. Appl. Water Sci. 2017, 7, 2857–2868. [Google Scholar] [CrossRef] [Green Version]
- Liu, J.; Mao, G.; Hoekstra, A.Y.; Wang, H.; Wang, J.; Zheng, C.; Yan, J. Managing the energy-water-food nexus for sustainable development. Appl. Energy 2018, 210, 377–381. [Google Scholar] [CrossRef]
- Zhang, T.; Tan, Q.; Yu, X.; Zhang, S. Synergy assessment and optimization for water-energy-food nexus: Modeling and application. Renew. Sustain. Energ. Rev. 2020, 134, 110059. [Google Scholar] [CrossRef]
- Chai, J.; Shi, H.; Lu, Q.; Hu, Y. Quantifying and predicting the Water-Energy-Food-Economy-Society-Environment Nexus based on Bayesian networks-a case study of China. J. Clean. Prod. 2020, 256, 120266. [Google Scholar] [CrossRef]
- Duan, W.; Chen, Y.; Zou, S.; Nover, D. Managing the water-climate-food nexus for sustainable development in Turkmenistan. J. Clean. Prod. 2019, 220, 212–224. [Google Scholar] [CrossRef]
- Hu, Y.; Duan, W.; Chen, Y.; Zou, S.; Kayumba, P.M.; Sahu, N. An integrated assessment of runoff dynamics in the Amu Darya River Basin: Confronting climate change and multiple human activities, 1960–2017. J. Hydrol. 2021, 603, 126905. [Google Scholar] [CrossRef]
- World Health Organization. Trends in Maternal Mortality 2000 to 2017: Estimates by WHO, UNICEF, UNFPA, World Bank Group and the United Nations Population Division; World Health Organization: Geneva, Switzerland, 2019. [Google Scholar]
- D’Odorico, P.; Davis, K.F.; Rosa, L.; Carr, J.A.; Chiarelli, D.; Dell’Angelo, J.; Rulli, M.C. The global Water-Energy-Food nexus. Rev. Geophys. 2018, 56, 456–531. [Google Scholar] [CrossRef]
- Hoff, H. Understanding the Nexus. Background paper for the Bonn 2011 Nexus conference: The Water, Energy and Food Security Nexus; Stockholm Environment Institute: Stockholm, Sweden, 2011. [Google Scholar]
- Adnan, H. Water-Food-Energy Nexus in Asia and the Pacific; United Nations ESCAP: Bangkok, Thailand, 2013; p. 72. [Google Scholar]
- FAO. The Water-Energy-Food Nexus: A New Approach in Support of Food Security and Sustainable Agriculture; Food and Agriculture Organization (FAO) of the United Nation: Rome, Italy, 2014. [Google Scholar]
- Lin, Z.; Liu, X.; Chen, Y.; Fu, B. Research progress and prospect of the relationship between water, food and energy. J. Geogr. 2021, 76, 1591–1604. (In Chinese) [Google Scholar]
- Zhao, A.; Zhu, X.; Liu, X.; Pan, Y.; Zuo, D. Impacts of land use change and climate variability on green and blue water resources in the Weihe River Basin of northwest China. Catena 2016, 137, 318–327. [Google Scholar] [CrossRef]
- Ge, J.; Lei, Y. Policy options for non-grain bioethanol in China: Insights from an economy-energy-environment CGE model. Energy Policy 2017, 105, 502–511. [Google Scholar] [CrossRef]
- Zhang, P.; Zhou, X. The latest development of food security research abroad and its enlightenment to China. Teach. Res. 2014, 7, 93–101. (In Chinese) [Google Scholar]
- Wang, C.; Tian, L.; Yu, M.; Liu, Y. Summary of research on water-energy coupling in electric power industry. Chin. Environ. Sci. 2018, 38, 4742–4748. [Google Scholar]
- Ghani, H.U.; Silalertruksa, T.; Gheewala, S.H. Water-energy-food nexus of bioethanol in Pakistan: A life cycle approach evaluating footprint indicators and energy performance. Sci. Total Environ. 2019, 687, 867–876. [Google Scholar] [CrossRef] [PubMed]
- Deng, H.M.; Wang, C.; Cai, W.J.; Liu, Y.; Zhang, L.X. Managing the water-energy-food nexus in China by adjusting critical final demands and supply chains: An input-output analysis. Sci. Total Environ. 2020, 720, 13763. [Google Scholar] [CrossRef]
- Li, J.; Cui, J.; Sui, P.; Yue, S.; Yang, J.; Lv, Z.; Chen, Y. Valuing the synergy in the water-energy-food nexus for cropping systems: A case in the North China Plain. Ecol. Indic. 2021, 127, 107741. [Google Scholar] [CrossRef]
- Bakhshianlamouki, E.; Masia, S.; Karimi, P.; van der Zaag, P.; Sušnik, J. A system dynamics model to quantify the impacts of restoration measures on the water-energy-food nexus in the Urmia lake Basin, Iran. Sci. Total Environ. 2020, 708, 134874. [Google Scholar] [CrossRef]
- Okumu, B.; Kehbila, A.G.; Osano, P. A review of water-forest-energy-food security nexus data and assessment of studies in East Africa. Curr. Res. Environ. Sustain. 2021, 3, 100045. [Google Scholar] [CrossRef]
- Bhattacharjee, D. China Pakistan Economic Corridor. SSRN Electron. J. 2015. [Google Scholar] [CrossRef]
- Qureshi, A.H. China/Pakistan economic corridor: A critical national and international law policy based perspective. Chin. J. Int. Law. 2015, 14, 777–799. [Google Scholar] [CrossRef]
- Awais, M.; Samin, T.; Gulzar, M.A.; Hwang, J. The sustainable development of the China Pakistan economic corridor: Synergy among economic, social, and environmental sustainability. Sustainability 2019, 11, 7044. [Google Scholar] [CrossRef] [Green Version]
- Khan, S. Policy diagnostics for Pakistan’s water security challenge. World Water Policy 2019, 5, 8–14. [Google Scholar] [CrossRef]
- Kirby, M.; Mainuddin, M.; Khaliq, T.; Cheema, M.J.M. Agricultural production, water use and food availability in Pakistan: Historical trends, and projections to 2050. Agric. Water Manag. 2017, 179, 34–46. [Google Scholar] [CrossRef]
- Laghari, A.N.; Vanham, D.; Rauch, W. The Indus basin in the framework of current and future water resources management. Hydrol. Earth Syst. Sci. 2012, 16, 1063–1083. [Google Scholar] [CrossRef] [Green Version]
- Taiqi, Z. The impact of China-Pakistan Economic Corridor on Pakistan economy under the background of “One Belt And One Road”. Front. Soc. Sci. Technol. 2020, 2, 41–44. [Google Scholar]
- Siddiqi, A.; Wescoat, J.L., Jr. Energy use in large-scale irrigated agriculture in the Punjab province of Pakistan. Water Int. 2013, 38, 571–586. [Google Scholar] [CrossRef]
- Jin, J.; Yang, X.; Ding, J. Accelerated Genetic Algorithm Based on Real Number Coding. J. Sichuan Univ. 2000, 4, 20–24. (In Chinese) [Google Scholar]
- Cai, W.; Zhang, J. Study on coupling of social economy, resources and environment in Central Plains Economic Zone based on projection pursuit model. Hubei Agric. Sci. 2018, 57, 156–160. (In Chinese) [Google Scholar]
- Zhou, H.; Pei, W.; You, B. Agricultural drought risk assessment in Heilongjiang Province based on RAGA optimized projection pursuit model. Chin. Agric. Sci. Bull. 2018, 34, 115–121. (In Chinese) [Google Scholar]
- Wang, Q.; Zhan, L. Assessing the sustainability of the shale gas industry by combining DPSIRM model and RAGA-PP techniques: An empirical analysis of Sichuan and Chongqing, China. Energy 2019, 176, 353–364. [Google Scholar] [CrossRef]
- Hameed, M. The politics of the China―Pakistan economic corridor. Palgrave Commun. 2018, 4, 1–10. [Google Scholar] [CrossRef]
- Yu, Z.; Yu, X.; Yang, F. The temporal and spatial distribution characteristics of climate change in the China-Pakistan Economic Corridor from 1980 to 2019. Arid Zone Res. 2021, 38, 695–703. (In Chinese) [Google Scholar]
- Ullah, S.; You, Q.; Ullah, W.; Ali, A. Observed changes in precipitation in China-Pakistan economic corridor during 1980–2016. Atmos. Res. 2018, 210, 1–14. [Google Scholar] [CrossRef]
- Wu, H.; Guo, B.; Fan, J.; Yang, F.; Han, B.; Wei, C.; Meng, C. A novel remote sensing ecological vulnerability index on large scale: A case study of the China-Pakistan Economic Corridor region. Ecol. Indic. 2021, 129, 107955. [Google Scholar] [CrossRef]
- Chen, J.; Tao, H.; Liu, J.; Zhai, J.; Subuda; Jiang, T. China-Pakistan Economic Corridor. Temporal and Spatial Variations of Extreme Precipitation. Plateau Meteorol. 2021, 40, 1048–1056. (In Chinese) [Google Scholar]
- Barlow, M.; Zaitchik, B.; Paz, S.; Black, E.; Evans, J.; Hoell, A. A review of drought in the Middle East and southwest Asia. J. Clim. 2016, 29, 8547–8574. [Google Scholar] [CrossRef]
- Adnan, S.; Ullah, K.; Shuanglin, L.; Gao, S.; Khan, A.H.; Mahmood, R. Comparison of various drought indices to monitor drought status in Pakistan. Clim. Dyn. 2018, 51, 1885–1899. [Google Scholar] [CrossRef]
- Sivakumar, M.V.; Lal, R.; Selvaraju, R.; Hamdan, I. (Eds.) Climate Change and Food Security in West Asia and North Africa; Springer: Berlin/Heidelberg, Germany, 2013. [Google Scholar]
- Hassani, A.; Azapagic, A.; Shokri, N. Predicting long-term dynamics of soil salinity and sodicity on a global scale. Proc. Natl. Acad. Sci. USA 2020, 117, 33017–33027. [Google Scholar] [CrossRef]
- Wang, Y.; Pu, A.; Yan, X.; Sun, J. Comprehensive evaluation of Xinjiang water-energy-food system security. Trans. Chin. Soc. Agric. Mach. 2020, 51, 264–272. (In Chinese) [Google Scholar]
- Yu, S.; Lu, H. An integrated model of water resources optimization allocation based on projection pursuit model–Grey wolf optimization method in a transboundary river basin. J. Hydrol. 2018, 559, 156–165. [Google Scholar] [CrossRef]
- Sawyerr, B.A.; Adewumi, A.O.; Ali, M.M. Real-coded genetic algorithm with uniform random local search. Appl. Math. Comput. 2014, 228, 589–597. [Google Scholar] [CrossRef]
- Meng, D.Y.; Lu, Y.Q.; Fan, X.S.; Shi, B.L. Evaluation of the coordination of transportation and economy in Henan counties based on the projection pursuit model. Geogr. Res. 2013, 32, 2092–2106. (In Chinese) [Google Scholar]
- Zaki, M.K.; Noda, K.; Ito, K.; Ariyanto, D.P. Long-term trends of diurnal rainfall and hydro-meteorological disaster in the new capital city of Indonesia. In IOP Conference Series: Earth and Environmental Science; IOP Publishing: Bristol, UK, 2021; Volume 724, p. 012046. [Google Scholar]
- Chen, Y.N.; Li, B.F.; Li, Z.; Li, W.H. Research on the formation, transformation and water security of water resources in the arid area of Northwest China. J. Geogr. Sci. 2016, 26, 939–952. [Google Scholar] [CrossRef] [Green Version]
- Ahmed, K.; Shahid, S.; Chung, E.S.; Nawaz, N.; Khan, N.; Rasheed, B. Divergence of potential evapotranspiration trends over Pakistan during 1967–2016. Theor. Appl. Climatol. 2020, 141, 215–222. [Google Scholar] [CrossRef]
- ALI, H. Impact of Terrorist Attacks on Stock Returns and Investors’ Sentiment in the Context of Pakistan Stock Market. Ph.D. Thesis, Northeast University of Finance and Economics, Dalian, China, 2018. [Google Scholar]
- Hina, H.; Qayyum, A. Re-estimation of Keynesian model by considering critical events and multiple cointegrating vectors. Pak. Dev. Rev. 2015, 1, 23–145. [Google Scholar] [CrossRef] [Green Version]
- Mughal, S.L.; Chaudhary, M. Implications of Global Financial Crisis on Textile Industry of Pakistan. J. Law Policy Glob. 2014, 26, 106. [Google Scholar] [CrossRef] [Green Version]
- Schotter, A.; Thi My, H.D. The Effects of the Global Financial Crisis on Supply Chain Members in Non-BRIC Emerging Markets. Thunderbird Int. Bus. Rev. 2013, 55, 609–618. [Google Scholar] [CrossRef]
- United Nations. Department of Economic and Social Affairs, World Population Prospects 2019; United Nations: San Francisco, CA, USA, 2017. [Google Scholar]
- Singh, A. Soil salinization and waterlogging: A threat to environment and agricultural sustainability. Ecol. Indic. 2015, 57, 128–130. [Google Scholar] [CrossRef]
- Min, S.; Cui, S.; Chen, Q. A review of soil salinization and its control measures. China Agric. Inf. 2016, 5, 108–110. (In Chinese) [Google Scholar]
- Cuevas, J.; Daliakopoulos, I.N.; del Moral, F.; Hueso, J.J.; Tsanis, I.K. A review of soil-improving cropping systems for soil salinization. Agronomy 2019, 9, 295. [Google Scholar] [CrossRef] [Green Version]
- Hasan, F.U.; Fatima, B.; Heaney-Mustafa, S. A critique of successful elements of existing on-farm irrigation water management initiatives in Pakistan. Agric. Water Manag. 2021, 244, 106598. [Google Scholar] [CrossRef]
- Hussain, S.; Yu, C. Relationship between Power Energy Consumption, FDI and Economic Growth: A Case Study of Pakistan. Int. J. Econ. Manag. Sci. 2021, 10, 6. [Google Scholar]
- Rehman, A.; Ma, H.; Radulescu, M.; Sinisi, C.I.; Yousaf, Z. Energy crisis in Pakistan and economic progress: Decoupling the impact of coal energy consumption in power and Brick Kilns. Mathematics 2021, 9, 2083. [Google Scholar] [CrossRef]
- Li, L.; Ji, L.; Zhang, Y.; Sun, W.; An, X.; Tu, J.; He, J.; Zhou, Q.; Jiang, H. Preliminary analysis and enlightenment of Pakistan’s “1·9” blackout. Power Grid Technol. 2021, 46, 1–8. (In Chinese) [Google Scholar]
- Li, Y.; Deng, M. Spatiotemporal variations of agricultural water footprint and its economic benefits in Xinjiang, northwestern China. Sci Rep. 2021, 11, 1–12. [Google Scholar] [CrossRef]
- Li, H. Research on the International Competitiveness of Cotton Industry in Xinjiang, China. Ph.D. Thesis, Huazhong Agricultural University, Wuhan, China, 2006. [Google Scholar]
- Zhang, P. Research on the Coupling System of Society, Ecoenvironment and Water in Tarim River Basin. Ph.D. Thesis, China Institute of Water Resources and Hydropower, Beijing, China, 2019. [Google Scholar]
- Zhupankhan, A.; Tussupova, K.; Berndtsson, R. Could changing power relationships lead to better water sharing in Central Asia? Water 2017, 9, 139. [Google Scholar] [CrossRef]
- Kahlown, M.A.; Majeed, A. Water-resources situation in Pakistan: Challenges and future strategies. Water Resour. South Present Scenar. Future Prospect. 2003, 20, 33–45. [Google Scholar]
- Wang, F. On the management model of water and soil resources in arid areas based on the separation of soil-salt and water-salt. Soil Water Conserv. Bull. 2019, 39, 317–321. (In Chinese) [Google Scholar]
- Sun, Y. The impact of human activities on the climate system—Interpretation of Chapter 3 of the Report of Working Group I of the Sixth IPCC Assessment Report. Chin. J. Atmos. Sci. 2021, 44, 654–657. (In Chinese) [Google Scholar]
- Rehman, A.; Ma, H.; Ahmad, M.; Irfan, M.; Traore, O.; Chandio, A.A. Towards environmental Sustainability: Devolving the influence of carbon dioxide emission to population growth, climate change, Forestry, livestock and crops production in Pakistan. Ecol. Indic. 2021, 125, 107460. [Google Scholar] [CrossRef]
- Wang, X.; Chen, Y.; Li, Z.; Fang, G.; Wang, Y. Development and utilization of water resources and assessment of water security in Central Asia. Agric. Water Manag. 2020, 240, 106297. [Google Scholar] [CrossRef]
- Rahaman, M.M. Principles of transboundary water resources management and water-related agreements in Central Asia: An analysis. Int. J. Water Resour. Dev. 2012, 28, 475–491. [Google Scholar] [CrossRef]
- Duan, W.; Zou, S.; Chen, Y.; Nover, D.; Fang, G.; Wang, Y. Sustainable water management for cross-border resources: The Balkhash Lake Basin of Central Asia, 1931–2015. J. Clean. Prod. 2020, 263, 121614. [Google Scholar] [CrossRef]
- Abdullah, F.B.; Iqbal, R.; Jawaid, M.; Memon, I.; Mughal, S.; Memon, F.S.; Rizvi, S.S.A. Energy security index of Pakistan (ESIOP). Energy Strateg. Rev. 2021, 38, 100710. [Google Scholar] [CrossRef]
- Liu, S.; Zhang, S. The development trend of Kashmir issue and its impact on the China-Pakistan Economic Corridor. Acad. Explor. 2020, 38–47. (In Chinese) [Google Scholar]
Figure 1.
Location of the CPEC, IRB, TRB, and river systems (Drawing approval number: GS (2019)1822).
Figure 1.
Location of the CPEC, IRB, TRB, and river systems (Drawing approval number: GS (2019)1822).

Figure 2.
Synergy competition mechanism of the WEF system.
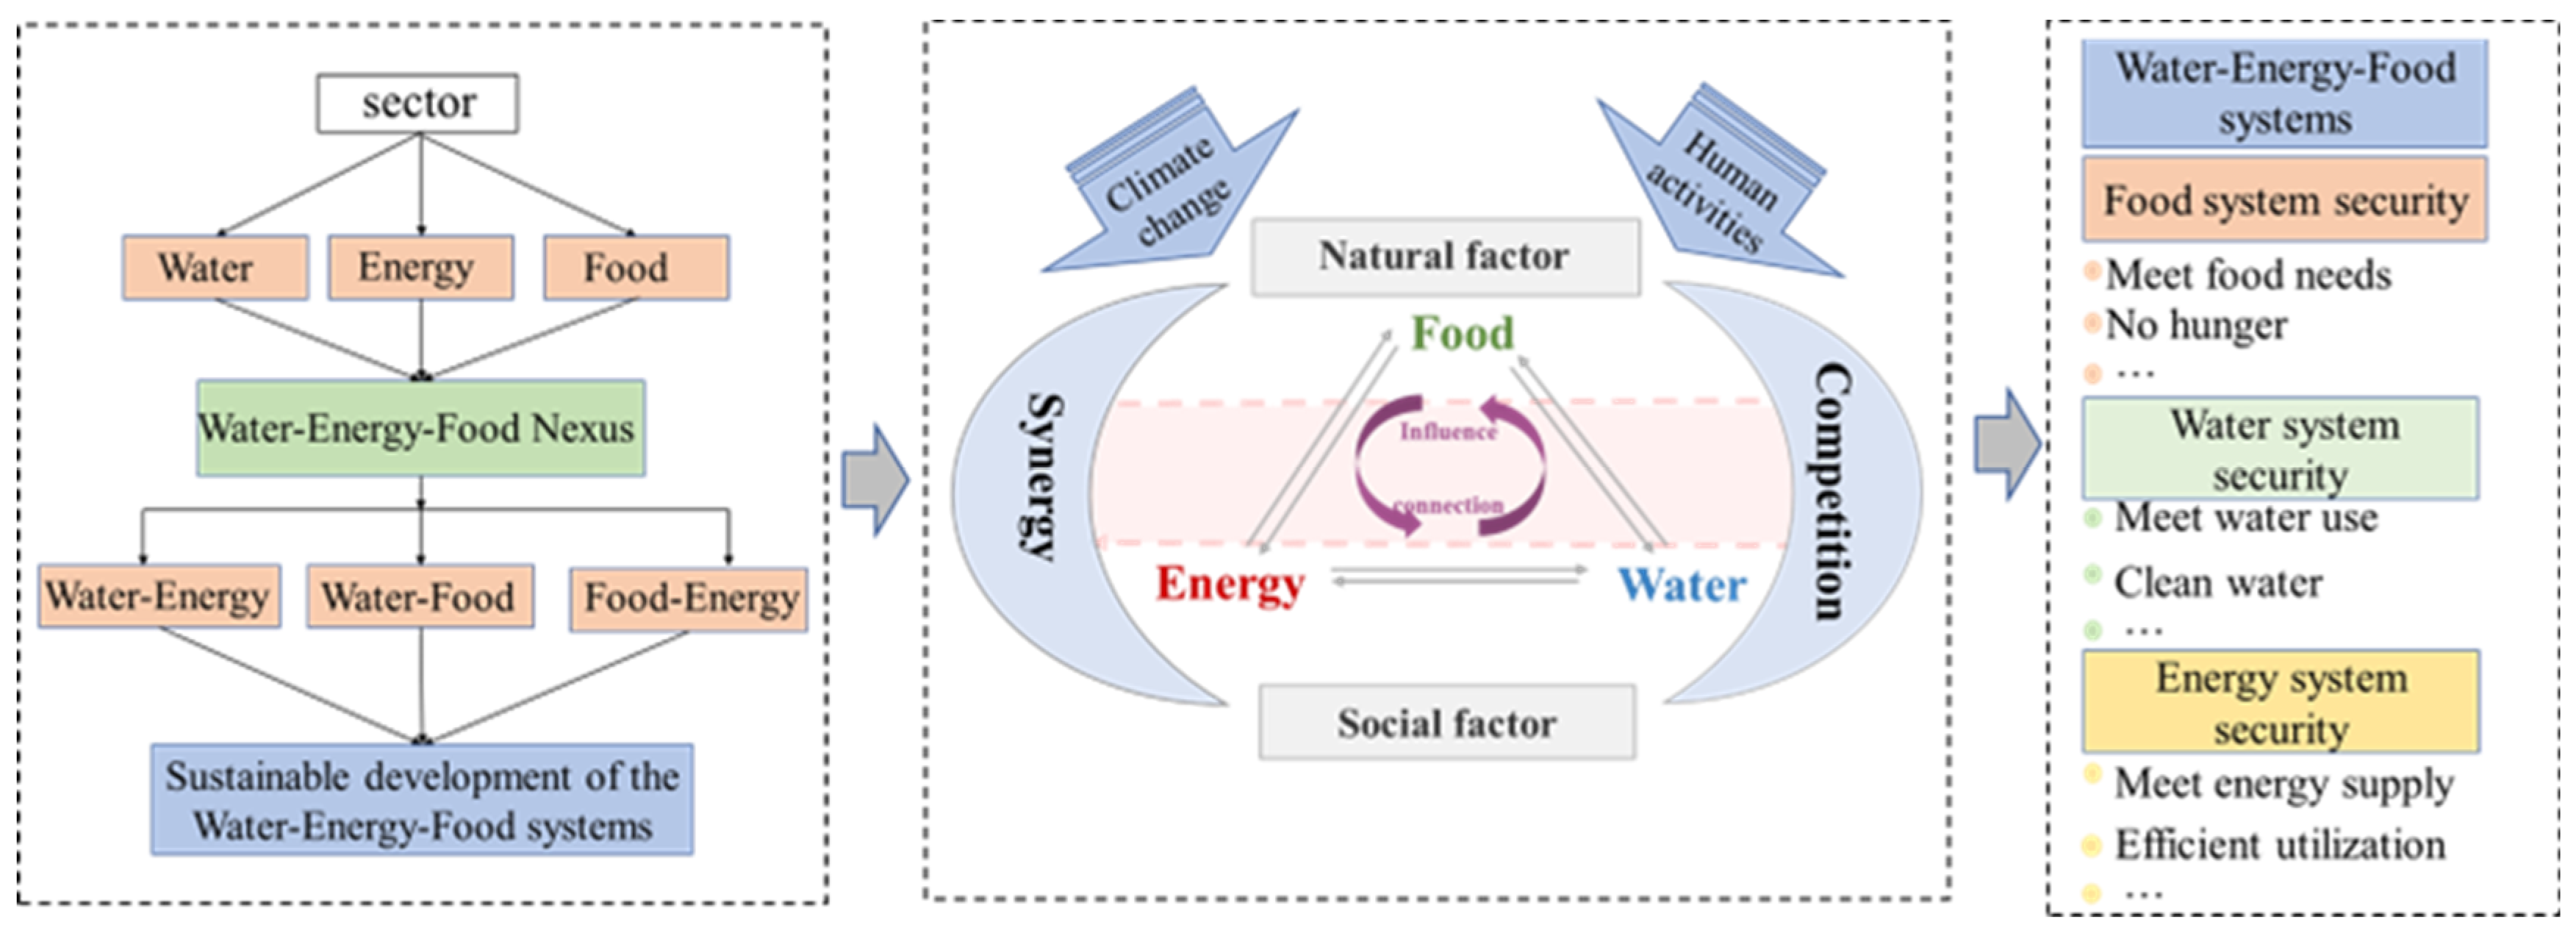
Figure 3.
Process of optimizing evaluation indicators.

Figure 4.
Relationship between projection value and evaluation grade.

Figure 5.
(a) Water resources per capita in the period 2000–2016. Note: The unit in KKAP is Person/104 m3. The unit in KR, the CPEC, and Pakistan is Person/103 m3. (b) Effective precipitation and evapotranspiration in the period 2000–2016. Among them, the size of the circle represents the annual change of ET, and the trend of the circle represents the trend of precipitation. (c) Energy consumption in the period 2000–2016. Among them, the size of the circle represents the total power consumption, and the trend of the circle represents the trend of the proportion of agricultural electricity consumption. (d) Carbon dioxide emission intensity in the period 2000–2016. (e) Per capita grain in the period 2000–2016. (f) Saline–alkali land area in the period 2000–2016.
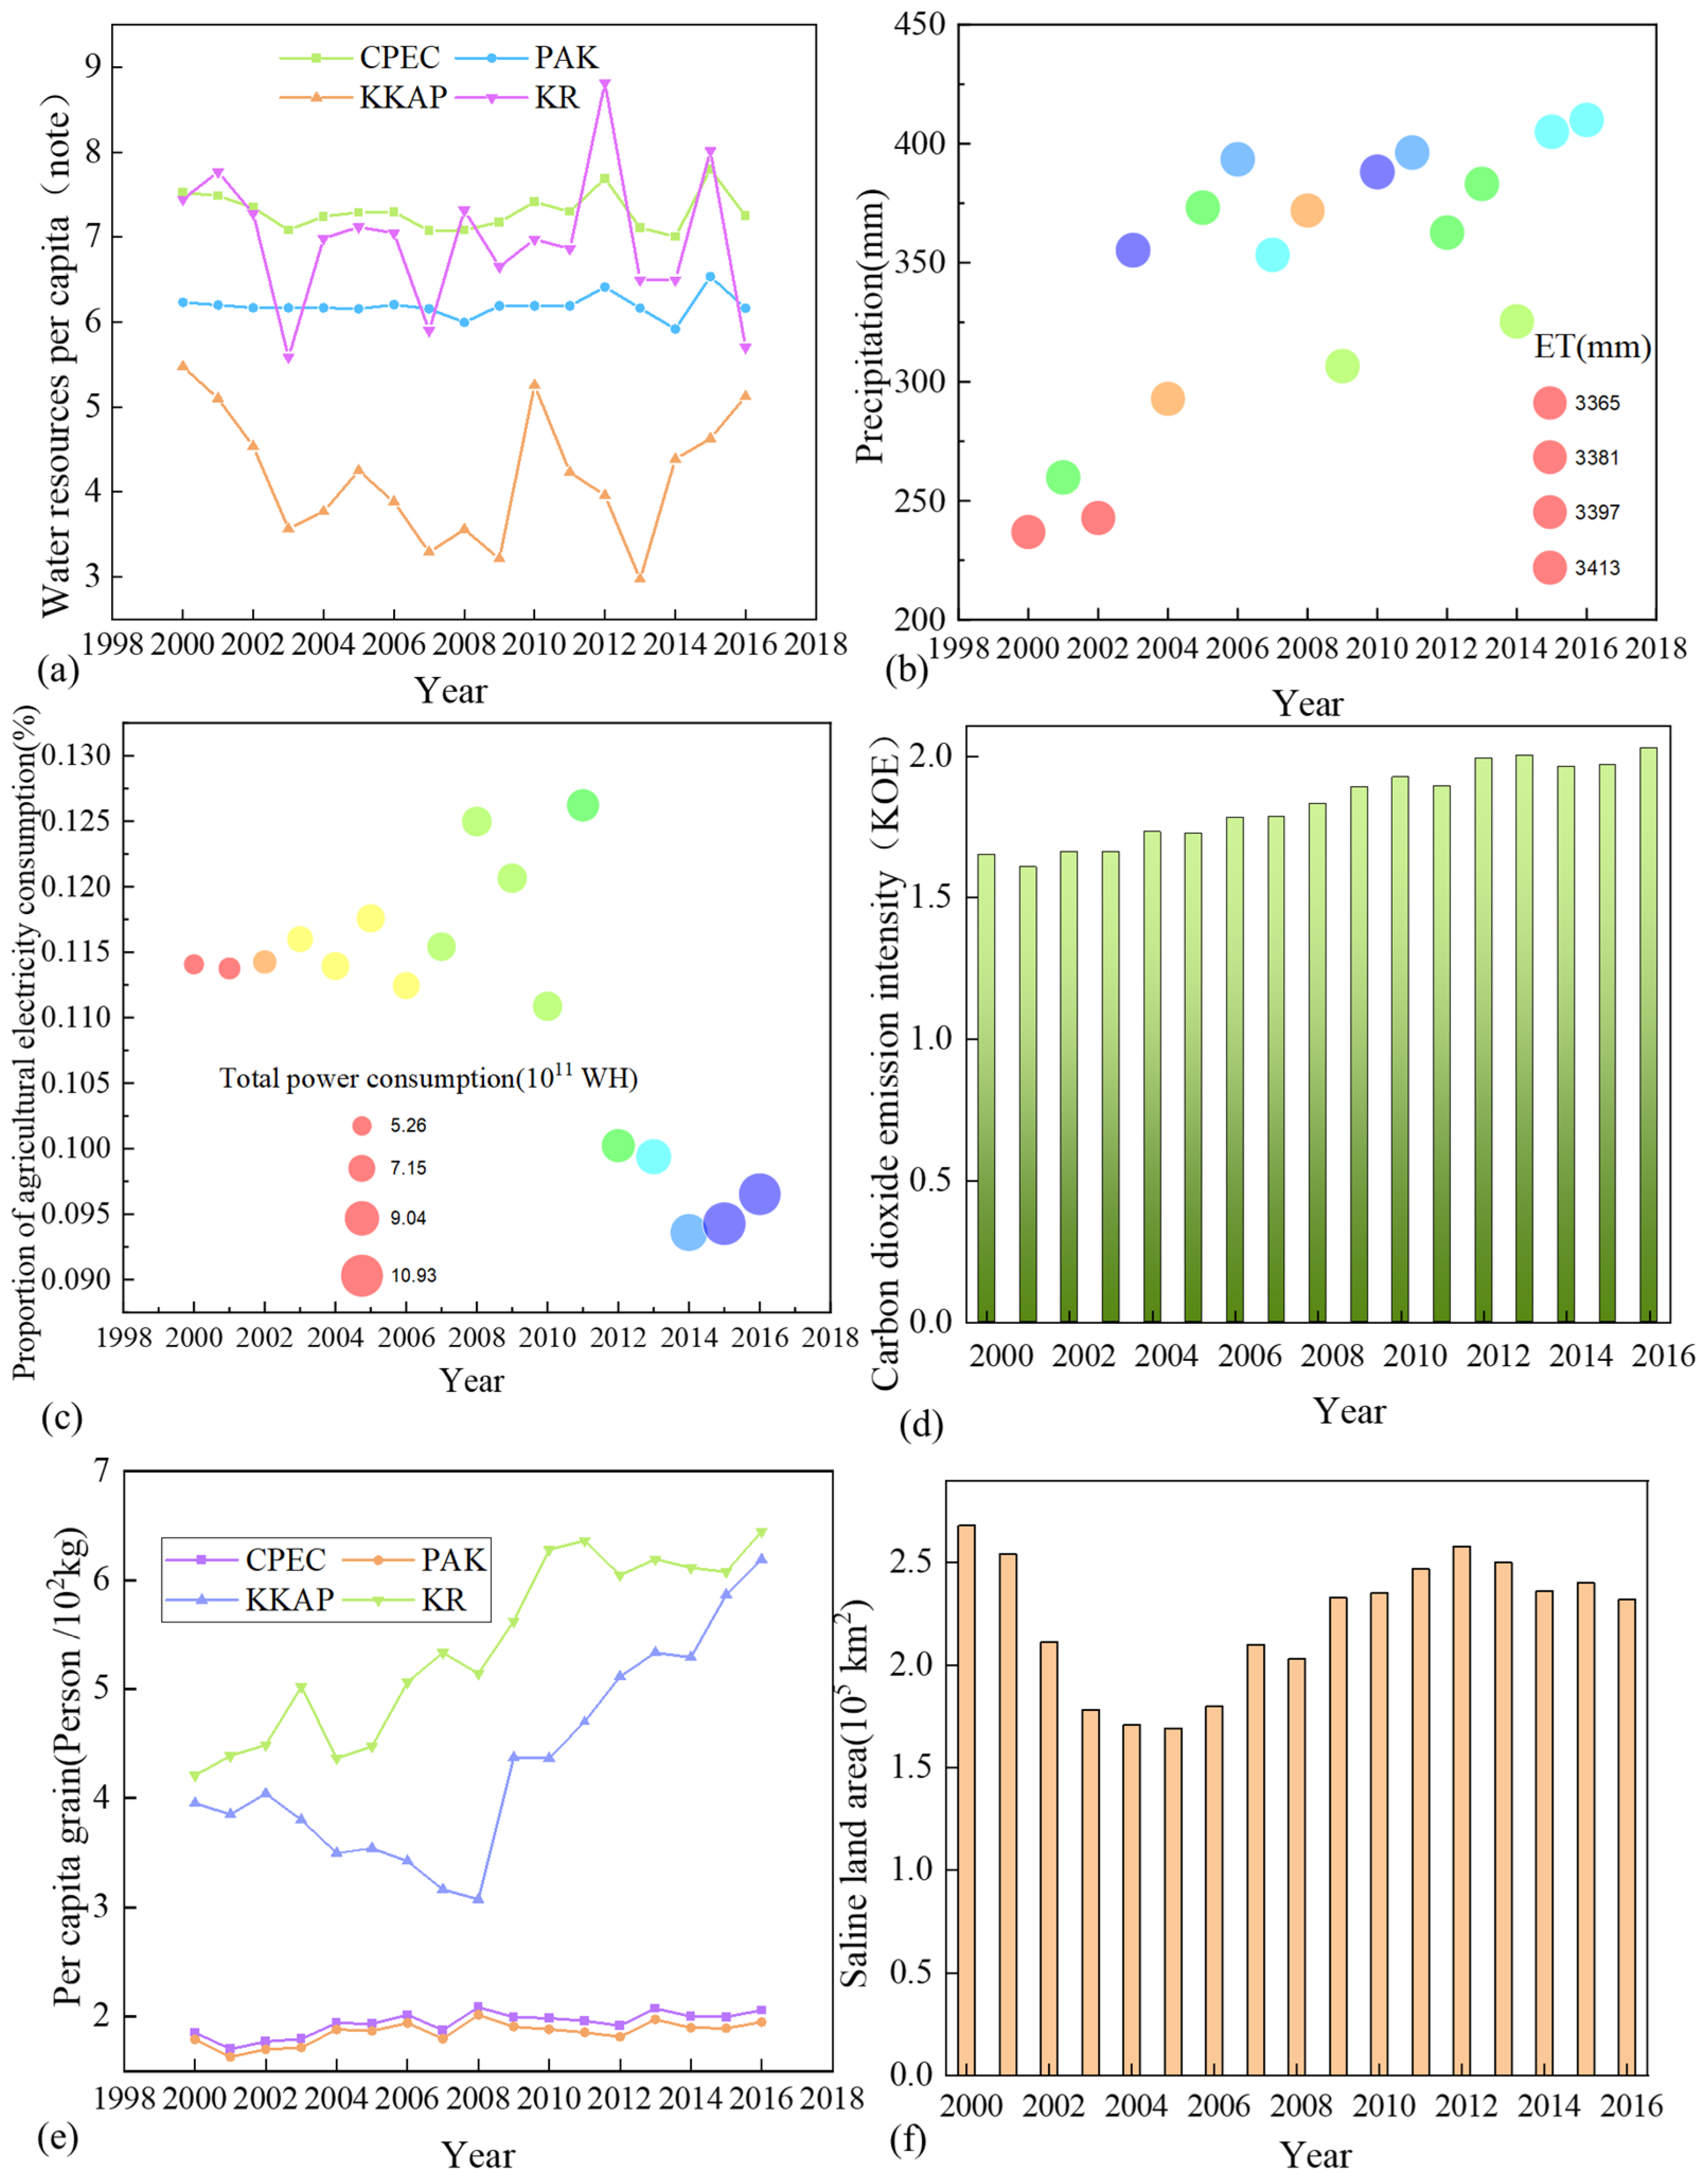
Figure 6.
(a) The proportion of agricultural electricity consumption and total electricity consumption in the period 2000–2016. (b) Fertilizer consumption and agricultural water-use ratios in the period 2000–2016. (c) Distribution of tube wells and irrigation areas in the period 2000–2016.
Figure 6.
(a) The proportion of agricultural electricity consumption and total electricity consumption in the period 2000–2016. (b) Fertilizer consumption and agricultural water-use ratios in the period 2000–2016. (c) Distribution of tube wells and irrigation areas in the period 2000–2016.

Figure 7.
Land use in CPEC in 2015.

Figure 8.
Analysis of mutation points of projection values in the period 2000–2016. (a) Projection value trend analysis. (b) Detection of abrupt change of projection value.
Figure 8.
Analysis of mutation points of projection values in the period 2000–2016. (a) Projection value trend analysis. (b) Detection of abrupt change of projection value.
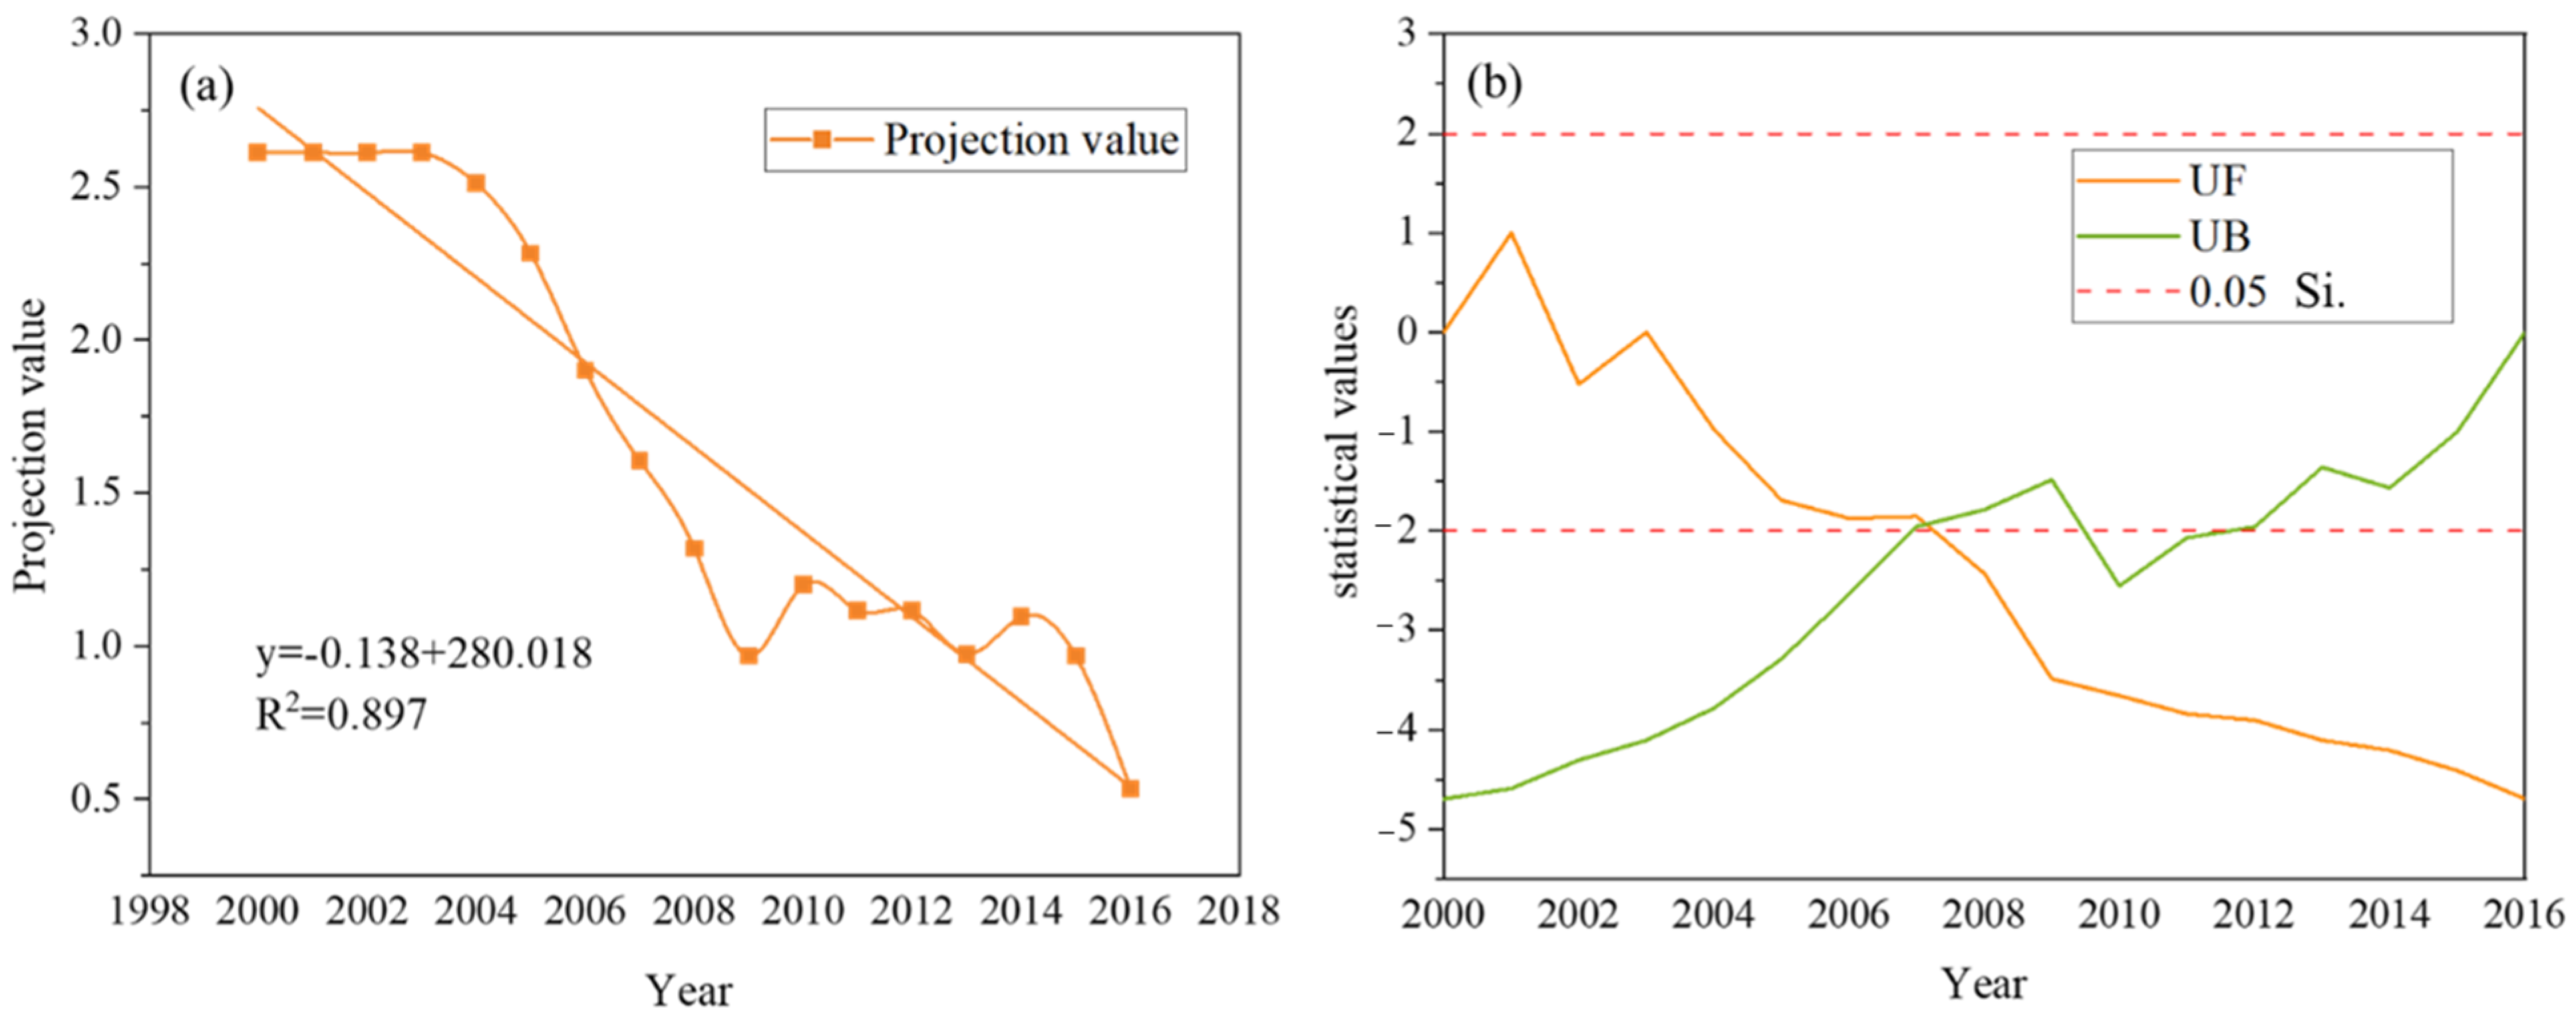
Figure 9.
Changes in system safety level values in the period 2000–2016.

Figure 10.
Change trend of crop planting structures and areas in the China–Pakistan Economic Corridor from 2000 to 2016. Note: (a) Xinjiang portion of the CPEC; and (b) Pakistan portion of the CPEC.
Figure 10.
Change trend of crop planting structures and areas in the China–Pakistan Economic Corridor from 2000 to 2016. Note: (a) Xinjiang portion of the CPEC; and (b) Pakistan portion of the CPEC.

Table 1.
Data references.
| Date | Unit | References |
|---|---|---|
| Total groundwater resources | 109 m3 | https://www.pbs.gov.pk/; http://tjj.xinjiang.gov.cn/ (accessed on 5 June 2022) |
| Cultivated land area | 106 ha | https://www.pbs.gov.pk/; http://tjj.xinjiang.gov.cn/ (accessed on 5 June 2022) |
| precipitation | mm | Grid data processing |
| Effective irrigation area | 103 ha | https://www.pbs.gov.pk/; http://tjj.xinjiang.gov.cn/ (accessed on 5 June 2022) |
| Evapotranspiration | mm | Grid data processing |
| Average per capita water resources | person/m3 | https://www.pbs.gov.pk/; http://tjj.xinjiang.gov.cn/ (accessed on 5 June 2022) |
| Fertilizer consumption | 104 tons | https://www.pbs.gov.pk/; http://tjj.xinjiang.gov.cn/ (accessed on 5 June 2022) |
| Crop water-use efficiency | % | Grid data processing |
| Carbon emission of energy in agriculture | J | https://www.fao.org/home/en/ (accessed on 5 June 2022) |
| Energy usage per unit GDP | KOE | https://www.worldbank.org/en/home (accessed on 5 June 2022) |
| Carbon dioxide intensity | KOE | https://www.worldbank.org/en/home (accessed on 5 June 2022) |
| Per capita power consumption | KWH | https://www.pbs.gov.pk/; http://tjj.xinjiang.gov.cn/ (accessed on 5 June 2022) |
| Agricultural output value | 104 dollars | https://www.pbs.gov.pk/; http://tjj.xinjiang.gov.cn/ (accessed on 5 June 2022) |
| Crop production index | 2004–2006 = 100 | https://www.shihang.org/zh/home (accessed on 5 June 2022) |
| Energy dependence coefficient | % | https://www.shihang.org/zh/home (accessed on 5 June 2022) |
| Saline land area | 105 km2 | [42] |
| Per capita grain crop yield | person/kg | https://www.worldbank.org/en/home (accessed on 5 June 2022) |
| Energy consumption of fossil fuels | % (Total energy) | https://www.worldbank.org/en/home (accessed on 5 June 2022) |
| Proportion of agricultural water | % | https://www.worldbank.org/en/home (accessed on 5 June 2022) |
| Per capita energy consumption | person/KOE | https://www.worldbank.org/en/home (accessed on 5 June 2022) |
| Water productivity | % | https://www.worldbank.org/en/home (accessed on 5 June 2022) |
| Proportion of agricultural electricity consumption | % | https://www.pbs.gov.pk/; http://tjj.xinjiang.gov.cn/ (accessed on 5 June 2022) |
| Number of tube wells | people | https://www.pbs.gov.pk/; http://tjj.xinjiang.gov.cn/ (accessed on 5 June 2022) |
Note: Kilogram oil equivalent (KOE).
Table 2.
Evaluation indicator system.
| Target Layer | Criterion Layer | Indicator Layer | Indicator Type |
|---|---|---|---|
| WEF system security (A1) | Water subsystem security (B1) | Evapotranspiration (C1) | Negative |
| Precipitation (C2) | Positive | ||
| Average per capita water resources (C3) | Positive | ||
| Total groundwater resources (C4) | Positive | ||
| Energy subsystem security (B2) | Energy usage per unit GDP (C5) | Negative | |
| Energy dependence coefficient (C6) | Negative | ||
| Energy consumption of fossil fuels (C7) | Negative | ||
| Carbon dioxide intensity (C8) | Negative | ||
| Per capita power consumption (C9) | Negative | ||
| Per capita energy consumption (C10) | Negative | ||
| Food subsystem security (B3) | Per capita grain crop yield (C11) | Positive | |
| Cultivated land area (C12) | Positive | ||
| Agricultural output value (C13) | Positive | ||
| Crop production index (C14) | Positive | ||
| Saline land area (C15) | Negative | ||
| WF subsystem security (B4) | Proportion of agricultural water (C16) | Negative | |
| Crop water-use efficiency (C17) | Positive | ||
| Fertilizer consumption (C18) | Negative | ||
| Water productivity (C19) | Positive | ||
| WE subsystem security (B5) | Number of tube wells (C20) | Negative | |
| Effective irrigation area (C21) | Positive | ||
| EF subsystem security (B6) | Carbon emission of energy in agriculture (C22) | Negative | |
| Proportion of agricultural electricity consumption (C23) | Positive |
Table 3.
Representative indicators with a relatively large weight from each subsystem.
| Indicator | C2 | C3 | C9 | C10 | C12 | C16 | C17 | C19 | C21 | C22 | C25 |
|---|---|---|---|---|---|---|---|---|---|---|---|
| The best projection direction | 0.1361 | 0.1093 | 0.3457 | 0.4272 | 0.3457 | 0.3406 | 0.3485 | 0.2353 | 0.2422 | 0.0015 | 0.0909 |
| Index type | Positive | Positive | Negative | Negative | Positive | Negative | Negative | Negative | Negative | Positive | Positive |
Publisher’s Note: MDPI stays neutral with regard to jurisdictional claims in published maps and institutional affiliations. |
© 2022 by the authors. Licensee MDPI, Basel, Switzerland. This article is an open access article distributed under the terms and conditions of the Creative Commons Attribution (CC BY) license (https://creativecommons.org/licenses/by/4.0/).
Share and Cite
MDPI and ACS Style
Cao, M.; Chen, Y.; Duan, W.; Li, Y.; Qin, J. Comprehensive Evaluation of Water–Energy–Food System Security in the China–Pakistan Economic Corridor. Water 2022, 14, 1900. https://doi.org/10.3390/w14121900
AMA Style
Cao M, Chen Y, Duan W, Li Y, Qin J. Comprehensive Evaluation of Water–Energy–Food System Security in the China–Pakistan Economic Corridor. Water. 2022; 14(12):1900. https://doi.org/10.3390/w14121900
Chicago/Turabian StyleCao, Mengzhu, Yaning Chen, Weili Duan, Yaqi Li, and Jingxiu Qin. 2022. "Comprehensive Evaluation of Water–Energy–Food System Security in the China–Pakistan Economic Corridor" Water 14, no. 12: 1900. https://doi.org/10.3390/w14121900
Note that from the first issue of 2016, this journal uses article numbers instead of page numbers. See further details here.