
Seasonal Variation and Spatial Heterogeneity of Water Quality Parameters in Lake Chenghai in Southwestern China


Institute for Ecological Research and Pollution Control of Plateau Lakes, School of Ecology and Environmental Science, Yunnan University, Kunming 650500, China
*
Authors to whom correspondence should be addressed.
Water 2022, 14(10), 1640; https://doi.org/10.3390/w14101640
Submission received: 14 March 2022
/
Revised: 27 April 2022
/
Accepted: 27 April 2022
/
Published: 20 May 2022
(This article belongs to the Special Issue Plateau Lake Water Quality and Eutrophication: Status and Challenges)
Abstract
:Seasonal dynamics and the vertical stratification of multiple parameters, including water temperature (WT), dissolved oxygen (DO), pH, and chlorophyll-a (Chl-a), were analyzed in Lake Chenghai, Northern Yunnan, based on monitoring data collected in 2015 (October), 2016 (March, May, July), 2017 (March, June, October), 2018 (August), and 2020 (June, November). The results indicate that the lake water was well mixed in winter and spring when the water quality was stable. However, when WT becomes stratified in summer and autumn, the Chl-a content and pH value changed substantially, along with the vertical movement of the thermocline. With rising temperature, the position of the stratified DO layer became higher than the thermocline, leading to a thickening of the water body with a low DO content. This process induced the release of nutrients from lake sediments and promoted eutrophication and cyanobacteria bloom. The thermal stratification structure had some influence on changes in DO, pH, and Chl-a, resulting in the obvious stratification of DO and pH. In summer, with an increase in temperature, thermal stratification was significant. DO and pH achieved peak values in the thermocline, and exhibited a decreasing trend from this peak, both upward and downward. The thermocline was anoxic and the pH value was low. Although Chl-a maintained a low level below the thermocline and was not high, there was a sudden increase in the surface layer, which should be urgently monitored to prevent large-scale algae reproduction and even local outbreaks in Lake Chenghai. Moreover, Lake Chenghai is deeper in the north and shallower in the south: this fact, together with the stronger wind–wave disturbance in the south, results in surface WT in the south being lower than that in the north year-round. This situation results in a gradual diminution of aquatic plants from north to south. Water quality in the lake’s southern extent is better than that in the north, exhibiting obvious spatial heterogeneity. It is recommended that lake water quality monitoring should be strengthened to more fully understand lake water quality and take steps to prevent further deterioration.
1. Introduction
Eutrophication has been a major problem affecting water resources and the environment around the world, which has profound effects on water quality and safety, as well as aquatic ecosystem health [1]. In the context of global change, the study of the mechanism of the effect of increasing temperature and eutrophication on the thermal stratification of lakes and reservoirs, as well as its ecological and environmental effects, has become one of the most prevalent issues of current international research [2,3]. Lake thermal stratification and thermal cycling are important factors governing various physicochemical processes (such as dissolved oxygen (DO) distribution, nutrient exchange, microbial activity, nutrient release from the bottom sediment, etc.) and dynamical phenomena (such as upper and lower water mixing and convection in lakes), which are important indicators affecting the biological production and ecosystem evolution of lakes [4,5]. For deep-water lakes (including reservoirs), with extreme and persistent temperature differences, the vertical distribution and variation patterns of water temperature determine the vertical stratification and mixing exchange of chemical factors as well as biological factors (phytoplankton, animals, etc.), which in turn profoundly affect the lake ecosystem [6,7]. Therefore, a deep understanding of the significance of deep-water lake hydrochemical parameters requires an in-depth study of the seasonal thermal stratification of lakes [8]. Meanwhile, the vertical variation of lake thermal stratification affects the vertical distribution of water chemistry parameters, such as lake water temperature (WT), DO, chlorophyll-a (Chl-a), pH, and electrical conductivity (EC), and this seasonal stratification of water chemistry parameters caused by water temperature changes is a typical feature of deep-water lakes. Therefore, an in-depth study of the thermodynamic stratification of lakes can help to improve the understanding of physical, chemical, and bioecological processes in lakes, and thus help to improve the health of lake ecosystems.
Over the last few decades, the hydrological conditions of many lakes have changed to the extent that the lakes have fundamentally altered in appearance [9] or in their stratification patterns. However, the effects of climate change on stratification phenology remain largely unexplored on a global scale [10]. Some scholars have conducted in-depth systematic studies of the seasonal stratification and hydrochemical characteristics of many natural deep-water and shallow-water lakes and large artificial reservoirs, such as Lakes Taihu, Tianmu, Fuxian, Wanfeng, Qiandao, Lugu, and Hongfeng [11,12]. Studies have shown that WT, DO, Chl-a, pH, EC, the cell densities of cyanobacteria, turbidity, and other parameters are prone to vertical seasonal stratification in summer, especially in deep-water lakes and reservoirs [13,14]; the vertical variation of lake thermal stratification affects the top-to-bottom distribution of DO, pH, Chl-a, and other hydrochemical parameters, and the seasonal stratification of hydrochemical parameters caused by variation in WT is a feature typical of deep-water lakes [15,16,17]. Stratification occurs quickly, causing hypoxia in the uniform temperature layer of water bodies, and algae grows and reproduces rapidly in the temperature change layer, disrupting balanced aquatic ecosystems and worsening the water quality. However, studies of the seasonal thermal stratification and the hydrochemical parameters of plateau deep-water lakes are few. Therefore, understanding changes in hydrochemical parameters, such as lake temperature, Chl-a and DO concentration, and pH value, is not only of practical significance for lake eutrophication prevention and water quality protection, but also has very important implications for local and even global climate change research.
Lake Chenghai is an important freshwater resource, supporting the productivity and lives of people around the lake. It is rich in animal and plant resources, and more importantly, Lake Chenghai is one of only three natural growth areas of Spirulina cyanobacteria in the world and is famous for producing high-quality S. (Arthrospira) platensis [18,19]. However, with the increasing human populations around the lake and the gradual development of industry and agriculture, the water quality of Lake Chenghai has deteriorated [20]. Especially since the beginning of the artificial cultivation of Spirulina, the eutrophication of the water body has become increasingly serious, and the perennial outbreak of algal blooms has a significant impact on the ecology and environment of the lake [21]. Most of the previous studies analyzed the eutrophication of Lake Chenghai from the perspective of aquatic plants and zooplankton, and the analytical studies of water quality parameters were only based on short-term and small-scale monitoring data, while long-term sentinel monitoring data of water quality parameters were rarely published or reviewed [22,23]. As an important deep-water lake in the southwest monsoon region, we still lack a detailed understanding of Lake Chenghai and lack detailed studies on the seasonal stratification of its temperature and vertical variation of water chemistry parameters. Faced with such a situation, we monitored Lake Chenghai from October 2015 in order to reveal the seasonal stratification characteristics and patterns of Lake Chenghai’s WT, and to further explore the environmental effects brought about by the seasonal vertical stratification of the lake’s WT, providing a scientific basis for the conservation of high-quality freshwater lakes in the plateau.
2. Data and Methods
2.1. Background of Lake Chenghai
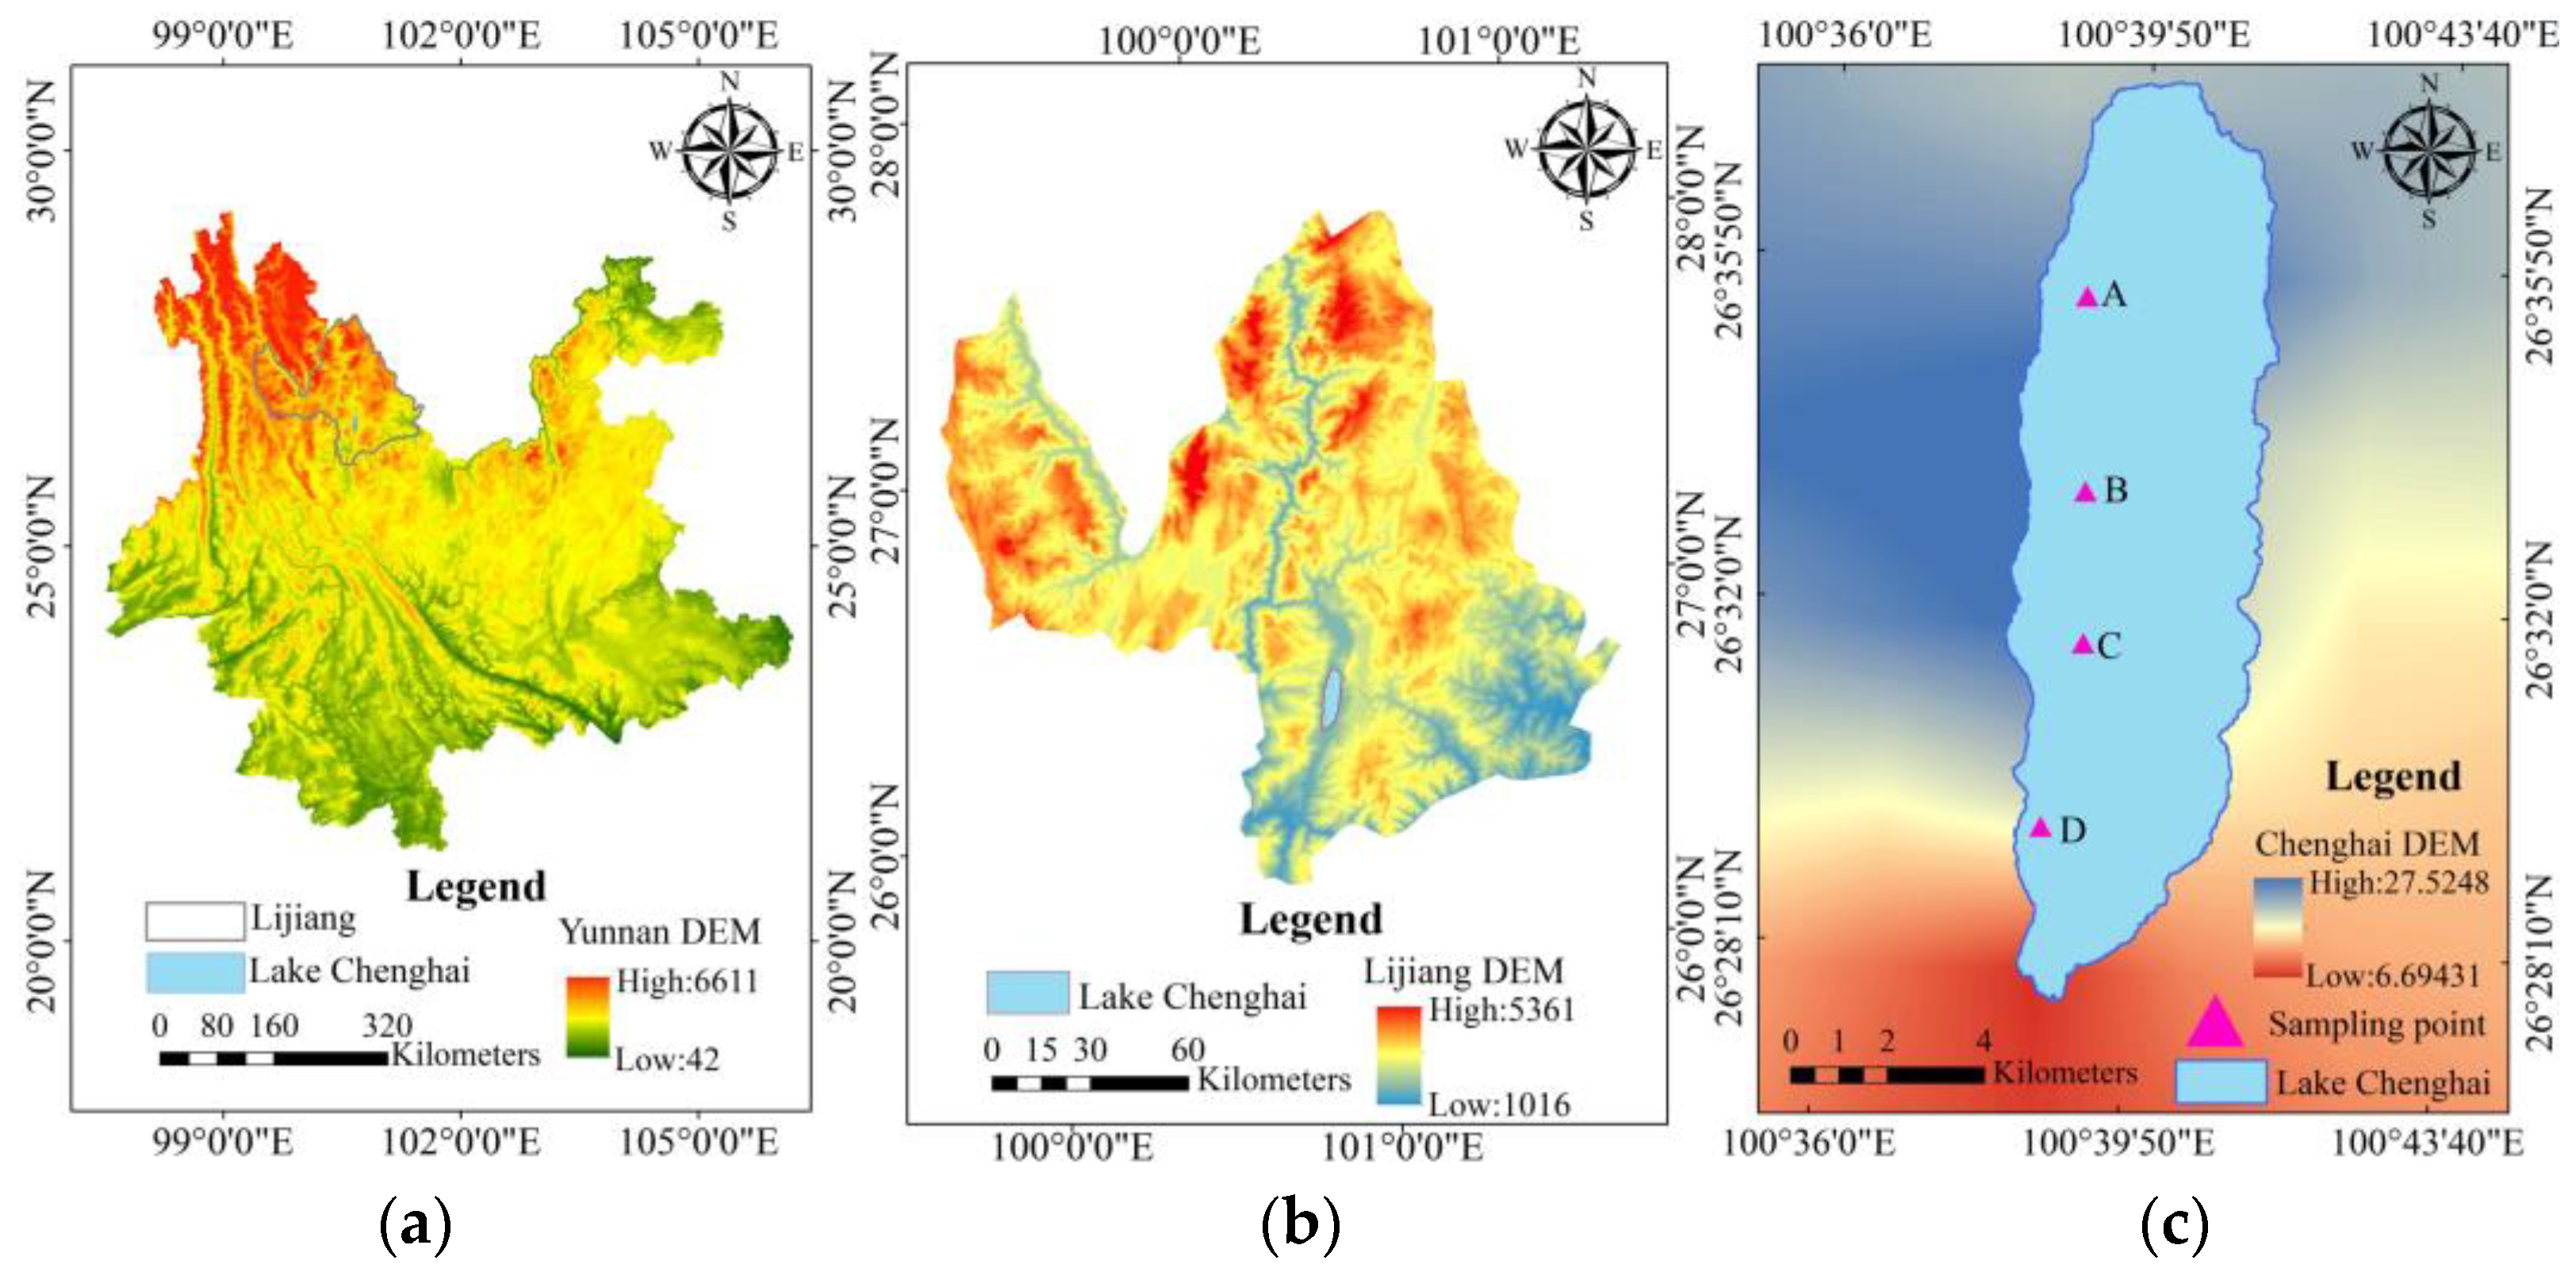
Lake Chenghai is located on the contiguous Qinghai–Tibet and Yunnan–Guizhou Plateaus at 100°33′ to 100°45′ E, 26°25′ to 26°40′ N, and in Yongsheng County, Yunnan Province. Lake Chenghai is located in the Chenghai Fracture Zone, and is a tectonically fractured lake with a small catchment area and no distant river input or outflow [24]. The results of water chemistry analysis of the lake water show that the total ions of the lake water reach 933.2 mg/L [25], and that the lake water is yellowish green; is weakly alkaline; has high hardness; is rich in Ca2+, CO32−, and HCO3− plasma; and can easily form autogenous carbonate mineral precipitation [26]. The soil around the lake is dominated by red loam and red-brown loam, and the basin has a wide variety of bedrock, including basalt, sandstone, dolomitic limestone, and shale [27,28]. The lake lies at an elevation of 1502 m a.s.l., its watershed area is 318.3 km2, and the lake area itself is 75.97 km2. Oval Lake Chenghai is oriented roughly north–south with a long axis measuring 19.15 km, a maximum east–west width of 5.21 km, and a maximum water depth of 35.87 m, with an average of 24.98 m. Lake Chenghai is one of the typical plateau deep-water lakes and has a water capacity of 1.98 million m3. The lake was formed in the middle Quaternary period (ca. 1.2 Ma) in a fault graben formed by the Himalayan orogeny [29]. The drainage area has a subtropical climate, with an average temperature of 18.7 °C and without frost throughout the year. Lake Chenghai is an inland closed plateau deep-water lake, where surface evaporation is approximately three times greater than watershed precipitation [30]. Lake Chenghai used to be an outflow lake; the water flows 30 km southward into the Jinsha River through the Cheng River, but it is a closed lake at present and mainly recharged by groundwater and precipitation. Due to its location in the dry and hot valley of the Jinsha River, the evaporation is approximately three times greater than the precipitation in the basin, resulting in a continuous decline in the water level.
Lake Chenghai is the fourth largest among nine plateau lakes in Yunnan, one of the only alkaline lakes in the world, and one of only three lakes in which Spirulina can grow naturally [31,32]. The water level of Lake Chenghai has dropped by 3.97 m in the last decade due to high evaporation in the basin and agricultural water use surrounding the lake. Human activities have long aimed to obtain economic benefits and have often overlooked the fragility of lacustrine ecosystems. In recent years, due to the continuous demographic and economic development of the Lake Chenghai watershed, rapid population growth, and water pollution, eutrophication has become increasingly serious. In addition to the “point source”, i.e., pollution from Spirulina farming wastewater, the most important source of contamination is domestic sewage from villages, agricultural non-point sources, and soil erosion [33]. At present, the environmental health of Lake Chenghai is rated as Class IV, its water quality is mesotrophic, and it faces the threat of eutrophication.
2.2. Sampling
Controlled by the tectonic background, the water depth of Lake Chenghai is characterized by a north–south oriented feature, and is deeper on the western side than the eastern side. Therefore, in this study, four sampling points were set up along the deep-water axis of the lake from north to south, marked as A (100°39′07″ E~26°35′26″ N), B (100°38′41″ E~26°33′23″ N), C (100°38′37″ E~26°31′33″ N), and D (100°38′45″ E~26°29′30″ N) (Figure 1). On-site monitoring was carried out in 2015 (October), 2016 (March, May, July), 2017 (March, June, October), 2018 (August), and 2020 (June, November). Sampling locations were established by means of a satellite-based global positioning system (GPS) and water quality parameters (including WT, DO, and Chl-a concentration; pH value; and phycocyanin concentration; among others) were measured with a Xylem Analytics YSI-6600 multi-parameter sonde. One vertical line was established at each site to monitor water quality at different depths. Data were first collected between 0.1 and 1 m below the water surface and the last data were monitored 0.5 m above the lake bottom, with additional data collected at one-meter intervals. To ensure accuracy, each depth was measured six times.
2.3. Analysizing Methods
2.3.1. Comprehensive Nutrition State Index
According to lake and reservoir eutrophication evaluation methods and grading technical regulations, total phosphorus (TP), permanganate index (CODMn), DO, Chl-a, and transparency are the main indicators of nutrient levels in water [34]. To systematically understand water quality and the eutrophication level of Lake Chenghai, the comprehensive nutrition state index was used to evaluate lake eutrophication levels under various scenarios. The comprehensive nutrition state index (TLI) is given as:
where TLI (∑) is the integrated trophic level index, TLI(j) is the trophic level index of j, and Wj is the correlative weighted score for the trophic level index of j.
where Wj is the correlative weighted score for the trophic level index of j and rij is a relative coefficient.
In Chinese lakes and reservoirs, the correlation coefficient for Chl-a to other parameters is presented in Table 1 [35]:
The computational formula for each eutrophication index is:
A series of 0~100 continuous values were adopted for grading the eutrophication level: trophic level index TLI (∑) < 30, oligotrophic; 30 ≤ TLI (∑) ≤ 50, mesotrophic; TLI (∑) > 50, eutrophic; 50 < TLI (∑) ≤ 60, weak eutrophic; 60 < TLI (∑) ≤ 70, middle eutrophic; and TLI (∑) > 70 hypo-eutrophic.
2.3.2. Lake Quality Level
2.3.3. Correlation Analysis Method
Pearson’s correlation coefficient is a metric used to describe relationships among variables. This method uses the covariance matrix of data to evaluate the strength of the relationship between two vectors. Normally, the Pearson’s correlation coefficient between two variables, βi and βj, can be calculated as shown in Equation, where cov(βi, βj) is the covariance, var(βi) is the variance of βi, and var(βj) is the variance of βj [37].
3. Results and Discussion
3.1. Vertical Stratification and Seasonal Temperature Fluctuations
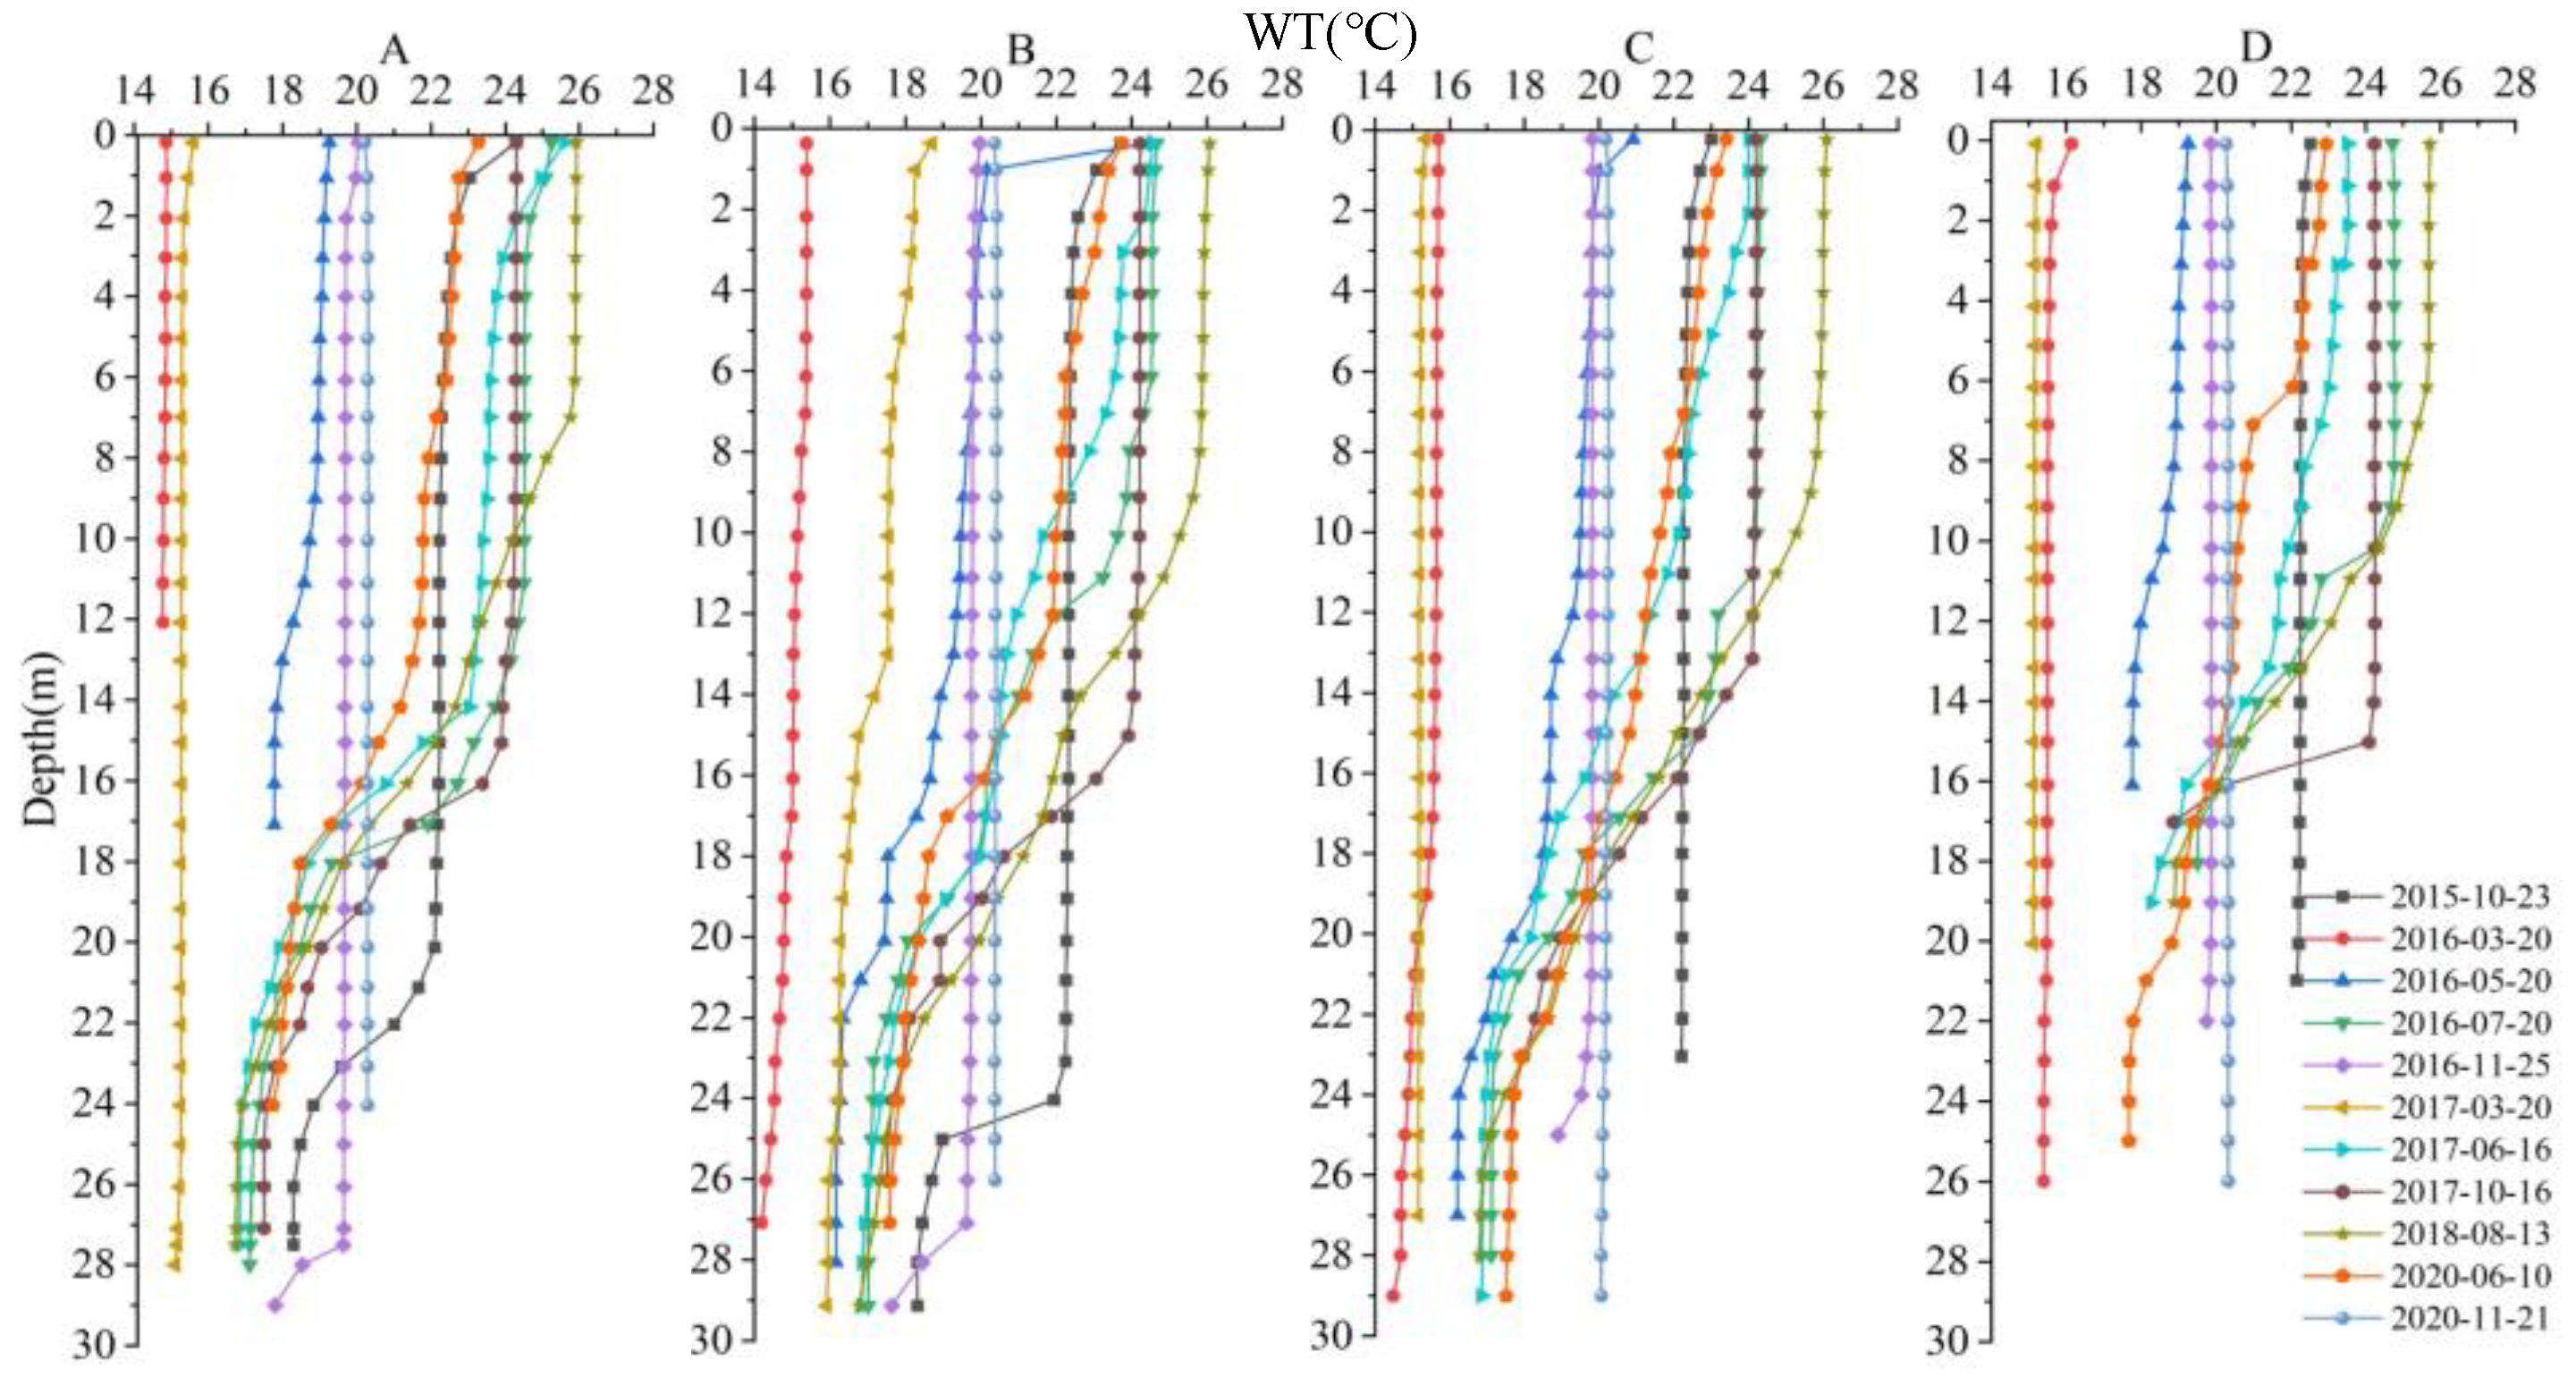
In large deep-water lakes, WT changes vertically due to inconsistent warming and cooling of the upper and lower water bodies. The vertical distribution of WT in March, May, July, and October at each sampling locus in Lake Chenghai clearly shows that seasonal variation of WT in the lake is excellent, and the vertical temperature gradient of the water body is obvious in May, July, and October. The depth of the thermocline gradually changes over time (Figure 2). With the increase in solar radiation and air temperature, the surface water body rapidly warmed up, the temperature difference with the deep-water body gradually increased, and the water body appeared as a stratification phenomenon. According to the standard definition, a thermocline is a water layer whose temperature gradient is more than 0.2 °C/m [38]. The air temperature of Lake Lugu reaches the highest in May, which makes the external heat continuously transfer downward from the surface layer, the maximum temperature difference decreases, the depth of the temperature leap layer moves up, and the temperature stratification phenomenon is obvious. The WT of Lake Chenghai reaches its highest in summer and autumn, which leads to the continuous transfer of external heat from the surface layer to the deeper layer, a decrease in the maximum temperature difference, and an increase in the depth of the thermocline, showing a clear temperature stratification. Changes in temperature always lead to the thermal stratification of lakes, during which period the WT decreases slowly in the epilimnion and hypolimnion and sharply in the thermocline with increasing depth [39,40].
The overall temperature of the lake in October 2015 was relatively high, with the temperature in the south higher than that in the north. Vertically, there was an obvious thermocline of 20 to 26 m depth at Locus A, with a concomitant temperature increase of around 4 °C. At Locus B, there was a clear thermocline 23 to 27 m in depth and a temperature rise again of 4 °C. There was no obvious thermocline at Locus C and D, where the water is shallow. The WT in March 2016, the lowest monitored, was higher in the north than in the south, which may be related to the larger thermocline in the deeper lake area. There was no apparent stratification at the four sampling loci from north to south, and the temperature only slowly fell with increasing depth. In May 2016, the lake WT was evenly distributed horizontally, and the WT in the north and south was relatively consistent. Vertically, temperature increases were recorded at all four monitoring points. In the north, in the deep-water area, a 3 °C temperature jump appeared at Locus A between 21 and 24 m. In the deep-water area, a 2.4 °C temperature increase appeared at Locus B between 16 and 24 m in depth. The thickness of this layer reached 8 m. In the south, a layer of increased temperature measuring 2.4 °C appeared at Locus C at 17 to 24 m depth. At Locus D, between 8 and 14 m depth, a modest 1.2 °C temperature increase was recorded. The average temperature of the lake water in July 2016 was the highest at all four monitoring locations, especially in the upper water layer, with a maximum value of 25.5 °C. Horizontally, surface WT in the north was higher than that in the south, while vertically all four loci showed obvious temperature increases. Between 13 and 22 m depth, a temperature increase layer of 6.8 °C formed at Locus A, while below 22 m, the temperature decreased slowly. A thermocline appeared at 7 to 23 m depth at Locus B, reflected by a temperature increase of 7.1 °C. Below 23 m, the temperature decreased slowly. At Locus C, the temperature barely changed in the 0 to 11 m depth range, and small temperature changes were recorded between 11 and 15 m, with a clear thermocline apparent at 15 to 23 m. At 5.5 °C, the temperature below 23 m decreased slowly with increasing depth, and the temperature at Locus D hardly changed in the top 10 m of the water column. Below 10 m to the bottom of the lake (ca. 18 m), the temperature dropped sharply.
The WT decreased between 0 and 5 m by 0.4 °C at Locus A in March 2017. The trend of change was smoother between 5 and 20 m, with WT remaining at around 15.3 °C, and an intensified decreasing trend from 25 to 30 m. In June 2020, Locus A exhibited a temperature increase between 0 and 15 m, with a temperature increase of 2.1 °C. Below 15 m, the temperature dropped sharply by 3.4 °C. At Locus B, the WT increased with depth as the temperature decreased by 0.89 °C between 0 and 5 m. From 5 to 10 m, the change trend was smooth, and from 10 to 30 m, the temperature decreased by 1.69 °C. In June, Locus A yielded a WT of 25.59 °C, the highest in 2017. From 0 to 15 m, WT remained stable, near 24 °C, but WT decreased sharply to 16.8 °C with increasing depth between 15 and 30 m, a decline of 8.79 °C. In October 2017, Locus B exhibited a thermocline from 7 to 23 m depth, reflecting a temperature increase of 5.96 °C, while WT decreased slowly below 23 m. The October temperature trend at Locus A, as with June, showed a significant thermocline between 14 and 25 m depth with a temperature jump of 6.4 °C, while the WT between 0 and 30 m dropped slowly by 6.8 °C. In 2020, the temperature at Locus A tended to be stable from 0 to 7 m in June, and decreased by 4.06 °C below 10 m. The WT at Locus B was nearly constant from 0 to 11 m depth, and there was a significant thermocline indicated by an increased temperature of 6.4 °C between 15 and 27 m.
From the change trend of Lake Chenghai’s WT (Figure 2), it can be seen that the seasonal stratification feature of Lake Chenghai’s WT is obvious. The stratification of water bodies is characterized by mixing in winter and stratification in summer and autumn, and the lake belongs to a single mixed type of lake. With the rapid decline in temperature in winter, the temperature of the upper water layer decreases, the upper and lower water layers are mixed, and the stratification phenomenon disappears; the temperature difference between surface water and bottom water is small, forming a more uniform water temperature. Lake Chenghai enters the mixing period in winter, and the water temperature gradient changes minimally, especially in the range of water depth below 10 m. In Lake Chenghai, in the summer, after the temperature rose rapidly with the enhancement of the surface layer temperature, it began to gradually increase; the surface layer and the bottom of the water temperature gap began to increase, the lower layer of water temperature change was minimal, and the water body gradually demonstrated a water temperature stratification phenomenon. After October, the surface layer temperature difference gradually became smaller, and the variable temperature layer became thicker, which is due to the fall as the temperature decreases; the reservoir surface temperature gradually decreased, the higher temperature of the bottom layer of water received the cooling of the upper layer of water, and the temperature stratification gradually weakened.
3.2. Seasonal Variation Characteristics of the Water Quality Profile
3.2.1. Dissolved Oxygen (DO)
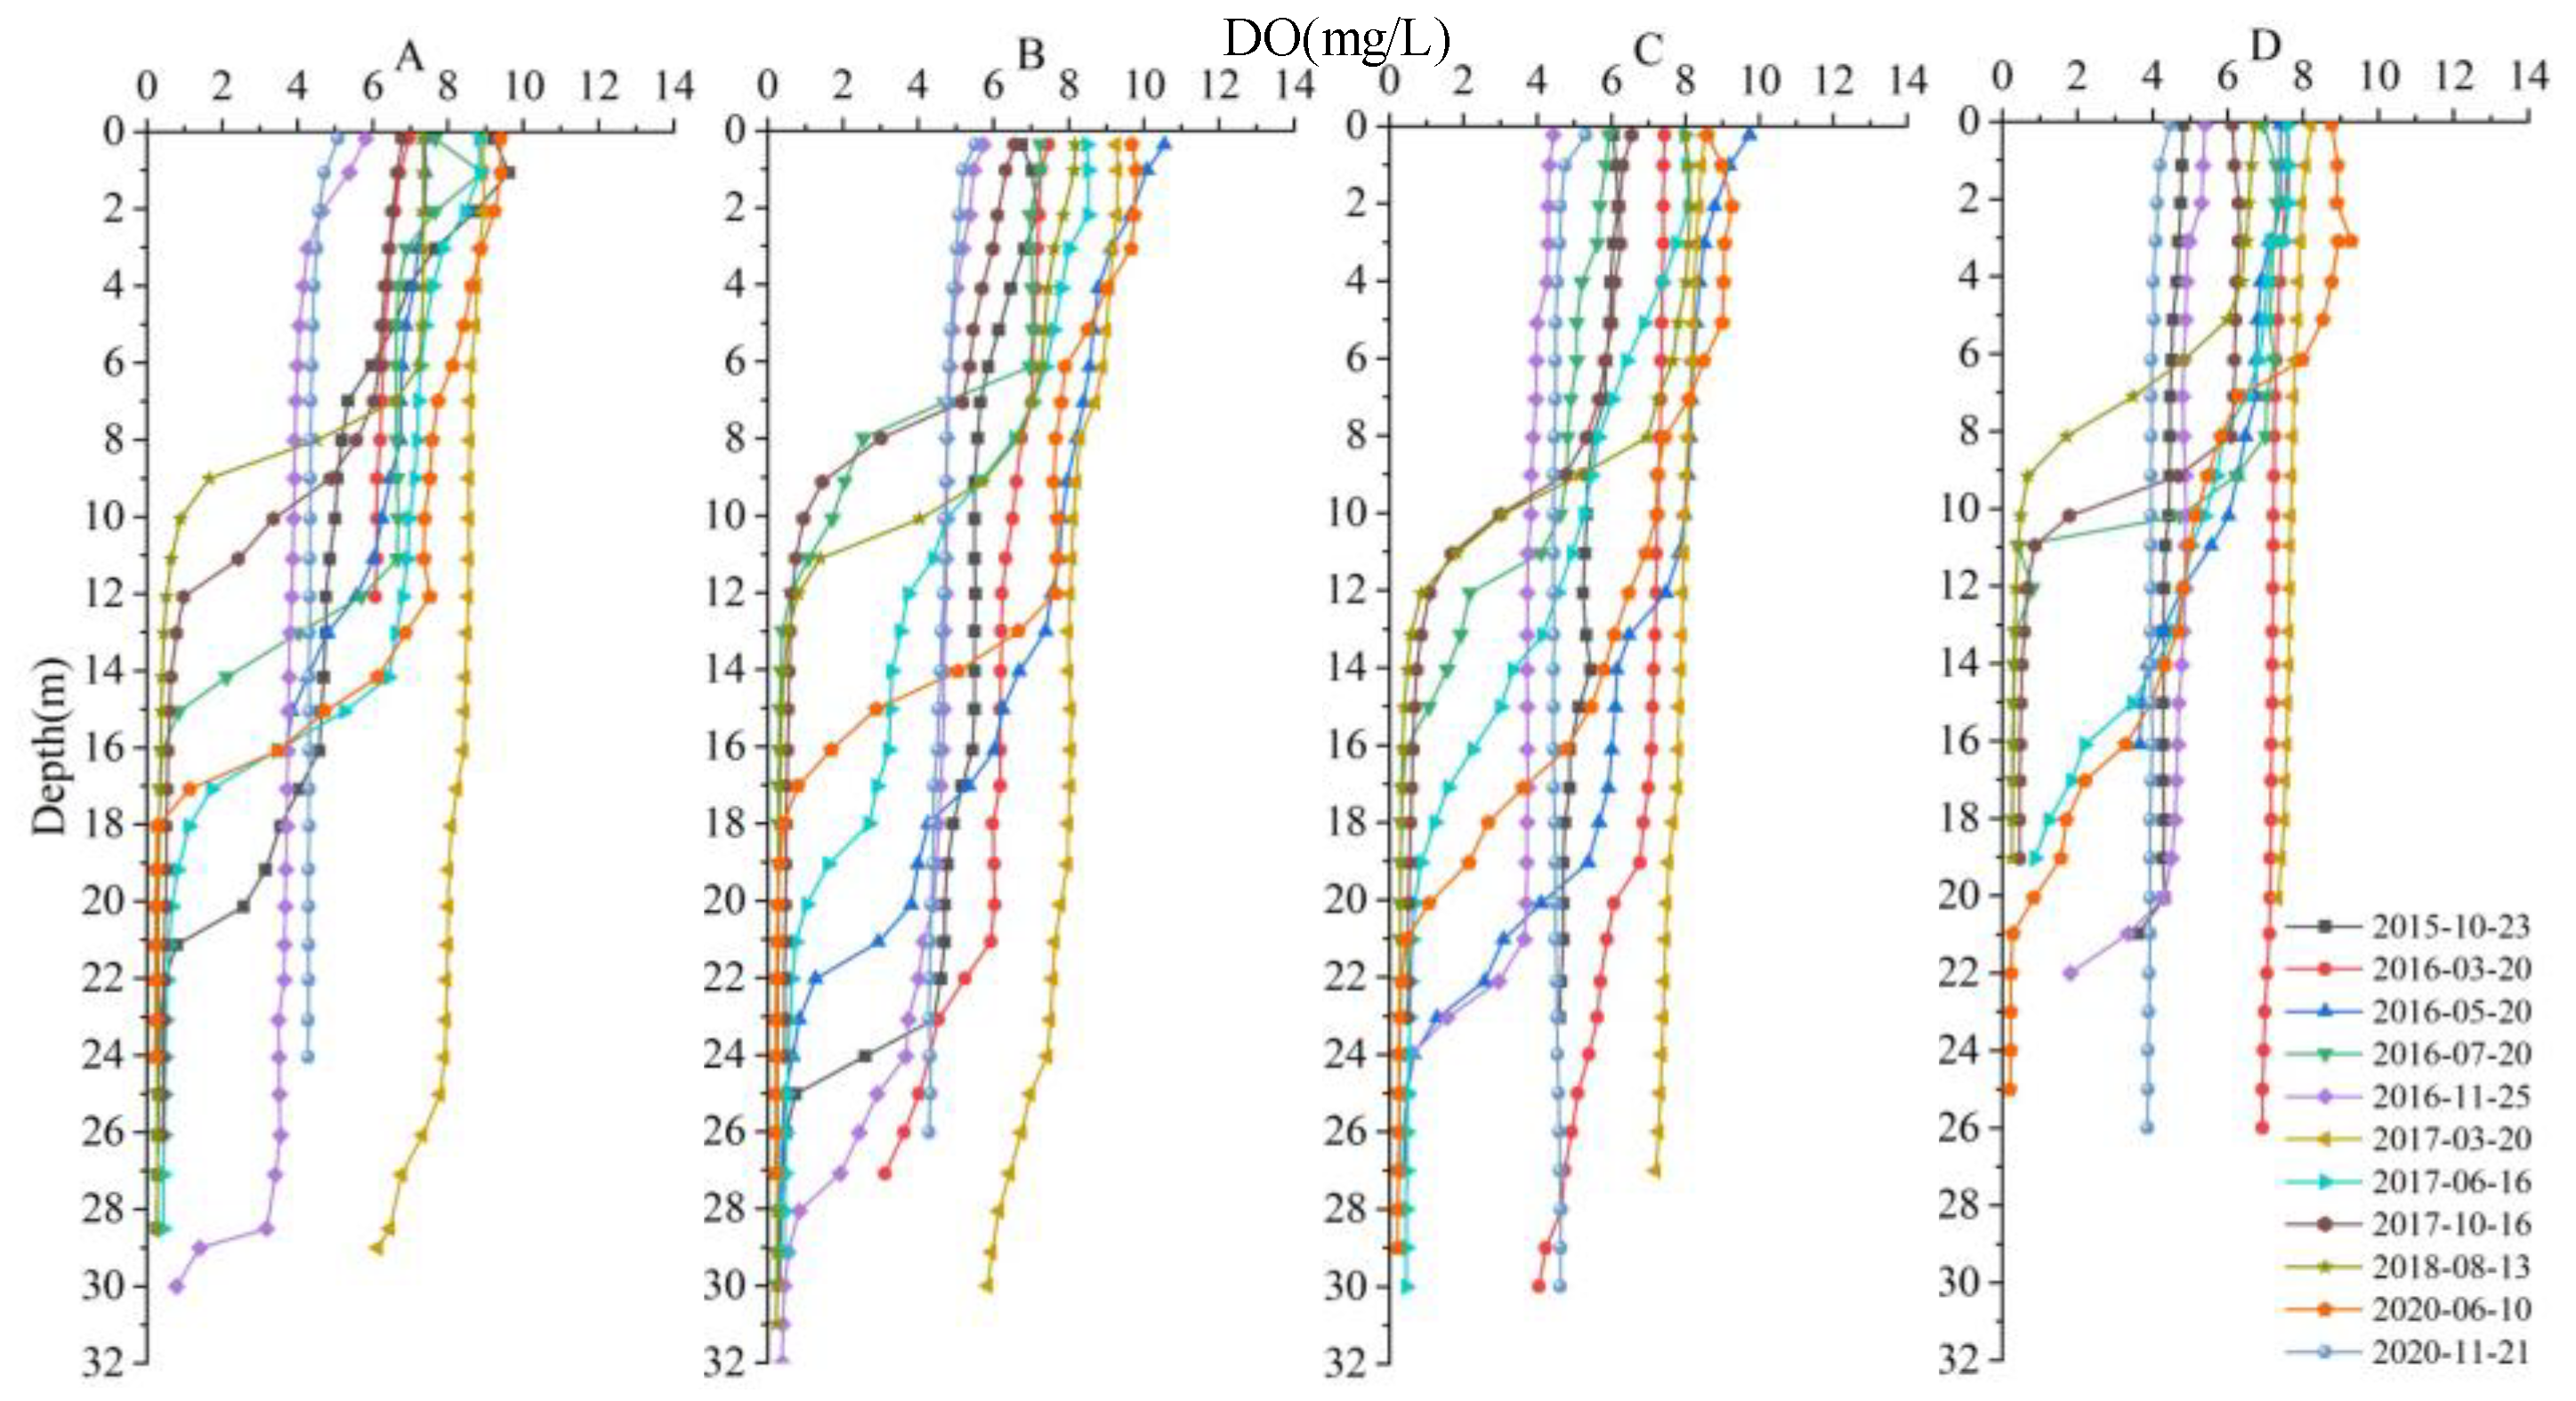
DO is a proxy of primary productivity and hydrodynamic conditions in lacustrine environments, and it is inversely proportional to salinity and temperature but positively proportional to the intensity of lake wave action; additionally, the level of DO is related to the photosynthesis of algae [41,42,43]. Seasonal variations in DO in Lake Chenghai are obvious, exhibiting distinct characteristics in different months (Figure 3). Our monitoring data show that the DO content of Lake Chenghai was not high in October 2015. The DO content at Locus A, the deep area in the north, increased slightly and then decreased at a depth of 0 to 7 m, with a maximum of 9.6 mg/L at a depth of 1 m. The DO content decreased slowly from 7 to 16 m, maintained a value of 5.3 to 4.6 mg/L, and then decreased rapidly from 16 to 21 m and finally maintained a concentration of approximately 0.3 mg/L. At Locus B, DO decreased between 0 and 7 m, and then remained stable at 5 mg/L to a depth of 22 m. Between 22 and 25 m, the DO content dropped sharply. The DO content at Locus C and D in the southern lake area decreased slowly with increased depth, but no sharp changes were observed. Horizontally, the DO content in the north was much higher than the south. The average DO content at 0 to 12 m depth was 6.5 mg/L at Locus A, 6.1 mg/L at Locus B, 5.7 mg/L at Locus C, and 4.5 mg/L at Locus D, showing a general decreasing trend from north to south.
The amount of DO in Lake Chenghai in March 2016 was relatively high, with the amount at Locus A decreasing slowly as the depth increased. A maximum of 7.58 mg/L was recorded at the surface, and a minimum value of 6.92 mg/L at the bottom. At Locus B, DO also decreased slowly from 0 to 19 m, and rapidly below 19 m in depth. The maximum DO content was recorded on the surface (7.43 mg/L), and the minimum at the bottom (4.23 mg/L). The DO content between 0 and 20 m at Locus C decreased slowly and then increased sharply. A maximum value was recorded at the surface (7.47 mg/L) and a minimum value at the bottom (3.12 mg/L). Due to the shallow depth at Locus D, the amount of DO slowly decreased with increased depth. The maximum value (6.96 mg/L) occurred in the surface layer, and the minimum value (6.07 mg/L) was recorded in the lower layer. Horizontally, the DO content in the north was much higher than in the south. The average DO content at a depth of 0 to 12 m was 7.3 mg/L at Locus A, 7.3 mg/L at Locus B, 6.9 mg/L at Locus C, and 6.3 mg/L at Locus D.
The highest DO content in Lake Chenghai was observed in May 2016, and the DO content of the upper water column was higher than that of the lower water column at Locus A. The DO content first increased and then decreased from 0 to 6 m in water depth, reaching a maximum of 9.71 mg/L at a depth of 2 m. The DO content decreased slowly from 6 to 19 m, and then decreased sharply at 19 m to 0.3 mg/L. The DO content at Locus B decreased rapidly between 0 and 4 m, and maintained a stable state from 7 to 13 m. Below 13 m, the DO content decreased continuously, forming a stable hypoxic environment below 22 m. At Locus C, the DO content decreased gradually with increasing water depth from 0 to 11 m, and increased sharply between 11 and 14 m. The DO content remained stable from 14 to 19 m, and decreased sharply below 19 m, creating a stable hypoxic environment below 27 m. The amount of DO between 0 and 10 m depth at Locus D decreased steadily as the water depth increased, and the amount of DO at depths greater than 10 m decreased sharply. The DO content in the north was much higher than that in the south. The average DO content between 0 and 12 m was 8.8 mg/L at Locus A, 8.7 mg/L at Locus B, 8.4 mg/L at Locus C, and 6.9 mg/L at Locus D. The DO content of Lake Chenghai in July 2016 was low, but higher between 0 and 3 m at Locus A and almost unchanged between 3 and 11 m water depth. The DO content decreased sharply from 11 to 16 m and remained below 0.3 mg/L at a depth of 16 m. The DO content in the depth range of 0 to 6 m at Locus B was basically maintained above 7 mg/L, and the DO content in the depth range of 6 to 11 m decreased sharply and stabilized below 0.3 mg/L below 11 m. The DO content in the depth range of 0 to 11 m at Locus C decreased slowly with increasing water depth and stabilized below 0.3 mg/L below 17 m. The DO content in the depth range of 0 to 9 m at Locus D in the southern shallow lake area was basically stable at approximately 7 mg/L, and then decreased sharply from 9 to 12 m. However, the DO content below 12 m slowly decreased as the water depth increased. The DO content was relatively high at Locus A and D and comparatively low at Locus B and C in the horizontal direction. In winter, the DO and WT in Chenghai water were characterized by uniform mixing at the same time. The reason for this change can be inferred from the fact that, in winter, the DO in Chenghai water is reduced due to the vertical exchange of water bodies, the consumption of DO in water by reducing substances, and the upwelling of anoxic water bodies in the lower layer, which consumes more oxygen than reoxygenation, causing the DO to decrease and reach anoxia in severe cases. In summer and autumn, the DO concentration decreases with the increase in water depth and decreases sharply in the depth range of the thermocline; below the thermocline, the DO is basically constant.
Generally, it can be seen that in the vertical direction, the variation trend of DO is obvious (Figure 3), and the lake shows a generally decreasing trend with the increase in water depth. This might be attributed to the photosynthesis of planktonic algae. When photosynthesizing in the surface layer, O2 is released, which increases the oxygen content in the water body; when respiration occurs in the bottom layer, O2 is consumed in the water body, which results in decreased oxygen content in the water body. The DO in the rainy season is always higher than that in the dry season, which might be due to the increase in algae activity when the WT increases. On the other hand, with the increase in precipitation in the rainy season, the enhanced hydrodynamics and lake wave action cause the DO content in the surface water column to increase rapidly, and at the same time, along with the water level rising, the respiration of bottom plants increases, and so does the oxygen consumption.
3.2.2. pH Value
The pH of water bodies is one of the most important indicators of chemical and biological changes in lake systems and is a major influence on inland water bodies and associated ecosystems [44]. Our monitoring data indicate that the lake experiences obvious seasonal changes (Figure 4). There is a general lacustrine phenomenon in which, due to the strong photosynthesis of algae in surface water and the high consumption of CO2, the pH values are high. On the other hand, the photosynthesis of bottom-dwelling algae is weak. High algal die-off causes CO2 to accumulate in large quantities. In addition, the decomposition of organic matter produces aids, which reduce the pH values [45,46].
In October 2015, the pH of Lake Chenghai was relatively high, with significant vertical reductions near the thermocline at Locus A and B in the northern deep-water region, and a jump gradient of approximately 0.4. Locus C and D, located in the southern lake with shallow depth, exhibited small vertical changes, and the pH values of the samples taken in the south were higher those that in the north. The pH value of lake water in March was relatively stable and there was almost no detectable change vertically, and the pH values in the northern lake were higher than those in the southern lake. The pH value of the lake water dropped significantly near the thermocline at Locus A and B in May 2016, with a jump gradient of approximately 0.4 and a steady drop at Locus C. The pH decreased sharply at Locus D between 0 and 4 m water depth, which is the shallowest location in the south. The vertical pH values at Locus A dropped sharply from the surface to a depth of 3 m in July 2016, with a jump amplitude of 0.6. The pH value first increased slightly and then decreased slowly between 3 and 17 m water depth, finally becoming stable. The pH values at Locus B decreased slowly with increasing depth between 0 and 14 m, and then stabilized. At Locus C, the pH values decreased slowly with increasing depth from 0 to 17 m, and then increased slowly with growing water depth. The pH values at Locus D decreased slowly between 0 and 11 m water depth. Horizontally, the pH values in the northern lake area were higher than those in the south. In general, the pH change in Chenghai is not a significant change. The changes in pH in the Lake Chenghai water column are mainly related to the photosynthesis of the algae growth process; the surface water algae consume CO2 in water through photosynthesis. The accumulation of CO2 under the thermocline in the stratified water column slightly reduces the pH of the water column, because the light cannot penetrate the thermocline and the CO2 in the lower water column is not consumed by photosynthesis.
From the pH variation curves in Figure 4, it can be seen that the pH varies very little in the vertical direction in Lake Chenghai, and all data measured at the four sites are between 8.18 and 10.65. The overall decreasing trend with increasing water depth may be related to the respiration of planktonic algae. The surface planktonic algae photosynthesize and absorb CO2 from the water, thus increasing the pH value; the bottom algae mainly respire and exhale CO2, thus decreasing the pH value due to the decrease in sunlight transmission.
3.2.3. Chlorophyll-a (Chl-a)
The Ch-a content is an important proxy of phytoplankton biomass in lakes [47]. Our study results show that there are 175 species of algae in Lake Chenghai, and mainly diatoms, green algae, and cyanobacteria dominated quantitatively, with cyanobacteria showing typical eutrophic cyanobacterial characteristics. The spatio-temporal content of Chl-a in Lake Chenghai varied greatly (Figure 5).
Our monitoring results show that the Chl-a content in Lake Chenghai was relatively high in October 2015, exhibiting a top-down increase and then a sharp decrease between 0 and 7 m at Locus A in the northern deep waters of the lake, with a maximum value (15.4 μg/L) observed at 1 m depth. The Chl-a content decreased slowly with depth between 7 and 26 m and showed a slight increase below 26 m, mainly due to algal death and sedimentation. The Chl-a content between 7 and 26 m decreased slowly with depth, and showed a slight increase below 26 m. This may be due to the death and sedimentation of some algae, and a maximum value of 11.4 μg/L was recorded at Locus B between 0 and 6 m. The Chl-a content stabilized at 8 μg/L between 6 and 16 m, decreased again between 16 and 19 m, and stabilized from 19 to 24 m water depth. The Chl-a content at a depth of 29.5 m changed three times at Locus B, indicating that the algal species in this position were relatively abundant and the population size was relatively large. At Locus C, Chl-a first increased at a depth of 0 to 6 m and then decreased sharply, reaching a maximum value of 9.5 μg/L at a depth of 2 to 3 m, and then decreased slowly below 6 m. The Chl-a content gradually increased at Locus D between 0 and 3 m and then slowly decreased below 3 m. The maximum recorded Chl-a value was 5.6 μg/L at 3 m. Horizontally, the Chl-a content gradually decreased from north to south, and the average Chl-a content in the 0 to 12 m depth range was 9.4 μg/L at Locus A, 8.4 μg/L at Locus B, and 7.3 μg/L at Locus C. The average Chl-a content at the 0 to 12 m water depth was 9.4 μg/L at Locus A, 8.4 μg/L at Locus B, 7.3 μg/L at Locus C, and 4.9 μg/L at Locus D.
The Chl-a content in Lake Chenghai was relatively low in March 2016; the surface content of Locus A was low and increased rapidly between 0 and 3 m water depth, after which changes were small. The Chl-a content increased slowly between 3 and 16 m water depth, and decreased from 16 to 26 m, with a maximum value (7 μg/L) recorded at 16 m. The Chl-a content between 0 and 12 m decreased and then increased again with depth, with the lowest value (0.3 μg/L) occurring at a depth of 1 m. The Chl-a content gradually decreased from north to south, with the average Chl-a content between 0 and 12 m at Locus A being 0.3 μg/L. The average content of Chl-a was 5.4 μg/L at Locus A, 4.4 μg/L at Locus B, 3.2 μg/L at Locus C, and 1.8 μg/L at Locus D. The vertical content of Chl-a varied greatly in May 2016, with Chl-a content between 0 and 2 m rising rapidly from 3.1 μg/L to 8.3 μg/L at Locus A, and then remaining constant around 8 μg/L from 2 to 20 m water depth. Below 20 m, the Chl-a content decreased gradually, finally reaching a minimum of 3 μg/L. The Chl-a content from 0 to 4 m at Locus B first decreased and then increased rapidly, finally stabilizing at around 7 μg/L between 4 and 13 m water depth. The Chl-a content from 13 to 24 m water depth continued to decrease, finally achieving a minimum value of 3 μg/L between 24 and 28 m. The Chl-a content between 0 and 4 m decreased and then increased rapidly, finally maintaining a value of approximately 7 μg/L at the depth ranging from 4 to 13 m. The Chl-a content between 13 and 24 m decreased continuously with increasing depth, and then increased slowly from 24 to 28 m, with a minimum value of 2.2 μg/L recorded. At Locus C, the Chl-a content between 0 and 12 m increased continuously downward, with a larger increase between 0 and 4 m. At Locus C, the Chl-a content from 0 to 22 m increased continuously with water depth. From 12 to 22 m, the Chl-a content continued to decrease with water depth, and below 22 m, the Chl-a content was essentially stable at 2.8 μg/L. In the southern part of the lake at Locus D, the Chl-a content increased rapidly with water depth between 0 and 2 m, and then decreased rapidly between 2 and 6 m, and continued to decrease steadily below 6 m. The average content of Chl-a between 0 and 12 m decreased with water depth. The average content of Chl-a at this depth was 7.9 μg/L at Locus A, 6.6 μg/L at Locus B, 5.4 μg/L at Locus C, and 5.3 μg/L at Locus D. The average Chl-a content in the water depth range of 0 to 12 m was 7.9 μg/L at Locus B, 5.4 μg/L at Locus C, and 5.3 μg/L at Locus D.
The largest changes in the Chl-a content were observed in the vertical water column in July 2016. For example, the Chl-a content increased sharply from 9.9 μg/L to 17.4 μg/L from 0 to 2 m water depth at Locus A, and then decreased to 13.7 μg/L between 2 and 4 m water depth. From 4 to 12 m water depth, the Chl-a content decreased slowly. The Chl-a content decreased from 10.2 μg/L to 2.2 μg/L at 12 to 17 m water depth, and remained stable at 1.7 μg/L below 17 m depth. The Chl-a content was the maximum measured at 19.9 μg/L between 0 and 4 m water depth at Locus B, and remained stable at 16 μg/L from 4 to 6 m, while it decreased sharply to 1.9 μg/L between 6 and 15 m. The Chl-a content increased and then decreased between 0 and 5 m at Locus C. From 1 to 3 m water depth, the Chl-a content was maintained at a high level of 17 μg/L. The Chl-a content decreased with depth from 5 to 10 m, and also from 10 to 17 m. However, below 17 m water depth, the Chl-a content decreased sharply from 12.7 μg/L to 2.2 μg/L with increasing depth, and remained at a low level of around 2 μg/L. The Chl-a content of the surface layer at Locus D was 4.1 μg/L, which jumped to 12.5 μg/L at 1 m water depth, and remained at approximately 12 μg/L between 1 and 10 m water depth. However, the Chl-a content increased to 15 μg/L at 15 m depth and decreased sharply from 15 μg/L to 2 μg/L between 10 and 15 m. Horizontally, the Chl-a content was the highest at Locus C in the south, followed by Locus A and B in the north, and the lowest appeared at Locus D, again in the south, exhibiting strong spatial heterogeneity.
From the Chl-a curves in Figure 5, it can be seen that the trend of Lake Chenghai’s Chl-a content is obvious and might be influenced by the wave and WT. The Chl-a content showed a decreasing trend with increasing water depth. The results of correlation analysis revealed that the Chl-a content had a significant positive correlation with WT. Meanwhile, the differences in the Chl-a content in Lake Chenghai water bodies were larger in the dry season and smaller in the rainy season, while the Chl-a content in the rainy season was lower than that in the dry season. This may be attributed to the fact that the concentration of toxins produced by the massive outbreak of Microcystis aeruginosa reached a certain level during the rainy season, which had a lysis effect on other algae. On the other hand, it may be related to the pH changes, as the increased water volume of Lake Chenghai in the rainy season had a dilution effect, which reduced the Chl-a content, and the enhanced hydrodynamics of the lake made the water body more homogeneous.
3.3. Correlation Analysis of Water Quality in Lake Chenghai
From the above discussion, it can be concluded that the spatial and seasonal changes in the water quality are significant in Lake Chenghai. Based upon the correlation analysis of the water quality parameters, including WT, pH, Chl-a, and DO (Table 3), there is a significant positive correlation between various parameters. The correlation coefficient between pH and DO is 0.55, the correlation coefficient between WT and Chl-a is 0.39, and the correlation coefficient between pH and Chl-a is 0.39. This verifies that WT affects the Chl-a content, while WT and Chl-a jointly influence both pH and DO.
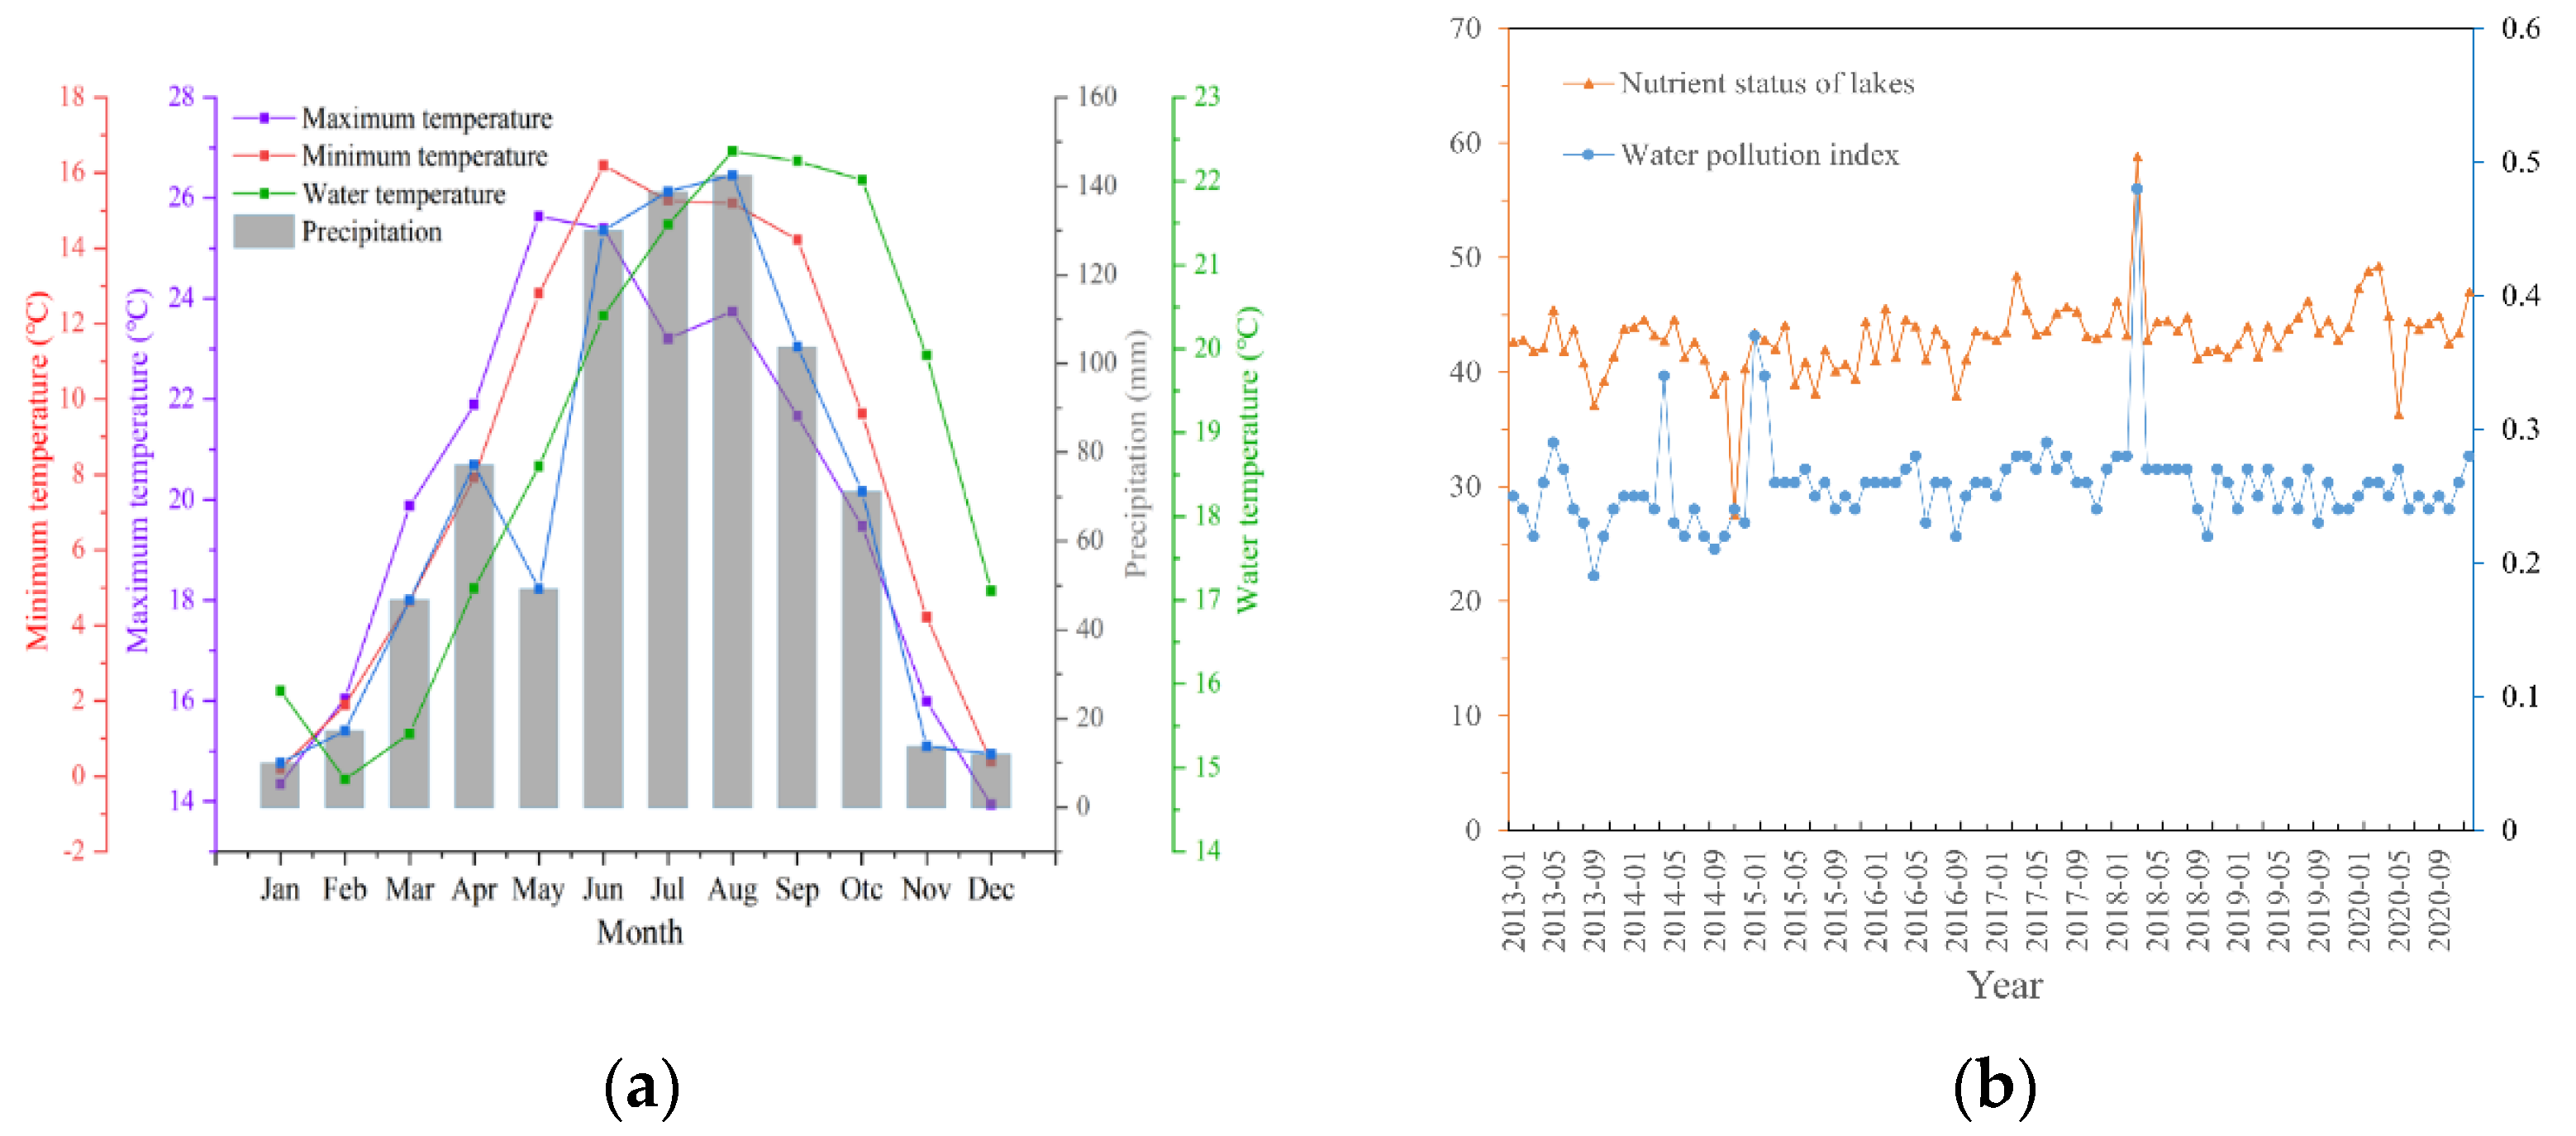
Based on the analysis of monitoring data from Lake Chenghai and meteorological data from Yongsheng County, it can be concluded that the feedback sensitivity of the lake water to the temperature is low, the temperature change in the water body always lags behind the air temperature change, and the precipitation has a strong influence on WT. The average monthly air temperature was 2.3 °C lower in October 2015 than one year later due to the larger number of rainy days in October 2016. Throughout the year, the average temperature of the southern lake area was higher than that of the northern lake area in both summer and autumn; however, during winter and spring, the average WT of the northern lake area was higher than that of the southern. The surface water temperature of the northern lake area was higher than that of the southern area. This is mainly due to the perennial prevalence of a southerly wind in Lake Chenghai. The mixing of shallow lake water in the southern area was uniform and heat exchange was frequent, while the northern deep-water lake area was stable. At Lake Chenghai, during summer and autumn, due to the obvious stratification in the deep-water area in the north, convection exchange between the upper and lower water bodies is hindered, and the distribution of nutrients such as N and P and light in the water body is affected, thus impacting the DO concentration and the vertical distribution of aquatic organisms, which then affects the pH, resulting in changes in water quality. In 2020, the water quality of Lake Chenghai was listed as Class IV, meaning slightly polluted, and this does not meet the requirements of the water environment function [48]. The lake’s nutritional status index was 45.9, and the nutritional status was medium (Figure 6).
The Chl-a content in clear water correlates positively with WT. As WT rises, the amount of phytoplankton increases and multiple peaks occur in different depth ranges, indicating the diversity and complexity of aquatic plant species [49,50]. Differences in pH occur principally because of changes in and ; thus, when the temperature rises in the spring, the pH values increase with the growth of phytoplankton. However, in Lake Chenghai, a different situation occurred. In May and July, the WT was significantly higher than in March, but the pH value was lower than in March, which may be due to the end of multiple algal blooms occurring during this period and the decomposition of algae, such as cyanobacteria of the genus Anabaena.
3.4. Limitations and Implications
Human activities are also one of the main reasons for the large changes in the water quality in Lake Chenghai, which should be given special attention in the future. First, in this study, the seasonal dynamics of WT and its vertical stratification structure were analyzed based on monitoring data, and the seasonal stratification characteristics of the water chemical properties in Lake Chenghai were discussed. However, there was a lack of long-term and high-frequency observations on the thermal stratification transformation and its critical period regarding the hydrodynamic profile, nutrients, and phytoplankton. Second, due to the limited number of monitoring sites, the results possibly cannot represent the situation in the whole lake. With improvements in the monitoring system and methods, this problem may be solved in the near future. Third, the impact of human activities on the water quality of Lake Chenghai in the context of urbanization was not analyzed. In addition to climate change, human activities (population, GDP, impervious area, industrial structure, non-point pollution, etc.) also cause water quality changes in Lake Chenghai. In the context of complex climate change and anthropogenic disturbances in the future, there is still much work to be carried out in order to gain a more comprehensive and in-depth understanding of the thermal stratification characteristics of the water column in Lake Chenghai and other similar lakes in the region, and their ecological and environmental effects (e.g., to reveal their effects on changes in the phytoplankton community structure and even the driving mechanisms of water blooms).
4. Conclusions
The stratification of Lake Chenghai seawater is characterized by mixing in winter and stratification in summer and autumn, with the lake being a single mixed lake. In winter, the lake water of Lake Chenghai is in a state of mixing, and complete water convection exchange causes the bottom water to maintain a high level of DO. Thermal stratification in summer and autumn directly hinders the exchange of substances between the temperature change layer and the stagnant water layer, resulting in the formation of stratified DO levels. The higher the lacustrine WT, the closer stratification of DO is to the water surface. In other words, with a thicker and more anoxic water body, coupled with the long-term effects of reducing substances and microorganisms, such as sulfides, nitrites, and ferrous ions in the sediment, an anaerobic zone is formed near the sediment, leading to the accelerated release of nitrogen and phosphorus from the sediments, deteriorating the bottom water quality. With the seasonal formation and disappearance of the thermal stratification of Lake Chenghai, there will be an impact on the water quality of the lake. Therefore, to protect the ecosystem of Lake Chenghai, water quality monitoring should be conducted in summer and autumn, and a rapid emergency response mechanism should be developed in advance.
In terms of Lake Chenghai, though the lake remains at a mesotrophic level, it will still face the risk of accelerated eutrophication and algal bloom outbreaks. Especially under the influence of complex climate change and human activities in the future, a great deal of work is still needed, and it would be worthwhile to understand the thermal stratification characteristics of Lake Chenghai’s water column and its ecological effects (e.g., to reveal its driving mechanism on the structural changes of the phytoplankton community and even the occurrence of water blooms) in a more comprehensive way. Therefore, in a subsequent study, the monitoring of water quality parameters in Lake Chenghai needs to be continued and supplemented with observations from other seasons and months in order to fully reflect the thermal stratification in the lake in different seasons and months, as well as the spatial differences and potential influencing factors of the stratification parameters. Meanwhile, the seasonal variations in lake thermal stratification (depth, intensity, and thickness), nutrient salinity, sediment phytoplankton biomass, and their influencing factors will be explored.
Author Contributions
H.Z. and P.H.: conceptualization, methodology, software and writing—original draft preparation. F.C.: supervision, writing—review and editing. H.Z.: conceptualization, supervision, resources, writing—review and editing, and foundation’s acquisition. L.D. and Y.Z.: investigation and data curation. All authors have read and agreed to the published version of the manuscript.
Funding
This work was supported by the Special Project for Social Development of Yunnan Province (202103AC100001) and the Yunnan Provincial Government Leading Scientist Program (No. 2015HA024).
Data Availability Statement
The data that support the findings of this study are available from the corresponding author upon reasonable request.
Acknowledgments
We are grateful to the teachers and students who participated in the field collection of data.
Conflicts of Interest
The authors declare no conflict of interest.
References
- Lu, Y.; Wang, R.; Zhang, Y.; Su, H.; Wang, P.; Jenkins, A.; Ferrier, R.C.; Bailey, M.; Squire, G. Ecosystem health towards sustainability. Ecosyst. Health Sustain. 2015, 1, 1–15. [Google Scholar] [CrossRef]
- Paerl, H.W.; Paul, V.J. Climate change: Links to global expansion of harmful cyanobacteria. Water Res. 2012, 46, 1349–1363. [Google Scholar] [CrossRef] [PubMed]
- Bruesewitz, D.A.; Carey, C.C.; Richardson, D.C.; Weathers, K.C. Under-ice thermal stratification dynamics of a large, deep lake revealed by high-frequency data. Limnol. Oceanogr. 2015, 60, 347–359. [Google Scholar] [CrossRef]
- Zhang, Y.; Wu, Z.; Liu, M.; He, J.; Shi, K.; Zhou, Y.; Wang, M.; Liu, X. Dissolved oxygen stratification and response to thermal structure and long-term climate change in a large and deep subtropical reservoir (Lake Qiandaohu, China). Water Res. 2015, 75, 249–258. [Google Scholar] [CrossRef] [PubMed]
- Alexakis, D.; Kagalou, I.; Tsakiris, G. Assessment of pressures and impacts on surface water bodies of the Mediterranean. Case study: Pamvotis Lake, Greece. Environ. Earth Sci. 2013, 70, 687–698. [Google Scholar] [CrossRef]
- Kraemer, B.M.; Anneville, O.; Chandra, S.; Dix, M.; Kuusisto, E.; Livingstone, D.M.; Rimmer, A.; Schladow, S.G.; Silow, E.; Sitoki, L.M.; et al. Morphometry and average temperature affect lake stratification responses to climate change. Geophys. Res. Lett. 2015, 42, 4981–4988. [Google Scholar] [CrossRef] [Green Version]
- Alexakis, D.; Tsihrintzis, V.A.; Tsakiris, G.; Gikas, G.D. Suitability of Water Quality Indices for Application in Lakes in the Mediterranean. Water Resour. Manag. 2016, 30, 1621–1633. [Google Scholar] [CrossRef]
- Butcher, J.B.; Nover, D.; Johnson, T.E.; Clark, C.M. Sensitivity of lake thermal and mixing dynamics to climate change. Clim. Chang. 2015, 129, 295–305. [Google Scholar] [CrossRef] [Green Version]
- Foley, B.; Jones, I.D.; Maberly, S.C.; Rippey, B. Long-term changes in oxygen depletion in a small temperate lake: Effects of climate change and eutrophication. Freshw. Biol. 2012, 57, 278–289. [Google Scholar] [CrossRef]
- Magee, M.R.; Wu, C.H. Response of water temperatures and stratification to changing climate in three lakes with different morphometry. Hydrol. Earth Syst. Sci. 2017, 21, 6253–6274. [Google Scholar] [CrossRef] [Green Version]
- Zou, R.; Zhang, X.; Liu, Y.; Chen, X.; Zhao, L.; Zhu, X.; He, B.; Guo, H. Uncertainty-based analysis on water quality response to water diversions for Lake Chenghai: A multiple-pattern inverse modeling approach. J. Hydrol. 2014, 514, 1–14. [Google Scholar] [CrossRef]
- Liu, X.; Lu, X.; Chen, Y. The effects of temperature and nutrient ratios on Microcystis blooms in Lake Taihu, China: An 11-year investigation. Harmful Algae 2011, 10, 337–343. [Google Scholar] [CrossRef]
- Leach, T.H.; Beisner, B.E.; Carey, C.C.; Pernica, P.; Rose, K.C.; Huot, Y.; Brentrup, J.A.; Domaizon, I.; Grossart, H.-P.; Ibelings, B.W.; et al. Patterns and drivers of deep chlorophyll maxima structure in 100 lakes: The relative importance of light and thermal stratification. Limnol. Oceanogr. 2012, 63, 628–646. [Google Scholar] [CrossRef] [Green Version]
- Zhang, Y.; Wu, Z.; Liu, M.; He, J.; Shi, K.; Wang, M.; Yu, Z. Thermal structure and response to long-term climatic changes in Lake Qiandaohu, a deep subtropical reservoir in China. Limnol. Oceanogr. 2014, 59, 1193–1202. [Google Scholar] [CrossRef]
- Liu, Y.; Wang, Y.; Sheng, H.; Dong, F.; Zou, R.; Zhao, L.; Guo, H.; Zhu, X.; He, B. Quantitative evaluation of lake eutrophication responses under alternative water diversion scenarios: A water quality modeling based statistical analysis approach. Sci. Total Environ. 2014, 468-469, 219–227. [Google Scholar] [CrossRef]
- Zohary, T.; Ostrovsky, I. Ecological impacts of excessive water level fluctuations in stratified freshwater lakes. Inland Waters 2011, 1, 47–59. [Google Scholar] [CrossRef]
- Kirillin, G.; Shatwell, T. Generalized scaling of seasonal thermal stratification in lakes. Earth-Sci. Rev. 2016, 161, 179–190. [Google Scholar] [CrossRef] [Green Version]
- Zhang, L.; Xu, K.; Wang, S.; Wang, S.; Li, Y.; Li, Q.; Meng, Z. Characteristics of dissolved organic nitrogen in overlying water of typical lakes of Yunnan Plateau, China. Ecol. Indic. 2018, 84, 727–737. [Google Scholar] [CrossRef]
- Yang, K.; Yu, Z.; Luo, Y. Analysis on driving factors of lake surface water temperature for major lakes in Yunnan-Guizhou Plateau. Water Res. 2020, 184, 116018. [Google Scholar] [CrossRef]
- Yan, D.; Xu, H.; Yang, M.; Lan, J.; Hou, W.; Wang, F.; Zhang, J.; Zhou, K.; An, Z.; Goldsmith, Y. Responses of cyanobacteria to climate and human activities at Lake Chenghai over the past 100 years. Ecol. Indic. 2019, 104, 755–763. [Google Scholar] [CrossRef]
- Song, Y.; Qi, J.; Deng, L.; Bai, Y.; Liu, H.; Qu, J. Selection of water source for water transfer based on algal growth potential to prevent algal blooms. J. Environ. Sci. 2021, 103, 246–254. [Google Scholar] [CrossRef] [PubMed]
- Yang, K.; Yu, Z.; Luo, Y.; Zhou, X.; Shang, C. Spatial-Temporal Variation of Lake Surface Water Temperature and Its Driving Factors in Yunnan-Guizhou Plateau. Water Resour. Res. 2019, 55, 4688–4703. [Google Scholar] [CrossRef]
- Yu, Y.; Zhang, M.; Qian, S.; Li, D.; Kong, F. Current status and development of water quality of lakes in Yunnan-Guizhou Plateau. J. Lake Sci. 2010, 22, 820–828. [Google Scholar]
- Wan, G.J.; Chen, J.A.; Wu, F.C.; Xu, S.Q.; Bai, Z.G.; Wan, E.Y.; Wang, C.; Huang, R.; Yeager, K.; Santschi, P. Coupling between 210Pbex and organic matter in sediments of a nutrient-enriched lake: An example from Lake Chenghai, China. Chem. Geol. 2005, 224, 223–236. [Google Scholar] [CrossRef]
- Du, L.N.; Jiang, Y.E.; Chen, X.Y.; Yang, J.X.; Aldridge, D. A family-level macroinvertebrate biotic index for ecological assessment of lakes in Yunnan, China. Water Resour. 2017, 44, 864–874. [Google Scholar] [CrossRef]
- Sun, W.; Zhang, E.; Liu, E.; Ji, M.; Chen, R.; Zhao, C.; Shen, J.; Li, Y. Oscillations in the Indian summer monsoon during the Holocene inferred from a stable isotope record from pyrogenic carbon from Lake Chenghai, southwest China. J. Southeast Asian Earth Sci. 2017, 134, 29–36. [Google Scholar] [CrossRef]
- Wu, F.; Xu, L.; Liao, H.; Guo, F.; Zhao, X.; Giesy, J.P. Relationship between mercury and organic carbon in sediment cores from Lakes Qinghai and Chenghai, China. J. Soils Sediments 2013, 13, 1084–1092. [Google Scholar] [CrossRef]
- Zhang, H.; Huo, S.; Yeager, K.M.; Xi, B.; Zhang, J.; He, Z.; Ma, C.; Wu, F. Accumulation of arsenic, mercury and heavy metals in lacustrine sediment in relation to eutrophication: Impacts of sources and climate change. Ecol. Indic. 2018, 93, 771–780. [Google Scholar] [CrossRef]
- Wang, Y.; Peng, J.; Cao, X.; Xu, Y.; Yu, H.; Duan, G.; Qu, J. Isotopic and chemical evidence for nitrate sources and transformation processes in a plateau lake basin in Southwest China. Sci. Total Environ. 2020, 711, 134856. [Google Scholar] [CrossRef]
- Wang, Y.; Tang, Y.; Xu, Y.; Yu, H.; Cao, X.; Duan, G.; Bi, L.; Peng, J. Isotopic dynamics of precipitation and its regional and local drivers in a plateau inland lake basin, Southwest China. Sci. Total Environ. 2021, 763, 143043. [Google Scholar] [CrossRef]
- Yu, H.; Qi, W.; Liu, C.; Yang, L.; Wang, L.; Lv, T.; Peng, J. Different stages of aquatic vegetation succession driven by environmental disturbance in the last 38 years. Water 2019, 11, 1412. [Google Scholar] [CrossRef] [Green Version]
- Liu, W.; Li, S.; Bu, H.; Zhang, Q.; Liu, G. Eutrophication in the Yunnan Plateau lakes: The influence of lake morphology, watershed land use, and socioeconomic factors. Environ. Sci. Pollut. Res. 2012, 19, 858–870. [Google Scholar] [CrossRef] [PubMed]
- Zan, F.; Huo, S.; Xi, B.; Zhang, J.; Liao, H.; Wang, Y.; Yeager, K.M. A 60-year sedimentary record of natural and anthropogenic impacts on Lake Chenghai, China. J. Environ. Sci. 2012, 24, 602–609. [Google Scholar] [CrossRef]
- China Environmental Status Bulletin. 2002. Available online: http://www.mee.gov.cn/ (accessed on 3 May 2003).
- China National Environmental Monitoring Centre. Lake (Reservoir) Eutrophication Evaluation Method and Classification Technical Provisions, 2001; China National Environmental Monitoring Centre: Beijing, China, 2002. [Google Scholar]
- State Environmental Protection Administration (SEPA). GB3838-2002. Environmental Quality Standard for Surface Water; Standards Press: Beijing, China, 2002; pp. 1–8. (In Chinese)
- Podobnik, B.; Stanley, H.E. Detrended cross-correlation analysis: A new method for analyzing two non-stationary time series. Phys. Rev. Lett. 2008, 100, 084102. [Google Scholar] [CrossRef] [PubMed] [Green Version]
- Lei, H.; Junbo, W.; Liping, Z.; Jianting, J.; Yong, W.; Qingfeng, M. Water temperature and characteristics of thermal stratification in Nam Co, Tibet. J. Lake Sci. 2015, 27, 711–718. [Google Scholar] [CrossRef] [Green Version]
- Noori, R.; Ansari, E.; Bhattarai, R.; Tang, Q.; Aradpour, S.; Maghrebi, M.; Haghighi, A.T.; Bengtsson, L.; Kløve, B. Complex dynamics of water quality mixing in a warm mono-mictic reservoir. Sci. Total Environ. 2021, 777, 146097. [Google Scholar] [CrossRef]
- Li, Y.; Tian, L.; Bowen, G.J.; Wu, Q.; Luo, W.; Chen, Y.; Wang, D.; Shao, L.; Cai, Z.; Tao, J. Deep lake water balance by dual water isotopes in Yungui Plateau, southwest China. J. Hydrol. 2021, 593, 125886. [Google Scholar] [CrossRef]
- Yu, Z.; Yang, K.; Luo, Y.; Shang, C.; Zhu, Y. Lake surface water temperature prediction and changing characteristics analysis-A case study of 11 natural lakes in Yunnan-Guizhou Plateau. J. Clean. Prod. 2020, 276, 122689. [Google Scholar] [CrossRef]
- Schwefel, R.; Gaudard, A.; Wüest, A.; Bouffard, D. Effects of climate change on deepwater oxygen and winter mixing in a deep lake (Lake Geneva): Comparing observational findings and modeling. Water Resour. Res. 2016, 52, 8811–8826. [Google Scholar] [CrossRef]
- Missaghi, S.; Hondzo, M.; Herb, W. Prediction of lake water temperature, dissolved oxygen, and fish habitat under changing climate. Clim. Chang. 2017, 141, 747–757. [Google Scholar] [CrossRef]
- Chen, X.; Liu, X.; Peng, W.; Dong, F.; Chen, Q.; Sun, Y.; Wang, R. Hydroclimatic influence on the salinity and water volume of a plateau lake in southwest China. Sci. Total Environ. 2019, 659, 746–755. [Google Scholar] [CrossRef] [PubMed]
- Cao, X.; Wang, Y.; He, J.; Luo, X.; Zheng, Z. Phosphorus mobility among sediments, water and cyanobacteria enhanced by cyanobacteria blooms in eutrophic Lake Dianchi. Environ. Pollut. 2016, 219, 580–587. [Google Scholar] [CrossRef] [PubMed]
- Ni, L.; Li, D.; Su, L.; Xu, J.; Li, S.; Ye, X.; Geng, H.; Wang, P.; Li, Y.; Li, Y.; et al. Effects of algae growth on cadmium remobilization and ecological risk in sediments of Taihu Lake. Chemosphere 2016, 151, 37–44. [Google Scholar] [CrossRef] [PubMed]
- Filazzola, A.; Mahdiyan, O.; Shuvo, A.; Ewins, C.; Moslenko, L.; Sadid, T.; Blagrave, K.; Imrit, M.A.; Gray, D.K.; Quinlan, R.; et al. A database of chlorophyll and water chemistry in freshwater lakes. Sci. Data 2020, 7, 310. [Google Scholar] [CrossRef]
- Pu, J.; Song, K.; Lv, Y.; Liu, G.; Fang, C.; Hou, J.; Wen, Z. Distinguishing Algal Blooms from Aquatic Vegetation in Chinese Lakes Using Sentinel 2 Image. Remote Sens. 2022, 14, 1988. [Google Scholar] [CrossRef]
- Zhang, M.; Yu, Y.; Yang, Z.; Kong, F. Deterministic diversity changes in freshwater phytoplankton in the Yunnan–Guizhou Plateau lakes in China. Ecol. Indic. 2016, 63, 273–281. [Google Scholar] [CrossRef]
- Zhou, Q.; Wang, W.; Huang, L.; Zhang, Y.; Qin, J.; Li, K.; Chen, L. Spatial and temporal variability in water transparency in Yunnan Plateau lakes, China. Aquat. Sci. 2019, 81, 36. [Google Scholar] [CrossRef]
Figure 1.
Distribution of sampling locations in Lake Chenghai: (a) Yunnan Province; (b) Lijiang City; (c) Sampling point of Lake Chenghai.
Figure 1.
Distribution of sampling locations in Lake Chenghai: (a) Yunnan Province; (b) Lijiang City; (c) Sampling point of Lake Chenghai.

Figure 2.
Vertical profile of water temperature (WT) in Lake Chenghai, Yunnan.

Figure 3.
Vertical profile of dissolved oxygen (DO) in Lake Chenghai, Yunnan.

Figure 4.
Vertical profile of pH values in Lake Chenghai, Yunnan.
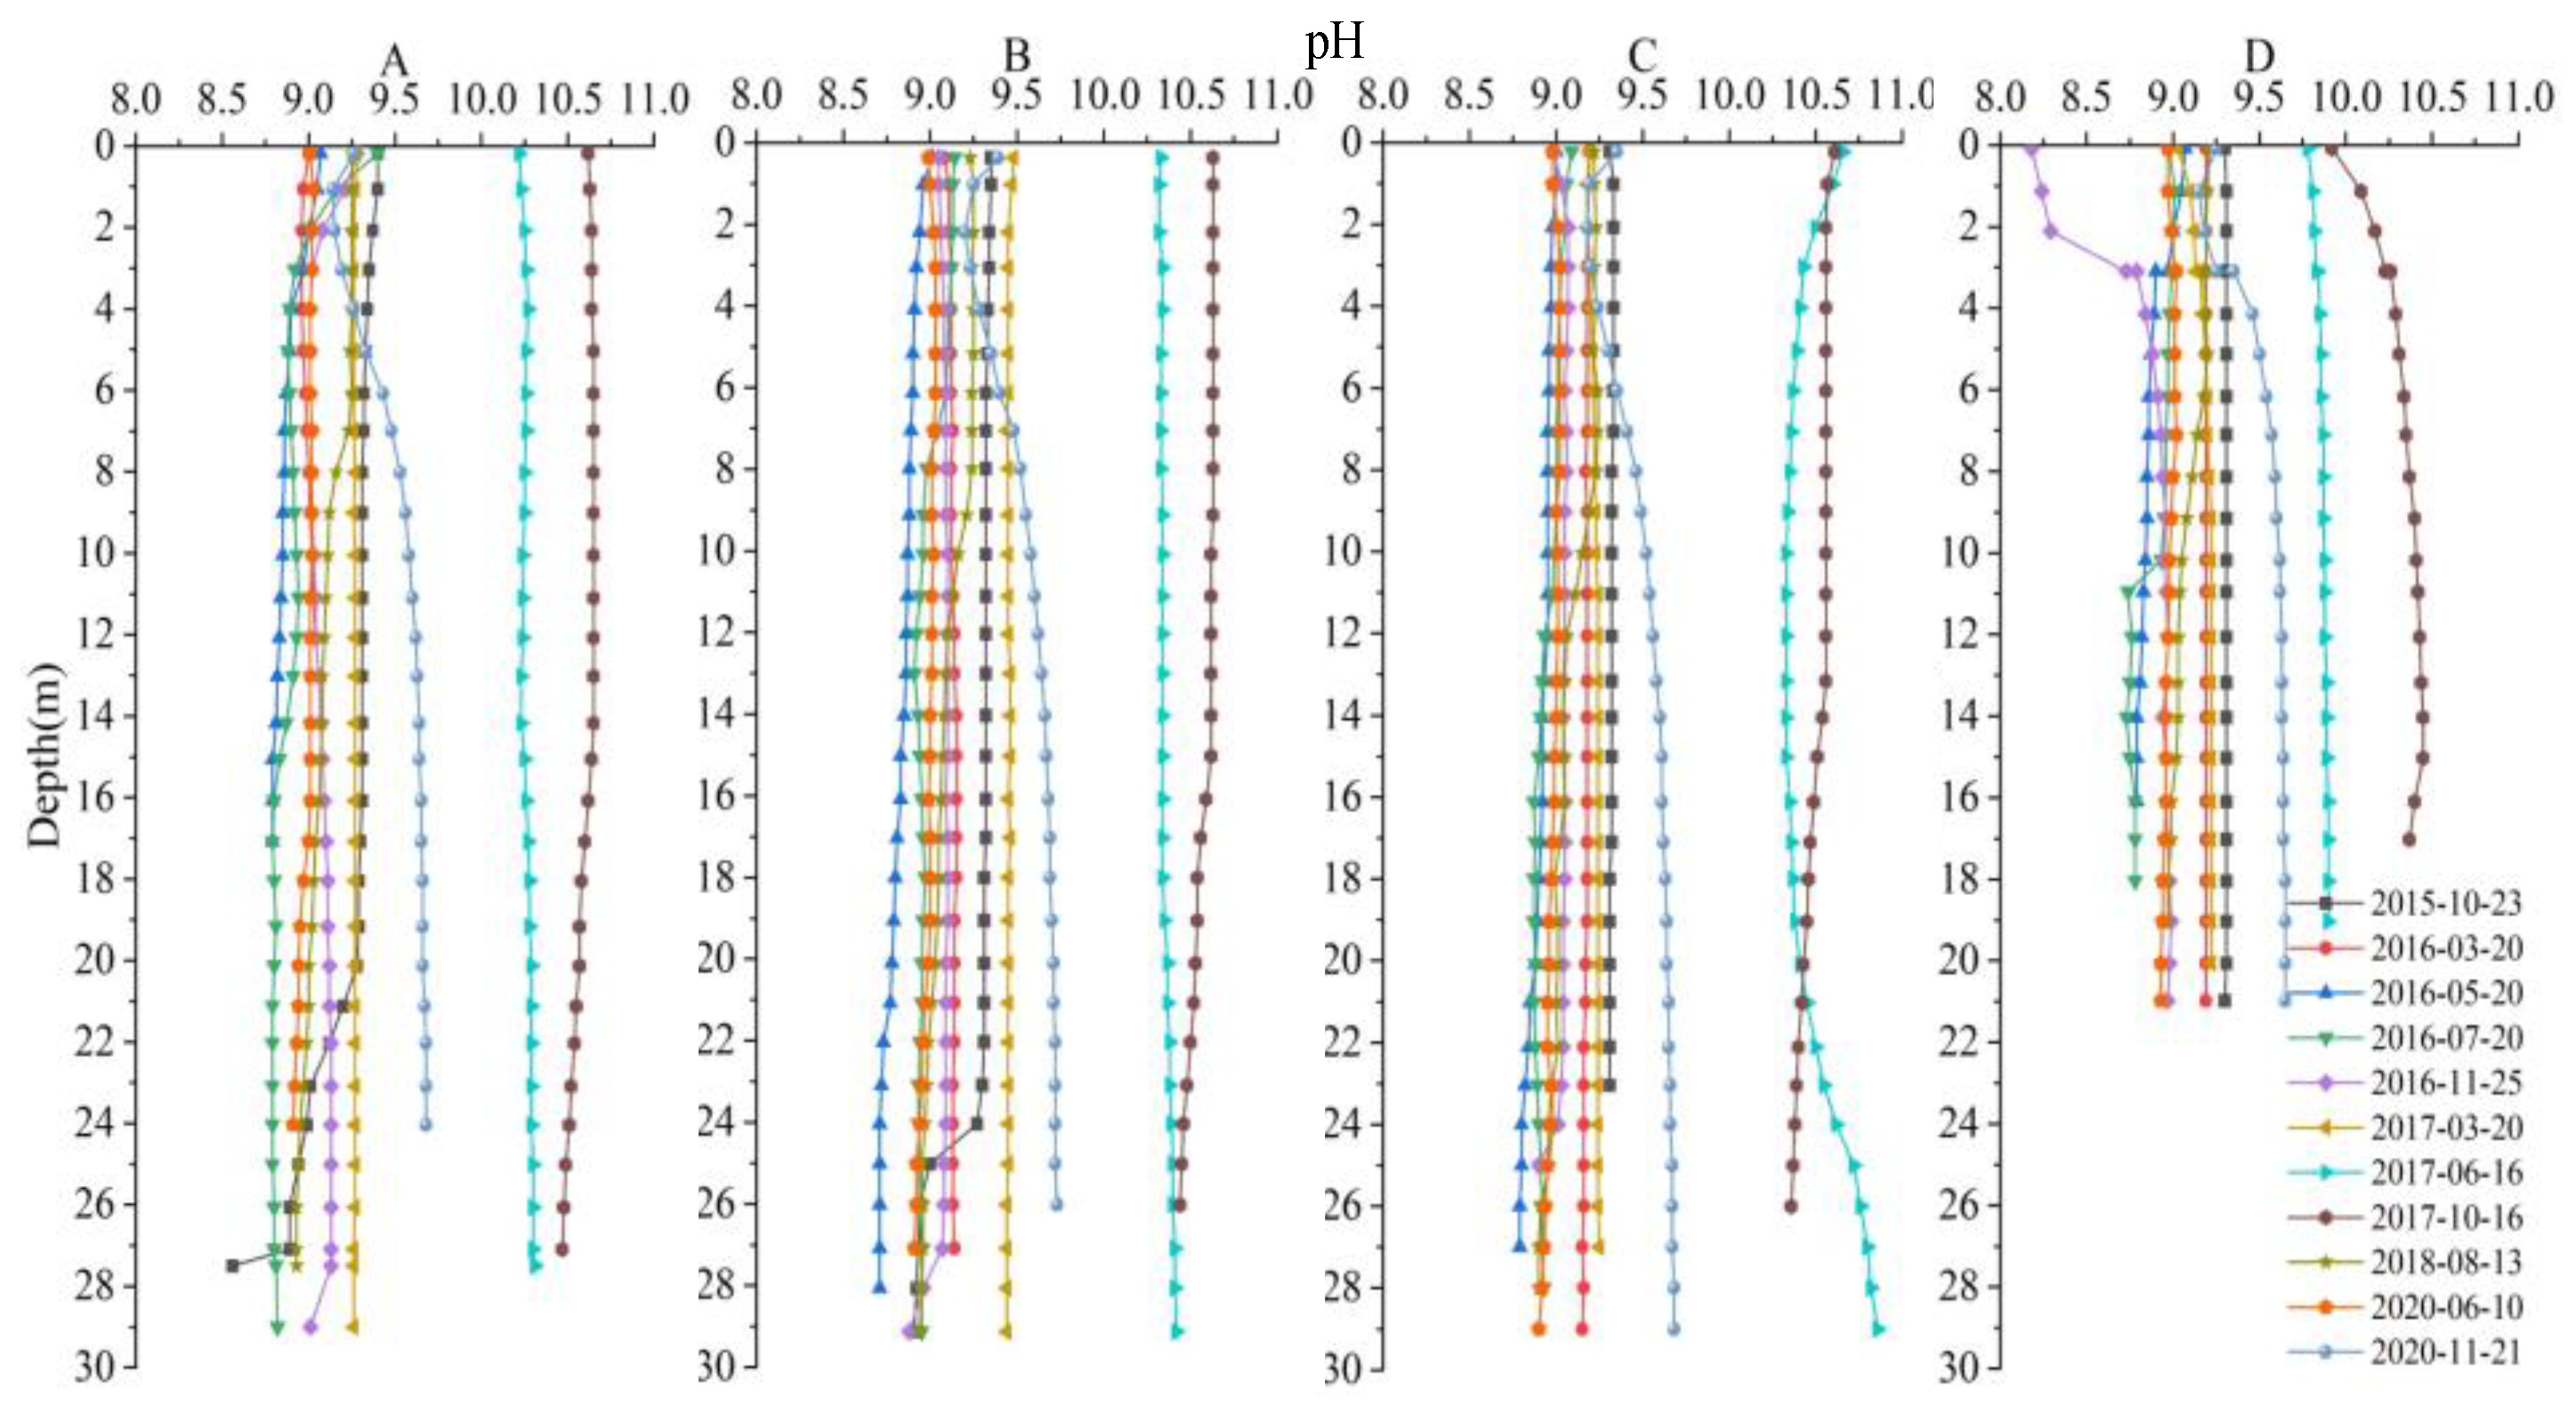
Figure 5.
Vertical profile of chlorophyll-a (Chl-a) in Lake Chenghai, Yunnan.
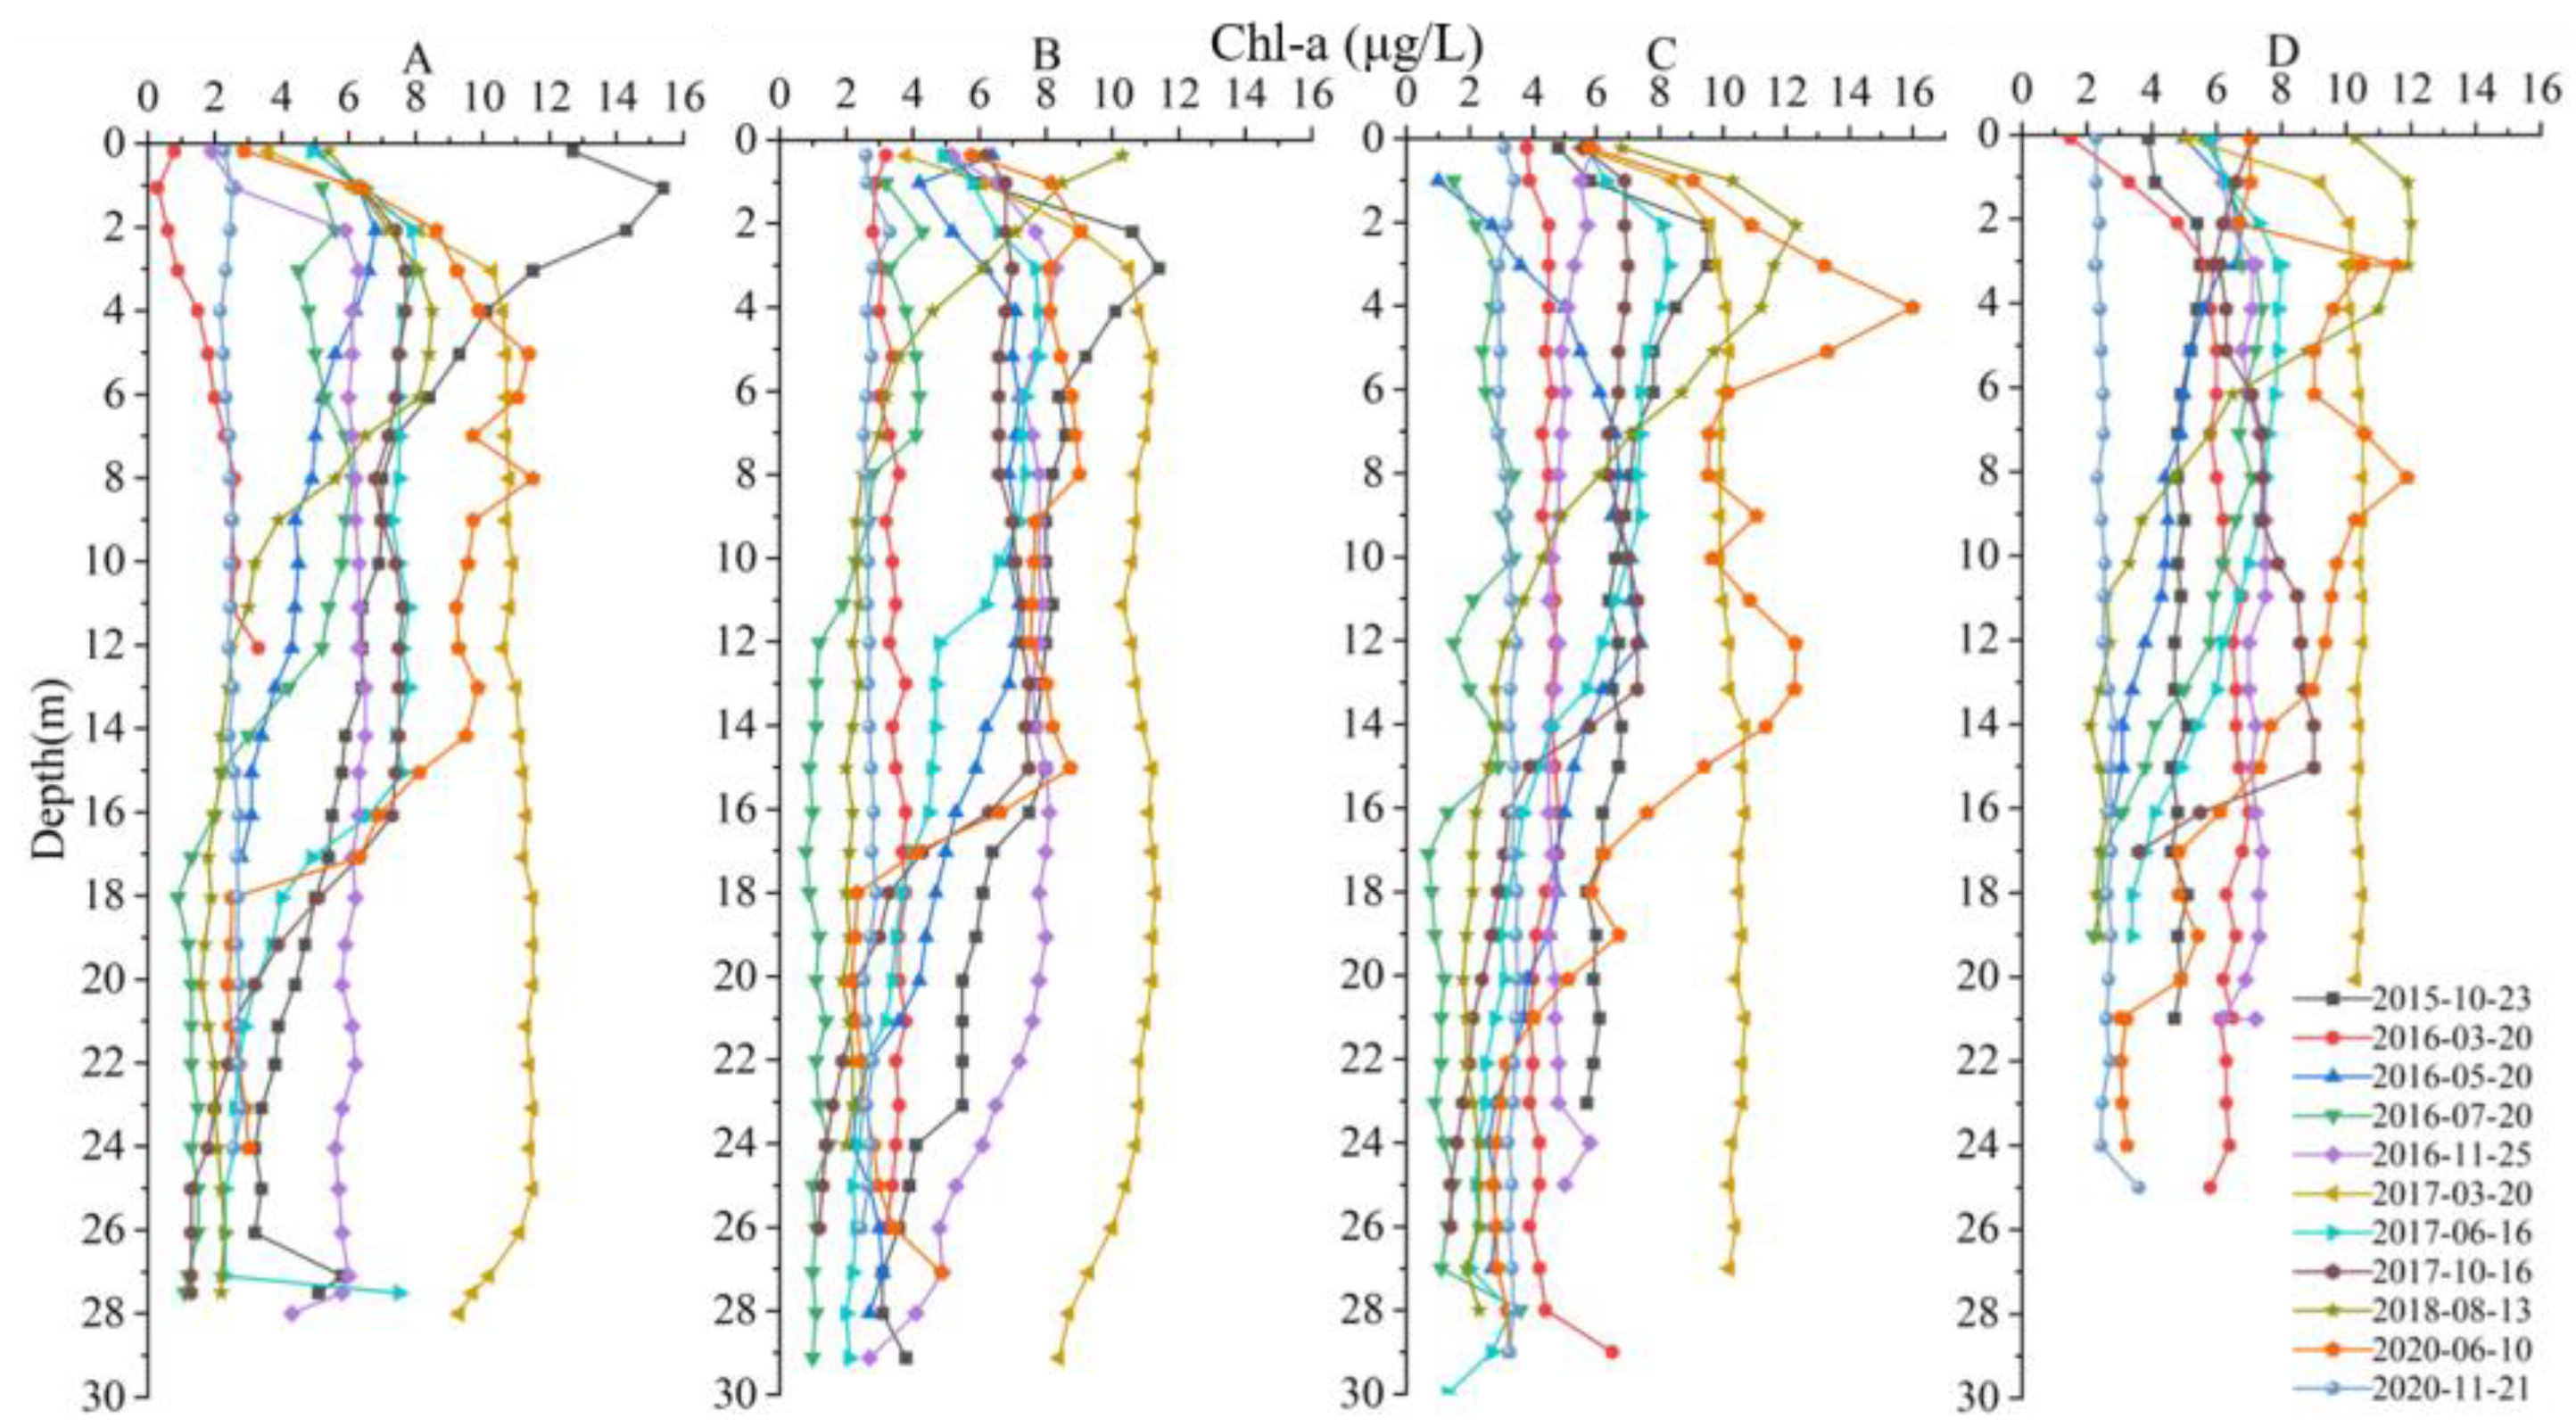
Figure 6.
(a) Changes in monthly average temperature and precipitation in Yongsheng County, Yunnan from 2015–2020; (b) Lake Chenghai water pollution index and lake nutrition state index.
Figure 6.
(a) Changes in monthly average temperature and precipitation in Yongsheng County, Yunnan from 2015–2020; (b) Lake Chenghai water pollution index and lake nutrition state index.

Table 1.
Correlation coefficient for Chl-a to other parameters in Chinese lakes and reservoirs.
| Parameter | Chl-a | TP | TN | SD | CODMn |
|---|---|---|---|---|---|
| 1 | 0.84 | 0.82 | −0.83 | 0.83 | |
| 1 | 0.7056 | 0.6724 | 0.6889 | 0.6889 |
Table 2.
Water function and standard classification.
| Water Quality Classification | Scope of Application |
|---|---|
| Class I | Mainly applicable to source waters and national nature reserves. |
| Class II | Mainly applicable to centralized drinking water, surface water sources, first-class protected areas, etc. |
| Class III | Mainly applicable to secondary protection zones, fisheries, and swimming areas of centralized drinking water surface water sources. |
| Class IV | Mainly applicable to general industrial water use areas and recreational areas where the human body is not in direct contact with water. |
| Class V | Mainly applicable to agricultural water use areas and general landscape requirements. |
Table 3.
Vertical profile of chlorophyll-a (Chl-a) in Lake Chenghai, Yunnan.
| pH | WT | Chl-a | |
|---|---|---|---|
| DO | 0.55 ** | 0.24 ** | 0.28 ** |
| pH | 0.24 ** | 0.39 ** | |
| WT | 0.39 ** |
** Significant correlation at 0.01 level (bilateral).
Publisher’s Note: MDPI stays neutral with regard to jurisdictional claims in published maps and institutional affiliations. |
© 2022 by the authors. Licensee MDPI, Basel, Switzerland. This article is an open access article distributed under the terms and conditions of the Creative Commons Attribution (CC BY) license (https://creativecommons.org/licenses/by/4.0/).
Share and Cite
MDPI and ACS Style
Hou, P.; Chang, F.; Duan, L.; Zhang, Y.; Zhang, H. Seasonal Variation and Spatial Heterogeneity of Water Quality Parameters in Lake Chenghai in Southwestern China. Water 2022, 14, 1640. https://doi.org/10.3390/w14101640
AMA Style
Hou P, Chang F, Duan L, Zhang Y, Zhang H. Seasonal Variation and Spatial Heterogeneity of Water Quality Parameters in Lake Chenghai in Southwestern China. Water. 2022; 14(10):1640. https://doi.org/10.3390/w14101640
Chicago/Turabian StyleHou, Pengfei, Fengqin Chang, Lizeng Duan, Yang Zhang, and Hucai Zhang. 2022. "Seasonal Variation and Spatial Heterogeneity of Water Quality Parameters in Lake Chenghai in Southwestern China" Water 14, no. 10: 1640. https://doi.org/10.3390/w14101640
Note that from the first issue of 2016, this journal uses article numbers instead of page numbers. See further details here.