
Water Use Characteristics of Two Dominant Species in the Mega-Dunes of the Badain Jaran Desert
by
Jie Qin
1,2, 
Jianhua Si
1,*,
Bing Jia
1,2,
Chunyan Zhao
1,
Dongmeng Zhou
1,2,
Xiaohui He
1,2,
Chunlin Wang
1,2 and
Xinglin Zhu
1,2 1
Key Laboratory of Eco-Hydrology of Inland River Basin, Northwest Institute of Eco-Environment and Resources, Chinese Academy of Sciences, Lanzhou 730000, China
2
Northwest Institute of Eco-Environment and Resources, University of Chinese Academy of Sciences, Beijing 100049, China
*
Author to whom correspondence should be addressed.
Water 2022, 14(1), 53; https://doi.org/10.3390/w14010053
Submission received: 19 November 2021
/
Revised: 20 December 2021
/
Accepted: 22 December 2021
/
Published: 28 December 2021
(This article belongs to the Special Issue Soil Hydrological Processes in Desert Regions)
Abstract
:The sparse natural vegetation develops special water use characteristics to adapt to inhospitable desert areas. The water use characteristics of such plants in desert areas are not yet completely understood. In this study, we compare the differences in water use characteristics between two dominant species of the Badain Jaran Desert mega-dunes—Zygophyllum xanthoxylum and Artemisia ordosica—by investigating δ2H and δ18O in plant xylem (the organization that transports water and inorganic salts in plant stems) and soil water, and δ13C in plant leaves. The results indicate that Z. xanthoxylum absorbed 86.5% of its water from soil layers below 90 cm during growing seasons, while A. ordosica derived 79.90% of its water from the 0–120 cm soil layers during growing seasons. Furthermore, the long-term leaf-level water use efficiency of A. ordosica (123.17 ± 2.13 μmol/mol) was higher than that of Z. xanthoxylum (97.36 ± 1.16 μmol/mol). The differences in water use between the two studied species were mainly found to relate to their root distribution characteristics. A better understanding of the water use characteristics of plants in desert habitats can provide a theoretical basis to assist in the selection of species for artificial vegetation restoration in arid areas.
1. Introduction
The Badain Jaran Desert is home to the highest mega-dunes in the world, with sparse rainfall, an arid climate, barren soil, and strong wind and sand activity. Despite the extremely arid environmental conditions, plants of the families Chenopodiaceae, Compositae, and Gramineae can be found widely distributed across the mega-dunes, as well as Artemisia ordosica, Nitraria tangutorum, Zygophyllum xanthoxylum, Psammochloa villosa, and other shrubs with tall obvious trunks and “arbor-like” growth. Among these, Z. xanthoxylum and A. ordosica represent the most dominant species and play an important role in preventing wind erosion and fixing sand. These plants are distributed 100–250 m above the lake surface; as such, it is difficult for them to use groundwater directly. Due to the extreme aridity of the desert—with an average annual rainfall of just 80 mm—the question of how these plants access and use water to survive in such an extreme environment remains. Answers to these questions are needed to clarify the water use characteristics of the plants in the Badain Jaran Desert.
Water—whether groundwater, surface water, or atmospheric precipitation—plays a highly important role in the desert ecosystem. It represents a dominant restrictive ecological factor affecting the growth of desert plants, restricting or determining the formation and development of desert vegetation [1,2]. Moreover, the distribution of desert vegetation can be analyzed to determine regional hydrological characteristics [3]. The degradation of desert vegetation is generally thought to be caused by a decline in the groundwater level, making it impossible for plants to effectively access water [4]. However, studies show that not all desert plants use groundwater alone for their maintenance [5]. In addition to groundwater, many plants use seasonal precipitation, soil water, and condensation water (such as dew and fog) to maintain their survival [5,6,7] However, the relative contribution of various water sources to desert plants remains inconclusive. Many previous studies used the whole-root excavation method [8], the plant physiological and ecological index identification method [9], and stable hydrogen and oxygen isotope technology [9,10,11,12] to study differences in the water sources of desert plants between species (life forms) at different times and with various spatial distributions [2,5,12]. Few studies analyze the effect of time and spatial differences together on plant water sources, which can help to better understand plant water use. The effect of such temporal and spatial changes on plant water sources are known as water use patterns [13]. In the present study, we aimed to determine the water use patterns that allow desert plants to effectively avoid or overcome water stress, and thus survive in the extremely arid mega-dune area.
Water use patterns of desert plants determine, to a certain extent, the response of the ecosystem to changes in environmental water conditions [12]. Cyclical changes in precipitation and groundwater, climate, and groundwater level in desert systems [10] lead to temporal and spatial fluctuations in the habitat conditions of desert plants, which require desert plants to adapt to changing water availability through multiple strategies such as changing their physiological characteristics and reproduction methods [14], thereby forming special water use characteristics. Water use efficiency (WUE) is another key indicator of plant water use [12,15], which can be used to characterize the ability of plants to fix organic matter under the same water consumption conditions [16]. Current mainstream research is primarily focused on instantaneous and long-term water use efficiency at the plant leaf scale [17], the latter of which can reflect the physiological conditions of plants over long-term timescales such as months and years—typically through the use of carbon stabilization isotope ratios (δ13C) [18]. Numerous studies show that δ13C is significantly positively correlated with water use efficiency [18,19]. Therefore, carbon stable isotope technology is currently the most common method for the analysis of the long-term water use efficiency of plants.
In this study, we compare the water use characteristics of two dominant species—Zygophyllum xanthoxylum, a shrub species, and Artemisia ordosica, a semi-shrub species—in the mega-dunes of the Badain Jaran Desert using stable isotope techniques (δ2H, δ18O and δ13C). We investigated δ2H and δ18O in plant xylem and soil water from various layers up to 240 cm under the dry sand layer to analyze plant water sources. Additionally, we measured δ13C in plant leaves to explore the interspecific differences in leaf-level WUE. The soil water content was also investigated. We hypothesized that the two species had completely different water use characteristics. The main aims of this study were: (1) to clarify the water sources of two species and determine the seasonal variation in their characteristics, (2) to analyze seasonal variations in water use efficiency (WUE) for the two species, and (3) to compare the differences in water use characteristics between the two plants. This study comprehensively analyzed the water use characteristics of different life-type plants from the perspective of time and space, which is conducive to further exploring the survival mechanism of plants in desert habitats.
2. Materials and Methods
2.1. Study Area
The Badain Jaran Desert (39°04′15″–42°12′23″ N, 99°23′18″–104°34′02″ E) is located in the west of the Alxa Plateau in Inner Mongolia. It is the second largest desert in China, with a total area of 5.22 × 10⁴ km2, an east-to-west length of 442 km, and a north-to-south distance of 354 km [20]. The region has an extremely arid temperate continental climate with sparse precipitation, strong evaporation, and abundant sunshine all year round. It is very hot in summer and windy in winter and spring. The average annual precipitation is 78.1 mm [21], which is mainly concentrated in the period of June to September, with the majority occurring in July and August. The air temperature ranges from a mean of −9.1 °C in winter to a mean of 25.3 °C in summer, with a mean annual temperature of 7–8 °C. The vegetation is dominated by xerophyte and super-xerophyte shrubs and semi-shrubs with low coverage. Representative plants include Nitraria tangutorum, Zygophyllum xanthoxylum, Reaumuria soongorica, Artemisia ordosica, Agriophyllum squarrosum, and Psammochloa villosa [22]. The landform is dominated by mobile sand dunes. The soil is mostly sandy soil with weak water storage capacity. The soil texture is mainly fine sand, followed by medium sand and very fine sand. The soil is alkaline, with high salinity, low organic matter and nutrient elements (Table 1). There are about 144 lakes in the Badain Jaran Desert. The depth of the lakes is relatively shallow, and the water level fluctuates less than 0.5 m. The groundwater level in this area is between 1000–1300 m [23].
2.2. Materials
The mega-dunes near Bataan Lake (102°37′1.74″ E, 39°43′19.31″ N) were selected as the test site. The test was conducted from May to August 2020, and samples were collected from 6:00 a.m. to 9:00 a.m. on each sampling date (all typical sunny days) in the middle of each month. Considering the height of the mega-dunes and the distribution of vegetation, the entire mega-dunes were divided into three regions: the upper part (180–250 m from the base of the mega-dunes), the middle part (from 90–160 m), and the lower part (from 0–70 m). Sampling was performed in 3 sampling regions on 5 mega-dunes, for a total of 15 sampling areas (Figure 1). Zygophyllum xanthoxylum and Artemisia ordosica (Figure 2), as plants typical of the mega-dune vegetation, were selected as the research objects. Z. xanthoxylum is a sand shrub growing in a “tree-like” shape, with fleshy leaves and an obvious main stem. The average plant is about 70 cm tall, with average main root length and diameter of 138 cm and 2.8 cm, respectively, and average lateral root length and diameter of 136 cm and 0.8 cm, respectively. A. ordosica is a semi-shrub, with slightly fleshy leaves, inconspicuous main stems, and many branches. The average plant is about 50 cm tall with an average root length of approximately 70 cm. In each area, three individual plants were randomly selected as representative samples for each species, and three parallel samples were collected for each individual plant. After sample collection was completed in the middle of each month, the indoor experimental analysis was carried out.
2.3. Sample Collection
Suberized and non-green twigs from different canopy directions were cut into 3–4 cm segments as samples for each species. The plant phloem tissues were also removed to avoid contamination of xylem water by isotope-enriched water [24]. Subsequently, these plant segments were immediately sealed in airtight vials, wrapped with Parafilm, stored in a portable freezer, and kept frozen at −20 °C until water extraction. Simultaneously, plant leave samples were collected in envelopes.
Soil samples were collected next to the selected plant individuals, from the emergence of the wet sand layer to 8 maximum depths (0–30, 30–60, 60–90, 90–120, 120–150, 150–180, 180–210, and 210–240 cm) by excavating soil profiles; three replicates per soil layer were performed for each species at each site. One part of each soil sample was immediately sealed in airtight vials, wrapped with Parafilm, stored in a portable freezer and kept frozen at −20 °C until water extraction for isotopic analysis. The other part was placed in a tin box to obtain the soil water content, which was determined by drying the samples at 105 °C for 24 h. After samples were collected, the sand was backfilled.
Groundwater samples were collected from the nearby wells, and lake water samples were collected from Bataan Lake (including east lake and west lake). These liquid samples were also immediately sealed in airtight vials, wrapped with Parafilm, and stored under refrigeration at −2 °C
2.4. Measurement of the δ2H and δ18O of Xylem Water and Water Sources
The cryogenic vacuum distillation system [11,25,26] was used to extract water from xylem and soil samples in the Key Laboratory of Ecohydrology of the Inland River Basin, Northwest Institute of Eco-Environment and Resources, Chinese Academy of Sciences. The whole extraction process lasted 2–3 h, depending on the sample water content [27], with an efficiency of up to 98% [5]. After extraction, the water samples were filtered with 0.22 μm pore size filters, transferred into 2 mL crimp cap vials, and stored at 4 °C until isotopic analysis. The δ2H and δ18O of all water samples were measured by an isotope ratio infrared spectroscopy (IRIS) system, namely, a Liquid Water Isotope Analyzer (LWIA, 912-0008-1001, Los Gatos Research Inc., Mountain View, CA, USA). The isotopic composition of water samples was expressed as follows:
where Rsample and Rstandard are the hydrogen and oxygen isotopic composition (2H/1H, 18O/16O ratios) of the sample and standard water (Vienna Standard Mean Ocean Water, V-SMOW), respectively.
2.5. Measurement of the δ13C of Plant Leaves
The plant leaves were placed in an oven, deactivated at 105 °C for 25 min, dried at 70 °C for 48 h to a constant weight, then thoroughly ground and passed through a 100-mesh sieve to obtain leaf powder. Powders were sealed in containers and stored in a dry place. The δ13C of plant leaves was determined by an isotope ratio mass spectrometer (IRMS) (DELTA V Advantage, Thermo Fisher Scientific, Bremen, Germany). The carbon isotopic compositions of plant leaves were expressed as in formula (1), with Rsample and Rstandard as the carbon isotopic composition (13C/12C ratios) of the sample and standard (the Vienna Pee Dee Belemnite, V-PDB), respectively.
2.6. Quantification of Water Sources Used by the Plants
Since the root systems of halophytes and xerophytes undergo hydrogen isotope fractionation during the process of absorbing water [11,28], we chose to use only δ18O values for the analysis and calculation of water sources. The most probable source of water absorption was found by comparing the δ18O values of stem water and those of potential sources such as soil water. The Iso-source model [29] was applied to identify the proportional contributions of each water source.
2.7. Calculation of Plants Water Use Efficiency
The long-term water use efficiency of the plants was calculated according to the formulas proposed by Farquhar et al. [30]:
where Ca and Ci are the CO2 pressure values in the atmosphere and leaf cells, respectively, μmol/mol; Δe is the water vapor pressure difference between the inside and outside of the leaf, MPa; δ13Ca and δ13Cp are the stable carbon isotope abundance values in the atmosphere and plant samples, respectively, ‰; a and b are the stable carbon isotope fractionation values during diffusion and carboxylation, respectively (approximately 4.4 ‰ and 27.0‰); and t is the year in AD, year.
2.8. Data Analysis
A one-way analysis of variance (ANOVA) was applied to detect differences in the isotopic composition and content of soil water from different soil layers. Differences in isotopic signatures, soil water content, and δ13C values across different seasons, plant species, and mega-dune locations were identified using a one-way analysis of variance (ANOVA) combined with a post-hoc Tukey’s least significant difference (LSD) test. The significance level of the statistical analyses was set at 0.05. Linear regression analysis was used to determine the relationship between the isotopic compositions of soil water, lake water, and groundwater, thereby analyzing the water replenishment relationship between each element. Data analyses were performed using SPSS 21.0 (SPSS Inc., Chicago, IL, USA), and figures were processed using Origin 2017 software (OriginLab Corp., Northampton, MA, USA).
3. Results
3.1. Temporal and Spatial Variations in Soil Water Content
The soil water content plots varied with soil depth and season (Figure 3). The overall soil water content in the study area is generally low, ranging from 0.41% to 2.46%, with an average value of 1.34 ± 0.53%. The soil water plots displayed no significant differences among depths but demonstrated pronounced differences among months (p < 0.001). Soil water content revealed a fluctuating upward trend with increase in soil depth (Figure 3). The soil water content of the 0–90 cm soil layers was highly varied—ranging from 0.50–2.40%—due to their exposure to environmental factors such as atmospheric precipitation and temperature. Therefore, the 0–90 cm soil layer can be classified as the water rapid change layer. This variation in soil water content persisted at depths of 100–180 cm, where the average water content was 0.47–2.46%. The soil water content in this layer was less affected by environmental factors but was obviously more affected by plant root water absorption, hydraulic lifting, and other activities; therefore, it can be classified as the water active layer. The soil water content of the layer between 180–240 cm had low variation and high stability, with an average water content of 1.10–2.15%. As such, it can be considered the water relatively stable layer.
The soil water content changed over the months, revealing a trend of initial increase from May to July (0.80 ± 0.26%, 1.35 ± 0.41%, and 1.68 ± 1.44% for May, June, and July, respectively) followed by a decrease in August (1.54 ± 0.50%). Soil water content varied significantly with position on the mega-dunes (p < 0.05) with the upper parts having the lowest soil water content (1.13 ± 0.38%), the middle parts having 1.39 ± 0.51% water, and the lower parts having the highest soil water content (1.51 ± 0.60%). The soil water content of the water rapid change, water active, and water relatively stable layers also exhibited a significant difference (p < 0.05) among the three regions of the mega-dunes studied.
3.2. Isotopic Composition of Xylem Water and Potential Water Sources
The δ18O values of groundwater and lake water varied with time (Figure 4). The δ18O values of groundwater in the Badain Jaran Desert remained relatively stable across the months of the study. The δ18O values of groundwater varied from −4.93‰ to −4.09‰, with an average value of −4.44 ± 0.33‰ (Figure 4). The renewal cycle of groundwater is long: it takes about 1400 years to complete a renewal of deep groundwater, while shallow groundwater also takes about 100 years. Therefore, there is little difference in the δ18O values of groundwater over a short period of time.
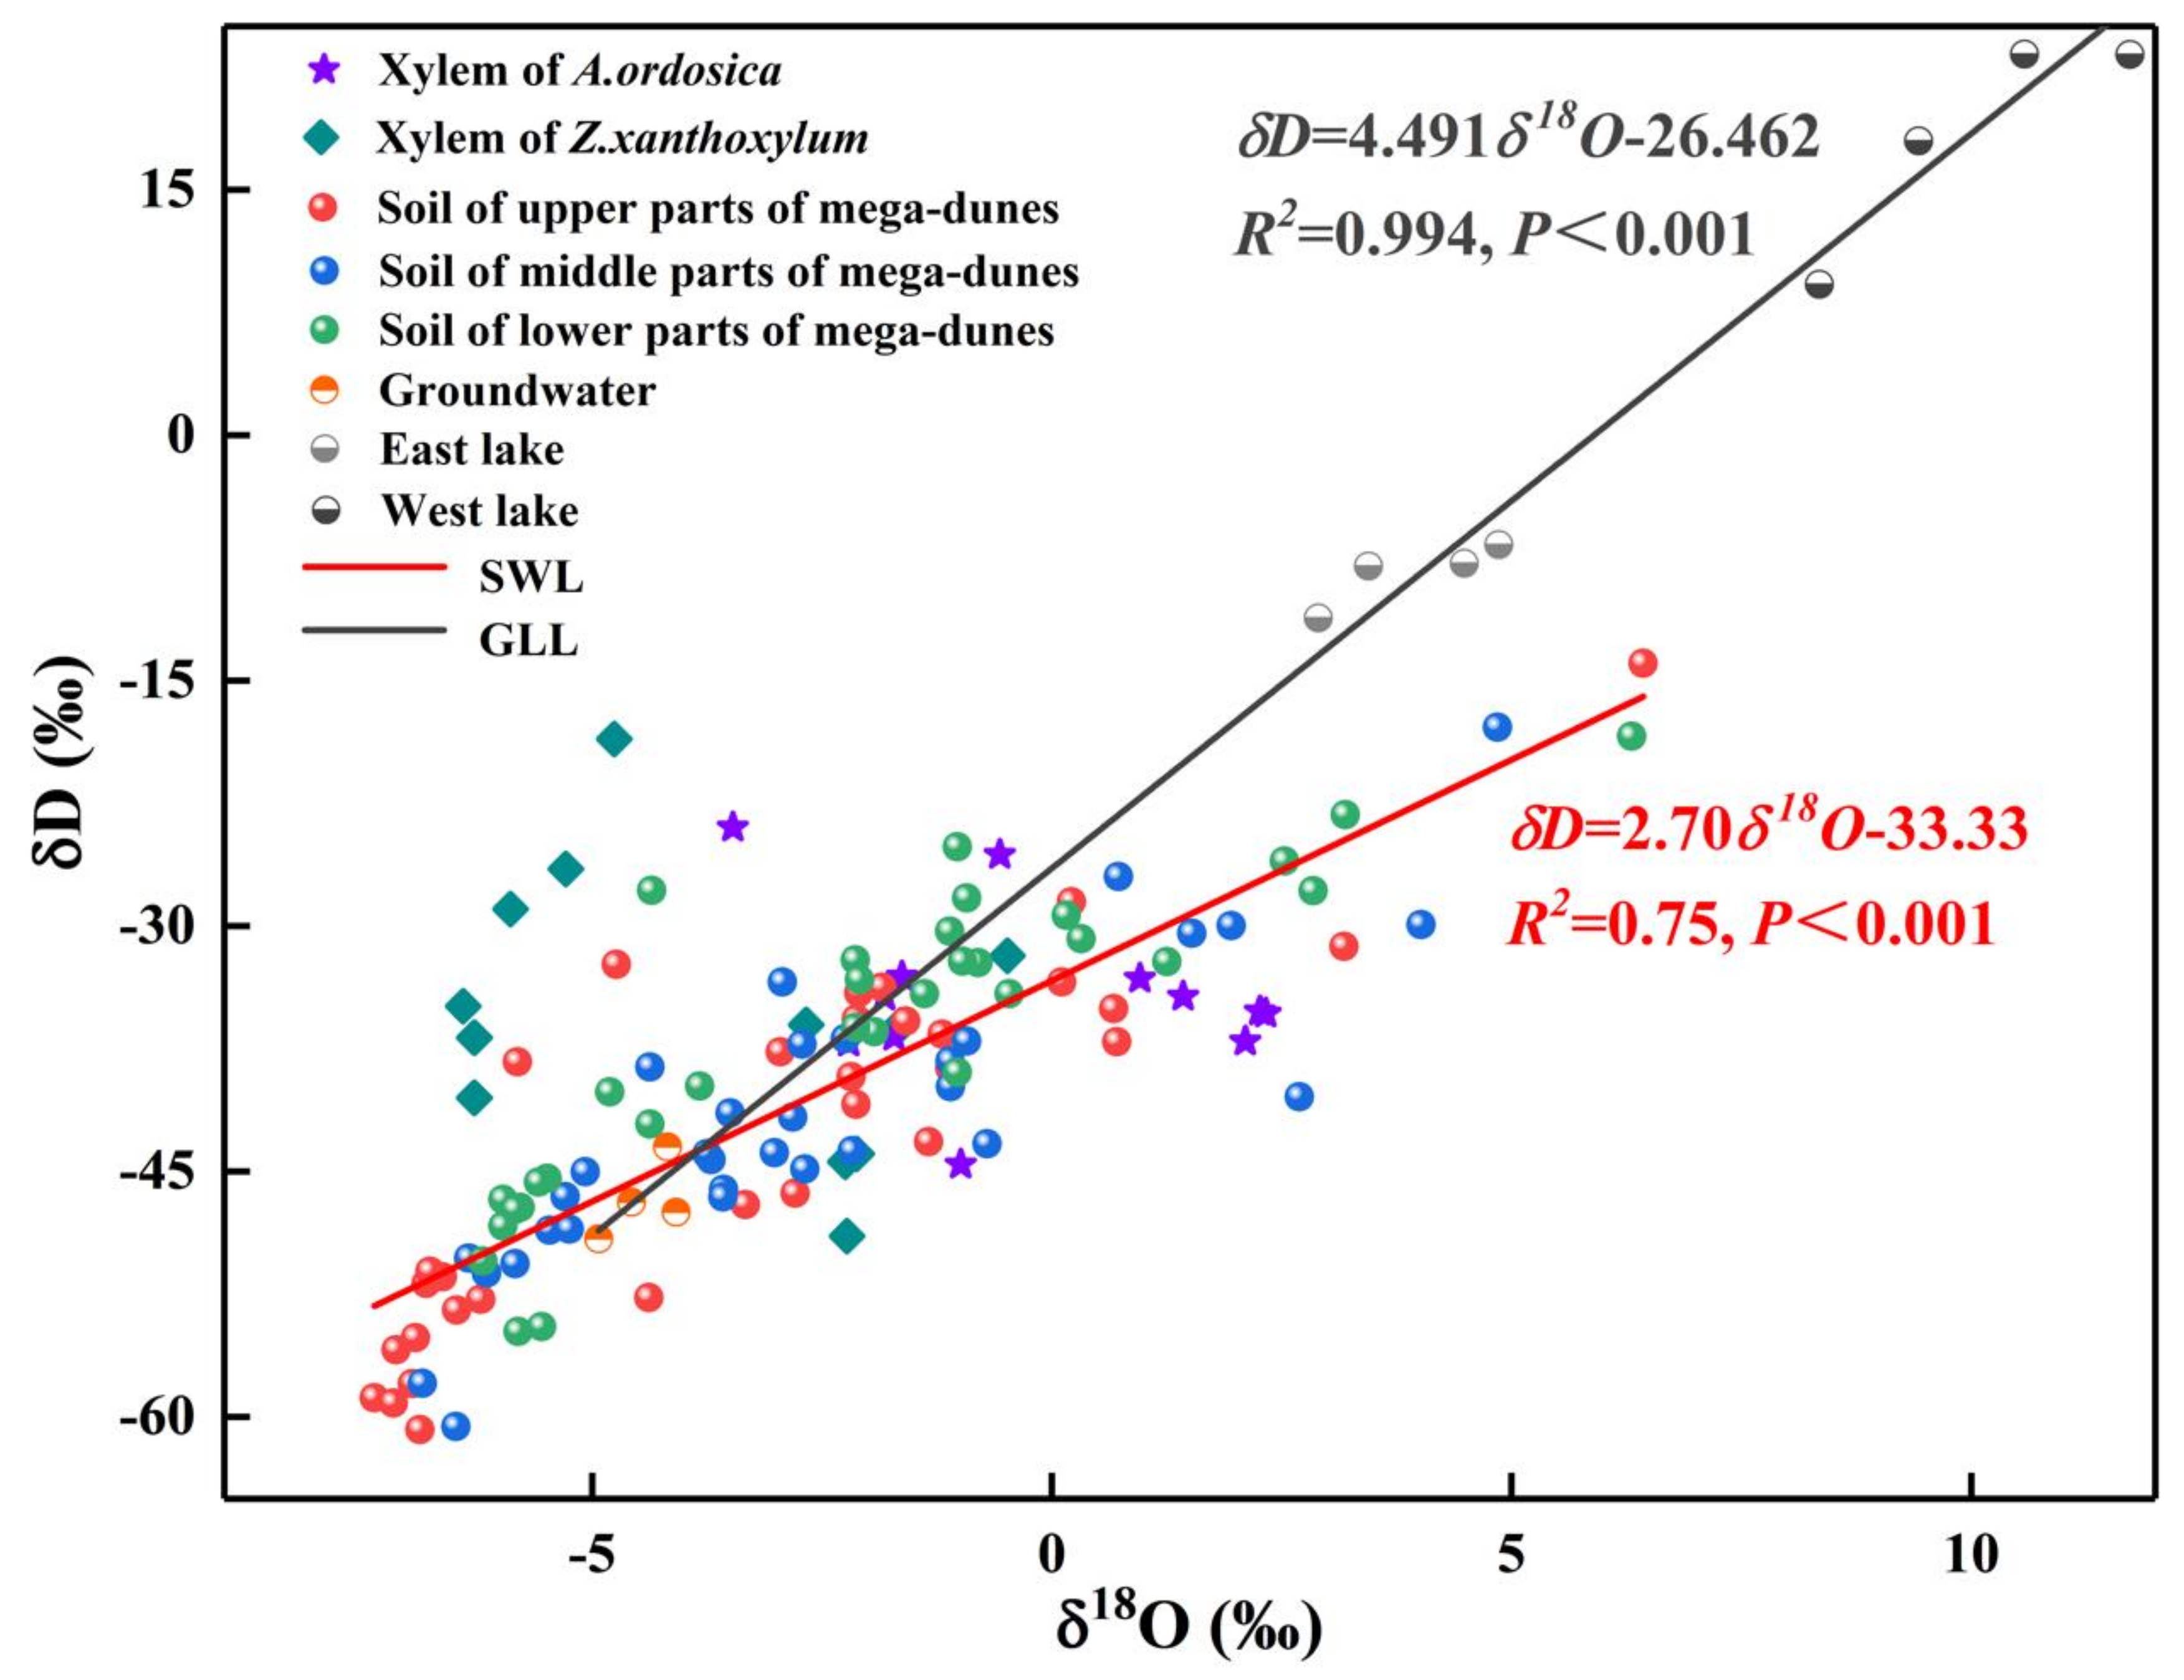
The δ18O values of Bataan Lake water had pronounced differences across the months (p < 0.001) and was largest in August. The Bataan Lake is divided into east lake and west lake, and their δ18O values were extremely different (p < 0.001). The δ18O values of east lake varied from 2.90‰ to 4.86‰, with an average value of 3.93 ± 0.79‰, while the δ18O values of west lake varied from 8.35‰ to 11.72‰, with an average value of 10.02 ± 1.26‰. The δ18O value of west lake is much higher than that of east lake (Figure 4), mainly because east lake is a freshwater lake (total dissolved solid: 1.880 g/L) and west lake is a saltwater lake (total dissolved solid: 483.150 g/L) [31], resulting in stronger water fractionation in west lake. In addition, the δD and δ18O of groundwater and lake water presented a very significant linear relationship (δD = 4.491δ18O-26.462, R2 = 0.994, p < 0.001). The scattered points of west lake were all located on the upper right side of east lake and groundwater, while the scattered points of east lake were all located on the upper right side of groundwater (Figure 4), indicating that west lake water may be recharged by both east lake water and groundwater while east lake water was recharged by groundwater alone.
The δ18O values of soil water ranged from −7.37‰ to 6.43‰, with an average value of −2.65‰. Significant differences were detected in the δ18O values of soil water from different depths (p < 0.001) and seasons (p < 0.001). The δ18O values of soil water gradually depleted with increase in soil depth, and the isotopic compositions of soil water in the 0–30 cm layers were enriched compared with those of the soil layers below 30 cm (Figure 5). The δ18O values of soil water gradually increased from −5.02‰ in May to −4.13‰ in June, −0.93‰ in July, and finally −0.53‰ in August. This change may be due to the gradual increase in temperature from May to August and the resultant increase in soil water evaporation, resulting in the gradual enrichment of soil water δ18O values. The δ18O values of soil water varied significantly with position on the mega-dunes (p < 0.05), being lowest in the upper part (−3.24‰), −2.56‰ in the middle parts, and highest in the lower parts (−2.16‰).
The average δ18O values in xylem water of Z. xanthoxylum ranged from −6.40‰ to −0.48‰, while those of A. ordosica ranged from −3.47‰ to 2.33‰. The δ18O values of xylem water from the two species studied revealed pronounced variations between the different sampling dates (Z. xanthoxylum: p < 0.001; A. ordosica: p < 0.01). There was no significant difference in the xylem water δ18O values for the two studied species among their different positions on the mega-dunes. However, the differences between the δ18O values of xylem water from Z. xanthoxylum and A. ordosica were distinct (p < 0.01). The isotopic signatures in xylem water were evenly distributed and were within the range of those seen in soil water; however, they were far from those of lake water (Figure 6), indicating that plants on mega-dunes mainly absorb and use soil water and that lake water is not a potential water source. The isotopic signatures of xylem water were located at the upper right of those of groundwater (Figure 6), indicating that groundwater may contribute to plant xylem water to a certain extent; however, the plants in this study were far from groundwater level, indicating that soil water constitutes their main water source, and groundwater may replenish soil water. The intersection of the δ18O value for xylem water of Z. xanthoxylum and that of soil water appeared within the 60–240 cm soil layer, and within the 0–60 cm soil layer for A. ordosica (Figure 5).
3.3. Water Use Patterns across the Growing Season
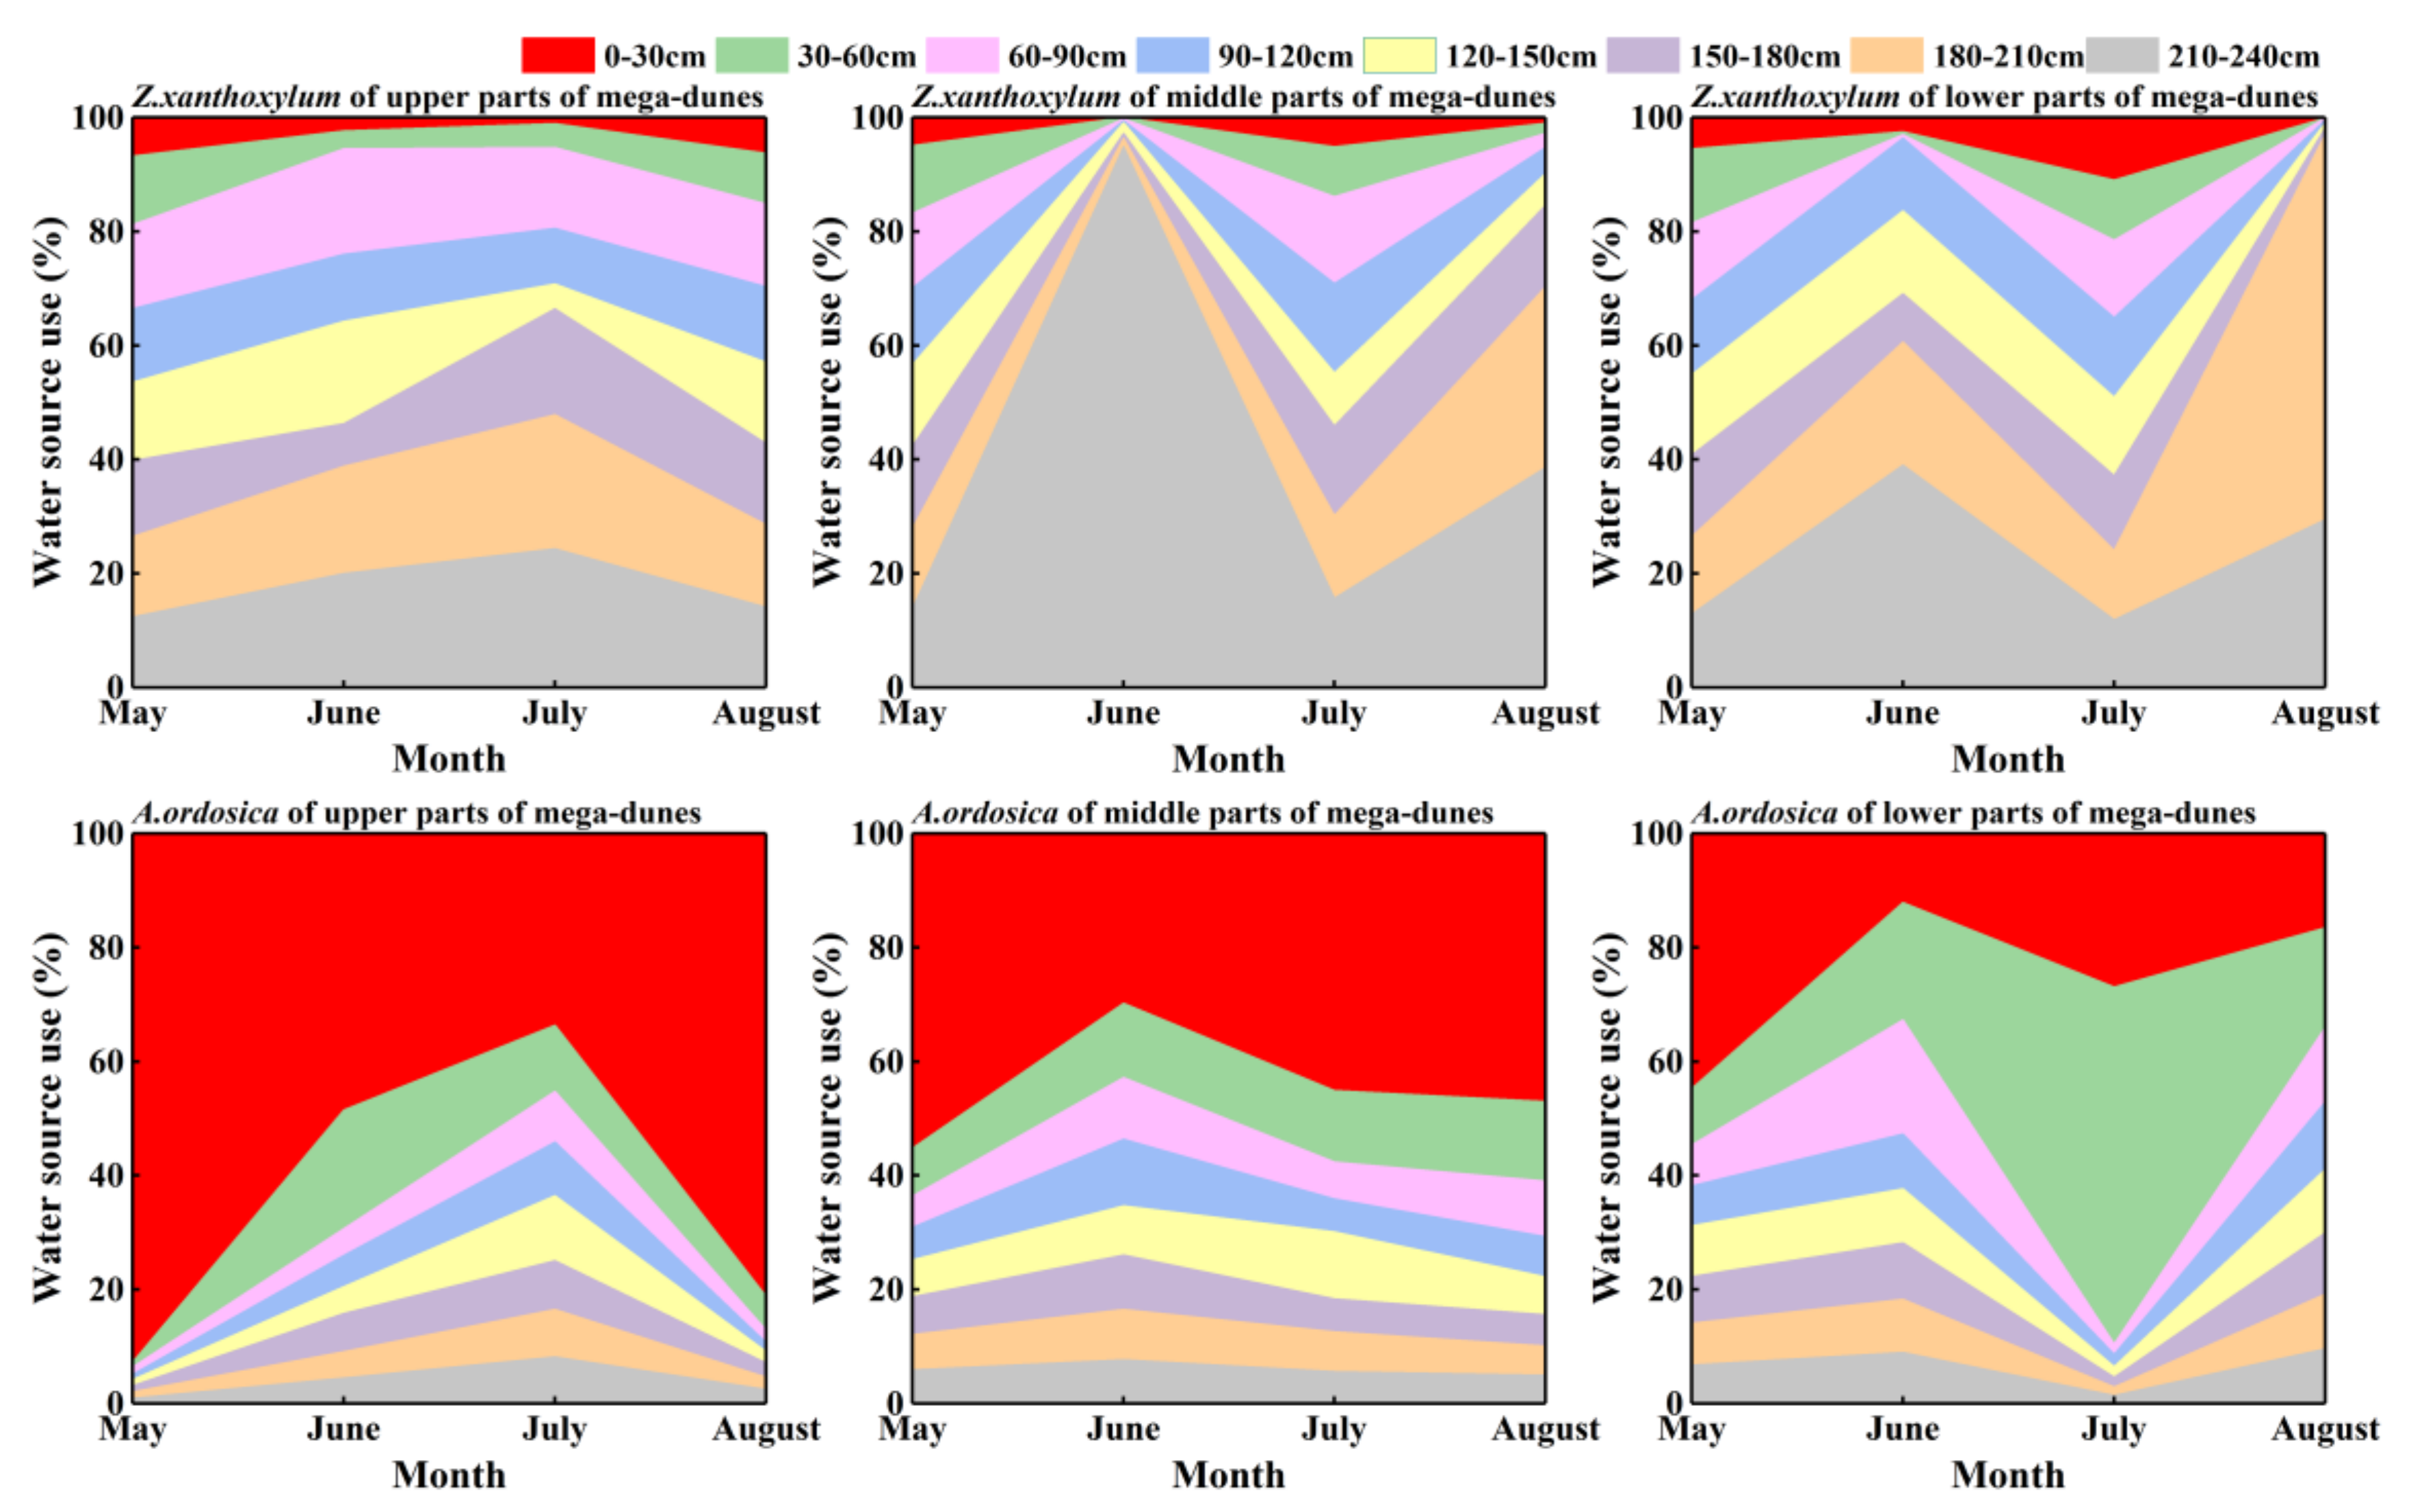
The Z. xanthoxylum more or less evenly absorbed water at different depths of soil in May and July. The proportional contribution of soil water from the 180–240 cm soil layers increased significantly in June and August, reaching 65.30% and 65.33%, respectively. Z. xanthoxylum absorbed most of its water (86.5%) from soil layers below 90 cm (Figure 7). The proportion of soil water contributed from the different soil layers was significantly different in Z. xanthoxylum (p < 0.001). A. ordosica derived most of its water (79.90%) from the 0–120 cm soil layers. The 0–30 cm soil layer contributed the largest percentage (64.30%) in May, and the 30–60 cm soil layer contributed the most (28.90%) in July. The proportional contributions of soil water from the 60–120 cm soil layer, from May to August, were 9.20%, 20.77%, 11.53%, and 15.17%, respectively (Figure 7). There were significant differences in the soil water contributions for A. ordosica from the different soil layers (p < 0.001). Differences in the proportional contributions from the different soil layers between Z. xanthoxylum and A. ordosica were significant, except for the 60–90 cm soil layers (p < 0.05). There were no distinct differences in the contribution percentages from the different soil layers for the two studied species among the different positions on the mega-dunes.
3.4. Temporal and Spatial Variations in Plant Water Use Efficiency
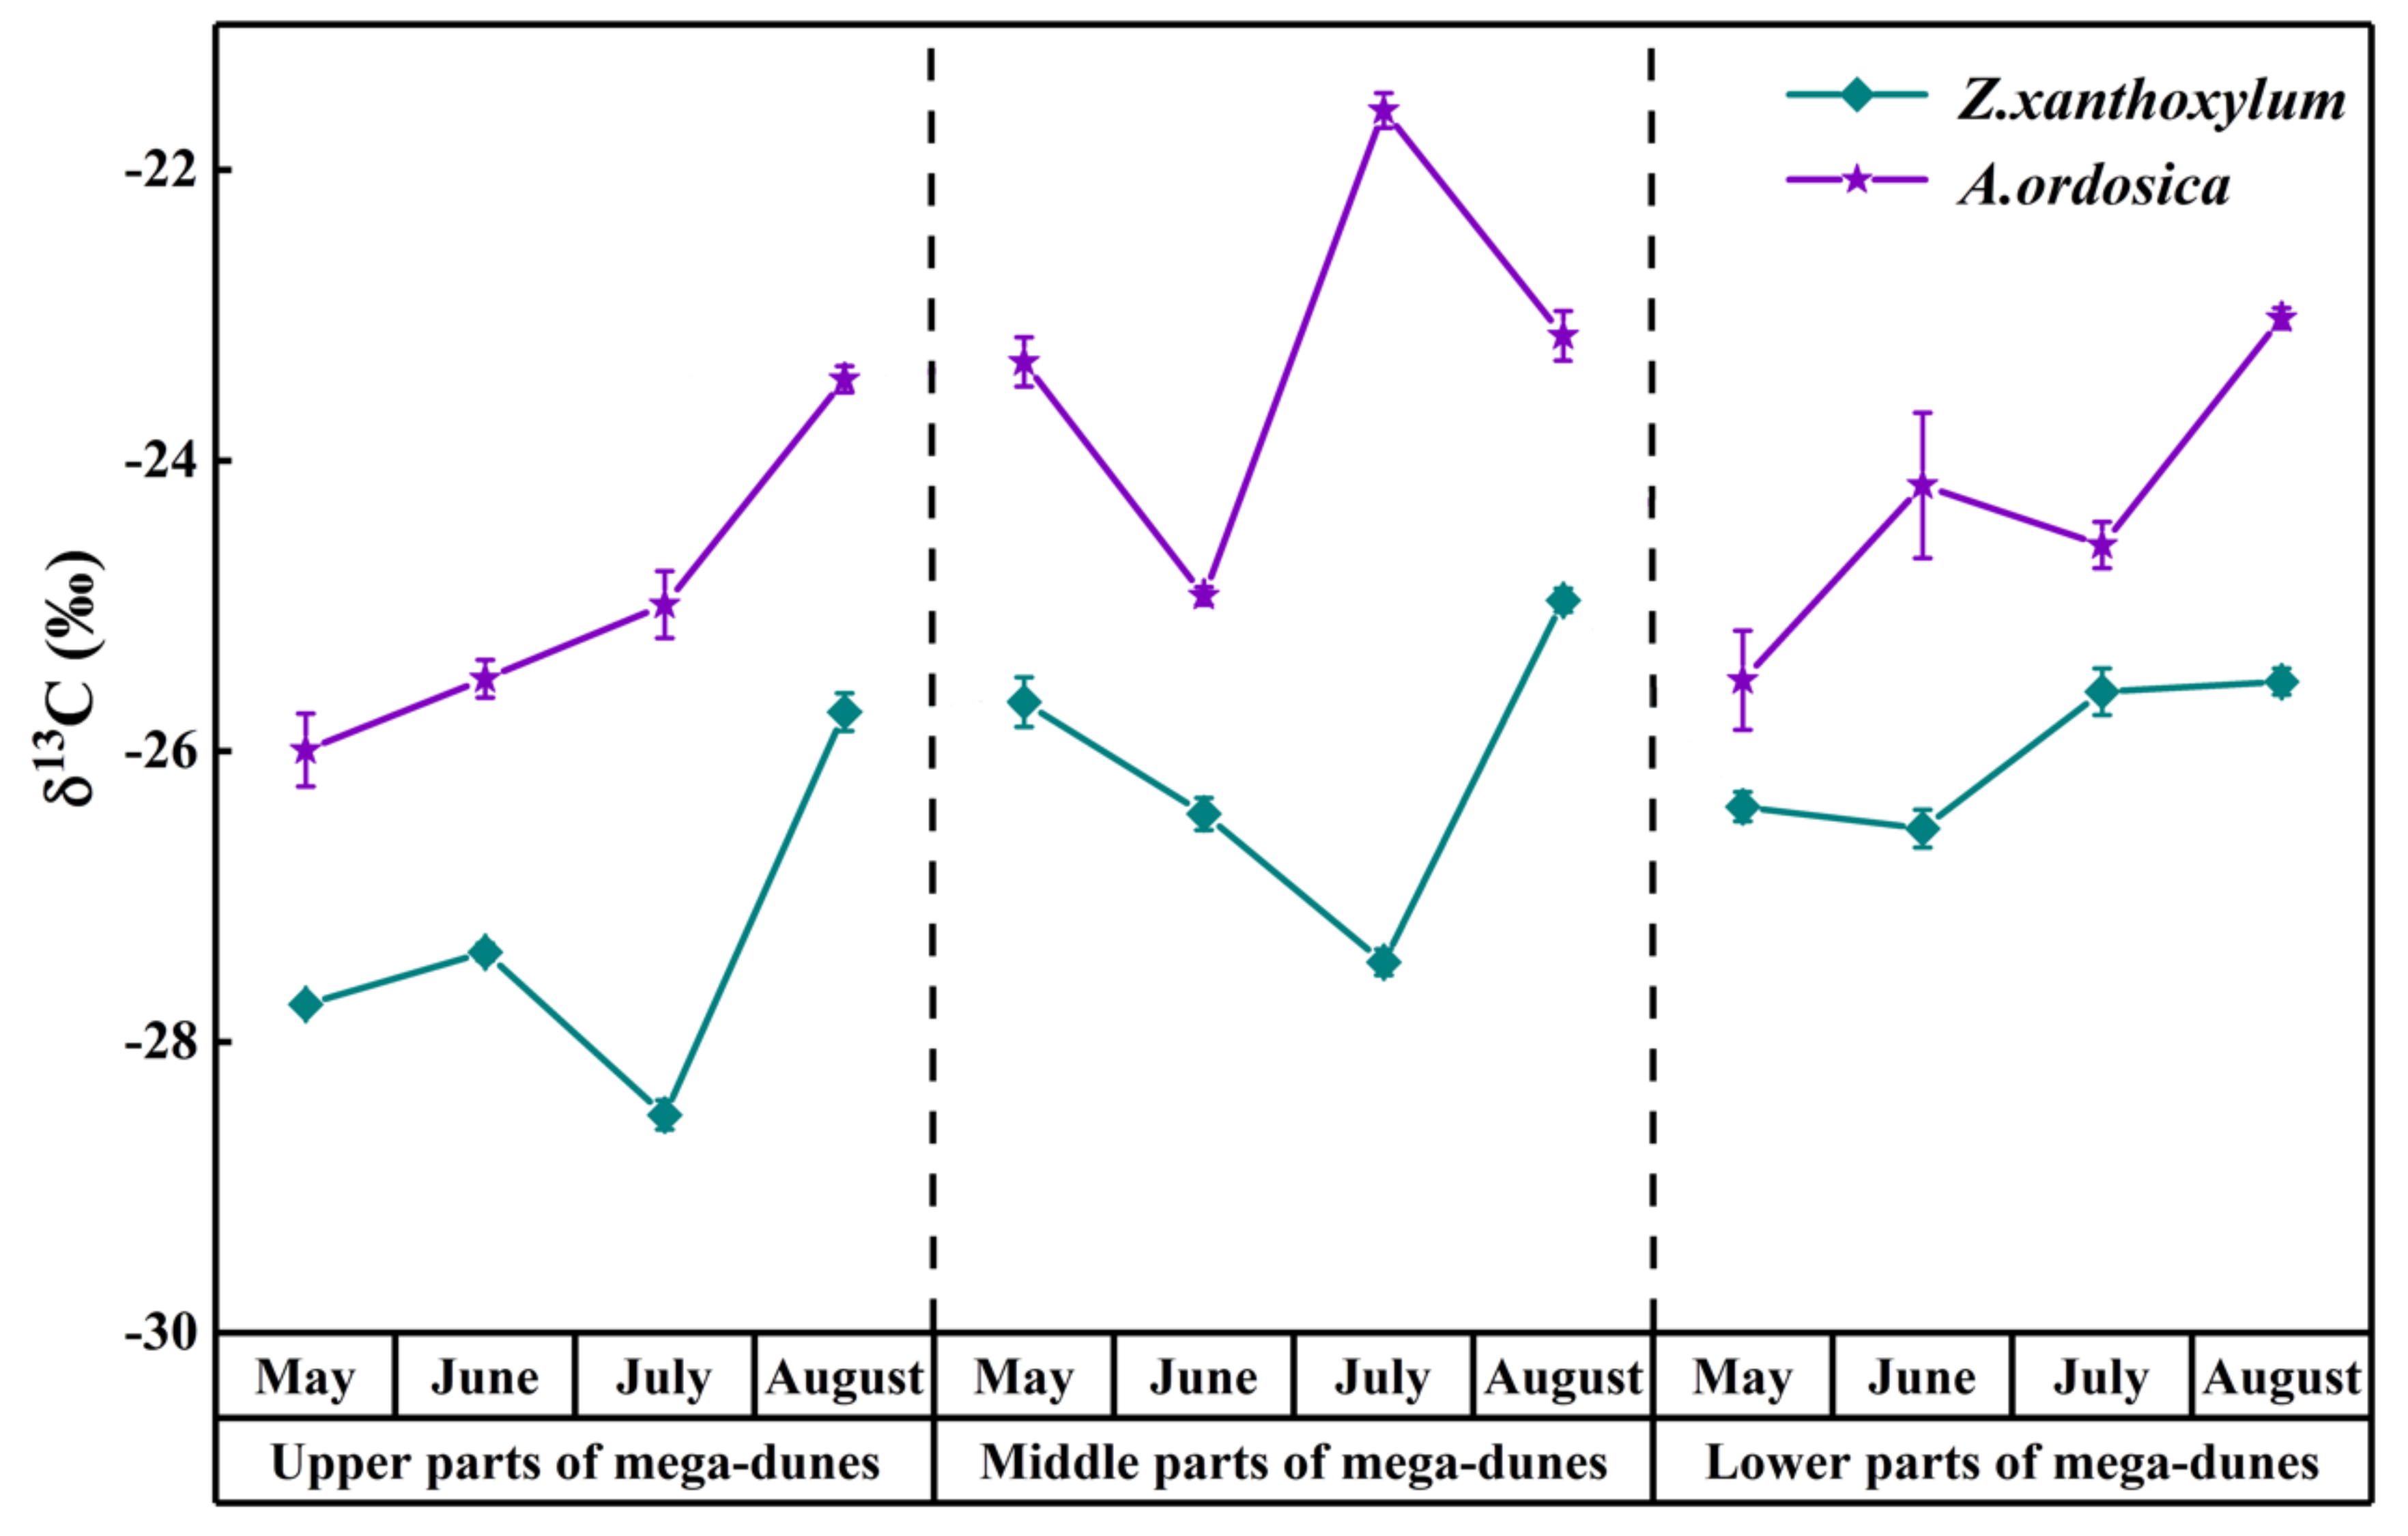
The leaf δ13C values of Z. xanthoxylum ranged from −28.50‰ to −24.96‰, with an average value of −26.49 ± 0.10‰. Z. xanthoxylum had the largest leaf δ13C value (−25.40 ± 0.30‰) in August, and the smallest value (−27.18 ± 0.33‰) in July (Figure 8). The leaf δ13C value of Z. xanthoxylum had distinct differences among months (p < 0.01) and positions on the mega-dunes (p < 0.001). The leaf δ13C value of A. ordosica ranged from −25.99‰ to −21.59‰, with an average value of −24.18 ± 0.19‰. The leaf δ13C values of A. ordosica, from May to August, were −24.94 ± 0.82‰, −24.87 ± 0.73‰, −23.72 ± 0.19‰ and −23.20 ± 0.38‰, respectively, revealing an increasing trend over time (Figure 6). There were significant differences in the leaf δ13C values of A. ordosica among months (p < 0.05) and positions on the mega-dunes (p < 0.01). Furthermore, the leaf δ13C values of Z. xanthoxylum and A. ordosica were significantly different (p < 0.001).
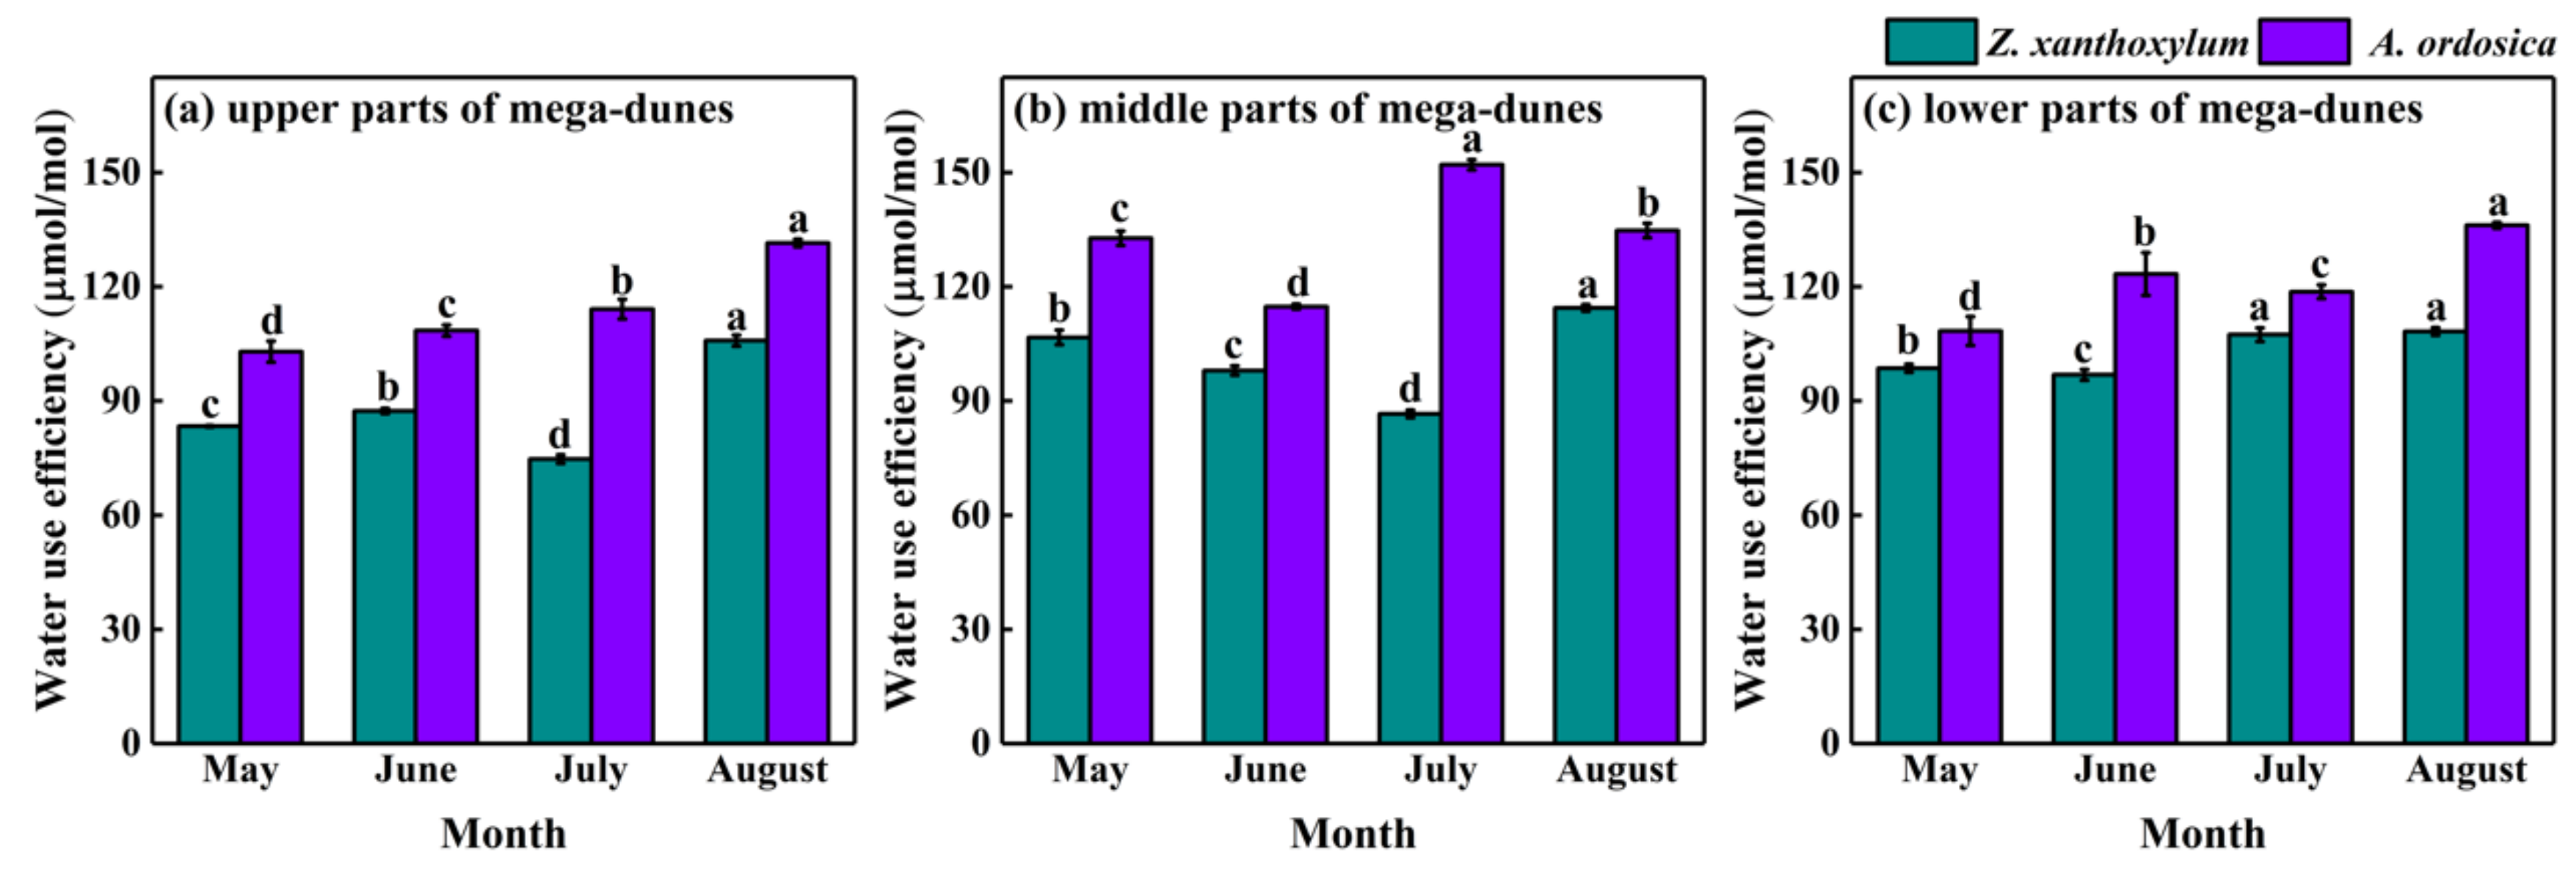
With leaf δ13C values of plants, long-term water use efficiency can be obtained through the use of a formula as the same trend exists for water use efficiency and leaf δ13C values. The water use efficiency of Z. xanthoxylum had a mean value of 97.36 ± 1.16 μmol/mol, ranging from 74.76 μmol/mol to 114.45 μmol/mol. The water use efficiency of A. ordosica had a mean value of 123.17 ± 2.13 μmol/mol, ranging from 102.96 μmol/mol to 152.07 μmol/mol (Figure 9). There were significant differences in the water use efficiency of both Z. xanthoxylum and A. ordosica among months (p < 0.05) and positions on the mega-dunes p < 0.01). The differences in the water use efficiency between Z. xanthoxylum and A. ordosica are pronounced (p < 0.001).
4. Discussion
4.1. Variations in Soil Water Content and Soil Water Isotopic Signatures
The soil water content in this study was generally low, with an average value of less than 3.0% (Figure 3). This is mainly due to the low precipitation and the strong evaporation in this area (the evaporation is 40 to 80 times the precipitation). Otherwise, the water use patterns of desert plants determine to a certain extent the response of the ecosystem to changes in soil water conditions [12]. The long-term absorption and utilization of soil water by plants may also cause the reduction of soil water content. Strong wind-sand activity is also an important factor. The soil profiles excavated in this study were usually covered with layer of dry sand about 1 m thick, in which the soil water content was basically 0%, and water extraction could not be performed. The stability of soil water content between different soil layers was different, and the temporal change rate of soil water content in shallow and middle layers was higher than that in deep soil layers. This phenomenon is consistent with many previous studies [32,33] and is mainly related to the depth of rainfall infiltration, the intensity of soil evaporation and the depth of water absorption by plants [34].
The isotopic signatures are also mainly affected by the processes of evaporation and infiltration, mixing the original soil water and various “initial” water sources [2]. The shallow soil water is more enriched in isotopes and unstable due to more intense evaporation and unstable precipitation replenishment, while the deep soil water has weaker evaporation and is recharged by stable phreatic water at the lower interface, which lead to more negative and stable isotopic signatures. The δD of precipitation near Bataan Lake ranged from −227‰ to −20‰, while the δ18O ranged from −28.5‰ to −1.3‰ [35]. Compared with the soil water isotope in this study, it was found that precipitation has a certain degree of replenishment to shallow soil water. According to the analysis in Figure 4, it was founded that groundwater (phreatic water) may recharge the soil water, indicating that there was strong water movement in the sand layers of mega-dunes.
4.2. Differences in Water Use Patterns
The distribution characteristics of roots—the water-absorbing end of plants—are closely related to the sources or the soil layers from which water is absorbed [12,36,37]. Many previous excavation studies on desert plants have demonstrated that the roots of perennials continuously appear throughout all soil layers that may be recharged once a year, and a few plants actually penetrate the groundwater table [8,10,38], but the most active water-absorbing fine roots were mainly found in deep soils [39]. The water absorption layers of the two studied species typical of the mega-dunes of the Badain Jaran Desert are also mainly determined by the distribution of their roots. Z. xanthoxylum has a deep root system that can extend to about 2 m below the dry sand layer so that it can evenly use soil moisture from depths of 0–240 cm. This finding is different to the results of Zhang et al. [40] and Chen et al. [41] regarding the water absorption layer (20–60 cm) of Z. xanthoxylum in the West Ordos Desert, which may be related to the adaption of plant roots to different habitats: the vertical distribution depth of the root system of Z. xanthoxylum in the mega-dunes of the Badain Jaran Desert—where the habitat is more arid—is deeper than in the West Ordos Desert. Therefore, it can be concluded that differences in habitat affect the water sources of Z. xanthoxylum. Plants can flexibly adjust their root distribution and other morphological characteristics according to habitat conditions and present the best phenotypes in various habitats [42]. However, the two abovementioned studies on the water use strategy of Z. xanthoxylum proposed that it simultaneously uses shallow and deep soil water, which is basically consistent with the conclusions of our study. The root system of A. ordosica is mainly distributed around 0–100 cm, so it mainly absorbs and utilizes soil water from the 0–60 cm layer, indicating that it is not the entire root system of plants that absorb water, but the active root system—distributed in the layer containing effective water—which can continuously absorb water from soil for plant growth and use [43]. Huang et al. [44] analyzed the water source of A. ordosica in the Tengger Desert and found that it mainly utilizes water in the upper layer (10–100 cm) of soil, and mainly uses shallow soil water in the dry season. Fu et al. [45] studied the water source of A. ordosica in the Mu Us sandy land and found that—while it can use soil moisture from the 0–140 cm soil layer—the water uptake proportion of the 0–60 cm soil layer was distinctly higher than that of the 60–140 cm layer. The results of these quantitative analyses on the of the water source of A. ordosica are basically consistent with our study. Therefore, it can be concluded that the root genetic characteristics of A. ordosica primarily determine its water sources in similar habitats.
Many scholars believe that plants in arid areas can flexibly use various water sources due to the dimorphism of their roots and the obvious seasonal changes in water sources of such plants [46,47,48,49]. Plants that continue to draw water from shallow soils may struggle to survive extreme drought conditions [12]. The water sources of the two plants in our study did not exhibit a uniform pattern of variation across the months they were studied. However, the two plants preferred to use more soil water from a relatively deep level, in terms of their own water range, in the middle of the growing season when their water demand was large, or the water condition was poor: Z. xanthoxylum significantly increased its use of soil water from the 180–240 cm soil layer, while A. ordosica used more water from the 30–90 cm soil layer. This may be because the Badain Jaran Desert experienced long-term drought in the winter and spring of this year, and precipitation occurred in May; however, these precipitation events were relatively small (less than 3 mm in a single event) and could not penetrate into the middle or deep soil [50]. Therefore, only the shallow or superficial moisture of the sand layer was replenished, and the plant roots distributed in this layer were stimulated to quickly absorb water. The temperature gradually increased in June and July while the precipitation was less than that of May, which made the shallow soil moisture evaporate quickly and prevented it from being recharged effectively (the precipitation reached the sand layer and quickly evaporated within a few hours). The water demand for plant growth at this time gradually increases, so plants could only switch to using more of the stable moisture from the middle and deep soil layers. This is a unique water utilization strategy for xerophyte survival in extreme environments.
Due to the dry climate of the Badain Jaran Desert, condensation, in addition to soil water, may play an important role in the growth and development of plants. Gong et al. [51] found that many plant leaves in arid areas can directly absorb condensation water and increase leaf water potential, thereby reducing the water deficit of plants. Hill et al. [52] analyzed the water sources of three xerophytes in the Negev Desert in Israel and found that the condensed water absorbed and used by plants accounted for more than 50% of their total water. In this study, only a small number of condensed water samples were collected, which led to the failure to analyze the relationship between condensed water and plant water. In future studies, the method of collecting condensed water samples should be optimized, and as many condensed water samples as possible should be collected to accurately and quantitatively analyze the contribution of condensed water to plant water.
4.3. Differences in Water Use Efficiency
Plant water use efficiency is an important index that couples leaf photosynthesis and water physiological processes, and can effectively evaluate the suitability of plant growth [15,16]. The normal physiological activity and growth of plants required high water use efficiency to be guaranteed in an extremely water-deficient desert ecosystem [12,30]. Previous studies have shown that plants in a water limited environment have higher water use efficiency that plants in an environment with sufficient water supply [14,53]. The average δ13C values of Z. xanthoxylum and A. ordosica in our study were larger than those of global plants (C3 plants), which is consistent with the conclusion that plants have relatively higher water efficiency in arid regions [53]. The water use efficiency of A. ordosica is higher than Z. xanthoxylum (Figure 7), which is mainly related to the genetic characteristics of the plant itself. In addition, the root distribution characteristics of the two plants are different, and the soil layers that they absorb water are different, resulting in differences in the degree of difficulty in obtaining water. Plants with higher water use efficiency are more advantageous in water-deficient habitats. The higher water use efficiency of A. ordosica also effectively explains its widespread distribution in the Badain Jaran Desert.
Plant water use efficiency is affected by many factors, including plant species, growth stage, plant internal factors (photosynthetic organ structure, leaf water potential, stomata, etc.) and external environmental factors (light, moisture, carbon dioxide concentration, air temperature, leaf temperature, etc.). In addition to the differences in species and soil water content, the spatial variations of plant water use efficiency in mega-dunes may also be related to the soil texture of mega-dunes, which has a strong correlation with the degree of water availability. In a water-restricted environment, in addition to flexible use of water sources and higher water use efficiency, plants adjusted their water use characteristics through morphological adaptation, stomatal regulation mechanism, osmotic regulation mechanism, antioxidant defense regulation mechanism, and hormone regulation mechanism.
4.4. Interaction between Different Plants in the Community
Plants that continue to use shallow or deep soil water for a long time may cause soil desiccation and degradation of ecosystem services [12,54]. Different plants that grow in the same habitat will usually absorb and utilize soil moisture from different depths [55,56], which is also reflected in our study. Z. xanthoxylum absorbed most of its water (86.5%) from below 90 cm soil layers, while A. ordosica derived most of its water (79.90%) from 0~120 soil layers. As a result, the limited soil moisture can be utilized to the maximum to meet the water demand of the community. In addition, there are perennial herbaceous plants in this habitat whose water absorption layer is about 0–60 cm, which overlaps with the water use layer of A. ordosica, indicating that there is a certain water competition relationship between them. Additionally, although the root system of A. ordosica is relatively shallower than that of Z. xanthoxylum, the analysis of water sources revealed that A. ordosica also absorbs a small or very small amount of soil water below 150 cm that its root system cannot reach. This phenomenon may be related to the water-lifting effect of Z. xanthoxylum’s root system [57]: the deep soil water absorbed by Z. xanthoxylum’s root system is released in relatively shallow soil and used by A. ordosica. This indicates that a variety of plants may have both a competitive and a mutually beneficial symbiotic relationship in extremely arid habitats.
The plants water use characteristics are an important basis for species selection in desert vegetation restoration or reconstruction. The amount of water sources should be considered. If the utilization of soil moisture and groundwater is not enough to maintain the normal growth of communities in this area, this may lead to a large area of vegetation degradation [58]. When selecting species, it is necessary to comprehensively consider the amount of available water resources in the area and the water use characteristics of various plants to determine the most suitable community type.
5. Conclusions
To better understand the water use characteristics of the two dominate species of the mega-dunes of the Badain Jaran Desert—Z. xanthoxylum and A. ordosica—we measured the δ2H and δ18O of plant xylem and soil water from various layers up to 240 cm under the dry sand layer and, in combination with the Iso-source model, analyzed plant water sources and the δ13C of plant leaves to explore the interspecific differences in leaf-level WUE. The Iso-source model predicted that Z. xanthoxylum derived most of its water (86.5%) from soil layers below 90 cm, while A. ordosica derived most of its water (79.90%) from the 0–120 cm soil layers during growing seasons. The leaf δ13C implied that the long-term leaf-level water use efficiency of A. ordosica is higher than that of Z. xanthoxylum during growing seasons. These results suggest that A. ordosica is more suitable for survival in this habitat. This indicates that A. ordosica can be selected as a sand-fixing plant for vegetation restoration and construction in sandy soil habitats with sparse rainfall and deep groundwater levels. Moreover, there existed both a competitive and a mutually beneficial symbiotic relationship between a variety of plants from the same arid habitat. This study reveals the water use mechanism of plants on mega-dunes far from the groundwater level and provides a theoretical basis to assist in the selection of species for artificial vegetation restoration in arid areas. In addition, condensation water plays a potential role in the growth and development of plants, which will be the subject of research in the future.
Author Contributions
J.Q.: Conceptualization, Data curation, Investigation, Methodology, Formal analysis, Roles/Writing—original draft, Writing—review & editing; J.S.: Conceptualization, Data curation, Formal analysis, Funding acquisition, Methodology; B.J.: Investigation; C.Z.: Conceptualization, Data curation, Formal analysis, Investigation; D.Z.: Investigation; X.H.: Investigation; C.W.: Investigation; X.Z.: Investigation. All authors have read and agreed to the published version of the manuscript.
Funding
This study was supported by the Major Science and Technology Project in Inner Mongolia Autonomous region of China (No. Zdzx2018057), the Innovation Cross Team Project of Chinese Academy of Sciences, CAS (No. JCTD-2019-19), Transformation Projects of Scientific and Technological Achievements in Inner Mongolia Autonomous region of China (No. 2021CG0046), and the National Natural Science Foundation of China (No. 42001038).
Institutional Review Board Statement
Not applicable.
Informed Consent Statement
Not applicable.
Data Availability Statement
The data that support the findings of this study are available from the corresponding author on reasonal request.
Acknowledgments
We greatly appreciate suggestions from anonymous referees for the improvement of our paper. Thanks also to the editorial staff.
Conflicts of Interest
The authors declare that they have no known competing financial interests or personal relationships that could have appeared to influence the work reported in this paper.
References
- Fay, P.A.; Carlisle, J.D.; Knapp, A.K.; Blair, J.M.; Collins, S.L. Productivity responses to altered rainfall patterns in a C4-dominated grassland. Oecologia 2003, 137, 245–251. [Google Scholar] [CrossRef]
- Zhao, L.J.; Wang, X.G.; Zhang, Y.C.; Xie, C.; Liu, Q.Y.; Meng, F. Plant water use strategies in the Shapotou artificial sand-fixed vegetation of the southeastern margin of the Tengger Desert, northwestern China. J. Mt. Sci. 2019, 16, 898–908. [Google Scholar] [CrossRef]
- Liu, Y.; Fu, B.J.; Lü, Y.H.; Gao, G.Y.; Wang, S.; Zhou, J. Linking vegetation cover patterns to hydrological responses using two process-based pattern indices at the plot scale. Sci. China-Earth Sci. 2013, 56, 1888–1898. [Google Scholar] [CrossRef] [Green Version]
- Hao, X.M.; Chen, Y.N.; Li, W.H.; Guo, B.; Zhao, R.F. Hydraulic lift in Populus euphratica Oliv. from the desert riparian vegetation of the Tarim River Basin. J. Arid. Environ. 2010, 74, 905–911. [Google Scholar] [CrossRef]
- Wu, X.; Zheng, X.J.; Yin, X.W.; Yue, Y.M.; Liu, R.; Xu, G.Q.; Li, Y. Seasonal variation in the groundwater dependency of two dominant woody species in a desert region of Central Asia. Plant Soil 2019, 444, 39–55. [Google Scholar] [CrossRef]
- Kolb, T.; Hart, S.; Amundson, R. Boxelder water source and physiology at perennial and ephemeral stream sites in Arizona. Tree Physiol. 1997, 17, 151–160. [Google Scholar] [CrossRef]
- Jacobs, A.F.G.; Heusinkveld, B.G.; Berkowicz, S.M. A simple model for potential dewfall in an arid region. Atmos. Res. 2002, 64, 285–295. [Google Scholar] [CrossRef]
- Cannon, W.A. The Root Habits of Desert Plants; Carnegie Inst of Washington Publ: Washington, DC, USA, 1911; p. 96. [Google Scholar]
- Nie, Y.P.; Chen, H.S.; Wang, K.L. Methods for determining plant water source in thin soil region: A review. Chin. J. Appl. Ecol. 2010, 21, 2427–2433. [Google Scholar]
- Ehleringer, J.R.; Phillips, S.L.; Schuster, W.S.F.; Sandquist, D.R. Differential utilization of summer rains by desert plants. Oecologia 1991, 88, 430–434. [Google Scholar] [CrossRef]
- Zhao, L.J.; Wang, L.X.; Cernusak, L.A.; Liu, X.H.; Xiao, H.L.; Zhou, M.X.; Zhang, S.Q. Significant difference in hydrogen isotope composition between xylem and tissue water in Populus euphratica. Plant Cell Environ. 2016, 39, 1848–1857. [Google Scholar] [CrossRef] [PubMed] [Green Version]
- Wang, J.; Fu, B.J.; Lu, N.; Wang, S.; Zhang, L. Water use characteristics of native and exotic shrub species in the semi-arid Loess Plateau using an isotope technique. Agric. Ecosyst. Environ. 2019, 276, 55–63. [Google Scholar] [CrossRef]
- Wang, J.; Fu, B.J.; Lu, N.; Zhang, L. Seasonal variation in water uptake patterns of three plant species based on stable isotopes in the semi-arid Loess Plateau. Sci. Total Environ. 2017, 609, 27–37. [Google Scholar] [CrossRef] [PubMed]
- Gries, D.; Zeng, F.; Foetzki, A.; Arndt, S.K.; Bruelheide, H.; Thomas, F.M.; Zhang, X.; Runge, M. Growth and water relations of Tamarix ramosissima and Populus euphratica on Taklamakan desert dunes in relation to depth to a permanent water table. Plant Cell Environ. 2003, 26, 725–736. [Google Scholar] [CrossRef] [Green Version]
- Gao, Y.; Markkanen, T.; Aurela, M.; Mammarella, I.; Thum, T.; Tsuruta, A.; Yang, H.; Aalto, T. Response of water use efficiency to summer drought in a boreal Scots pine forest in Finland. Biogeosciences 2017, 14, 4409–4422. [Google Scholar] [CrossRef] [Green Version]
- Lavergne, A.; Graven, H.; De Kauwe, M.G.; Keenan, T.F.; Medlyn, B.E.; Prentice, I.C. Observed and modelled historical trends in the water-use efficiency of plants and ecosystems. Glob. Change Biol. 2019, 25, 2242–2257. [Google Scholar] [CrossRef] [PubMed] [Green Version]
- Medrano, H.; Tomás, M.; Martorell, S.; Flexas, J.; Hernández, E.; Rosselló, J.; Pou, A.; Escalona, J.M.; Bota, J. From leaf to whole-plant water use efficiency (WUE) in complex canopies: Limitations of leaf WUE as a selection target. Crop J. 2015, 3, 220–228. [Google Scholar] [CrossRef] [Green Version]
- Ehleringer, J.R.; Cooper, T.A. Correlations between carbon isotope ratio and microhabitat in desert plants. Oecologia 1988, 76, 562–566. [Google Scholar] [CrossRef]
- Ebdon, J.S.; Petrovic, A.M.; Dawson, T.E. Relationship between carbon isotope discrimination, water use efficiency, and evapotranspiration in Kentucky Bluegrass. Crop Sci. 1998, 38, 157–162. [Google Scholar] [CrossRef]
- Zhu, J.F.; Wang, N.A.; Chen, H.B.; Dong, C.Y.; Zhang, H.A. Study on the boundary and the area of Badain Jaran Desert based on remote sensing imagery. Prog. Geogr. 2010, 29, 1087–1094. [Google Scholar]
- Ma, N.; Wang, N.A.; Zhu, J.F.; Chen, X.L.; Chen, H.B.; Dong, C.Y. Climate change around the Badain Jaran Desert in recent 50 years. J. Desert Res. 2011, 31, 1541–1547. [Google Scholar]
- Qin, J.; Si, J.H.; Jia, B.; Zhao, C.Y.; Li, D.; Luo, H.; Ren, L.X. Study on the relationship between vegetation community characteristics and soil moisture in Badain Jaran Desert. Arid. Zone Res. 2021, 38, 207–222. [Google Scholar]
- Zhang, J.; Wang, X.S.; Hu, X.N.; Lu, H.T.; Gong, Y.P.; Wan, L. The macro-characteristics of Groundwater flow in the Badain Jaran Desert. J. Desert Res. 2015, 35, 774–782. [Google Scholar]
- Querejeta, J.I.; Estrada-Medina, H.; Allen, M.F.; Jiménez-Osornio, J.J. Water source partitioning among trees growing on shallow karst soils in a seasonally dry tropical climate. Oecologia 2007, 152, 26–36. [Google Scholar] [CrossRef]
- Ehleringer, J.R.; Roden, J.; Dawson, T.E. Assessing Ecosystem-Level Water Relations through Stable Isotope Ratio Analyses. In Methods in Ecosystem Science; Springer: New York, NY, USA, 2000; pp. 181–198. [Google Scholar]
- West, A.G.; Patrickson, S.J.; Ehleringer, J.R. Water extraction times for plant and soil materials used in stable isotope analysis. Rapid Commun. Mass Spectrom. 2006, 20, 1317–1321. [Google Scholar] [CrossRef]
- West, J.B.; Bowen, G.J.; Cerling, T.E.; Ehleringer, J.R. Stable isotopes as one of nature’s ecological recorders. Trends Ecol. Evol. 2006, 21, 408–414. [Google Scholar] [CrossRef] [PubMed]
- Ellsworth, P.Z.; Williams, D.G. Hydrogen isotope fractionation during water uptake by woody xerophytes. Plant Soil 2007, 291, 93–107. [Google Scholar] [CrossRef]
- Phillips, D.L.; Gregg, J.W. Source partitioning using stable isotopes: Coping with too many sources. Oecologia 2003, 136, 261–269. [Google Scholar] [CrossRef] [PubMed]
- Farquhar, G.D.; O’Leary, M.H.; Berry, J.A. On the relationship between carbon isotope discrimination and the intercellular carbon dioxide concentration in leaves. Aust. J. Plant Physiol. 1982, 9, 281–292. [Google Scholar] [CrossRef]
- Chen, L.; Wang, N.A.; Wang, H.; Dong, C.Y.; Lu, Y.; Lu, J.W. Spatial patterns of chemical parameters of lakes and groundwater in Badain Jaran Desert. J. Desert Res. 2012, 32, 531–538. [Google Scholar]
- Penna, D.; Brocca, L.; Borga, M.; Dalla, F.G. Soil moisture temporal stability at different depths on two alpine hillslopes during wet and dry periods. J. Hydrol. 2013, 477, 55–71. [Google Scholar] [CrossRef]
- Yang, L.; Wei, W.; Chen, L.D.; Chen, W.L.; Wang, J.L. Response of temporal variation of soil moisture to vegetation restoration in semi-arid Loess Plateau, China. Catena 2014, 115, 123–133. [Google Scholar] [CrossRef]
- Seneviratne, S.I.; Corti, T.; Davin, E.L.; Hirschi, M.; Jaeger, E.B.; Lehner, I.; Orlowsky, B.; Teuling, A.J. Investigating soil moisture–climate interactions in a changing climate: A review. Earth-Sci. Rev. 2010, 99, 125–161. [Google Scholar] [CrossRef]
- Cao, L.; Shen, J.M.; Nie, Z.L.; Meng, L.Q.; Liu, M.; Wang, Z. Stable isotopic characteristics of precipitation and moisture recycling in Badain Jaran Desert. Earth Sci. 2021, 46, 2973–2983. [Google Scholar]
- Dawson, T.E.; Mambelli, S.; Plamboeck, A.H.; Templer, P.H.; Tu, K.P. Stable isotopes in plant ecology. Annu. Rev. Ecol. Syst. 2002, 33, 507–559. [Google Scholar] [CrossRef]
- Schenk, H.J. Soil depth, plant rooting strategies and species’ niches. New Phytol. 2008, 178, 223–225. [Google Scholar] [CrossRef] [PubMed]
- Manning, S.J.; Barbour, M.G. Root systems, spatial patterns, and competition for soil moisture between two desert subshrubs. Am. J. Bot. 1988, 75, 885–893. [Google Scholar] [CrossRef]
- Dawson, T.E.; Ehleringer, J.R. Streamside trees that do not use stream water. Nature 1991, 350, 335–337. [Google Scholar] [CrossRef]
- Zhang, Y.M.; Gao, R.H.; Jin, H. Studies on the ecological characteristics of four bushes roots in desert of West Erdos. J. Inn. Mong. Agric. Univ. 2005, 26, 39–43. [Google Scholar]
- Chen, J.; Xu, Q.; Gao, D.Q.; Ma, Y.B. Water use of Helianthemum songaricum and co-occurring plant species Sarcozygium xanthoxylum in Western Ordos. Sci. Silvae Sin. 2016, 52, 47–56. [Google Scholar]
- Zhou, H.; Zhao, W.Z.; He, Z.B. Water sources of Nitraria sibirica and response to precipitation in two desert habitats. Chin. J. Appl. Ecol. 2017, 28, 2083–2092. [Google Scholar]
- Donovan, L.A.; Ehleringer, J.R. Water stress and use of summer precipitation in a Great Basin shrub community. Funct. Ecol. 1994, 8, 289–297. [Google Scholar] [CrossRef]
- Huang, L.; Zhang, Z.S.; Li, X.R. Sap flow of Artemisia ordosica and the influence of environmental factors in a revegetated desert area: Tengger Desert, China. Hydrol. Processes 2010, 24, 1248–1253. [Google Scholar]
- Fu, X.; Wu, Y.S.; Zhang, Y.J. Analysis of water sources utilized by four shrubs during the growing season in the southern margin of Mu Us Sandy Land. J. Inn. Mong. Norm. Univ. 2020, 49, 245–250. [Google Scholar]
- Dawson, T.E.; Pate, J.S. Seasonal water uptake and movement in root systems of Australian phraeatophytic plants of dimorphic root morphology: A stable isotope investigation. Oecologia 1996, 107, 13–20. [Google Scholar] [CrossRef] [PubMed]
- Xi, B.Y.; Wang, Y.; Jia, L.M.; Bloomberg, M.; Li, G.D.; Di, N. Characteristics of fine root system and water uptake in a triploid Populus tomentosa plantation in the North China Plain: Implications for irrigation water management. Agric. Water Manag. 2013, 117, 83–92. [Google Scholar] [CrossRef]
- Xing, X.; Chen, H.; Zhu, J.J.; Chen, T.T. Water sources of five dominant desert plant species in Nuomuhong area of Qaidam Basin. Acta Ecol. Sin. 2014, 34, 6277–6286. [Google Scholar]
- Wang, J.; Zhang, R.; Yan, Y.T.; Dong, X.Q.; Li, J.M. Locating hazardous gas leaks in the atmosphere via modified genetic, MCMC and particle swarm optimization algorithms. Atmos. Environ. 2017, 157, 27–37. [Google Scholar] [CrossRef]
- Feng, Q.; Cheng, G.D. Moisture distribution and movement in sandy lands of China. Acta Pedol. Sin. 1999, 225–236. [Google Scholar]
- Gong, X.W.; Lü, G.H.; Ran, Q.Y.; Yang, X.D. Response of vegetative growth and biomass allocation of Lappula semiglabra seedlings to dew gradient. Chin. J. Appl. Ecol. 2016, 27, 2257–2263. [Google Scholar]
- Hill, A.J.; Dawson, T.E.; Shelef, O.; Rachmilevitch, S. The role of dew in Negev Desert plants. Oecologia 2015, 178, 317–327. [Google Scholar] [CrossRef] [PubMed]
- Wright, G.C.; Rao, R.C.; Farquhar, G.D. Water-use efficiency and carbon isotope discrimination in peanut under water deficit conditions. Crop Sci. 1994, 34, 92–97. [Google Scholar] [CrossRef]
- Chen, H.S.; Shao, M.G.; Li, Y.Y. Soil desiccation in the Loess Plateau of China. Geoderma 2008, 143, 91–100. [Google Scholar] [CrossRef]
- Noymeir, I. Desert ecosystems: Environment and producers. Annu. Rev. Ecol. Syst. 1973, 4, 25–51. [Google Scholar] [CrossRef]
- Darrouzet-Nardi, A.; D’ Antonio, C.M.; Dawson, T.E. Depth of water acquisition by invading shrubs and resident herbs in a Sierra Nevada meadow. Plant Soil 2006, 285, 31–43. [Google Scholar] [CrossRef]
- Wu, K.S. Study of Hydraulic Lift in Zygophyllum xanthoxylum of Eremophytes. Master’s Thesis, Lanzhou University, Lanzhou, China, 2010. [Google Scholar]
- Zhu, Y.J.; Jia, Z.Q. Water source of Haloxylon ammodendron plantations in autumn at the southeast edge of Badain Jaran Desert. Sci. Silvae Sin. 2012, 48, 1–5. [Google Scholar]
Figure 1.
Location of the study area and sampling points.
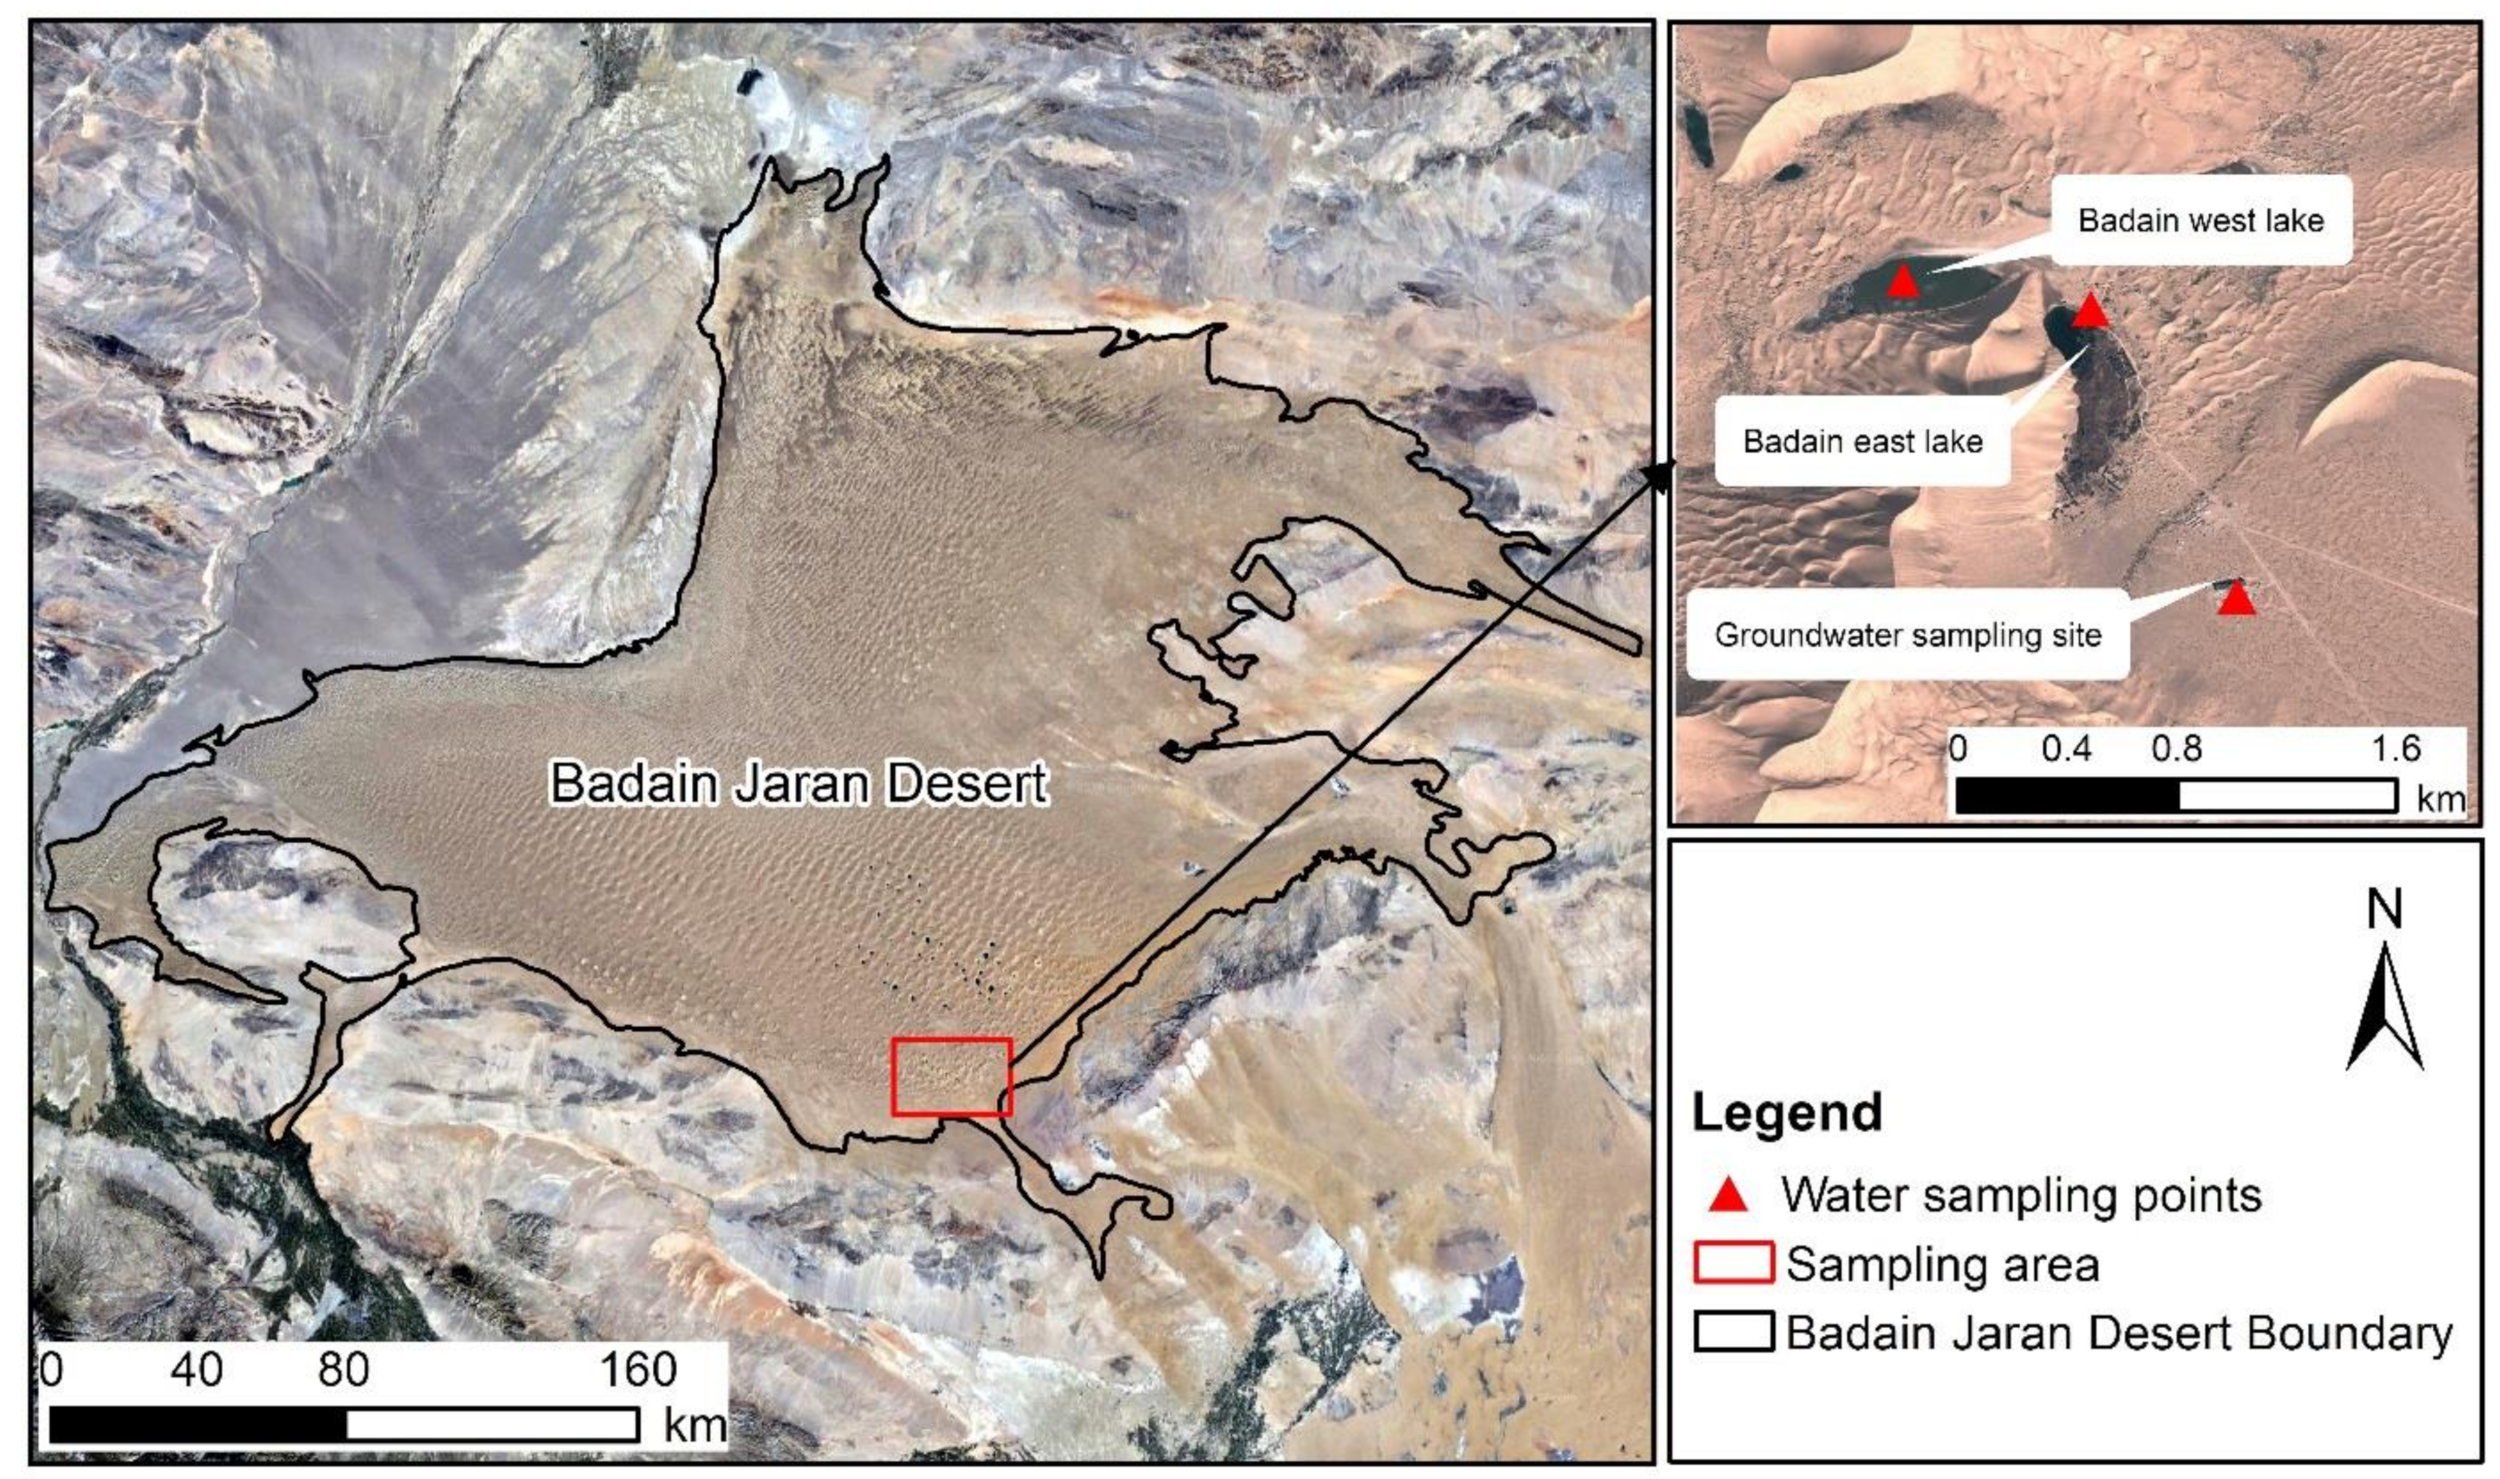
Figure 2.
Photographs of Zygophyllum xanthoxylum and Artemisia ordosica.
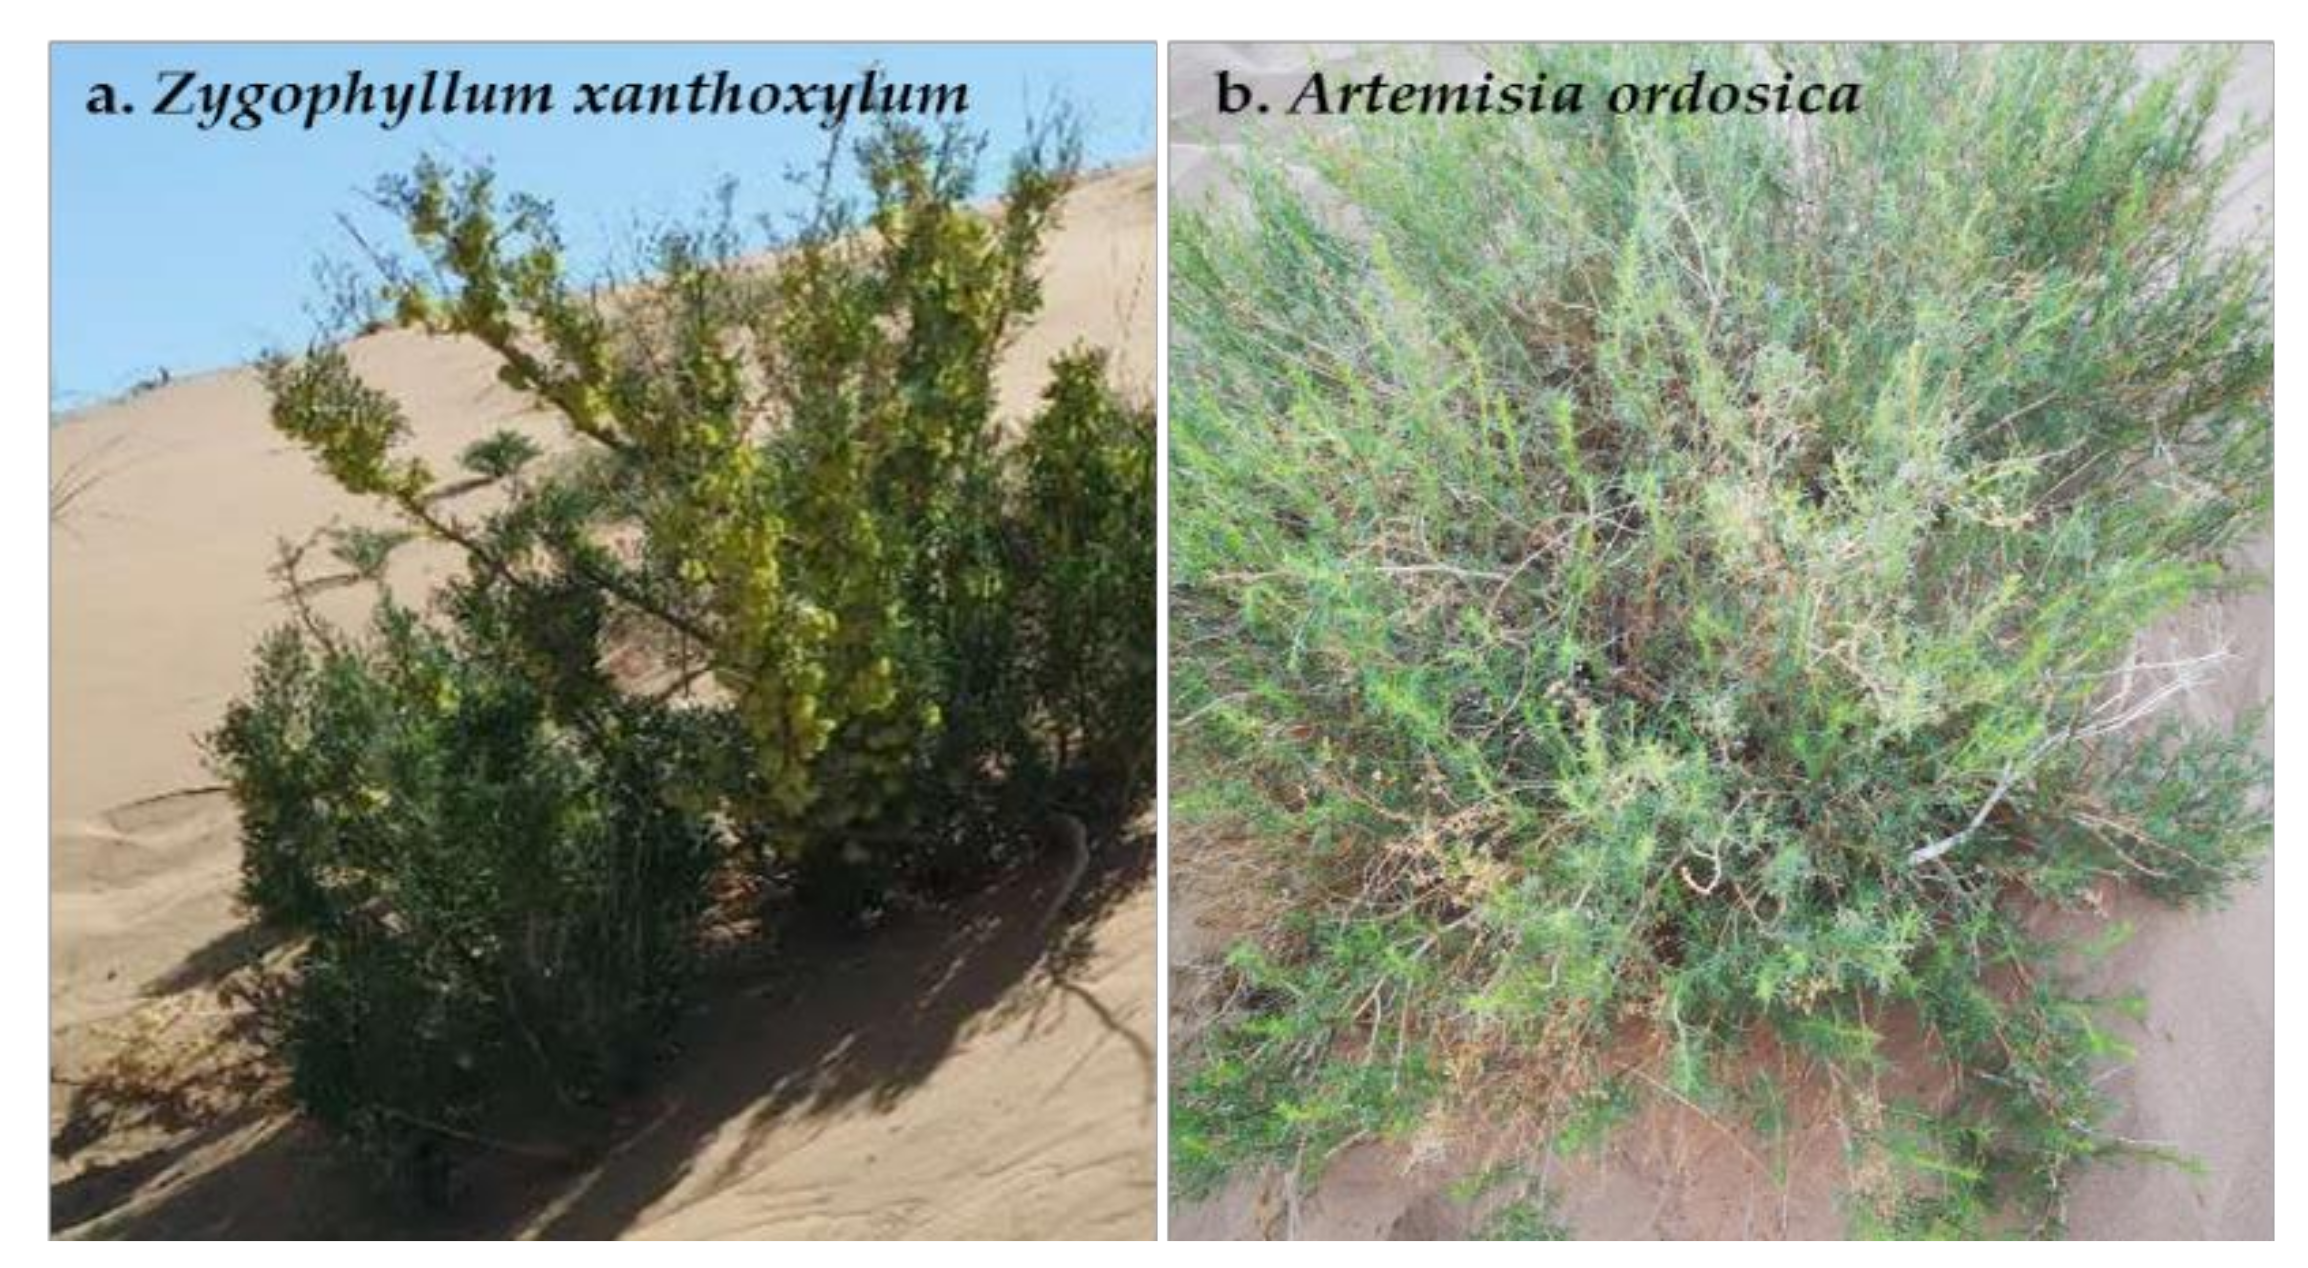
Figure 3.
Vertical distribution of gravimetric soil water content of mega-dunes in the Badain Jaran Desert. Data are expressed as means ± 1SD. Rows one to three present the soil water content of the upper, middle, and lower parts of mega-dunes, respectively. Columns one to four present the soil water content in May, June, July, and August, respectively.
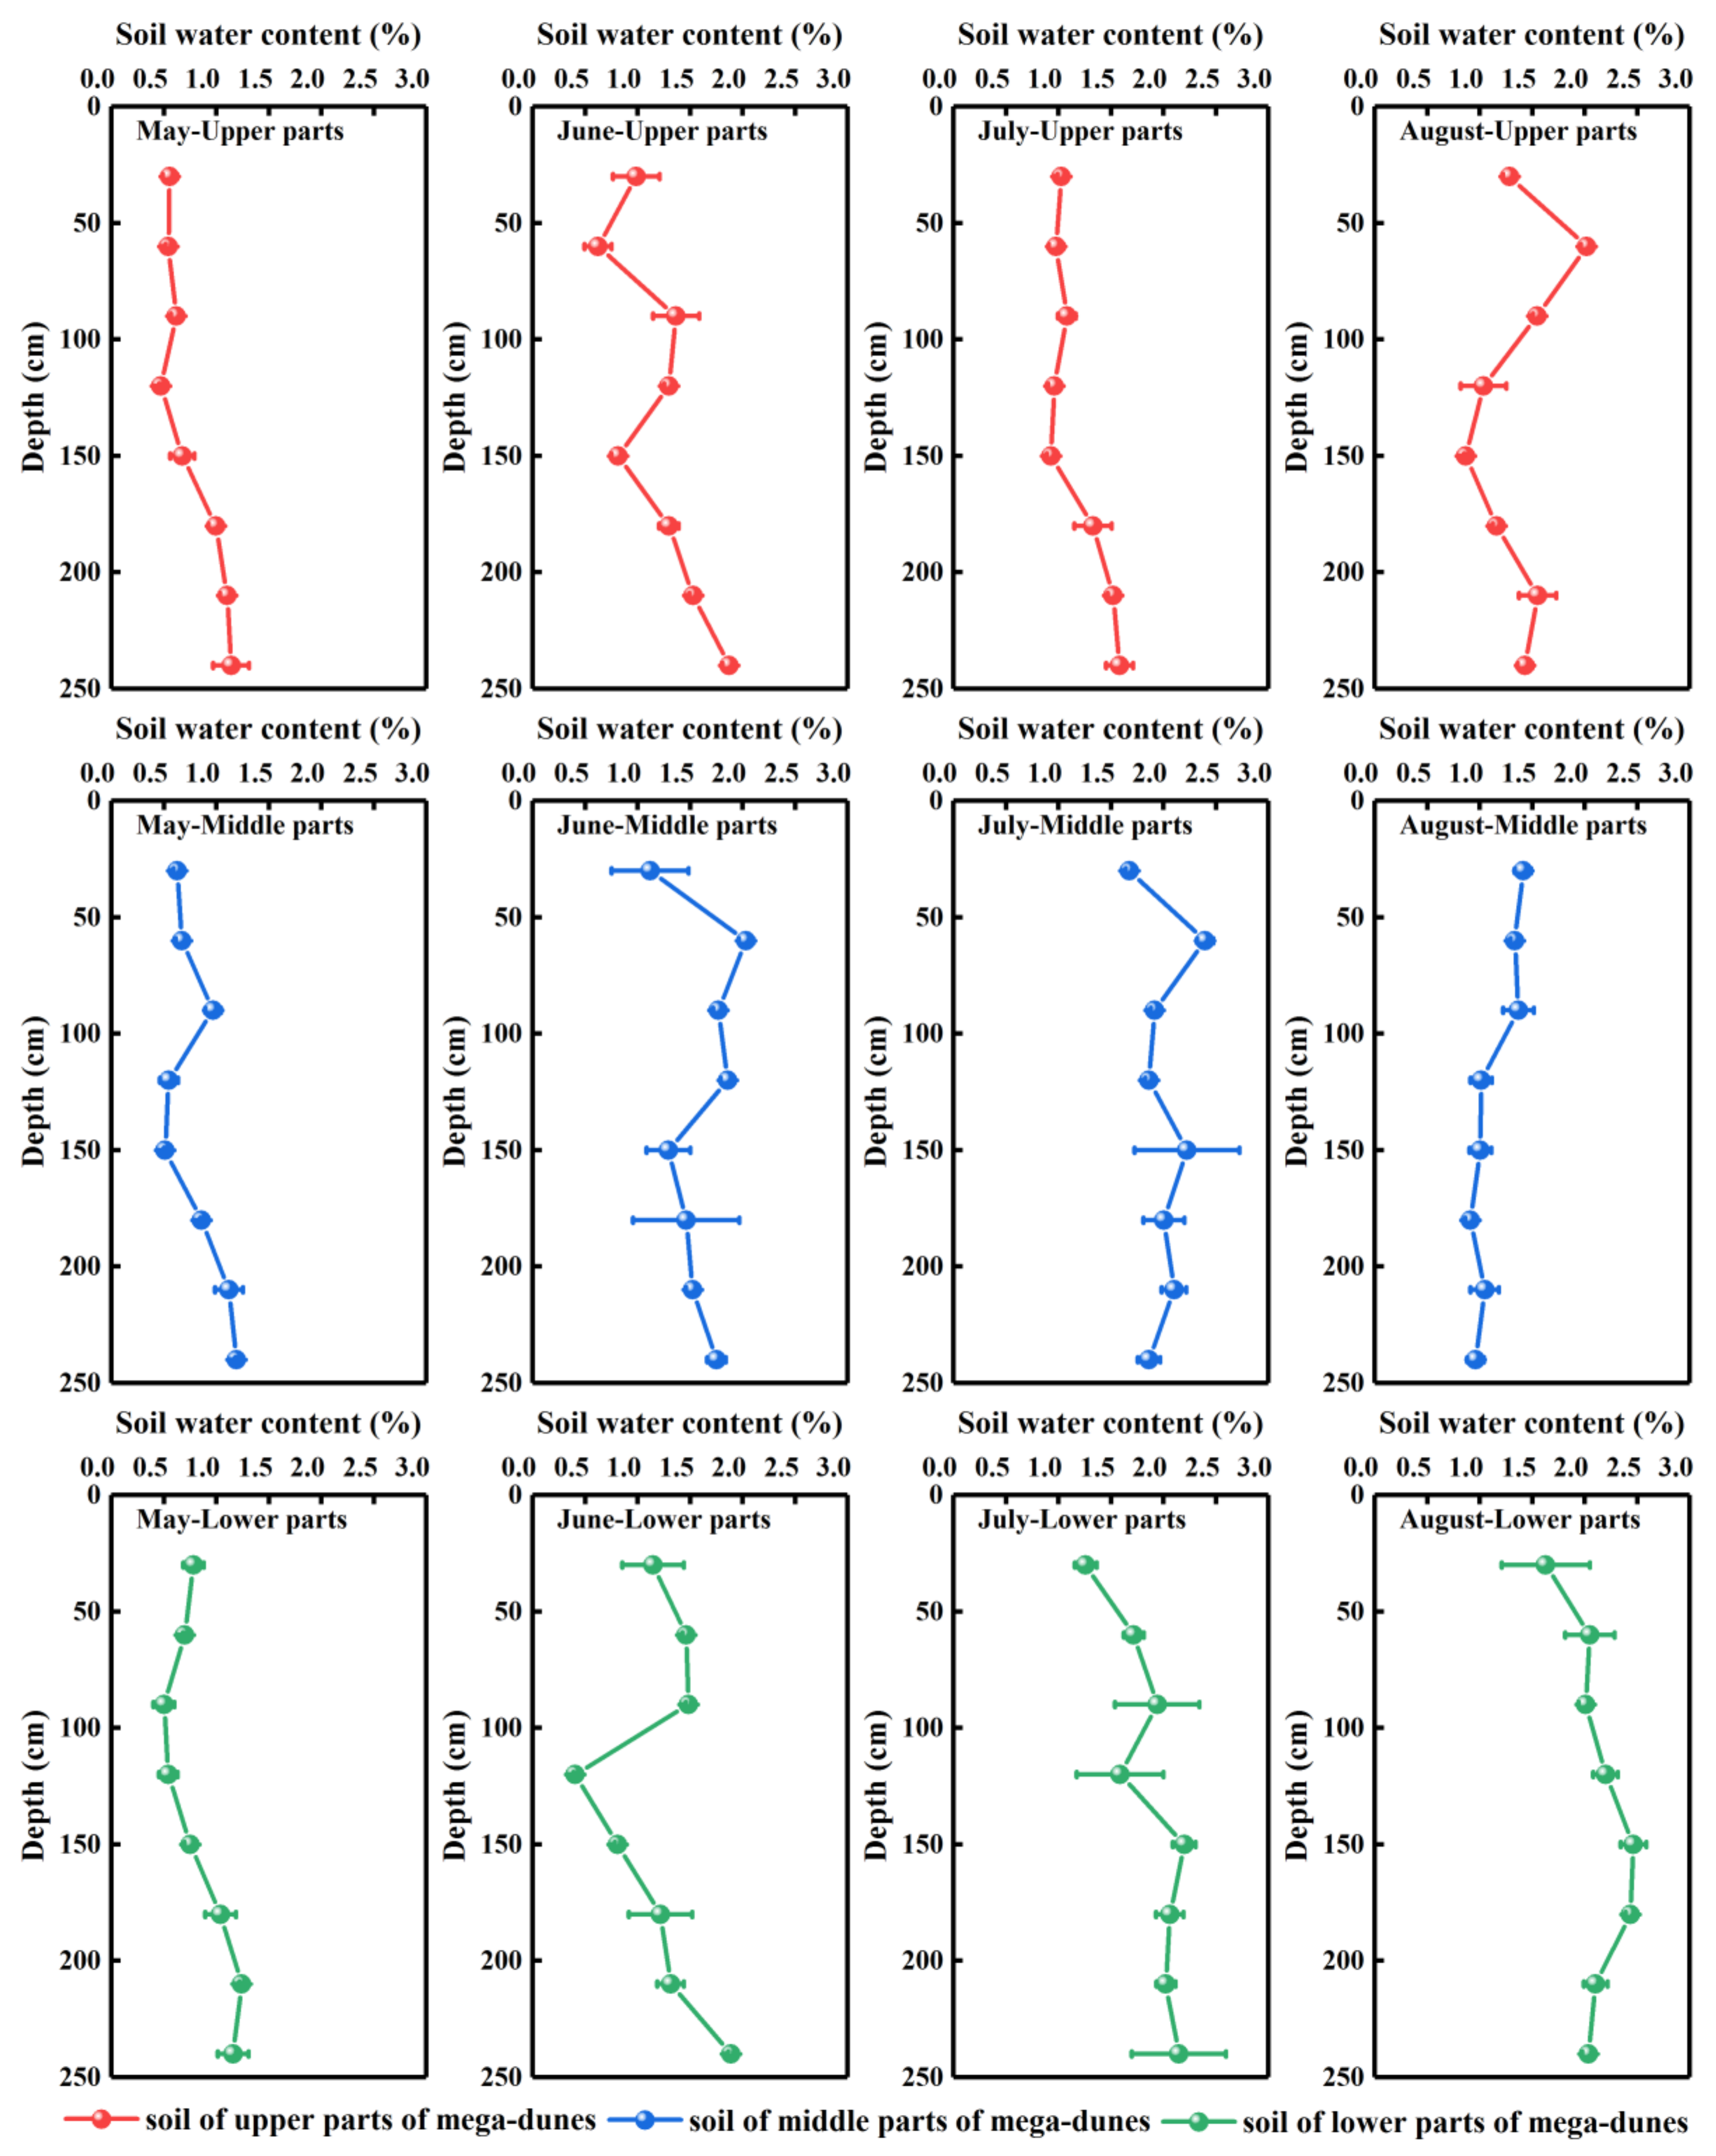
Figure 4.
Seasonal variations in δ18O values of groundwater and lake water. Data are expressed as means ± 1SD. Different lowercase letters express significant differences for δ18O values of groundwater and lake water among months at significance level p < 0.05.
Figure 4.
Seasonal variations in δ18O values of groundwater and lake water. Data are expressed as means ± 1SD. Different lowercase letters express significant differences for δ18O values of groundwater and lake water among months at significance level p < 0.05.
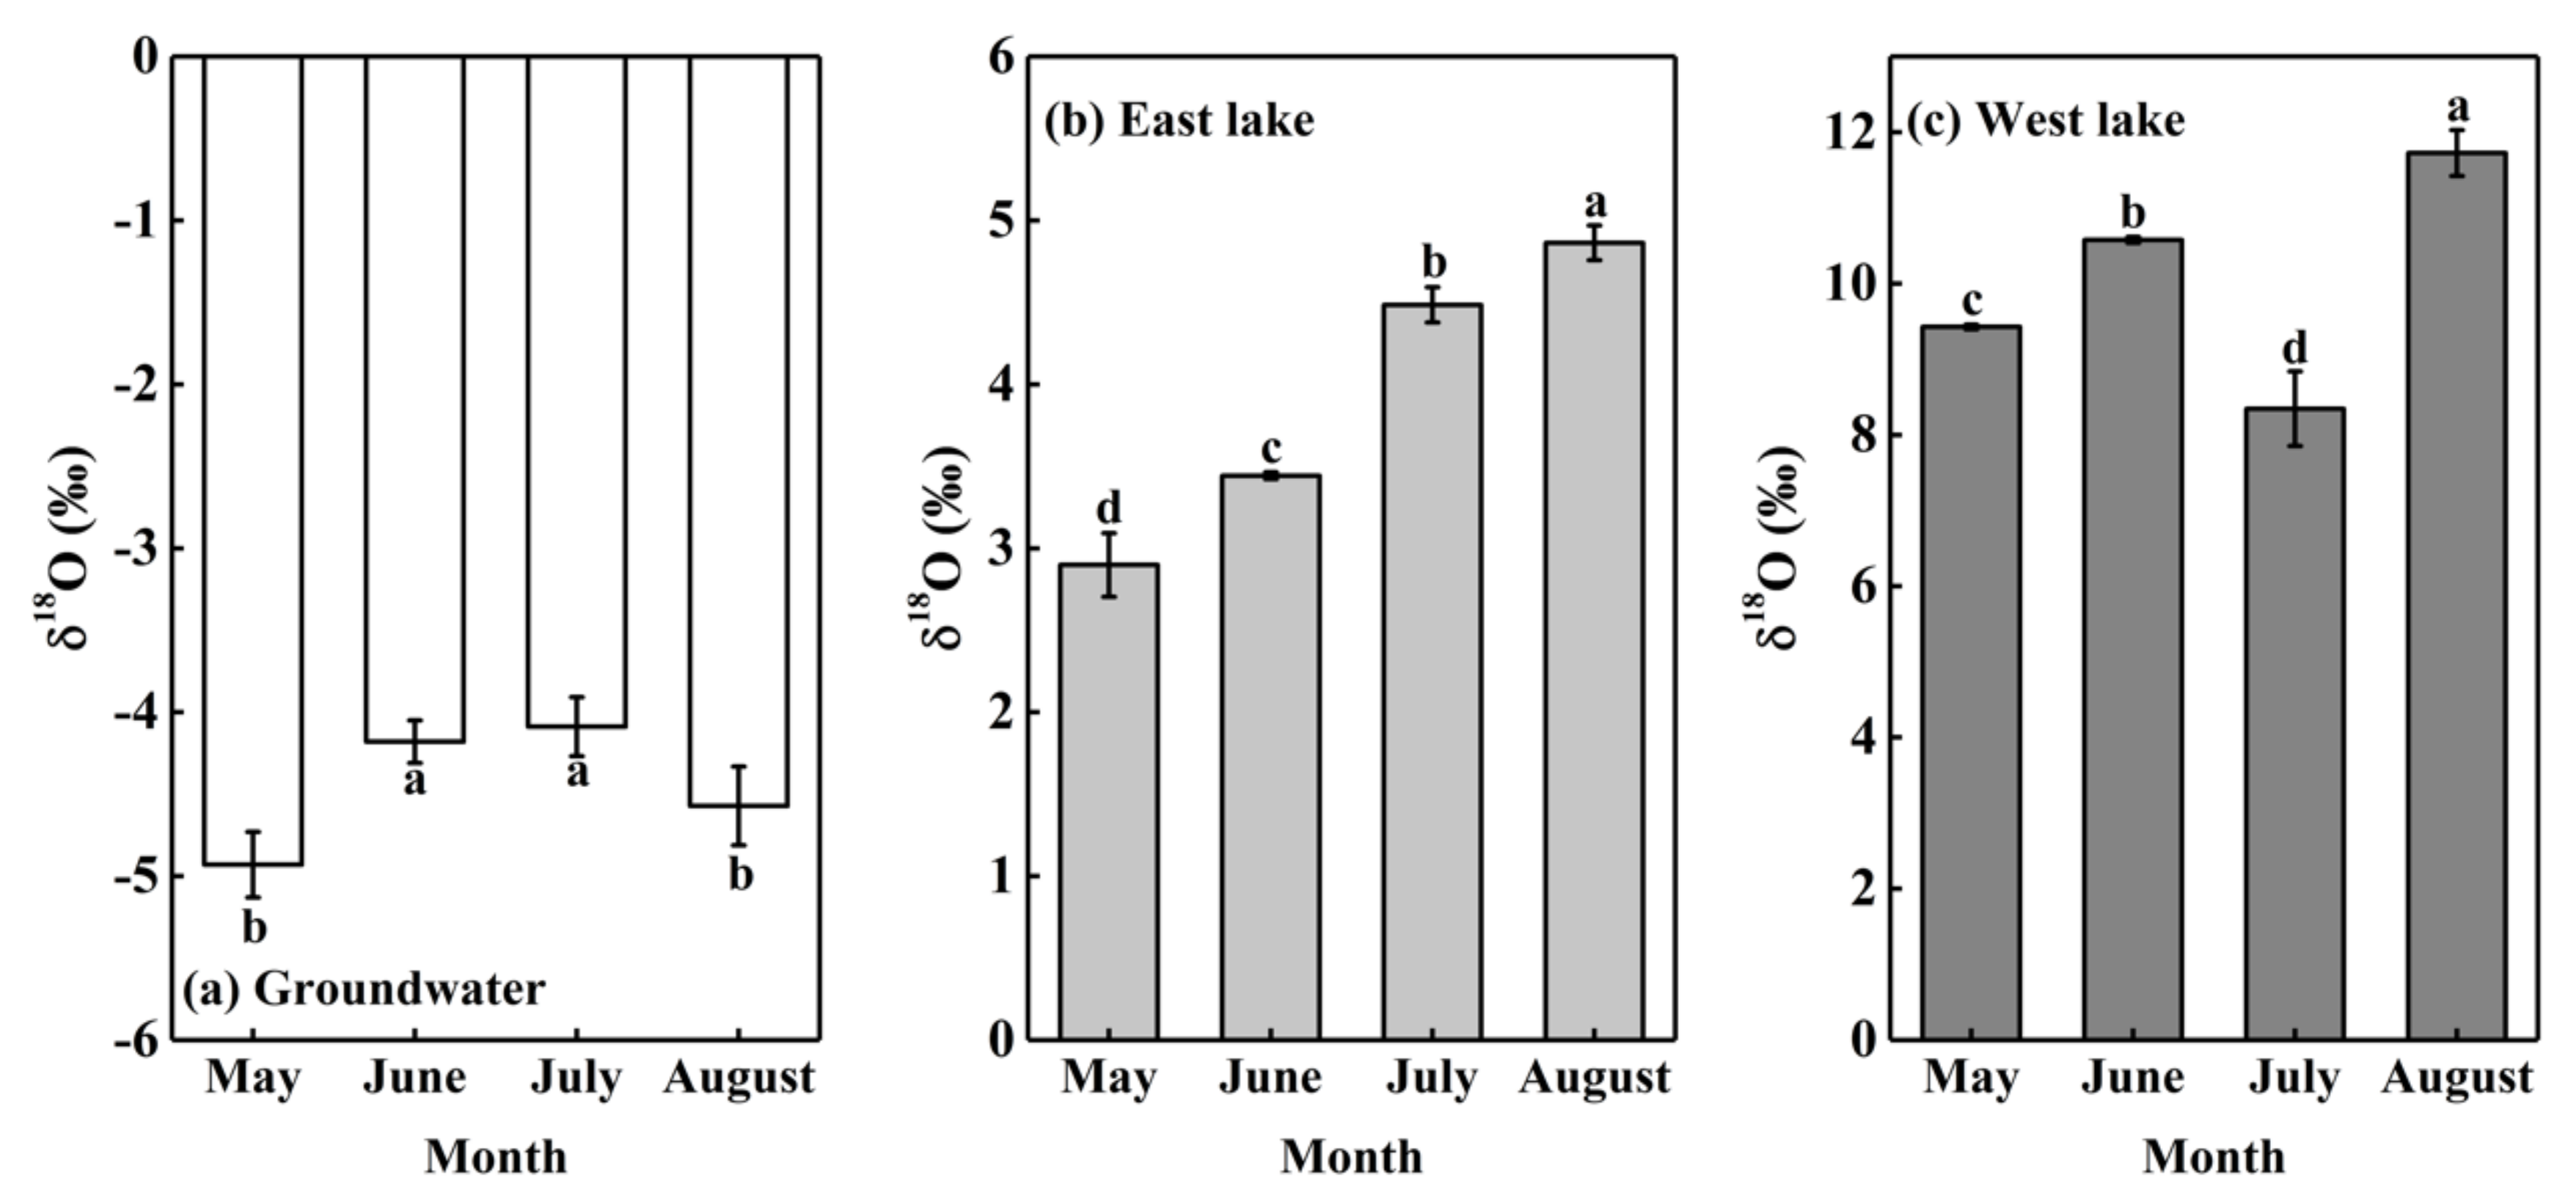
Figure 5.
Spatio-temporal variations in δ18O values of plant xylem water and soil water. Rows one to three present the δ18O values of plant xylem water and soil water from the upper, middle, and lower parts of mega-dunes, respectively. Columns one to four present the δ18O values of plant xylem water and soil water in May, June, July, and August, respectively.
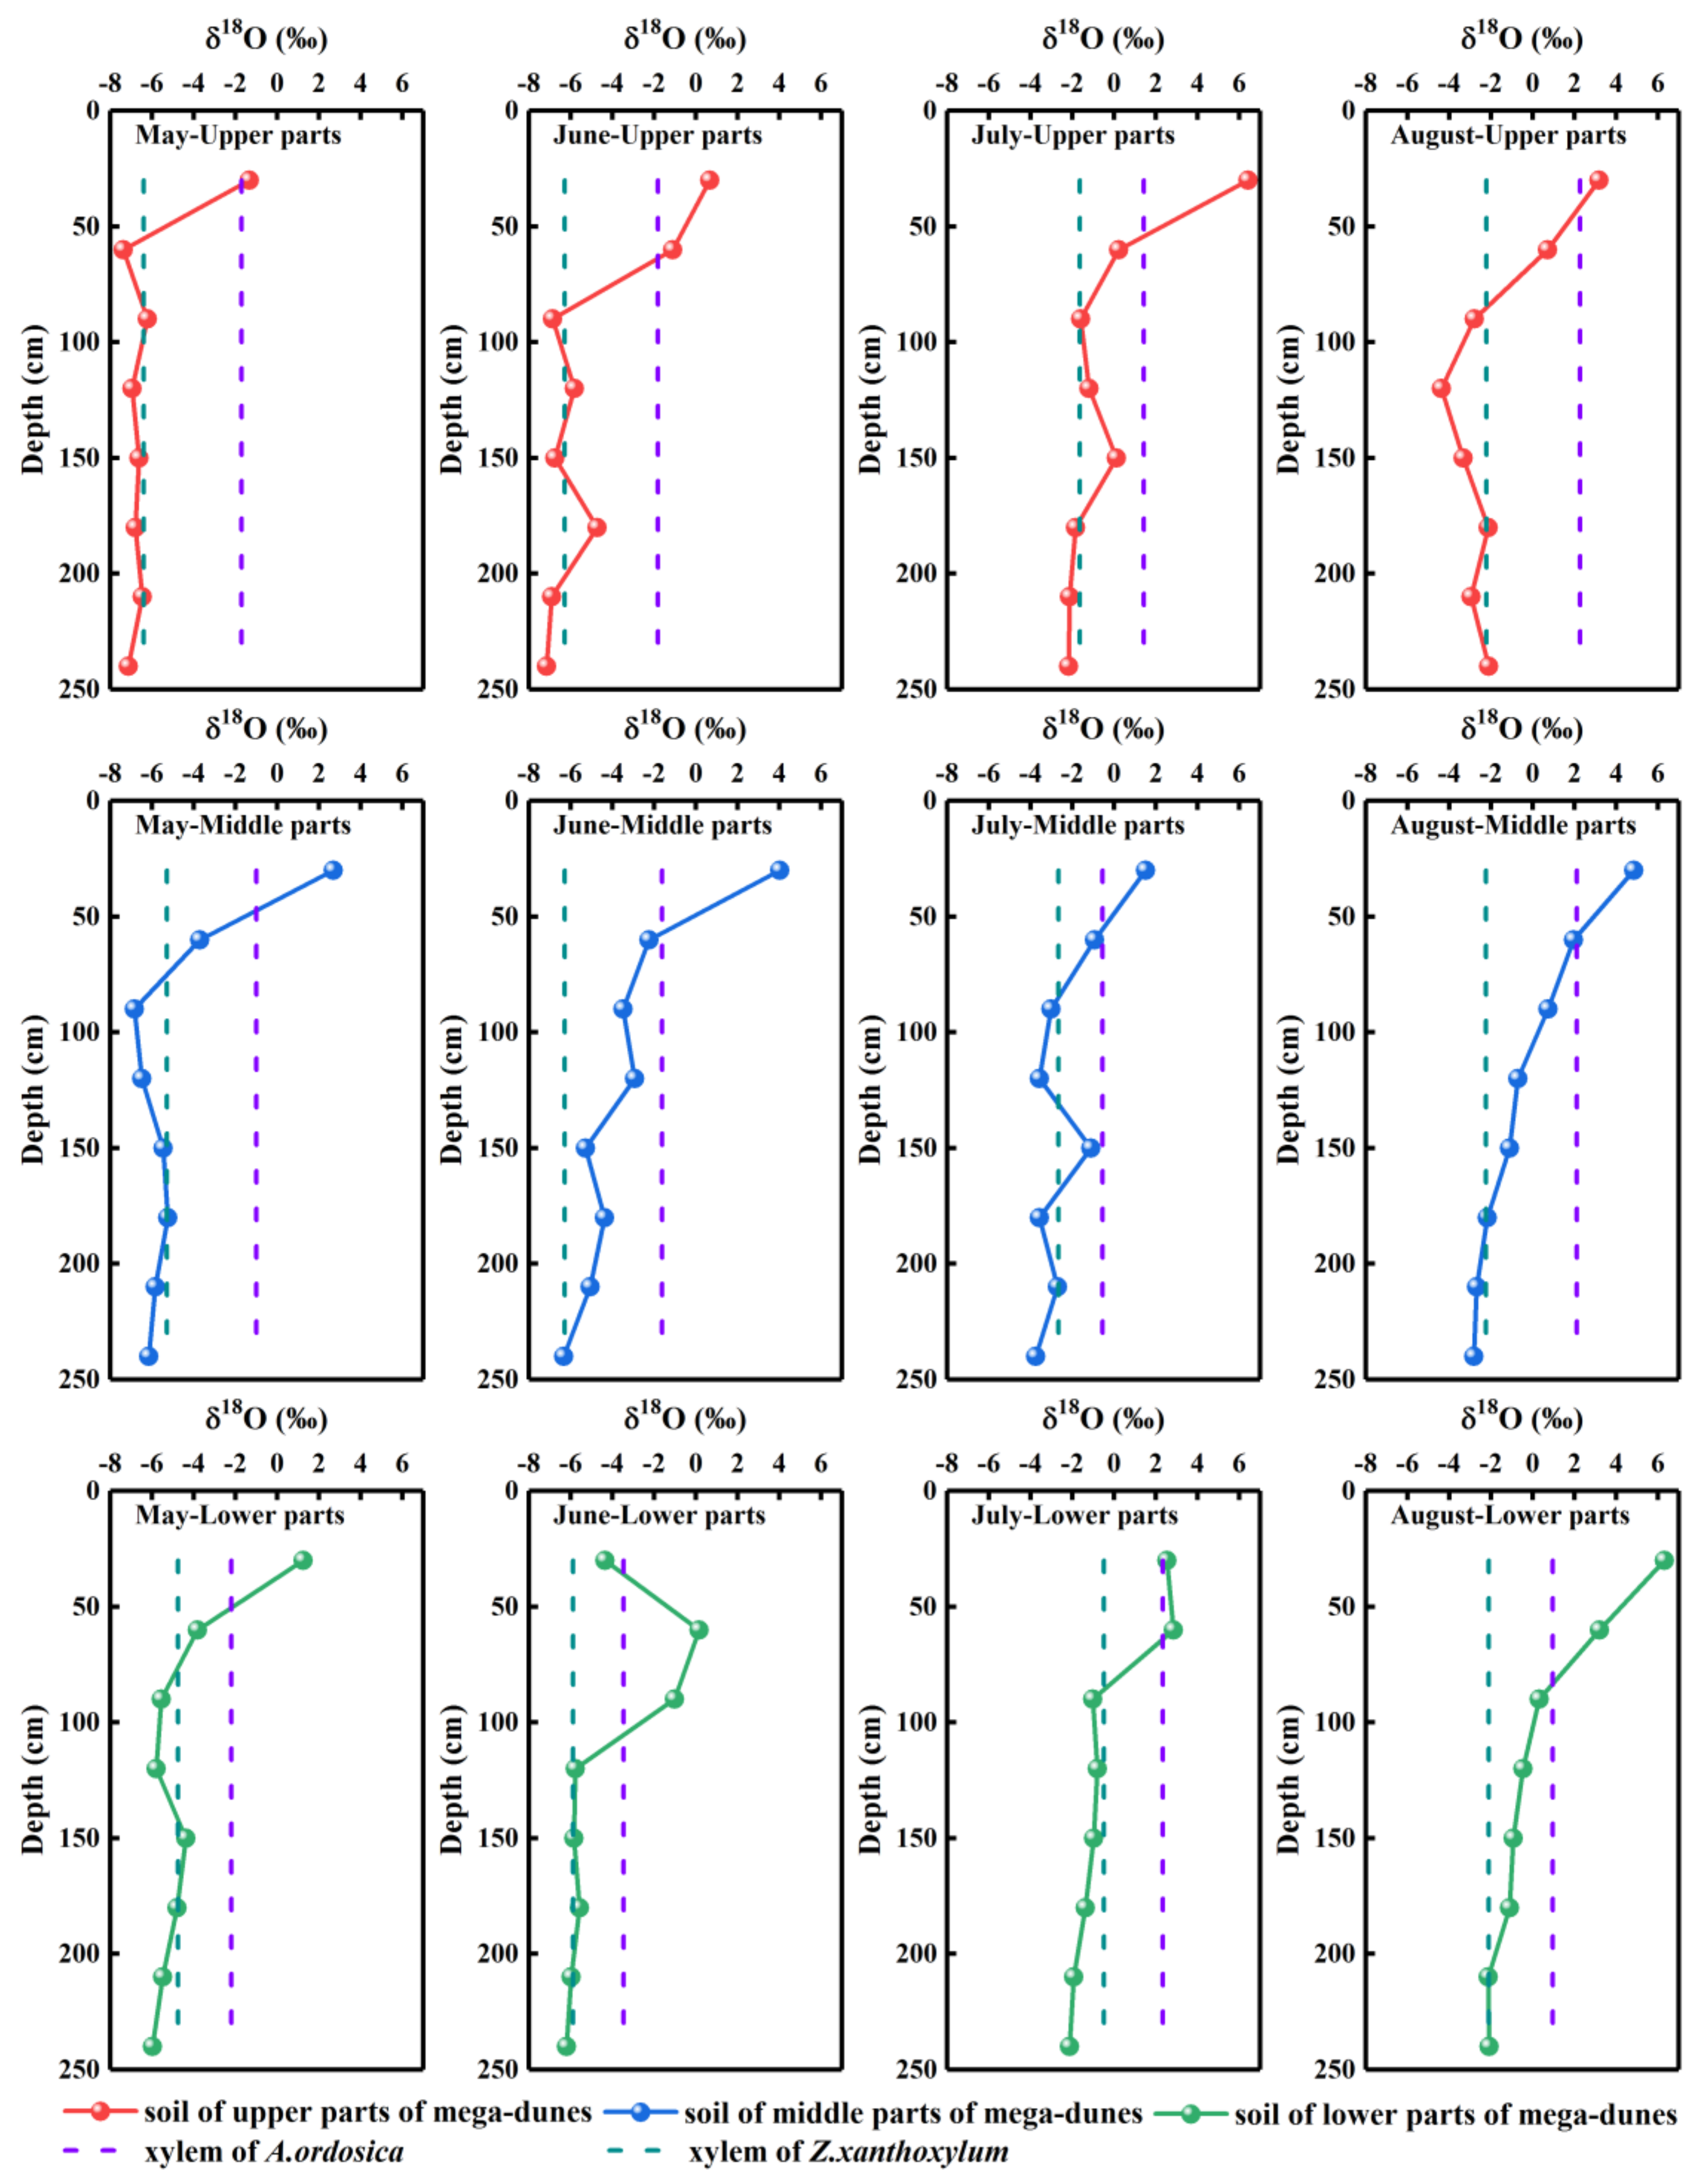
Figure 6.
The δD-δ18O plots of xylem water and potential water sources for Z. xanthoxylum and A. ordosica, including soil water from different soil layers, groundwater, and lake water during the sampling period. SWL is the soil water evaporation line which is fitted based on the isotopic values of soil water. GLL is fitted based on the isotopic values of groundwater, east lake water, and west lake water.

Figure 7.
Seasonal variations in water uptake proportions from different soil layers for Z. xanthoxylum and A. ordosica. The data were obtained via the Iso—source model.
Figure 7.
Seasonal variations in water uptake proportions from different soil layers for Z. xanthoxylum and A. ordosica. The data were obtained via the Iso—source model.

Figure 8.
Spatio-temporal variations in δ13C values from Z. xanthoxylum and A. ordosica. Data are expressed as means ± 1SD.
Figure 8.
Spatio-temporal variations in δ13C values from Z. xanthoxylum and A. ordosica. Data are expressed as means ± 1SD.

Figure 9.
Spatio-temporal variations in water use efficiency for Z. xanthoxylum and A. ordosica. Data are expressed as means ± 1SD. Different lowercase letters express significant differences in plant water use efficiency among months at significance level p < 0.05.
Figure 9.
Spatio-temporal variations in water use efficiency for Z. xanthoxylum and A. ordosica. Data are expressed as means ± 1SD. Different lowercase letters express significant differences in plant water use efficiency among months at significance level p < 0.05.

Table 1.
Basic soil properties of Badain Jaran Desert.
| Organic Matter (g/kg) | Total Nitrogen (g/kg) | Total Carbon (g/kg) | Total Phosphorus (g/kg) | Total Salt (g/kg) | pH | Conductivity (s/m) |
|---|---|---|---|---|---|---|
| 3.91 ± 0.46 | 0.71 ± 0.04 | 7.83 ± 0.51 | 0.75 ± 0.03 | 10.61 ± 1.87 | 8.15 ± 0.06 | 0.63 ± 0.12 |
Publisher’s Note: MDPI stays neutral with regard to jurisdictional claims in published maps and institutional affiliations. |
© 2021 by the authors. Licensee MDPI, Basel, Switzerland. This article is an open access article distributed under the terms and conditions of the Creative Commons Attribution (CC BY) license (https://creativecommons.org/licenses/by/4.0/).
Share and Cite
MDPI and ACS Style
Qin, J.; Si, J.; Jia, B.; Zhao, C.; Zhou, D.; He, X.; Wang, C.; Zhu, X. Water Use Characteristics of Two Dominant Species in the Mega-Dunes of the Badain Jaran Desert. Water 2022, 14, 53. https://doi.org/10.3390/w14010053
AMA Style
Qin J, Si J, Jia B, Zhao C, Zhou D, He X, Wang C, Zhu X. Water Use Characteristics of Two Dominant Species in the Mega-Dunes of the Badain Jaran Desert. Water. 2022; 14(1):53. https://doi.org/10.3390/w14010053
Chicago/Turabian StyleQin, Jie, Jianhua Si, Bing Jia, Chunyan Zhao, Dongmeng Zhou, Xiaohui He, Chunlin Wang, and Xinglin Zhu. 2022. "Water Use Characteristics of Two Dominant Species in the Mega-Dunes of the Badain Jaran Desert" Water 14, no. 1: 53. https://doi.org/10.3390/w14010053
Note that from the first issue of 2016, this journal uses article numbers instead of page numbers. See further details here.