Article

Salinity Contributions from Geothermal Waters to the Rio Grande and Shallow Aquifer System in the Transboundary Mesilla (United States)/Conejos-Médanos (Mexico) Basin

1
U.S. Geological Survey, 6700 Edith Blvd. NE, Building B, Albuquerque, NM 87113, USA
2
New Mexico Bureau of Geology & Mineral Resources, New Mexico Institute of Mining & Technology, 801 Leroy Place, Socorro, NM 87801, USA
*
Author to whom correspondence should be addressed.
Water 2022, 14(1), 33; https://doi.org/10.3390/w14010033
Submission received: 25 June 2021 / Revised: 9 December 2021 / Accepted: 11 December 2021 / Published: 23 December 2021
(This article belongs to the Special Issue Advances in Transboundary Aquifer Assessment)

Abstract

:
Freshwater scarcity has raised concerns about the long-term availability of the water supplies within the transboundary Mesilla (United States)/Conejos-Médanos (Mexico) Basin in Texas, New Mexico, and Chihuahua. Analysis of legacy temperature data and groundwater flux estimates indicates that the region’s known geothermal systems may contribute more than 45,000 tons of dissolved solids per year to the shallow aquifer system, with around 8500 tons of dissolved solids being delivered from localized groundwater upflow zones within those geothermal systems. If this salinity flux is steady and eventually flows into the Rio Grande, it could account for 22% of the typical average annual cumulative Rio Grande salinity that leaves the basin each year—this salinity proportion could be much greater in times of low streamflow. Regional water level mapping indicates upwelling brackish waters flow towards the Rio Grande and the southern part of the Mesilla portion of the basin with some water intercepted by wells in Las Cruces and northern Chihuahua. Upwelling waters ascend from depths greater than 1 km with focused flow along fault zones, uplifted bedrock, and/or fractured igneous intrusions. Overall, this work demonstrates the utility of using heat as a groundwater tracer to identify salinity sources and further informs stakeholders on the presence of several brackish upflow zones that could notably degrade the quality of international water supplies in this developed drought-stricken region.

1. Introduction

Natural and anthropogenic salinization of water supplies challenges sustainable water resource management, particularly in drought-stricken regions such as the southwestern United States and northern Mexico [1]. The transboundary Mesilla (United States)/Conejos-Médanos (Mexico) Basin (referred to herein as the Basin) of New Mexico and Texas (United States) and Chihuahua (Mexico) is one populated region facing these challenges in light of declining water levels, deteriorating water quality, and increased water use on both sides of the international border (Figure 1) [2]. Both groundwater and the Rio Grande (United States)/Rio Bravo (Mexico) are heavily relied upon to meet water demand. Hogan et al. (2007) have shown that Rio Grande chloride concentration more than doubles from around 120 milligrams per liter (mg/L) to 280 mg/L between the inlet and outlet of the Mesilla portion of the Basin (Mesilla) [3]. Driscoll and Sherson (2016) later demonstrated that during periods of minimal upstream reservoir releases (i.e., non-release seasons) within the 2009 to 2013 time period, Rio Grande salinity (as approximated by total dissolved solids (TDS)) averaged about 1500 mg/L at the basin inlet (RG-LB, Figure 1) and increased to approximately 2200 mg/L at the outlet (RG-EP, Figure 1) [4]. This salinity increase, along with similar spatial trends in groundwater salinity, are likely affected by several factors, including (1) runoff and recharge from agricultural activity, (2) wastewater discharge, (3) evapoconcentration, (4) topographically and/or buoyancy driven upwelling (vertical flow/upflow) of geothermal and non-thermal groundwater, and (5) intra-basin groundwater flow from surrounding basins [3,5,6,7,8,9,10,11].
Salinity contributions from geothermal waters, meaning salinity from waters of naturally elevated temperature, have not been studied as extensively in this region as some of the other salinity mechanisms and are the focus of this research. Three prominent geothermal systems have been identified in the study area, where previous research has largely focused on geothermal energy production and development rather than salinity contributions [12,13,14,15,16]. Upwelling waters associated with these geothermal systems have naturally elevated salinities ranging from about 1800 to 4800 mg/L and therefore have the potential to degrade surrounding freshwater supplies [15,16,17]. This work combines previously published geothermal discharge estimates and historical (1972–2018) temperature measurements to identify prominent geothermal groundwater upflow zones and estimate their salinity contribution to the region’s primary aquifer system and to the Rio Grande.
Analyzed temperature data includes temperature measured as a function of depth (temperature profile) collected within 379 wells dispersed throughout the Mesilla [18]. Temperature profiles typically portray a linear increase in temperature with depth when groundwater flow rates (i.e., advection) are slow. Systematic curvature is evident in temperature profiles when vertical and/or horizontal advection rates dominate over thermal conduction; the degree of curvature increases with higher rates of advection [19]. This systematic relation between profile curvature and flow rates enables the quantitative estimation of discharge based on temperature data, thereby permitting heat to be used as a groundwater tracer [19]. This research entails the following: (1) classifying temperature profile curvature, (2) calculating 1D vertical flow rates for the temperature profiles that have upflow curvature, (3) estimating corresponding spatial areas of upflow, and (4) coupling estimated vertical flow rates, areas, and groundwater salinity data to estimate potential volumetric salinity contributions to the primary aquifer system and the Rio Grande. This approach identifies prevalent geothermal upflow zones that are localized within more broadly defined and diffuse upwelling geothermal systems. Estimates of salinity flux were also computed for the broad geothermal systems if previously published geothermal discharge estimates were available.
Overall, this work confirms the notable salinity flux associated with geothermal waters upwelling in the Mesilla. Identified localized upflow zones likely contribute upwards of 8500 tons of dissolved solids to the shallow aquifer system annually, or approximately 4% of average annual cumulative Rio Grande dissolved solids leaving the basin from 2009 through 2013 [4]. Coupling previously published estimates of geothermal discharge for the broad geothermal systems with corresponding geothermal groundwater salinity indicates that the total geothermal salinity contributions may be much higher, exceeding 45,000 tons of dissolved solids per year, or 22% of 2009–2013 average annual cumulative Rio Grande mass flux at the basin outlet. Groundwater elevation mapping of water levels measured in 2010 indicates that brackish groundwater from identified upflow zones likely flows towards northern Chihuahua in Mexico, and Las Cruces, the southern Mesilla, and the Rio Grande within the United States [20]. Generally, this work indicates geothermal waters may appreciably affect the salinity budget for this region, both in the United States and Mexico, identifies localized upflow zones that could inform future mitigation efforts, and demonstrates the utility of using heat as a groundwater tracer to evaluate geothermal salinity fluxes.
Figure 1. Local (A) and regional (B) maps showing the location of the study area in the United States (New Mexico and Texas) and Mexico (Chihuahua) [21,22]. All analyzed temperature data in this work were collected in the United States, while interpreted groundwater elevation mapping covers substantial portions of the aquifer system in both countries. Stream gage abbreviations are as follows: RG-LB = USGS 08363510 Rio Grande below Leasburg Dam at Fort Selden, New Mexico; RG-EP = USGS 08364000 Rio Grande at El Paso, Texas [23].
Water 14 00033 g001

2. Background

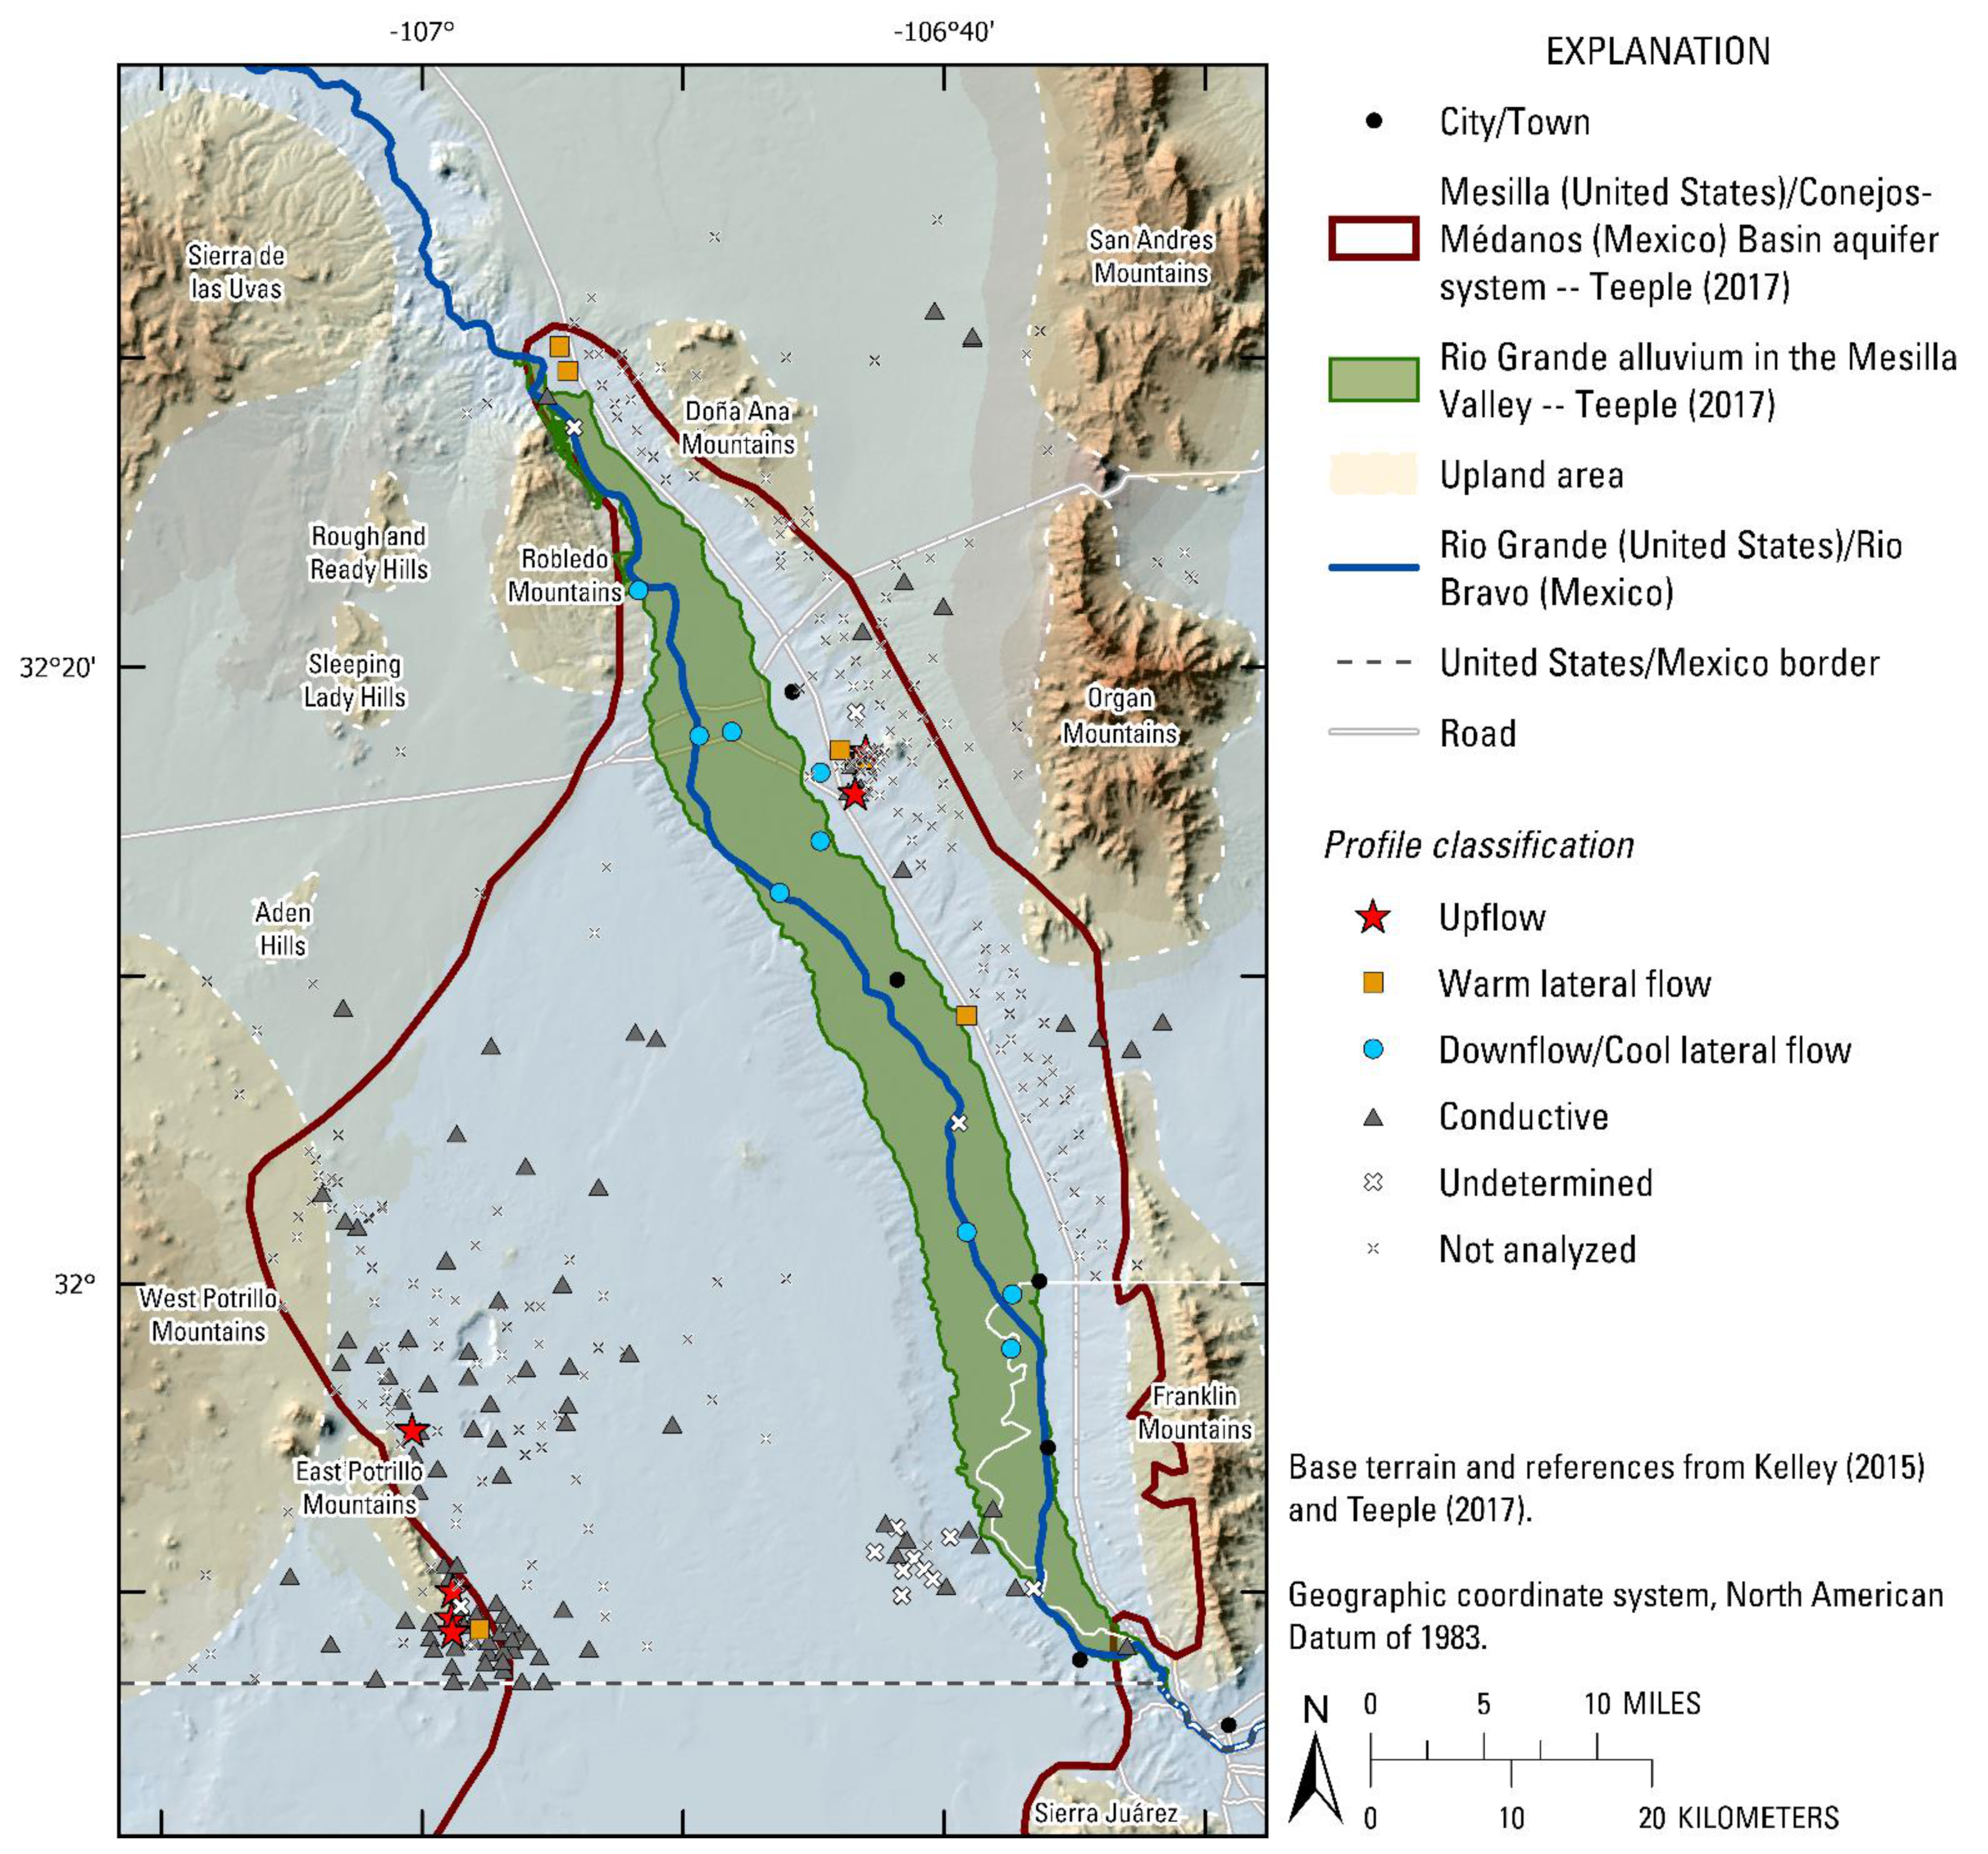
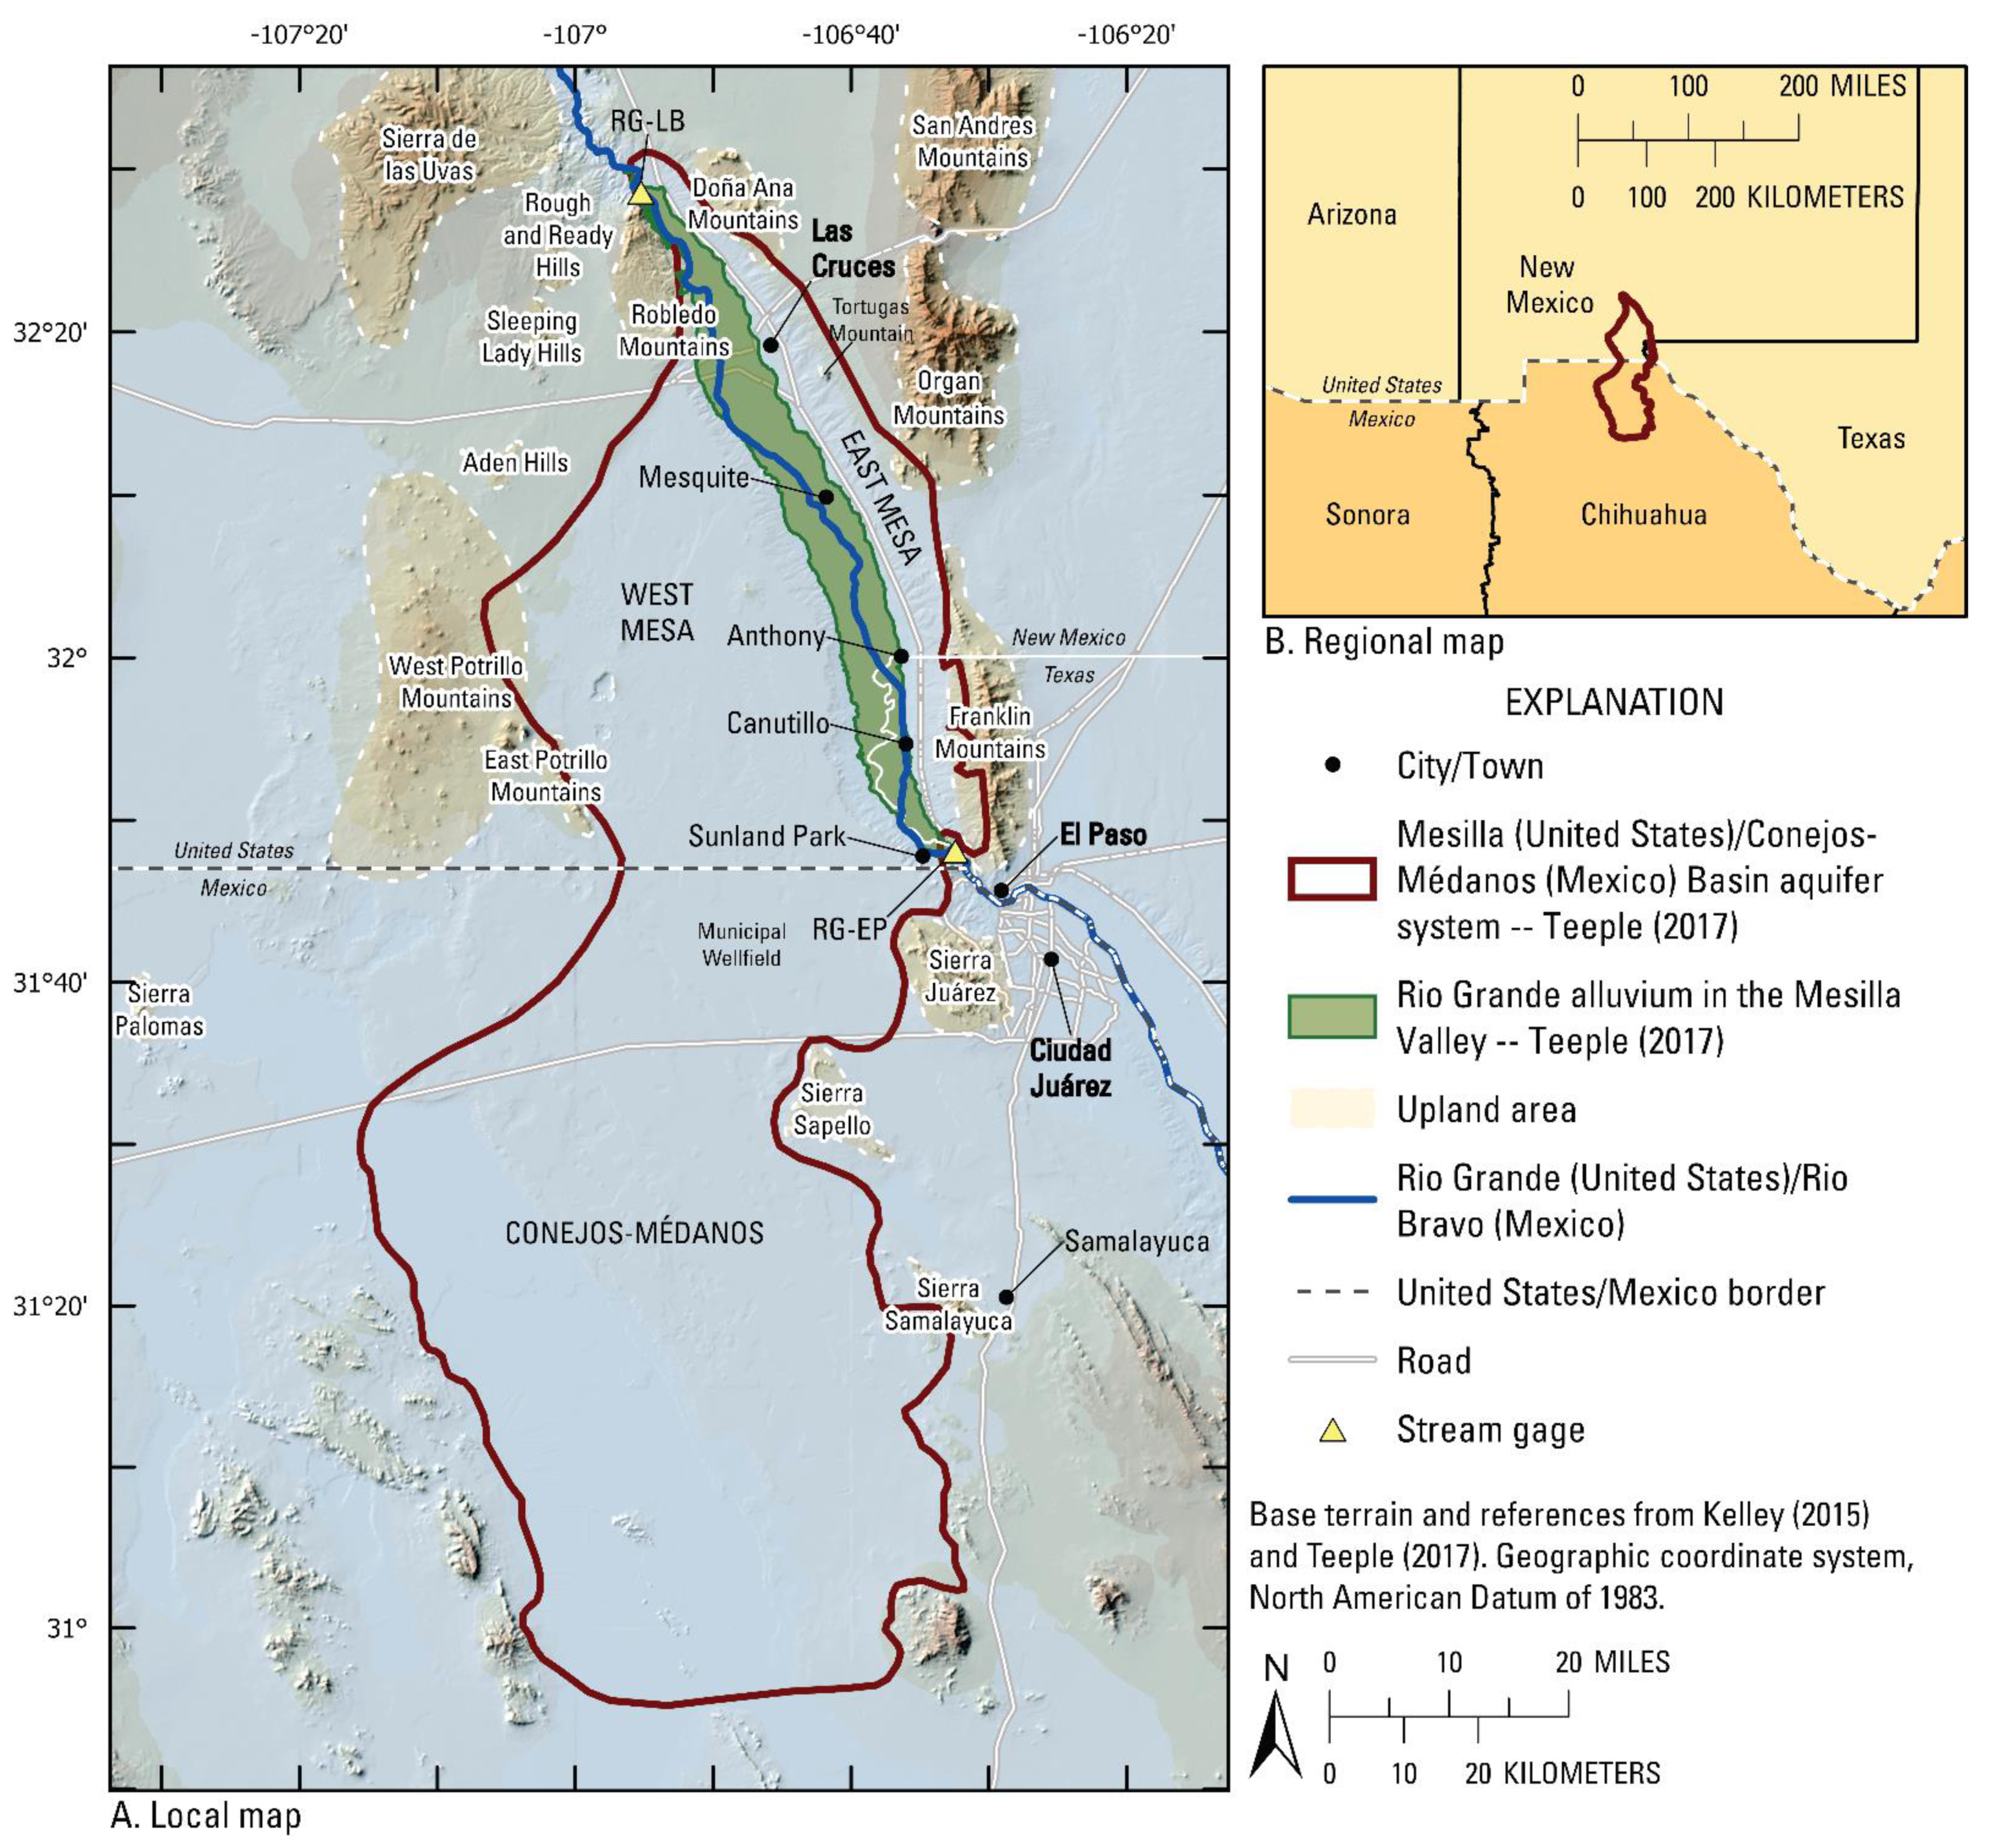
2.1. Description of the Study Area

The study area is the Mesilla (United States)/Conejos-Médanos (Mexico) Basin and the corresponding aquifer system, which covers a total area of about 7200 square kilometers (km2), with around 2700 km2 (37%) in the United States (U.S.) and 4500 km2 (63%) in Mexico (Figure 1) [21]. The Mesilla portion of the Basin (Mesilla) is further divided into the West Mesa and the East Mesa, which are separated by the Mesilla Valley. This study area is in the southern portion of the Rio Grande rift, a tectonically active extensional province that stretches from southern Colorado into Mexico and is bound by numerous fault zones and upland areas [24,25,26,27]. An extensive basalt field, including Kilbourne Hole and Hunt’s Hole (volcanic maars) and several igneous intrusions, is in the southwest Mesilla within and near the West Potrillo Mountains and the East Potrillo Mountains [21,27,28]. The landscape of the Conejos-Médanos portion of the Basin (Conejos-Médanos) is dominated by dune fields [29].
Regional climate has been described as arid and dry with low humidity and precipitation, high evaporation, and a wide range of temperature and vegetation types [21,29]; these characteristics are often strongly elevation dependent. Most precipitation falls during July through September as monsoonal rainfall [29,30].
The main surface water features in the area are the Rio Grande (U.S.)/Rio Bravo (Mexico) and an intricate network of irrigation canals that are primarily fed by diverted Rio Grande water [4,29,31]. The Rio Grande enters the Mesilla through Selden Canyon north of Las Cruces near the RG-LB stream gage and the adjacent Leasburg Diversion Dam (Figure 1). The river flows south-southeast through the Mesilla Valley before exiting the Basin at the Paso del Norte near the RG-EP stream gage at El Paso, where it forms the U.S./Mexico international border. Surface water flow is strongly dependent on releases from upstream reservoirs, with the highest flows typically occurring during the summer growing season [4]. Flows dramatically decline or cease when reservoir releases are halted, typically during the winter months. The Rio Grande alternates between being a losing and gaining stream and water quality generally degrades as the river traverses the Mesilla Valley [4,6,11].
The Quaternary/late Tertiary Santa Fe Group sediments and Quaternary Rio Grande Valley alluvium constitute the Basin’s aquifer system and are the primary regional aquifers [4,21,27]. More than 120 million acre-feet of groundwater is estimated to be potentially recoverable from this mixture of unconsolidated sand, gravel, silt, and clay [20,27]. Groundwater salinity varies widely from less than 500 mg/L to about 30,000 mg/L, with a prominent zone of brackish to highly saline (5000 to 30,000 mg/L) groundwater located near the Basin outlet (Figure 1) [3,6,11,21]. This groundwater zone is likely associated, in part, with regional-scale non-thermal groundwater upwelling [3,5,11]. The base of the aquifer system is defined by a variety of consolidated rocks including Precambrian crystalline rocks; Paleozoic and Mesozoic dolomite, limestone, and sandstone; intrusive rocks; and Paleogene sedimentary and volcanic rocks—all of which are referred to as basement rocks herein [27,29]. Exposures of these rocks are largely in upland areas and where horst blocks crop out. Depths to these bedrock units also become shallower at the Basin margin, notably near the Basin outlet at Paso del Norte.
Recharge to the aquifer system is mainly within the Mesilla Valley along losing reaches of the Rio Grande and irrigation canals, with smaller amounts of mountain front recharge near upland areas [6,11,17,21]. Groundwater salinity is often less than 250 mg/L in local mountain front recharge areas, whereas surface water recharge commonly ranges from around 400 to 2200 mg/L [4,11].
International groundwater elevation mapping indicates that groundwater generally flows towards the Rio Grande and that some groundwater flows from the Conejos-Médanos in Mexico into the Mesilla in the United States [20,29]. Groundwater generally flows east-southeast in the West Mesa, south-southeast in the Mesilla Valley, and south-southwest in the East Mesa. In contrast, groundwater flows north-northwest from the southern Conejos-Médanos towards lowlands in the western part of the basin. From the lowlands, groundwater slowly moves north-northeast towards the Mesilla and Rio Grande.
The area has largely been developed for agriculture since the 1900s, but also contains relatively large population centers in Las Cruces, El Paso, and Ciudad Juárez (Figure 1) [29,31]. Groundwater is the primary drinking water supply and supplements surface water for irrigation [29,31]. Some of the groundwater that flows towards the United States from Mexico is intercepted by a municipal wellfield that supplements water supply to Ciudad Juárez [20,29]. Generally, dependence on groundwater in the region results in notable water level fluctuations, particularly in the Mesilla Valley where agricultural development is most prominent [31].

2.2. Known Geothermal Systems within the Study Area

There are at least three known geothermal systems in the study area, all of which are in the Mesilla. The East Mesa geothermal system is thought to be one of the largest low-temperature (less than 90 °C) systems in the United States, spanning from east of Las Cruces southward to nearly the Texas Stateline (Figure 1) [13]. Geothermal upwelling associated with this system is fault-controlled and focused along a largely buried horst block. Estimated natural groundwater discharge from heat flow analyses for the broad footprint of this system is upwards of 15,000 acre-feet per year [13]. A portion of this system was developed east of Las Cruces near Tortugas Mountain for college campus heating, greenhouse heating, and aquaculture [15]. Produced waters are typically around 64 °C with an average TDS of about 1800 mg/L [15]. Groundwater volumes between 1225 and 1780 acre-feet per year may naturally discharge from this portion of the system alone [6,32].
The Radium Springs geothermal system, located near the basin inlet adjacent to the RG-LB stream gage (Figure 1), is another developed geothermal system in the Mesilla [13,14,16]. This system serves one of the largest geothermal greenhouses in the United States at Masson Farms of New Mexico [13,16]. The geothermal anomaly is thought to cover an area of about 78 km2 [13]. Geothermal upwelling is associated with Quaternary faulting and outflow within a highly fractured rhyolitic intrusion [13,16]. No previously published estimates of natural discharge are known to the authors, possibly due to data scarcity because the system is largely developed on private land. Temperatures of produced waters are about 99 °C with TDS around 3650 mg/L [16].
Lastly, the low-temperature East Potrillo geothermal system is an undeveloped resource in the southern foothills of the East Potrillo Mountains (Figure 1) [12]. Geothermal upwelling is controlled by the East Potrillo fault zone and corresponding highly fractured East Potrillo Mountain horst block [12]. Heat flow analysis indicates a groundwater discharge rate of approximately 970 acre-feet per year over an area of about 2.4 km2 [12]. Groundwater chemistry of produced water is unknown because this system is undeveloped; however, historical data collected nearby along the same fault zone indicates specific conductance (SC) values of 7400 microsiemens per centimeter (µS/cm) [23]. Using the SC to TDS conversion factor from Driscoll and Sherson (2016) of 0.6518 yields a TDS estimate of 4823 mg/L for the East Potrillo geothermal waters [4].
Provided the elevated salinity of the geothermal waters in the study area (1800 to over 4800 mg/L) and notable corresponding discharge rates, these three systems alone have the potential to adversely affect the groundwater chemistry of the shallow aquifer system and of the Rio Grande in this region.

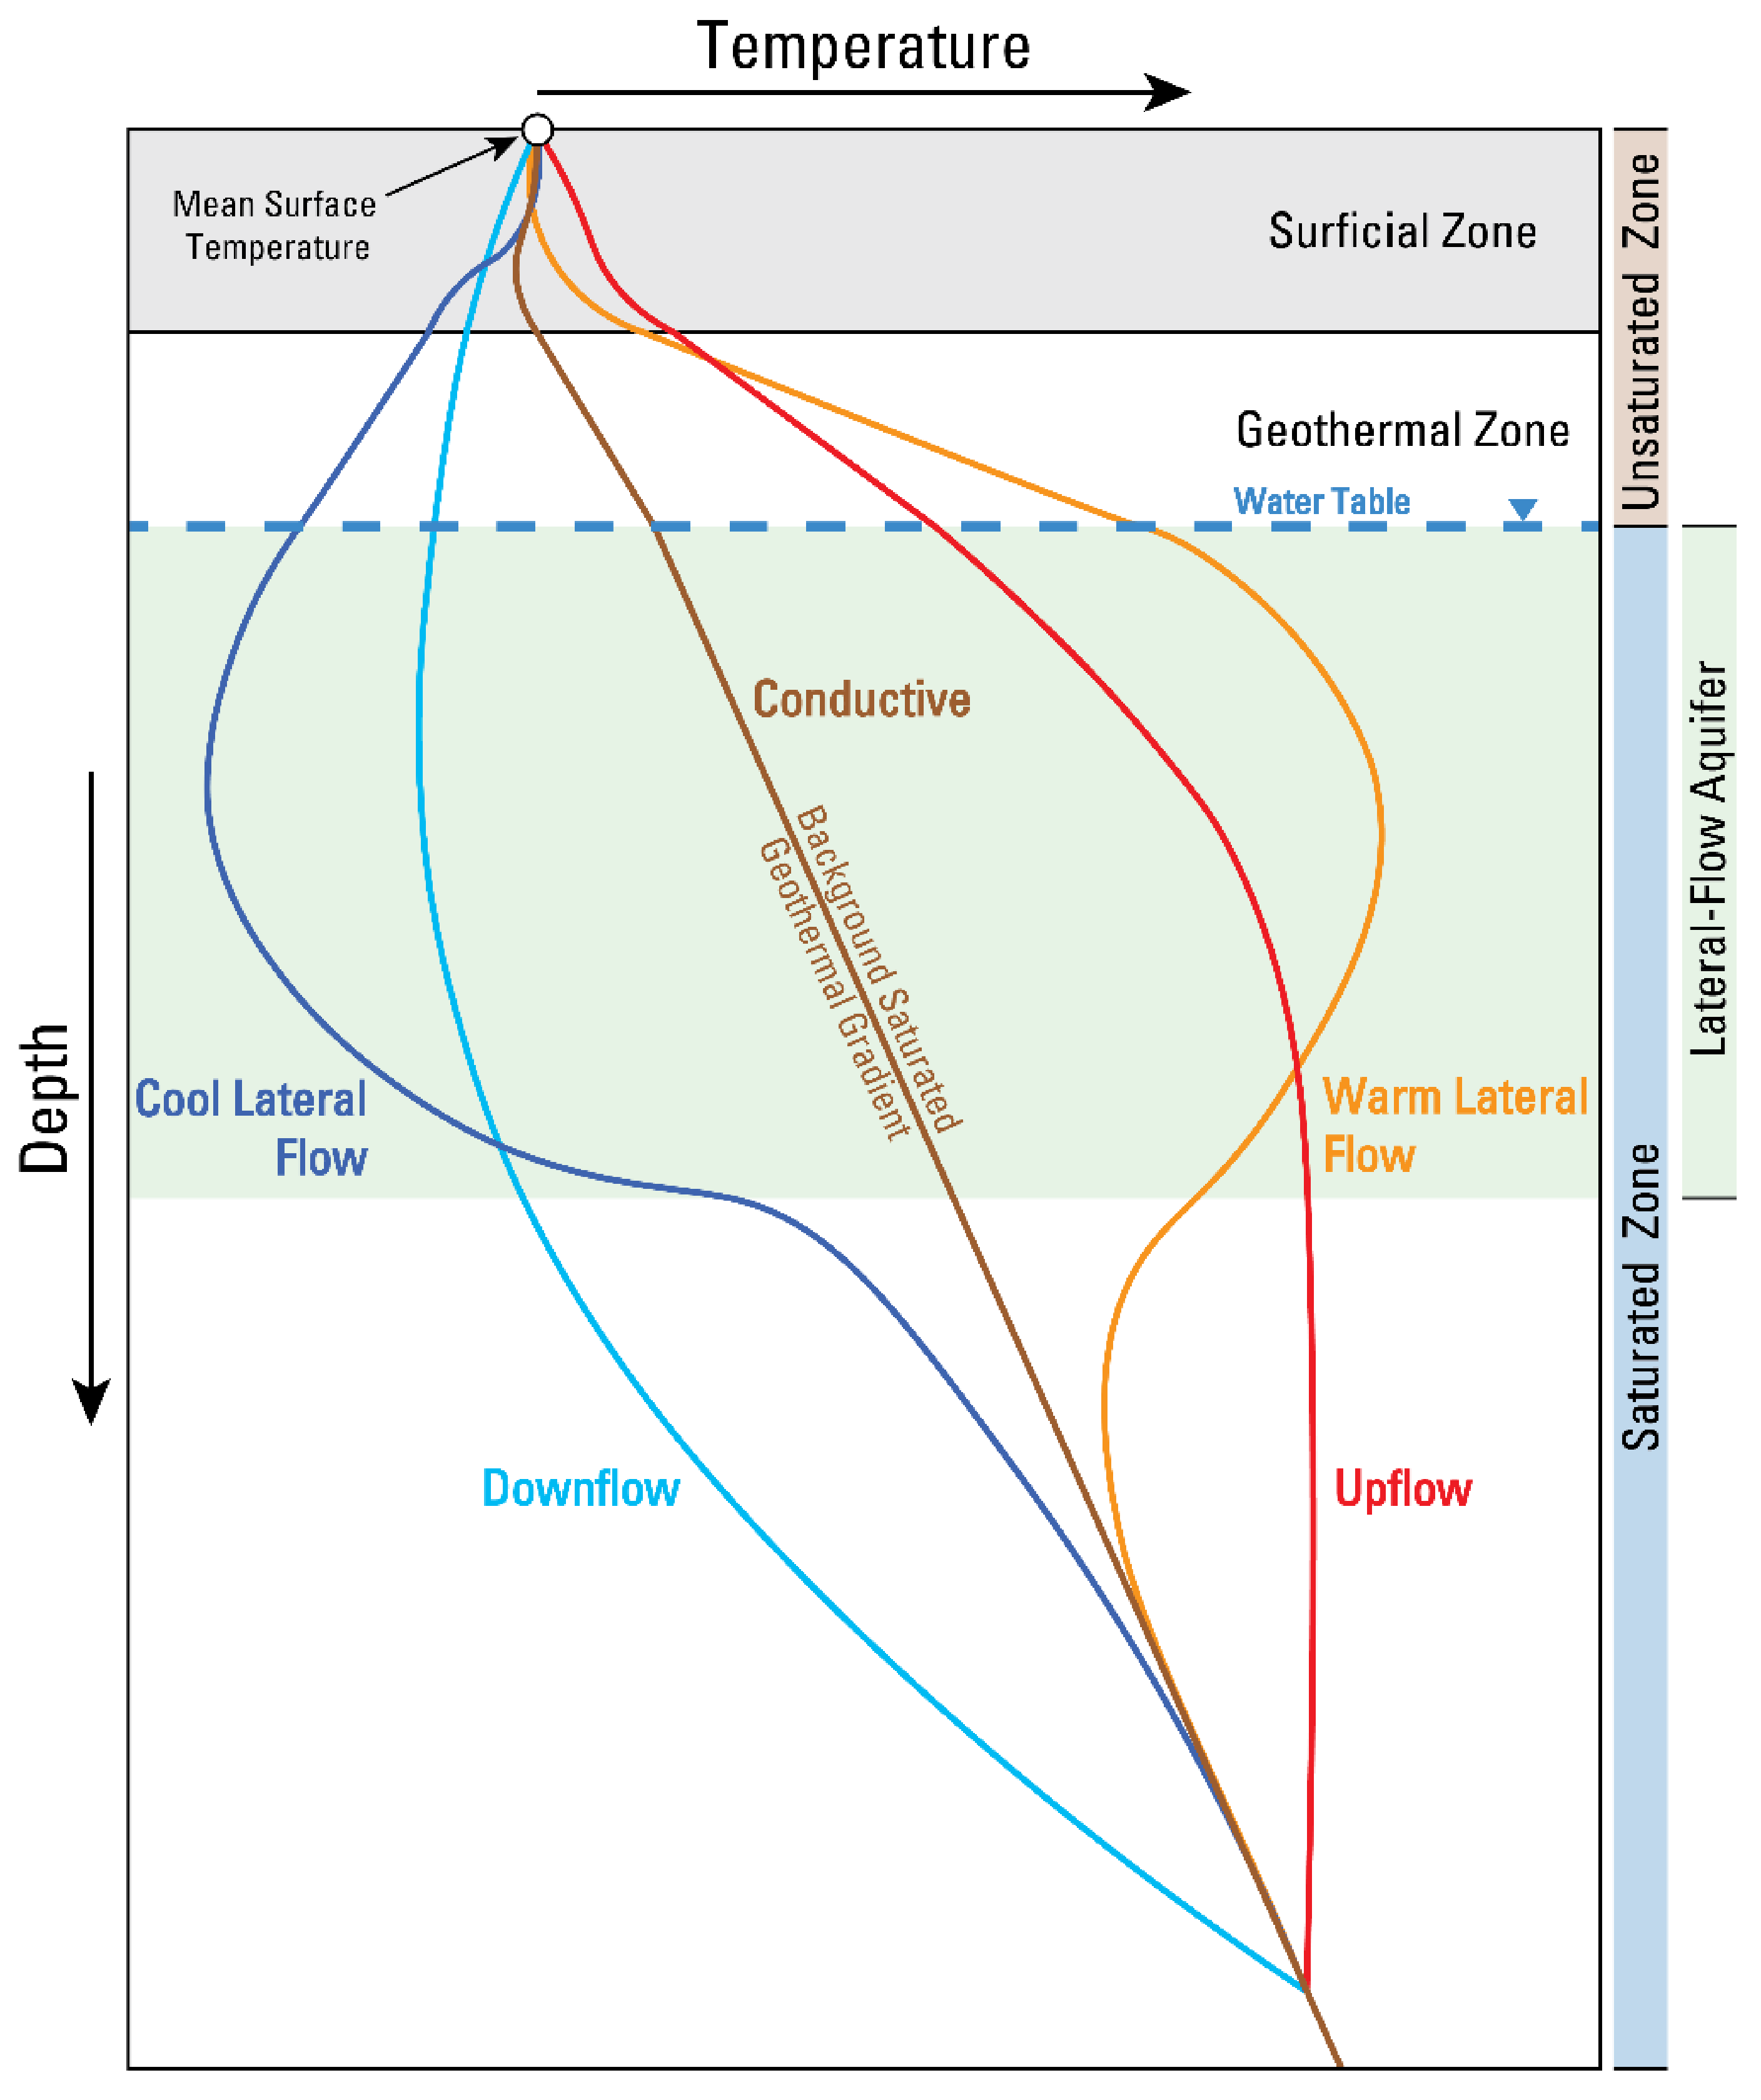
2.3. Using Heat as a Groundwater Tracer

Water carries heat with it as it flows, which enables temperature measurements to be used to trace groundwater flow. When advection rates are high enough, the water possesses a temperature signature that is characteristic of its flow history. For example, hot water upwelling from deep within the earth may remain hot when it reaches the shallow aquifer system or land surface (as hot springs), given appropriate advection, conduction, and mixing conditions. Figure 2 illustrates how the advective transport of heat in vertical (upflow and downflow) and horizontal (lateral) groundwater flow can perturb a typical linear conductive geothermal gradient in measured temperature profiles. This concept gives rise to the idea of using heat as a groundwater tracer. Anderson (2005) provides a detailed review of the extensive work that has been done using heat as a tracer dating back to the 1950s [19]. This technique has been successfully used in many ways, including the estimation of recharge and discharge rates, hydraulic conductivities of streambeds, basin-scale permeabilities, and hyporheic zone flow patterns [19]. Herein, heat is used as a tracer to estimate vertical salinity fluxes at locations that have a temperature profile curvature that is indicative of groundwater upflow.

3. Materials and Methods

The analyses presented herein include using legacy temperature data to estimate the salinity flux associated with groundwater upflow zones within the study area. This methodology included data preparation, temperature profile curvature classification to identify upflow zones, and estimation of salinity fluxes from identified upflow zones and their host geothermal systems.

3.1. Description of Data

Data used in this study were historical industry, academic, and researcher data that were collected and/or compiled by the New Mexico Bureau of Geology and Mineral Resources. The analyzed dataset included 379 temperature profiles made up of 11,161 individual temperature measurements. Corresponding lithology records, which included thermal conductivity and porosity estimates in some cases, were identified for 199 (52.5%) profiles. Much of these data (98%) were collected during a period of extensive geothermal exploration within the study area in the late 1970s and early 1980s. Of all the profiles, 116 (31%) were measured in the 1970s, 253 (67%) were measured in the 1980s, and 8 (2%) were measured in 2018. Two profiles had unknown collection dates but were most likely measured in the late 1970s or early 1980s. Overall, measurement dates ranged from 21 April 1972 to 23 February 2018, with a median measurement date of 27 March 1980. Data preprocessing included correction of obvious typographical errors by consulting original records; conversion of depth and temperature units to meters and degrees Celsius, respectively; and removal of spaces, commas, periods, slashes, apostrophes, and personally identifiable information from well names. Per standard practice in the geothermal industry, the most recently measured profile was used to favor thermal equilibrium in instances where multiple temperature profiles were available at the same location. The final dataset of temperature profiles and corresponding well records was published as a U.S. Geological Survey (USGS) data release in 2019 [18]; the profile ID numbers used in this research correspond to those from the data release
In the final dataset, measured depths ranged from 1 to 910 m (median = 67 m), while measured temperatures ranged from 10.5 to 86.4 °C (median = 24.8 °C). Measurement intervals within the boreholes ranged from about 0.5 m to 20 m, with a median of about 3 m (10 feet). Reported measurement precision for temperatures were within 1 °C or better, whereas reported measurement precision for depth measurements were 1 m or less. A table with additional relevant details for the profiles is provided in Table S1.

3.2. Classification Analysis

Temperature profiles were classified based on their curvature (Figure 2) to facilitate identification of upflow zones and regions of warm lateral flow, which would be proximal to upflow zones. The analysis began by plotting the profiles for visual inspection (profile plots are provided in Figure S1). Temperatures measured near the land surface are subject to relatively short-term (e.g., daily, seasonal) temperature variations, and were considered data noise for this study’s objectives [33,34,35]. Temperatures measured within the first 20 m of the subsurface (surficial zone) were therefore omitted to avoid this interference; this is a conservative depth threshold that was chosen based on visual inspection of the profiles. Because this research seeks salinity flux estimates of upwelling groundwater, it was necessary to identify portions of profiles that were measured below the water table (i.e., saturated zone). Well records, smoothed profiles and their derivatives, and nearby USGS water level data were conjunctively used to estimate water table depth where feasible and thereby identify profiles warranting further analysis. Smoothing methods were used to aid in the identification of dominant profile and derivative characteristics. These methods included cubic smoothing splines and 2nd degree local regression (LOESS) fits. LOESS fits were computed with a smoothing parameter that was (1) held constant for all profiles (0.75), (2) determined by using a bias-corrected Akaike information criterion (AICC), and (3) determined by using generalized cross-validation (GCV), whereas spline fits all used leave-one-out cross-validation (LOOCV) to determine their degree of smoothness; the range of smoothing approaches was implemented to give an ensemble of reasonable smoothed profiles and derivatives. Smoothing fits were computed using the ‘stats’ (version 3.5.3) and fANCOVA (version 0.5-1) packages of the open-source R programming language (version 3.5.3) [36,37]; plots of the smoothed results overlain by the raw data for saturated profiles are provided in Figure S2. Profiles with less than four measurements below the estimated water table elevation at any given location were not further analyzed because of the insufficient amount of data to confidently assess profile curvature. Final classifications of profile curvature were plotted spatially and included: upflow, warm lateral flow, downflow/cool lateral flow, conductive, undetermined, and not analyzed.

3.3. Flux Estimation

Computing salinity flux estimates required coupling groundwater salinity data with volumetric upflow rate estimates. The Bredehoeft and Papadopulos (1965) 1D vertical heat transport analytical solution was applied to estimate a vertical specific discharge rate for each upflow profile [38]. This solution uses the thermal Peclet number (Pe), which is defined as the ratio of thermal advection to conduction as follows:
Pe = ρfcfqzL/Ke
where ρf is fluid density, cf is fluid specific heat capacity, qz is vertical specific discharge, L is the saturated thickness over which the temperature data were analyzed, and Ke is the effective thermal conductivity. Peclet numbers of larger magnitude correspond to higher vertical flux rates and more extensive profile curvature. Negative Peclet numbers indicate groundwater upflow, whereas positive Peclet numbers are associated with groundwater downflow. The practical minimum detectable Peclet number is typically considered to be around +/ 0.2 given thermal conductivity variations and measurement accuracy limitations [33]. Rearranging Equation (1) to solve for vertical flux yields the following expression:
qz = KePe/ρfcfL
Vertical flux can be estimated by specifying the thermal properties listed in Equation (2) and iteratively solving for the Peclet number that best matches measured temperatures when used in the Bredehoeft and Papadopulos (1965) analytical solution [38]. In this study, best-fit Peclet numbers were determined by minimizing root-mean-squared error (RMSE) between the analytical solution and the measured data. Fluid specific heat capacity was specified to be 4180 joules per kilogram per degrees Celsius (J/kg °C) at all locations. Fluid density was estimated by using the median analyzed profile temperature and the temperature-dependent water density relation of Kell (1975), which has been shown to be valid for water ranging in temperature from 0 to 150 °C [39]. Salinity effects on water properties were neglected because detailed water chemistry was not known for all evaluated waters. A sensitivity analysis performed in this study showed temperatures ranging from 25 to 100 °C affected fluid density by about 4%, whereas salinities ranging from 0 to 5000 TDS altered fluid density by 0.5% or less. Therefore, neglecting salinity effects on fluid density is acceptable for the conditions considered in this study. Effective thermal conductivities were estimated from well records and/or computed by using the geometric mean of reported solid and fluid thermal conductivities, as follows:
Ke = ks(1−n)kfn
where ks is the thermal conductivity of the solid phase (e.g., sediment grains), kf is the thermal conductivity of the fluid phase (e.g., air or water), and n is porosity. This relation has been shown to well approximate the effective thermal conductivity in previous studies [40]. Porosities were obtained from well records or previously published literature.
Associated spatial areas of upflow were then estimated by evaluating spatial temperature patterns, thermal cross sections, and the spatial distribution of profile curvature classifications. Thermal cross sections included temperature profiles that were projected onto cross-section profile lines. These data were overlain onto the basement stratigraphy and faults from Sweetkind (2017), along with topography from a USGS 1/3 arc-second (about 10 m) digital elevation model (DEM) [27,41]. Estimated areas were combined with the vertical flux estimates and salinities to determine the salinity flux associated with each local upflow zone, as follows:
JTDS = qzACTDS = QzCTDS
where JTDS is mass transfer rate (salinity flux in mass per time), qz is vertical specific discharge from the application of Bredehoeft and Papadopulos (1965) [38], A is upflow zone area, CTDS is the TDS concentration of upwelling groundwater, and Qz is volumetric vertical groundwater flux (Qz = qzA).
This approach for estimating salinity flux has limitations. For example, this approach considers only salinity contributions from localized upflow zones within the broader geothermal systems—salinity flux estimates are therefore conservative and flux from the entire geothermal system is higher. In addition to the localized analyses, estimates of salinity flux were therefore also computed for the broad geothermal systems if previously published geothermal volumetric flux values were available (Equation (3)). Identification of upflow zone locations was limited to portions of the study area where temperature profiles had been measured. It is therefore likely that other unidentified upflow zones contribute salinity to the area. Unaccounted-for fluxes could be evaluated in the future by using more comprehensive 3D heat and solute transport modeling and with additional data collection. Other key assumptions associated with this approach include steady-state thermal equilibrium between the well bore and its subsurface surroundings, constant groundwater and aquifer properties along the analyzed temperature profile interval, and that vertical flow dominates over horizontal flow within the upflow zones. Despite these assumptions, previously published uncertainty research that used synthetic temperature data indicates that reliable flux estimates can be obtained from the Bredehoeft and Papadopulos (1965) solution [38] in heterogenous media and when horizontal fluxes are 10 times greater than vertical fluxes, provided the temperature at the upper boundary is steady through time [35]. Overall, this methodology is thought to be a straightforward way of obtaining reasonable salinity flux estimates associated with geothermal systems and their localized upflow zones.
Previously published geothermal volumetric flux estimates were available for the East Potrillo and East Mesa geothermal systems and were coupled with groundwater salinities to make additional salinity flux estimates in this work. The previously reported estimates were typically for the broad footprint of the geothermal systems, rather than the localized upflow zones of those systems, thereby providing insight into the potential salinity contributions from the host systems. These estimates were derived by using heat-flow modeling techniques [6,12,13]. A typical workflow for obtaining these estimates included estimating heat flow from temperature profiles, constructing contour maps of heat flow from those results, integrating a total heat flux by using the newly constructed map, and subtracting off an assumed background heat flux to compute an amount of excess energy flux (energy flux less background) at the site of interest. That excess energy flux was then assumed to be a result of advection and was used to estimate a corresponding required volumetric groundwater flux to account for the estimated excess energy flux. A detailed mathematical description of this type of modeling is provided in Snyder (1986) [12]. This approach has its limitations, namely that it is tied directly to contoured maps of heat flow that may change appreciably based on contouring techniques and data coverage. Additional uncertainty comes from the common assumption of a reservoir temperature when converting excess energy flux to volumetric groundwater flux; this value is usually conservatively selected as the maximum measured temperature in any given area, which can lead to the underestimation of volumetric groundwater flux. Generally, heat flow modeling techniques are based on fundamental energy balance relations and provide a means to practically estimate geothermal groundwater flux over large areas.

4. Results

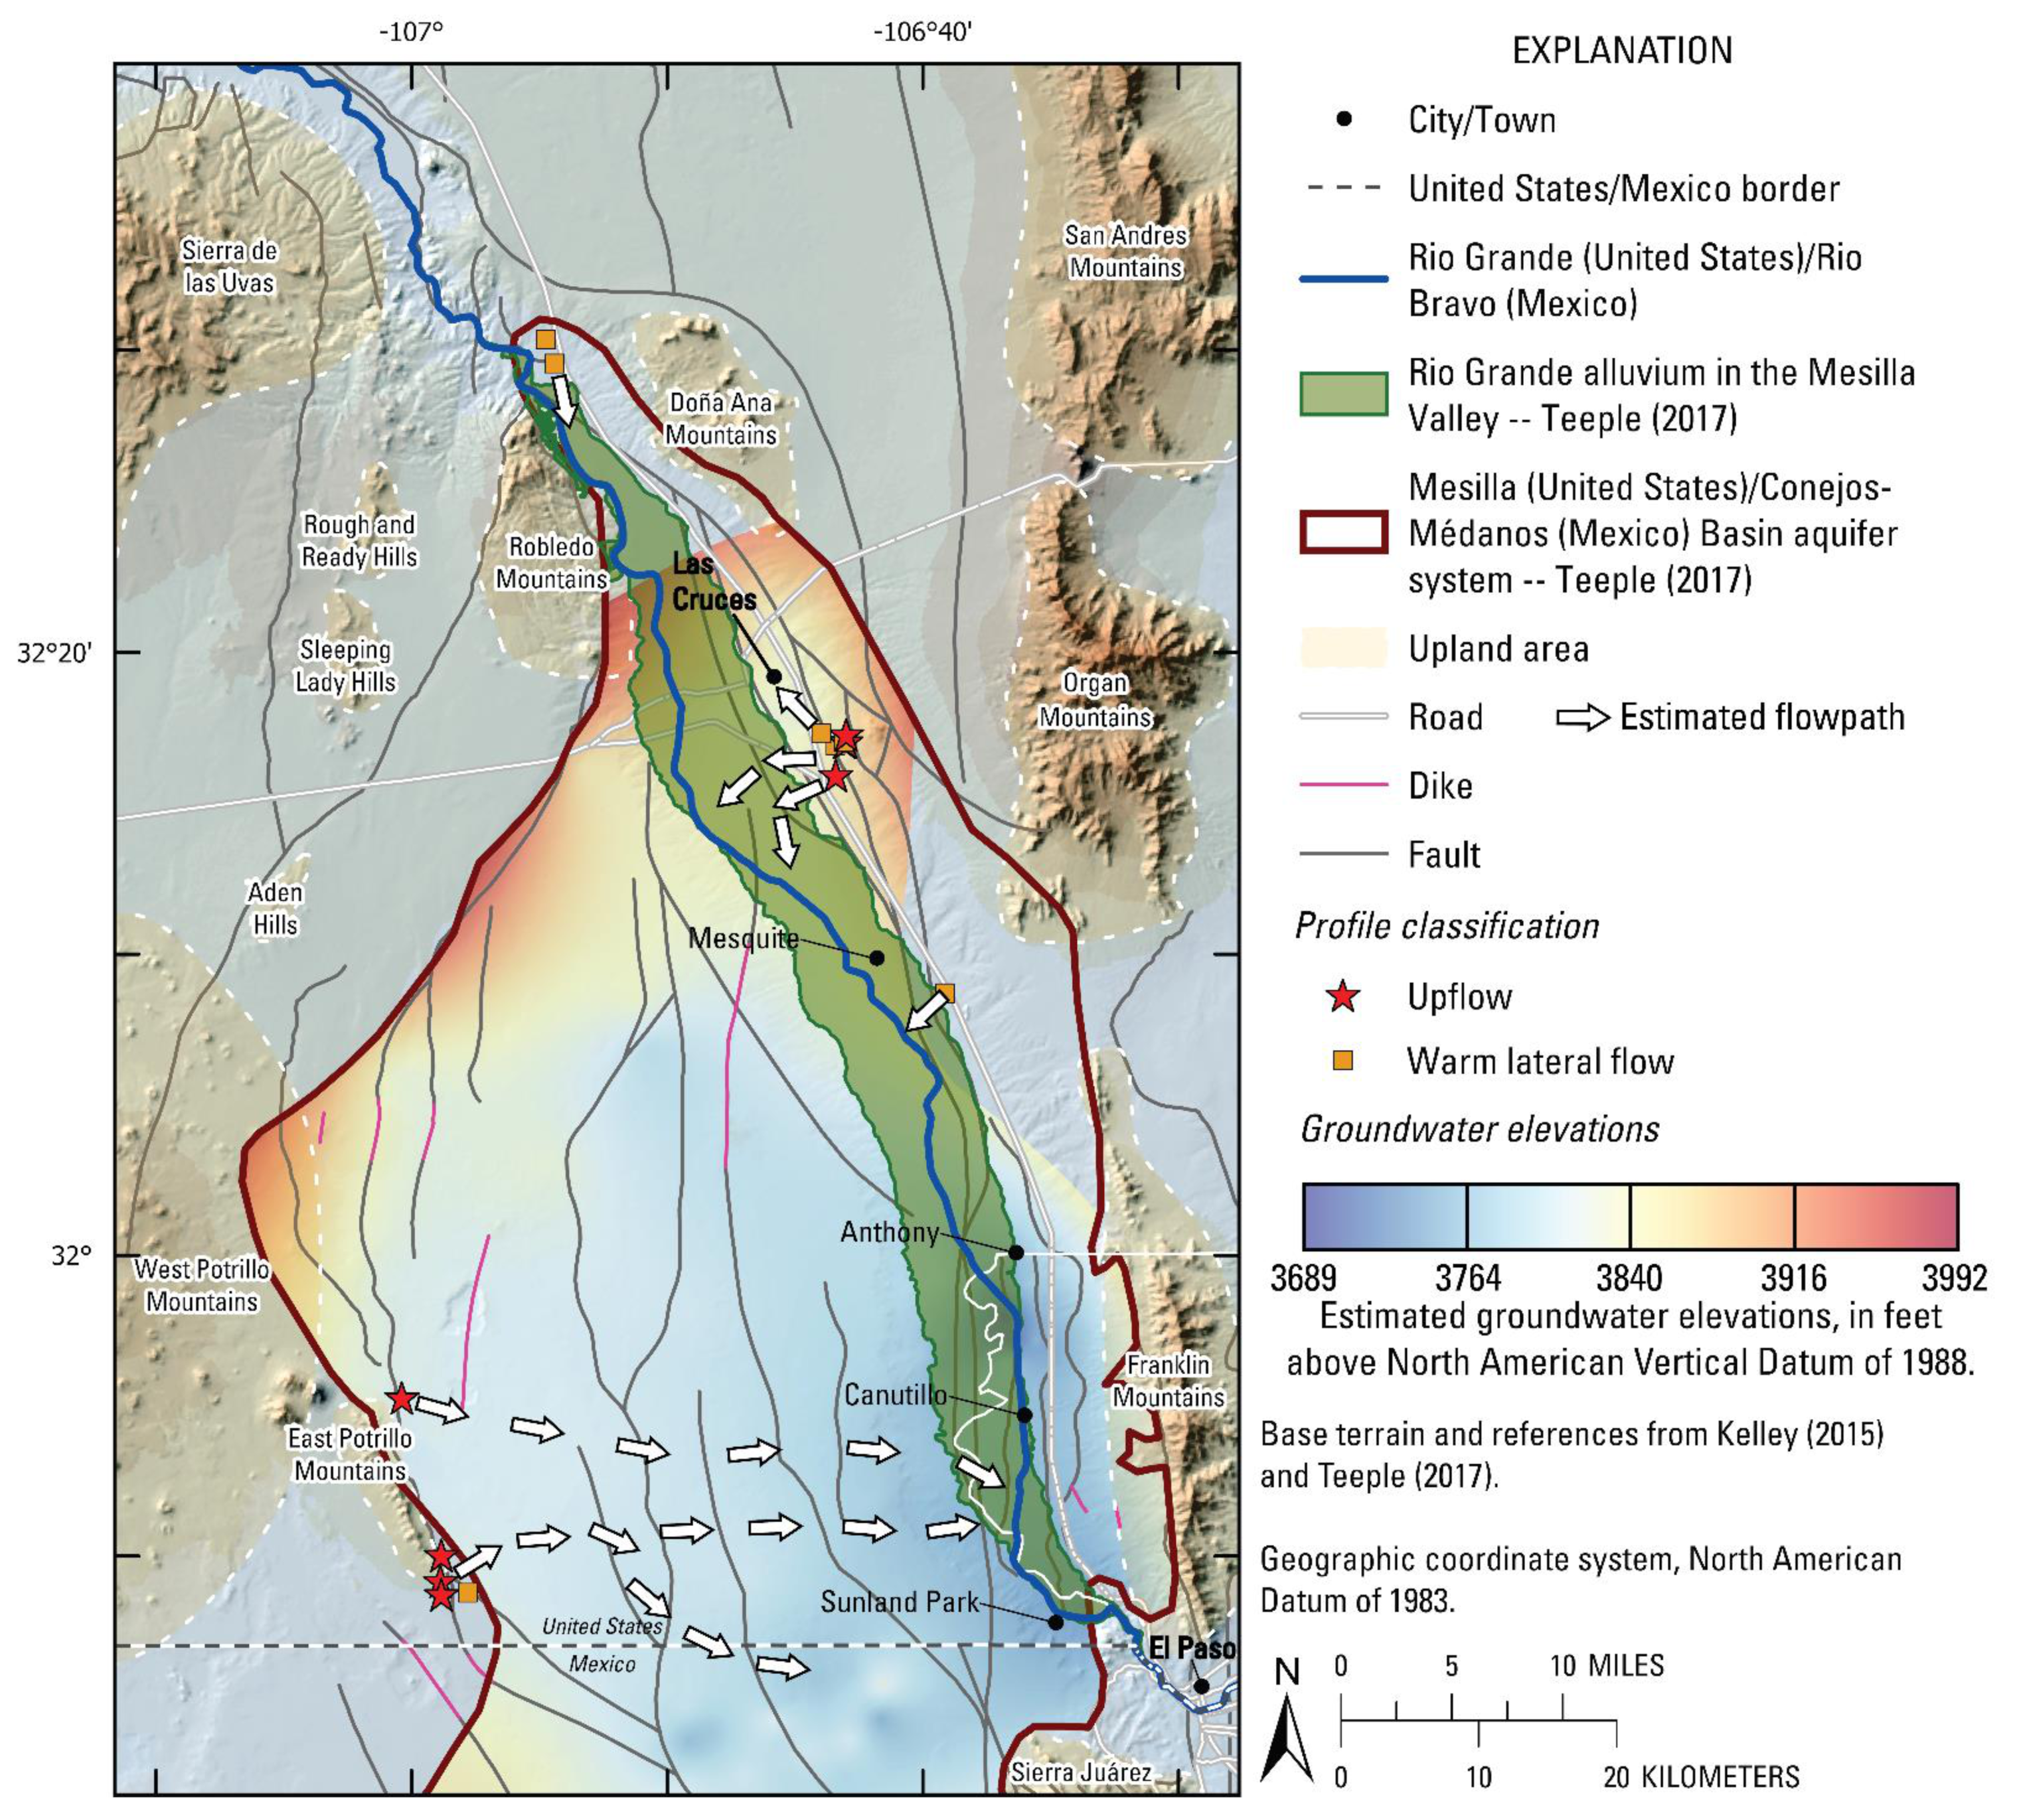
4.1. Classifications
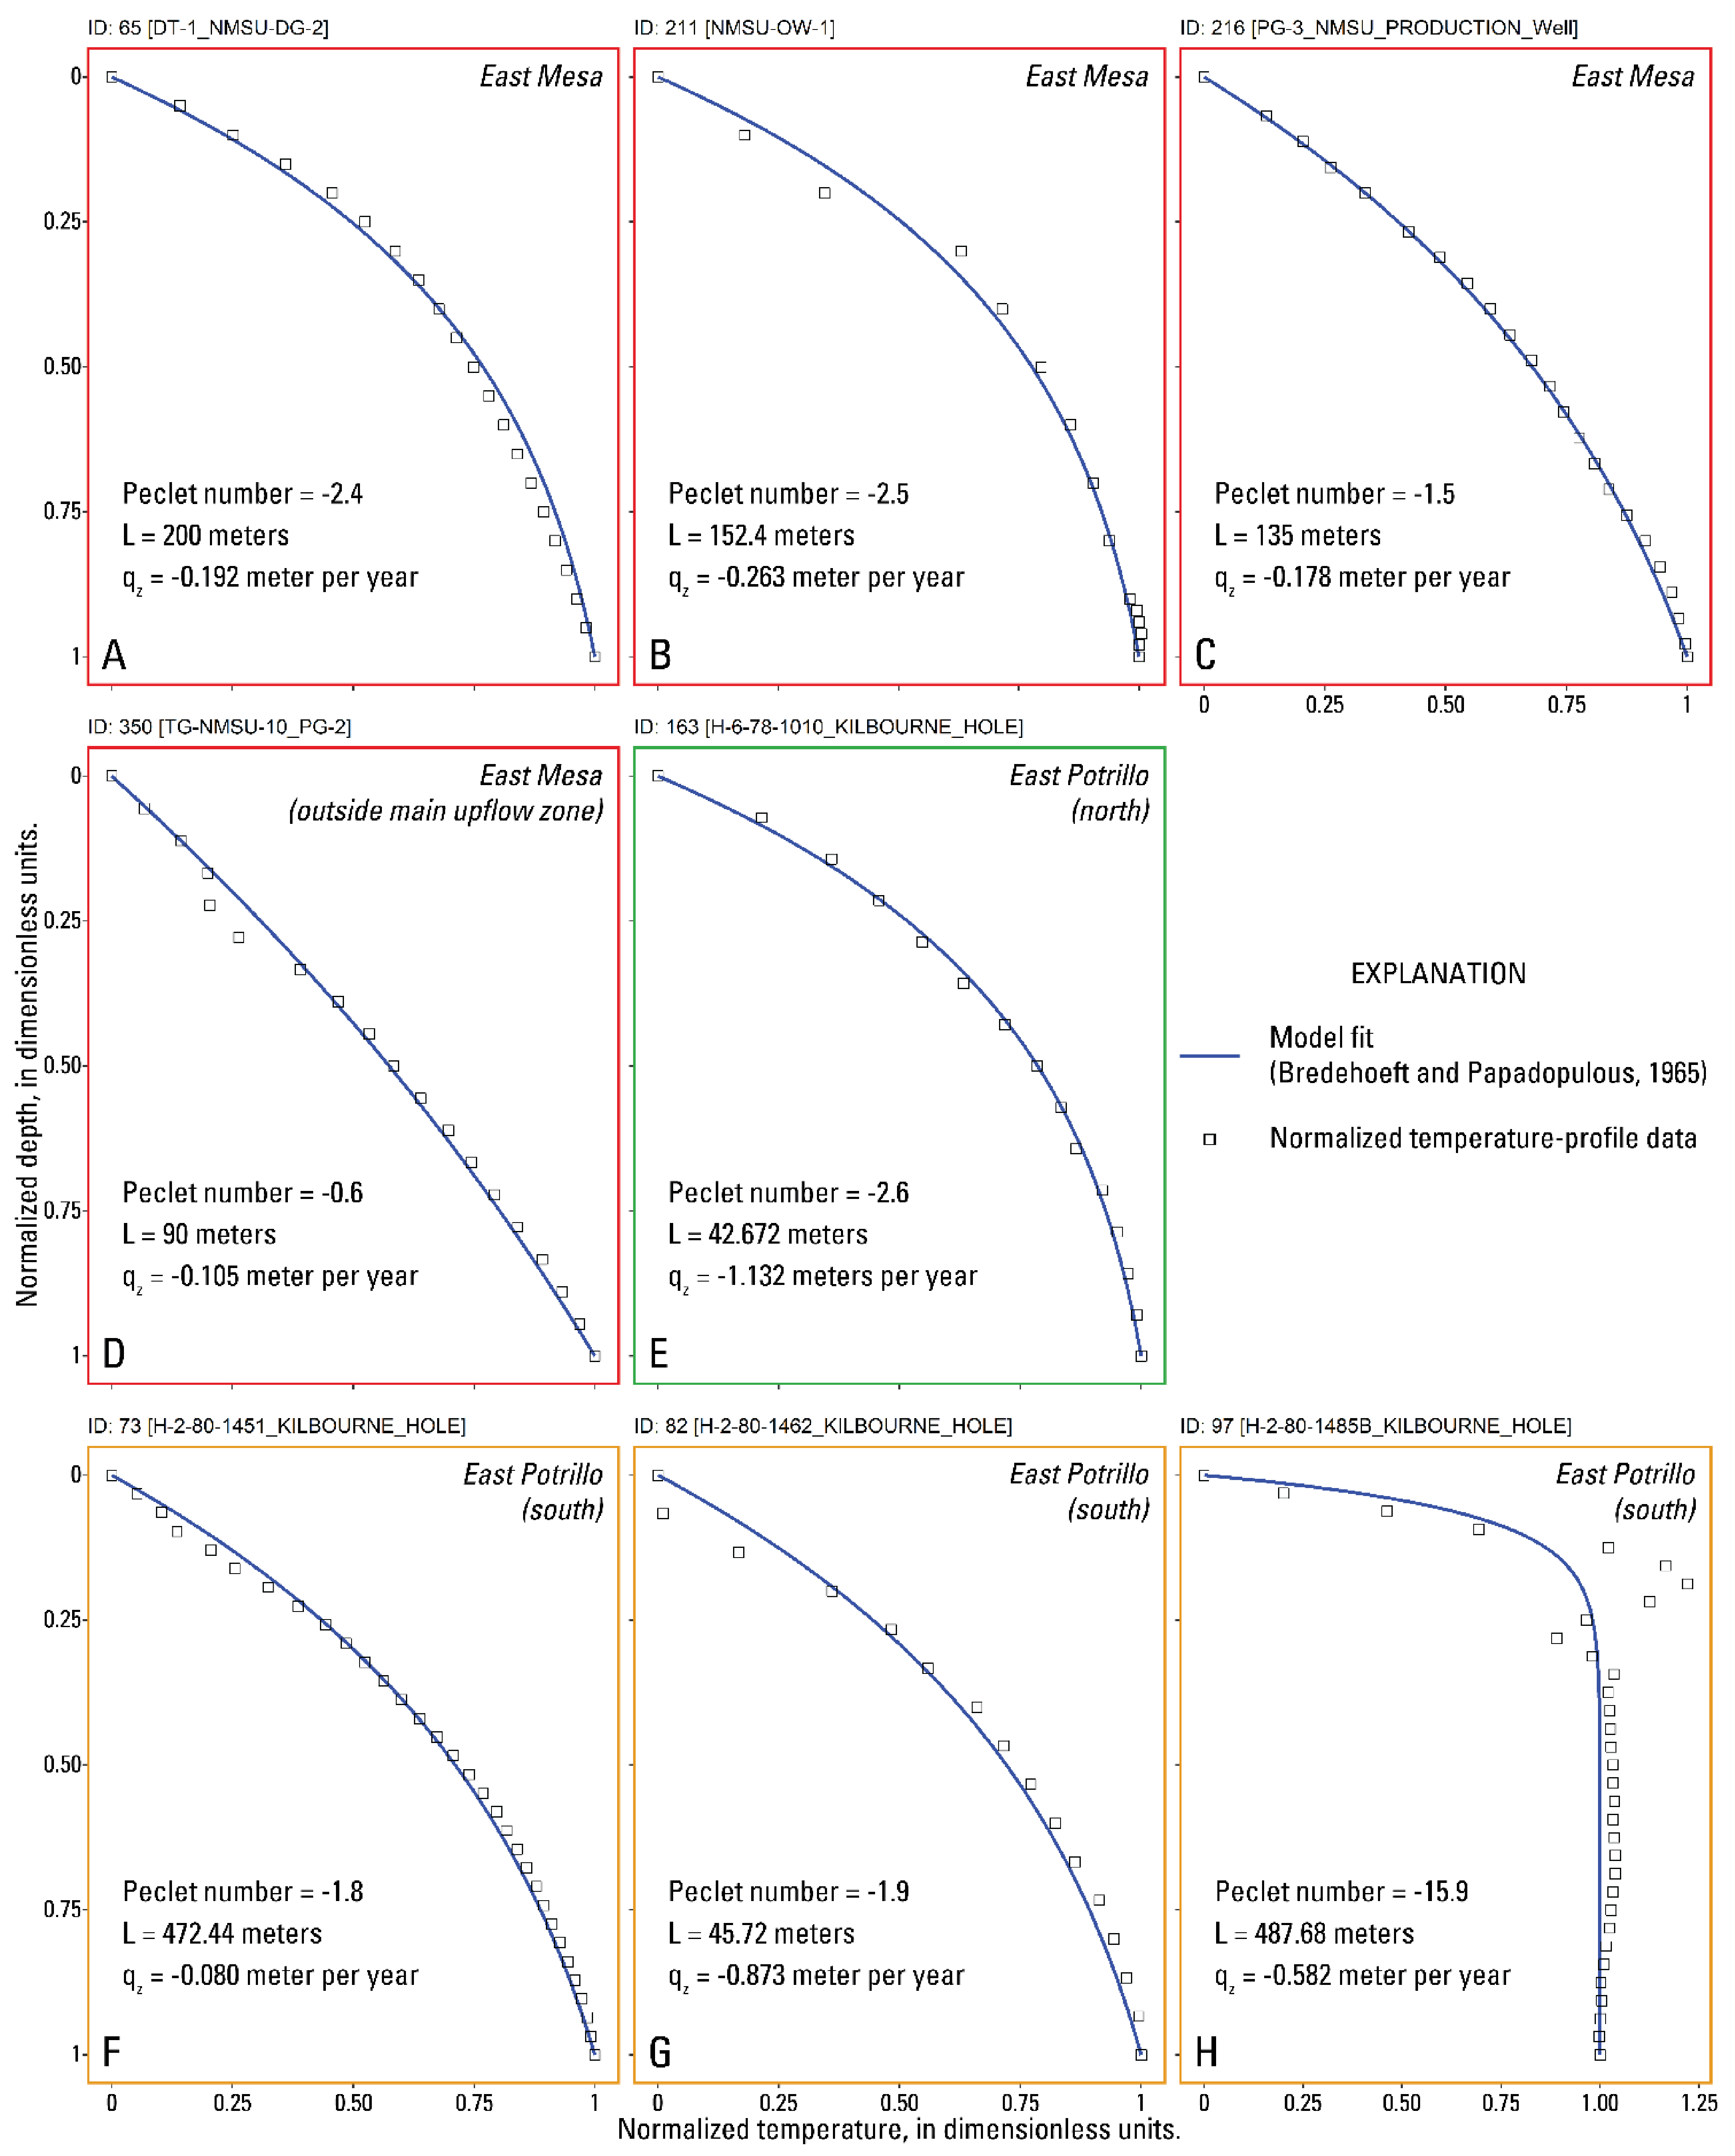
Figure 3 shows the spatial distribution of profile classifications. Profiles with upflow curvature (eight profiles) were identified in the eastern portion of the study area just south of Las Cruces and along the East Potrillo Mountains in the southwestern part of the study area. Upflow in the east is associated with the East Mesa geothermal system and the upflow profiles are within the developed portion of this system near Tortugas Mountain. Southwestern upflow is associated with the undeveloped East Potrillo geothermal system, where two upflow zones were identified along the east side of the East Potrillo Mountains. The northernmost of these two upflow zones, located about 12 km (km) north of the main East Potrillo upflow zone, has not been extensively studied by previous researchers because of its relatively low heat flow [12]. Nevertheless, profile curvature in this area indicated upwelling groundwater, albeit at lower temperatures relative to the southern portion of the geothermal system.
Profiles with curvature indicating warm lateral flow (seven profiles) were found within the East Potrillo and East Mesa geothermal systems. Interestingly, lateral flow profiles were not identified near the northern East Potrillo upflow zone, thereby indicating relatively slow horizontal groundwater flow rates within the aquifer system. An isolated warm lateral flow profile was identified about 17 km south of the developed East Mesa upflow zone. Measured saturated geothermal gradients (rate of temperature change with depth) were very high (about 125 °C/km) above the horizontal flow horizon at this site relative to typical conductive gradients in the study area (around 35 °C/km), thereby indicating a proximity to warm upwelling groundwater [42]. The precise location of the upflow zone is unknown due to limited data coverage, but it is within the extensive footprint of the East Mesa geothermal system and therefore likely has similar groundwater chemistry (TDS around 1800 mg/L) [15]. Warm lateral flow profiles were also associated with the Radium Springs geothermal system in the northern part of the study area near the RG-LB stream gage (Figure 1). Although no upflow profiles were measured, these warm lateral flow profiles are certainly in the vicinity of upwelling geothermal fluids with appreciable salinity (likely around 3650 mg/L based on produced water TDS at Radium Springs).
Downflow/cool lateral flow profiles (nine profiles) were all within or near the Mesilla Valley. This indicates surface water recharge and cool lateral groundwater flow within the permeable Rio Grande alluvium in the valley. This finding also agrees with previous work that indicated negligible recharge outside of the Mesilla Valley because of the depths to groundwater, effective water consumption by desert vegetation, and the presence of caliche [17,20,29].
The remaining profiles were either linear (conductive, 101 profiles) with little evidence of advective disturbance, too difficult to confidently classify (undetermined, 13 profiles), or simply not further analyzed because of insufficient data below the water table or surficial zone or inadequate data to estimate the depth to the water table (not analyzed, 241 profiles).
Overall, these results indicate the presence of three primary upflow zones and at least two more isolated upflow zones in the study area, all of which are associated with the known geothermal systems in the region.

4.2. Flux Estimates

Several interrelated lines of data were used to estimate salinity fluxes from identified upflow zones. Insets of the regions with upflow profiles are presented in Figure 4, with corresponding thermal cross sections provided in Figure 5, and vertical heat transport analytical solution fits shown in Figure 6. A summary of the flux estimates and input parameters is provided in Table 1.

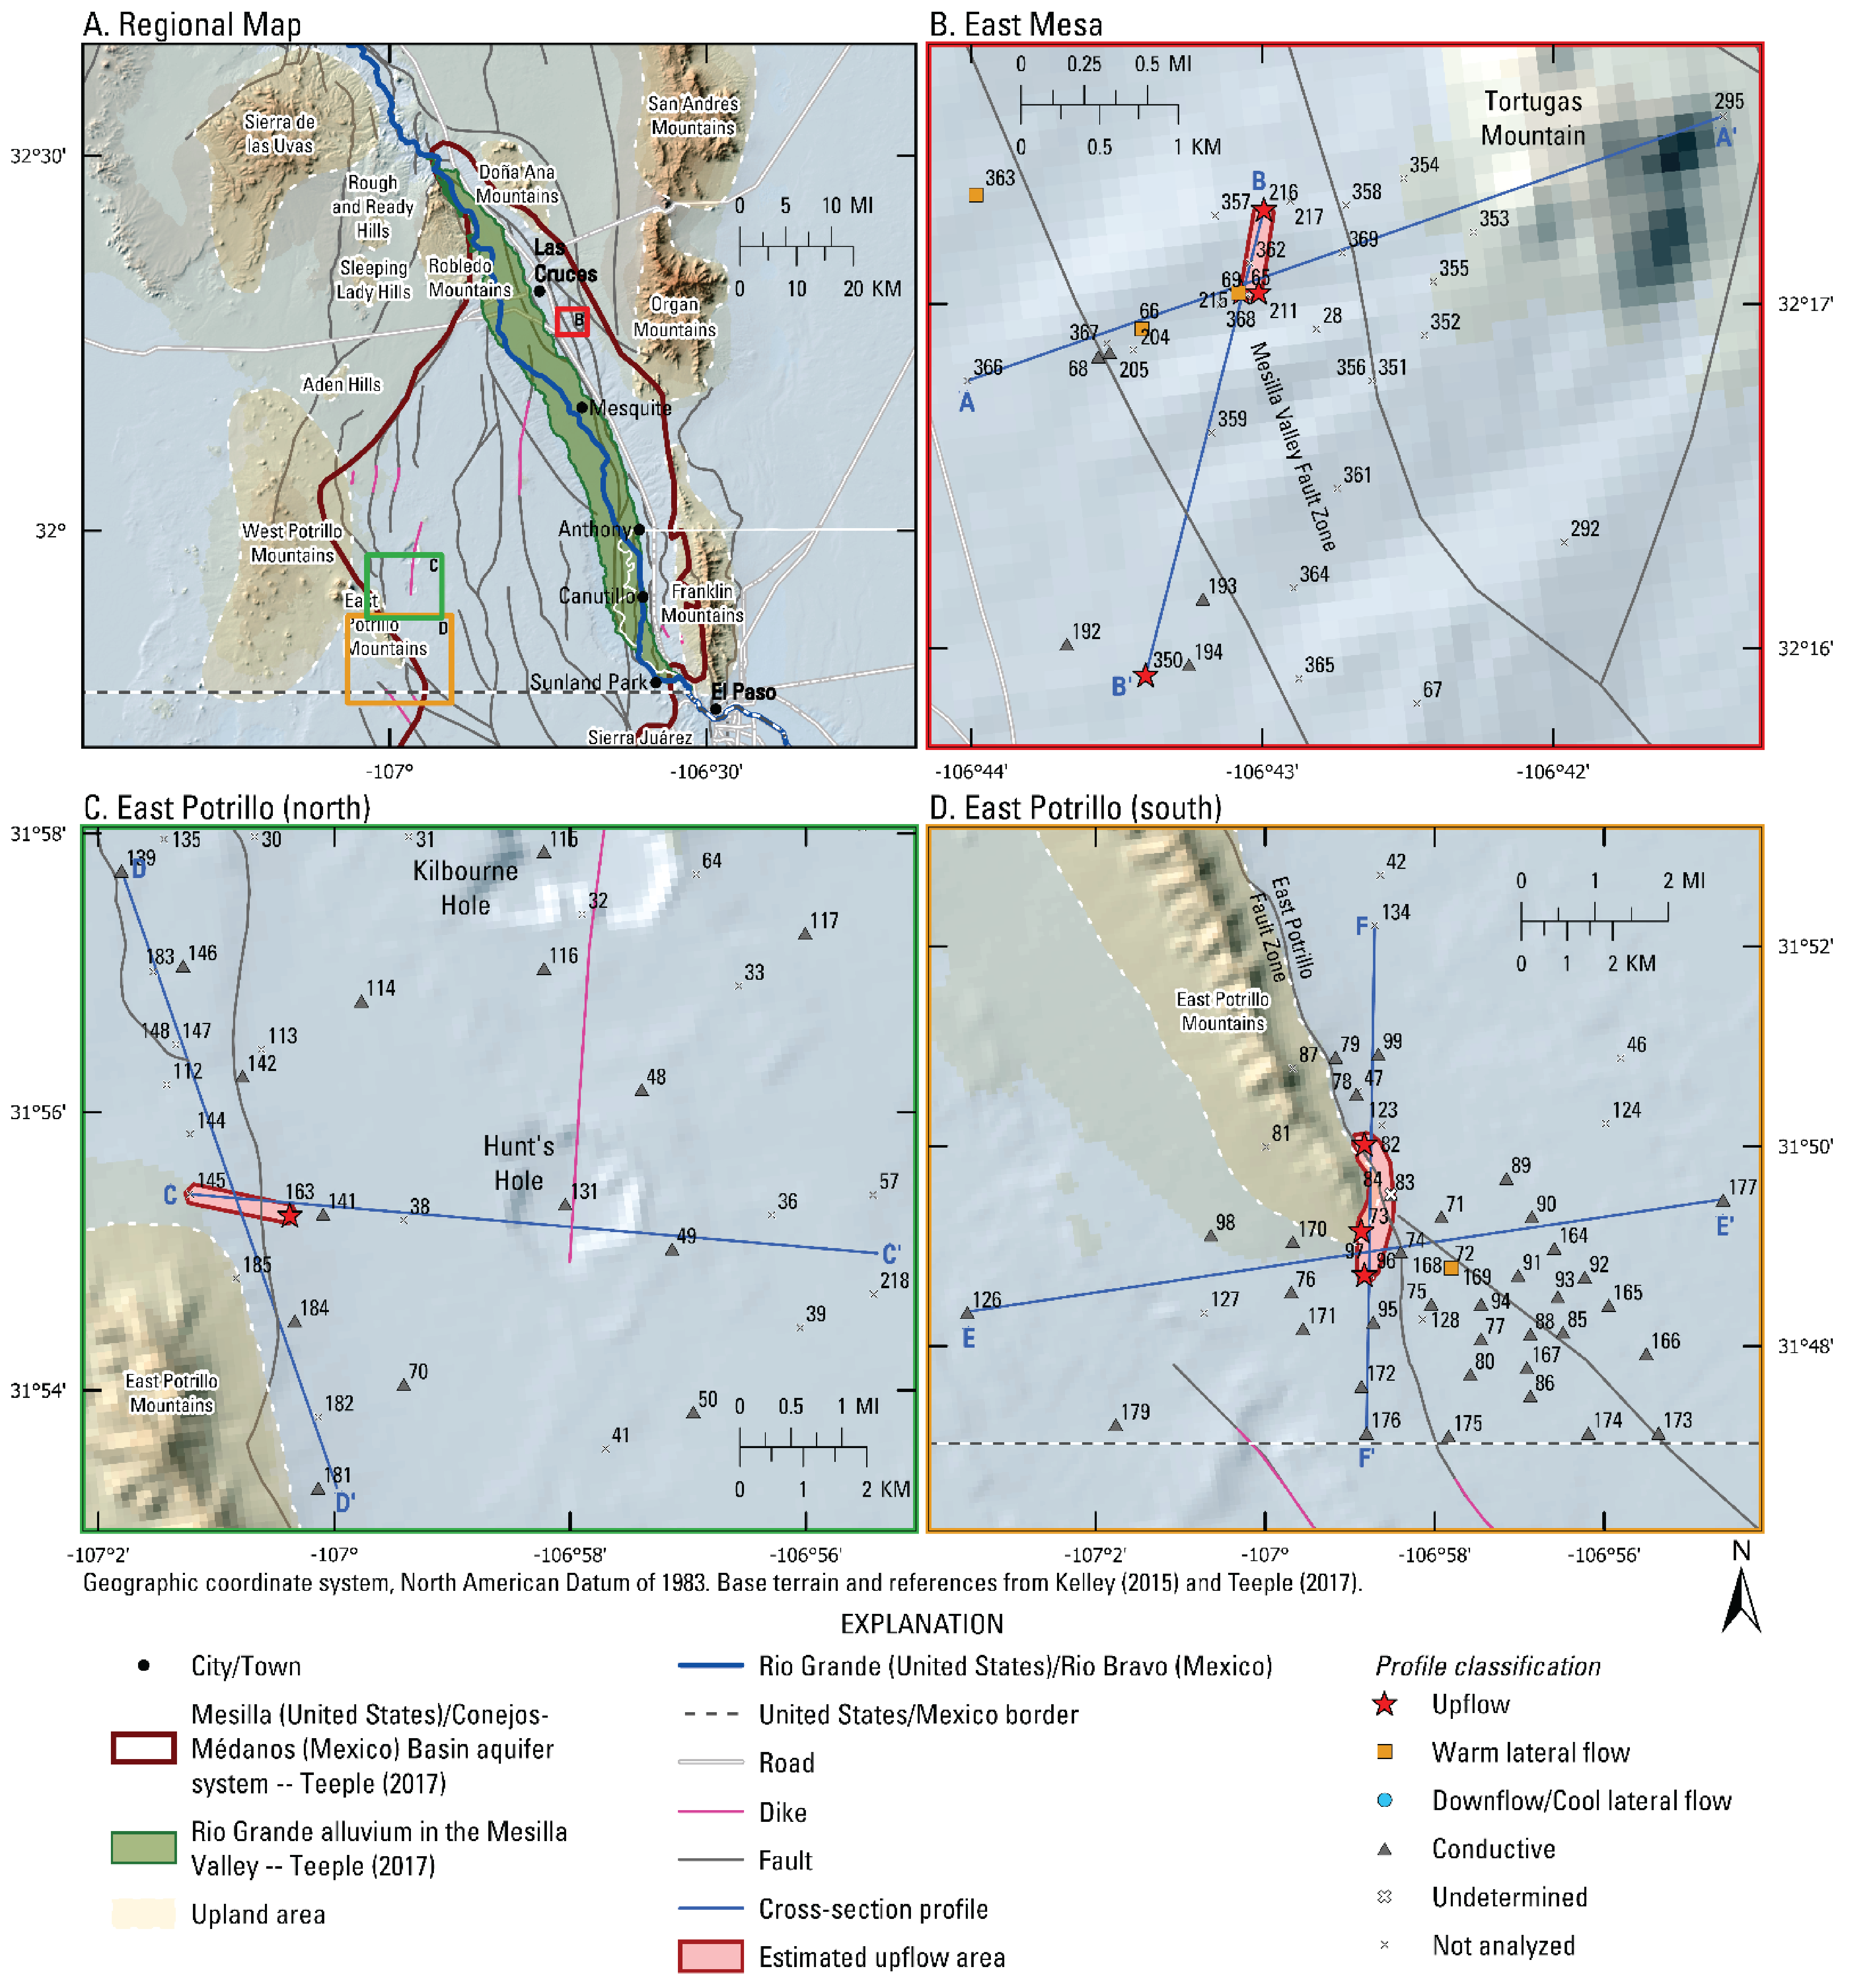
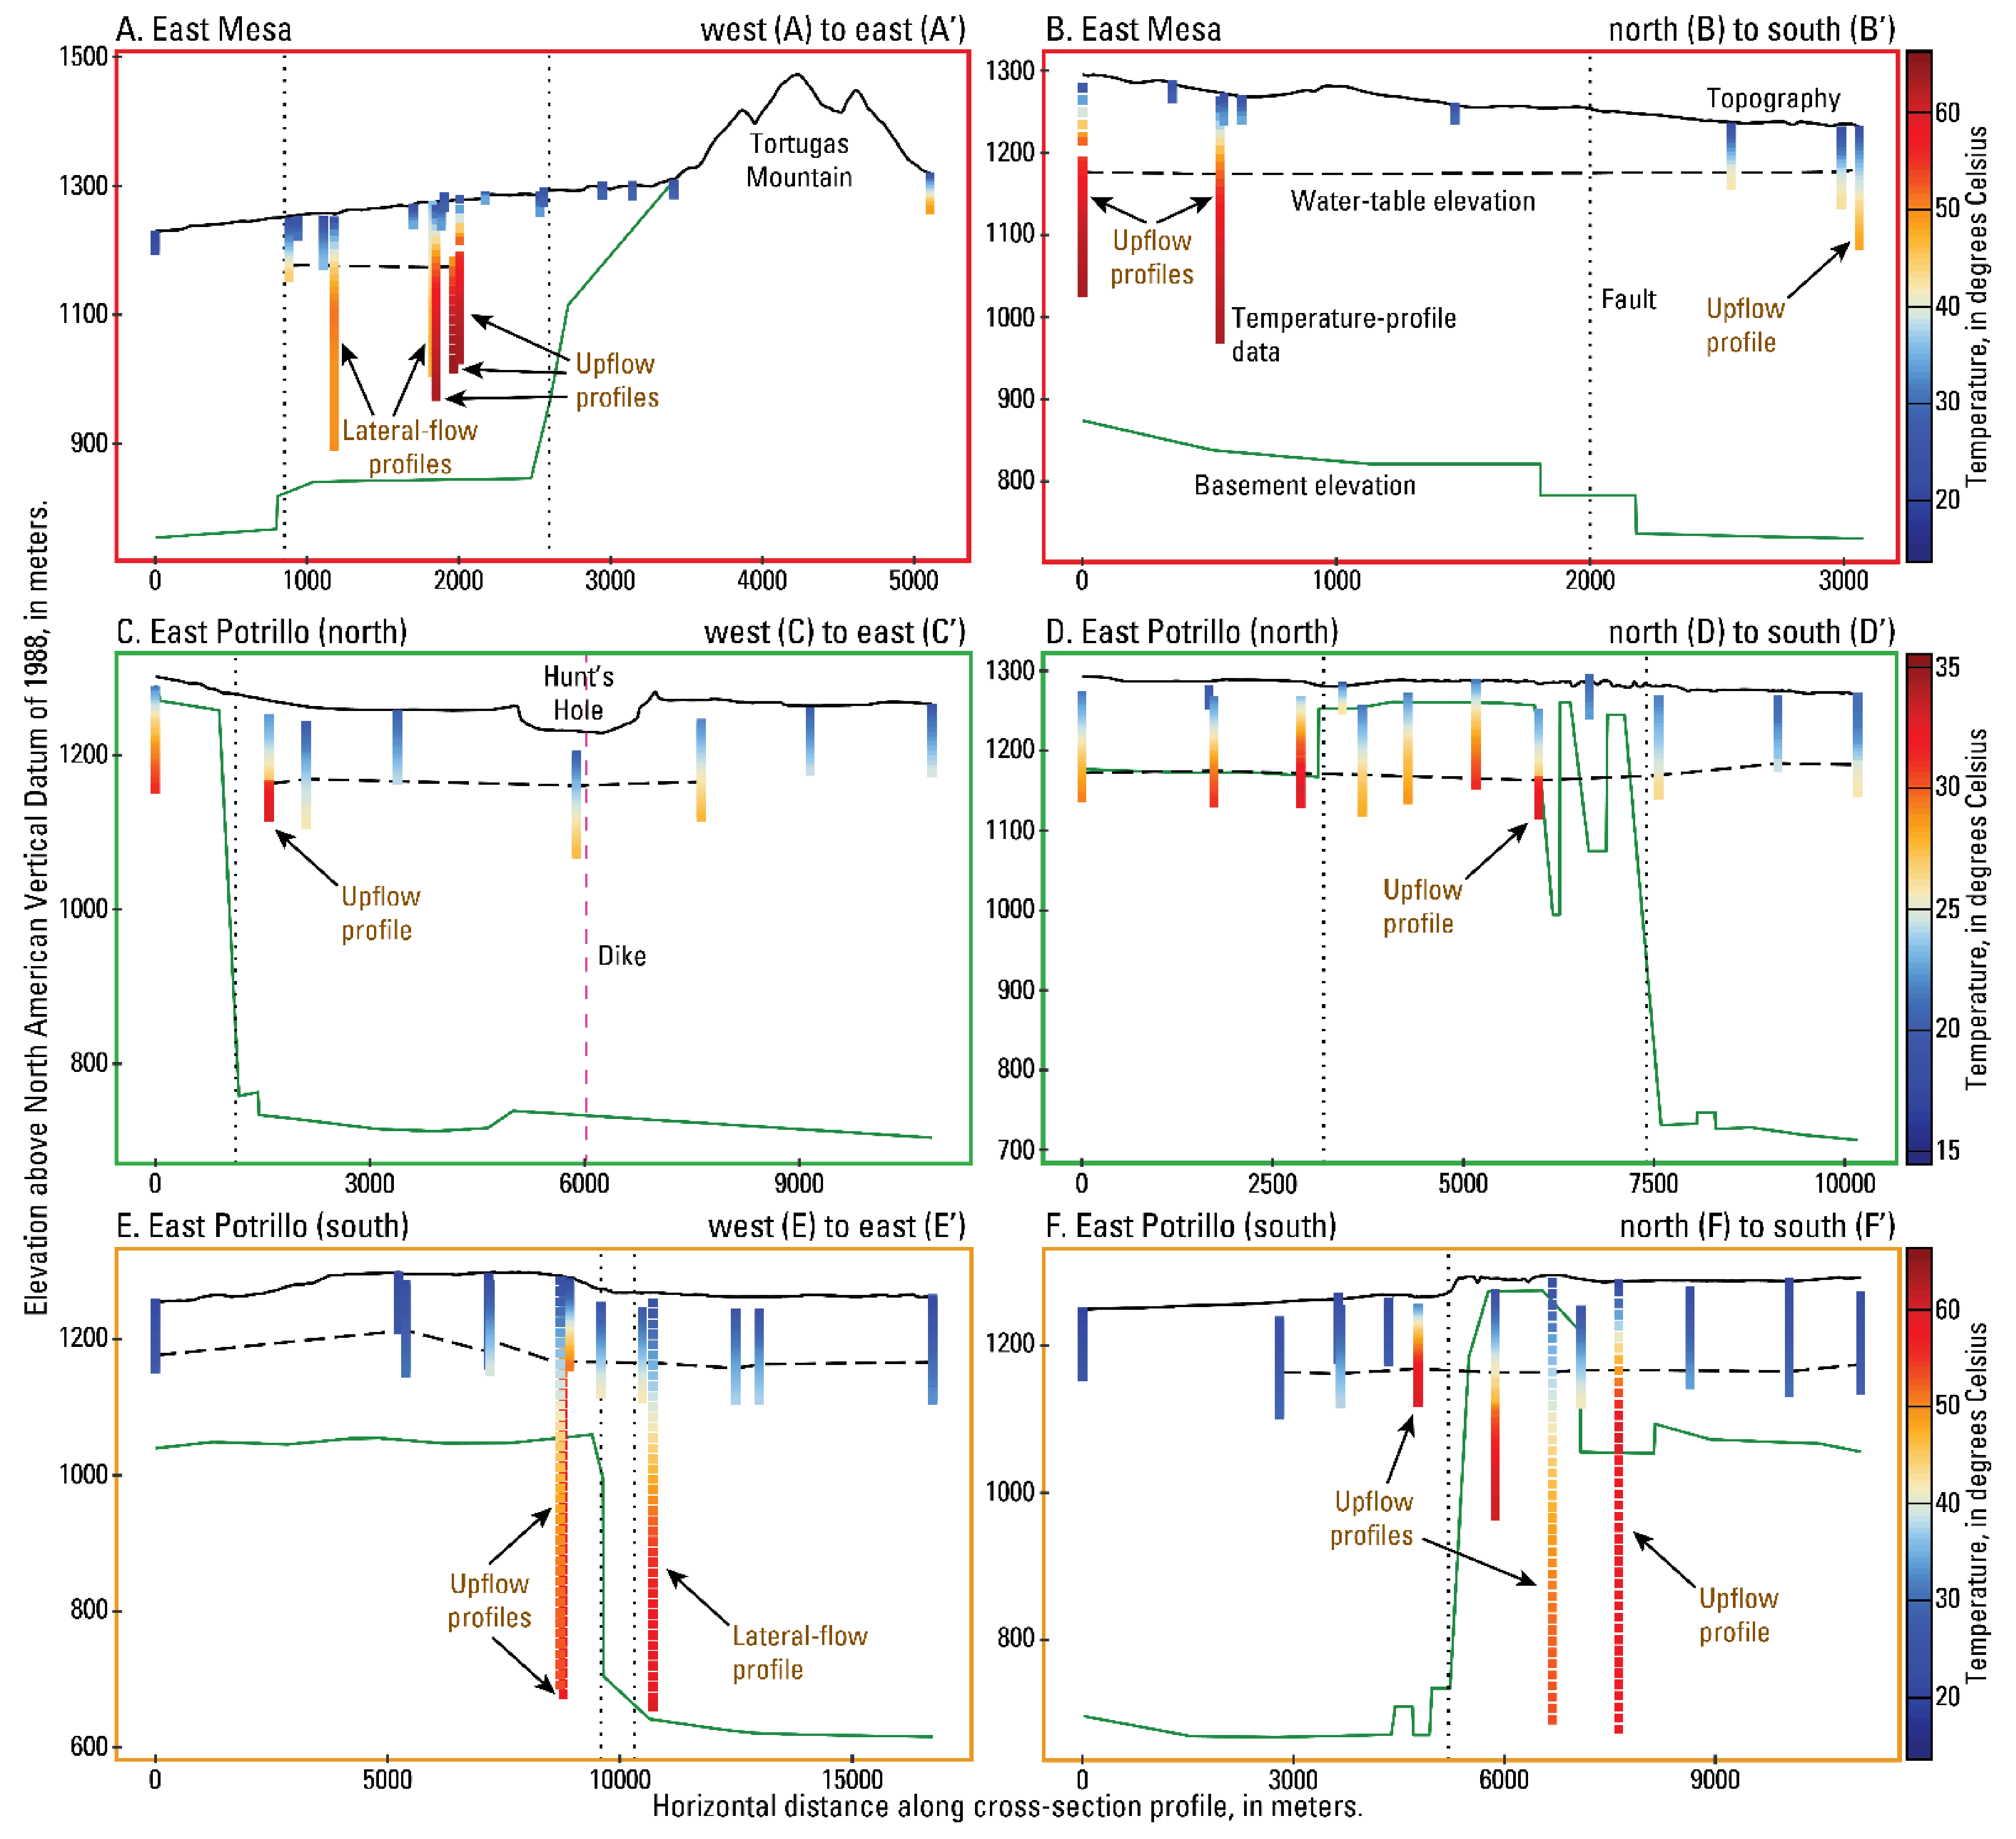
4.2.1. East Mesa Upflow

The main East Mesa upflow zone was indicated by three upflow profiles in proximity to one another, while an additional localized upflow zone was denoted by an isolated fourth upflow profile about 2 km to the southwest (Figure 4B). Thermal cross-section A-A’ clearly shows a zone of high temperatures that are associated with the upflow profiles at a horizontal distance from A of around 2000 m (Figure 5A). Measured temperatures were cooler to the west where profile classifications indicated lateral flow of upwelling groundwater. The upflow profiles were measured in the Santa Fe Group sediments that overlie the basement, which has been offset locally by the Mesilla Valley fault zone. This fault zone, and the resulting enhanced permeability and irregular basement geometry, are no doubt key hydrogeologic controls on the location of the main upflow zone. Elevated temperatures on the east side of Tortugas Mountain indicated the presence of an additional upflow zone or continuation of the main upflow zone beneath Tortugas Mountain, though this remains uncertain due to the scarcity of deep temperature measurements near Tortugas Mountain (Figure 5A). A similar ambiguity exists in the B-B’ thermal cross section where only shallow temperature profiles separated the main upflow zone from the isolated upflow profile (Figure 5B). The isolated upflow profile at the southern end of B-B’ was surrounded by elevated temperatures, but they were not as high as those at the main upflow zone, thereby making it unknown how far the main upflow zone extends. The main upflow zone area was therefore conservatively estimated to be 53,900 square meters (m2). This estimate ignored the isolated upflow zone because a continuous connection or corresponding area could not be confidently estimated.
The data indicate the potential for a much larger area of upflow, so the areal estimate, and the corresponding fluxes, are considered minimum values for the main upflow zone. Application of the Bredehoeft and Papadopulos (1965) 1D vertical heat transport analytical solution [38] to each profile yielded a range in vertical specific discharge rates at the main upflow zone of −0.178 to −0.263 m per year (m/y), where the negative sign denotes upflow (Figure 6A–C). Computed upflow rates for the isolated upflow profile were lower at −0.105 m/y (Figure 6D), which may explain why associated temperatures were cooler at this location, because slower upflow rates typically yield more conductive cooling during groundwater ascent. Multiplying vertical flow rates from the main discharge zone by its estimated area provided a volumetric flux range of 4.8 to 7.1 gallons per minute (gpm), or 7.8 to 11.5 acre-feet per year (afpy). Coupling this vertical flux with the typical groundwater salinity of the East Mesa geothermal system (1800 mg/L) yielded an estimated salinity flux of 19 to 28 tons of dissolved solids per year (t/y).
Previous researchers using heat flow modeling techniques have estimated that total groundwater flux from the entire East Mesa geothermal system, rather than its localized upflow zones estimated here, exceeds 15,000 afpy, with between 1225 and 1780 afpy coming from the region surrounding Tortugas Mountain [6,13,32]. Coupling these previous groundwater flux estimates with the typical salinity of the East Mesa waters (1800 mg/L) yielded an estimated salinity flux of 36,713 t/y for the entire East Mesa geothermal system and 3000 to 4362 t/y for the Tortugas Mountain region. Each of these salinity flux estimates greatly exceed the estimated flux range for the main localized upflow zone. This indicates that the diffuse and more spatially distributed salinity flux from this system is substantially higher than that of its localized upflow zones. The large difference between the estimated salinity flux from the localized upflow zone near Tortugas Mountain (19 to 28 t/y) and the estimates for the more extensive Tortugas Mountain region (3000 to 4362 t/y) further highlights this concept and indicates that additional deep temperature data could be useful in identification of additional upflow profiles in the Tortugas Mountain area.

4.2.2. East Potrillo Upflow

The main East Potrillo upflow zone (East Potrillo (south)) was indicated by three upflow profiles located near each other, whereas the more isolated East Potrillo upflow zone (East Potrillo (north)) had just one upflow profile (Figure 4C,D). Thermal cross sections of the northern upflow zone indicated upflow along the East Potrillo fault zone with likely lateral flow to the east, as evidenced by the temperature distribution even though no lateral flow profiles were identified (Figure 5C,D). The lack of lateral flow curvature to the east indicates that groundwater flow rates may slow once the waters enter the shallow aquifer system. Elevated temperatures to the north of the northern upflow zone, indicated around 2500 m of horizontal distance on Figure 5D (profile ID 148), suggested the probable presence of an additional upflow zone, although no upflow profiles were observed. Thermal cross sections of the southern East Potrillo upflow zone (Figure 5E,F) showed higher temperatures than the northern upflow zone, with upflow along the East Potrillo fault zone (note that the temperature scales differ between Figure 5C–F). Upflow profiles were spatially distributed in a north–south trend with a lateral flow profile indicating eastward groundwater flow of upwelling waters. In addition to the clear association of both upflow zones with the East Potrillo fault zone, upflow profiles were also associated with bedrock highs (Figure 5C–F). Like the main East Mesa upflow zone, faulting and resulting enhanced permeability and bedrock geometry certainly play strong roles in the location of these upflow zones. The northern East Potrillo upflow area was estimated to be 361,700 m2, whereas the southern upflow zone was estimated at 1,357,700 m2. Estimated areas were conservatively estimated to avoid overestimation of salinity flux.
Areas associated with both East Potrillo upflow zones were much greater than the area of the main East Mesa upflow zone, which resulted in substantially larger associated fluxes. The 1D vertical groundwater flux estimate for the northern upflow zone was −1.132 m/y (Figure 6E), while estimates for profiles in the southern upflow zone ranged from −0.080 to −0.873 m/y (Figure 6F–H). One profile (ID 97) showed appreciable warm lateral flow effects within the shallowest quarter of the profile that were essentially ignored during flux estimation (Figure 6H); well records showed drillers lost drilling fluid circulation in the vicinity of the lateral flow effects, thereby indicating fracture-controlled lateral flow may be important here. As a result of the lateral flow effects, this profile had greater uncertainty in the flux estimation, but the computed value (−0.582 m/y) was still bracketed by the overall flux range for the upflow zone. Multiplying the 1D flux estimated by the upflow areas yielded volumetric flux estimates of 206 gpm for the northern zone and 54 to 596 gpm for the southern zone. These estimates corresponded to 332 afpy for the northern zone and 87 to 961 afpy for the southern zone. Coupling these groundwater fluxes with the estimated groundwater salinity of the East Potrillo geothermal system (4823 mg/L) yielded a salinity flux of 2177 t/y for the northern zone and 575 to 6302 t/y for the southern zone, or a combined total of 2752 to 8479 t/y.
Snyder (1986) estimated total groundwater flux from the southern portion of the geothermal system to be 970 afpy, which agrees well with the upper estimate from this study of 961 afpy [12]. Snyder’s flux estimate corresponded to a salinity flux of 6347 t/y. While this estimate ignored contributions from the northern upflow zone, it indicates that most upwelling salinity at the East Potrillo geothermal system is likely associated with somewhat localized upflow zones rather than broad diffuse upflow. This is in contrast to the East Mesa salinity contributions, which are likely much more distributed throughout the associated geothermal system.

5. Discussion

Salinity fluxes from geothermal systems within the study area could account for a notable amount of Rio Grande salinity if the geothermal waters eventually discharged into the Rio Grande. From 2009 through 2013, the Rio Grande, on average, delivered about 205,000 t/y to the Mesilla outlet near the El Paso stream gage (RG-EP; Figure 1) [4]. Assuming all geothermal salinity contributions are more or less constant through time and eventually make their way to the Rio Grande, the 36,713 t/y from the East Mesa geothermal system as a whole could account for around 18% of average annual Rio Grande salinity, while the 8479 t/y from the East Potrillo geothermal system may contribute about 4% of average annual Rio Grande salinity. Identified local upflow zones associated with these geothermal systems expectedly could contribute less salinity, with the main identified East Mesa upflow zone potentially accounting for only about 0.01%, the northern East Potrillo zone contributing around 1%, and the southern East Potrillo zone adding 0.3 to 3% of Rio Grande salinity. The localized East Mesa upflow zone was located within the more extensive Tortugas Mountain region that had an estimated salinity flux of 3000 to 4362 t/y, which would account for about 1.5 to 2% of Rio Grande salinity. The Basin is a dynamic groundwater region, thereby making it uncertain whether these solids do indeed eventually make their way to the Rio Grande; potential flowpaths are considered later in this discussion section.
These proportions could be exacerbated in periods of low streamflow due to reduced dilution. In these periods, geothermal inputs have the potential to account for a much larger percentage of Rio Grande salinity. For instance, in 2013 the Rio Grande salinity delivery to the RG-EP stream gage at the basin outlet lessened to around 55,000 tons of dissolved solids because of reduced upstream reservoir releases [4]. Geothermal salinity contributions in that particular year could have amounted to 67% from the East Mesa geothermal system, with 5.5% to 8% from the Tortugas Mountain region, and about 15.5% from the East Potrillo geothermal system. Additional salinity could be contributed to the Rio Grande from the Radium Springs geothermal system within the study area. Previously published groundwater flux estimates were unavailable at the time of this study and only warm lateral flow profiles were identified near this geothermal system due to data coverage limitations. This system is known to produce waters with salinities around 3650 mg/L and could be an additional noteworthy natural salinity source that was not accounted for in this work. Overall, this study shows the appreciable potential geothermal salinity contributions to the Rio Grande, especially during periods of low streamflow.
Previously published water level mapping provides further insight into the regions influenced by identified upwelling and laterally flowing geothermal waters. Figure 7 presents upflow and warm lateral flow profile locations with interpolated groundwater elevations from measurements made in 2010 in the shallow aquifer system [20]. Warm lateral flow associated with the Radium Springs geothermal system near the basin inlet is predicted to flow south towards the Rio Grande. Similarly, warm groundwater associated with an isolated lateral flow profile near Mesquite within the footprint of the East Mesa geothermal system is projected to flow to the southwest towards the Rio Grande. Groundwater upwelling near Tortugas Mountain is thought to follow a west-southwest trajectory towards the Rio Grande, with evidence of some upwelling groundwater laterally flowing to the northwest where it is intercepted by wells near Las Cruces. Upflow along the East Potrillo Mountains is predicted to gradually flow eastward toward the Rio Grande and southern Mesilla with a portion of the flow crossing the United States/Mexico international border before being intercepted by municipal wells in the Conejos-Médanos; water quality data was not available for that particular portion of the municipal wellfield that would have allowed further evaluation. Generally, water level mapping underscores the likelihood that upwelling geothermal groundwater affects the Rio Grande and indicates that groundwater supplies in Las Cruces, the southern Mesilla, and municipal production in the northern Conejos-Médanos could be adversely affected by these geothermal systems.
Where does this upwelling brackish groundwater originate? Most geothermal systems in New Mexico, with exception of the active Valles Caldera volcanic system in northern New Mexico, are thought to result from amagmatic (non-magmatic) heating of infiltrating recharge [13,43]. A common multi-step conceptual model is as follows:
  • Upland precipitation infiltrates;
  • Infiltrated groundwater is heated by the Earth’s natural geothermal gradient as it flows deeper within the Earth’s crust;
  • Salinity of heated waters increases as the groundwater interacts with sediments and rocks along its flowpath;
  • Resulting brackish waters discharge at regional topographic lows, through zones of enhanced permeability (commonly caused by faults), and/or through gaps in overlying lower-permeability stratigraphic layers.
Previous researchers have linked the East Mesa and Radium Springs geothermal systems with geothermal upwelling within fault zones along uplifted bedrock and fractured igneous intrusions, respectively [13,14,15,16]. This agrees well with the strong correlation of identified upflow zones with fault zones and uplifted bedrock and further supports the conceptual model presented above. Produced water temperatures from the East Mesa geothermal system are typically around 64 °C, whereas Radium Springs geothermal system temperatures are commonly higher, at approximately 99 °C [15,16]. By assuming an average annual surface temperature of 17 °C and background geothermal gradient of 35 °C/km, measured groundwater temperatures indicate that these upwelling waters ascend from depths of at least 1.3 and 2.3 km, respectively [42]. These are minimum circulation depths because conductive cooling and mixing with shallower cool waters during ascent are likely to occur but are not considered in this study. Maximum measured temperatures in the East Potrillo geothermal system were around 60 °C at depths of less than 215 m, indicating a minimum circulation depth of about 1 km. Geothermal recharge sources are currently unknown but could be evaluated in future work. More specifically, efforts using advanced modeling techniques and geochemical and isotopic tracers could further interrogate geothermal flowpaths, recharge locations, and geothermal groundwater residence times to provide a more complete conceptual model for these systems. Overall, it can confidently be stated that these geothermal waters upwell from depths exceeding 1 km, and in some cases 2 km, along preferential flowpaths caused by fault zones that affect subsurface stratigraphy and permeability.
Geothermal characterization and exploration researchers have long established the importance of fault zones, especially fault intersections, on controlling the locations of upwelling geothermal fluids [43,44]. These flow dynamics are common in extensional physiographic provinces, such as the Rio Grande rift and Basin and Range of the western United States [43,44,45]. Geothermal developers rely on these upwelling fluids being hot, but upflow zones with slightly elevated or background temperatures can still contribute substantial salinity to the shallow aquifer system—similar to the northern East Potrillo upflow zone identified in this study. Relying on this concept and others borrowed from the geothermal research field could prove to be an effective means of locating additional upflow zones within the study area. For example, fault and subsurface stratigraphy could be used to locate areas of potential upflow, particularly in areas with limited thermal data coverage, which could then be further evaluated with targeted data collection and modeling. Identification of upflow zones in this manner could be a cost-effective way to further inform stakeholders on salinity sources and possible mitigation strategies.
This study demonstrates the utility of using heat as a groundwater tracer to further understand sources of salinity and their associated fluxes, along with regional and local groundwater movement. Legacy thermal datasets exist in many areas of the world because of energy exploration and development and new data collection is rather straightforward. These data and the strong and well-understood relation between fluid flow and heat argues for the more common inclusion of heat transport and thermal data calibration techniques in groundwater modeling efforts to improve model accuracy. Researchers could consider evaluating thermal data when assessing groundwater flow patterns and salinity sources on regional and local scales.
Additional future research to further evaluate geothermal salinity contributions and their effects might include mass balance streamgaging; multi-dimensional solute, heat, and mass transport modeling; and additional thermal data collection. Mass balance streamgaging techniques could most readily be used to estimate flux contributions to the Rio Grande from the Radium Springs geothermal system. This would entail measuring salinity loads in conjunction with streamflow upstream and downstream from the Radium Springs geothermal system. Discharge and corresponding salinity contributions from the geothermal system, assuming the system is the dominant salinity source through that river section, could then be back calculated by coupling the values with Radium Springs geothermal groundwater salinity. Multi-dimensional modeling that incorporates temperature and salinity could be used to predict upwelling flux rates and flow patterns more accurately. Lastly, the collection of more thermal data below the surficial zone and water table, particularly within the footprint of the East Mesa geothermal system, could significantly reduce the uncertainty associated with estimated geothermal salinity fluxes. This list of possible study directions is not comprehensive but provides practical avenues that could build upon this study.

Limitations

The approaches used herein have limitations. The most likely complicating factors are related to the following:
  • Sparse data availability affecting the ability to comprehensively identify upflow zones and more accurately estimate upflow areas;
  • Misidentification of profile curvature. For example, upflow profile curvature can look very similar to the upper half of profiles showing warm lateral flow (see Figure 2);
  • Coupling computed 1D vertical fluxes to entire areas of upflow when estimating volumetric fluxes;
  • Potential lateral flow effects in profiles with dominant upflow curvature;
  • Non-steady state conditions of groundwater flow and temperature in the subsurface over the period of investigation (1972–2018).
This study is not intended to be comprehensive but is instructive about the locations of upwelling geothermal waters and their associated salinity fluxes within the study area. The above limitations highlight opportunities to improve upon this research in the future, particularly with additional data collection and more advanced modeling tools that can better represent transience and heterogeneity.
Addressing potential non-steady state conditions of groundwater flow and temperature over the period of investigation (1972–2018) is one of the biggest opportunities for improvement in this work; this includes evaluating the assumption that identified upflow zones have been active for a long enough duration to affect Rio Grande salinity. While geothermal discharge rates are commonly consistent for long periods of time in absence of geothermal development, the Mesilla is a developed and dynamic groundwater region. All but one of the upflow profiles were measured over a timespan of just 14 months (11 March 1979 through 10 May 1980), which favors consistent conditions during measurement; one upflow profile had an unknown collection date but was most likely measured in the late 1970s or early 1980s. It is important to keep in mind that the groundwater elevations shown in Figure 7 vary through time, thereby affecting the estimated flowpaths of upwelling waters through time as well. Generally, upflow zones that are nearest to the Mesilla Valley are the most likely to be affected by changing groundwater conditions, and their associated flux estimates and flowpaths are therefore more uncertain. Regions with small hydraulic gradients (i.e., slowly moving groundwater; Figure 7), such as the Mesilla interior, are less likely to have had time to transport salinity to the Rio Grande on short timescales. Additional thermal, geochemical, and groundwater elevation data could be collected to assess the consistency of the estimated fluxes and their corresponding flow history.

6. Conclusions

Evaluation of previously published flux estimates and 379 temperature profiles measured between 1972 and 2018 show the appreciable potential salinity contributions from upwelling geothermal waters to the shallow aquifer system and the Rio Grande within the Mesilla (United States)/Conejos-Médanos (Mexico) Basin. Upflow and/or warm lateral flow profiles were identified within the region’s three known geothermal systems (Radium Springs, East Mesa, and East Potrillo).
Salinity flux analyses indicate that the East Mesa geothermal system may contribute about 36,700 tons of dissolved solids per year (t/y) to the shallow aquifer system, whereas the East Potrillo geothermal system may add around an additional 8500 t/y. Assuming these fluxes are steady through time and eventually enter the Rio Grande, these systems could account for a combined 22% (East Mesa = 18%, East Potrillo = 4%) of typical average annual Rio Grande salinity. These salinity proportions can be much greater in times of low streamflow and additional salinity contributions likely come from the Radium Springs geothermal system. Radium Springs flux estimates were not feasible in this study due to data coverage limitations but could be pursued in the future.
Regional water levels mapped in 2010 indicate upwelling brackish waters flow towards the Rio Grande and southern part of the Mesilla portion of the Basin, with some water intercepted by wells in Las Cruces and northern Chihuahua. These waters upwell from depths greater than 1 km with upflow being focused along fault zones, uplifted bedrock, and/or fractured igneous intrusions. This understanding may be used to guide future data collection efforts aimed at identifying additional upflow zones, particularly in areas that have limited thermal data coverage but adequate knowledge of faults and stratigraphy.
This work demonstrates the utility of using heat to identify regional and local sources of salinity and their associated fluxes and highlights the benefits of using thermal data in hydrologic studies. This effort could be improved upon by future research focused on improving data coverage and reducing uncertainties associated with transience and heterogeneity in the aquifer system. Overall, the results presented herein further inform stakeholders on the presence of several brackish upflow zones that could notably degrade the quality of international water supplies in this developed drought-stricken region.

Supplementary Materials

The following are available online at https://www.mdpi.com/article/10.3390/w14010033/s1, Figure S1: Plots of all 379 temperature profiles; Figure S2: Plots of smoothed profiles and derivatives for analyzed measurements made below estimated water table elevations; Table S1: Profile analysis details including water table depth estimates, curvature classifications, and analysis remarks.

Author Contributions

Conceptualization, J.D.P., A.J.R. and S.A.K.; methodology, J.D.P.; software, J.D.P.; validation, J.D.P.; formal analysis, J.D.P.; investigation, J.D.P., A.J.R. and S.A.K.; resources, J.D.P., A.J.R. and S.A.K.; data curation, S.A.K., J.D.P. and A.J.R.; writing—original draft preparation, J.D.P.; writing—review and editing, J.D.P., A.J.R. and S.A.K.; visualization, J.D.P.; supervision, A.J.R. and J.D.P.; project administration, A.J.R. and J.D.P.; funding acquisition, A.J.R. and S.A.K. All authors have read and agreed to the published version of the manuscript.

Funding

This work was partially funded by the U.S. Geological Survey (funding authorized by P.L. 109–448) for the Transboundary Aquifer Assessment Program. Shari A. Kelley received U.S. Department of Energy funding (NM-EE0002850) through the National Geothermal Database project to digitize and organize the thermal data used in this research.

Institutional Review Board Statement

Not applicable.

Informed Consent Statement

Not applicable.

Data Availability Statement

The data presented in this study are openly available in ScienceBase at https://doi.org/10.5066/P9FQ9BEN (accessed on 11 June 2019) [18]. USGS site identifiers may be used to extract additional data from the U.S. Geological Survey National Water Information System (NWIS) database [23].

Acknowledgments

The authors extend their gratitude to James Witcher for providing many of the original data documents that were then digitized and used in this research. This product has been peer reviewed and approved for publication consistent with U.S. Geological Survey Fundamental Science Practices (https://pubs.usgs.gov/circ/1367/ (accessed on 13 December 2021)). Any use of trade, firm, or product names is for descriptive purposes only and does not imply endorsement by the U.S. Government. Writings prepared by U.S. Government employees as part of their official duties, including this paper, cannot be copyrighted and are in the public domain.

Conflicts of Interest

The authors declare no conflict of interest. The funders had no role in the design of the study; in the collection, analyses, or interpretation of data; in the writing of the manuscript, or in the decision to publish the results.

References

  1. National Oceanic and Atmospheric Administration (NOAA)—National Centers for Environmental Information—North American Drought Monitor. Available online: https://www.ncdc.noaa.gov/temp-and-precip/drought/nadm/ (accessed on 29 April 2021).
  2. Alley, W.M. Five-Year Interim, Report of the United States—Mexico Transboundary Aquifer Assessment Program: 2007–2012; U.S. Geological Survey Open-File Report; U.S. Department of the Interior: Washington, DC, USA, 2013; 31p. [CrossRef]
  3. Hogan, J.F.; Phillips, F.M.; Mills, S.K.; Hendrickx, J.M.H.; Ruiz, J.; Chesley, J.T.; Asmerom, Y. Geologic origins of salinization in semi-arid river: The role of sedimentary basin brines. Geology 2007, 35, 1063–1066. [Google Scholar] [CrossRef]
  4. Driscoll, J.M.; Sherson, L.R. Variability of Surface-Water Quantity and Quality and Shallow Groundwater Levels and Quality within the Rio Grande Project Area, New Mexico and Texas, 2009–2013; U.S. Geological Survey Scientific Investigations Report; USGS: Reston, VA, USA, 2016; 33p. [CrossRef]
  5. Phillips, F.M.; Mills, S.; Hendrickx, M.H.; Hogan, J. Environmental tracers applied to quantifying causes of salinity in arid-region rivers: Results from the Rio Grande Basin, Southwestern USA. Dev. Water Sci. 2003, 50, 327–334. [Google Scholar] [CrossRef]
  6. Witcher, J.C.; King, J.P.; Hawley, J.W.; Kennedy, J.F.; Williams, J.; Cleary, M.; Bothern, L.R. Sources of Salinity in the Rio Grande and Mesilla Basin Groundwater; New Mexico Water Resources Institute Technical Completion Report; 2004; 168p. Available online: https://nmwrri.nmsu.edu/tr-330/ (accessed on 1 May 2021).
  7. Moore, S.J.; Bassett, R.L.; Liu, B.; Wolf, C.P.; Doremus, D. Geochemical tracers to evaluate hydrogeologic controls on river salinization. Ground Water 2008, 46, 489–501. [Google Scholar] [CrossRef] [PubMed]
  8. Szynkiewicz, A.; Witcher, J.C.; Modelska, M.; Borrok, D.M.; Pratt, L.M. Anthropogenic sulphate loads in the Rio Grande, New Mexico (USA). Chem. Geol. 2011, 283, 194–209. [Google Scholar] [CrossRef]
  9. Moyer, D.L.; Anderholm, S.K.; Hogan, J.F.; Phillips, F.M.; Hibbs, B.J.; Witcher, J.C.; Matherne, A.M.; Falk, S.E. Knowledge and Understanding of Dissolved Solids in the Rio Grande—San Acacia, New Mexico, to Fort Quitman, Texas, and Plan for Future Studies and Monitoring; U.S. Geological Survey Open-File Report; USGS: Reston, VA, USA, 2013; 67p. [CrossRef] [Green Version]
  10. Hiebing, M.; Doser, D.I.; Avila, V.M.; Ma, L. Geophysical studies of fault and bedrock control on groundwater geochemistry within the southern Mesilla Basin, western Texas and southern New Mexico. Geosphere 2018, 14, 1912–1934. [Google Scholar] [CrossRef]
  11. Kubicki, C.; Carroll, K.C.; Witcher, J.C.; Robertson, A. An Integrated Geochemical Approach for Defining Sources of Groundwater Salinity in the Southern Rio Grande Valley of the Mesilla Basin, New Mexico and West Texas, USA; Desalination and Water Purification Research Program—Research and Development Office Report/New Mexico Water Resources Research Institute Technical Completion Report; 2021; 82p. Available online: https://nmwrri.nmsu.edu/tr-388/ (accessed on 1 May 2021).
  12. Snyder, J.T. Heat Flow in the Southern Mesilla Basin with an Analysis of the East Potrillo Geothermal System, Dona Ana County, New Mexico. Master’s Thesis, New Mexico State University, Las Cruces, NM, USA, May 1986. [Google Scholar]
  13. Witcher, J.C. A Geothermal Resource Data Base—New Mexico. New Mexico State University—Southwest Technology Development Institute Report; 1995; 94p. Available online: https://digital.library.unt.edu/ark:/67531/metadc665986/m2/1/high_res_d/204690.pdf (accessed on 1 May 2021).
  14. Lund, J.W. Radium Hot Springs. GHC Bull. 2002, 23, 48–49. Available online: https://www.osti.gov/servlets/purl/1209492 (accessed on 1 May 2021).
  15. Witcher, J.C.; Cunniff, R.A. Geothermal Energy at New Mexico State University in Las Cruces. GHC Bull. 2002, 23, 30–36. Available online: https://www.osti.gov/servlets/purl/1209492 (accessed on 1 May 2021).
  16. Witcher, J.C.; Lund, J.W. Masson Radium Springs Farm. GHC Bull. 2002, 23, 42–44. Available online: https://www.osti.gov/servlets/purl/1209492 (accessed on 1 May 2021).
  17. Frenzel, P.F.; Kaehler, C.A.; Anderholm, S.K. Geohydrology and Simulation of Ground-Water Flow in the Mesilla Basin, Dona Ana County, New Mexico, and El Paso County, Texas, with a Section on Water Quality and Geochemistry; U.S. Geological Survey Professional Paper; USGS: Reston, VA, USA, 1992. [CrossRef]
  18. Pepin, J.D.; Robertson, A.J.; Kelley, S.A. Borehole Temperature Profiles Measured in the Mesilla Basin, New Mexico during the Period 1972 through 2018; U.S. Geological Survey Data Release; USGS: Reston, VA, USA, 2019. [CrossRef]
  19. Anderson, M.P. Heat as a ground water tracer. Ground Water 2005, 43, 951–968. [Google Scholar] [CrossRef] [PubMed]
  20. Robertson, A.J.; Matherne, A.M.; Pepin, J.D.; Ritchie, A.; Sweetkind, D.S.; Teeple, A.P.; Granados-Olivas, A.; Garcia Vasquez, A.C.; Carroll, K.C.; Fuchs, E.H.; et al. Mesilla/Conejos-Médanos Basin: U.S.-Mexico Transboundary Water Resources and Research Needs. Water 2021. under revision. [Google Scholar]
  21. Teeple, A.P. Geophysics- and Geochemistry-Based Assessment of the Geochemical Characteristics and Groundwater-Flow System of the U.S. Part of the Mesilla Basin/Conejos-Médanos Aquifer System in Doña Ana County, New Mexico, and El Paso County, Texas, 2010–2012; U.S. Geological Survey Scientific Investigations Report; USGS: Reston, VA, USA, 2017; 183p. [CrossRef]
  22. Kelley, R. New Mexico Geothermal Play Fairway Analysis from LANL. Geothermal Data Repository. 2015. Available online: https://gdr.openei.org/submissions/597 (accessed on 29 April 2021).
  23. U.S. Geological Survey [USGS]. USGS Water Data for the Nation; U.S. Geological Survey National Water Information System Database; USGS: Reston, VA, USA, 2021. [CrossRef]
  24. Chapin, C.E.; Seager, W.R. Evolution of the Rio Grande rift in the Socorro and Las Cruces areas. In 26th Annual Fall Field Conference Guidebook; Seager, W.R., Clemons, R.E., Callender, J.F., Eds.; New Mexico Geological Society: Socorro, NM, USA, 1975; pp. 297–321. [Google Scholar]
  25. Hawley, J.W. Guidebook to the Rio Grande Rift in New Mexico and Colorado; New Mexico Bureau of Mines and Mineral Resources Circular; New Mexico Bureau of Mines and Mineral Resources: Socorro, NM, USA, 1978; 241p. [Google Scholar]
  26. Chapin, C.E.; Cather, S.M. Tectonic setting of the axial basins of the northern and central Rio Grande rift. In Basins of the Rio Grande Rift—Structure, Stratigraphy, and Tectonic Setting; Keller, G.R., Cather, S.M., Eds.; Geological Society of America: Boulder, CO, USA, 1994; pp. 5–25. [Google Scholar] [CrossRef]
  27. Sweetkind, D.S. Three-Dimensional Hydrogeologic Framework Model of the Rio Grande Transboundary Region of New Mexico and Texas, USA, and Northern Chihuahua, Mexico; U.S. Geological Survey Scientific Investigations Report; USGS: Reston, VA, USA, 2017; 49p. [CrossRef] [Green Version]
  28. Hoffer, J.M. Geology of Potrillo Basalt Field, South-Central New Mexico; New Mexico Bureau of Geology and Mineral Resources Circular; New Mexico Bureau of Mines and Mineral Resources: Socorro, NM, USA, 1976; 30p. [Google Scholar]
  29. Servicio Geológico Mexicano. Hydrogeological Activities in the Conejos-Medanos/Mesilla Basin Aquifer, Chihuahua, Phase 1; Servicio Geológico Mexicano Report; Servicio Geológico Mexicano: Pachuca, Hidalgo, 2010; Volume 1, 467p. [Google Scholar]
  30. LeRoy, S.; Garfin, G. Climate Assessment for the Southwest (CLIMAS)—The Climate of Las Cruces; University of Arizona: Tucson, NM, USA, 2017; 24p. [Google Scholar]
  31. Hanson, R.T.; Ritchie, A.B.; Boyce, S.E.; Galanter, A.E.; Ferguson, I.A.; Flint, L.E.; Flint, A.; Henson, W.R. Rio Grande Transboundary Integrated Hydrologic Model and Water-Availability Analysis, New Mexico and Texas, United States, and Northern Chihuahua, Mexico; U.S. Geological Survey Scientific Investigations Report; USGS: Reston, VA, USA, 2020; 186p. [CrossRef] [Green Version]
  32. Gross, J.T.; Giordano, T.H. The Las Cruces Geothermal Field—A flow model [Abstract]. New Mex. Geol. 1985, 7, 64. [Google Scholar]
  33. Sorey, M.L. Measurement of vertical groundwater velocity from temperature profiles in wells. Water Resour. Res. 1971, 7, 963–970. [Google Scholar] [CrossRef]
  34. Boyle, J.M.; Saleem, Z.A. Determination of recharge rates using temperature-depth profiles in wells. Water Resour. Res. 1979, 15, 1616–1622. [Google Scholar] [CrossRef]
  35. Irvine, D.J.; Cartwright, I.; Post, V.E.A.; Simmons, C.T.; Banks, E.W. Uncertainties in vertical groundwater fluxes from 1-D steady state heat transport analyses caused by heterogeneity, multidimensional flow, and climate change. Water Resour. Res. 2016, 52, 813–826. [Google Scholar] [CrossRef] [Green Version]
  36. Wang, X. fANCOVA: Nonparametric Analysis of Covariance. R Package Version 0.5-1. 2010. Available online: https://CRAN.R-project.org/package=fANCOVA (accessed on 13 December 2021).
  37. R Core Team. R: A Language and Environment for Statistical Computing. R Foundation for Statistical Computing. 2019. Available online: https://www.R-project.org/ (accessed on 13 May 2021).
  38. Bredehoeft, J.D.; Papadopulos, I.S. Rates of vertical groundwater movement estimated from the Earth’s thermal profiles. Water Resour. Res. 1965, 1, 325–328. [Google Scholar] [CrossRef]
  39. Kell, G.S. Density, thermal expansivity, and compressibility of liquid water from 0° to 150 °C: Correlations and tables for atmospheric pressure and saturation reviewed and expressed on 1968 temperature scale. J. Chem. Eng. Data 1975, 20, 97–105. [Google Scholar] [CrossRef]
  40. Ingebritsen, S.E.; Sanford, W.E.; Neuzil, C.E. Groundwater in Geologic Processes, 2nd ed.; Cambridge University Press: New York, NY, USA, 2006; 536p. [Google Scholar]
  41. U.S. Geological Survey (USGS) 3D Elevation Program (3DEP). National Elevation Dataset (NED) Seamless Layers. Available online: http://ned.usgs.gov/about.html (accessed on 18 May 2021).
  42. Reiter, M.; Eggleston, R.E.; Broadwell, B.R.; Minier, J. Estimates of terrestrial heat flow from deep petroleum tests along the Rio Grande rift in Central and Southern New Mexico. J. Geophys. Res. 1986, 91, 6225–6245. [Google Scholar] [CrossRef]
  43. Witcher, J.C.; Reiter, M.; Bland, D.; Barroll, M.W. Geothermal resources in New Mexico. New Mex. Geol. 1992, 14–16. [Google Scholar]
  44. Faulds, J.E.; Hinz, N.H. Favorable Tectonic and Structural Settings of Geothermal Systems in the Great Basin Region, Western USA: Proxies for Discovering Blind Geothermal Systems. In Proceedings of the World Geothermal Congress, Melbourne, Australia, 19–24 April 2015; p. 6. Available online: https://www.osti.gov/servlets/purl/1724082 (accessed on 13 December 2021).
  45. Faulds, J.; Coolbaugh, M.; Bouchot, V.; Moek, I.; Oguz, K. Characterizing structural controls of geothermal reservoirs in the Great Basin, USA, and Western Turkey: Developing successful exploration strategies in extended terranes. In Proceedings of the World Geothermal Congress, Bali, Indonesia, 25–30 April 2010; pp. 1–11. [Google Scholar]
Figure 2. Schematic showing typical temperature profile deviations from the conductive case because of horizontal or vertical groundwater flow. The surficial zone refers to depths in which temperatures are influenced by relatively short-term (e.g., daily, seasonal) temperature variations.
Water 14 00033 g002
Figure 3. Spatial distribution of profile classifications [21,22].
Water 14 00033 g003
Figure 4. Areal estimates of upflow and relation of faults and dikes to profile classifications for the East Mesa (B), East Potrillo (north) (C) and East Portrillo (south) (D) upflow zones [21,22]. Extents of the insets are given on the regional map inset (A). Faults and dikes are from Sweetkind (2017) [27]. Profile locations are labeled with their profile ID number from Pepin et al. (2019) [18].
Water 14 00033 g004
Figure 5. East–west and north–south thermal cross sections for the East Mesa (A,B), East Potrillo (north) (C,D) and East Potrillo (south) (E,F) upflow zones. These plots include temperature observations overlain onto basement stratigraphy, dikes, and faults from Sweetkind (2017) [27]. Additionally, topography from a USGS 1/3 arc-second (about 10 m) digital elevation model [41] is shown along with water table elevations estimated from the well records, smoothed temperature profiles and their derivatives, and nearby USGS water level data [23]. The temperature scale differs for the East Potrillo (north) cross sections (C,D) relative to the other cross sections. Surface projections are used to plot dikes and faults and their corresponding dips are not depicted.
Water 14 00033 g005
Figure 6. Normalized temperature profiles and their best-fit Bredehoeft and Papadopulos (1965) analytical solution [38] for profiles associated with the East Mesa (AD), East Potrillo (north) (E) and East Potrillo (south) (FH) upflow zones. Best-fit Peclet numbers, as determined from root-mean-squared error (RMSE) minimization, along with the length over which temperatures were analyzed (L) and estimated vertical specific discharge (qz) are displayed on each plot for reference. The Peclet number and L are inversely related in equation 2, meaning that high Peclet numbers across small depth intervals will maximize vertical flux rates. Negative Peclet numbers and vertical specific discharge values correspond to upflow curvature. Precision of displayed values is for research reproducibility purposes and does not reflect value uncertainty. Profiles are labeled with their profile ID number from Pepin et al. (2019) [18].
Water 14 00033 g006
Figure 7. Anticipated flow patterns of upwelling and warm lateral flowing groundwater, as informed by groundwater-elevation mapping from Robertson et al. (2021) [20,21,22]. Estimated flowpath arrows are oriented perpendicularly to groundwater elevation contours with flow directed down hydraulic gradient. Groundwater elevations depict groundwater flow towards the Rio Grande and southern Mesilla, along with flow intercepted by groundwater wells in Las Cruces and northern Chihuahua. Estimated groundwater elevations vary through time, thereby affecting the estimated flowpaths of upwelling waters through time as well. Generally, upflow zones that are nearest the Mesilla Valley are the most likely to be affected by changing groundwater conditions and their associated flux estimates and flowpaths are therefore more uncertain.
Water 14 00033 g007
Table 1. Summary of flux estimates and input parameters used in modeling. Fluid specific heat was specified to be 4180 joules per kilogram per degree Celsius at all locations in the modeling. Modeled values for the thickness over which temperature data were analyzed (L) and best-fit Peclet numbers (Pe) are provided in Figure 6. Salinities of 1800 mg/L and 4823 mg/L were used to estimate salinity fluxes for the East Mesa and East Potrillo regions, respectively. Reported precision of tabulated values is for research reproducibility purposes and does not reflect value uncertainty. (Column headings and abbreviations: Region = region of upflow and associated geothermal system; Subregion = localized area within the larger upflow region; ID = temperature profile identification number from Pepin et al. (2019) [18]; Ke = effective thermal conductivity in watts per meter per degree Celsius; n = porosity in dimensionless units; ρf = fluid density in kilograms per cubic meter; A = upflow area in square meters; qz = vertical specific discharge in meters per year; Qz = volumetric vertical specific discharge in acre-feet per year; JTDS is salinity flux in tons of dissolved solids per year; N/A = not available.)
RegionSubregionIDKenρfAqzQzJTDS
East
Mesa
Main652.0830.125983.3153,900−0.1928.421
Main2112.0840.125981.8653,900−0.26311.528
Main2162.0840.125982.5953,900−0.1787.819
Isolated3502.0760.125991.05N/A1−0.105N/A1N/A1
East
Potrillo
North1632.450.25995.01361,700−1.1323322177
South732.740.25988.591,357,700−0.08088575
South822.740.20983.981,357,700−0.8739616302
South972.330.20984.241,357,700−0.5826414203
1 Not enough proximal temperature data to confidently estimate value.
Publisher’s Note: MDPI stays neutral with regard to jurisdictional claims in published maps and institutional affiliations.

