1. Introduction
Significant proportions of water resources in the EU are consumed by the domestic drinking water (14%) and agricultural sectors (40–45%), respectively [
1]. The energy consumption associated with pressurized water networks is estimated to represent 2–3% of global energy consumption [
2]. A significant proportion of this is associated with the transport or distribution of water in pipe networks through pumping. The consumption of energy inherent in the extraction, treatment, and distribution of drinking water is a well-publicised area of concern for water utilities and their respective governments [
3,
4,
5]. Energy consumption is similarly high in the collection and treatment of wastewater [
6]. Energy consumption in irrigation networks, particularly pressurised irrigation systems, has been shown to have increased dramatically in recent years. Some studies in Spain reported the energy costs in approximately 40% of total water costs on average, reaching peaks of 65% in some cases [
7,
8]. As such, water networks of various kinds are associated with significant energy consumption.
Numerous technological and policy approaches have been developed and investigated with a view to reducing this energy consumption and subsequent CO
2 emissions within the water sector, including activities such as leakage reduction measures [
9,
10], water pricing [
11], irrigation network sectoring [
12], the production of bio-gas in wastewater treatment [
13], and the recovery of energy in pipe networks using micro-hydropower turbines (MHP) [
14,
15].
Focusing on MHP energy recovery in particular, a significant focus has been placed on this energy-saving technique in recent years. Investigations have been conducted extensively on the design and performance of hydraulic machines suitable for in-pipe MHP generation applications [
16,
17,
18,
19,
20,
21]. Investigations have also examined in detail the optimisation of water networks to incorporate the optimal placing and number of MHP turbines using various objective functions, such as maximising energy production or minimising leakage [
9,
22,
23]. Numerous case studies have been conducted assessing the potential impacts of MHP at local and regional scales and in drinking water, irrigation, and wastewater networks.
Gallagher et al. [
24] outlined the potential for the recovery of 17.9 GWh/y from 80 existing pressure-reducing valves and other network infrastructure in drinking water networks in Ireland and Wales. Power et al. [
3] highlighted the potential for MHP energy recovery from >100 wastewater works in parts of Ireland and the UK at 1.1 MW. Bousquet et al. [
25] assessed the potential for MHP energy recovery in Switzerland, highlighting a potential for 9.3 GWh/y from 19 profitable wastewater sites. García Morillo et al. [
26] estimated a potential of 270.5 MWh/y from four potential turbine installations in a 4000 ha pressurised irrigation network in Southern Spain. Pérez-Sánchez [
27] highlighted the potential for the recovery of 188.2 MWh/y at a 290 ha irrigation network in Eastern Spain.
However, the potential impact of MHP in water pipe networks across a large geographical scale has not been assessed to date, owing in part to the difficulty in obtaining the required water network data to conduct such an assessment. These data are often missing or unavailable from water authorities. As a result, the full potential impact of this technological intervention on energy consumption and CO2 emissions in the sector is unknown. Therefore, limited exploitation of the resources to date has occurred due to a combination of inertia within the water sector, a lack of knowledge about its potential impacts, and a lack incentives from governments.
The objective of this work focused on the development of the largest assessment of energy recovery potential through MHP in the water sector conducted to date, using a dataset amassed across six EU countries. The results of this work will show the potential of MHP to generate clean energy in three key sectors such as drinking water, wastewater, and irrigation. These results will enable policy makers to see the full potential impact of MHP in water pipe infrastructure at a multi-country scale, making the case to promote and incentive the technology as a means to achieve the desired CO2 emissions reduction targets of the sector and resulting action at the level of individual utilities.
2. Methodology
2.1. MHP Energy Recovery Resource Assessment
Data on the location, flow, and pressure conditions in existing water infrastructure were collected from numerous water utilities and public organisations across Ireland, Northern Ireland, Scotland, Wales, Portugal, and Spain. Data were collected from these six countries in particular as part of an EU funded research project, REDAWN, which focused on this particular area of Europe (the Atlantic Area,
www.REDAWN.eu, accessed on 25 March 2021). Data were collected on the existing water network infrastructure known to possess potential for significant amounts of excess pressure, which could be used to generate electricity in an MHP system, without interfering with water service requirements. These existing locations where excess pressure is intentionally dispelled from the water system have been previously highlighted as pressure-reducing valves, control valves, break pressure tanks, gravity-fed reservoir inlets, inlets of gravity-fed water treatment works, and outlets of wastewater treatment works [
4]. In these locations, previous investigations have shown the potential to install MHP turbines to recover energy from excess pressure in pipelines, or excess head in free-surface flows, without affecting downstream consumers or processes. Collecting data on these existing locations in existing infrastructure enabled the assessment of the potential for energy production, which could be achieved by installing MHP turbines at these various sites.
This methodology facilitates an assessment of the potential at existing infrastructure; however, it fails to assess the total or optimal potential. This is the case as, while pressure-reducing valves (PRVs), for example, exist in water networks to reduce pressure, their presence is not optimal in every region, and excess pressure can exist in water networks where PRVs are not present to reduce it. As such, the current approach can only assess the potential of replacing or coupling the existing infrastructure with MHP turbines. To obtain an assessment of the full optimal potential of MHP in water networks would require hydraulic models of every network to be assessed, which is not feasible at a multi-country scale, representing the main limitations of this study
Data from 8828 water network sites (
Table 1) were collected across Ireland, Northern Ireland, Scotland, Wales, Spain, and Portugal. Thirty water utilities and public organisations (for drinking water, wastewater, and irrigation networks) across the six countries were contacted. Over 73% of utilities contacted were in a position to provide data in varying levels of resolution, and with varying record lengths. Data obtained varied from annual average flow and pressure information, to long data records at 5-min intervals. However, the majority of data was collected at low temporal resolution, and therefore, the subsequent multi-country assessment of energy potential was conducted on the basis of annual average flow and pressure conditions.
The potential energy available for MHP generation at each site was estimated according to Equation (1).
where:
P (W) is the potential power output.
Q (m3 s−1) is the flow rate of the water.
ρ (kg m−3) is the density of the water.
g (9.81 m s−2) is the acceleration due to gravity.
H (m) is the head available at the turbine.
e0 is the efficiency of the overall power plant.
A constant and conservative efficiency of 50% [
24,
26] was assumed for the purposes of this analysis. While the efficiency of turbines and hydropower plants in total are known to vary with fluctuations in flow, pressure, and machine type [
17], this information was not universally available in most of the studied sites. Similarly, detailed design level assessment of the performance of each site was not the focus of this research. Rather the aim was to produce a multi-country level assessment of potential energy resources. Hence, using a conservative constant efficiency value of 50% was deemed appropriate. Sites that resulted in an energy recovery potential of less than 2 kW were also excluded from the analysis on the assumption that installations less than 2 kW were unlikely to be economically viable. This assumption was held on the basis that the cost competitiveness of pump-as-turbine installations is diminished below this level, and pump-as-turbines are noted as most suitable for small power capacity MHP installations of this kind [
21].
2.2. Drinking Water Networks
From the total 8828 sites shown in
Table 1, 7773 corresponded to existing potential sites in drinking water networks. The majority of data collected was in Scotland (69% of total sites). The data also included all relevant infrastructure in Northern Ireland and Wales. Data in Ireland were partial and mostly comprised information from the Dublin region (capital city). Data in Spain and Portugal were also partial datasets and comprised the southern regions and Madeira Island. The mean flow and excess pressure at these locations were then used in Equation (1) to estimate the mean annual energy recovery potential, assuming a conservative plant efficiency to account for the lack of high-resolution data.
2.3. Wastewater Networks
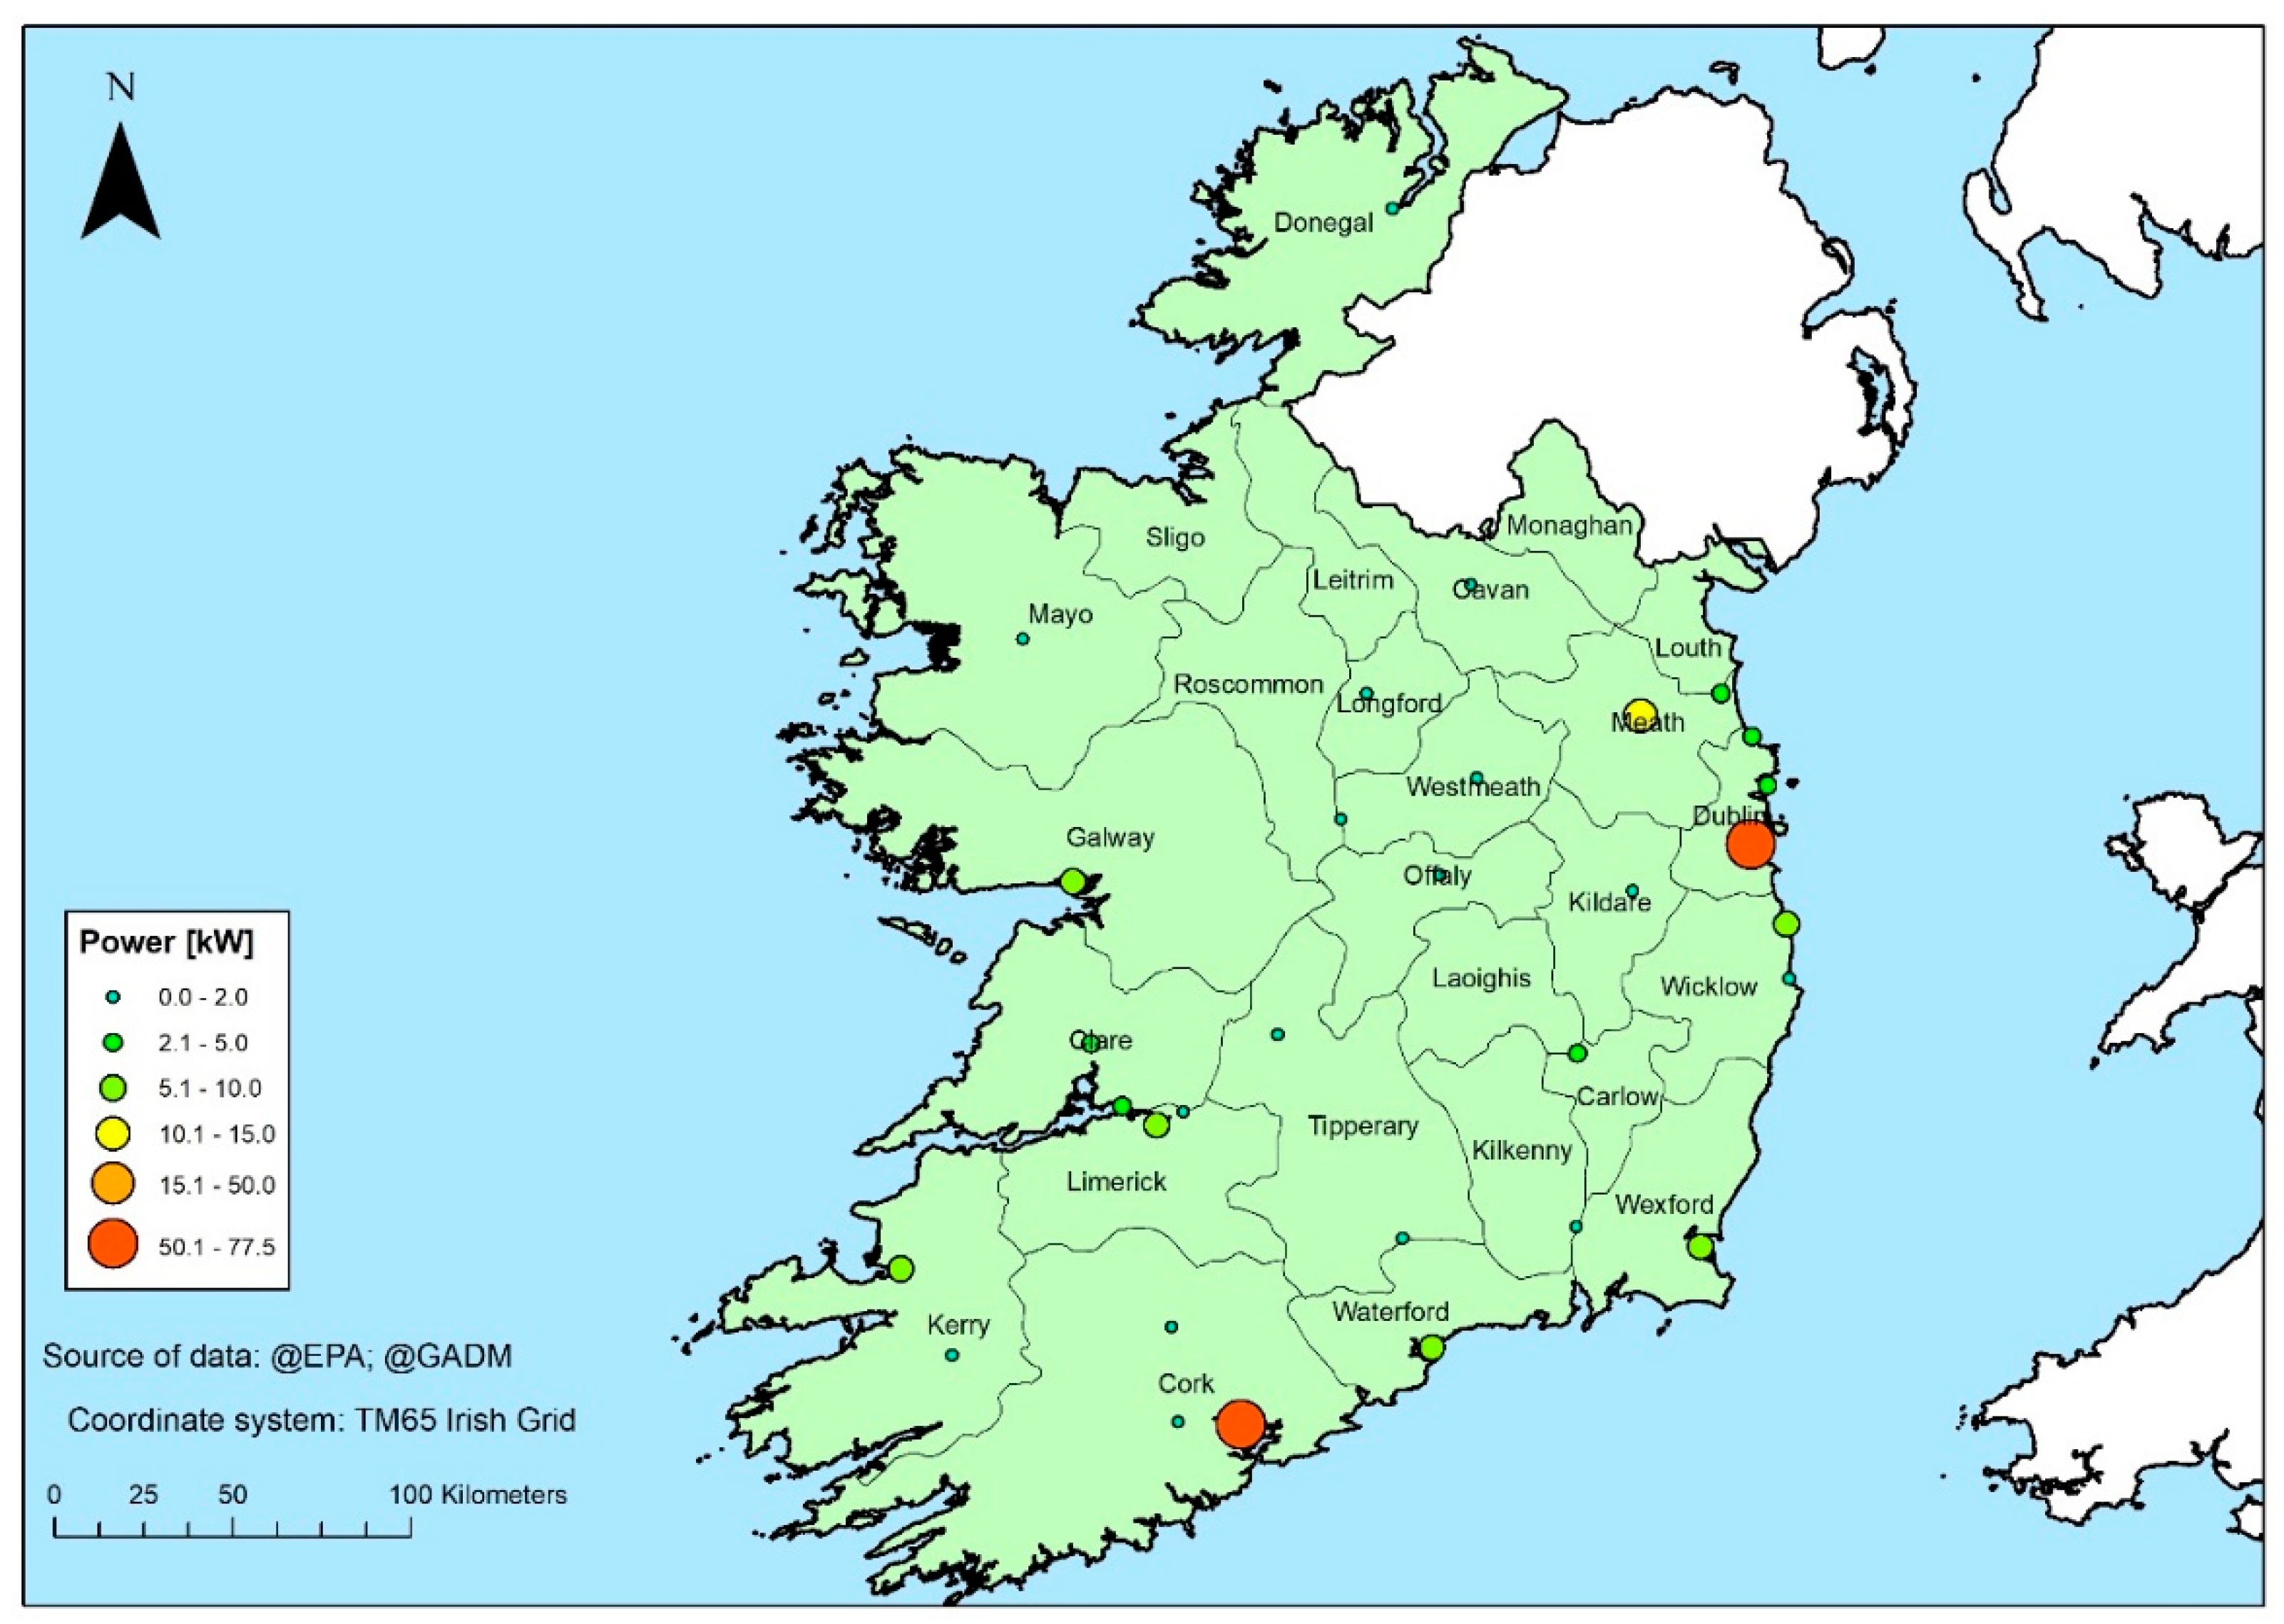
Data on the annual average effluent flow rate for 535 facilities in wastewater treatment plants in Ireland were compiled from the published annual wastewater discharge licences, provided by the Irish Environmental Protection Agency, including all wastewater treatment plants in the country. In addition, data were also collected from 343 wastewater treatment plants in Spain. In this case, the discharge licenses for the main river basins in the country were collected.
The wastewater discharge licenses provided information on annual outflow rates and the coordinates of the discharge point. Digital elevation models and satellite images were subsequently used to estimate the head drop available between each treatment works and its discharge point using the methodology described in Power et al. [
3].
2.4. Irrigation Networks
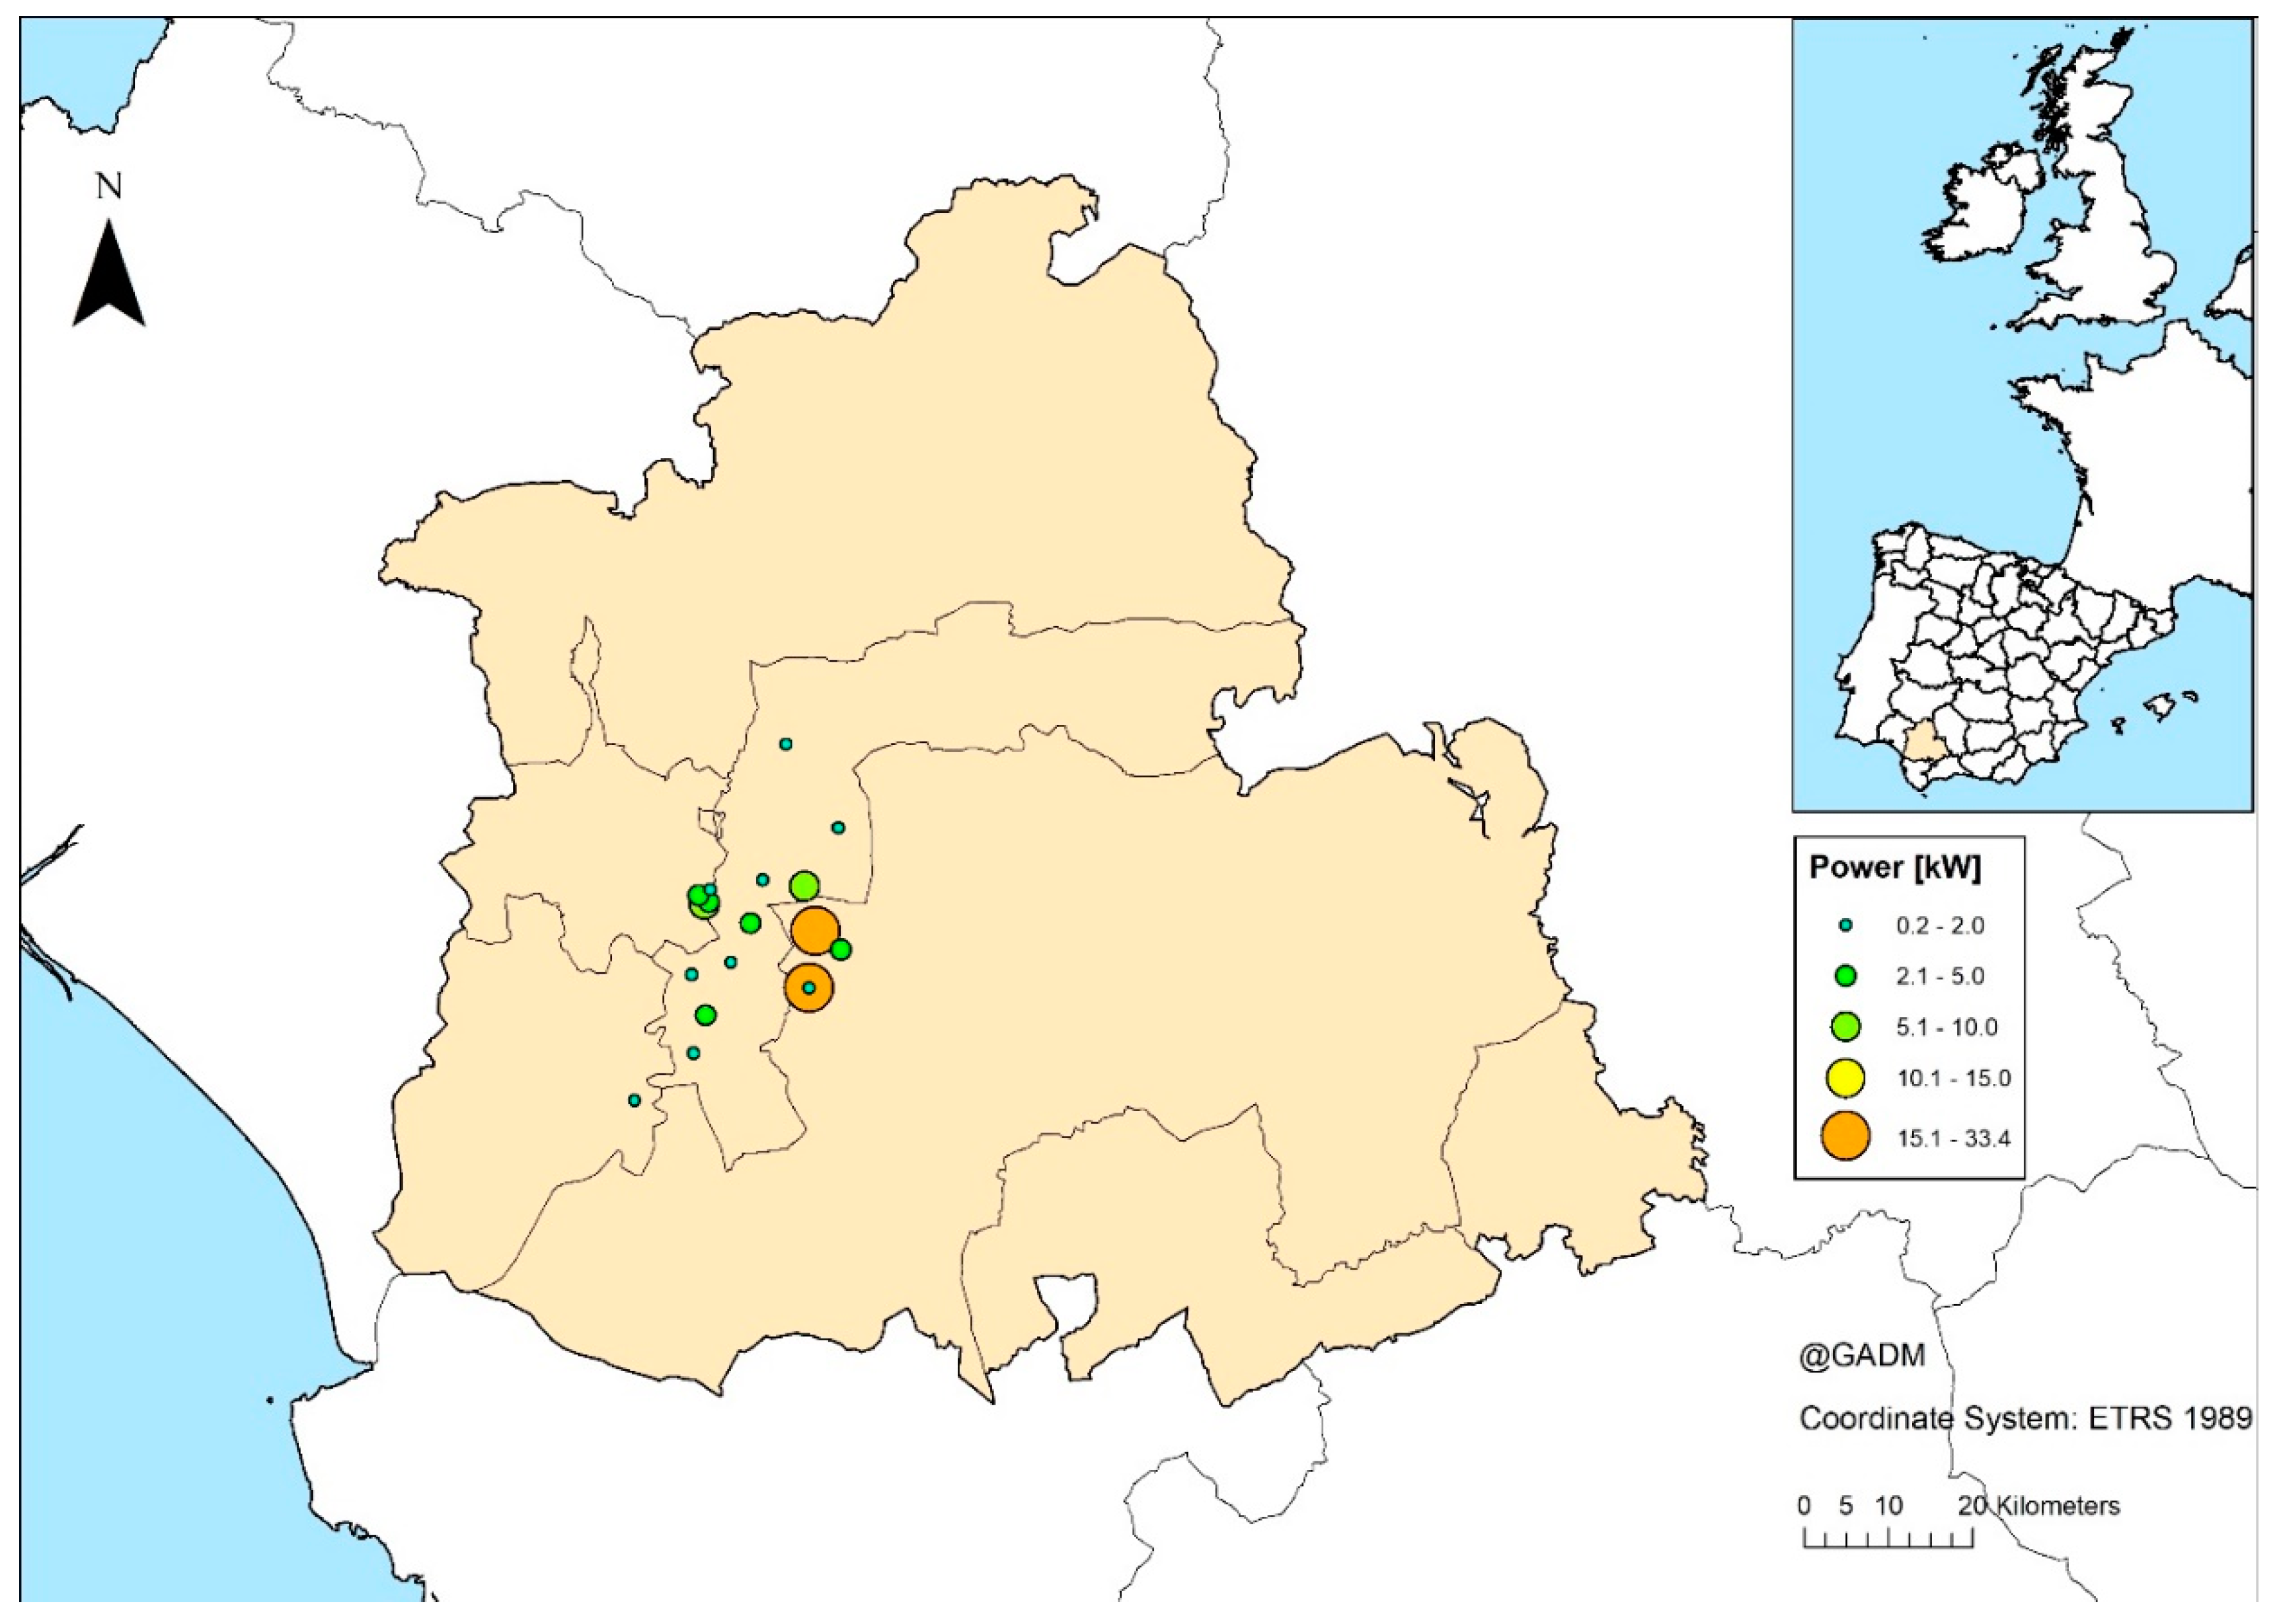
In the case of the irrigation networks, detailed information on instantaneous flow and pressure within networks or at points of interest such as PRVs or control valves is not commonly registered. Therefore, the excess pressure cannot be usefully determined in the same manner as for drinking and wastewater networks. For irrigation networks, data required to develop full hydraulic models for 18 pressurised irrigation networks in southern Spain and Portugal were collected (
Figure 1). Using data on network layout, crop water requirements, meteorological factors, models of the distribution of flow, and pressure for each network were determined as described in detail in [
28,
29]. From this analysis, the potential for 177 MHP installations at points of excess pressure was determined across 18 networks, covering 36,536 ha of irrigated land in southern Spain and Portugal. Furthermore, these results were used to estimate the energy recovery potential in 180 municipalities located within the Seville and Cordoba regions, in southern Spain, for a total irrigated area over 164,000 ha [
30].
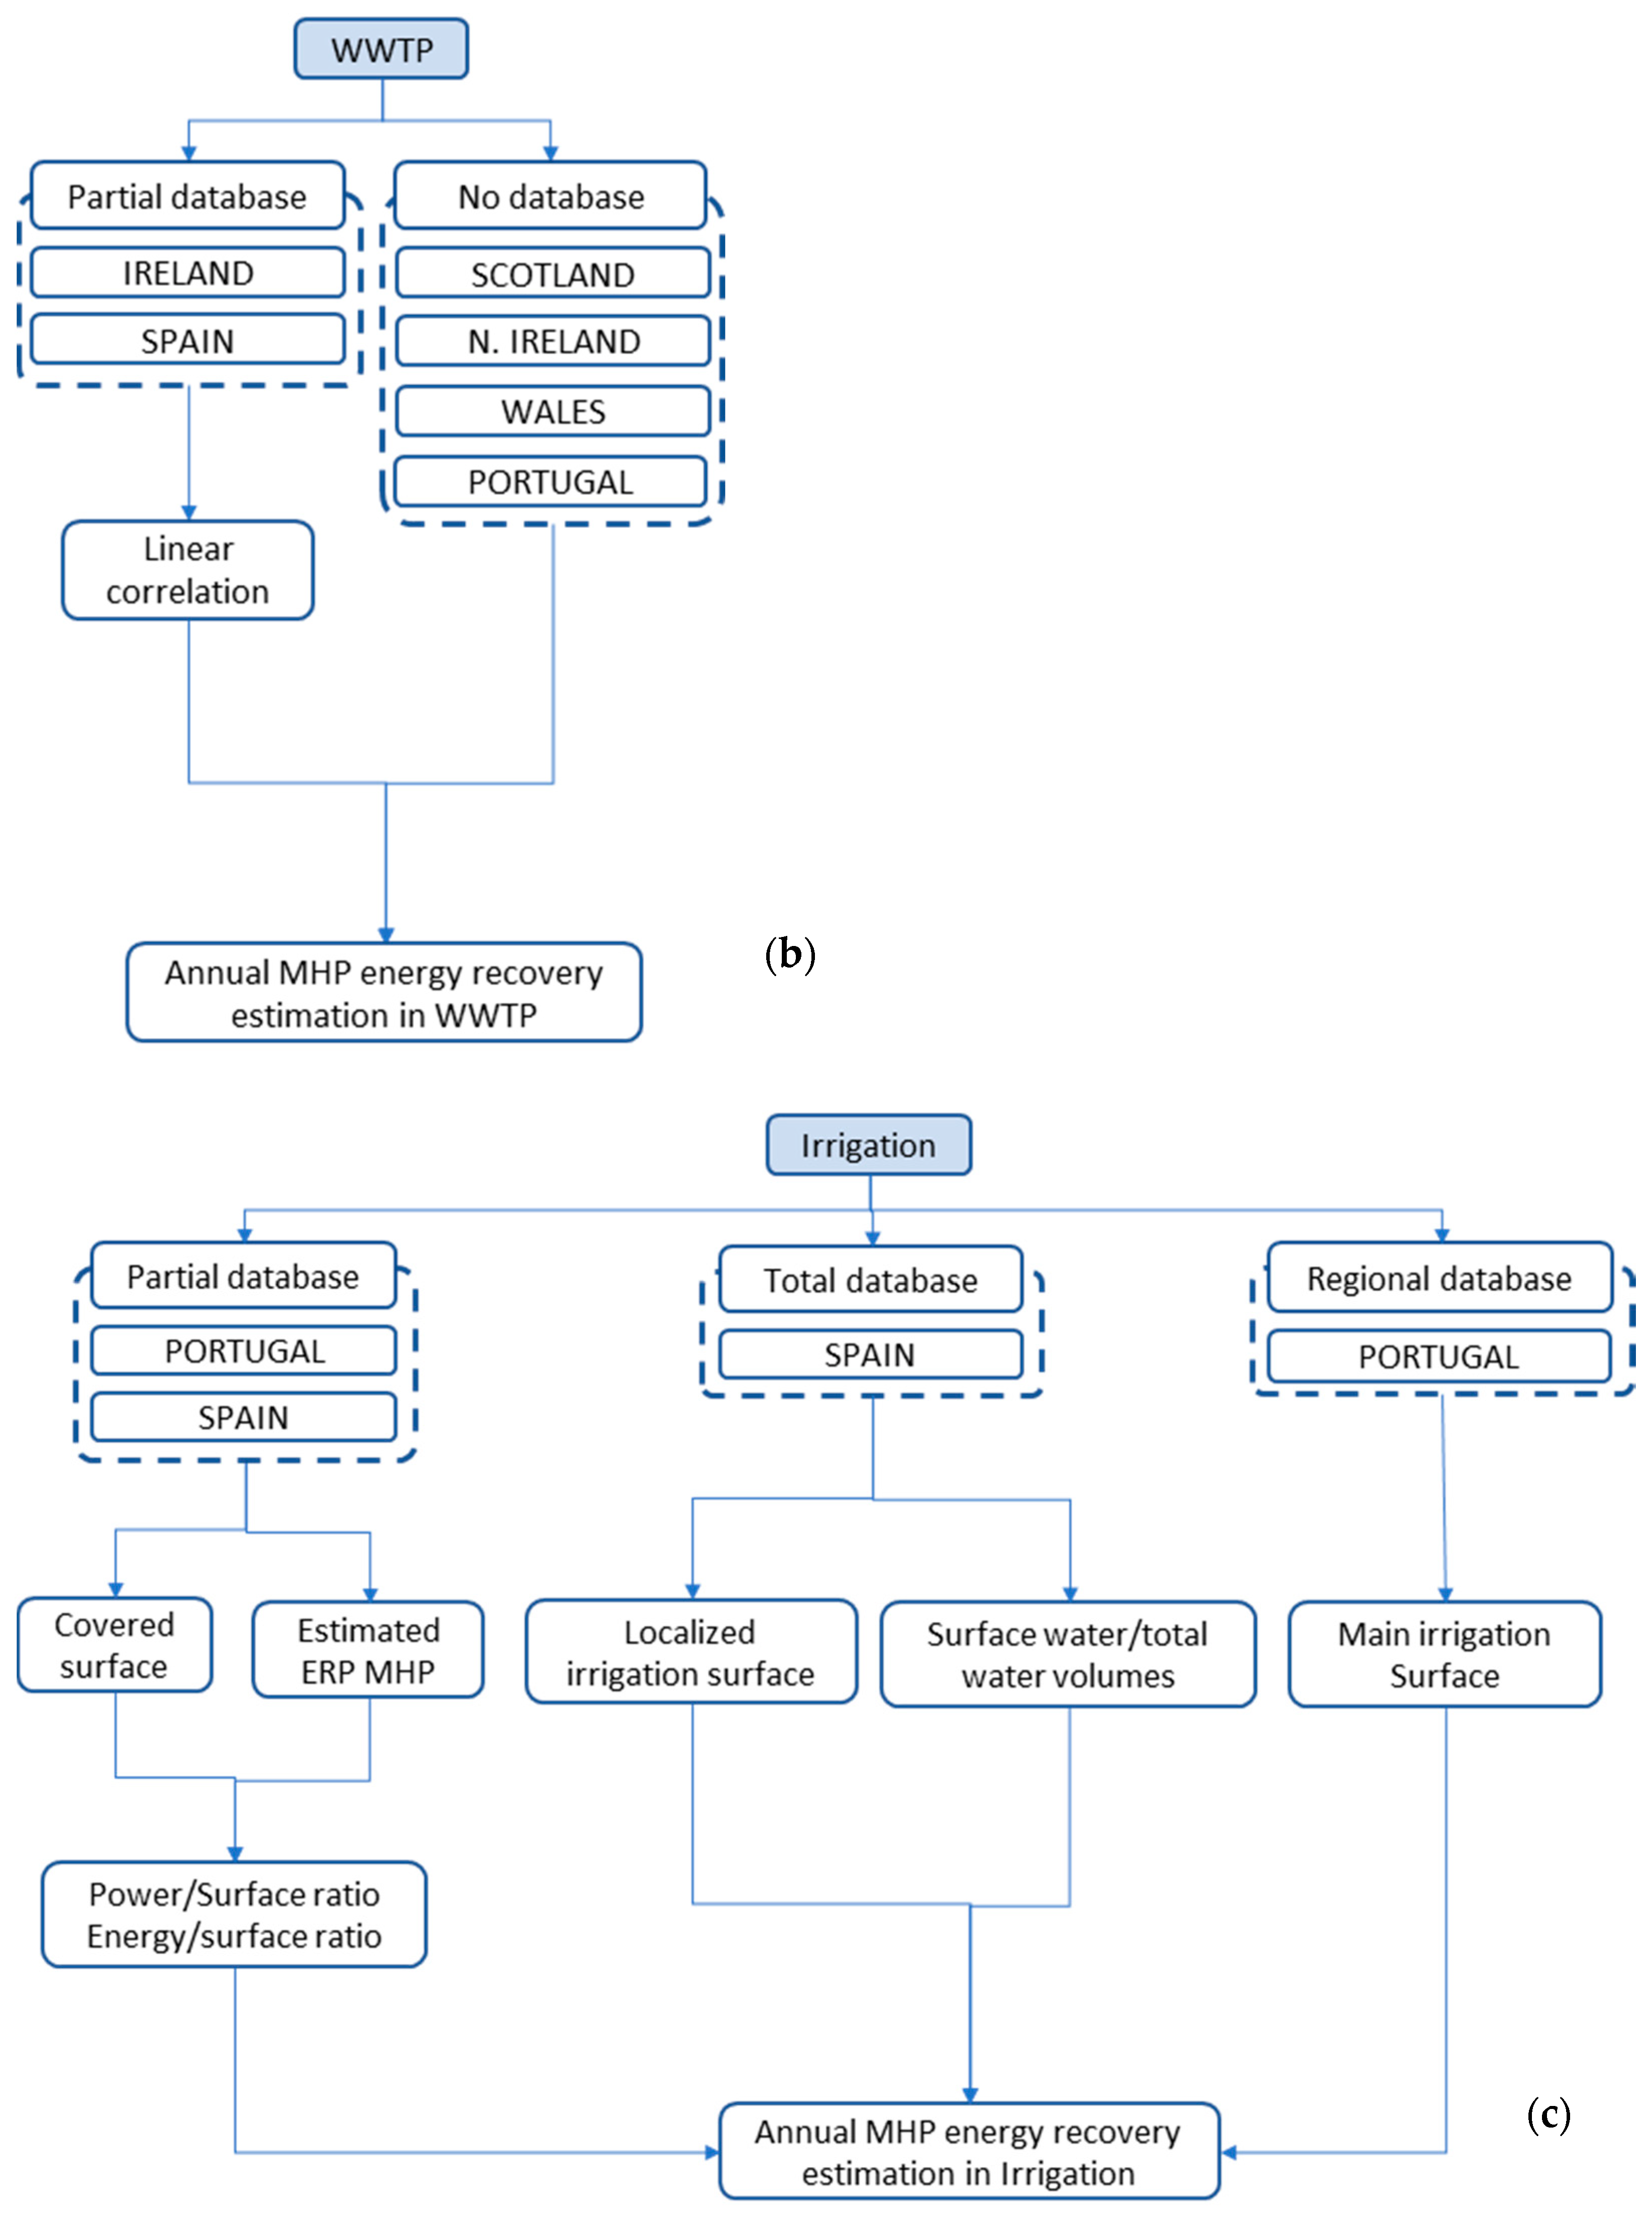
2.5. Resource Extrapolation
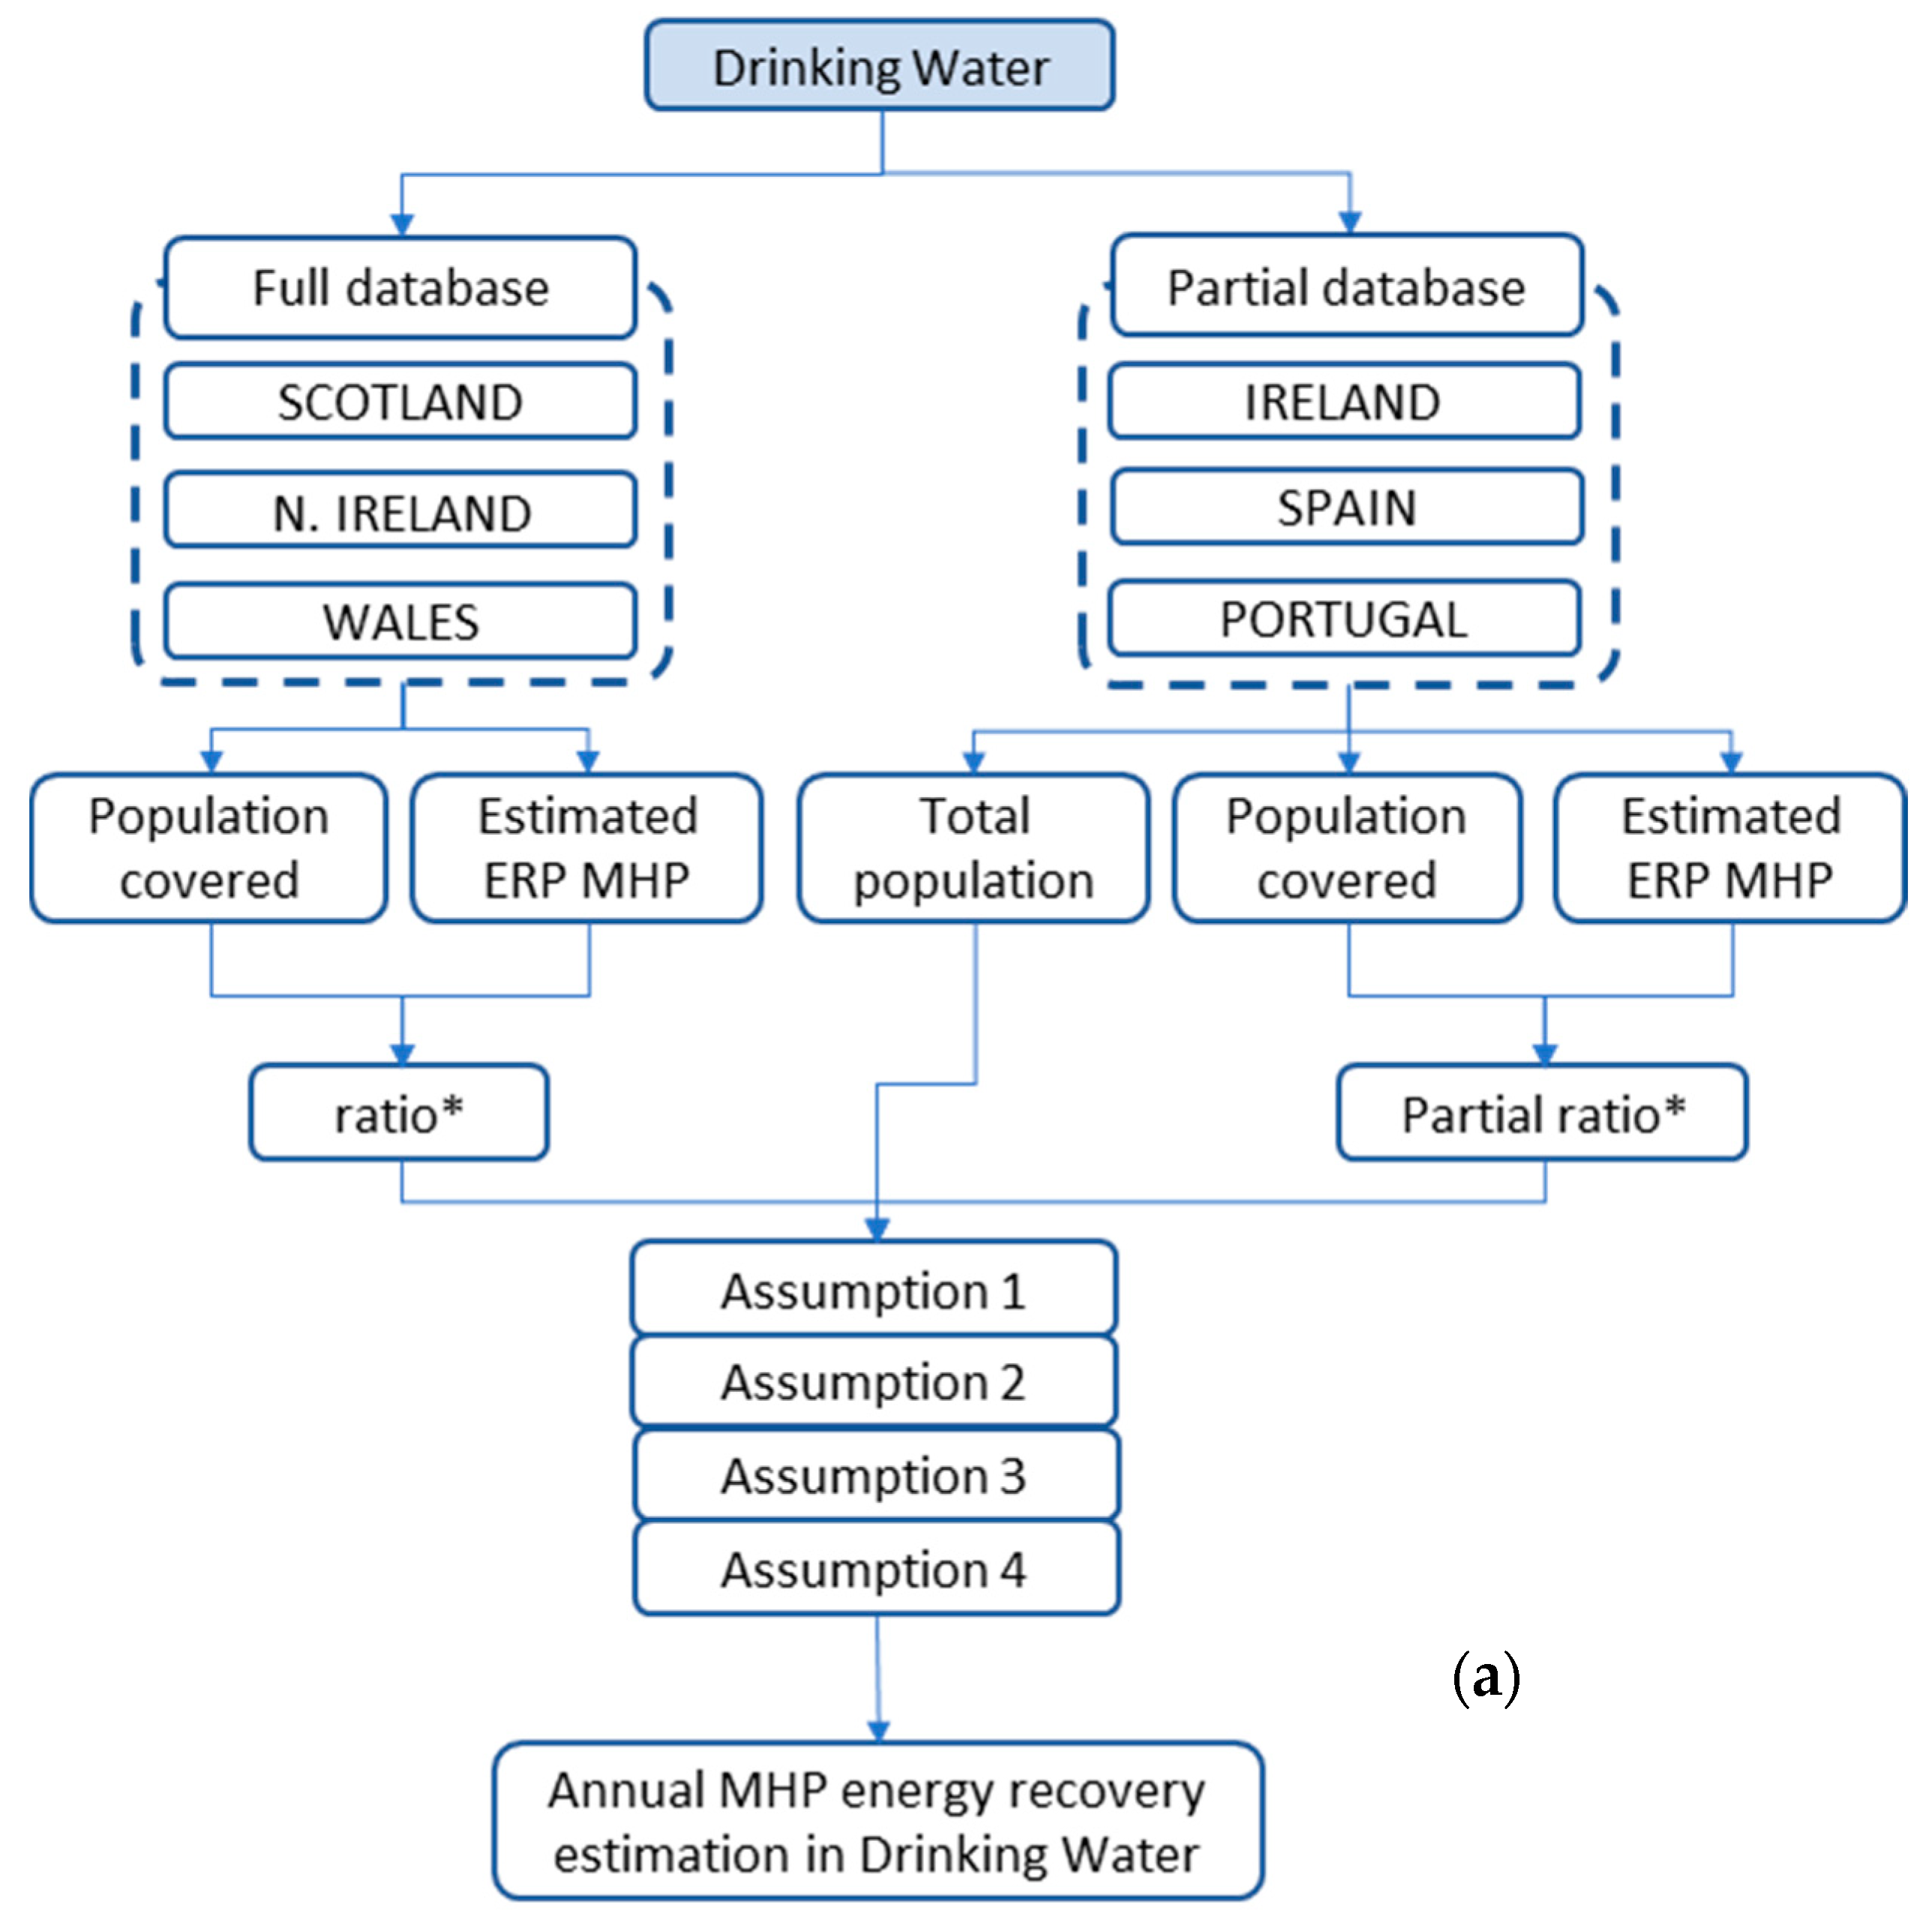
Once the energy potential estimates were completed for the 8828 sites, the relationship between potential energy recovery and local descriptive statistics was analysed as a means of extrapolating the findings to areas where water network data were not available. These local descriptive statistics served as proxy indicators of the likelihood of the existence of MHP energy recovery potential in the absence of network information. For drinking water networks, the potential for MHP obtained from the existing site data was compared against the population served by the network in the local region. The ratio of MHP energy potential to population served was compared across the six countries and used to extrapolate the findings to the full population in each case, following four different assumptions.
In the case of wastewater, the power potential of the sites identified was compared against the population served by each treatment works, and this correlation was used to predict the potential in all six countries. This was done, as lower uncertainty was found to exist in the extrapolation of wastewater MHP energy recovery, compared to drinking water networks.
For irrigation networks, the relationship between the estimated power and energy potentials and the corresponding irrigated surface area were examined across the 177 sites identified in the studied networks. These ratios were then applied to the most important irrigated areas in Portugal (Alentejo and Algarve) and Spain. In the case of Spain, more detailed data about the total area specifically dedicated to localised (drip and sprinkler) irrigation for the different regions of the country were available. In Spain, localised irrigation is commonly linked to large pressurised irrigation networks, although it is also present in small networks generally supplied by private wells. For that reason, data about the surface irrigation water and the total irrigation water volumes used by regions were also collected. In this way, the localized irrigation area was affected by the power/energy-surface area ratio obtained from the analysed networks and, then, corrected by a second coefficient. This second coefficient was used as a reduction ratio, to minimize the effect of possible small private pumping from wells, which would have very limited possibilities to present potential for MHP. The findings and extrapolations in this case were not extended to the rest of the countries in the study, as they were only relevant to the large pressurised and on-demand-organized irrigation networks found in these selected regions of Spain and Portugal. Open-channel irrigation networks or networks that are sourced from on-farm wells were not included in this analysis. The inclusion of other irrigation and water conveyance systems may increase the energy recovery potential significantly but would require more specific information and detailed studies, which were not available for this work.
A schematic representation of the general process followed for each sector analysed is shown in
Figure 2.
Finally, the energy estimation is compared against the total energy consumption of the water sector in each case.
3. Results
3.1. Drinking Water Networks
Figure 3 and
Figure 4 illustrate the distribution of the drinking water sites with energy recovery potential identified from existing infrastructure in Scotland and Seville (Spain), respectively. For brevity, the rest of the figures, corresponding to the different countries, are appended in the
Supplementary Materials Section as Figures S1–S5. For the drinking water sector, the head and flow data included in the different databases were partially recorded or estimated, depending on the available information at each site. The estimation methodology depended on the water company that managed each of the corresponding databases. In the case of Scotland, mean flow and pressure were available in the original database for all relevant infrastructure in the region, comprising 5351 locations with varying potential for MHP energy recovery. Nevertheless, the original database assumed average flow and head for a significant number of sites (72%), where actual values were unknown. These average flow values were based on pipe diameters or flow rate assuming total property coverage. The spatial distribution of the data in Seville showed a more typical scenario where only partial data in the region were available. In this case, the database included assumptions for the available head in some of the BPTs, while recorded data were available for all PRVs. Similar to the spatial distribution in Seville, plots with partial data were also available for Ireland, Northern Ireland, Wales, Spain, and Portugal. In the case of Northern Ireland, the original database provided the average head values for all sites, but for flow data, the values were again estimated based on the pipe diameter and assumptions on average velocity. The Dublin database, in turn, included head and flow data obtained from a hydraulic model of Dublin drinking water network, operated by the corresponding water utility.
Table 2 outlines the power potential of regions within the six countries examined. A total of 17,944 kW was identified from existing network data in the six countries investigated. The majority of this estimate was in Scotland (15,516 kW), which had a complete dataset. The second largest estimate for countries with a complete dataset was Northern Ireland, with 859 kW.
Extrapolating the power estimated to the areas of countries not included in the data collection was carried out on the basis of using the specific ratio determined for each country with partial data (extrapolated power potential I), and using the average (0.73 kW per 1000 population) across all of the countries by comparison (extrapolated power potential II). In the case of Ireland, for example, data were collected from the Dublin region in an area of the water network serving 40% of the national population. This was extrapolated to the entire country using a ratio of power potential to population served of 0.35 kW per 1000 population and 0.73 kW per 1000 population, for extrapolated power potential I and II, respectively.
To compile an assessment of the total energy potential for the six countries, the individual extrapolated power potential I values were used for countries with full data, while extrapolated power potential II was used for those cases in which only partial data were available. This extrapolation was made considering 365 days and 24 h of operation of the installations. The total extrapolated annual energy potential using this method for drinking water amounted to 548.2 GWh. Noting the significant variation in the extrapolation ratios across each region in
Table 2, which varied between 0.09 and 2.89, and that the value for Scotland was significantly higher than the other locations, the accuracy of the total estimate should be considered. For this reason, an extra estimation of the extrapolated energy potential was added under different assumptions, summarized in
Table 3:
Assumption 1 estimated the extrapolated energy potential based on the individual ratios for Scotland, N. Ireland, and Wales, for which the full database was available, while the average ratio was used for the rest of countries.
Assumption 2 used individual ratios for all countries.
Assumption 3 considered individual ratios for countries with a full database, while for Ireland, Spain, and Portugal, energy potential estimations were based on a partial average ratio, excluding Scotland, due to the significant difference in its ratio, compared to the rest of individual ratios.
Assumption 4 applied the median of the individual ratios to all countries.
The four different assumptions showed total extrapolated annual energy potential values in the range of 208.9 to 548.2 GWh, which differed by more than 250%. Previous investigations have highlighted that a weak correlation exists between MHP energy potential and local population statistics, with a R
2 = 26% for drinking water networks [
31]. However, this previous study was conducted on the basis of local population estimates in 1 × 1 km
2 grids as opposed to on a regional and country basis here.
3.2. Wastewater Networks
Table 4 outlines the estimated energy recovery potential of wastewater treatment plants in the countries examined. This estimate was conducted on the basis of the analysis of 535 treatment plants in Ireland and 343 in Spain. These data comprised all plants in Ireland (see
Figure 5) and most of those corresponding to Spain (78%). For the remaining countries, data were not collected, and instead, energy potential was estimated on the basis of the relationship between power potential and population served by each treatment plant. A linear correlation was found between the estimated hydropower potential (kW) for sites and the population served by each plant, with an R
2 = 78%, according to Equation (2). Due to the stronger correlation between population and power potential for wastewater, data collection in all six countries was deemed unnecessary.
where:
y represents the estimated power potential for wastewater treatment plant outlets (kW), and
x represents the size of the population served by each plant.
A total of 3206 kW of power at wastewater treatment plant outfalls in the six countries was estimated on the basis of Equation (2) and corresponding population data. The low-head inherent in most wastewater treatment plant outfalls resulted in a relatively low energy potential from this sector in comparison with drinking water, amounting to an annual total of 28.0 GWh.
3.3. Irrigation Networks
Figure 1 shows the spatial distribution of irrigation networks analysed, located in southern Spain and Portugal. For pressurized irrigation networks, data on the irrigated surface areas and corresponding energy recovery potential were collected from 177 sites identified by Crespo Chacón et al. [
30]. A mean ratio of power recovery potential to irrigated surface area was found at 0.08 kW/ha. In this case, the irrigated surface areas were those areas downstream of each potential turbine installation according to the irrigation networks topology.
In total, 2995 kW of potential for power recovery was identified at the 177 sites with available excess pressure. However, in contrast to wastewater and drinking water sectors, this power recovery potential in irrigation networks would only be available during the irrigation season (which usually covers around 6–7 months). Considering the daily irrigation time and season, the annual energy recovery potential was estimated at 6.11 GWh per annum. The energy production was estimated to occur between the months of April and October with intensive activity in July and August, as described in detail in [
28,
29] and summarised in
Table 5. In this table, a ratio between the energy estimated and the corresponding irrigated surface was determined, with an average value of 0.167 MWh/ha.
Extrapolating the estimated energy recovery potential to the rest of identified areas was conducted on the basis of the obtained mean ratios for power and energy per hectare of irrigated surface area. Extrapolation was only conducted for regions in Spain and Southern Portugal, which include similar pressurised irrigation infrastructure to those networks analysed by [
30] in
Table 5. The extrapolation did not extend to the other considered countries due to the lack of irrigation requirements and/or infrastructure.
Table 6 summarizes the findings for Portugal in the two regions, Alentejo and Algarve, showing a total annual energy potential of 24 GWh.
In the case of Spain,
Table 7 includes the surface area for localised irrigation, the ratio between the surface irrigation water and total irrigation water volumes, and the power and energy extrapolation for the different regions, amounting to a total annual energy potential of 221.4 GWh.
In total, the instantaneous power estimated from the irrigation networks in Spain and Portugal was 120.5 MW, and considering that the operation of the networks is typically concentrated in the summer months, the total annual energy available for MHP recovery was estimated at 245.4 GWh. It is important to note, as previously mentioned, that only the surface water used for localised irrigation was considered for this study. The inclusion of open-channel irrigation networks or networks fed by on-farm wells would increase the energy recovery potential significantly, but it would require more detailed studies per specific areas.
3.4. Total Energy Potential
The total annual energy estimated across the six countries and three sectors is summarised in
Table 8 as 482.3 to 821.6 GWh, depending on the assumptions selected for the energy potential estimation in the drinking water sector. The majority of energy identified was located in drinking and irrigation water networks (ranging between 43 and 67% for drinking water and 51 and 30% for irrigation). Although the power potential for pressurised irrigation networks was high in Spain and Portugal, due to the summertime concentration of this activity, less energy is available on an annual basis, compared to drinking water networks, for the results corresponding to the upper limit from the considered assumptions. Furthermore, this assessment did not extend beyond pressurised irrigation network infrastructure, which is prevalent in some parts of the EU. Energy potential at wastewater treatment works outfalls ranged between 6 and 3% of the total, depending on the selected assumptions for the drinking water sector.
4. Discussion
As previously shown in the results section, the analysis of the energy recovery potential with MHP technology in the water industry in the six European countries analysed, including drinking water, wastewater, and irrigation sectors, reached a total annual value of between 482.3 and 821.6 GWh, depending on the extrapolation method chosen for the drinking water sector. From this total, the drinking water sector showed the highest contribution in all countries except in those where the irrigated agriculture is a key sector in the economy of the country. This is the case of Spain and Portugal, where both irrigation and drinking water sectors represented the largest share of the estimated potential. These results, together with those obtained in previous studies focusing on the drinking water [
14,
15,
24], wastewater [
3,
25], and irrigation sectors [
26,
27,
30], show that MHP can play an important role in the transition to a more sustainable water industry at a cross-country and cross-sector scales, with a subsequent impact on society in environmental and economic terms.
Table 9 outlines the total electricity consumption in drinking water, wastewater, and irrigation activities in the analysed countries/regions, and the potential contribution of MHP energy recovery installations. This can be seen to vary from 1.7–3.6% in Ireland to 9–13% in Spain.
Put into context, the total annual energy requirement of the pressurised irrigation infrastructure in the regions considered was estimated as 1486 GWh. This estimate was based on the irrigated surface areas outlined in
Table 6 and
Table 7 and an average energy requirement per hectare of 1003 kWh/ha, as determined by [
7]. The potential energy estimated from MHP in the irrigation networks in these regions accounts for 13% of the corresponding estimations for energy consumed by the irrigation activity. This highlights that the potential in irrigation networks for energy recovery using MHP is on a par with or even greater than that of drinking water networks, where pressurized irrigation infrastructure exists. While this is only a partial contribution to the total required, the main advantage of MHP in the irrigation setting lies also in the provision of electricity at farm level in areas, which are often far from grid connections, and where renewable energy sources would be preferred to diesel generators. The results of
Table 8 highlight that the wastewater (between 6 and 3%) sector accounted for the minor share of MHP potential, although wastewater infrastructure was present in all regions. In the case of irrigation networks, not present in all regions, these presented a substantial potential where such infrastructure was present, representing between 51 and 30%, against 43 and 67% of the drinking water sector.
The high-level analysis conducted here presents some limitations, as several assumptions were made, and results should be treated in light of the methodology used. Many of the identified 8828 sites could prove to be non-viable on detailed assessment due to a variety of factors including land-access, grid connection availability or off-grid consumption, flow/pressure variability, etc. As outlined in
Section 2, the analysis also only considered the potential for MHP from existing locations with excess pressure/head and not all possible locations, which would have required access to numerous hydraulic models, and results in underestimation of the total potential. Open-channel irrigation infrastructure was also omitted from the assessment, which also results in an underestimate of the MHP potential for the entire irrigation sector.
In examining the distribution of potential installation sizes across 8828 sites, installations with a power potential over 15 kW represented 3% of the total number of sites (
Table 1) and 10% of the sites, which had energy potential over 2 kW (
Figure 6). Nevertheless, it was found that 42, 64, and 66% of total energy potential from the analysed sites for drinking water, wastewater, and irrigation sectors, respectively, could be produced in installations with more than 15 kW of power. These figures highlight that a significant proportion of the energy potential estimated in this study could be exploited by installing MHP plants in only a small number of the sites. A further 28% of the energy available was at sites in the range of 5−15 kW (
Figure 6), and these represented 8% of the total number initially identified and 28% of those that presented power potential equal to, or higher than, 2 kW (
Figure 6). These small-scale sites could be economically viable if exploited using pump-as-turbine technology. Pumps-as-turbines in water networks have been shown to be particularly relevant in the range of 2−50 kW, which adds confidence to the reliability of the estimated energy potential.
The potential MHP installations identified here could cumulatively make a valuable contribution to net energy efficiency gains and CO2 emission reductions in the EU’s water sector. This is also significant, as it demonstrates cost-effective, value-added, multi-country benefits to policy makers, establishing the case to promote and incentivise MHP installations to help achieve the desired CO2 emissions reduction targets in the sector.
5. Conclusions
A total annual potential for energy production using MHP turbines in the drinking water, irrigation, and wastewater networks was estimated in the range 482.3 to 821.6 GWh across six countries in the EU, depending on the assumption used for extrapolations for energy recovery potential in the drinking water sector. This energy was shown to represent a potential reduction in the electricity demand of these water services by 1.7 to 3.6% and 9 to 13%, depending on the assumptions and countries. A large abundance of potential locations to install MHP turbines was identified. For example, over 5000 and 2000 locations were identified in Scotland and Northern Ireland, respectively, demonstrating a large potential for renewable energy activity and energy-saving potential in water networks. Almost half of the potential energy associated with the 8828 sites identified could be produced in installations with a capacity greater than 15 kW, and these could, therefore, be readily exploitable using low-cost MHP technology, such as pump-as-turbines or alternative approaches. These sites also only represented a small number of the total identified. Most existing PRVs identified produced power estimates less than 2 kW and would be less likely to be economically viable as power plants. Most energy potential was present in the drinking water and irrigation networks. Irrigation was shown to be the most important sector in regions where this activity was present. Wastewater treatment plant outfalls by contrast presented limited potential for exploitation related to the number of identified sites and their systems’ characteristics.
The potential MHP installations identified here at existing water network infrastructure taken together could make a valuable contribution to improving the sustainability of the EU’s water sector. Incentivisation and regulation of installations of this kind could prove to be a valuable mechanism in achieving the desired CO2 emissions reductions targets in the sector.


 ,
, 


