Article

Shoreline Solutions: Guiding Efficient Data Selection for Coastal Risk Modeling and the Design of Adaptation Interventions

by
Montserrat Acosta-Morel
1,*,
Valerie Pietsch McNulty
1,
Natainia Lummen
1,
Steven R. Schill
1 and
Michael W. Beck
2
1
The Nature Conservancy, Caribbean Division, Coral Gables, FL 33134, USA
2
Institute of Marine Sciences, University California, Santa Cruz, CA 95062, USA
*
Author to whom correspondence should be addressed.
Water 2021, 13(6), 875; https://doi.org/10.3390/w13060875
Submission received: 12 February 2021 / Revised: 17 March 2021 / Accepted: 20 March 2021 / Published: 23 March 2021
(This article belongs to the Special Issue Adaptation to Coastal Climate Change and Sea-Level Rise)

Abstract

:
The Caribbean is affected by climate change due to an increase in the variability, frequency, and intensity of extreme weather events. When coupled with sea level rise (SLR), poor urban development design, and loss of habitats, severe flooding often impacts the coastal zone. In order to protect citizens and adapt to a changing climate, national and local governments need to investigate their coastal vulnerability and climate change risks. To assess flood and inundation risk, some of the critical data are topography, bathymetry, and socio-economic. We review the datasets available for these parameters in Jamaica (and specifically Old Harbour Bay) and assess their pros and cons in terms of resolution and costs. We then examine how their use can affect the evaluation of the number of people and the value of infrastructure flooded in a typical sea level rise/flooding assessment. We find that there can be more than a three-fold difference in the estimate of people and property flooded under 3m SLR. We present an inventory of available environmental and economic datasets for modeling storm surge/SLR impacts and ecosystem-based coastal protection benefits at varying scales. We emphasize the importance of the careful selection of the appropriately scaled data for use in models that will inform climate adaptation planning, especially when considering sea level rise, in the coastal zone. Without a proper understanding of data needs and limitations, project developers and decision-makers overvalue investments in adaptation science which do not necessarily translate into effective adaptation implementation. Applying these datasets to estimate sea level rise and storm surge in an adaptation project in Jamaica, we found that less costly and lower resolution data and models provide up to three times lower coastal risk estimates than more expensive data and models, indicating that investments in better resolution digital elevation mapping (DEM) data are needed for targeted local-level decisions. However, we also identify that, with this general rule of thumb in mind, cost-effective, national data can be used by planners in the absence of high-resolution data to support adaptation action planning, possibly saving critical climate adaptation budgets for project implementation.

1. Introduction

The Caribbean region, consisting of its sixteen Small Island Developing States (SIDS), is among the world’s most vulnerable to climate change. The region supports a population that exceeds 43 million people, with over 50% living within 1.5 km of the coast [1]. At the same time, these Caribbean coastal zones are also facing: (1) more intense (and possibly more frequent) hurricanes and other extreme climate events; (2) sea level rise; (3) sea surface temperature rise; (4) ocean acidification, and; (5) increasing drought conditions [2,3,4]. For example, in 2017, Puerto Rico and Dominica were two of the countries most affected by weather-related loss events from Hurricane Maria. Over the past two decades, Puerto Rico and Haiti stand out as the most impacted SIDS in the region [5,6]. In September 2019, Hurricane Dorian made landfall in the Bahamas, the strongest ever to hit the island, causing approximately US$2.5 billion in damages or 7.3% of Abaco Island’s gross domestic product (GDP) and 2% of Grand Bahama’s GDP [7]. Sea level rise is intensifying the problem and has accelerated in the Caribbean to +0.725 cm/yr since 2005 with expectations of >0.3m by 2050 [8]. This is resulting in both ecological and economic detrimental impacts. These region-wide climate impacts are increasing foreign debt, affecting livelihoods and income, leading to declines in ecosystem health (loss of coral reefs), exacerbating inland flooding, and prompting some countries to not meet their Sustainable Development Goal targets.
To address climate impacts across this region and the world, the scientific community has concentrated on understanding climate change scenarios and assessing socio-economic vulnerability to inform climate change mitigation, adaptation, and resilience plans. Resilience-building requires that stakeholders understand the impacts they face from climate change and the potential solutions that can help in reaching desired outcomes [9]. Decision science can help prioritize adaptation solutions and optimize locations that address climate impacts. When effective solutions are implemented within vulnerable communities, resiliency is enhanced. This can be attributed to an improvement in community members’ ability to anticipate, prepare for, reduce the impacts of, cope with, and recover from the effects of climate change without compromising their long-term prospects [10,11].
Climate vulnerability assessments provide decision-makers with empirical data that guides their mitigation and adaptation strategies and informs the development of targeted interventions [4,12,13]. While these vulnerability assessments are useful, they are often completed across broad spatial scales, resulting in generalized assessments of issues that are local and community-specific. Indeed, risk and vulnerability are ultimately dependent on the social, economic, political, and cultural conditions of communities. Therefore, climate vulnerability assessments of small island nations should be developed at community scales.
These assessments, when carried out at the appropriate spatial scale to determine a community’s level of exposure, sensitivity to stressors, and adaptive capacity to manage [13] and address the social, economic, and environmental systems that people depend on. These assessments also consider the protection or restoration of risk reduction services provided by the natural environment, such as benefits provided by the coral reef and mangrove ecosystems (sometimes referred to as natural infrastructure or nature-based solutions (NBS)) within the suite of priority activities to increase climate adaptation [14,15,16,17,18]. There is growing interest in nature-based (or the more specific ecosystem-based) approaches for adaptation as cost-effective measures for reducing coastal risk [19,20].
During a critical time where climate change is increasing storm frequency and intensity and accelerating coastline changes, scientists, practitioners, and managers must be able to quickly assess flood risk to design adaptation and risk reduction actions on the ground. Input data and modeling expertise to do these analyses are limited in SIDS, and flood risk and adaptation analyses are sensitive to the resolution of data and models [19]. It is critical for modelers to understand these sensitivities in order to select the most appropriate dataset that effectively answers their management question and budget. This is especially nuanced as new global DEM datasets are being released with increasing frequency and technologies for collecting this type of data are becoming more accessible. The National Aeronautics and Space Administration Shuttle Radar Topography Mission Version 3.0 (NASA SRTM v3), Terra Advanced Spaceborne Thermal Emission and Reflection Radiometer Global Digital Elevation Model Version 3 (ASTER GDEM v3), Advanced Land Observation Satellite World 3D - 30m (AW3D30), and recently released NASA Digital Elevation Model (NASADEM) are the highest resolution freely available digital surface models (DSMs) for Jamaica, at 30m spatial resolution. Recent work by Kulp and Strauss [21] argues for improved accuracy over these traditional global elevation models that do not adequately represent true “bare earth” elevations, particularly in low-lying coastal areas where features such as tall mangroves interfere with vertical accuracy. This causes sea level rise (SLR) and storm surge models to greatly underestimate the flood envelope of impacted coastal populations. The Multi-Error-Removed Improved-Terrain (MERIT) [22,23] global elevation and Climate Central Coastal DEM [24] are recent attempts to improve vertical accuracy (i.e., eliminate vegetation cover), but they come at very different costs and resolutions. The NASADEM [25] is the most recent attempt to integrate all available global elevation data (e.g., GDEM, AW3D30, and ICESat laser altimeter) to improve and fill data voids, however, it is a digital surface model (DSM) product and therefore problematic for coastal SLR and storm surge modeling where tall and dense vegetation persists [26,27]. Some of these new products come with moderate to substantial price tags, which may be difficult for stakeholders in SIDS. We aim to assess whether one can get reasonable assessments of inundation risk from freely available data.
Menéndez et al. [19] is the first study to explore the sensitivity of flood models for assessing risk reduction benefits of ecosystem-based adaptation measures, comparing the risks and risk reduction benefits of mangroves in the Philippines to identify where to invest in new modeling and data acquisition to improve decision-making. They found that coastal flood risk valuation improves by using high-resolution topography and that flood reduction benefits of mangroves are better valued by using consistent databases rather than investing in single measures [19]. They also identify that while global or national approaches are best suited for screening assessments to identify hotspots and national ecosystem rankings, lack of modeling capacity and high-resolution data at the local level causes many local adaptation decisions to be made based on information that is inappropriate at this scale [19]. We aim to build on their work by similarly assessing the sensitivities of coastal risk models to the resolution of input data, specific to the products that are available in the Caribbean, and the implications of these model outputs to adaptation and risk reduction decision-making within a small coastal community in Jamaica.
To investigate the impact of data selection when modeling vulnerability, we consider several methodological approaches applied at different spatial scales in Jamaica. These approaches blend and compare bottom-up analyses with national-level models using local-scale imagery. Our objectives are to (1) compare and identify patterns of sea level rise and socioeconomic impacts using varying resolutions of input datasets; (2) inform the appropriate selection of spatial data to better manage climate adaptation funds for project implementation, and; (3) demonstrate how coastal inundation risk models can be integrated into a portfolio of evidence to inform the design of climate adaptation solutions, such as NBS. Following Game et al.’s [28] recommendation, we frame our analysis of coastal vulnerability to achieve outcomes that follow specific resource-allocation problems. These outcomes are targeted at: (1) minimizing the amount of people and infrastructure impacted by storm surge and sea level rise; (2) increasing the coastal protection benefits of natural ecosystems as a viable climate adaptation solution for SIDS, and; (3) maximizing budgets available for climate adaptation project implementation. We apply these methods to the small, coastal community of Old Harbour Bay, Jamaica, and present recommendations for future research.

2. Materials and Methods

2.1. Climate Change Impacts in Jamaica
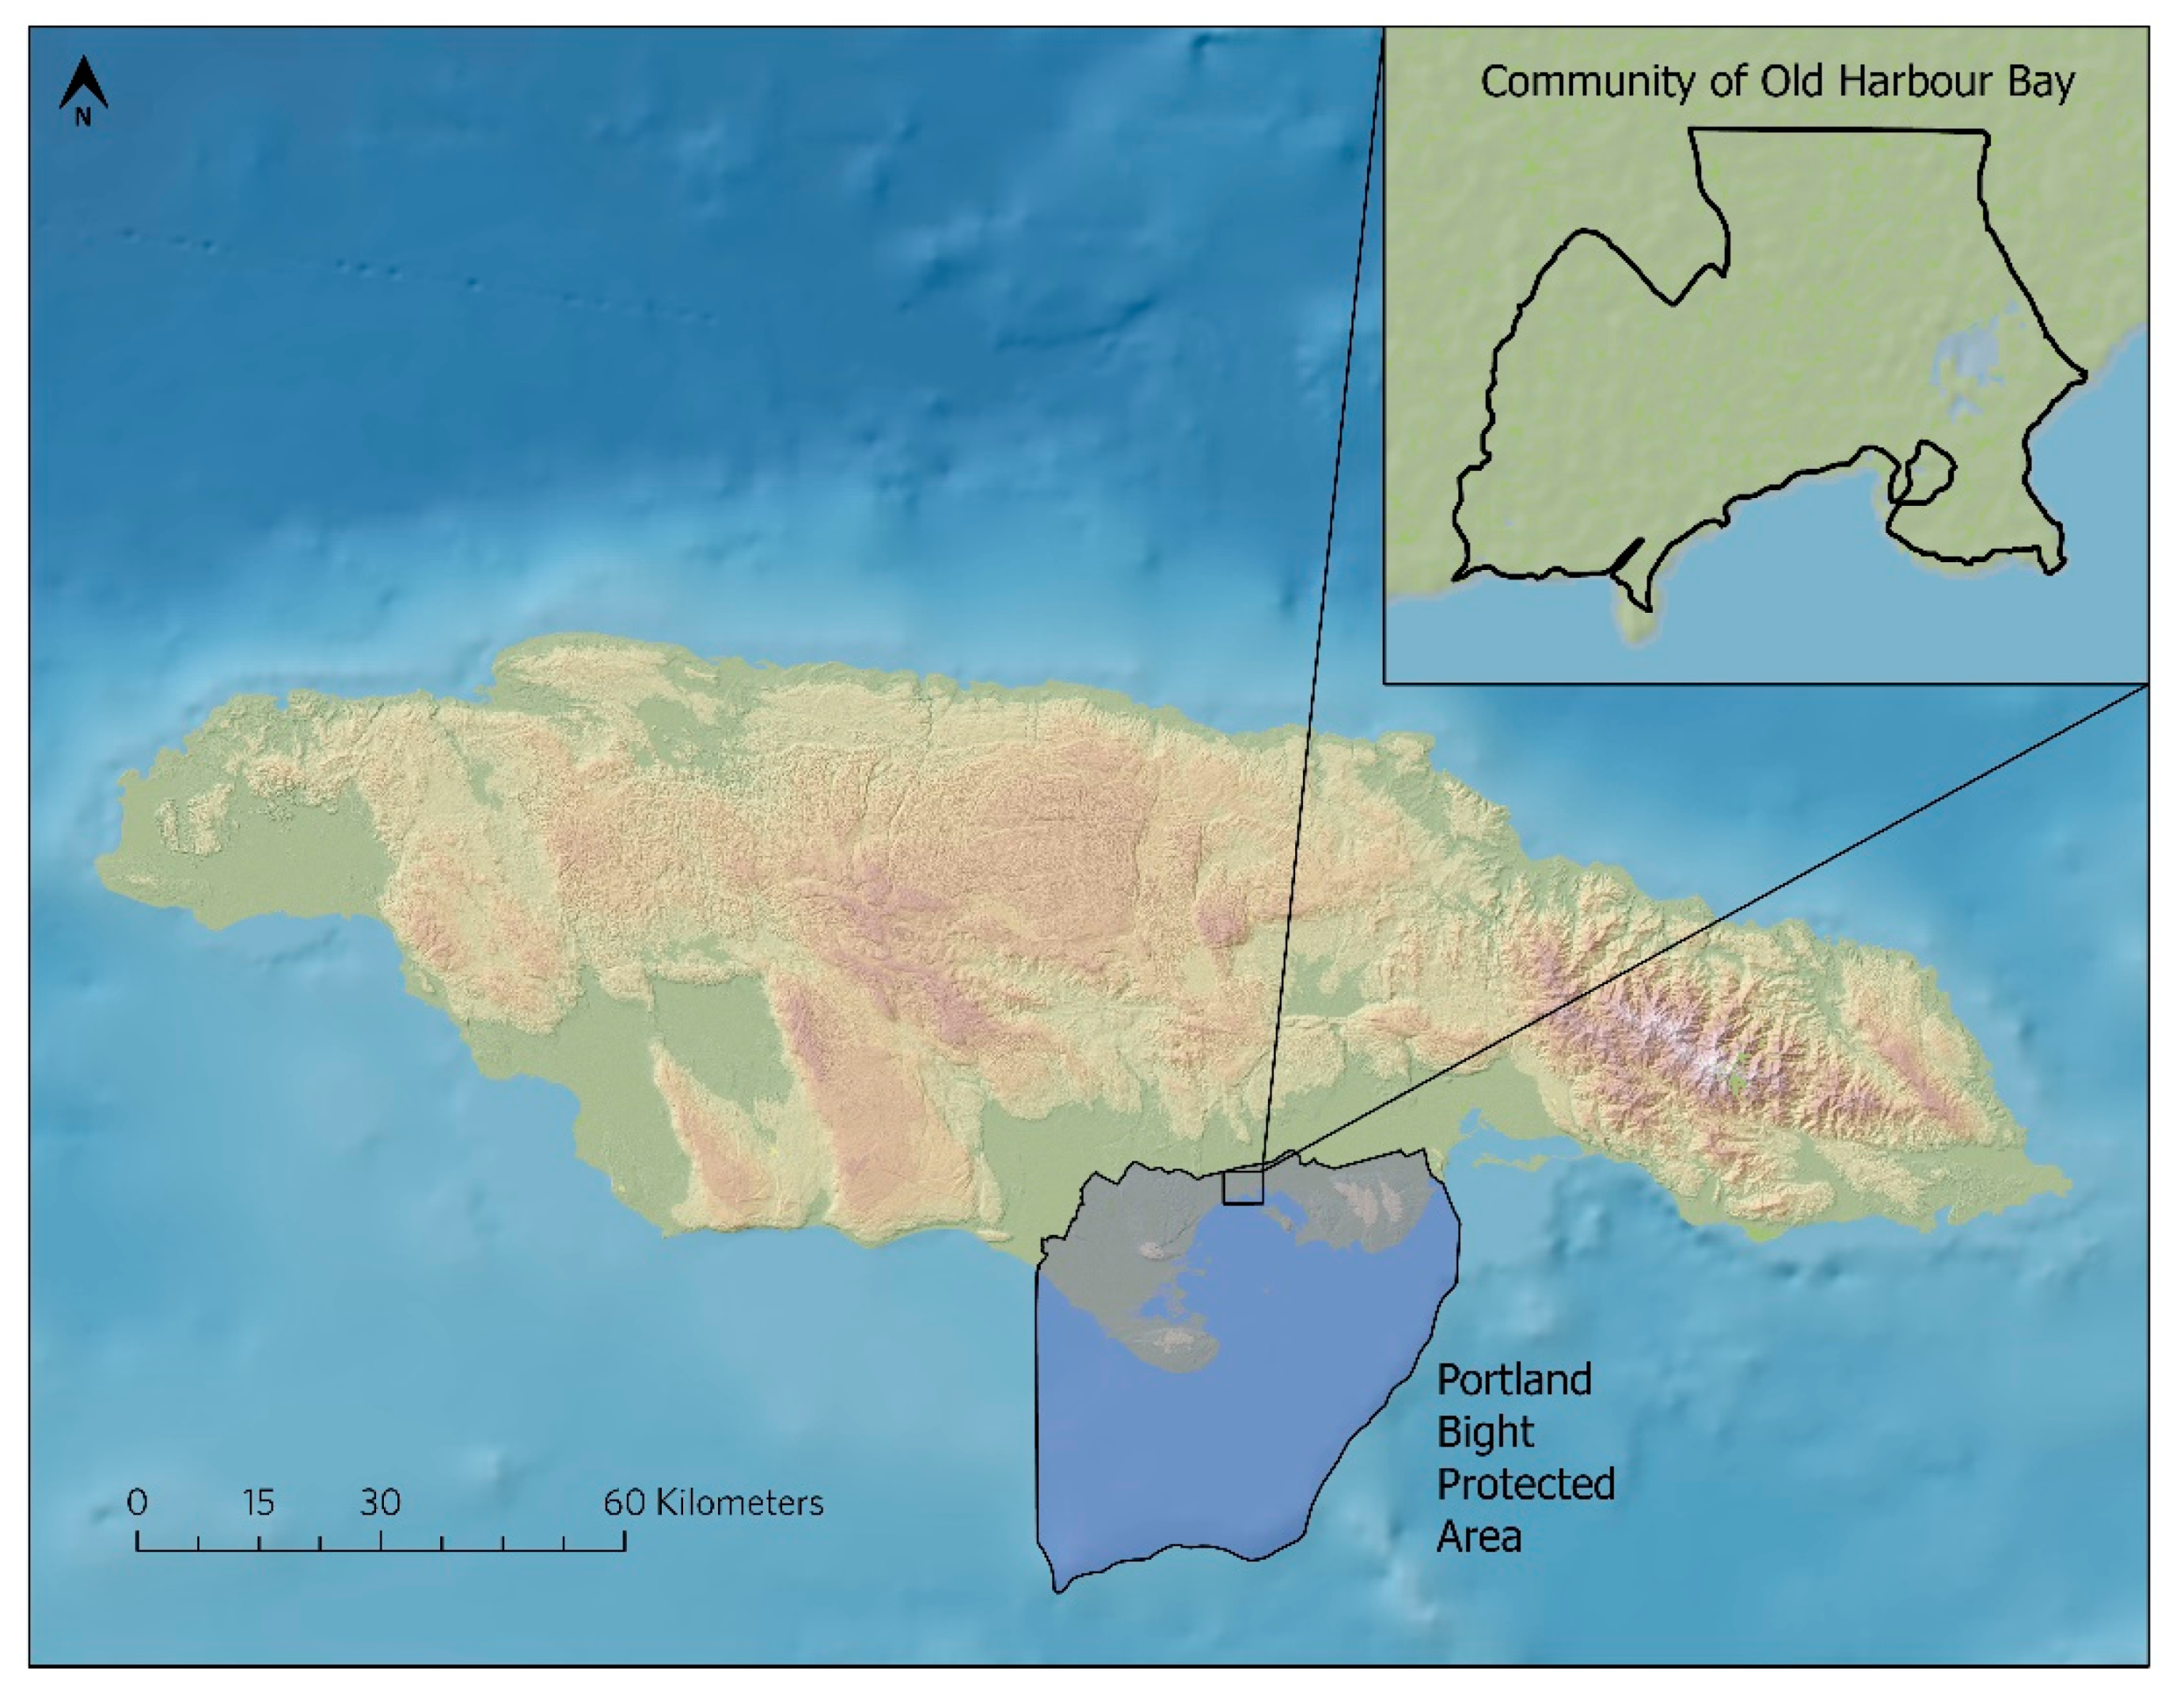
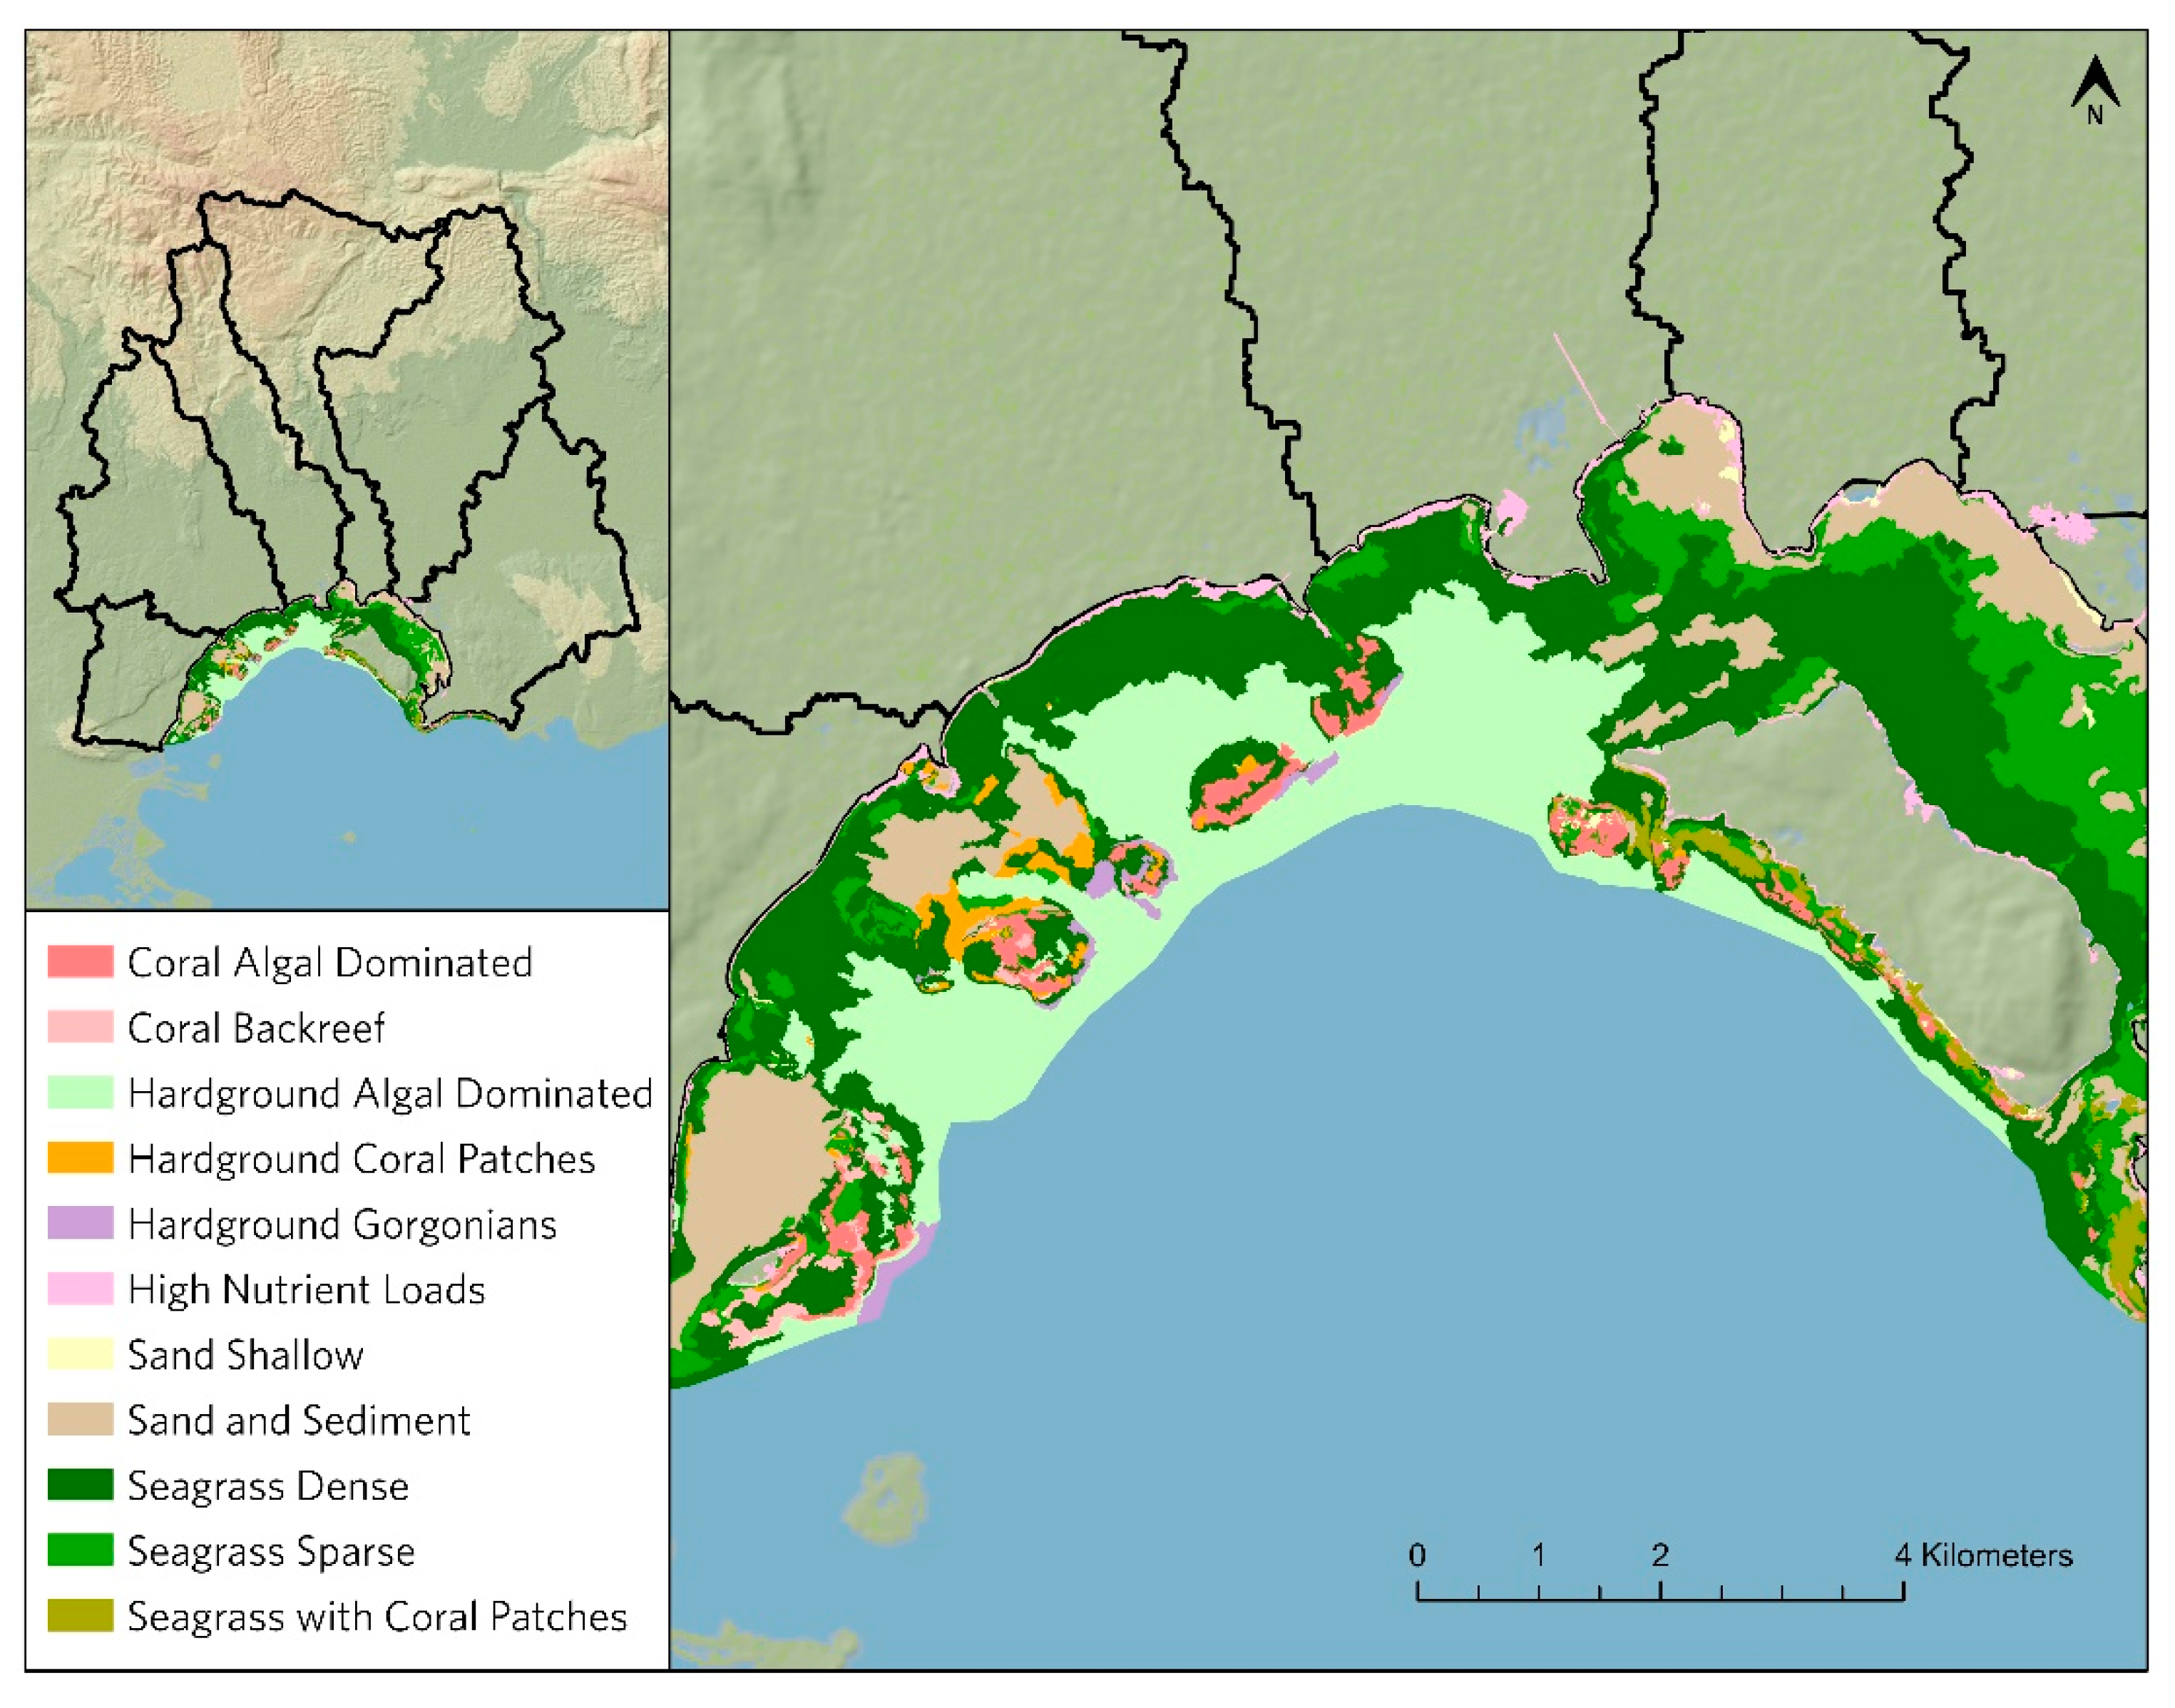
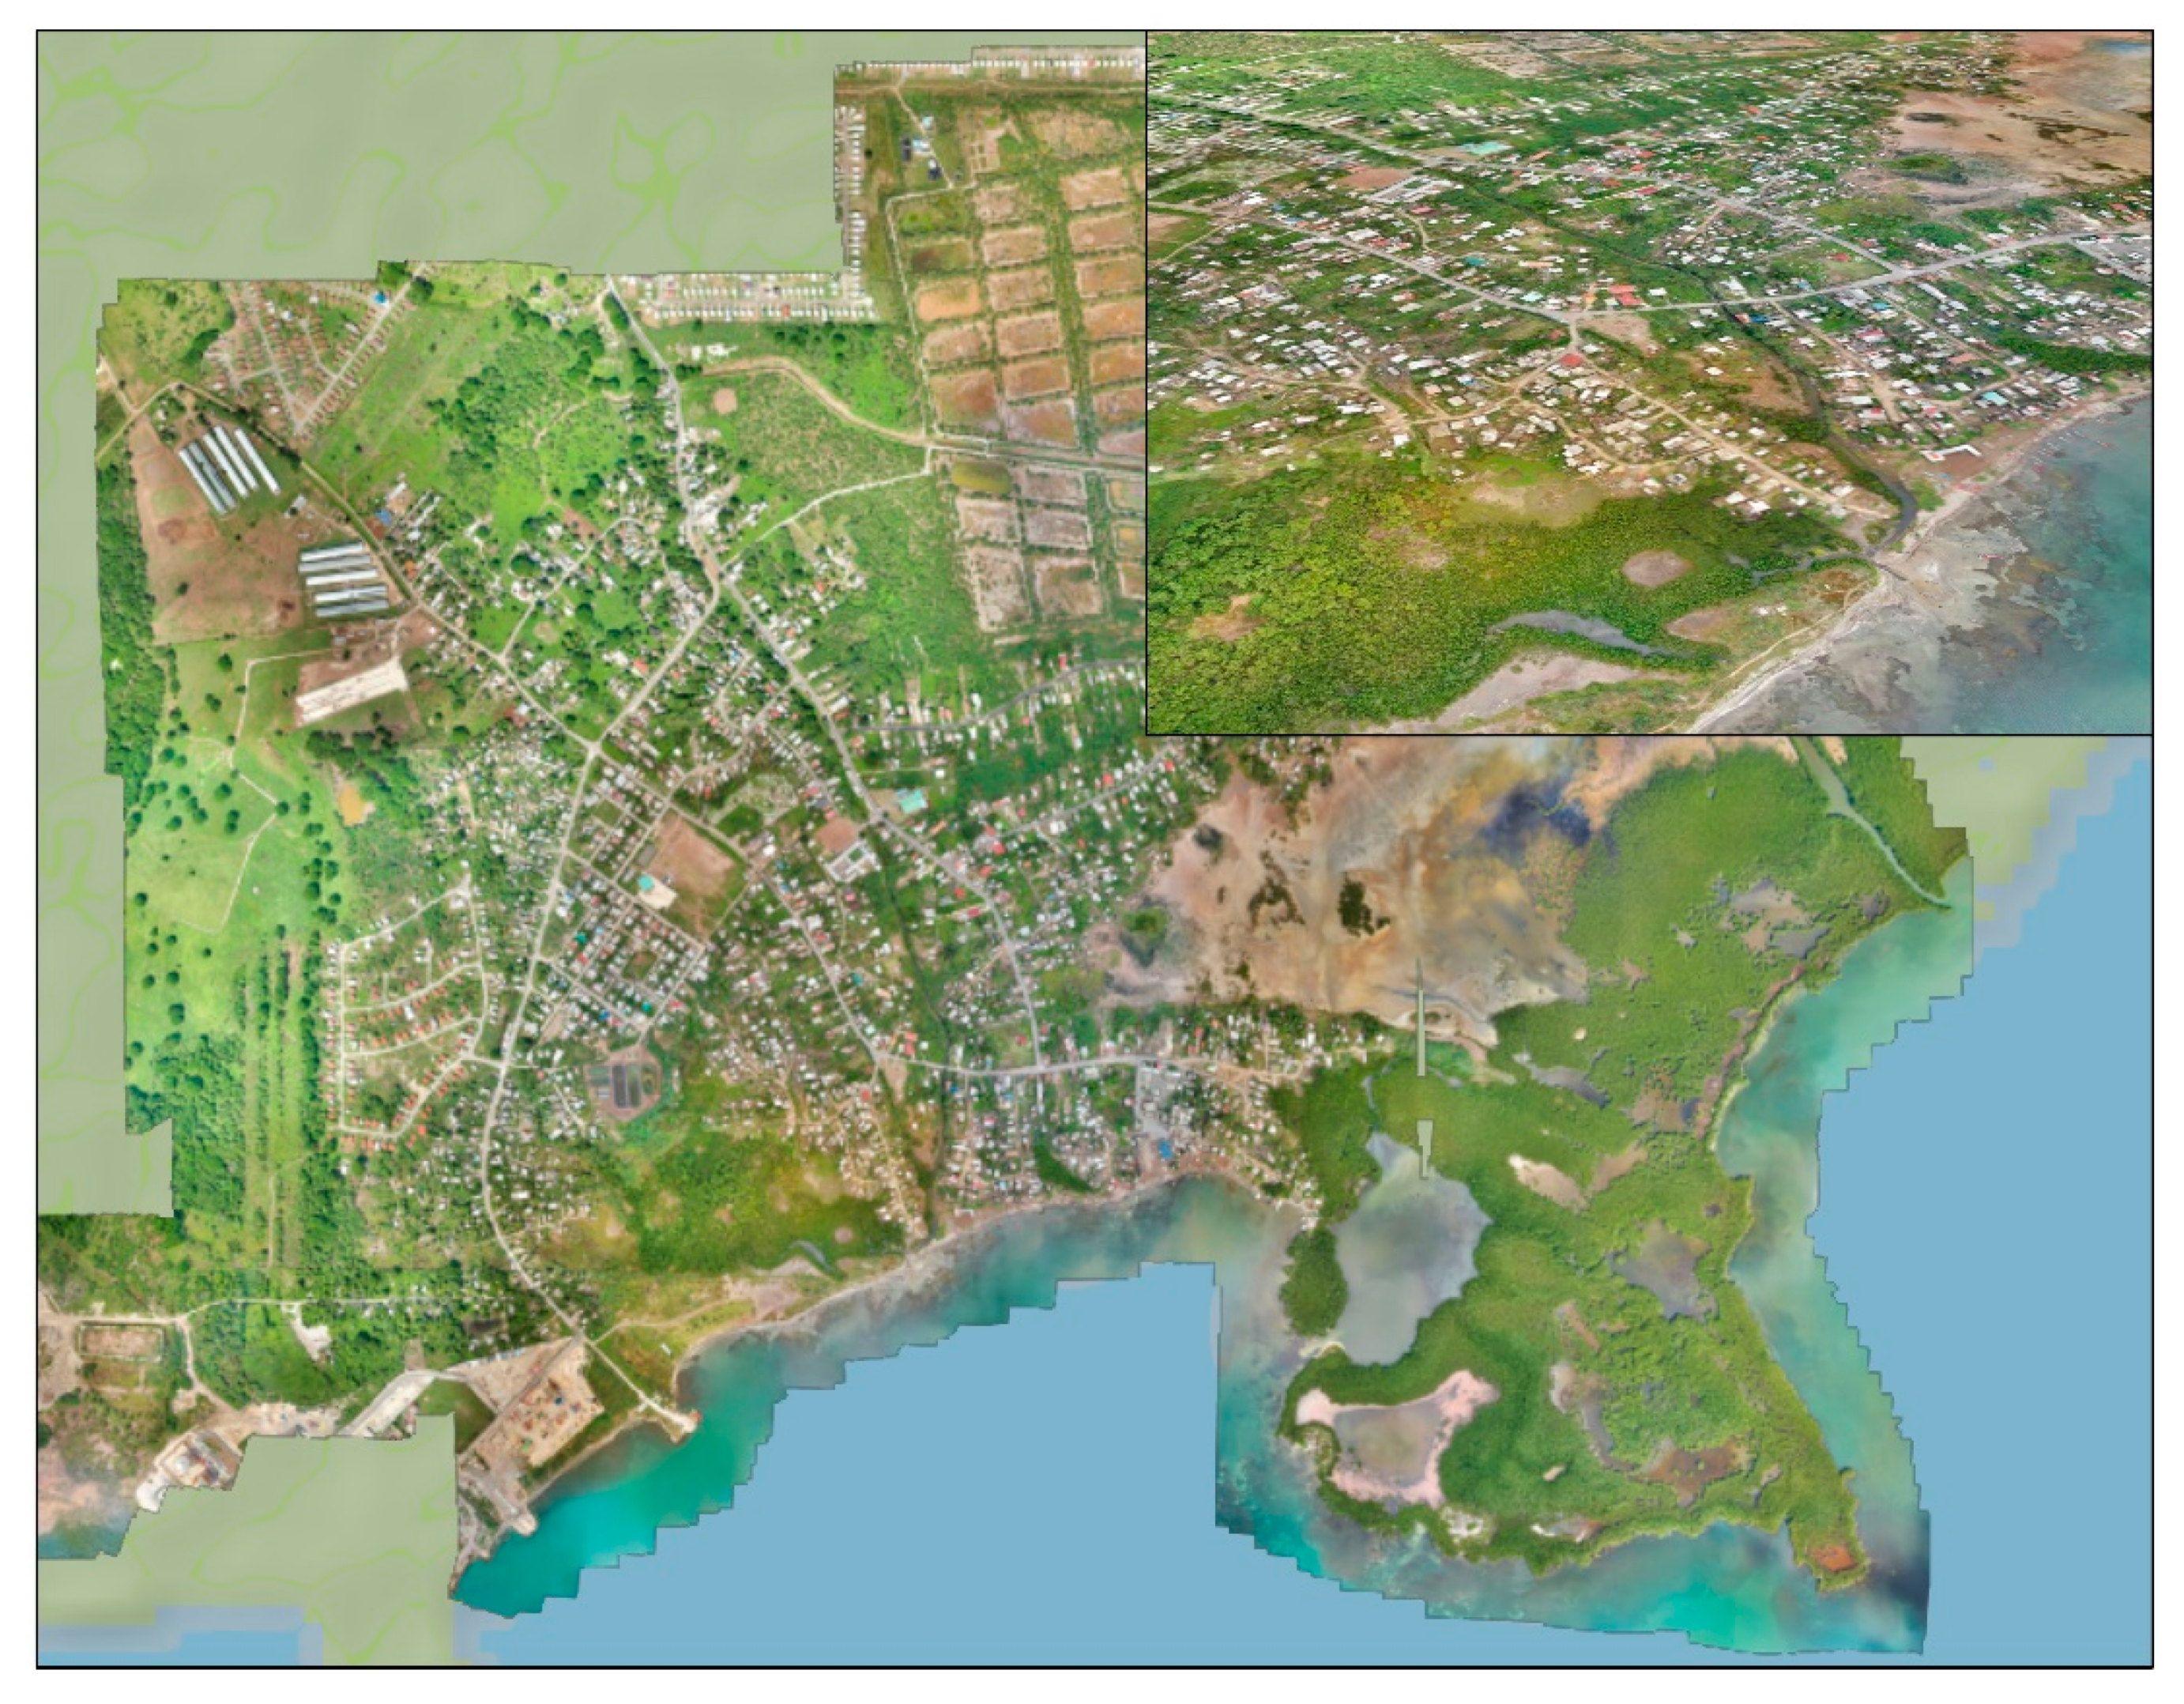
Tropical storms and hurricanes impact Jamaica on an annual basis which results in high wind, heavy rains, and localized flooding, sometimes occurring days prior to and after the event. Historically, these events have resulted in coastal and inland flooding, damage to assets and infrastructure, and the loss of lives and livelihoods. Sea level rise in Jamaica is projected to increase over 1m by the end of the century and has been seen to play a role in exacerbating inland flooding, shoreline (and beach) recession rates and erosion, and availability and quality of groundwater [3]. Recent publications [29,30] suggest generalized shoreline changes across Jamaica. Observations during the period between 1968 to 2010 and projections to 2060 referenced long-term shoreline retreat rates of 0.17 and 0.76 m per annum, with an average of 0.26 m per annum.
Some notable events causing severe flooding (wide-scale inundation of dry land, overflow of rivers, or groundwater seepage) include Hurricane Charlie in 1951, with 432 mm of rainfall, 154 reported deaths, and which cost about US$615 million, Hurricane Ivan, a Category 4 hurricane in 2004, with 709 mm of rainfall, 17 reported deaths, and an 8% impact on Jamaica’s GDP, and Tropical Storm Gustav in 2008, with 491 mm of rainfall, 20 reported deaths, and a cost of 2% of Jamaica’s GDP [4,31]. The loss and damages incurred during these events suggest heterogeneity resulting from factors such as socio-economic conditions of the communities impacted, location of the community including its proximity and elevation from the coast, and quantity and age of infrastructure, among others. These are indicators of a community’s sensitivity and adaptive capacity that can be measured to assess its vulnerability [4,13].
A study of 198 flood events between 1678 and 2010, estimated that flood occurrences in Jamaica have been increasing, with 35 events occurring between 2000 and 2010 (the highest during the time period studied) [31]. Since then, Jamaica has experienced severe flooding events in 2012, 2017, and 2018 [32]. In addition, the twenty-year period comprising 1990–2010 was 49% more active than the forty-year period between 1970–2010 (0.9 events per annum with reported losses) [31]. Just during the period between 2002 and 2007, where six strong storm events impacted Jamaica, sixty lives were lost, and damages amounted to US$1.02 billion [4]. These findings support climate change projections of an increase in the frequency and costs of storm events. They also reflect development choices that have led to unregulated and unsustainable urban planning, putting people and property in high-risk zones. Overall, the average severe flood event costs US$62.1 million or roughly 0.5% of GDP measured in 2010 values with an annual loss of life rate of 4 people [31]. Although the majority of the loss and damages during these storms are caused by severe flooding, Hurricane Gilbert in 1988 is a notable exception since it primarily caused wind damages estimated at US$4 billion [33].
These loss and damage estimates are highly dependent on the method of assessment and post-storm data available. The most common type of assessment employed in Latin America and the Caribbean is the DaLa methodology (https://www.gfdrr.org/en/damage-loss-and-needs-assessment-tools-and-methodology, accessed on 8 January 2021), developed by the Economic Commission for Latin America and the Caribbean (ECLAC), which uses national accounts and statistics to calculate the financial value of damages and losses due to disaster events. This methodology uses a sectoral approach and “itemizes distribution and priority setting based on geopolitical divisions, sectors of the economy, and different population groupings in the affected area” [34]. The assessment is triggered by a request from countries and is not applied comprehensively. Accordingly, the data it provides are limited to post-impact assessment, and more specifically to areas obviously impacted. It does not readily allow for strategic planning and identification of areas for prioritized investment in NBS.

2.2. Study Area

Old Harbour Bay (OHB) is located along the south coast of Jamaica in the parish of St Catherine (Figure 1). It is the largest fishing village in Jamaica and contributes to the economic viability of the agriculture sector. Land use within the area is supported by its proximity to six micro-watersheds (Figure 2) and is characterized as agricultural, commercial, industrial, residential, and recreational. OHB falls within the Portland Bight Protected Area, the largest protected area in Jamaica, of immense ecological and biological importance. It is a predominately flat, coastal community, with gullies and rivers which act as a drainage system in times of heavy rainfall (Figure 3). The community is composed of about 7388 residents living in 1894 households or dwellings [35].
In OHB, exposure to natural and climate-related hazards such as flooding, storm surge, and coastal erosion is a significant component of the community’s physical vulnerability. The majority of the OHB community is situated in a low-lying coastal area of the Rio Cobre Watershed Management Unit that extends 300 m inland with an elevation that is less than 1.6 m (mean sea level). The immediate coastal zone is concentrated with human and infrastructure assets and directly impacted by flooding. Given the area’s low-lying nature, flooding is a regular occurrence from both upland stormwater flows and storm surge. This flooding can be attributed to rising seas, poorly designed drainage systems, and the solid waste management network, as well as the numerous gullies, drains, and streams that traverse the community’s infrastructure and easily overflow during extreme rain events.
The estimated shoreline change rates for Old Harbour Bay are at 0.74 m per annum which may be further compounded as mangrove habitats within eroded zones will be destroyed or drowned and the remaining mangroves buried with coastal sediments [30]. Further intensification of hurricane peak wind intensity and accelerated SLR rates may increase the extent of mangrove inundation and reef stress [36,37]. Erosion in Old Harbour Bay is associated with hurricane winds that generate strong waves and near-shore currents that can mobilize sediments, as well as SLR. The large dependence on ecosystem-based livelihoods for fisheries activities, as well as the location of important assets in this zone, exacerbates the community’s vulnerability, impacting their resilience and ability to recover from sudden shocks. The relatively high exposure necessitates the development of environmental protective strategies, infrastructure repair, and policy adoption.
Accurate spatial data are needed for a more detailed vulnerability analysis of the OHB community. These data and models will assist decision-makers in the development of climate mitigation and adaptation strategies as well as the medium to long-term strategic plans for the community to address climate change impacts. About 90% of Jamaica’s GDP is generated in coastal areas, where fisheries and tourism are major sources of the country’s revenue [38]. Given the community’s contribution to national GDP, it is important that community-level datasets and models be used to analyze risks and vulnerabilities as accurately as possible. To address this need, we present existing available environmental and socio-economic datasets, use cost-effective means to develop new high-resolution datasets, and demonstrate how this information can be used to inform sea level rise impacts and vulnerability analyses, which can serve as the basis for developing community resiliency plans.

2.3. Topographic and Environmental Data

Flood model results that evaluate sea level rise, storm surge, or riverine flooding events, can vary greatly depending on the intensity of modeling software used and the quality of the input datasets applied. Coastal inundation models vary from simple static bathtub models [39] to more accurate mesh-based hydrodynamic models that use compound wave and water level events [40]. Global SLR and storm surge models have historically been limited to simple bathtub scenarios due to computing capacity and lack of finer-scale topographic and bathymetric data needed for hydrodynamic modeling. For complex coastal flood vulnerability models to be precise, they require several key environmental datasets to accurately estimate SLR or storm surge levels, including coastal elevation, bathymetry, shoreline data, and marine and coastal habitat data (i.e., coral and mangrove extent). Balancing the quality and expected accuracy of the data and model used is controlled by project budgets and access to resources.

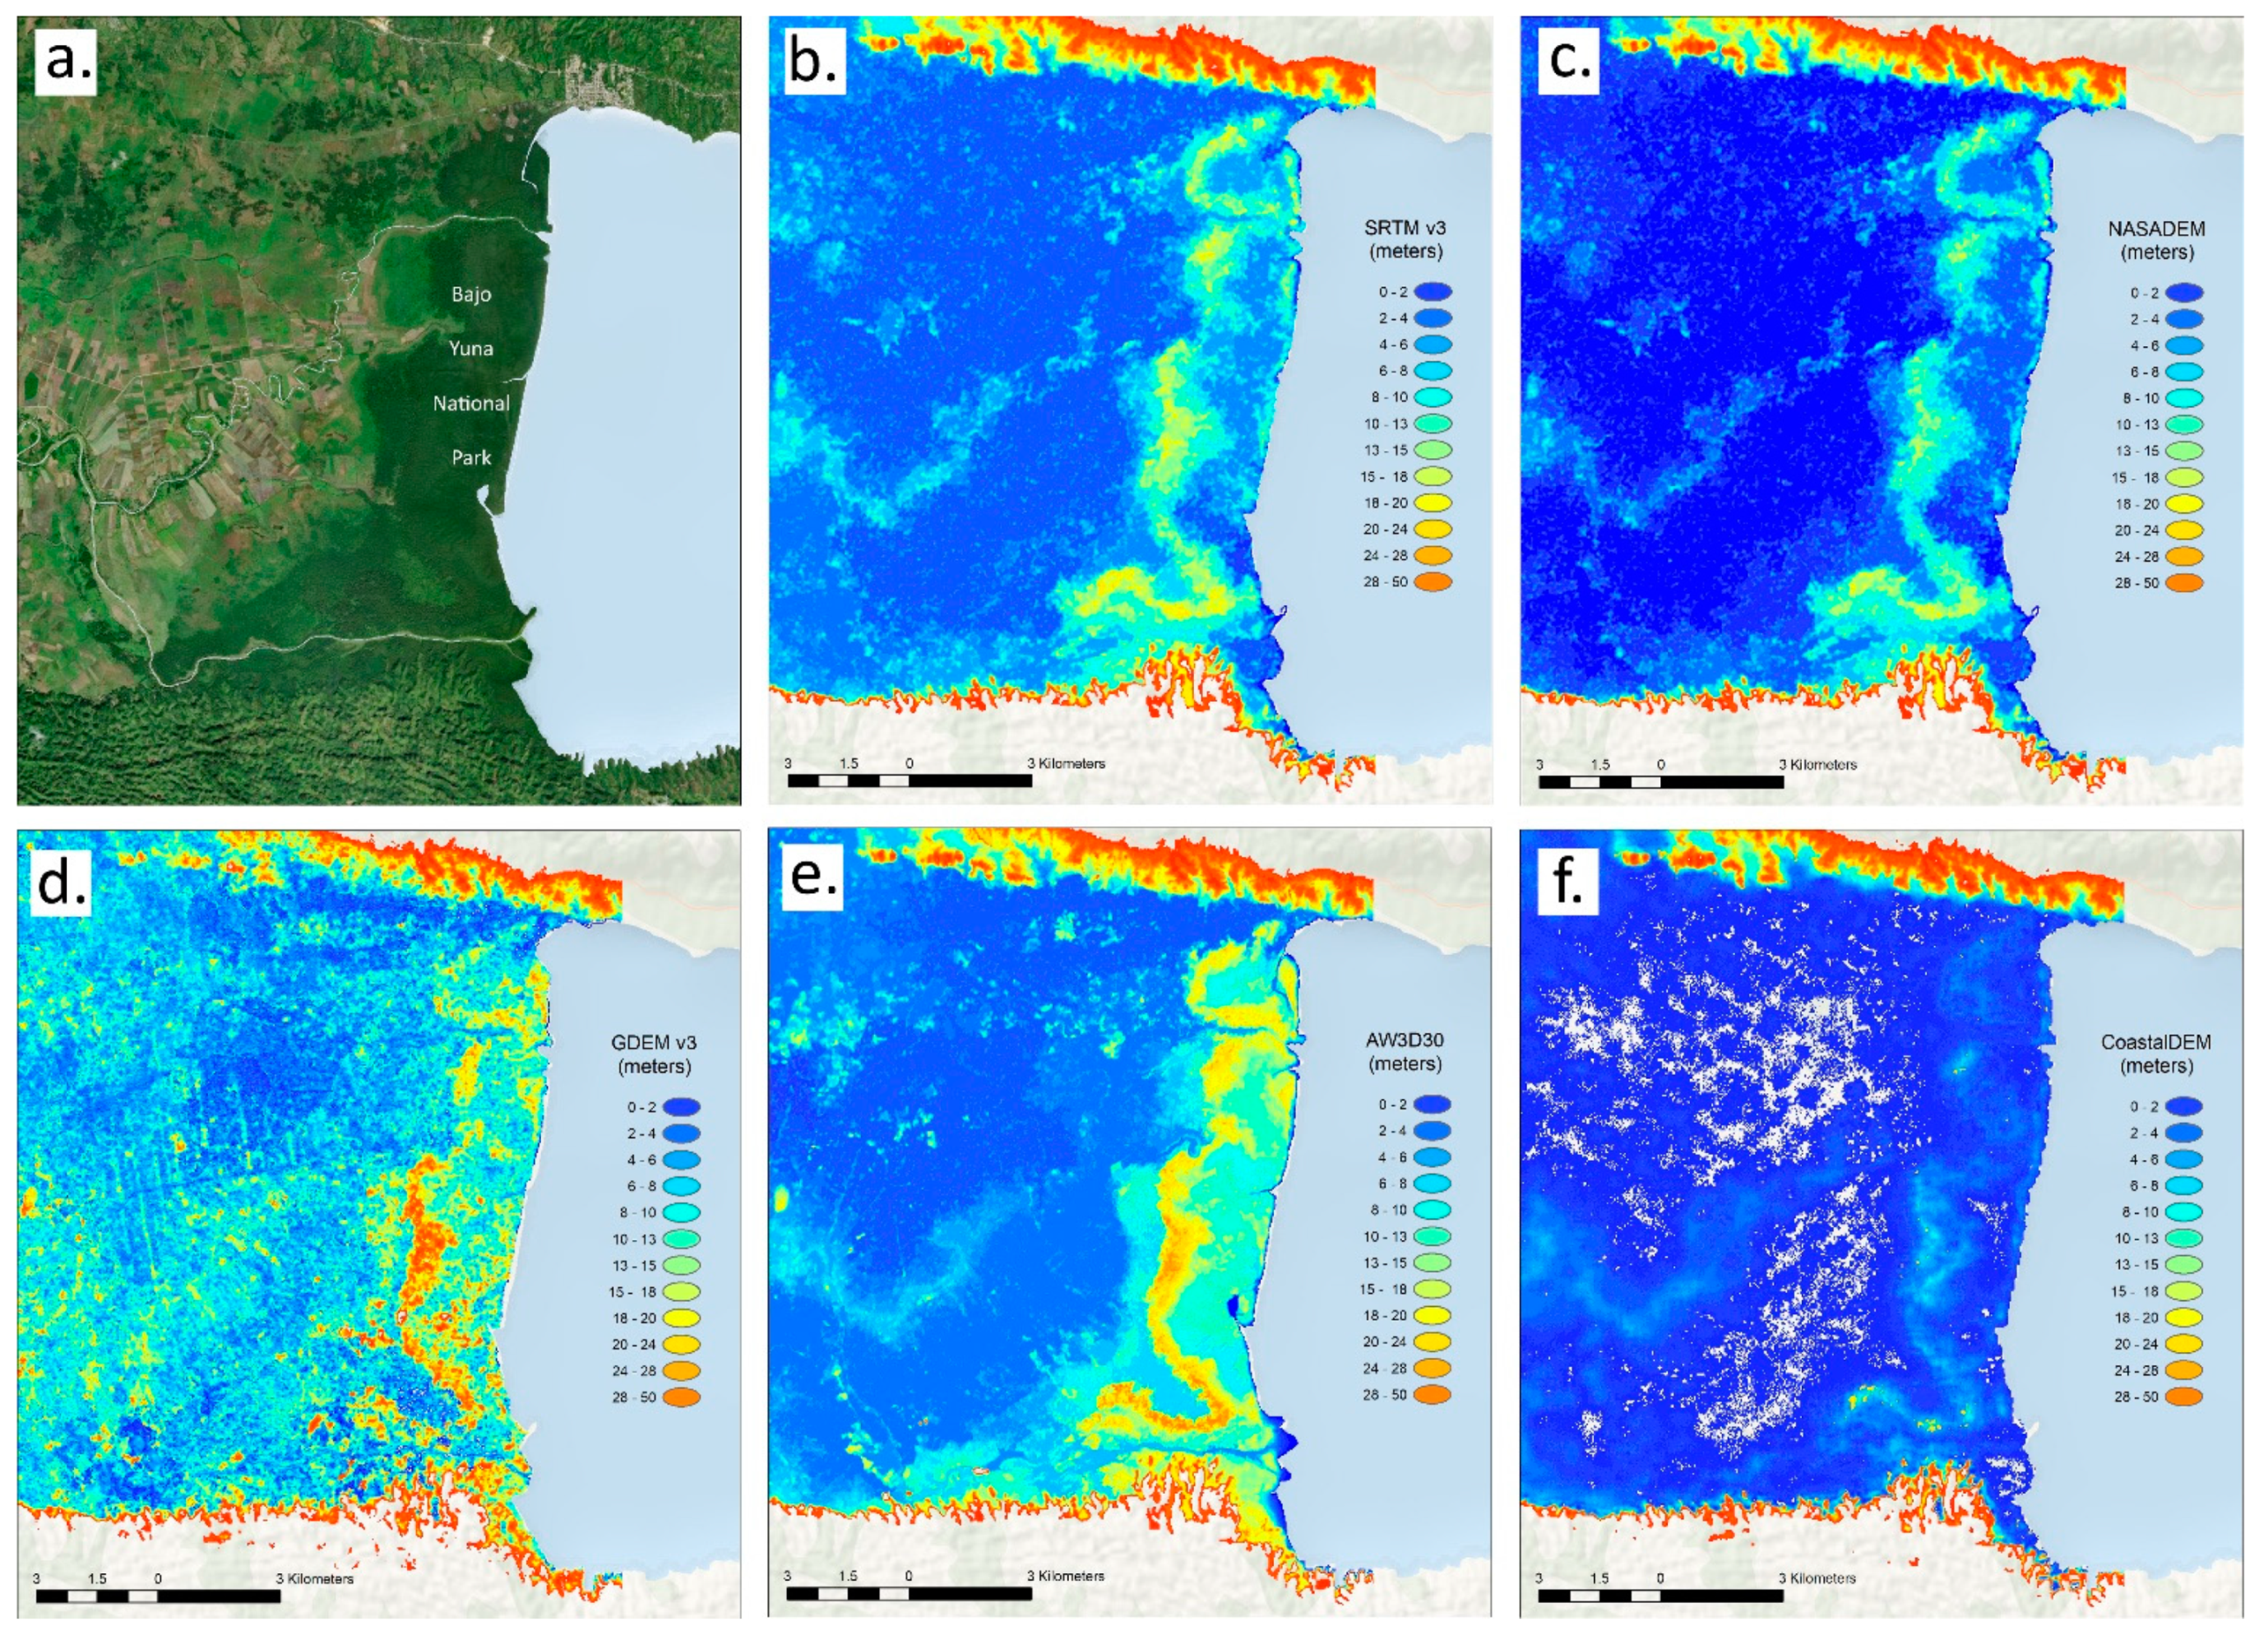
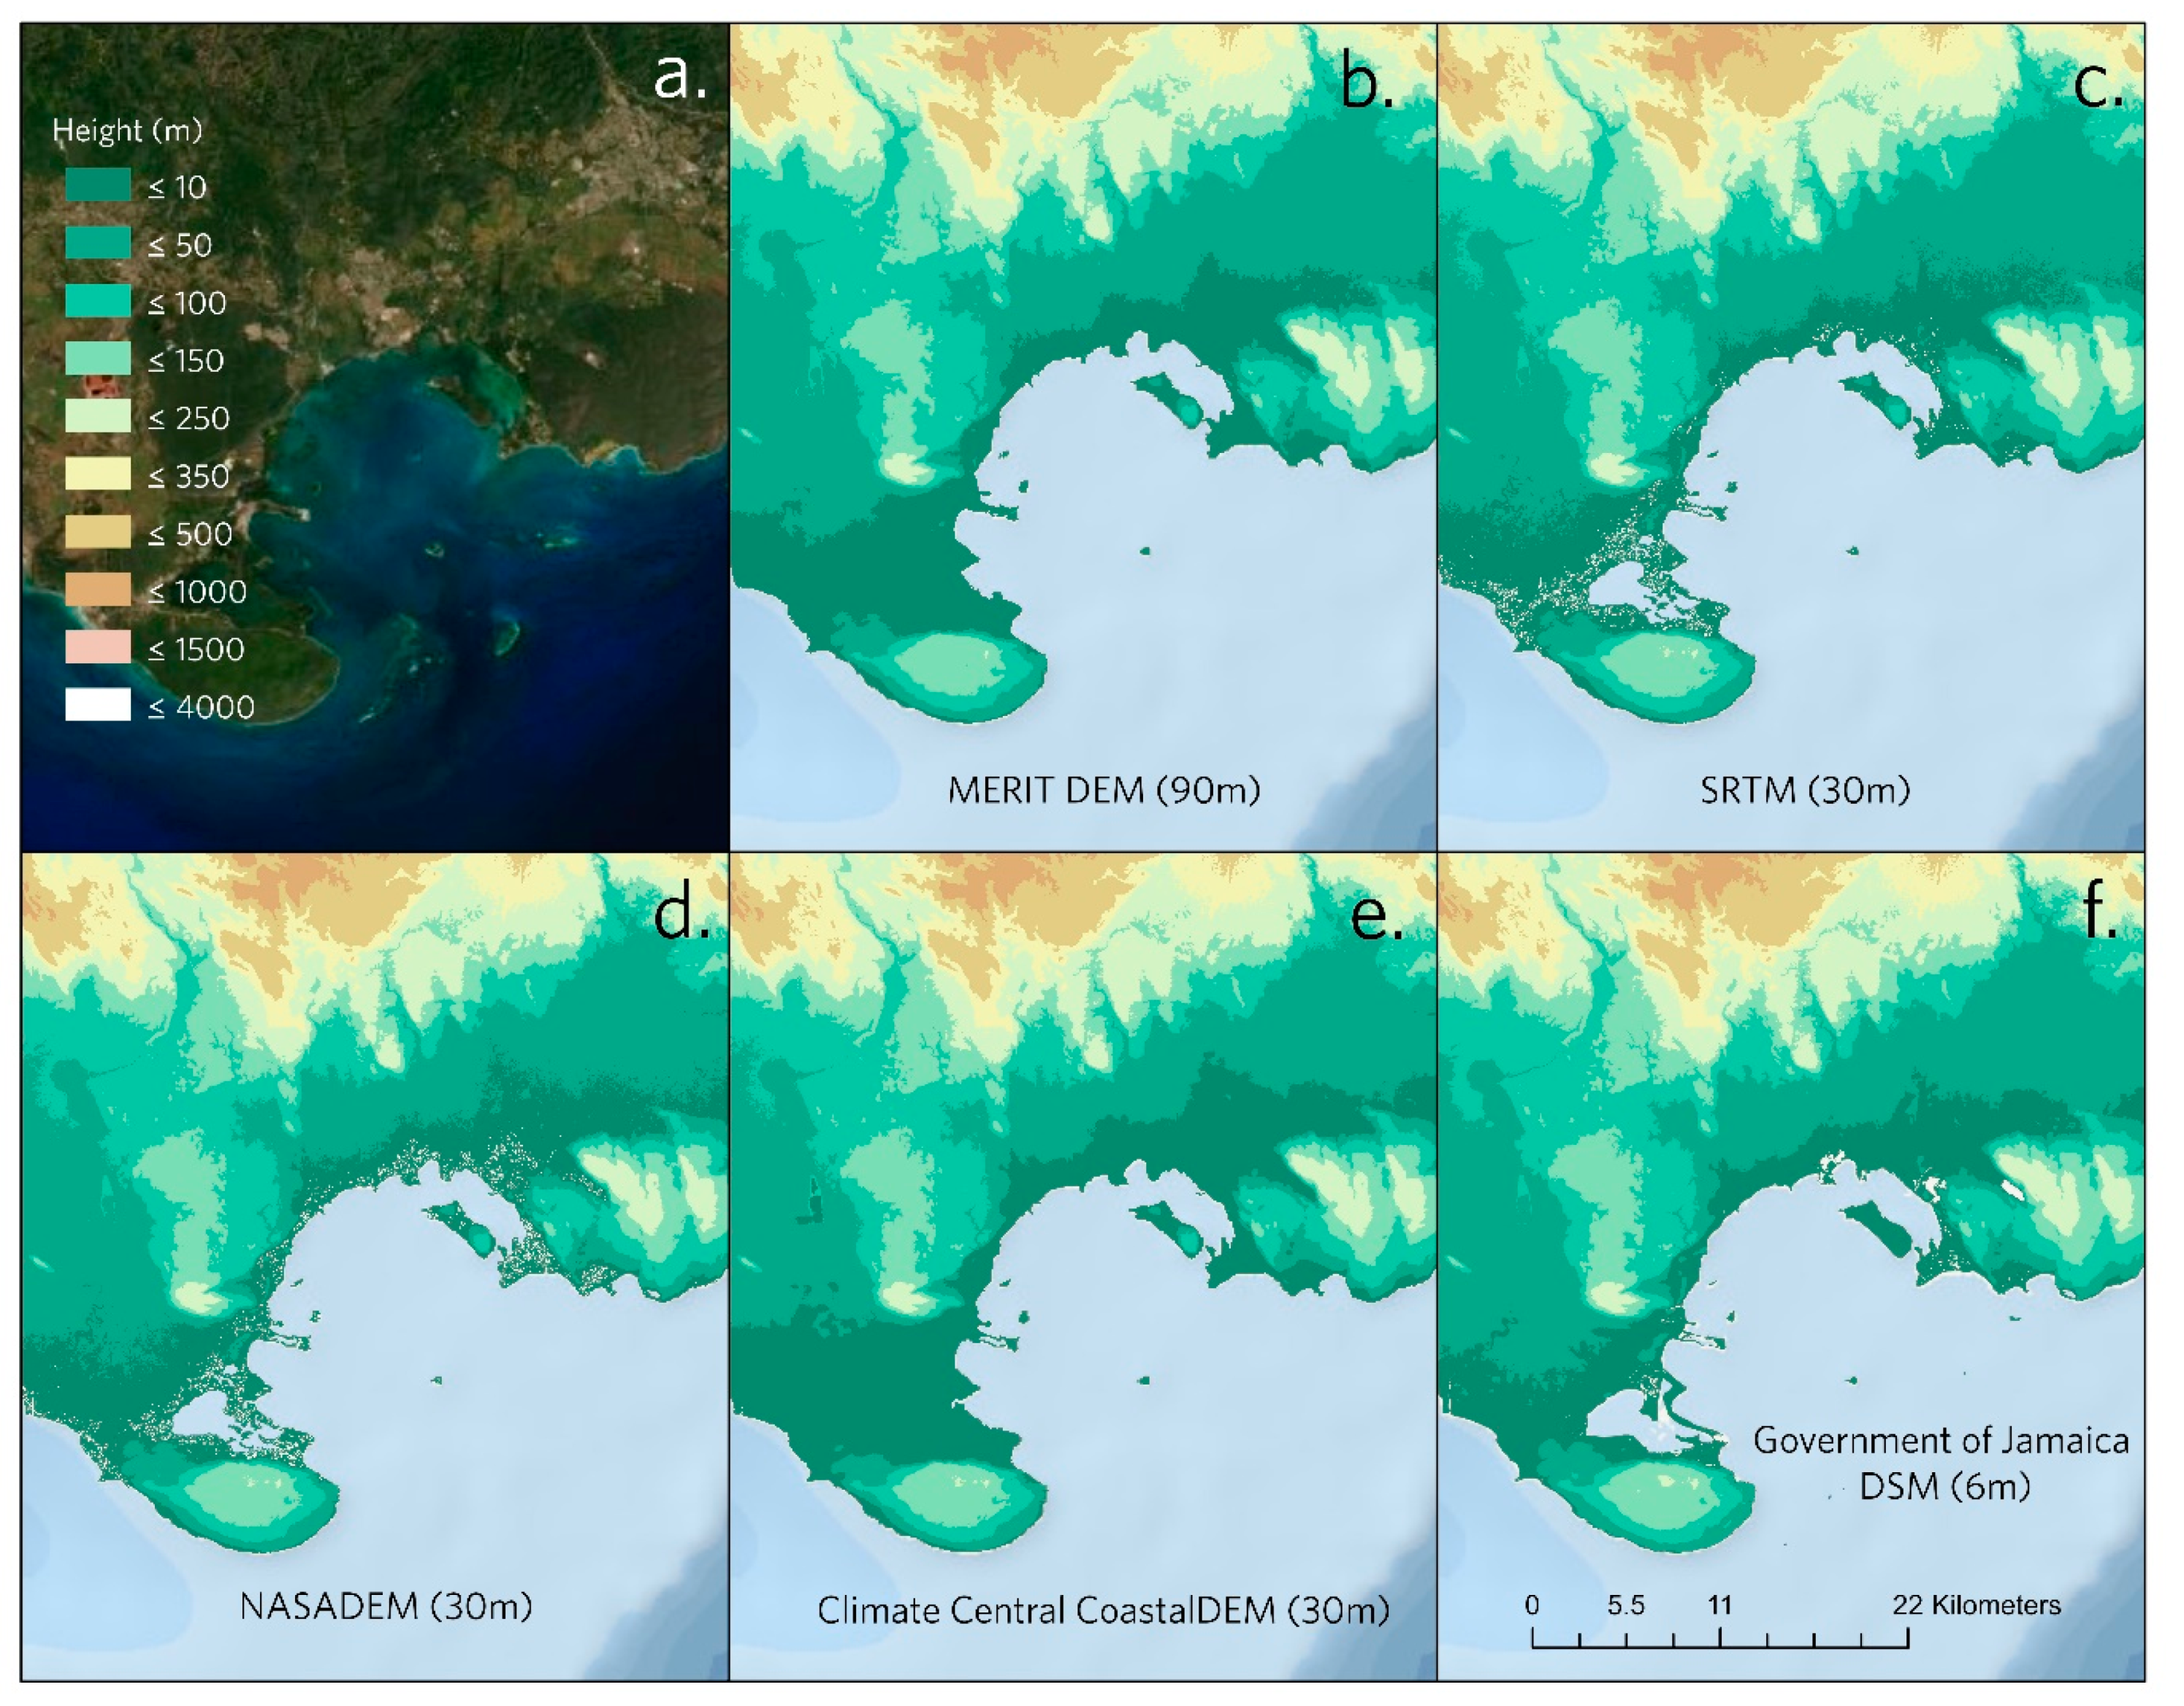
2.3.1. Digital Elevation Maps

Given the concentration of people and wealth on the coastline and climate change-driven acceleration of rising sea levels and storm surge from extreme weather events, the accurate coastal elevation is a critical data layer needed to predict and model the risks to the estimated 11% of the global population that live in low-lying coastal areas prone to coastal inundation [41]. To accurately predict the population and infrastructure impacted, more precise elevation data and improved hydrodynamic models are needed.
For these reasons, modeling coastal inundation potential in OHB required an exhaustive search of available elevation datasets, considering global, national, and local scale products. Table 1 gives an overview of available digital elevation models (DEM) for Jamaica and their corresponding sources, spatial resolution, vertical accuracy, and cost.
Many studies [42,43,44,45] show that the accuracy of the DEM, in both the spatial resolution and vertical accuracy of the data source, directly influences the modeled coastal inundation area and underlying population and infrastructure that are impacted [46]. DEMs can be classified into two different products: (1) Digital Surface Models (DSM) that represent the Earth’s surface and all objects on it (e.g., vegetation, buildings), and (2) Digital Terrain Models (DTM) that represent the bare ground with all objects removed. The NASA SRTM v3, ASTER GDEM v3, AW3D30, and recently released NASADEM are the highest resolution DSMs freely available for Jamaica, at 30 m spatial resolution. Recent work by Kulp and Strauss [21] argue for improved accuracy over these traditional global elevation models that do not adequately represent true “bare earth” elevations, particularly in low-lying coastal areas where features such as tall mangroves interfere with vertical accuracy (see Figure 4 for comparison of products showing vegetation removal). This causes SLR and storm surge models to greatly underestimate the flood envelope of impacted coastal populations.
The MERIT [22,23] global elevation, also freely available, is a recent attempt to improve the vertical accuracy (i.e., eliminate vegetation cover), however, it is only available at a 90m spatial resolution [31]. The NASADEM [25] is the most recent attempt to integrate all available global elevation data (e.g., GDEM, AW3D30, and ICESat laser altimeter) to improve and fill data voids, however, it is a DSM product and therefore problematic for coastal SLR and storm surge modeling where tall and dense vegetation persists. The Climate Central Coastal DEM was derived from the NASA SRTM product, however, the vertical accuracy was greatly improved using a multilayer perceptron artificial neural network which effectively removes vegetation cover up to the 20m contour, reportedly reducing the vertical bias in half, but requires a significant budget [24].
Figure 4 shows a satellite image and comparison of five DEM products for Bajo Yuna National Park in the Dominican Republic, an area with a dense band of tall mangroves along the edge of Samaná Bay. Figure 4b–e show freely available 30 m DEM products while Figure 4f shows the vertically corrected 30 m CoastalDEM product. The CoastalDEM represents the closest estimation of ‘bare earth’, with mangroves removed from the elevation profile. For coastal modeling in a heavily vegetated areas, the CoastalDEM would be the most appropriate product, as the others would significantly underestimate coastal inundation. Figure 5 shows the available DEMs for Old Harbour Bay, Jamaica. There is less apparent variation between the products in Old Harbour Bay since this area is comparatively less vegetated than Bajo Yuna. However, the variations between these DEMs in OHB become more apparent when comparing the modeled impacts of sea level rise on the community (Table 3).
All of the elevation models applied in this research (Figure 5), excluding the Jamaica National DSM and the Unmanned Aerial Vehicles (UAV)-derived DSM, are derivatives of the Shuttle Radar Topography Mission (SRTM) global dataset. The MERIT DEM (90m) and Climate Central CoastalDEM (30 m) both improved upon the SRTM data by applying vertical correction algorithms to remove vegetation. Generally, the cost for these products increases as spatial resolution and vertical accuracy increase. More details on the distinctions between these DEMs are described in Table 1.
Technologies that can greatly enhance the spatial resolution and vertical accuracy of local elevation data include LiDAR, X-band airborne radar, and digital photogrammetry, such as the acquisition of stereo photos from UAVs. Products with higher accuracy often require a significant budget to collect, as they are not readily available in Jamaica. Costs of these technologies are scale-dependent: LiDAR becomes more cost-effective over larger areas [47], while UAV methods are more cost-effective or logistically feasible for small, local projects. When investments in UAVs and photogrammetry software are made, DEMs at spatial resolutions of 2–3 cm can be produced for areas on the order of square kilometers and can provide high-density point clouds that can be filtered using post-processing software to achieve a ‘bare earth’ DTM. UAV methods require the upfront investment in equipment and software as well as the knowledge and skillset to collect and process the data, however, once the capacity is achieved, the cost-effectiveness and benefits of acquiring these data can multiply, spilling over into many other projects that require these types of data.

2.3.2. Bathymetry Data

In addition to elevation data, bathymetry and shoreline data are critical inputs for sea level rise and storm surge models. The General Bathymetric Chart of the Oceans (GEBCO_ 2020, https://www.gebco.net/data_and_products/gridded_bathymetry_data/, accessed on 1 February 2021) gridded bathymetry data are the latest highest resolution and freely available global bathymetric product at 15 arc-second (~450 m) spatial resolution [48]. The GEBCO grid is the result of an international collaboration of bathymetric data providers and interpolated from contours that were digitized from a variety of nautical charts. Recent efforts have integrated additional ship track information from multibeam and single beam soundings and satellite altimetry. ETOPO1 (https://www.ngdc.noaa.gov/mgg/global/, accessed on 1 February 2021) is an older global relief model with a bathymetric grid at 1 arc-minute (~1852 m). These data are useful for deep ocean areas, (>200 m and >500 m depth), however, higher-resolution data are needed to model the hydrodynamic nature of the shallow coastal zone.
Using raster modeling, multiple scales of bathymetric data can be blended together to provide the spatial resolution needed to accurately model coastal inundation events. For example, local and national scale nautical chart data can be used to supplement existing data using soundings and contour information that can increase accuracy in the shallower areas (e.g., 0–100 m depth). Satellite-derived bathymetry (SDB) is an alternative option for modeling depth in the shallow zone (i.e., <30 m), using clear water column imagery from freely available Landsat (30 m) or Sentinel-2 (10 m) scenes, or from high-resolution imagery purchased from private companies such as Planet’s Planetscope Dove (4 m) [49] or Maxar’s WorldView-3 (1.25 m) [50] satellites. However, developing the bathymetric derivation algorithm requires software access and technical capacity. Another option is to purchase these products from companies that specialize in SDB solutions.

2.3.3. Shoreline Data

Shoreline data can similarly be derived from varying scales of satellite imagery. Previous global shoreline vector products have excluded many small islands (i.e., <1 km2 in area), however, a new 30 m product developed from annual composites of 2014 Landsat satellite imagery provides a consistently mapped land and ocean interface boundary with global ecological coastal units [51]. Older global shoreline products include the Global Self-consistent, Hierarchical, High-resolution Shoreline (GSHHS) [52] and the World Vector Shoreline Plus produced at a scale of 1:250 K with 90% of shoreline features within a 500 m circular error of their true geographic location [53]. Shoreline can also be extracted from high-resolution imagery [54] or manually digitized using Google Earth, Esri, and Microsoft Bing image libraries. For example, The Nature Conservancy manually digitized the shoreline for all areas within the Caribbean Basin through image interpretation of these image libraries, and this vector file is freely available via CaribbeanScienceAtlas.tnc.org (accessed on 1 February 2021).
When considering the coastal resilience benefits of marine and coastal habitats (e.g., coral reefs, seagrass, mangroves), it is critical to include their mapped spatial extents as data input for improving SLR and storm surge models. Satellite-derived freely available global products such as the UNEP-WCMC global distribution of coral reefs [55] and Global Mangrove Watch [56] provide 30 m resolution. The Allen Coral Atlas is greatly improving global-scale benthic habitat products, providing PlanetScope Dove-derived maps of coral reefs and seagrass beds at a spatial resolution of 4 m [57]. While these global-scale products may be the best data available, it is important to recognize the limitations and implications of using these datasets for national or local scale analyses. High-resolution satellite and UAV imagery can be acquired at this scale and used for creating finer scale benthic habitat maps. These features can also be manually digitized through image interpretation using image libraries in Google Earth, Esri, or Microsoft Bing. For benthic habitat data in the Caribbean Basin, including coral reefs and seagrass beds, The Nature Conservancy provides freely available benthic habitat data that have been produced at the regional scale at 4m resolution, derived from PlanetScope Dove satellite imagery acquired in 2018–2019, with 13 standardized habitat classes via CaribbeanMarineMaps.tnc.org (accessed on 1 February 2021).

2.4. Socioeconomic Data Availability

Once a coastal inundation model has been developed, socioeconomic data are needed to estimate threats to populations and damages to infrastructure under varying storm scenarios. Gridded population models are available via Oak Ridge National Laboratory’s LandScan dataset [58] and the European Commission’s Global Human Settlement layer [59], at 1 km and 250 m resolution respectively (Table 2). WorldPop is available globally at 1 km, or at the national level for most countries, including Jamaica, at 100 m resolution for years 2000–2020 [60].
Higher accuracy, national census data are often available at the enumeration or municipal district level, however, these data are summarized per district, which can be challenging to use in small-scale coastal inundation models since these data are not gridded. At the community level, buildings can be digitized from high-resolution satellite or UAV imagery and combined with census estimates of people-per-household to derive fine-scale estimates of coastal flood risk to populations. Gridded models were compared to freely available 2018 census data at the parish level from the Jamaica Statistical Institute (STATIN) for this study. WorldPop data, with 100 m × 100 m pixels, correlates the closest with census data at the parish level and was identified as the best available population dataset for modeling avoided damages to people, in locations where UAV imagery is not available or cannot be collected.
Infrastructure data are scarcely available in the Caribbean, although roads, utility lines, and building footprints can sometimes be found from the relevant government ministries. The Global Assessment Report on Disaster Risk Reduction (GAR) provides a gridded global model of economic exposure split by use sector (public, private, government, etc.) at a 1km resolution. This information is derived from several global datasets including: building structure typology from the World Agency of Planetary Monitoring and Earthquake Risk Reduction (WAPMERR); socioeconomic indicators from the UN; GDP distribution from the World Bank; Built-Up Reference (BUREF) from the Joint Research Center (JRC); among others. This information can be downscaled to 100 m using available population data from WorldPop via geospatial resampling methods. Open Street Map (Map data copyrighted OpenStreetMap contributors and available from https://www.openstreetmap.org, accessed on 8 January 2021) has spatial data freely available for roads, water towers, cell towers, and wastewater plants. The Ministry of Health (MoH) and Planning Institute of Jamaica (PIOJ) have spatial data on emergency facilities, such as hospitals, fire stations, police stations, and health centers, which can be freely accessed via their websites (https://www.moh.gov.jm/, accessed on 8 January 2021; https://www.pioj.gov.jm/, accessed on 8 January 2021; https://jis.gov.jm/government/agencies/national-spatial-data-management-division/, accessed on 8 January 2021; http://www.licj.org.jm, accessed on 8 January 2021). Additionally, the National Spatial Data Management Division (NSDMD) and the secretariat for the Land Information Council of Jamaica (LICJ) collects, manages, and shares infrastructure data for Jamaica, which is made available through a data requisition process.
Once a data inventory has been completed, decisions are made on what data are needed and data gaps that need to be filled. It is important to ensure all data are co-registered and georeferenced prior to importing for SLR or storm surge modeling. This can be done using Google Earth, Esri, or Microsoft Bing image base maps at fairly high resolutions, which vary depending on location, with an average resolution of 1–2 m. High-resolution satellite or UAV imagery provides the ability to map building footprints of homes and community facilities at 3 cm–0.3 m resolution, respectively (Figure 6). Local estimates of housing costs per unit area can be used to calculate infrastructure damages under flooding scenarios, using the UAV-derived or other digitized format housing footprints.
For the community of Old Harbour Bay, UAV imagery was collected using a DJI Mavic Pro 2 at an altitude of 120 m (3.8 cm pixel). The UAV collected 7352 images that were processed using DroneDeploy (San Francisco, CA) cloud-based photogrammetry software to create a digital surface model (DSM) and orthophoto mosaic that covered 12.82 km2 (Figure 1). The orthophoto mosaic was georeferenced to RMSE <1 m using ground control targets throughout the community and the vertical elevation was adjusted based on the observed high tide line. Building footprints and other infrastructure were then manually digitized via image interpretation.

3. Results

3.1. Bathtub Sea Level Rise or Storm Surge Modeling

To compare and identify patterns of sea level rise and socioeconomic impacts using varying resolutions of input datasets, we developed flood envelope maps for several of the DEMs listed in Table 1 using a simple bathtub approach to simulate 3 m of sea level rise or storm surge in Old Harbour Bay, Jamaica. Given this model, it is assumed that all areas with elevation less than 3 m are flooded, regardless of proximity to the coast. Each SLR/storm surge model was intersected with high-resolution socioeconomic data (e.g., building footprints), derived from UAV imagery, to assess the differences in inundation impacts using different elevation data sources.
Although oversimplified, the bathtub models (see Table 3) illustrate the need for careful selection of environmental datasets as inputs for coastal inundation modeling. Under each of these models, it was assumed that any structure within the flood envelope constituted 100% damage to people and infrastructure. Our analysis was done to identify the magnitude of the differences in assessments of coastal risk when using different DEM datasets. A census estimate of 3.2 people/household for this parish was applied across the entire building footprint layer, regardless of the size or function of the structure [61]. Similarly, an estimate of US$65.50 per square foot was calculated as an average value for properties in the Old Harbour Bay community using costs and square footages of online property listings from several realtor sites and applied to all buildings digitized from UAV imagery. There is no regulated system for house prices in Jamaica and market value varies according to rural, urban and peri-urban as well as historical and cultural values. Additionally with an expansion in the housing market, low interest rates, and an influx of foreign investors, the housing market is now experiencing a boom in new construction especially apartments and townhouses. This has led to a shift in market prices. To obtain the average property cost for the community of OHB, approximately ten sites were systematically scanned looking at offers for sale, comparable for similar properties and characteristics of the property. Information was collected for fifteen units and costs averaged. These results are not meant to predict SLR/storm surge risk exactly, rather comparatively. For specific coastal risk assessments in the area, we have used complex hydrodynamic and coastal inundation models, coupled with depth damage curves [29].
Though higher resolution or vertically corrected datasets are generally preferable, the use of these DEMs may not be feasible for national-scale assessments due to cost constraints. For complex hydrodynamic inundation modeling, there is also a tradeoff between DEM resolution and processing times. The results here demonstrate that higher resolution and vertically corrected DEMs also tend to give higher SLR/storm surge damage estimates. For example, the NASADEM and the CoastalDEM are both 30 m resolution, however, the CoastalDEM represents improved vertical accuracy resulting in damage estimates greater by 1596 people and $15.7 million USD. The UAV-derived DEM has the highest spatial resolution at 3.8 cm and estimates the greatest damages at 9619 people and $172.5 million USD, a difference of 6723 people and $132.5 million when comparing the results of the coarsest resolution DEM (MERIT, 90 m).

3.2. Complex Hydrodynamic Modeling

A complex storm surge model and subsequent damage assessment were developed by Beck et al. [29] for the entire country of Jamaica using the input datasets outlined in Table 4 as part of a project for the World Bank and Government of Jamaica. This assessment included multiple storm scenarios and estimated avoided damages to people and infrastructure attributed to the coastal protection benefits provided by mangroves. This storm surge risk assessment combined a variety of high-resolution national databases with complex hydrodynamic models such as XBeach [62].
Storm surge flooding was assessed for 1 in 5-, 25-, 50-, 100-, and 500-year storm events with and without mangroves. Modeled output shows flood height values in meters based on a 375 m × 375 m pixel. Flood heights were binned into four groups: less than 0.5 m flood height, 0.5–1 m flood height, 1–2 m flood height, and greater than 2 m flood height. Population and infrastructure damages were calculated based on damage functions developed by the European Commission’s Joint Research Centre (EU JRC). These functions assume that any level of flooding to a building constitutes 100% damage to the population in that household. They estimate damages 60%, 85%, and 100% damages to infrastructure based on 0.5 m, 1 m, and 2 m flooding thresholds, respectively.
Nationally, the avoided damages were calculated at the enumeration district level, resulting in the coastal inundation protection benefits of mangroves per district. These estimates are based on global, gridded models: the 2015 JRC-EU Global Human Settlement Layer (250 m) for population and the GAR17 (UNISDR)—Total, Residential, Industrial Stock for property values. The GAR17 was downscaled from 1km resolution to 250 m resolution using resampling methods. These modeled socioeconomic datasets were utilized because there are no national datasets available for building footprints. The resulting avoided damages in the community of Old Harbour Bay were found by aggregating the results within its 14 enumeration districts (see Table 5). Although higher-resolution elevation, habitat data, and shoreline data derived from UAV imagery were available for Old Harbour Bay, there was no technical or budgetary capacity to run a multivariable storm surge analysis at this scale. This complex, multivariable analysis reveals a much greater level of detail and more realistic storm surge estimates than the bathtub models described in Section 3.1 [29].

4. Discussion

The impacts of climate change compounded by poor planning in urban areas have led to increased vulnerability in coastal communities. Modeling the impacts of storm surge and SLR is crucial for understanding and developing policies for risk reduction and targeted coastal management [63]. Local governments need to be able to visualize potential flooding zones in order to implement actions for better disaster management and urban planning. In addition, public awareness of high-risk flood areas is essential to better prepare for these hazards and strategically implement risk reduction actions via improved infrastructure and nature-based solutions. We suggest a thorough examination of available datasets prior to executing a flood model and urge data users to understand data limitations—matching the appropriate data to the scale of the project, within budget constraints.
Our case study presents two types of models, a simple bathtub model and a complex, hydrodynamic inundation model, that can be applied at different scales using various datasets, to assess coastal inundation risk. As expected, the results of coastal risk assessments vary greatly depending on the quality and assumptions of the underlying data. We find significant disparities, for example, in the quality of the SLR/storm surge maps when using different DEMs, with lower resolution DEMs underestimating flood risk at the local level. The vertical accuracy of elevation datasets also varies greatly and impacts coastal risk estimates in areas with coastal vegetation, such as mangroves. In our study site of Old Harbour Bay, we found that the use of a vertically corrected DEM (Climate Central CoastalDEM) estimated risk to 1596 more people and US$15.7 million more in infrastructure than an equal resolution (30 m) DEM that was not vertically corrected (NASADEM). We find that the highest-resolution (3 cm) UAV-derived DEM estimates the risk to 3565 more people and US$71.3 million more in infrastructure than the 30 m Climate Central Coastal DEM. These results suggest that DEM spatial resolution and vertical accuracy heavily affect coastal risk estimates. Flood model resolution impacts on coastal risk estimates are less clear from our results. As compared to coarse bathtub models, complex hydrodynamic models offer the ability to more specifically model risk under varying storm scenarios and to quantify the benefits of flood reduction benefits of mangroves under those scenarios. Coarse bathtub models cannot present this level of clarity on the benefits of nature-based solutions for coastal risk reduction benefits. However, Menéndez et al. [19] identified that improvements in flood methods had the least improvement in all risk assessments, indicating that coarse bathtub models give a fine approximation of risk.
Advanced elevation modeling technologies, such as LiDAR, are typically more accessible in developed countries that have greater resources and budgetary capacities. Consequently, these data are generally less expensive to collect per unit area and produce elevation products that are more accurate and better suited for inundation modeling [47]. For example, the U.S. Geological Service has plans to complete the acquisition of LiDAR-derived elevation products throughout the US by 2023 and make these DEM products publicly available [64]. However, due to smaller land masses and economic constraints in SIDS [65], high-resolution elevation data are often scarce and prohibitively expensive to collect. This implies weighing available dataset costs against risk assessment benefits to match an input dataset or modeling technique to a management question is not always simple. We found that less costly and lower resolution data and models provide up to three times lower coastal risk estimates than more expensive data and models, indicating that investments in better resolution DEM data are needed for targeted local-level decisions. However, we also identify that, while high-resolution datasets are well-suited to support the development of plans and policies to address localized risks, there is value in using the lower resolution, national-level estimates at the community level, when no other datasets are available. These lower-resolution datasets can provide a ballpark estimate for decision-making, reserving climate adaptation budgets for intervention actions on the ground.
Models can provide insight into where climate adaptation actions would be most effective, however, limited adaptation budgets must be conserved for implementation response. We concur with the suggestions of Menendez et al. [19] that for local, high-resolution flood estimates, we must consider how to combine data and methods to produce the best possible result while minimizing expenses, rather than assuming the use of the highest resolution methods is best. Preston et al. [66] identified that investments in adaptation science in the past have not necessarily translated into adaptation implementation, due to a variety of mental models, or heuristics, used in climate adaptation research. This includes the ‘predict and respond’ heuristic, in which a strong emphasis is placed on developing insights into future climate and socioeconomic trends, including projections of future societal and/or ecological vulnerability. Preston et al. [66] state that while 61% of relevant papers endorse this ‘evidence-based’ approach to decision-making and planning, it’s critical for decision-makers to note that uncertainty cannot be eliminated from these models, and the assumption that more accurate/precise information is needed to adapt to climate change may not always be valid [67,68]. Preston et al. [66] suggest that climate adaptation research should pivot from the ‘predict and respond’ heuristic to ‘predict and learn’, in which modeled vulnerability estimates are not used for their literal, direct application in decision-making but instead to identify sensitivities and thresholds [69,70], facilitate discussion [71,72], and contribute to a portfolio of evidence that may inform possible adaptation responses [66].
In instances where lower resolution DEMs are utilized, policymakers and planners should take note that the derived damage is often underestimated. We find that there can be more than a 3-fold difference in the people and property flooded based on the source DEM that is used. Our DEM analysis serves as a proxy, highlighting the importance of the appropriate selection of input environmental datasets on the SLR and storm surge model results. Differences in coastal risk estimates can also have substantial effects on funding availability for hazard mitigation, disaster recovery, and climate adaptation. This can affect the assumed cost-effectiveness of strategies—including nature-based strategies such as coral reef or mangrove restoration for coastal flood mitigation and climate adaptation. Furthermore, because of data limitations in developing countries with limited resources that impair data and analyses at granular levels, planning and implementation of adaptation to address coastal changes and the impacts of SLR are often hindered.
As suggested by Preston et al. [66], the coastal risk estimates discussed in this paper were integrated into a portfolio of evidence used to develop a suite of climate adaptation solutions to mitigate storm surge and SLR risks. Our portfolio for OHB included satellite-derived land cover and benthic habitat maps, an analysis of high-risk areas for sedimentation within the greater watershed, a rapid ecological assessment, and expert advice from climate adaptation scientists. Though the feasibility of these solutions is still under review by the community, these proposed solutions aim to comprehensively address ecological threats to coastal habitats and socioeconomic vulnerability to coastal inundation in the community using NBS, improved management, and livelihood strategies. NBS includes ecosystem-based adaptation strategies such as coral nurseries, a living breakwater, and mangrove and seagrass replanting to increase flood protection benefits of these habitats. Improved management solutions aim to mitigate risks to these coastal and marine habitats and include the installation of moorings, invasive species management, long-term monitoring, seasonal closures, special protection zones, and policies requiring tertiary treatment for all new coastal developments. Livelihood strategies aim to address community resilience and awareness and include establishing community-based ecotourism, after-school sustainability programs, community resilience building workshops, a recycling program, and the development of emergency action plans.
Suggested future research could include comparing the population and infrastructure impacts derived from national models with those of community models to identify a potential rate of difference to estimate a rule of thumb for interpretation of national models. For example, we identified a roughly 3-fold difference in people and property flooded with a simple bathtub model utilizing global versus local elevation datasets. A more rigorous comparison using complex inundation modeling with multivariable environmental inputs, as well as several community sites, could potentially identify a more reliable difference factor.

Author Contributions

All authors conceived of the research. Conceptualization, M.A.-M.; methodology, V.P.M. and S.R.S.; validation, M.A.-M., N.L., V.P.M. and S.R.S.; resources, N.L., V.P.M., S.R.S. and M.W.B.; visualization, M.A.-M., V.P.M. and S.R.S.; writing—original draft preparation, M.A.-M.; writing—review and editing, M.A.-M., N.L., V.P.M., S.R.S. and M.W.B.; project administration, M.A.-M. All authors have read and agreed to the published version of the manuscript.

Funding

This research was funded by the International Climate Initiative (IKI). The Federal Ministry for the Environment, Nature Conservation and Nuclear Safety (BMU) supports this initiative on the basis of a decision adopted by the German Bundestag.

Institutional Review Board Statement

Not applicable.

Informed Consent Statement

Not applicable.

Data Availability Statement

The freely available dataset used in this study are available from the following entities: NASADEM Merged DEM Global (NASADEM_HGT)—https://lpdaac.usgs.gov/products/nasadem_hgtv001/; NASA SRTM v3—https://www.usgs.gov/centers/eros/science/usgs-eros-archive-digital-elevation-shuttle-radar-topography-mission-srtm-1-arc?qt-science_center_objects=0#qt-science_center_objects; Multi-Error-Removed Improved-Terrain (MERIT) DEM—http://hydro.iis.u-tokyo.ac.jp/~yamadai/MERIT_DEM/; AW3D30—https://www.eorc.jaxa.jp/ALOS/en/aw3d30/index.htm; AW3D Standard—https://www.aw3d.jp/en/products/standard/; AW3D Enhanced—https://www.aw3d.jp/en/products/enhanced/; Climate Central Coastal DEM—https://sealevel.climatecentral.org/research/papers/coastaldem-a-global-coastal-digital-elevation-model-improved-from-srtm-usin/; https://go.climatecentral.org/coastaldem/; WorldDEM—https://worlddem-database.terrasar.com/; ASTER GDEM v3—https://lpdaac.usgs.gov/products/astgtmv003/; NOAA’s ETOPO1 Global Relief Model—https://www.ngdc.noaa.gov/mgg/global/; General Bathymetric Chart of the Oceans (GEBCO)—https://www.gebco.net/data_and_products/gridded_bathymetry_data/; The Landsat satellite images—https://landsat.visibleearth.nasa.gov/; Sentinel 2 satellite images—https://sentinel.esa.int/web/sentinel/missions/sentinel-2; Global Mangrove Watch—https://www.globalmangrovewatch.org/; 4m-resolution, Dove-derived shoreline—https://caribbeanscienceatlas.tnc.org/; hand-digitized mangrove data for the insular Caribbean—https://storymaps.arcgis.com/collections/58321fb0f35f4659a1f508630d45c76c; benthic habitat data at 4m resolution, derived from Planetscope smallsat satellite 2017–2018 scenes—https://storymaps.arcgis.com/collections/58321fb0f35f4659a1f508630d45c76c; LandScan—https://landscan.ornl.gov/; Global Human Settlement—https://ghsl.jrc.ec.europa.eu/; World Pop—https://www.worldpop.org/. Restrictions apply to the other datasets used such as the Jamaica census data. This data was obtained from The Statistical Institute of Jamaica (STATIN). STATIN provides a repository for certain Jamaica national datasets. This Institute is able to respond to data requests for research purposes when the contact form is completed at: https://statinja.gov.jm/.

Acknowledgments

We would like to thank Giselle Hall for language editing and proof reading of this paper.

Conflicts of Interest

The authors declare no conflict of interest. The funders had no role in the design of the study; in the collection, analyses, or interpretation of data; in the writing of the manuscript, or in the decision to publish the results.

References

  1. Mimura, N.; Nurse, L.; McLean, R.F.; Agard, J.; Briguglio, L.; Lefale, P.; Payet, R.; Sem, G. Small Islands. In Climate Change 2007: Impacts, Adaptation and Vulnerability. Contribution of Working Group II to the Fourth Assessment Report of the Intergovernmental Panel on Climate Change; Parry, M.L., Canziani, O.F., Palutikof, J.P., van der Linden, P.J., Hanson, C.E., Eds.; Cambridge University Press: Cambridge, UK, 2007; pp. 687–716. [Google Scholar]
  2. Mycoo, M.A. Beyond 1.5 °C: Vulnerabilities and Adaptation Strategies for Caribbean Small Island Developing States. Reg. Environ. Chang. 2018, 18, 2341–2353. [Google Scholar] [CrossRef] [Green Version]
  3. Climate Studies Group, Mona (CSGM). State of the Jamaican Climate 2015: Information for Resilience Building (Full Report); Planning Institute of Jamaica (PIOJ): Kingston, Jamaica, 2017; p. 208. [Google Scholar]
  4. Stennett-Brown, R.K.; Stephenson, T.S.; Taylor, M.A. Caribbean Climate Change Vulnerability: Lessons from an Aggregate Index Approach. PLoS ONE 2019, 14, 1–19. [Google Scholar] [CrossRef] [Green Version]
  5. Eckstein, D.; Hutfils, M.-L.; Winges, M. Global Climate Risk Index 2019 Who Suffers Most from Extreme Weather Events? Weather-Related Loss Events in 2017 and 1998 to 2017; Germanwatch e.V: Bonn, Germany, 2018; ISBN 978-3-943704-70-9. [Google Scholar]
  6. Eckstein, D.; Winges, M.; Künzel, V.; Schäfer, L. Global Climate Risk Index 2020 Who Suffers Most from Extreme Weather Events? Wether-Related Loss Events in 2018 and 1999 to 2018; Germanwatch e.V: Bonn, Germany, 2019; ISBN 978-3-943704-77-8. [Google Scholar]
  7. Deopersad, C.; Persaud, C.; Chakalall, Y.; Bello, O.; Masson, M.; Perroni, A.; Carrera-Marquis, D.; Fontes de Meira, L.; Gonzales, C.; Peralta, L.; et al. Assessment of the Effects and Impacts of Hurricane Dorian in the Bahamas; Inter-American Development Bank; United Nations: Washington, DC, USA, 2020; p. 219. [Google Scholar]
  8. Jury, M.R. Puerto Rico Sea Level Trend in Regional Context. Ocean Coast. Manag. 2018, 163, 478–484. [Google Scholar] [CrossRef]
  9. International Federation of Red Cross and Red Crescent Societies. IFRC Framework for Community Resilience; International Federation of Red Cross and Red Crescent Societies: Geneva, Switzerland, 2014; p. 24. [Google Scholar]
  10. Kafle, S.K. Measuring Disaster-Resilient Communities: A Case Study of Coastal Communities in Indonesia. J. Bus Contin. Emer. Plan 2012, 5, 316–326. [Google Scholar]
  11. Gowan, M.E.; Kirk, R.C.; Sloan, J.A. Building Resiliency: A Cross-Sectional Study Examining Relationships among Health-Related Quality of Life, Well-Being, and Disaster Preparedness. Health Qual. Life Outcomes 2014, 12, 85. [Google Scholar] [CrossRef] [Green Version]
  12. Matteo, G.; Nardi, P.; Grego, S.; Guidi, C. Bibliometric Analysis of Climate Change Vulnerability Assessment Research. Environ. Syst. Decis. 2018, 38, 508–516. [Google Scholar] [CrossRef]
  13. Weis, S.W.M.; Agostini, V.N.; Roth, L.M.; Gilmer, B.; Schill, S.R.; Knowles, J.E.; Blyther, R. Assessing Vulnerability: An Integrated Approach for Mapping Adaptive Capacity, Sensitivity, and Exposure. Clim. Chang. 2016, 136, 615–629. [Google Scholar] [CrossRef] [Green Version]
  14. Beck, M.W.; Losada, I.J.; Menéndez, P.; Reguero, B.G.; Díaz-Simal, P.; Fernández, F. The Global Flood Protection Savings Provided by Coral Reefs. Nat. Commun. 2018, 9, 2186. [Google Scholar] [CrossRef] [PubMed] [Green Version]
  15. Ferrario, F.; Beck, M.W.; Storlazzi, C.D.; Micheli, F.; Shepard, C.C.; Airoldi, L. The Effectiveness of Coral Reefs for Coastal Hazard Risk Reduction and Adaptation. Nat. Commun. 2014, 5, 3794. [Google Scholar] [CrossRef] [PubMed]
  16. Reguero, B.G.; Beck, M.W.; Agostini, V.N.; Kramer, P.; Hancock, B. Coral Reefs for Coastal Protection: A New Methodological Approach and Engineering Case Study in Grenada. J. Environ. Manag. 2018, 210, 146–161. [Google Scholar] [CrossRef]
  17. Menéndez, P.; Losada, I.J.; Torres-Ortega, S.; Narayan, S.; Beck, M.W. The Global Flood Protection Benefits of Mangroves. Sci. Rep. 2020, 10, 4404. [Google Scholar] [CrossRef] [PubMed]
  18. Chausson, A.; Turner, B.; Seddon, D.; Chabaneix, N.; Girardin, C.A.J.; Kapos, V.; Key, I.; Roe, D.; Smith, A.; Woroniecki, S.; et al. Mapping the Effectiveness of Nature-Based Solutions for Climate Change Adaptation. Glob. Chang. Biol. 2020, 26, 6134–6155. [Google Scholar] [CrossRef] [PubMed]
  19. Menéndez, P.; Losada, I.J.; Torres-Ortega, S.; Toimil, A.; Beck, M.W. Assessing the Effects of Using High-Quality Data and High-Resolution Models in Valuing Flood Protection Services of Mangroves. PLoS ONE 2019, 14, e0220941. [Google Scholar] [CrossRef] [PubMed]
  20. Spalding, M.D.; McIvor, A.L.; Beck, M.W.; Koch, E.W.; Möller, I.; Reed, D.J.; Rubinoff, P.; Spencer, T.; Tolhurst, T.J.; Wamsley, T.V.; et al. Coastal Ecosystems: A Critical Element of Risk Reduction. Conserv. Lett. 2014, 7, 293–301. [Google Scholar] [CrossRef]
  21. Kulp, S.A.; Strauss, B.H. New Elevation Data Triple Estimates of Global Vulnerability to Sea-Level Rise and Coastal Flooding. Nat. Commun. 2019, 10, 4844. [Google Scholar] [CrossRef] [Green Version]
  22. Yamazaki, D.; Ikeshima, D.; Neal, J.C.; O’Loughlin, F.; Sampson, C.C.; Kanae, S.; Bates, P.D. MERIT DEM: A New High-Accuracy Global Digital Elevation Model and Its Merit to Global Hydrodynamic Modeling.; 2017; Volume 2017. Available online: https://ui.adsabs.harvard.edu/abs/2017AGUFM.H12C..04Y/abstract (accessed on 13 February 2021).
  23. Yamazaki, D.; Ikeshima, D.; Sosa, J.; Bates, P.D.; Allen, G.H.; Pavelsky, T.M. MERIT Hydro: A High-Resolution Global Hydrography Map Based on Latest Topography Dataset. Water Resour. Res. 2019, 55, 5053–5073. [Google Scholar] [CrossRef] [Green Version]
  24. Kulp, S.A.; Strauss, B.H. CoastalDEM: A Global Coastal Digital Elevation Model Improved from SRTM Using a Neural Network. Remote Sens. Environ. 2018, 206, 231–239. [Google Scholar] [CrossRef]
  25. Crippen, R.; Buckley, S.; Agram, P.; Belz, E.; Gurrola, E.; Hensley, S.; Kobrick, M.; Lavalle, M.; Martin, J.; Neumann, M.; et al. NASADEM Global Elevation Model: Methods and Progress. Isprs Int. Arch. Photogramm. Remote Sens. Spat. Inf. Sci. 2016, XLI-B4, 125–128. [Google Scholar] [CrossRef]
  26. Nikolakopoulos, K.G. Accuracy Assessment of ALOS AW3D30 DSM and Comparison to ALOS PRISM DSM Created with Classical Photogrammetric Techniques. Eur. J. Remote Sens. 2020, 53, 39–52. [Google Scholar] [CrossRef]
  27. Moudrý, V.; Lecours, V.; Gdulová, K.; Gábor, L.; Moudrá, L.; Kropáček, J.; Wild, J. On the Use of Global DEMs in Ecological Modelling and the Accuracy of New Bare-Earth DEMs. Ecol. Model. 2018, 383, 3–9. [Google Scholar] [CrossRef]
  28. Game, E.T.; Kareiva, P.; Possingham, H.P. Six Common Mistakes in Conservation Priority Setting. Conserv. Biol. 2013, 27, 480–485. [Google Scholar] [CrossRef] [Green Version]
  29. Beck, M.W.; Narayan, S.; Losada, I.J.; Espejo, A.; Torres-Ortega, S. The Flood Protection Benefits and Restoration Costs for Mangroves in Jamaica. In Forces of Nature: Assessment and Economic Valuation of Coastal Protection Services Provided by Mangroves in Jamaica; Castaño-Isaza, J., Lee, S., Dani, S., Eds.; World Bank: Washington, DC, USA, 2019; p. 64. [Google Scholar]
  30. Burgess, C.; Johnson, C. Shoreline Change in Jamaica: Observations for the Period 1968 to 2010 and Projections to 2060. Available online: https://ceacsolutions.com/shoreline-change-in-jamaica/ (accessed on 1 February 2021).
  31. Burgess, C.P.; Taylor, M.A.; Stephenson, T.; Mandal, A.; Powell, L. A Macro-Scale Flood Risk Model for Jamaica with Impact of Climate Variability. Nat. Hazards 2015, 78, 231–256. [Google Scholar] [CrossRef]
  32. Fontes de Meira, L.; Phillips, W. An Economic Analysis of Flooding in the Caribbean: The Case of Jamaica and Trinidad and Tobago; ECLAC: Santiago, Chile, 2019. [Google Scholar]
  33. Spencer, N.; Strobl, E. Poverty and Hurricane Risk Exposure in Jamaica. Available online: https://www.stjohns.edu/sites/default/files/uploads/Poverty%20and%20Hurricane%20Risk%20Exposure%20in%20Jamaica.pdf (accessed on 11 January 2021).
  34. Global Facility for Disaster Reduction and; Recovery (GFDRR). Damage, Loss and Needs Assessment Guidance Notes; World Bank: Washington, DC, USA, 2010; p. 86. [Google Scholar]
  35. Office of Disaster Preparedness and Emergency Management (ODPEM). Community Disaster Risk Management Plan for Old Harbour Bay Community; The Canadian International Development Agency: Kingston, Jamaica, 2012; p. 134. [Google Scholar]
  36. Climate Studies Group, Mona (CSGM). Climate Change Risk Assessment Report: Portland Bight Protected Area; University of West Indies: Kingston, Jamaica, 2013; p. 110. [Google Scholar]
  37. Storlazzi, C.D.; Elias, E.; Field, M.E.; Presto, M.K. Numerical Modeling of the Impact of Sea-Level Rise on Fringing Coral Reef Hydrodynamics and Sediment Transport. Coral Reefs 2011, 30, 83–96. [Google Scholar] [CrossRef] [Green Version]
  38. King, N. Jamaica Fisheries Sector Gets World Bank Aid - Caribbean Life News. Available online: https://www.caribbeanlifenews.com/jamaica-fisheries-sector-gets-world-bank-aid/ (accessed on 12 February 2021).
  39. Williams, L.L.; Lück-Vogel, M. Comparative Assessment of the GIS Based Bathtub Model and an Enhanced Bathtub Model for Coastal Inundation. J. Coast. Conserv. 2020, 24, 23. [Google Scholar] [CrossRef]
  40. Didier, D.; Baudry, J.; Bernatchez, P.; Dumont, D.; Sadegh, M.; Bismuth, E.; Bandet, M.; Dugas, S.; Sévigny, C. Multihazard Simulation for Coastal Flood Mapping: Bathtub versus Numerical Modelling in an Open Estuary, Eastern Canada. J. Flood Risk Manag. 2018. [Google Scholar] [CrossRef]
  41. Lichter, M.; Vafeidis, A.; Nicholls, R.; Kaiser, G. Exploring Data-Related Uncertainties in Analyses of Land Area and Population in the “Low-Elevation Coastal Zone” (LECZ). J. Coast. Res. 2011, 757–768. [Google Scholar] [CrossRef]
  42. Bove, G.; Becker, A.; Sweeney, B.; Vousdoukas, M.; Kulp, S. A Method for Regional Estimation of Climate Change Exposure of Coastal Infrastructure: Case of USVI and the Influence of Digital Elevation Models on Assessments. Sci. Total Environ. 2020, 710, 136162. [Google Scholar] [CrossRef]
  43. Eakins, B.W.; Grothe, P.R. Challenges in Building Coastal Digital Elevation Models. J. Coast. Res. 2014, 30, 942–953. [Google Scholar] [CrossRef]
  44. Van de Sande, B.; Lansen, J.; Hoyng, C. Sensitivity of Coastal Flood Risk Assessments to Digital Elevation Models. Water 2012, 4, 568–579. [Google Scholar] [CrossRef]
  45. Small, C.; Sohn, R. Correlation Scales of Digital Elevation Models in Developed Coastal Environments. Remote Sens. Environ. 2015, 159, 80–85. [Google Scholar] [CrossRef] [Green Version]
  46. Leon, J.X.; Heuvelink, G.B.M.; Phinn, S.R. Incorporating DEM Uncertainty in Coastal Inundation Mapping. PLoS ONE 2014, 9, 1–12. [Google Scholar] [CrossRef]
  47. Renslow, M.; Greenfield, P.; Guay, T. Evaluation of Multi-Return LIDAR for Forestry Applications; US Department of Agriculture Forest Service–Engineering. 2000, p. 19. Available online: https://www.fs.fed.us/eng/techdev/IM/rsac_reports/lidar_report.pdf (accessed on 13 February 2021).
  48. Weatherall, P.; Marks, K.M.; Jakobsson, M.; Schmitt, T.; Tani, S.; Arndt, J.E.; Rovere, M.; Chayes, D.; Ferrini, V.; Wigley, R. A New Digital Bathymetric Model of the World’s Oceans. Earth Space Sci. 2015, 2, 331–345. [Google Scholar] [CrossRef]
  49. Li, J.; Knapp, D.E.; Schill, S.R.; Roelfsema, C.; Phinn, S.; Silman, M.; Mascaro, J.; Asner, G.P. Adaptive Bathymetry Estimation for Shallow Coastal Waters Using Planet Dove Satellites. Remote Sens. Environ. 2019, 232, 111302. [Google Scholar] [CrossRef]
  50. Pepe, M.; Parente, C. Bathymetry from Worldview-3 Satellite Using Radiometric Band Ratio. Acta Polytech. 2018, 58. [Google Scholar] [CrossRef] [Green Version]
  51. Sayre, R.; Noble, S.; Hamann, S.; Smith, R.; Wright, D.; Breyer, S.; Butler, K.; Van Graafeiland, K.; Frye, C.; Karagulle, D.; et al. A New 30 Meter Resolution Global Shoreline Vector and Associated Global Islands Database for the Development of Standardized Ecological Coastal Units. Null 2019, 12, S47–S56. [Google Scholar] [CrossRef] [Green Version]
  52. Wessel, P.; Smith, W. A Global, Self-Consistent, Hierarchical, High-Resolution Shoreline Database. J. Geophys. Res. 1996, 101, 8741–8743. [Google Scholar] [CrossRef] [Green Version]
  53. Carlotto, M.; Nebrich, M.; DeMichele, D. Enhancing Vector Shoreline Data Using a Data Fusion Approach. In Proceedings of the Signal Processing, Sensor/Information Fusion, and Target Recognition XXVI, Anaheim, CA, USA, 2 May 2017; Volume 10200, p. 1020010. [Google Scholar]
  54. Dai, C.; Howat, I.M.; Larour, E.; Husby, E. Coastline Extraction from Repeat High Resolution Satellite Imagery. Remote Sens. Environ. 2019, 229, 260–270. [Google Scholar] [CrossRef]
  55. UNEP-WCMC; WorldFish Centre; WRI. TNC Global Distribution of Warm-Water Coral Reefs, Compiled from Multiple Sources Including the Millennium Coral Reef Mapping Project. Version 4.0. Includes Contributions from IMaRS-USF and IRD (2005), IMaRS-USF (2005) and Spalding et al. 2001. Available online: http://data.unep-wcmc.org/datasets/1 (accessed on 1 February 2021).
  56. Bunting, P.; Rosenqvist, A.; Lucas, R.M.; Rebelo, L.-M.; Hilarides, L.; Thomas, N.; Hardy, A.; Itoh, T.; Shimada, M.; Finlayson, C.M. The Global Mangrove Watch—A New 2010 Global Baseline of Mangrove Extent. Remote Sens. 2018, 10, 1669. [Google Scholar] [CrossRef] [Green Version]
  57. Li, J.; Knapp, D.E.; Fabina, N.S.; Kennedy, E.V.; Larsen, K.; Lyons, M.B.; Murray, N.J.; Phinn, S.R.; Roelfsema, C.M.; Asner, G.P. A Global Coral Reef Probability Map Generated Using Convolutional Neural Networks. Coral Reefs 2020, 39, 1805–1815. [Google Scholar] [CrossRef]
  58. Bright, E.A.; Rose, A.N.; Urban, M.L.; McKee, J. LandScan 2017 High-Resolution Global Population Data Set; Oak Ridge National Laboratory: Oak Ridge, TN, UAS, 2018. [Google Scholar]
  59. Pesaresi, M.; Huadong, G.; Blaes, X.; Ehrlich, D.; Ferri, S.; Gueguen, L.; Halkia, M.; Kauffmann, M.; Kemper, T.; Lu, L.; et al. A Global Human Settlement Layer from Optical HR/VHR RS Data: Concept and First Results. Ieee J. Sel. Top. Appl. Earth Obs. Remote Sens. 2013, 6, 2102–2131. [Google Scholar] [CrossRef]
  60. Tatem, A.J. WorldPop, Open Data for Spatial Demography. Sci. Data 2017, 4, 170004. [Google Scholar] [CrossRef]
  61. Statistical Institute of Jamaica. Jamaica Population Census 2011. Statistical Institute of Jamaica (STATIN): Kingston, Jamaica, 2011; p. 170. [Google Scholar]
  62. Roelvink, D.; Reniers, A.; van Dongeren, A.; de Vries, J.v.T.; McCall, R.; Lescinski, J. Modelling Storm Impacts on Beaches, Dunes and Barrier Islands. Coast. Eng. 2009, 56, 1133–1152. [Google Scholar] [CrossRef]
  63. Nkwunonwo, U.C.; Whitworth, M.; Baily, B. A Review of the Current Status of Flood Modelling for Urban Flood Risk Management in the Developing Countries. Sci. Afr. 2020, 7, e00269. [Google Scholar] [CrossRef]
  64. US Geological Survey 3D Elevation Program (3DEP). Available online: https://www.usgs.gov/core-science-systems/ngp/3dep/what-is-3dep?qt-science_support_page_related_con=0#qt-science_support_page_related_con. (accessed on 8 January 2021).
  65. Kabite, G. LiDAR DEM Data for Flood Mapping and Assessment; Opportunities and Challenges: A Review. J. Remote Sens. Gis 2017, 6. [Google Scholar] [CrossRef]
  66. Preston, B.L.; Mustelin, J.; Maloney, M.C. Climate Adaptation Heuristics and the Science/Policy Divide. Mitig. Adapt. Strateg. Glob. Chang. 2015, 20, 467–497. [Google Scholar] [CrossRef]
  67. Adger, W.N.; Dessai, S.; Goulden, M.; Hulme, M.; Lorenzoni, I.; Nelson, D.R.; Naess, L.O.; Wolf, J.; Wreford, A. Are There Social Limits to Adaptation to Climate Change? Clim. Chang. 2009, 93, 335–354. [Google Scholar] [CrossRef]
  68. Dessai, S.; Hulme, M.; Lempert, R.; Pielke, R. Climate prediction: A limit to adaptation? In Adapting to Climate Change: Thresholds, Values, Governance; Lorenzoni, I., O’Brien, K.L., Adger, W.N., Eds.; Cambridge University Press: Cambridge, UK, 2009; pp. 64–78. ISBN 978-0-521-76485-8. [Google Scholar]
  69. Jones, R.N. An Environmental Risk Assessment/Management Framework for Climate Change Impact Assessments. Nat. Hazards 2001, 23, 197–230. [Google Scholar] [CrossRef]
  70. Dessai, S.; Adger, W.N.; Hulme, M.; Turnpenny, J.; Köhler, J.; Warren, R. Defining and Experiencing Dangerous Climate Change. Clim. Chang. 2004, 64, 11–25. [Google Scholar] [CrossRef]
  71. Yuen, E.; Jovicich, S.S.; Preston, B.L. Climate Change Vulnerability Assessments as Catalysts for Social Learning: Four Case Studies in South-Eastern Australia. Mitig. Adapt. Strateg. Glob. Chang. 2013, 18, 567–590. [Google Scholar] [CrossRef]
  72. Preston, B.L.; Brooke, C.; Measham, T.G.; Smith, T.F.; Gorddard, R. Igniting Change in Local Government: Lessons Learned from a Bushfire Vulnerability Assessment. Mitig. Adapt. Strateg. Glob. Chang. 2009, 14, 251–283. [Google Scholar] [CrossRef]
Figure 1. Reference map showing the location of the community of Old Harbour Bay, Jamaica within the Portland Bight Protected Area.
Water 13 00875 g001
Figure 2. Watershed boundaries modeled using RiverTools v4 and NASADEM elevation (30 m) that indicate drainage patterns into the Old Harbour Bay community and surrounding bay. An 11-class marine benthic habitat classification was derived from WorldView-3 satellite imagery (1.25 m, acquired on 23 October 2018) and GPS-referenced underwater field data.
Water 13 00875 g002
Figure 3. Orthophoto mosaic of Old Harbour Bay derived from 7352 Unmanned Aerial Vehicle (UAV) photos collected in November 2019 at a spatial resolution of 3.8 cm.
Water 13 00875 g003
Figure 4. Comparison of 30 m global elevation products of Bajo Yuna National Park in the Dominican Republic which has a dense band of tall mangroves along the edge of Samaná Bay. Each product shows the relative impact that dense vegetation can have on the resulting surface elevation and the attempts to remove the vegetation to arrive at a ‘bare earth’ product. (a) satellite image showing the Bajo Yuna National Park and mangrove area; (b) SRTM v3; (c) NASADEM; (d) GDEM v3; (e) AW3D30; and (f) CoastalDEM. The highest mangrove canopy with the least amount of vegetation removed is in the photogrammetry-based GDEM from ASTER stereo imagery and the AW3D radar-derived products. The CoastalDEM shows the vegetations largely removed to arrive at a more suitable ‘bare earth’ product for SLR and storm surge modeling.
Water 13 00875 g004
Figure 5. Comparison of elevation products of Old Harbour Bay, Jamaica. (a) Satellite image showing Old Harbour Bay; (b) MERIT DEM; (c) SRTM; (d) NASADEM; (e) CoastalDEM; and (f) Government of Jamaica digital surface model (DSM).
Water 13 00875 g005
Figure 6. UAV-derived orthophoto mosaic of Old Harbour Bay, Jamaica at 3.8 cm resolution (top). Corresponding building footprints and roads digitized from the orthophoto mosaic for use in the socioeconomic and flood analysis (bottom).
Water 13 00875 g006
Table 1. Available Digital Elevation Models (DEM) for Jamaica.
Source of DEMElevation DatasetSpatial
Resolution (m)
Vertical
Accuracy (m) *
ProductCost
Space-based RadarMERIT DEM9012DSMFree
SRTM DEM v3309–17DSMFree
NASADEM30N/ADSMFree
AW3D30303–12 mDSMFree
CoastalDEM30<2DTMContact Climate Central
WorldDEM121–4, depending on productDSM/DTM$12 per km2
AW3D Standard 2.5, 55–7DSM/DTM$3–17 per km2 (min area 400 km2)
Space-based PhotogrammetryASTER GDEM v3308–17DSMFree
AW3D Enhanced0.5, 1, 21–2DSM$95–190 per km2 (min area 25 km2)
Custom satellite-derived DEMs (e.g., Maxar, AirBus)0.5, 1,2.5, 4, 82–10, depending on productDSM/DTM$50–190 per km2 (min area 100 km2)
Jamaica National DSM (IKONOS stereo-pair)6unclear DSMN/A
Airborne UAV
Photogrammetry
UAV-derived elevation model0.03 m<1 m when calibratedDSMDepends on UAV sensor and software used
* varies depending on the land cover type, budget, and resources used including the amount and quality of vertical ground control and how extensive post-processing methods were applied (e.g., filtering, precision break lines, manual editing).
Table 2. Available Population Datasets for Jamaica.
DatasetTemporal ResolutionSpatial Resolution (m)Cost
LandScan20181000Free for U.S. Federal Government agencies and for those within the educational community for non-commercial use
Global Human Settlement2014250Free
World Pop2020100Free
Satellite or UAV-derived population estimates20190.03Variable
Table 3. Calculated damages to people and infrastructure under 3 m-digital surface model (SLR) using various DEM datasets.
Elevation Dataset People FloodedInfrastructure Flooded (USD)Old Harbour Bay UAV Imagery Flooded to 3 m SLR/Storm Surge (Bathtub Model)
Multi-Error-Removed Improved-Terrain (MERIT) (90 m)2896 peopleUS$40.0 million Water 13 00875 i001
NASADEM (30 m)4458 peopleUS$85.5 million Water 13 00875 i002
Climate Central CoastalDEM (30 m, vertically corrected)6054 peopleUS$101.2 million Water 13 00875 i003
Jamaica National DSM (6 m)5341 peopleUS$78.8 million Water 13 00875 i004
UAV-derived Elevation Model (The Nature Conservancy, 3.8 cm)9619 peopleUS$172.5 million Water 13 00875 i005
Table 4. Input datasets used for the Jamaica national-level storm surge analysis.
Data TypeSourceSpatial ResolutionTemporal Resolution
Digital Elevation ModelGovernment of Jamaica national DSM (derived IKONOS stereo-paired mages)6 m2004
BathymetryA blend of (1) Landsat-derived bathymetry from IHC (0–25 m depth); (2) Navionics nautical charts-interpolated bathymetry (25–100 m depth); and (3) ETOPO1 (>500 m depth) 10 m nearshore, 1 km deep ocean--
ShorelineOpenStreetMap global coastline shapefile10 m--
MangrovesBaseline: Government of Jamaica-- 2005
Current: The Nature Conservancy1–2 m2013
PopulationJRC-EU Global Human Settlement Layer250 m2015
Economic Exposure (stock/property)GAR17 (UNISDR)—Total, Residential, Industrial Stock1 km downscaled to 250 m using GHS population layer2017
Table 5. Modeled avoided damages in Old Harbour Bay, Jamaica, attributable to mangroves under 2 storm scenarios using different socioeconomic datasets.
National Assessment
People Protected Avoided damages to assets
1-in-100 years storm858 people$29 million USD
1-in-500 years storm 4958 people$45 million USD
Publisher’s Note: MDPI stays neutral with regard to jurisdictional claims in published maps and institutional affiliations.

