
Hydrogeochemical and Hydrodynamic Assessment of Tirnavos Basin, Central Greece


1
Sector of Geological Sciences, Mineralogy and Geology Laboratory, Department of Natural Resources & Agricultural Engineering, Agricultural University of Athens, Iera Odos 75, 11855 Athens, Greece
2
Hellenic Agricultural Organisation “Demeter”, Soil & Water Resources Institute, Sindos, 57400 Thessaloniki, Greece
*
Author to whom correspondence should be addressed.
Water 2021, 13(6), 759; https://doi.org/10.3390/w13060759
Submission received: 31 December 2020
/
Revised: 17 February 2021
/
Accepted: 8 March 2021
/
Published: 11 March 2021
(This article belongs to the Special Issue Geo-Environmental Approaches for the Analysis and Assessment of Groundwater Resources at Catchment-Scale)
Abstract
:A combined hydrogeochemical and hydrodynamic characterization for the assessment of key aspects related to groundwater resources management was performed in a highly productive agricultural basin of the Thessaly region in central Greece. A complementary suite of tools and methods—including graphical processing, hydrogeochemical modeling, multivariate statistics and environmental isotopes—have been applied to a comprehensive dataset of physicochemical analyses and water level measurements. Results revealed that the initial hydrogeochemistry of groundwater was progressively impacted by secondary phenomena (e.g., ion exchange and redox reactions) which were clearly delineated into distinct zones according to data processing. The progressive evolution of groundwater was further verified by the variation of the saturation indices of critical minerals. In addition, the combined use of water level measurements delineated the major pathways of groundwater flow. Interestingly, the additional joint assessment of environmental isotopes revealed a new pathway from E–NE (which had never before been validated), thus highlighting the importance of the joint tools/methods application in complex scientific tasks. The application of multivariate statistics identified the dominant processes that control hydrogeochemistry and fit well with identified hydrodynamic mechanisms. These included (as dominant factor) the salinization impact due to the combined use of irrigation water return and evaporitic mineral leaching, as well as the impact of the geogenic calcareous substrate (mainly karstic calcareous formations and dolostones). Secondary factors, acting as processes (e.g., redox and ion exchange), were identified and found to be in line with initial assessment, thus validating the overall characterization. Finally, the outcomes may prove to be valuable in the progression toward sustainable groundwater resources management. The results have provided spatial and temporal information for significant parameters, sources, and processes—which, as a methodological approach, could be adopted in similar cases of other catchments.
1. Introduction
Groundwater is a critical natural resource that needs to be properly managed in order to sustain its paramount aspects of quantity and quality. In service of this goal, rational groundwater management requires accurate information and adequate knowledge about the processes affecting groundwater evolution in time and space. Therefore, scientists (and eventually stakeholders) need robust tools to efficiently evaluate the status of groundwater and decipher the governing factors that regulate its hydrogeochemical and hydrodynamic regimes. The acquisition and interpretation of such information is a demanding and complex task, which requires multidisciplinary approaches, different perspectives and varied methodologies [1]. Essentially, hydrogeochemical and hydrodynamic information needs to be dealt with holistically, with special emphasis put on their interactions. The methodological approach of the present work dictated the synergetic and combinational consideration of various tools and methods, e.g., classic hydrogeochemical approaches, the use of bivariate plots and/or molar ratios [2,3,4,5,6], hydrodynamic characterizations [7,8,9], hydrogeochemical modelling [10,11,12], multivariate statistics [13,14,15,16,17,18] and environmental isotopes [19,20,21,22,23].
As a case study, we focused on the Tirnavos basin, which is part of the greater Thessaly plain in central Greece and is among the most productive regions of the country. The study area was favored for its relative abundance of water resources, most of which are used for irrigation purposes. Systematic exploitation of the system has been subject to the water authorities for more than half a century. This paper attempted to comprehensively elucidate the dominant attributes of the aquifer system that control its hydrodynamic evolution and shape its groundwater quality characteristics, based on historic and contemporary data.
The main goals of this research may be summarized as follows:
- -
- Combine and test variable methodologies and tools through a specific proposed workflow, which may act a basic methodological array for assessing the hydrogeochemical and hydrodynamic conditions in similar cases.
- -
- Develop and optimize a conceptual model for the groundwater resources of the study area, based on previous literature and the newly applied combined methods/tools.
Performed analyses served as a basis for developing a deep understanding of the system’s characteristics, in order to identify and adopt optimal solutions for rational groundwater management. The latter is important, especially in environmentally vulnerable arid or semiarid Mediterranean areas—like the Tirnavos basin—which are expected to face adverse impacts (e.g., increased temperatures, decreased precipitation, and reduced recharge of groundwater resources) in the future due to climate change [24]. Therefore, comprehensive planning in the framework of climate change is regarded as highly important for safeguarding food safety and overall sustainability of the water-ecosystem-food nexus on which the socioeconomic stability and welfare of the region depend.
It is apparent that, in complex aquifer systems that are strongly controlled by active tectonics, co-evaluation of numerous analysis methodologies of hydrological, hydrolithological, hydrogeochemical and isotopic data need to be conjunctively considered. That is the optimal way to get safe results and decipher controlling mechanisms that may prove to be critical in intensively stressed systems. The performed analysis confirmed known key hydrodynamic evolution mechanisms; it also revealed significant elements that were not apparent—having been masked by the controlling hydraulic and hydrogeochemical mechanisms.
2. Study Area
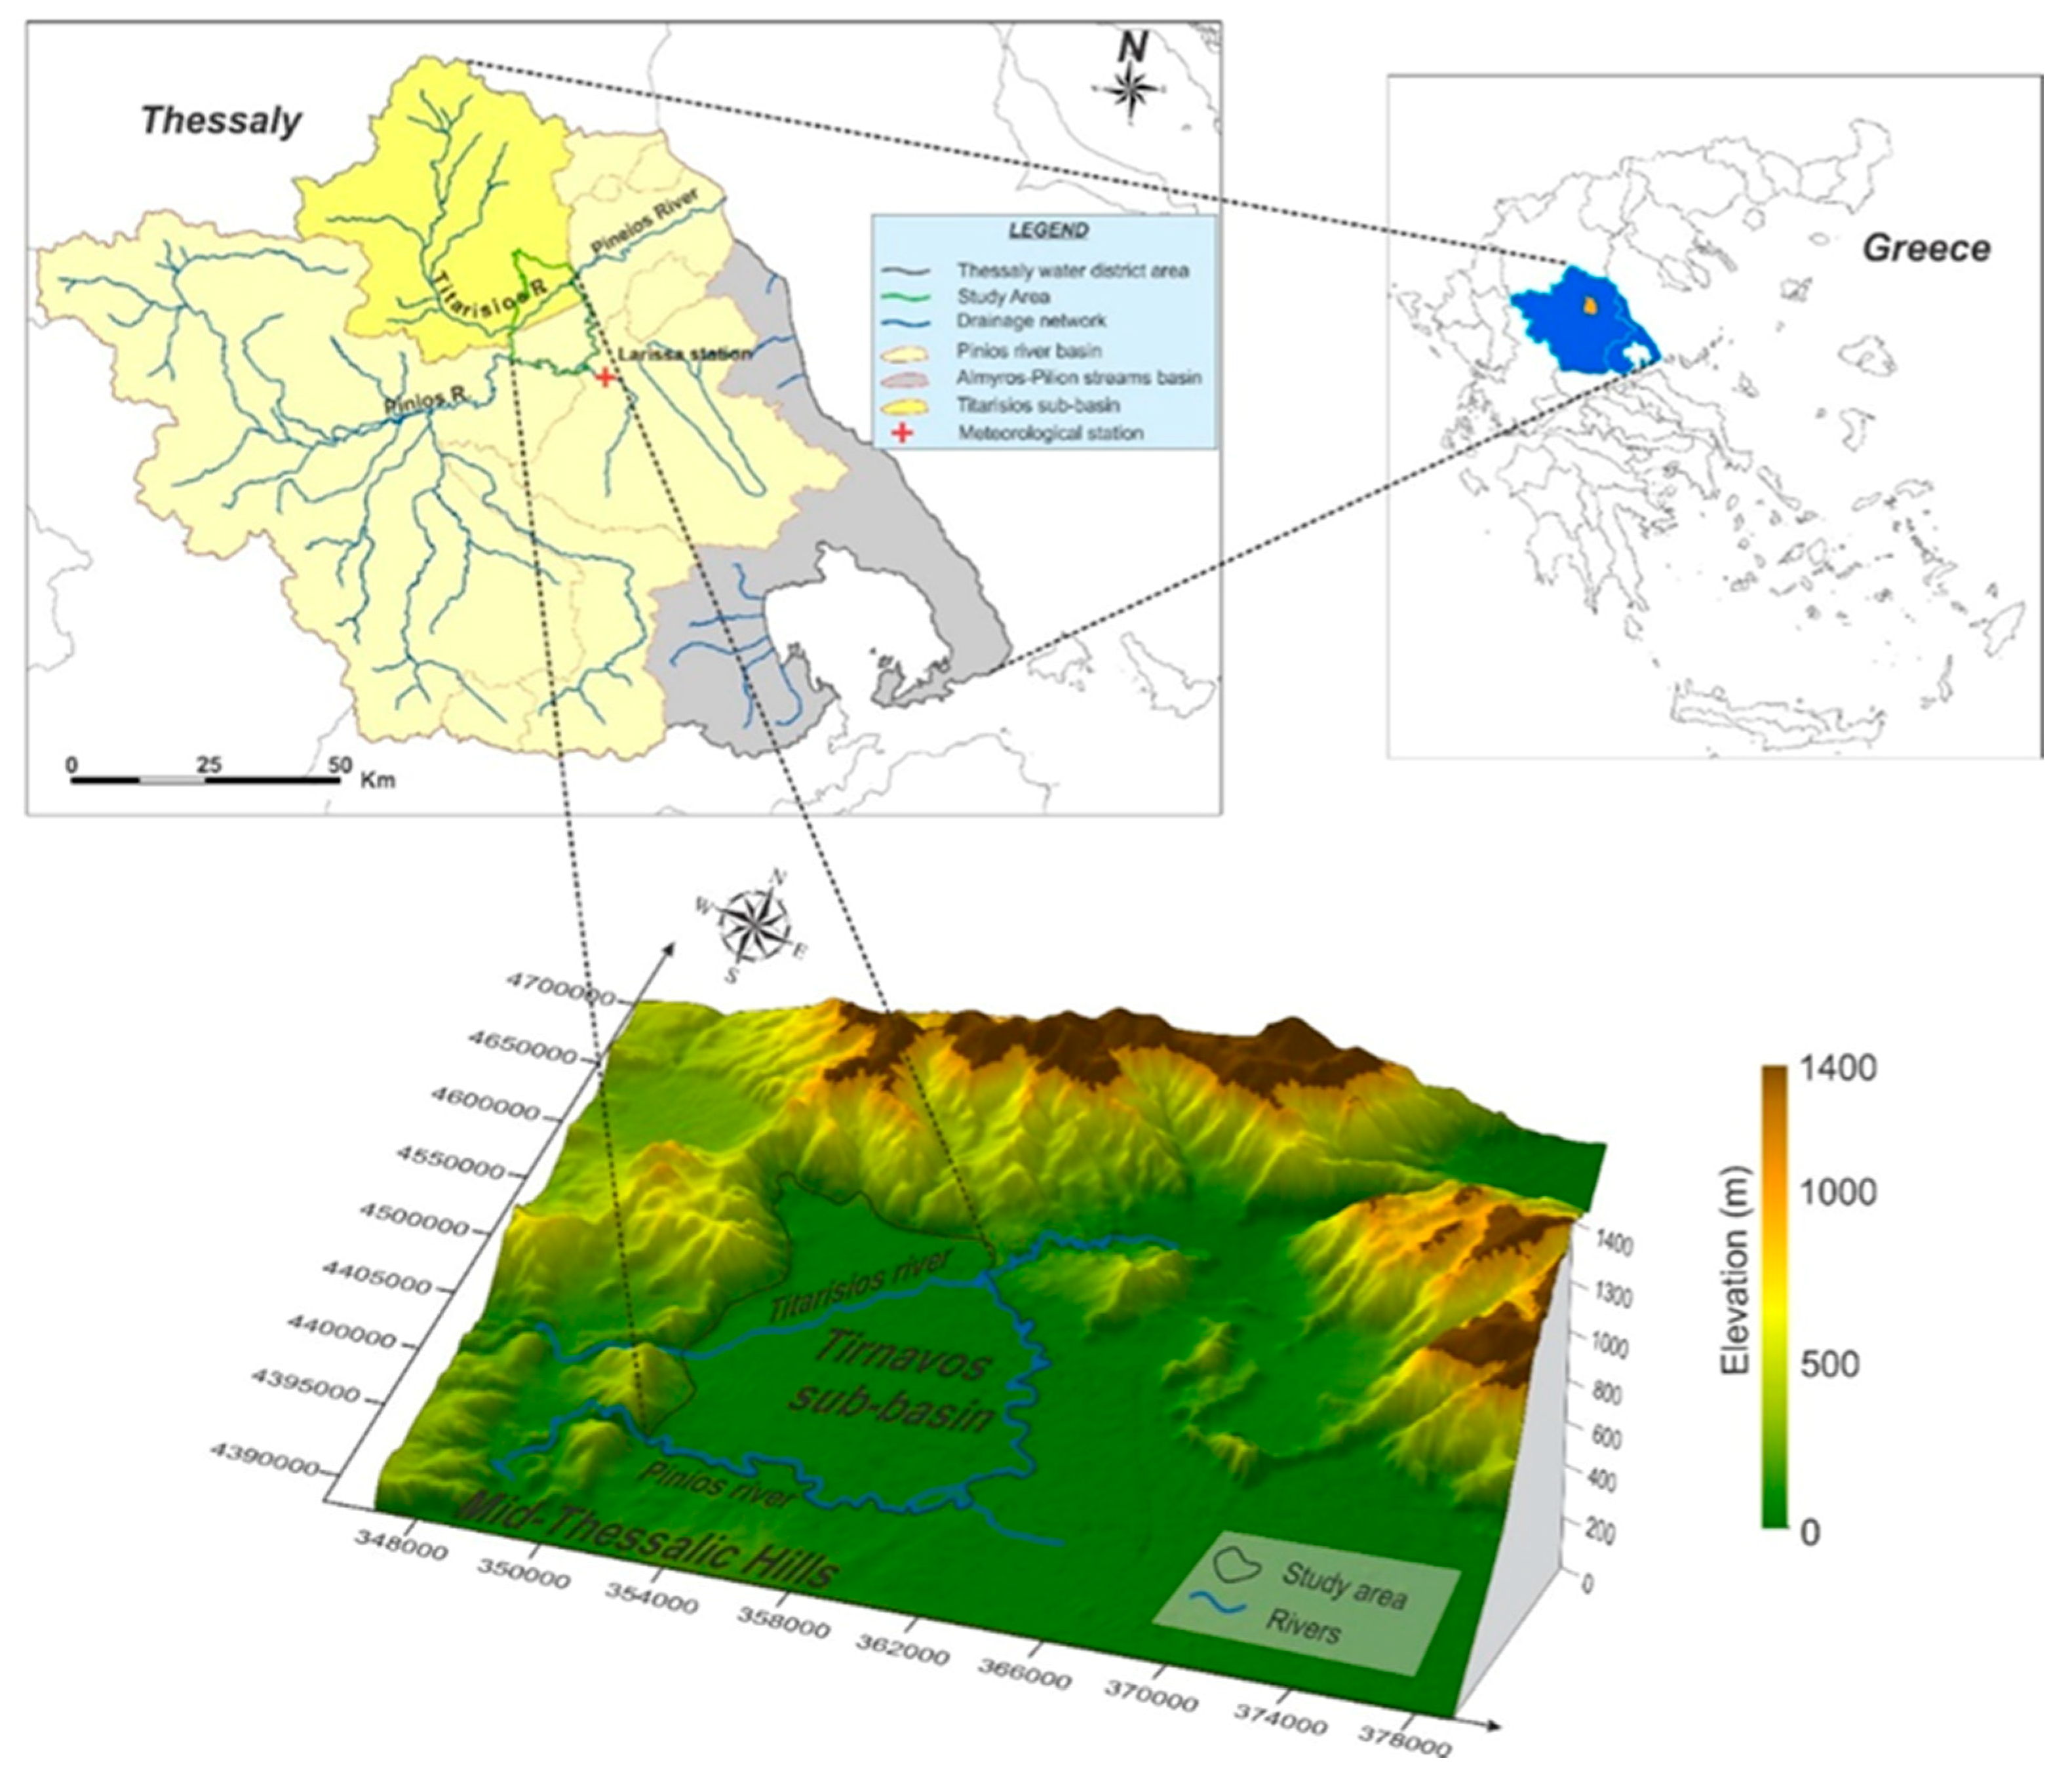
Thessaly plain is the largest alluvial basin in Greece, with a total area of 13,142 km2 and an average altitude of 427 m. It is in central Greece and—through the Mid-Thessalic hills—it is divided into two sub-basins: the western Thessaly basin and the eastern Thessaly basin, each of which developed in a NW-SE direction as part of a wider tectonic trough. The Tirnavos subbasin, from a hydrological perspective, is essentially the northwest part of the eastern Thessaly basin. It includes sections of the Titarisios River basin to the north and the Pinios River basin to the south. Its area is estimated to 251 km2, or about 2.35% of the total area of the Pinios basin (Figure 1). The perimeter of the study area was 106 km and the average altitude 76 m. The smallest and largest morphological gradients recorded are 0 and 45.93%, respectively, while the mean slope is 5.3%. The relief of the wider region is depicted in Figure 1.
The climate is typical Mediterranean, with annual rainfall from 400 mm to 500 mm, distributed almost entirely during the wet hydrological period, without any significant precipitation during summer. Thus, several irrigation systems have been developed to support the cultivation of highly productive summer crops [25]. With regards to the meteorological data, Larissa station is the closest to the study area, and has gathered continuous and reliable data over several decades.
Agriculture is the dominant land use, covering approximately 165 km2 or 65.73% of the Tirnavos sub-basin. Intensified agricultural activities, including both cultivation and livestock, are a major source of groundwater contamination by nitrogen compounds. Manure waste and the often excessive, improper use of nitrogen fertilizers aiming to improve agricultural production have led to the occurrence of elevated concentrations of nitrates in groundwater [26].
3. Geology—Hydrogeology
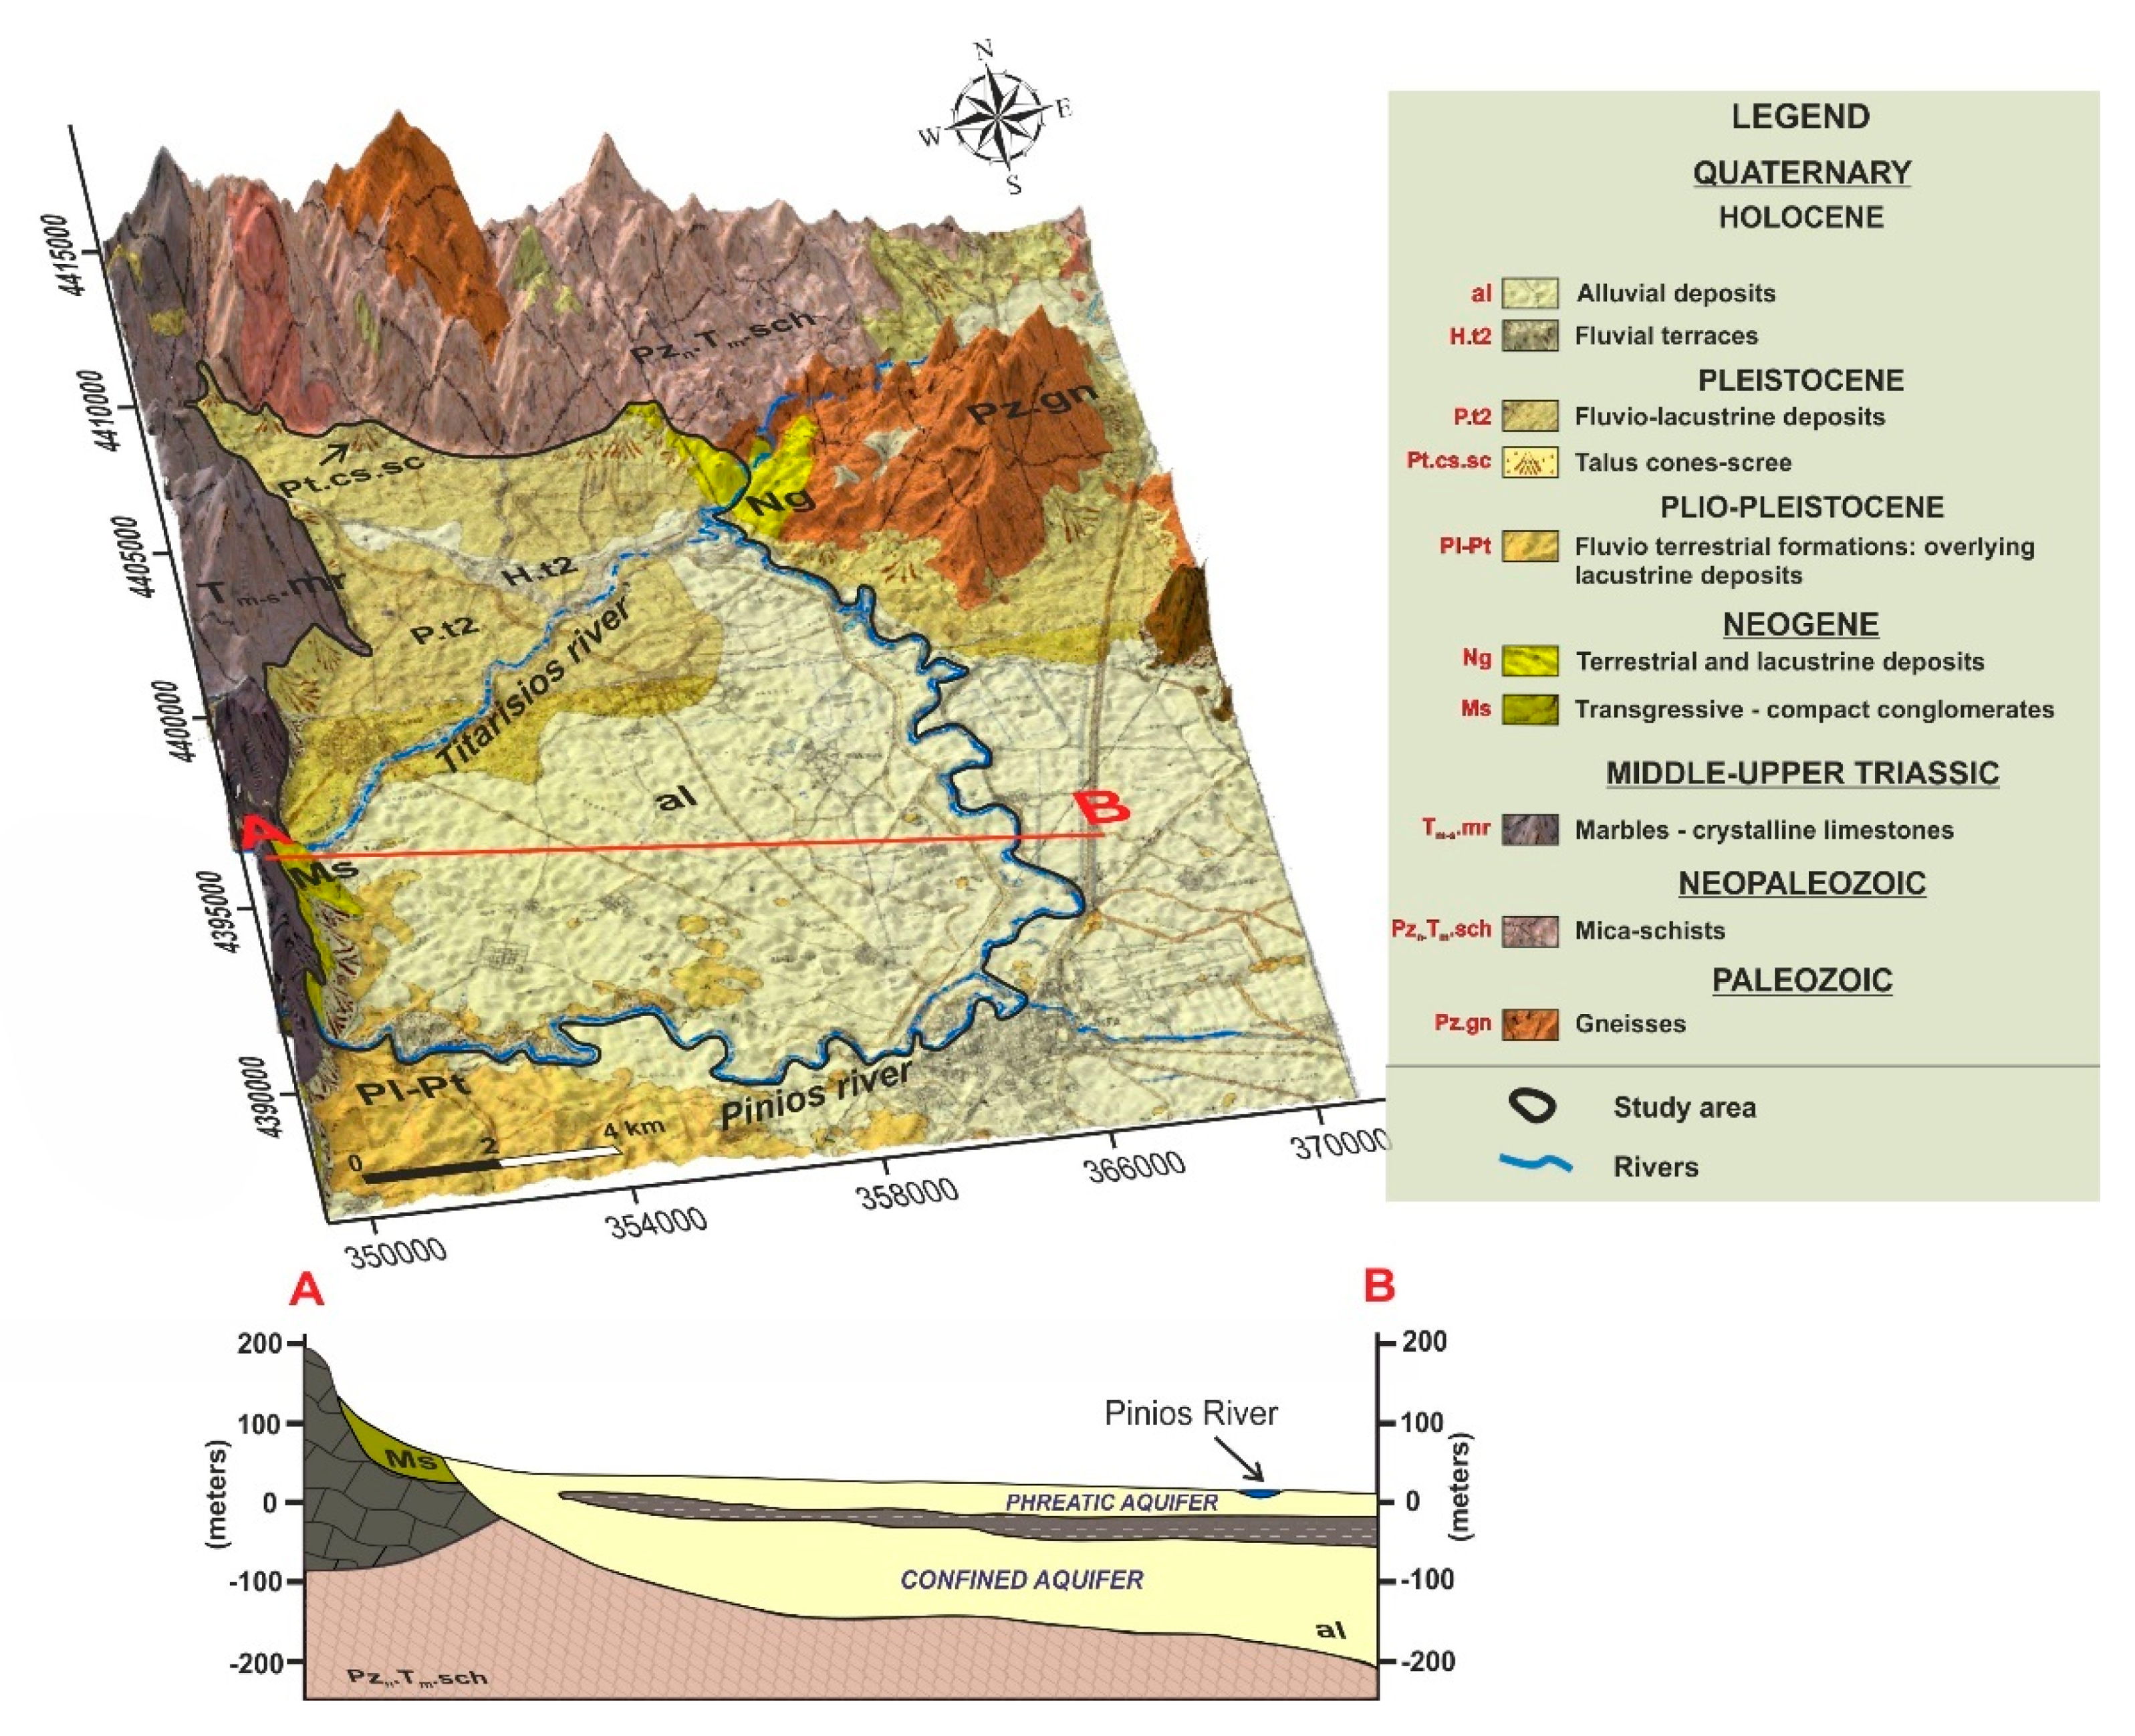
The Tirnavos subbasin forms the northwestern part of the eastern Thessaly plain of Central Greece. It is filled by Quaternary alluvial formations which are bounded along the southwest part of the basin by Neogene marls and sandy-clay deposits. The western margins consist of karstified marbles of middle-upper Cretaceous origin. The crystalline bedrock is composed of mica-schists and gneisses of upper Paleozoic and Paleozoic age, respectively, forming the northern boundary of the subbasin (Figure 2). Two major springs (Mati Tirnavou and Agia Anna) emerge at the contact of the karstified system with the alluvial deposits. The Pinios and Titarisios rivers flow across the subbasin which, as already mentioned, hydrologically part of the wider Pinios River basin.
The Quaternary deposits host an unconfined aquifer near the talus cones of Titarisios River in the NW, which converts to a phreatic and deeper confined aquifer toward the center of the basin. These are separated by a sequence of clay layers, which form an aquitard [29,30] and have a maximum thickness of over 550 m at their central parts [25,31]. Despite the limited potential of the phreatic aquifer nowadays, its importance is paramount as it forms an effective buffer zone that protects the confined units from potential surface-released contaminants of anthropogenic origin (e.g., due to agricultural activities). In addition, the marbles of the western margins host a karstic aquifer of great potential, which recharges the alluvial system by lateral crossflows.
Due to the occurrence of marls along the southern part of the karst, the inflow from this part is reduced compared to that of the northern parts. Crossflow from the crystalline bedrock at the northern margins of the basin also occurs but is of minor importance. In addition to the above, the southern extent of the karst system—and to a minor extent the Mid-Thessalic hills—recharges the central plain parts by crossflow from the southwest and southern parts of the area.
In the western part of the basin, there is an extensive marginal cone through which the alluvial system receives significant amounts of recharge, as crossflow through the Titarisios River gorge sediments. A smaller volume recharges the aquifer system as crossflow from the Pinios River gorge sediments to the south [29].
4. Methodology
4.1. Methodological Array
A suite of different methodological tools was efficiently combined to provide a robust array of methodological workflows (Figure 3), having as their goal the construction of a comprehensive conceptual model for the evolution of groundwater resources at the study area. The bases of this workflow were the physicochemical analyses of groundwater samples, which were subsequently processed with the aid of (i) graphical methods (expanded Durov diagram), (ii) multivariate statistics (R-mode factor analysis and cluster analysis) and (iii) hydrochemical sections and bivariate plots. This combined approach was essential for grouping samples of similar hydrogeochemical identity (physicochemical fingerprint and processes). It identified the dominant previous and/or ongoing geochemical processes which strongly influenced the hydrogeochemical status of the study area. It also revealed the main sources of enrichment and/or contamination to/from specific parameters and allowed for the an assessment of their spatial evolution—progressively with the groundwater flow of the system.
As a first result of this assessment, an evaluation of the groundwater quality was achieved, based on a comparison of the parametric values with relative standards and legislation. An additional set of raw data and field measurements—including groundwater level registrations—was then used for deciphering the basic hydrogeological characteristics (e.g., groundwater flow). This, combined with the results from stable isotope analysis (oxygen and deuterium) can provide insight into the recharge and hydrodynamic conditions of the system. Eventually, the combination and co-assessment of the hydrodynamic conditions with the dominant geochemical processes will constitute the fundamental aspect of the conceptual model for the groundwater resources of the area. Based on distinct steps and specified tools, this methodological array may be used as a model in similar cases where the groundwater conceptual model is the main scientific quest.
4.2. Groundwater Sampling, Analyses and Measurements
In total, 174 water samples were collected during 4 sampling periods (2 dry and 2 wet periods) between September 2016 and April 2018. Specifically, 153 samples were collected from boreholes within the study area and 21 surface water samples were taken from the rivers. Water samples were collected in double-capped polyethylene bottles of 1000 mL and stored in cool conditions during transport to a laboratory at The Soil and Water Resources Institute (SWRI) for analyses. Electrical conductivity (EC), pH, dissolved oxygen (DO) and oxidation-reduction potential (ORP) were determined in the field using the ProDSS (YSI inc., Yellow Springs, OH, USA) multiparametric probe. Laboratory analyses determined 27 parameters, including major and minor ions and trace elements; additional parameters were also calculated subsequently (Appendix A, Table A1). Calcium, magnesium and trace elements (except boron) were determined using an atomic absorption spectrophotometer by flame method. Sodium and potassium were analyzed through flame photometry while sulphate, nitrate, nitrite and ammonium were analyzed using spectrophotometer UV-VIS measurement. Bicarbonates, carbonate anions (neutralization by H2SO4) and chloride (neutralization by AgNO3) were determined volumetrically. The reliability of the results was determined by ionic balance error, which was found to be less than 10% for all samples, with a median value of −3%.
In addition, twenty-six (26) samples were collected for isotopic analyses from selected sites of the monitoring network in April (n = 15) and September (n = 11) 2018, respectively, according to the International Atomic Energy Agency’s sampling specifications [32]. The first isotope sampling period took place in April 2018; 15 samples were collected. The second sampling period took place in September 2018; only 11 out of 15 samples were collected because some of the wells were not operating. Additionally, the Titarisios River was dry during that period. In detail, the following samples were collected: (a) 21 from groundwater sites (12 in the first period, 9 in the second); (b) 2 from the Mati Tirnavou spring (1 for each period); (c) 2 from the Pinios River (1 for each period); and (d) 1 from the Titarisios River (in the first period). Fully filled 100 mL double cap polyethylene bottles were used for sampling, and samples were analyzed for oxygen and hydrogen isotopic compositions (18O and 2H) at the Hydrology Laboratory of Lubeck Technical University in Germany. Analyses were conducted via off-axis integrated cavity output spectroscopy (OA-ICOS, DLT-100 Liquid Water Isotope Analyzer, Los Gatos Research Inc., Mountain View, CA, USA) and reported in per mil (‰). The analytical precision for δ18O and δ2H was 0.2‰ and 0.6‰, respectively.
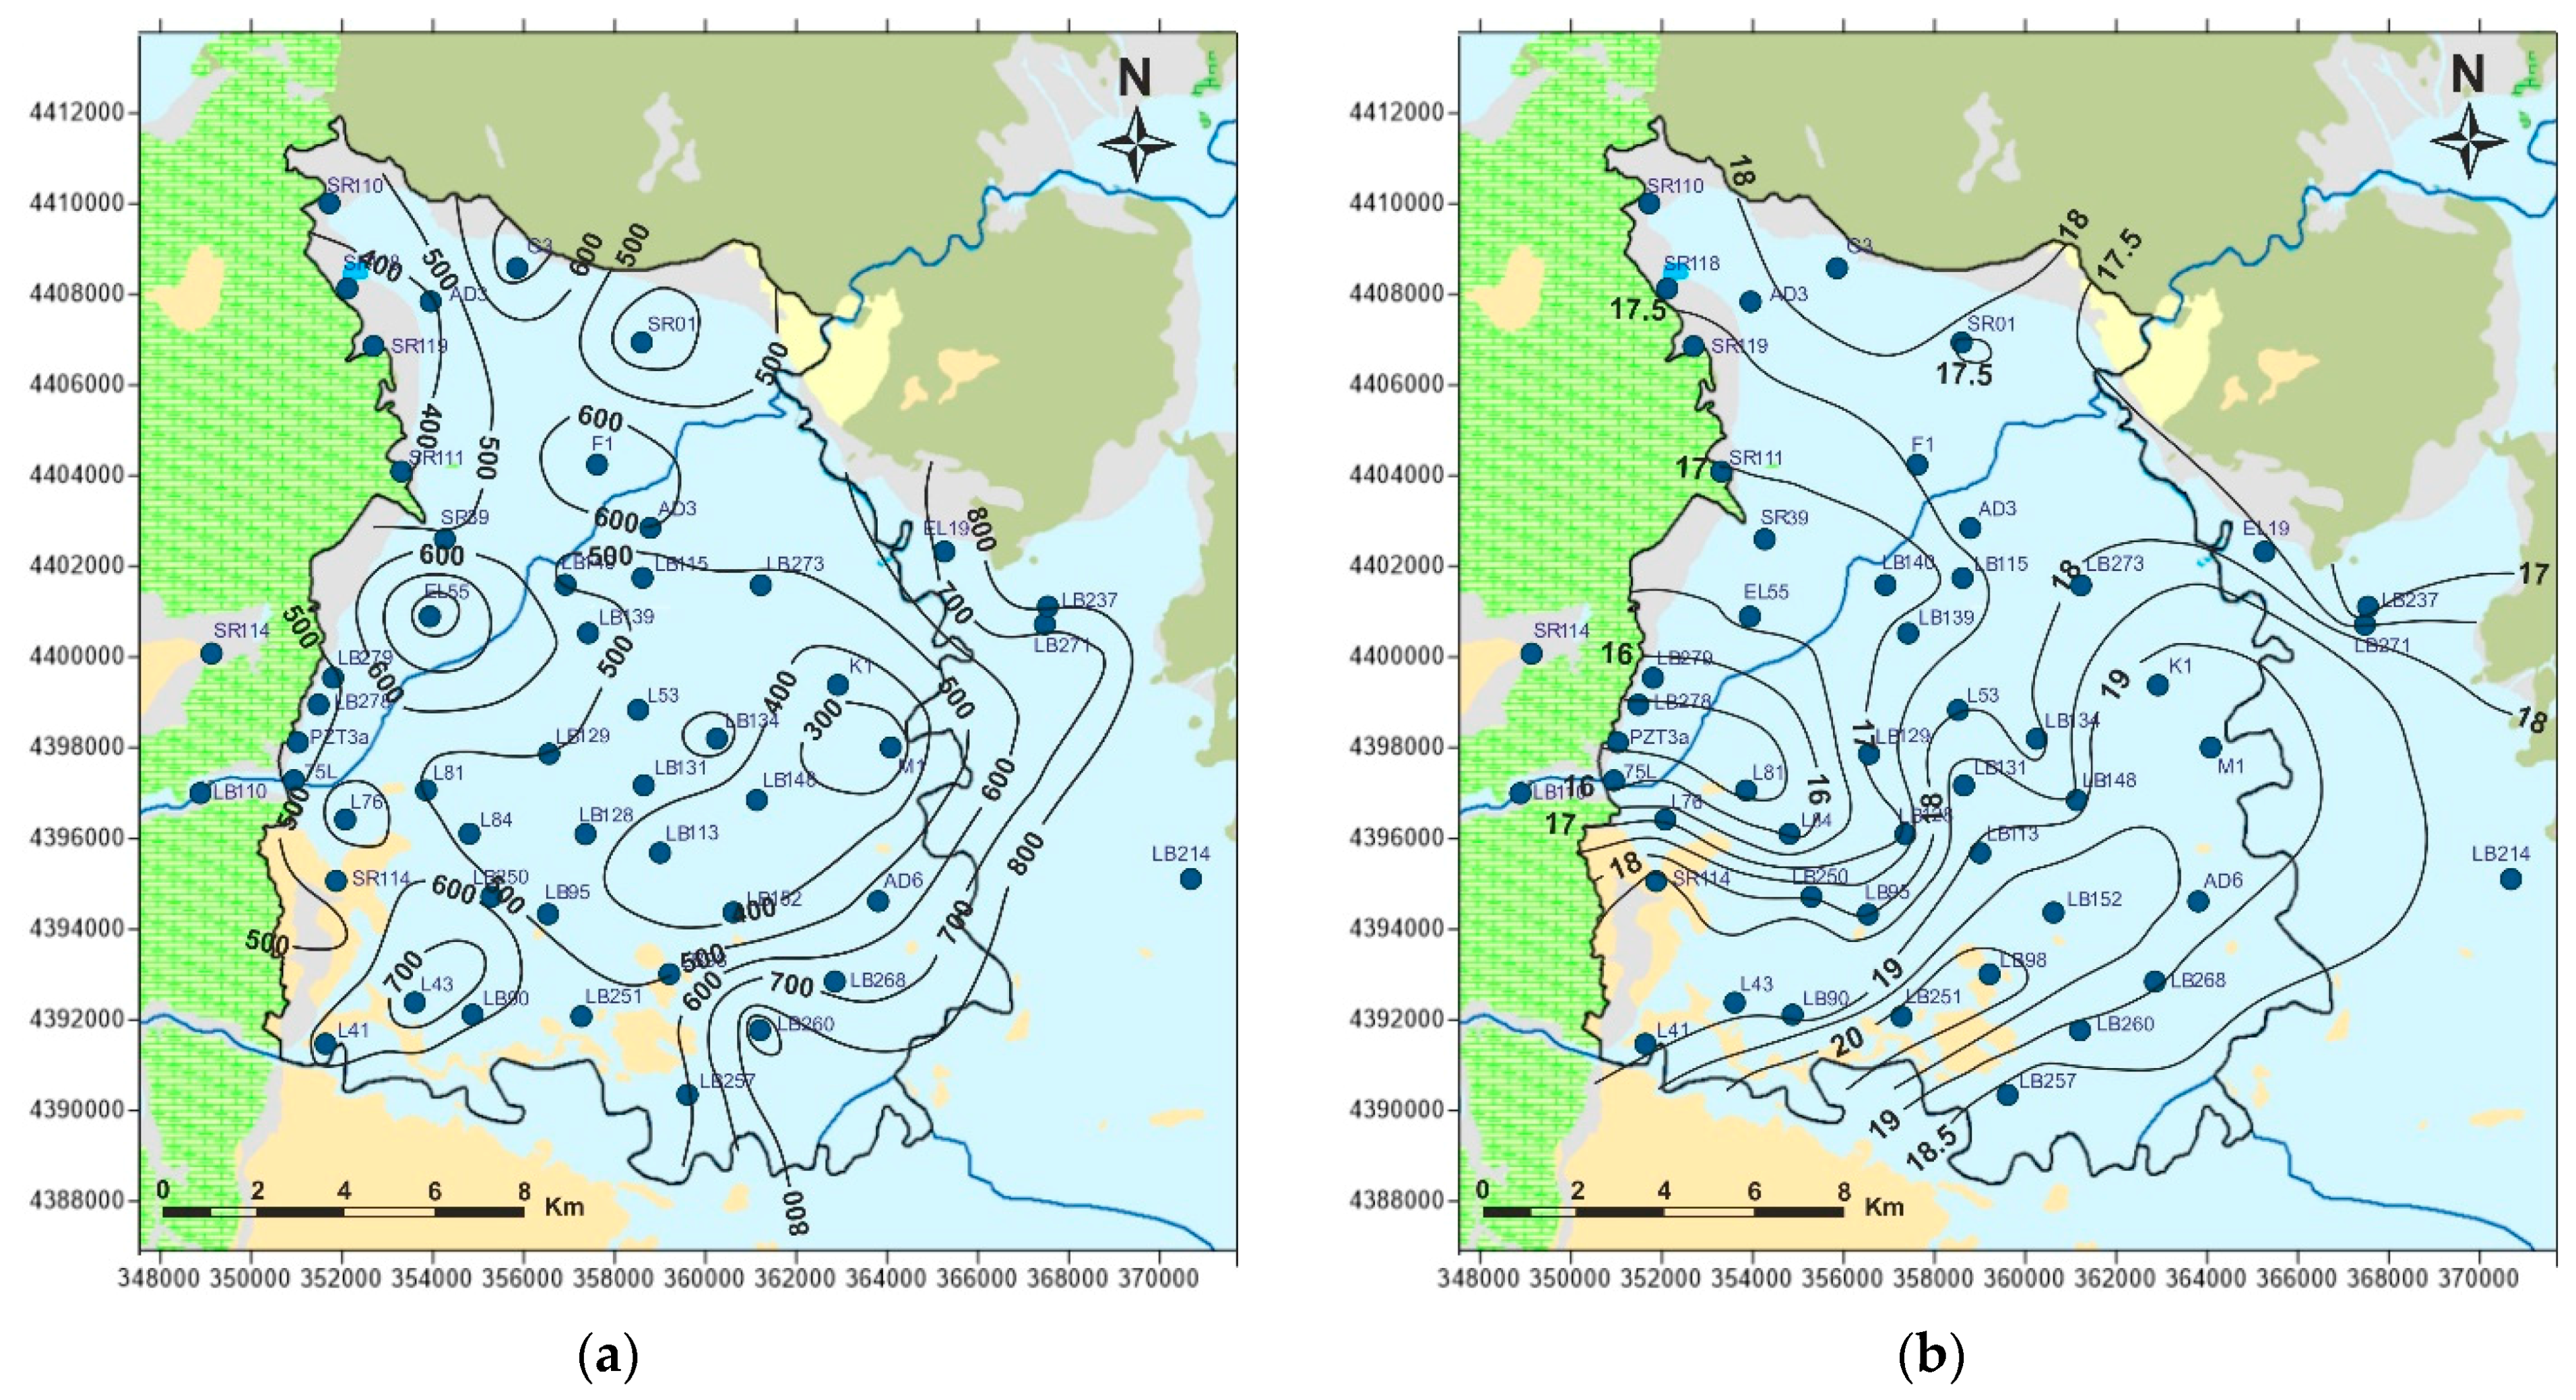
In addition to water sampling, a groundwater level monitoring network comprising 46 wells was compiled (Figure 4) and operated to facilitate the objectives of the research. At all groundwater level measuring stations (boreholes), the altitude was accurately recorded using the Real Time Kinematic (RTK)—GPS, Epoch 50 by Spectra Geospatial. Water level monitoring was performed in April and September 2017, to reflect representative conditions of the wet and dry hydrological periods. Based on the compiled piezometric maps (Figure 4), a relative drawdown is evident, ranging from a few to ten meters locally. This indicated a seasonal effect on water level and consequently volume of water stored in the aquifer system.
4.3. Data Processing
Groundwater chemistry data was processed with graphical approaches and multivariate statistics. An expanded Durov diagram [34] was used to identify the ongoing hydrogeochemical processes in the study area. In this diagram, the cation and anion triangles were recognized and distinguished along the 25% axes so that the main field was conveniently divided. The expanded Durov diagram has a distinct advantage over the Piper diagram [35] in that it provides a better display of hydrochemical water types [36] and has the potential to reveal geochemical processes that could affect groundwater evolution [37].
To get a better insight on the potential correlation between the examined parameters, the Pearson correlation coefficient (r) was calculated. If the correlation coefficient (r) is greater than 0.7, parameters are considered strongly correlated; if it ranges between 0.5 and 0.7, it indicates a moderate correlation at a significance level of p < 0.05. [38]. In addition, a classic robust multivariate statistical technique (R-mode factor analysis) was applied. Factor analysis (FA) has been widely used in environmental sciences and hydrogeochemical research [1,14,39,40]. It is a multivariate statistical technique that involves linear combinations of variables through a correlation-focused approach. FA seeks to reproduce intercorrelations among variables, in which the factors represent their common variance. The relationship among several observed quantitative variables is represented in terms of a few underlying, independent variables, called factors, which may not be directly measured or even measurable [41]. The exact number of factors was chosen by Kaiser criterion [42] in which factors with eigenvalues smaller than 1 were eliminated. Prior to processing, initial data was standardized through log transformation and z-scores to eliminate the influence of different units between variables and acquire a normal or log normal distribution [43]. Variables that failed to meet that criterion were omitted from further data processing. Finally, 19 parameters compiled the correlation matrix that accounted for the degree of mutually shared variability between individual pairs of groundwater quality parameters. The higher the factor loading of a parameter, the greater its participation to the examined factor. Factor loadings above 0.750 were considered high, those between 0.500 and 0.750 were considered moderate, and those between 0.400 and 0.500 were considered weak [40]. To further assist the performed assessments, the saturation indices of critical minerals were calculated with the aid of PHREEQC software [44].
5. Results and Discussion
5.1. Physicochemcial Analyses
Electric conductivity (EC) varied from 253 to 1821 μS/cm (Figure 5a). The higher EC values occurred in the southeastern part of the study area, where most of the region’s small-to-medium sized industrial units are located [45]. The lowest values of EC are noted in the eastern and central part of the study area, where no significant industrial activity occurs.
Groundwater temperature is known to be an important driver for water quality [46,47], and therefore a crucial parameter for groundwater quality management. In addition, groundwater temperature is one of the best environmental tracers for detecting water flux, because heat in aquifers is transported both by conduction and advection caused by groundwater flow water temperature [48]; hence it may be directly related to the hydrodynamic evolution of a system. Low groundwater temperatures normally indicate recharge waters while higher temperatures indicate greater distance from the recharge source. As shown in Figure 5b, the lower groundwater temperatures were observed in the western margins of the basin, at the contact of the alluvial with the carbonate formations, while more elevated temperatures occurred toward the central and southern parts of the basin. This spatial distribution of temperature—combined with the piezometric data—indicated that the karstic system to the west is the main recharge source. On the other hand, low temperatures were also observed in the eastern parts of the basin, where alluvial deposits exist between metamorphic formations of crystalline bedrock, probably denoting a potential recharge effect from the east. In the absence of monitoring points at that part of the basin, however, that hypothesis could not be verified by piezometric data.
The main recharge areas of the basin were also indicated by the spatial patterns of DO and pH. For DO, higher values suggested enrichment in oxygen; thus, recharge conditions were present in the western and northern parts, while DO values were progressively reduced toward the center of the basin (Figure 5c). Deviations from that pattern (e.g., NW part of the basin) may be attributed to potential secondary geochemical processes (e.g., redox reactions) which create locally reducing conditions. Regarding the pH values, it was evident that in the recharge areas (west and north), pH was circumneutral, but progressively more alkaline moving toward the central and eastern parts of the basin (Figure 5d).
Based on the analytical results (Appendix A, Table A1), groundwater samples were slightly alkaline (median value: med = 7.61) with relatively low electrical conductivity (med = 486 μS/cm). The order of abundance for cations is Ca2+ > Mg2+ > Na+ > K+, and for anions HCO3− > NO3− > SO42− > Cl−. With regard to calcium and bicarbonates (which constitute the most abundant ions), it was evident that the main origin of their concentrations was the karstic system, cropping out at the western parts of the basin. That, as indicated in the previous section, is considered a major pathway for recharge of the system. Interestingly, nitrates are the second most abundant anion, clearly reflecting the anthropogenic impact due to widespread agricultural activities. In total, 72% of samples exhibited concentrations above 10 mg/L, which is an indicative threshold for nitrate contamination in natural systems [49]. Over 9% exceeded the Maximum Admissible Concentration (MAC) for drinking water (50 mg/L), according to [50,51], reaching up to 145 mg/L. However, their spatial distribution was scattered, without any profound pattern, elucidating that, apart from diffuse agricultural impact, contamination is point-source. This could be explained by agricultural malpractice and/or septic tanks, reflecting the potential influence of locally developed favorable conditions for percolation of pollutants through the vadose zone—which is in line with the above-described characteristics of the sediments that fill the basin. Other outlying values and cooccurrences of elevated ion concentrations (e.g., maximum values of Na+ (287 mg/L) and SO42− (604 mg/L)) were also related to local factors (e.g., soil amendments rich in Na+ and SO42− or dissolution of evaporitic minerals such as thenardite (Na2SO4), gypsum (CaSO4), and halite (NaCl)) which could have occurred due to previous paleoenvironmental evaporitic conditions [1]. Nevertheless, their distribution (and thus their impact) was very limited. Finally, concentrations of heavy metals and metalloids were generally low; the only exception was an outlier for B (1.25 mg/L), most likely attributed to local impact of boron-rich soil amendments.
5.2. Identification of Governing Processes and Spalital Evolution of Hydrogeochemistry
The results of chemical analyses were plotted in the expanded Durov diagram with the help of the DurovPwin application [52]. To ensure the representativeness of the results, the median values of the four periods were considered in the process. According to the expanded Durov diagram (Figure 6), two basic hydrochemical characters are identified, which can be further separated into subgroups: 1a, 1b, 2, 3, 5, 6. These characters are described below, while in Figure 6 the spatial distribution of the identified groups is illustrated.
- Hydrochemical Type 1 (Ca-Mg-HCO3): In Subgroup 1a, Ca2+ and HCO3− were dominant, indicating that this was a recharge zone, which was verified by high dissolved oxygen and low water temperature values in this area (according to field measurements analyzed in previous paragraphs). Based on the dominant cations in the formation of the hydrochemical character, group 1b did not differ substantially from 1a. However, there was a slight increase in the concentrations of Na+ and Mg2+ and, with respect to the anions, higher SO42− values. Spatially, this hydrochemical type occupied two zones on either side of the Titarisios River. The first began north of it and extended to the northwestern part of the basin, while the second began from the central part of the basin (south of Titarisios) and extended to the south and southwestern part of the basin. The dominance of Ca2+ and HCO3− in this subgroup also indicated a recharge zone, possibly lower than that of group 1a. The involvement of Mg2+ in the formation of the hydrochemical type was consistent with the mild dolomitization process which characterized the carbonate system [27]. The reason for the observed differentiation between the two subgroups may have been due to the limited system recharge rate from the karst (which allows mixing of recharge water with the aquifer system and/or the development of a small degree of ion exchange processes). In particular, the development of this subgroup on its southwestern boundary may have been justified by the emergence of Neogene deposits in this area, which limited the rate of groundwater replenishment in this part of the aquifer. At the same time, in this area, according to earlier studies [53], lateral recharge from the Mid-Thessalic hills was reported—of limited extent and intensity and qualitatively inferior to that of the karst system.
- Hydrochemical Type 2 (Ca-Mg-Na-HCO3-SO4): The second hydrochemical type was characterized by higher Na+ and SO42− concentrations. The involvement of Ca2+ and HCO3− in the formation of the hydrochemical type of subgroup 2 (Mg-Ca-HCO3-SO4) was still significant; however, it was less than that of subgroups 1a and 1b. The projection position of subgroup 2 in the expanded Durov diagram indicated progressive involvement of ion exchange and perhaps also mixing mechanisms. At least locally and seasonally [27], the mixing of Pinios River water with aquifer water through filtration along its bed in the formation of the observed hydrochemical type cannot be excluded. It was also characterized by low analogues with subgroups 1a and 1b at Ca2+ and HCO3− concentrations. Subgroup 2 (Ca-Mg-Na-HCO3) can therefore be considered as representative of a transition zone from intense recharge zones (subgroups 1a and 1b) to a restricted recharge zone and longer groundwater residence time in the aquifer (subgroups 3, 5, 6). In subgroup 3 (Na-HCO3), HCO3− and Na+ dominated, and the ion exchange phenomenon was fully evolved, as indicated by the projection of its representative samples (wells 18 and 34) on the expanded Durov diagram. Subgroup 5 (Na-Mg-Ca-SO4-HCO3) represented mixing or dissolution waters, where Mg2+ (but mainly Na+ from cations) and Cl- (but mainly SO42− and HCO3−, to a lesser extent from anions) dominated, thus suggesting a contributing recharge mechanism in the form of lateral influx from surrounding formations that contributed to the aquifer balance and obviously affected its hydrochemical identity. Last, subgroup 6 (Na-SO4-HCO3), which was only represented by a single but distinct sample, plotted on an uncommon part of the graph for groundwaters, which is often a product of mixing.
The above assessments may be further supported by the physicochemical evolution of groundwater along its flow path (Figure 7 and Figure 8), from the identified recharge area to the end of the transition zone, as defined by the six (6) selected (representative) wells (A-A’ axis) depicted in Figure 6. With regard to the physicochemical parameters (Figure 7), an increasing trend was identified for the EC (like Total Dissolved Solids -TDS-, as expected), following the typical ion enrichment of groundwater from the recharge areas to the central parts of the hydrological basin. Bicarbonates (HCO3−) progressively decreased and then subsequently increased, reaching a higher value than the recharge area; this evolution probably denoted an external impact from CO2 content. Specifically, the reaction of calcite from the karstic substrate in the recharge area (west) with the CO2 derived from the respiration of organic matter, produced carbonic acid as an intermediate step and then bicarbonates—with simultaneous release of calcium, as shown in Equation (1).
CO2(g) + H2O + CaCO3 → Ca2+ + 2HCO3−,
Progressively, along the groundwater flow path, the CO2 content increased (presumably using as its source the occurrence of organic matter in the sediments of the aquifer matrix due to the sedimentation process of the fluviolacustrine deposits under C rich paleogeographic conditions), leading to an increase of CaCO3 solubility [54] and shifting the Saturation Index of calcite (SICaCO3) values from supersaturated to slightly saturated. The latter was in accordance with Figure 8, indicating sharp SICaCO3 reduction.
With respect to Cl−: a constant increase toward groundwater flow was identified. Bearing in mind that Cl− is a conservative ion, the increase of its concentration should be attributed to external factors which—based on the dominant land use activities and site characteristics—may be related to manure leaching and/or septic tanks. However, the dissolution of evaporitic minerals such as halite (NaCl) could not be excluded. Interestingly, the concentrations of SO42− changed without a significant pattern, with notable variations. The primary source of sulfates was geogenic, stemming from the weathering of S-bearing minerals (e.g., gypsum, pyrite, etc). Changes in their concentration were likely due to further impact from the S-bearing minerals, as well as from external factors, e.g., soil amendments. However, their concentration along the dominant groundwater flow path may also change due to variations in redox conditions. The latter was also evidenced by the similar trend in nitrate concentrations—which may act as electron donors. Nevertheless, in the case of nitrates, the changes in their concentrations were less sharp than sulfates. The redox impact was also evidenced in some wells through the elevated values of NH4+ and the relatively low values of NO3−. Potential effects due to leaching of N-fertilizers could not be excluded.
Regarding the major cations (Figure 8), there was an antithetic change in the concentrations of Ca2+ and Na+, explained by the process of ion exchange. The fresh (recharge) groundwater (which was enriched in Ca2+ due to the karstic substrate) is subject to ion exchange toward its flow with the Na+ content of silicate minerals, leading progressively to a decrease in calcium and increase in sodium. This was also reflected in the shift of water types, from Ca-HCO3 to Na-HCO3. The magnesium (Mg2+) also showed a slight increase toward flow, probably enriched by the weathering of dolomite or other Mg-bearing aluminosilicate minerals. Potassium (K+) was nearly constant, exhibiting only minor changes in concentration. Overall, the selected parameters’ evolution along the regional groundwater flow direction (Figure 7 and Figure 8) agreed with the findings and observations discussed above, supporting the concept of strong recharge from the karstic domain in the form of lateral crossflow which then mixes with resident groundwater and is impacted locally by leachates from anthropogenic activities. Moreover, it clearly denoted the progressive shift from mixing to ion exchange process, which was also affected by oxygen depletion and the relative dominance of reducing conditions.
The dominance of the ion exchange process was further verified by the major ion relation analysis conducted and illustrated in Figure 9. Specifically, the relation between (Ca+Mg-SO4-HCO3) and (Na+K-Cl) in meq/L was examined, as suggested by [55,56]. The product of (Na+K-Cl) represented the excessive sodium originating from sources other than halite dissolution (assuming that all chloride is derived from halite). In addition, the product of (Ca+Mg-SO4-HCO3) represented the calcium and/or magnesium which originated from sources other than gypsum and carbonate dissolution (calcite and/or dolomite). If these processes were significant in defining the hydrogeochemistry of groundwater, the relation between the two products should have been linear with a slope of −1. As seen in Figure 9, many data points lie close to a straight line (r = +0.93) with a slope of −0.80, which clearly points to the existence of cation exchange [57,58].
According to [58] the plot of (Ca + Mg) vs. (SO4 + HCO3) could be a reliable indicator—helping to distinguish between ion exchange and reverse ion exchange processes, if these are active in a given study area. The points plotted below the 1:1 line toward the Mg + Ca axis suggest prevalence of the ion exchange process, while those plotted above the 1:1 line towards the SO4 + HCO3 axis denote prevalence of reverse ion exchange. The results of the plotted samples (Figure 10) are in accordance with the outcomes of the expanded Durov diagram (Figure 6). The relative positions of the points in the plot indicate that excessive calcium and magnesium in groundwater were exchanged with sodium from the aquifer matrix. Figure 10 shows the amount of Ca + Mg gained or lost relative to that provided by calcite, dolomite, and gypsum. When HCO3 + SO4 is low (< 5 meq/L) and the samples plot on 1:1 line, dissolution of calcite and dolomite is the major process influencing water chemistry; on the contrary, when HCO3 + SO4 is greater than 5 meq/L, in addition to calcite and dolomite, dissolution of gypsum is likely to occur [59].
5.3. Multivariate Statistics
According to the calculated Pearson coefficient (r), there were strong positive correlations between Na-Cl (+0.847), Na-SO4 (+0.889), Cl-SO4 (+0.855), B-Na (+0.899), and B-SO4 (+0.904); there were moderate positive correlations between Ca-Mg (+0.532), Mg-Cl (+0.683), Mg-SO4 (+0.612), B-Cl (+0.737) and Mg-NO3 (+0.648). Most of the correlated parameters were indicative of a salinization impact, which, according to the dominant land use and site specs, can probably be attributed to leachates rich in high salinity fertilizers washed off through irrigation water return flow. It is interesting, though, that boron (B) was strongly correlated with Na, Cl and SO4, denoting a similar origin or enrichment process. Based on the hypothesis addressed above (occurrence of evaporitic minerals), B could potentially derive from the dissolution of buried evaporitic minerals such as borax (Na2B4O7·10H2O), considering the paleoclimatic conditions of the area. Nevertheless, this cannot solely explain the correlation with Cl and SO4. Most likely, B is also related to fertilizers/soil amendments, whose leached products may contain boron, apart from other saline-related parameters.
The results of the FA (Table 1) identified five (5) factors that define the hydrogeochemical regime and explained 83.3% of the total variance. The first factor (F1) accounted for the 32.8% of total variance and denoted the cumulative effect of groundwater salinization by variable sources. It included (with strong positive loadings) the parameters of EC, Na, Cl, B, and SIhalite; it also included (with medium loadings) the parameters of Mg and SIgypsum, reflecting the impact from irrigation water return flow and the dissolution of evaporitic minerals. It should be noted that higher values of SIs correlate with a greater state of saturation.
The second factor (F2) accounted for the 19.6% of total variance and included: Ca and NO3 with strong positive loadings; K and HCO3 with medium ones; Mg and SIgypsum with weak ones; and pH with a strong negative loading. This factor may possibly interpret the hydrogeochemistry in the recharge areas, where Ca and HCO3 contents are elevated (higher values), and pH (as shown previously) is circumneutral (lower values). This sufficiently explained the antithetic loading. The strong positive loading of nitrates possibly denoted an additional dominant process of nitrate enrichment in these areas. This was possibly due to existence of two additional criteria: the relative oxidizing conditions and the external source of NO3 (e.g., agricultural activities and/or septic tanks); the latter being profoundly supported by the geometry of the aquifer system at that part of the basin, characterized by a phreatic unit of high hydraulic parameters.
The third factor (F3) explained 12.4% of total variance and included (with strong positive loadings) the SIs of calcite and dolomite. It probably denoted the areas which were supersaturated in the above minerals because of the calcareous substrate (limestones and dolostones). The weak correlation with the dominant cations of these formations (r = +0.35 for Ca-SIcalcite, r = +0.45 for Mg-SIdolomite) probably reflected the existence of additional sources for Ca and Mg (e.g., F1 and F2) which masked the direct covariance of these parameters due to impact from limestones and dolostones.
The fourth (F4) factor explained 11.9% of total variance, with strong negative loadings for Mn and NH4 and a medium one for Fe. This factor clearly reflected the local reducing conditions, in which dominance of Fe2+ and Mn2+ prevailed along with ammonium (NH4). These areas were probably affected by the increased organic content that creates reducing conditions and/or the anoxic environments caused by limited groundwater recharge (e.g., semiconfined and/or confined aquifers).
Finally, the fifth (F5) factor explained a minor percentage (6.6%) of total variance and included (with strong and medium positive loadings) the parameters of Cu and Fe, respectively. It probably denoted the occurrence of a weak local sulfide mineralization (e.g., chalcopyrite—CuFeS2 or other) without excluding the potential impact from the use of Cu as a soil conditioner (mainly as a major constituent in several plant protection products, especially for orchards and vineyards).
5.4. Stable Isotopes
With regard to the stable isotopes, the Local Groundwater Isotope regression Line (LGIL) was compiled and plotted, along with the Global Meteoric Water Line (GMWL), Greek MWL and Thessalian MWL—as depicted in Figure 11. Isotope values of δ2H and δ18O were expressed as the difference between the measured ratios of the sample and reference divided by the measured ratio of the reference, which was in turn expressed as VSMOW values (Vienna-standard mean ocean water). The isotopic ratio of δ18O in the study area ranged between −9.8‰ and −6.9‰ with an average value of −8‰. This value almost coincided with the average value recorded from the spring waters of Thessaly (−8.29‰) [60]. Similarly, the isotopic ratio of δ2H ranged between −66.2‰ and −47.5‰ with an average value of −51.3‰ which was almost the same as the average value recorded in Thessaly (−51.1‰), based on the reference. Based on these observations, the isotope composition of groundwater in the Tirnavos subbasin seemed to fit perfectly with the obtained levels from a previous study on the Thessaly region. The function that expressed the LGIL (δ2H = 6.71 × δ18O + 2.09) compared to Thessaly’s MWL (δ2H = 6.48 × δ18O + 1.7) presented a similar slope (6.71 and 6.48) and slightly higher value of the d-excess (2.09 and 1.7). Generally, deuterium excess is primarily controlled by kinetic effects associated with evaporation of water at the surface of the oceans or inland. It increases with an increase in the moisture deficit of oceanic air masses [61]. Differences in d-excess arise because of varying temperature, relative humidity, and wind speed at the sea surface, whereas global atmospheric moisture mainly originates from admixture of recycled continental vapor [19,60]. Hence, the value of d-excess (close to 2) in the study area, compared to the GMWL value (10) could probably be attributed to environmental conditions.
Based on the results of the 18O isotope analyses, a spatial distribution map of groundwater samples was constructed (Figure 12), aiming to facilitate the identification and evolution of the active recharge mechanisms in the Tirnavos alluvial basin in support of hydrochemical and piezometric data analyses. For the construction of this map, the monitoring period of April 2018 was used because of the larger number of available samples.
Due to the influence of altitude and continentality on the isotopic composition of precipitation [64,65]—and based on the recharge mechanisms already identified and substantiated—it would be expected that the most negative values of δ18O were observed along the western part of the basin, where the alluvial aquifer system receives most of its natural recharge in the form of lateral crossflows from the karstic system of Tirnavos. This is the most distant boundary of the alluvial system from the sea, and receives water from direct infiltration of precipitation at altitudes that reach as high as 900 m. Likewise, moving to the downstream parts of the basin, towards the sea, the δ18O values would have been expected to become less negative. From the spatial distribution map (Figure 12), however, this only happened in the NW part of the basin while, as we move to its central and southeastern parts, the values were increasingly negative—with the minimum figure (the most negative value) found at monitoring point LB214, the easternmost of the compiled network.
This created a need for further study of the wider area to the east of the basin, in order to obtain a more satisfactory interpretation of this isotopic spatial distribution. About 18 km NE of monitoring point LB214 (where the δ18O value had the lowest negative value (−9.82‰)) is the Ossa mountain range. The Ossa range rises to 1978 m elevation. Ossa is mainly structured by pre alpine and alpine formations which, geotectonically, are integrated in three units (Figure 12, [66]).
Regarding the tectonics of the area: according to [66], the most important transverse structures resulting from the statistical analysis of the Ossa tectonic elements are illustrated in Figure 12. These are: A, B, C, D, and E (the main fault zones); as well as F, and G (the secondary fault zones). The intense disruption observed along these zones (especially A, B and C, being the main fault zones), in combination with the anticlinal structure of Ossa, was a key factor in the formation of preferential groundwater flow paths to the eastern Thessaly basin (i.e., towards the study area). However, the rate of this recharge (and thus the exact contribution of this mechanism to the balance of the system) is yet to be determined.
The high altitude of Ossa carbonate formations (maximum altitude 1978 m) justified the existence of the lightest 18O isotopes in the wells of the Pinios area in the eastern part of the basin, giving the spatial distribution of δ18O as shown in Figure 12. High negative values of δ18O, close to (−10), indicated water of meteoric origin. Considering the literature [67], for regions of Thessaly with similar characteristics, the composition of the precipitation indicated a recharge altitude greater than 1200 m. Hence, originating from higher elevations of the Ossa mountain, this recharge mound—in the form of lateral crossflows—does explain the observed δ18O spatial distribution anomalies and indeed the apparent anomaly in the spatial distribution of the hydrochemical water types that were earlier discussed.
5.5. Conceptual Model of Groundwater Resources
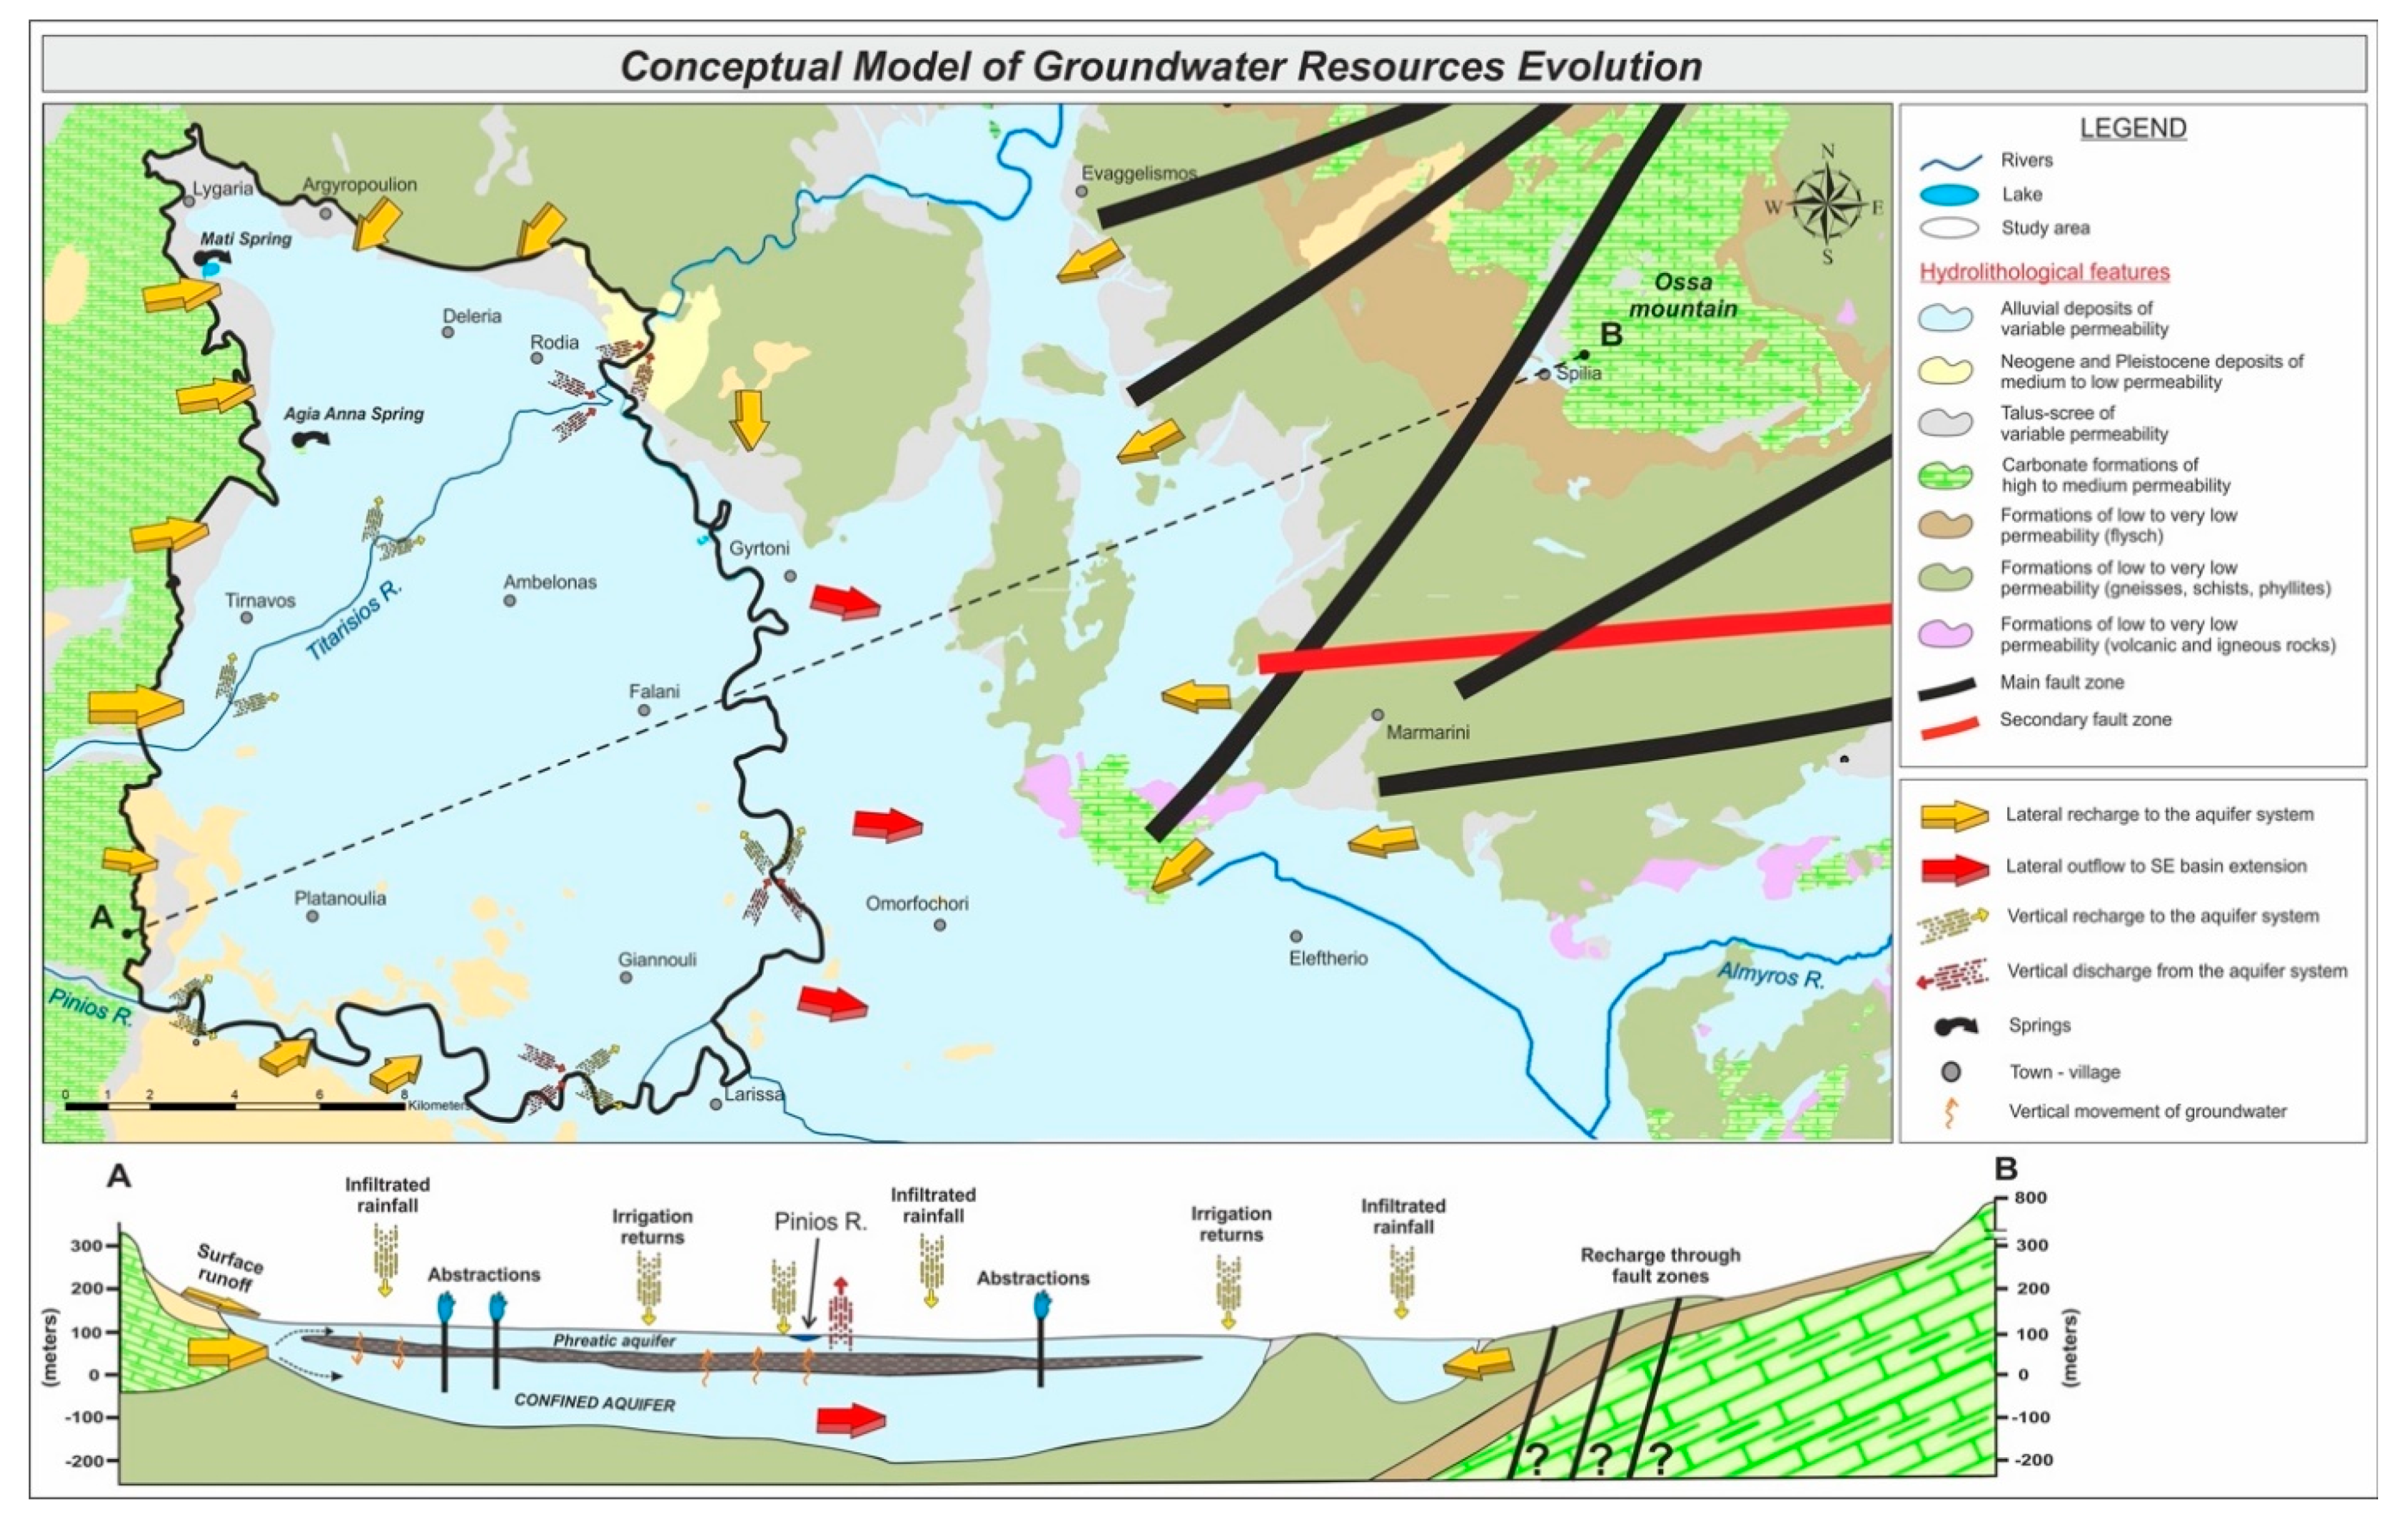
Geometry: The Tirnavos subbasin is the northwesternmost part of the eastern Thessaly basin and is filled by alluvial sediments of varying thickness that reach a maximum of over 550 m towards its central parts [25,31]. The deposition environment progressively turns from fluvial/terrestrial to lacustrine toward the central parts of the basin. A sequence of confining units (which, on a regional scale, could be assumed to form a uniform layer of high clay content,) separated the alluvial sediments in a phreatic aquifer overlain by a thick and high-potential confined aquifer system (Figure 13).
Recharge: Talus cones and scree along the margins of the basin act as a favorable medium for the aquifer system’s recharge, especially the extensive fluvial deposits at the exit of the Titarisios River to the basin. The aquifer system exhibits limited hydraulic interactions with the Titarisios River and the Pinios River. These var spatiotemporally in direction and magnitude [53]. The main recharge mechanism to the aquifer system is the lateral inflow across the western boundary with the karstic system of Tirnavos. Lateral recharge from the karstic massif of Mt Ossa, at the northeastern extent of the eastern Thessaly basin, through preferential flow paths developed along the heavily tectonized and disrupted zones [66], is also a significant recharge source to the system. Deep percolation of precipitation forms a source of recharge to the system, and so do irrigation returns. The latter is of progressively reducing importance as more efficient and less water-consuming irrigation systems are being employed.
Discharge: Numerous production wells operate to cover irrigated agriculture and, to a lesser extent, domestic and industrial demands. These account for the majority of discharge from the aquifer system, which has led to the establishment of negative water budgets and the exhaustion of the phreatic aquifer. Natural discharge occurs in the form of lateral crossflows to the southeastern extension of the eastern Thessaly alluvial basin. Seasonal discharge occurs at temporally variable rates to the Pinios River upstream and the town of Larissa and the confluence of the Titarisios and Pinios Rivers downstream [53].
Flow domain: Dominant groundwater flow direction is from NW to SE, towards the extension of the eastern Thessaly basin. A key hydrodynamic feature in the basin is the development of a depression cone during the irrigation period, at the central parts of the subbasin, as a result of extensive groundwater abstractions. During hydrologically dry years, the depression cone expands and becomes sharper, characterized by higher hydraulic gradients [33]. Over prolonged droughts characterized by increased water demands, outflow to the SE extension of the basin reduces considerably and is even reported to be completely interrupted [25].
Quality characteristics & Land use impact: Excessive abstractions cause considerable groundwater heads decline and distort the spatial distribution and values of hydraulic gradients. Calcium carbonate is the dominant hydrochemical character attributed to the origin of recharge to the aquifer system. Regionally, residence times increase toward the central parts of the basin where ion exchange mechanisms become important, along with reducing redox conditions. Mixing of resident water with leachates of agricultural activity—and possibly leaks of septic tanks and/or domestic effluent treatment plants—does bring in groundwater contamination issues. These predominantly take the form of elevated nutrients and sporadic findings of high Cu concentrations attributable mainly to orchards and cultivars. Small industrial unit activity is also reflected on groundwater quality in the form of elevated EC values.
6. Conclusions
Rational and sustainable management of groundwater resources requires knowledge of the geometric and hydraulic characteristics of the aquifer system that hosts the reserves, as well as a deep understanding of the hydrogeochemical and hydrodynamic mechanisms that control their evolution. This is even more true in cases of complex geotectonic environments, under intensive and prolonged exploitative conditions—especially within the climate change framework.
The alluvial system of the Tirnavos subbasin has a long record of exploitation, dating to the early 1970s, in support of the development of the region through irrigated agriculture. Anthropogenic activities have had a profound impact in shaping up groundwater reserves’ availability and groundwater quality. Even though the Tirnavos subbasin is among the oldest and best-studied basins in Greece, this paper brings up new insights into its hydrodynamic evolution and controlling mechanisms. This enlightens and explains hydrogeochemical signatures and hydrodynamic behaviors which have been noticed in the past but disregarded.
The exercise performed in this research—characterizing and assessing the groundwater resources of the Tirnavos alluvial subbasin—consisted of a comprehensive overview of a suite of methodologies and approaches that acted complementarily to each other, leading to a clear and well-justified overview of flow and hydrochemical evolution mechanisms. Evidently, no single method is able to provide comprehensive, reliable answers or fully explain the observed spatiotemporal distribution of data. In this work, we have successfully made conjunctive use of hydrogeochemical, hydrodynamic, geological, structural, geotectonic and isotopic data—all analyzed in their spatiotemporal distribution, assessed in statistical indices, and evaluated in hydrogeochemical indices and tri-linear diagrams.
The key outcome of the present paper is the development of an integrated conceptual model for groundwater resource evolution, through the application of a specific methodological framework. This framework may be used globally as a generic model in other cases addressing similar scientific quests. The main findings of the research which compose this conceptual model, are briefly described below:
- -
- The dominant ions (Ca2+ and HCO3−) of groundwater were indicative for the main recharge mechanisms—which were related to the karstic substrate.
- -
- The recharge areas were delineated with the joint use of variable tools and concluded in two major axes in an E–W direction. The western direction was related to the recharge from the karstic system of Titarisios and the eastern one was related to the recharge through preferential flow paths from the karstic massif of Mt. Ossa.
- -
- The prevalence of carbonate formations was also reflected in the dominant hydrochemical type (Ca-Mg-HCO3) which also encompassed the Mg content from relevant Mg-rich carbonate formations (dolostones).
- -
- Groundwater quality in the Tirnavos subbasin was in a generally good state, with few exceptions (elevated values of NO3 and Cu) which indicate local impact due to anthropogenic activities.
- -
- Nitrates can be considered the main adverse environmental aspect, occurring locally in hot spots at the area, due to irrational agricultural activities.
- -
- The groundwater quality was also impacted by salinization due to the combined use of irrigation water returns (agricultural leachates) and evaporitic mineral leaching.
- -
- The governing hydrogeochemical process identified was ion exchange, which progressively alters the chemical composition of groundwater from west to east.
- -
- A secondary process which seems to affect hydrogeochemistry was redox, which locally controls speciation of groundwater solute parameters.
- -
- The physicochemical evolution mechanisms were jointly assessed and verified by the hydrochemical sections of major ions and saturation indices of critical mineralogical phases.
Even though the presented work sheds light on—and further proves the existence of—several major controlling evolution mechanisms, there is still room for further elaboration and in-depth analysis. This is important to capture potential alterations in the significance each identified mechanism might have on the system’s evolution because of ongoing continuous changes in land and water use—and in the framework of climate change. Moreover, overexploitation of the phreatic aquifer—to the point of depletion and destruction or abandonment of shallow wells and boreholes—makes it imperative to seek out replacements for functional and aquifer unit-specific monitoring points, to ensure accurate, representative, and meaningful measurements are made. Moreover, the authors of the presented work propose further detailed analyses of redox processes and status. This will bring added value and knowledge and help to further decipher details of the controlling factors that shape the established hydrogeochemical signatures captured in the analyzed water samples.
Author Contributions
I.V. conceived the methodological approach, performed the data processing and supervised the drafting and revision of the final text. E.T., A.P. and G.S. participated in data processing, verified and optimized the methodology, contributed to the discussion parts, and revised the final text. All authors have read and agreed to the published version of the manuscript.
Funding
This research received no external funding.
Institutional Review Board Statement
Not applicable.
Informed Consent Statement
Not applicable.
Data Availability Statement
Data is contained within the article.
Acknowledgments
The authors wish to acknowledge the valuable contribution of Hydrology Laboratory of Lubeck Technical University in analyzing the collected samples for isotopes—and especially C. Kuells for offering valuable guidance in the assessment of the results. This work was supported by the SWRI infrastructure, with the aid of which sampling and analysis of the collected samples was made possible. Special thanks are due to the laboratory staff of the Institute that performed the presented determinations. Last but not least, the technical and administrative staff of the Local Irrigation Organizations of Tirnavos, Ampelona and Agia Sofia are acknowledged for their support and guidance in the conducted sampling campaigns.
Conflicts of Interest
The authors declare no conflict of interest.
Appendix A

Table A1.
Basic descriptive statistics of analyzed samples.
| pH | EC (μS/cm) | K (mg/L) | Na (mg/L) | Ca (mg/L) | Mg (mg/L) | Tot. Hardness (mg CaCO3/L) | Cl (mg/L) | HCO3 (mg/L) | CO3 (mg/L) | SO4 (mg/L) | |
| MIN | 6.92 | 253.00 | 0.40 | 6.86 | 14.66 | 8.10 | 69.96 | 4.77 | 118.81 | 0.00 | 0.11 |
| MAX | 7.96 | 1821.00 | 7.21 | 286.69 | 120.15 | 52.98 | 436.05 | 88.62 | 453.87 | 0.00 | 604.34 |
| MEDIAN | 7.59 | 473.04 | 1.68 | 13.60 | 67.69 | 16.67 | 234.53 | 10.82 | 238.37 | 0.00 | 12.21 |
| STDEV | 0.21 | 246.39 | 1.11 | 44.50 | 23.27 | 10.84 | 83.51 | 14.06 | 64.37 | 0.00 | 99.21 |
| NO3 (mg/L) | NH4 (mg/L) | B (mg/L) | Cu (μg/L) | Fe (μg/L) | Mn (μg/L) | Pb (μg/L) | Cd (μg/L) | As (μg/L) | SAR | TDS | |
| MIN | 0.22 | 0.01 | 0.00 | 0.00 | 0.81 | 0.07 | 0.00 | 0.00 | 0.00 | 0.20 | 216.00 |
| MAX | 145.37 | 5.76 | 1.25 | 24.22 | 100.85 | 150.83 | 3.12 | 0.13 | 4.22 | 6.76 | 1374.87 |
| MEDIAN | 19.08 | 0.12 | 0.02 | 1.65 | 22.26 | 1.27 | 0.08 | 0.04 | 1.62 | 0.39 | 390.39 |
| STDEV | 27.89 | 0.98 | 0.23 | 5.14 | 17.70 | 28.32 | 0.72 | 0.03 | 1.06 | 1.19 | 187.85 |
References
- Tziritis, E.P.; Datta, P.S.; Barzegar, R. Characterization and assessment of groundwater resources in a complex hydrological basin of central Greece (Kopaida basin) with the joint use of hydrogeochemical analysis, multivariate statistics and stable isotopes. Aquat. Geochem. 2017, 23, 271–298. [Google Scholar] [CrossRef]
- Kim, Y.; Lee, K.S.; Koh, D.C.; Lee, D.H.; Lee, S.G.; Park, W.B.; Woo, N.C. Hydrogeochemical and isotopic evidence of groundwater salinization in a coastal aquifer: A case study in Jeju volcanic island, Korea. J. Hydrol. 2003, 270, 282–294. [Google Scholar] [CrossRef]
- Barzegar, R.; Moghaddam, A.A.; Tziritis, E.; Fakhri, M.S.; Soltani, S. Identification of hydrogeochemical processes and pollution sources of groundwater resources in the Marand plain, northwest of Iran. Environ. Earth Sci. 2017, 76, 297. [Google Scholar] [CrossRef]
- Iqbal, J.; Nazzal, Y.; Howari, F.; Xavier, C.; Yousef, A. Hydrochemical processes determining the groundwater quality for irrigation use in an arid environment: The case of Liwa Aquifer, Abu Dhabi, United Arab Emirates. Groundw. Sustain. Dev. 2018, 7, 212–219. [Google Scholar] [CrossRef]
- Wang, Z.; Torres, M.; Paudel, P.; Hu, L.; Yang, G.; Chu, X. Assessing the Karst Groundwater Quality and Hydrogeochemical Characteristics of a Prominent Dolomite Aquifer in Guizhou, China. Water 2020, 12, 2584. [Google Scholar] [CrossRef]
- Zancanaro, E.; Teatini, P.; Scudiero, E.; Morari, F. Identification of the Origins of Vadose-Zone Salinity on an Agricultural Site in the Venice Coastland by Ionic Molar Ratio Analysis. Water 2020, 12, 3363. [Google Scholar] [CrossRef]
- Domingo-Pinillos, J.C.; Senent-Aparicio, J.; García-Aróstegui, J.L.; Baudron, P. Long term hydrodynamic effects in a semi-arid Mediterranean multilayer aquifer: Campo de Cartagena in south-eastern Spain. Water 2018, 10, 1320. [Google Scholar] [CrossRef] [Green Version]
- Li, M.; Liang, X.; Xiao, C.; Cao, Y.; Hu, S. Hydrochemical Evolution of Groundwater in a Typical Semi-Arid Groundwater Storage Basin Using a Zoning Model. Water 2019, 11, 1334. [Google Scholar] [CrossRef] [Green Version]
- Cao, F.; Jaunat, J.; Vergnaud-Ayraud, V.; Devau, N.; Labasque, T.; Guillou, A.; Ollivier, P. Heterogeneous behaviour of unconfined Chalk aquifers infer from combination of groundwater residence time, hydrochemistry and hydrodynamic tools. J. Hydrol. 2020, 581, 124433. [Google Scholar] [CrossRef]
- Murgulet, D.; Murgulet, V.; Spalt, N.; Douglas, A.; Hay, R.G. Impact of hydrological alterations on river-groundwater exchange and water quality in a semi-arid area: Nueces River, Texas. Sci. Total Environ. 2016, 572, 595–607. [Google Scholar] [CrossRef] [PubMed]
- Barbieri, M.; Nigro, A.; Petitta, M. Groundwater mixing in the discharge area of San Vittorino Plain (Central Italy): Geochemical characterization and implication for drinking uses. Environ. Earth Sci. 2017, 76, 393. [Google Scholar] [CrossRef]
- Maest, A.; Prucha, R.; Wobus, C. Hydrologic and Water Quality Modeling of the Pebble Mine Project Pit Lake and Downstream Environment after Mine Closure. Minerals 2020, 10, 727. [Google Scholar] [CrossRef]
- Güler, C.; Kurt, M.A.; Alpaslan, M.; Akbulut, C. Assessment of the impact of anthropogenic activities on the groundwater hydrology and chemistry in Tarsus coastal plain (Mersin, SE Turkey) using fuzzy clustering, multivariate statistics and GIS techniques. J. Hydrol. 2012, 414, 435–451. [Google Scholar] [CrossRef]
- Voutsis, N.; Kelepertzis, E.; Tziritis, E.; Kelepertsis, A. Assessing the hydrogeochemistry of groundwaters in ophiolite areas of Euboea Island, Greece, using multivariate statistical methods. J. Geochem. Explor. 2015, 159, 79–92. [Google Scholar] [CrossRef]
- Barzegar, R.; Moghaddam, A.A.; Tziritis, E. Assessing the hydrogeochemistry and water quality of the Aji-Chay River, northwest of Iran. Environ. Earth Sci. 2016, 75, 1486. [Google Scholar] [CrossRef]
- Celestino, A.E.M.; Ramos-Leal, J.; Cruz, D.A.M.; Tuxpan, J.; Bashulto, J.D.L.; Ramírez, J.M. Identification of the hydrogeochemical processes and assessment of groundwater quality, using multivariate statistical approaches and water quality index in a wastewater irrigated region. Water 2019, 11, 1702. [Google Scholar] [CrossRef] [Green Version]
- Walter, J.; Chesnaux, R.; Gaboury, D.; Cloutier, V. Subsampling of Regional-Scale Database for improving Multivariate Analysis Interpretation of Groundwater Chemical Evolution and Ion Sources. Geosciences 2019, 9, 139. [Google Scholar] [CrossRef] [Green Version]
- Chai, Y.; Xiao, C.; Li, M.; Liang, X. Hydrogeochemical Characteristics and Groundwater Quality Evaluation Based on Multivariate Statistical Analysis. Water 2020, 12, 2792. [Google Scholar] [CrossRef]
- Tziritis, E. Stable isotope study of a karstic aquifer in Central Greece. Composition, variations and controlling factors. In Advances in the Research of Aquatic Environment; Springer: Berlin/Heidelberg, Germany, 2011; pp. 193–200. [Google Scholar] [CrossRef]
- Joshi, S.K.; Rai, S.P.; Sinha, R.; Gupta, S.; Densmore, A.L.; Rawat, Y.S.; Shekhar, S. Tracing groundwater recharge sources in the northwestern Indian alluvial aquifer using water isotopes (δ18O, δ2H and 3H). J. Hydrol. 2018, 559, 835–847. [Google Scholar] [CrossRef]
- Liu, F.; Wang, S.; Wang, L.; Shi, L.; Song, X.; Yeh, T.C.J.; Zhen, P. Coupling hydrochemistry and stable isotopes to identify the major factors affecting groundwater geochemical evolution in the Heilongdong Spring Basin, North China. J. Geochem. Explor. 2019, 205, 106352. [Google Scholar] [CrossRef]
- Zamora, H.A.; Eastoe, C.J.; Wilder, B.T.; McIntosh, J.C.; Meixner, T.; Flessa, K.W. Groundwater Isotopes in the Sonoyta River Watershed, USA-Mexico: Implications for Recharge Sources and Management of the Quitobaquito Springs. Water 2020, 12, 3307. [Google Scholar] [CrossRef]
- Wu, C.; Wu, X.; Mu, W.; Zhu, G. Using Isotopes (H, O, and Sr) and Major Ions to Identify Hydrogeochemical Characteristics of Groundwater in the Hongjiannao Lake Basin, Northwest China. Water 2020, 12, 1467. [Google Scholar] [CrossRef]
- Panagopoulos, A.; Arampatzis, G.; Tziritis, E.; Pisinaras, V.; Herrmann, F.; Kunkel, R.; Wendland, F. Assessment of climate change impact in the hydrological regime of River Pinios Basin, central Greece. Desalination Water Treat. 2016, 57, 2256–2267. [Google Scholar] [CrossRef]
- Alexandridis, T.; Panagopoulos, A.; Galanis, G.; Alexiou, I.; Cherif, I.; Chemin, Y.; Stavrinos, E.; Bilas, G.; Zalidis, G. Combining remotely sensed surface energy fluxes and GIS analysis of groundwater parameters for irrigation assessment. Irrig. Sci. 2014, 32, 127–140. [Google Scholar] [CrossRef]
- Vrouhakis, I.; Panagopoulos, A.; Stamatis, G. Current quality and quantity status of Tirnavos sub-basin water system—Central Greece. In Proceedings of the 11th International Hydrogeological Congress of the Greece, Athens, Greece, 4–6 October 2017. [Google Scholar]
- Plastiras, V. Geological Map of Greece, Larissa Sheet; Institute of Geology and Mineral Exploitation: Athens, Greece, 1982. [Google Scholar]
- Miggiros, G. Geological Map of Greece, Gonnoi Sheet; Institute of Geology and Mineral Exploitation: Athens, Greece, 1980. [Google Scholar]
- Panagopoulos, A. A methodology for groundwater resources management of a typical alluvial aquifer system in Greece. Ph.D. Thesis, School of Earth Sciences, Faculty of Science, University of Birmingham, Birmingham, UK, 1995. [Google Scholar]
- Vrouhakis, I.; Tziritis, E.; Panagopoulos, A.; Kulls, C.; Stamatis, G. The use of environmental stable isotopes at the Tirnavos alluvial basin (Central Greece). In Proceedings of the 15th International Congress of the Geological Society of Greece, Athens, Greece, 22–24 May 2019. [Google Scholar]
- Demitrack, A. The Late Quaternary Geologic History of the Larissa Plain, Thessaly, Greece: Tectonic, Climatic, and Human Impact on the Landscape. Ph.D. Thesis, Stanford University, Stanford, UK, 1986. (Unpublished). [Google Scholar]
- Aggarwal, P.K.; Araguas, L.; Garner, W.A.; Groeninig, M.; Kulkarni, K. Introduction to Water Sampling Analysis for Isotope Hydrology. Water Resources Programme-IAEA. Available online: www-naweb.iaea.org/napc/ih/documents/other/Sampling%20booklet%20web.pdf (accessed on 1 December 2009).
- Ministry of the Environment Energy and Climate Change. Development of river Basin Management Plans for the Water District of Thessalia, Epirus, Western Sterea Ellada, in Accordance with the Directive 2000/60/EC, the Law 3199/2003 and the P.D. 51/2007; Special Secretariat for Water: Athens, Greece, 2014.
- Burdon, D.; Mazloum, S. Some Chemical Types of Ground-Water from Syria; David, J.B., Soubhi, M., Eds.; UNESCO: Paris, France, 1958. [Google Scholar]
- Piper, A.M. A graphic procedure in the geochemical interpretation of water-analyses. Trans. Am. Geophys. Union 1944, 25, 914–928. [Google Scholar] [CrossRef]
- Lloyd, J.; Heathcote, J. Natural Inorganic Hydrochemistry in Relation to Ground Water; Oxford Science Publications: Oxford, UK, 1985. [Google Scholar]
- Ravikumar, P.; Somashekar, R.K.; Prakash, K.L. A comparative study on usage of Durov and Piper diagrams to interpret hydrochemical processes in groundwater from SRLIS river basin, Karnataka, India. Elixir Int. J. 2015, 80, 31073–31077. [Google Scholar]
- Shyu, G.S.; Cheng, B.Y.; Chiang, C.T.; Yao, P.H.; Chang, T.K. Applying factor analysis combined with kriging and information entropy theory for mapping and evaluating the stability of groundwater quality variation in Taiwan. Int. J. Environ. Res. Public Health 2011, 8, 1084–1109. [Google Scholar] [CrossRef] [PubMed]
- Liu, C.W.; Lin, K.H.; Kuo, Y.M. Application of factor analysis in the assessment of groundwater quality in a blackfoot disease area in Taiwan. Sci. Total Environ. 2003, 313, 77–89. [Google Scholar] [CrossRef]
- Panda, U.C.; Sundaray, S.K.; Rath, P.; Nayak, B.B.; Bhatta, D. Application of factor and cluster analysis for characterization of river and estuarine water systems–a case study: Mahanadi River (India). J. Hydrol. 2006, 331, 434–445. [Google Scholar] [CrossRef]
- Tziritis, E.P. Environmental monitoring of Micro Prespa Lake basin (Western Macedonia, Greece): Hydrogeochemical characteristics of water resources and quality trends. Environ. Monit. Assess. 2014, 186, 4553–4568. [Google Scholar] [CrossRef] [PubMed]
- Kaiser, H.F. The application of electronic computers to factor analysis. Educ. Psychol. Meas. 1960, 20, 141–151. [Google Scholar] [CrossRef]
- Reimann, C.; Filzmoser, P.; Garrett, R.; Dutter, R. Statistical Data Analysis Explained: Applied Environmental Statistics with R.; John Wiley & Sons: Hoboken, NJ, USA, 2011. [Google Scholar]
- Parkhurst, D.L.; Appelo, C.A.J. PHREEQC2 User’s Manual and Program; Water-Resources Investigations Report; US Geological Survey: Denver, CO, USA, 2004.
- Ministry of Environment; Energy and Climate Change; Special Secretariat for Water. River Basin Management Plan of Thessaly Water District (GR08). In Analysis of Anthropogenic Pressures and Their Impact on Surface Water Systems and Aquifer Systems; Special Secretariat for Water: Athens, Greece, 2014. [Google Scholar]
- Sharma, L.; Greskowiak, J.; Ray, C.; Eckert, P.; Prommer, H. Elucidating temperature effects on seasonal variations of biogeochemical turnover rates during riverbank filtration. J. Hydrol. 2012, 428, 104–115. [Google Scholar] [CrossRef]
- Menberg, K.; Blum, P.; Kurylyk, B.L.; Bayer, P. Observed groundwater temperature response to recent climate change. Hydrol. Earth Syst. Sci. 2014. [Google Scholar] [CrossRef] [Green Version]
- Taniguchi, M. Analysing the long term reduction in groundwater temperature due to pun pumping. Hydrol. Sci. J. 1995, 40, 407–421. [Google Scholar] [CrossRef]
- Panagopoulos, A.; Kassapi, K.A.; Arampatzis, G.; Perleros, B.; Drakopoulou, S.; Tziritis, E.; Chrysafi, A.; Vrouhakis, I. Assessment of chemical and quantitative status of groundwater systems in Pinios hydrological basin-Greece. In Proceedings of the XI Int. Conference Protection and Restoration of the Environment, Thessaloniki, Greece, 3–6 July 2012. [Google Scholar]
- Directive 98/83/EC of 3 November 1998 on the Quality of Water Intended for Human Consumption. Available online: https://eur-lex.europa.eu/legal-content/EN/TXT/?uri=CELEX%3A31998L0083 (accessed on 19 March 2019).
- World Health Organization (WHO). Guidelines for Drinking Water Quality, 2nd ed.; Health Criteria and Other Supporting Information; World Health Organization (WHO): Vienna, Austria, 1996; Volume 2. [Google Scholar]
- Al-Bassam, A.M.; Khalil, A.R. DurovPwin: A new version to plot the expanded Durov diagram for hydro-chemical data analysis. Comput. Geosci. 2012, 42, 1–6. [Google Scholar] [CrossRef]
- Panagopoulos, A.; Lloyd, J.; Fitzsimons, V. Groundwater evolution of the Tirnavos alluvial basin, central Greece, as indicated by hydrochemistry. In Proceedings of the 3rd Hydrogeological Conference of the Hellenic Chapter of IAH, Heraklion, Greece, 3–5 November 1995. [Google Scholar]
- Appelo, C.A.J.; Postma, D. Geochemistry, Groundwater and Pollution; CRC Press: Boca Raton, FL, USA, 2004. [Google Scholar]
- Boghici, R.; Van Broekhoven, N.G. Hydrogeology of the Rustler Aquifer, Trans-Pecos, Texas; in Aquifers of West Texas. Tex. Water Dev. Board Rep. 2001, 356, 207–225. [Google Scholar]
- Jalali, M. Hydrochemical characteristics and sodification of groundwater in the Shirin Sou, Hamedan, Western Iran. Nat. Resour. Res. 2012, 21, 61–73. [Google Scholar] [CrossRef]
- Jalali, M. Major ion chemistry of groundwaters in the Bahar area, Hamadan, western Iran. Environ. Geol. 2005, 47, 763–772. [Google Scholar] [CrossRef]
- Esmaeili-Vardanjani, M.; Rasa, I.; Amiri, V.; Yazdi, M.; Pazand, K. Evaluation of groundwater quality and assessment of scaling potential and corrosiveness of water samples in Kadkan aquifer, Khorasan-e-Razavi Province, Iran. Environ. Monit. Assess. 2015, 187, 53. [Google Scholar] [CrossRef] [PubMed]
- Kalantary, N.; Rahimi, M.; Charchi, A. Use of composite diagram, factor analyses and saturation index for quantification of Zaviercherry and Kheran plain groundwaters. J. Eng. Geol. 2007, 2, 339–356. [Google Scholar]
- Dotsika, E.; Lykoudis, S.; Poutoukis, D. Spatial distribution of the isotopic composition of precipitation and spring water in Greece. Glob. Planet. Chang. 2010, 71, 141–149. [Google Scholar] [CrossRef]
- Sharp, Z. Stable Isotope Geochemistry; Pearson Education; Prentice Hall: New York, NY, USA, 2007; p. 344. [Google Scholar]
- Craig, H. Isotopic variations in meteoric waters. Science 1961, 133, 1702–1703. [Google Scholar] [CrossRef] [PubMed]
- Argiriou, A.A.; Lykoudis, S. Isotopic composition of precipitation in Greece. J. Hydrol. 2006, 327, 486–495. [Google Scholar] [CrossRef]
- Clark, I.D.; Fritz, P. Environmental Isotopes in Hydro-Geology; CRC Press: New York, NY, USA, 1997. [Google Scholar]
- Matiatos, I. Hydrogeological and Isotopic Investigations at Regions of the Argolis Peninsula. Ph.D. Thesis, National and Kapodistrian University of Athens, Athens, Greece, 2010. [Google Scholar]
- Stamatis, G.; Miggiros, G. The relationship between fractured tectonic and groundwater reservoir of massive formations of Ossa Mountain (E. Thessaly, Greece). Bull. Geol. Soc. Greece 2004, 36, 2077–2086. [Google Scholar] [CrossRef]
- Payne, B.; Dimitroula, C.; Leondiadis, I.; Kallergis, G. Environmental Isotope Data in the Western Thessaly Valley, Greece: Use of Mathematical Model for Quantitative Evaluations with Tritium; Bulletin of the Geological Society of Greece: Athens, Greece, 1976. [Google Scholar]
Figure 1.
Location map of the study area and geomorphological illustration of the wider region.

Figure 2.
Geological map and conceptualized cross section of the study area, based on [27,28] and [29], respectively.

Figure 3.
Methodological workflow for the development of groundwater resources conceptual model.
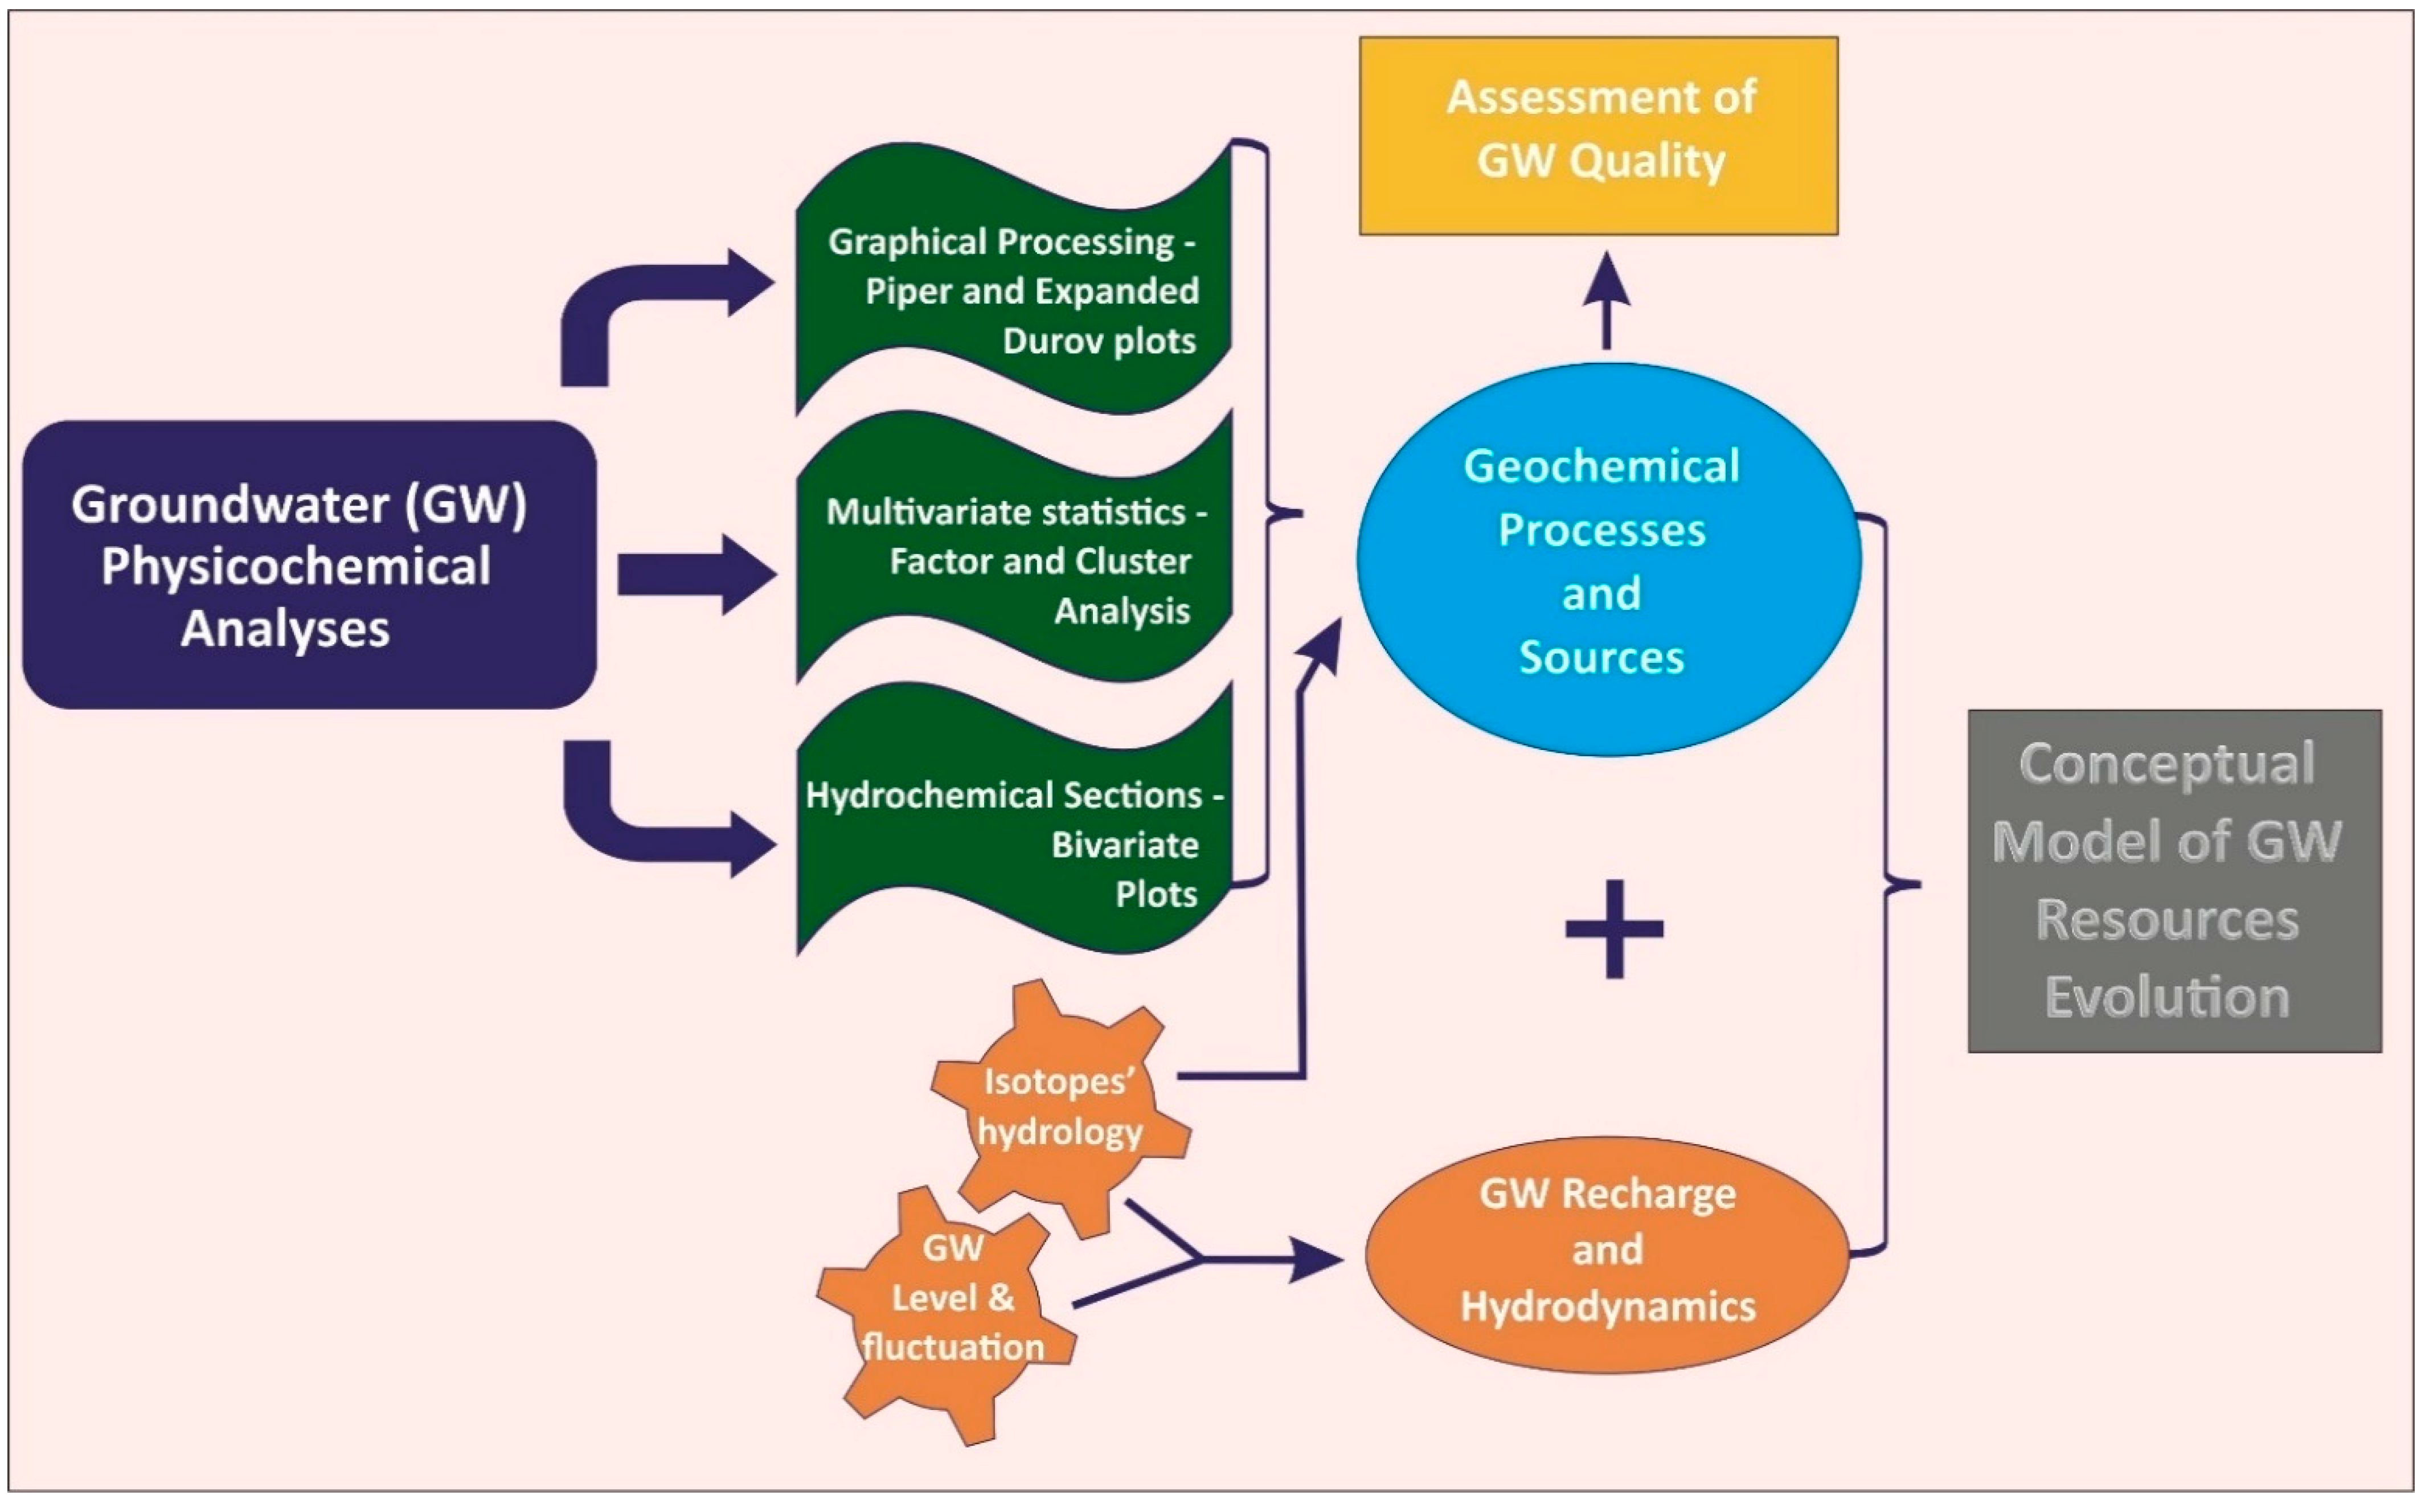
Figure 4.
Monitoring network, piezometric curves and dominant flow lines for: (a) April 2017; and (b) September 2017 (Hydrolithology map based on [33]).
Figure 4.
Monitoring network, piezometric curves and dominant flow lines for: (a) April 2017; and (b) September 2017 (Hydrolithology map based on [33]).
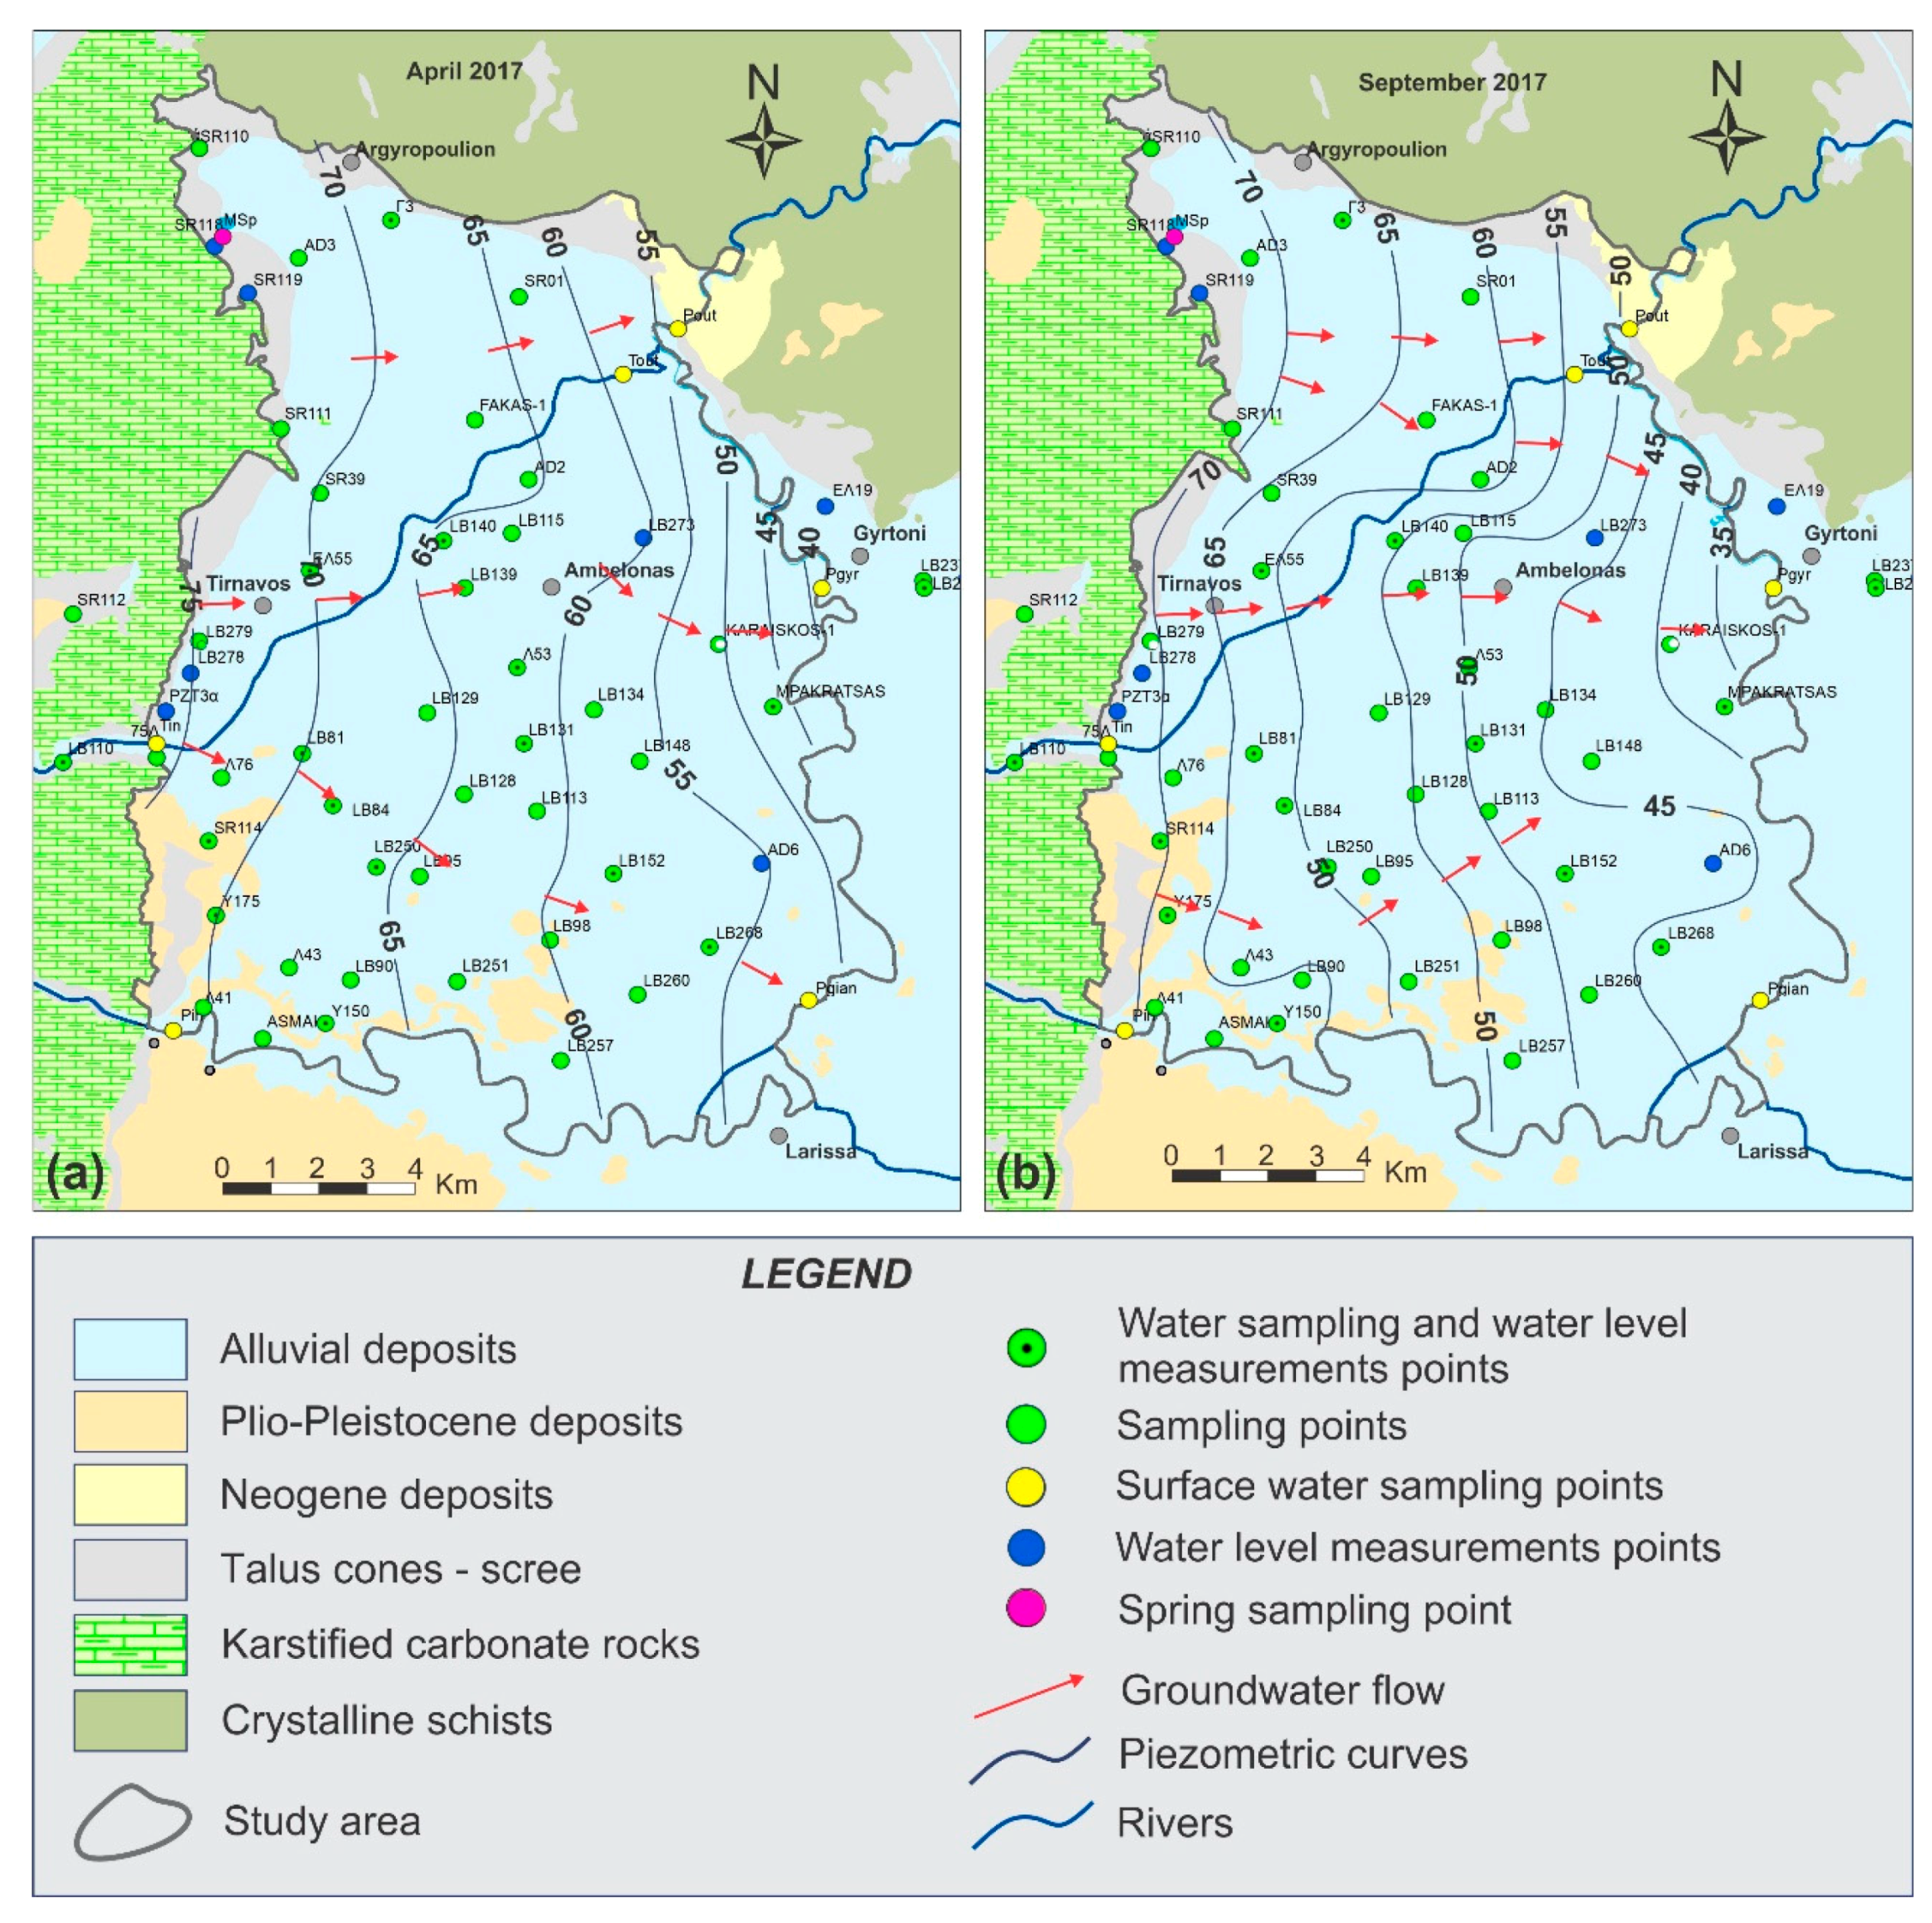
Figure 5.
Spatial distribution of physicochemical parameters at the study area: (a) electrical conductivity (μS/cm); (b) water temperature (°C); (c) dissolved oxygen (mg/L); (d) pH.
Figure 5.
Spatial distribution of physicochemical parameters at the study area: (a) electrical conductivity (μS/cm); (b) water temperature (°C); (c) dissolved oxygen (mg/L); (d) pH.

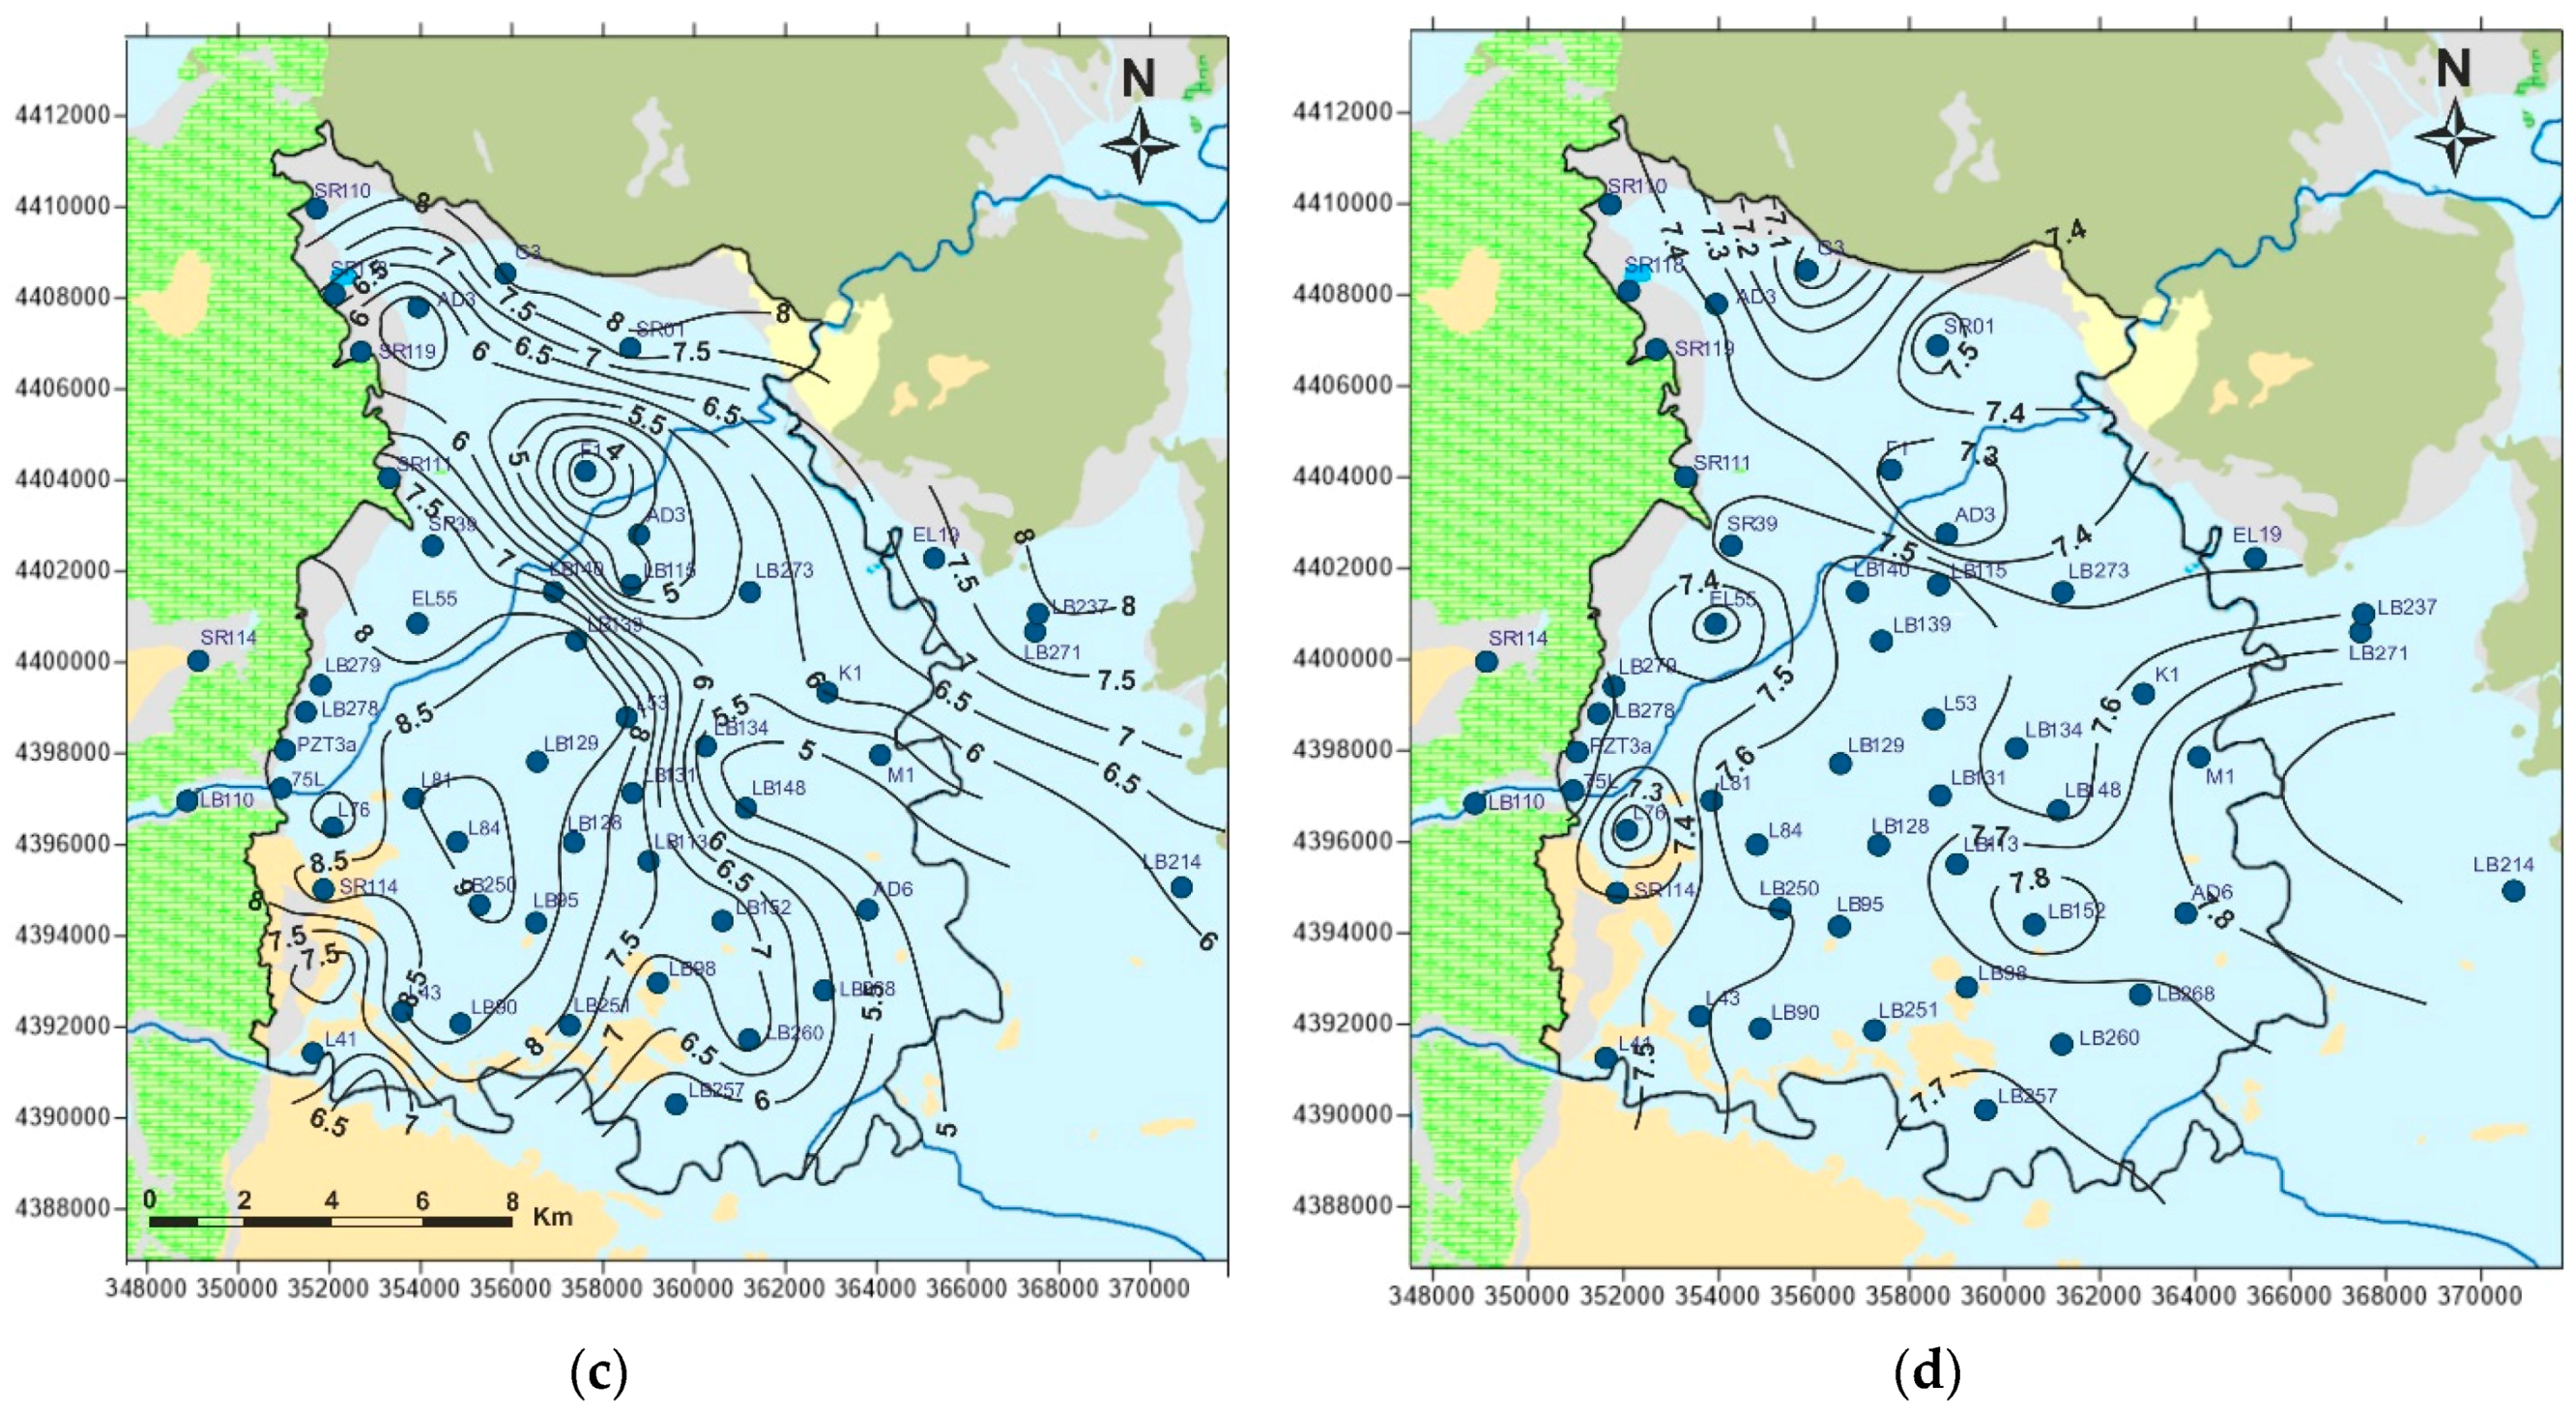
Figure 6.
Expanded Durov plot illustrating the hydrogeochemical processes [36] and their spatial distribution in the study area.
Figure 6.
Expanded Durov plot illustrating the hydrogeochemical processes [36] and their spatial distribution in the study area.
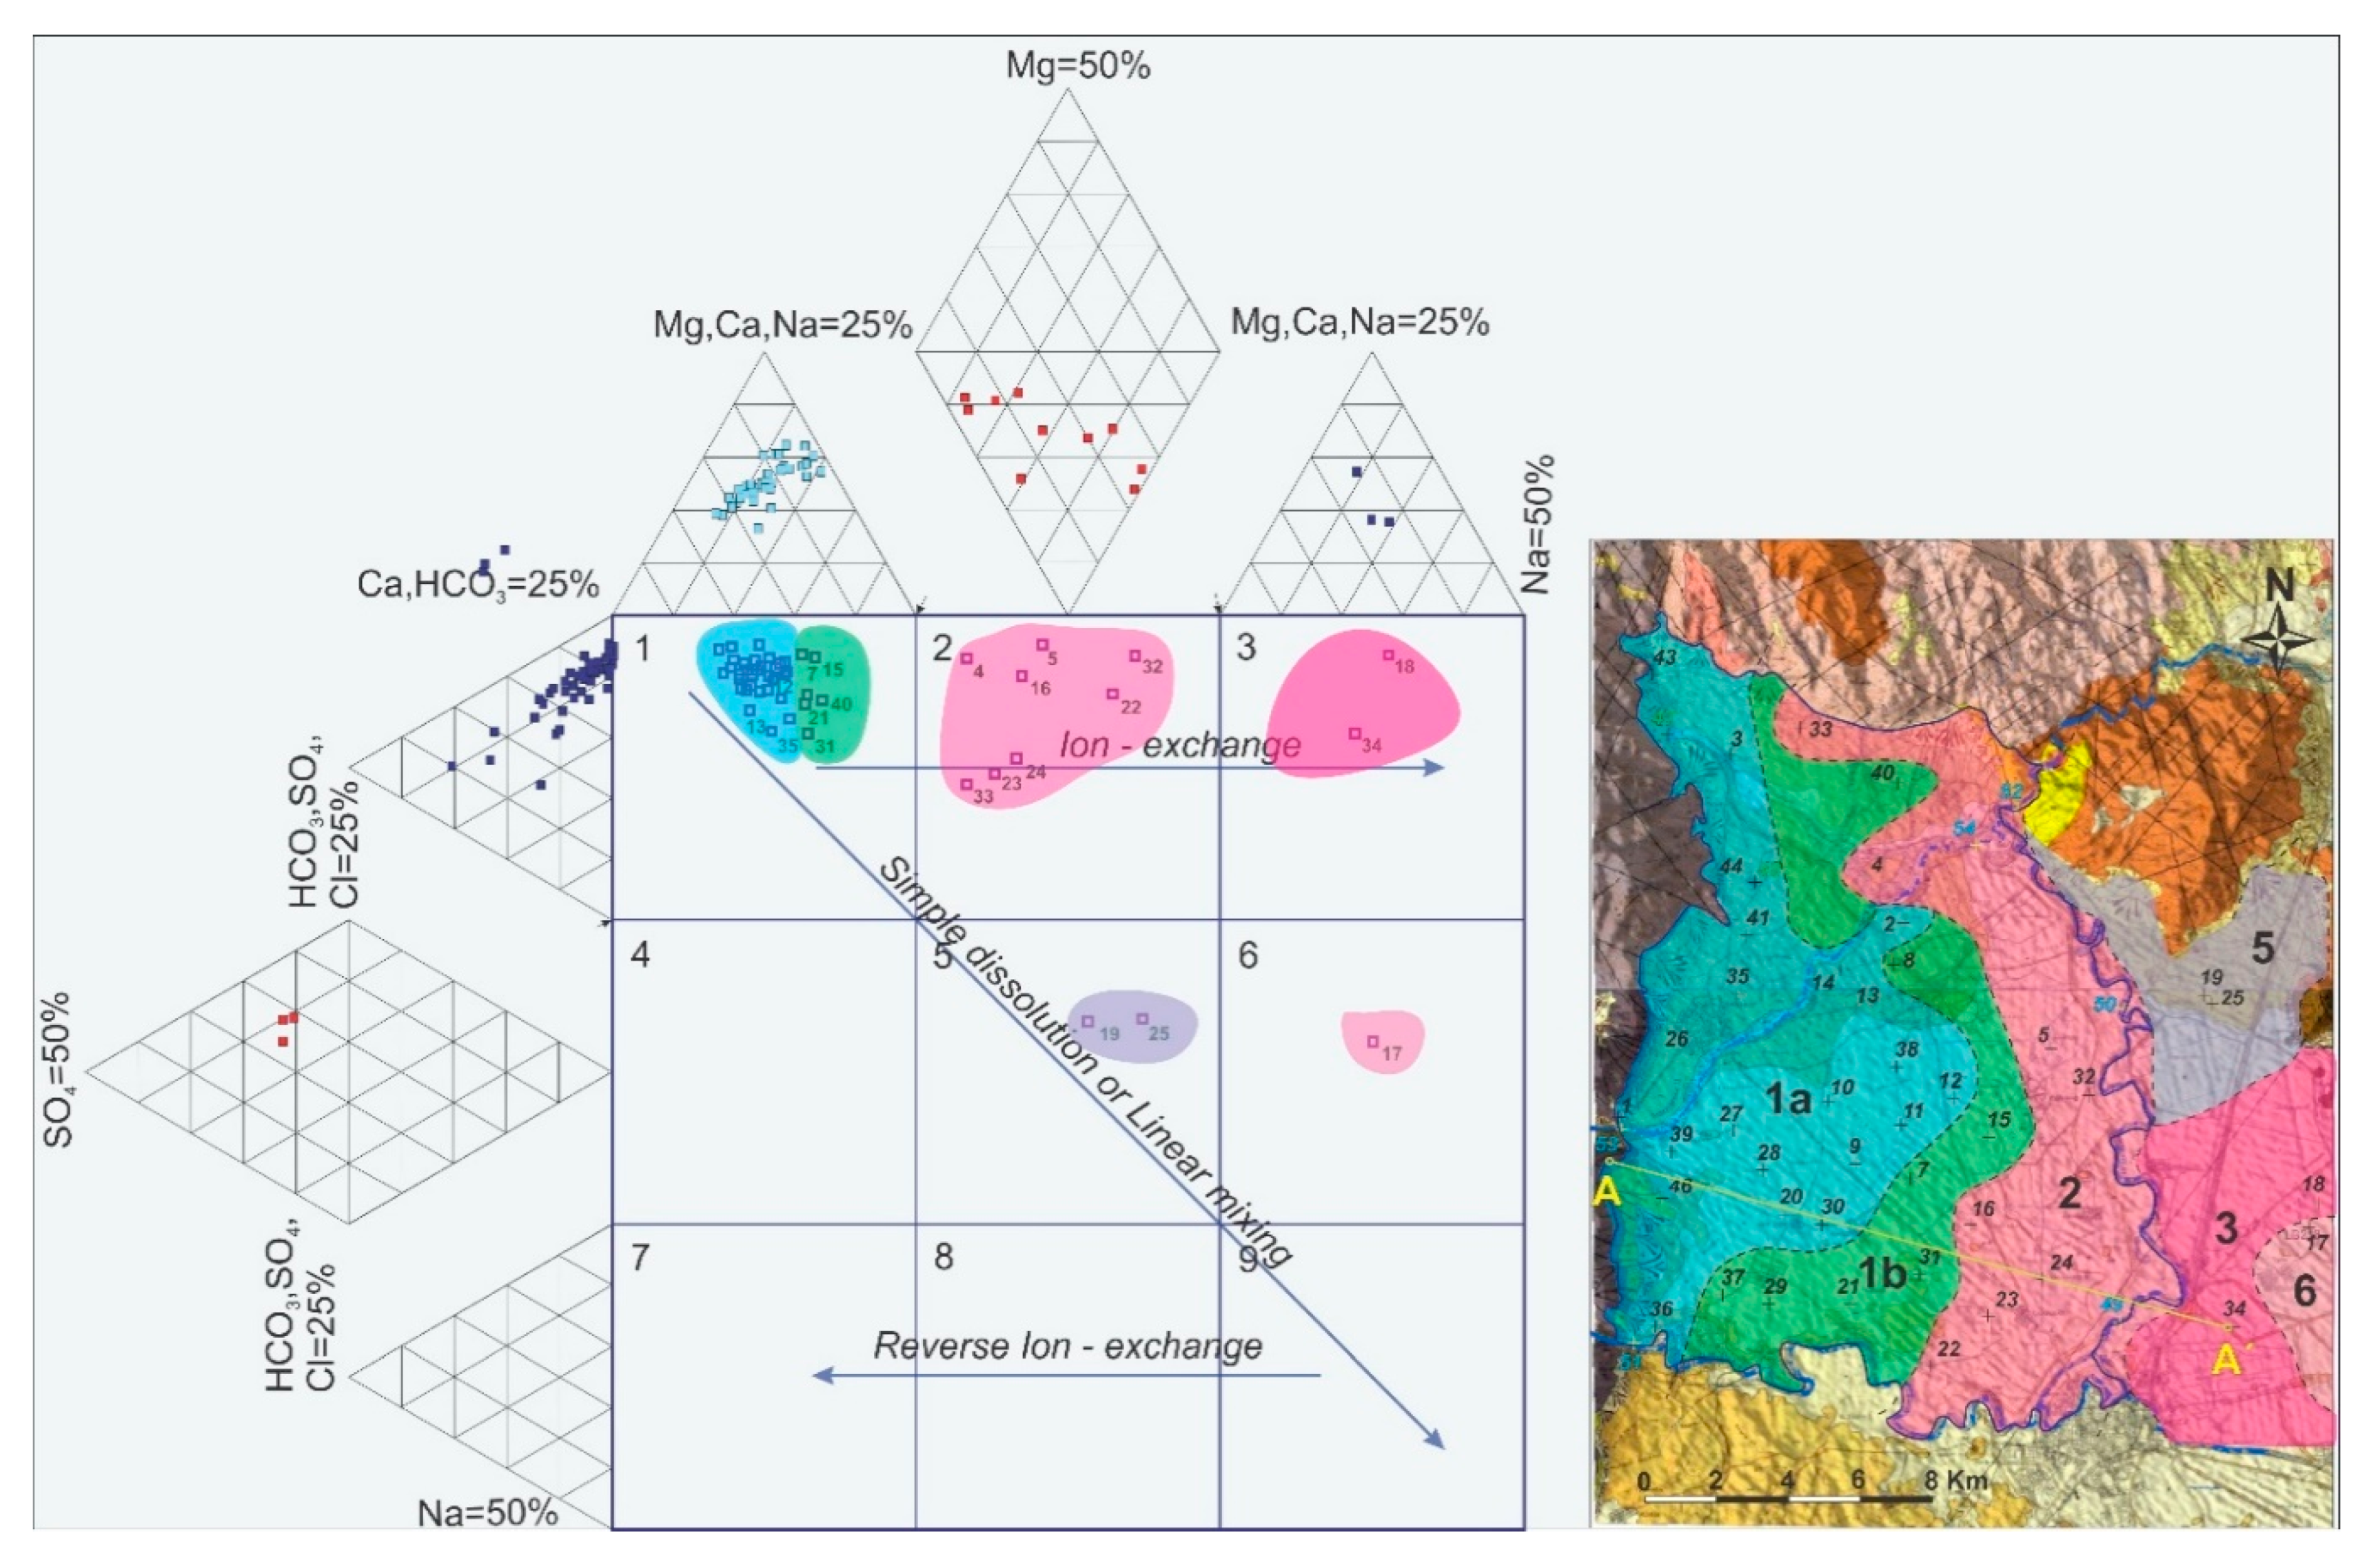
Figure 7.
Variations in the concentration/values of major anions and physicochemical parameters along the groundwater flow.
Figure 7.
Variations in the concentration/values of major anions and physicochemical parameters along the groundwater flow.
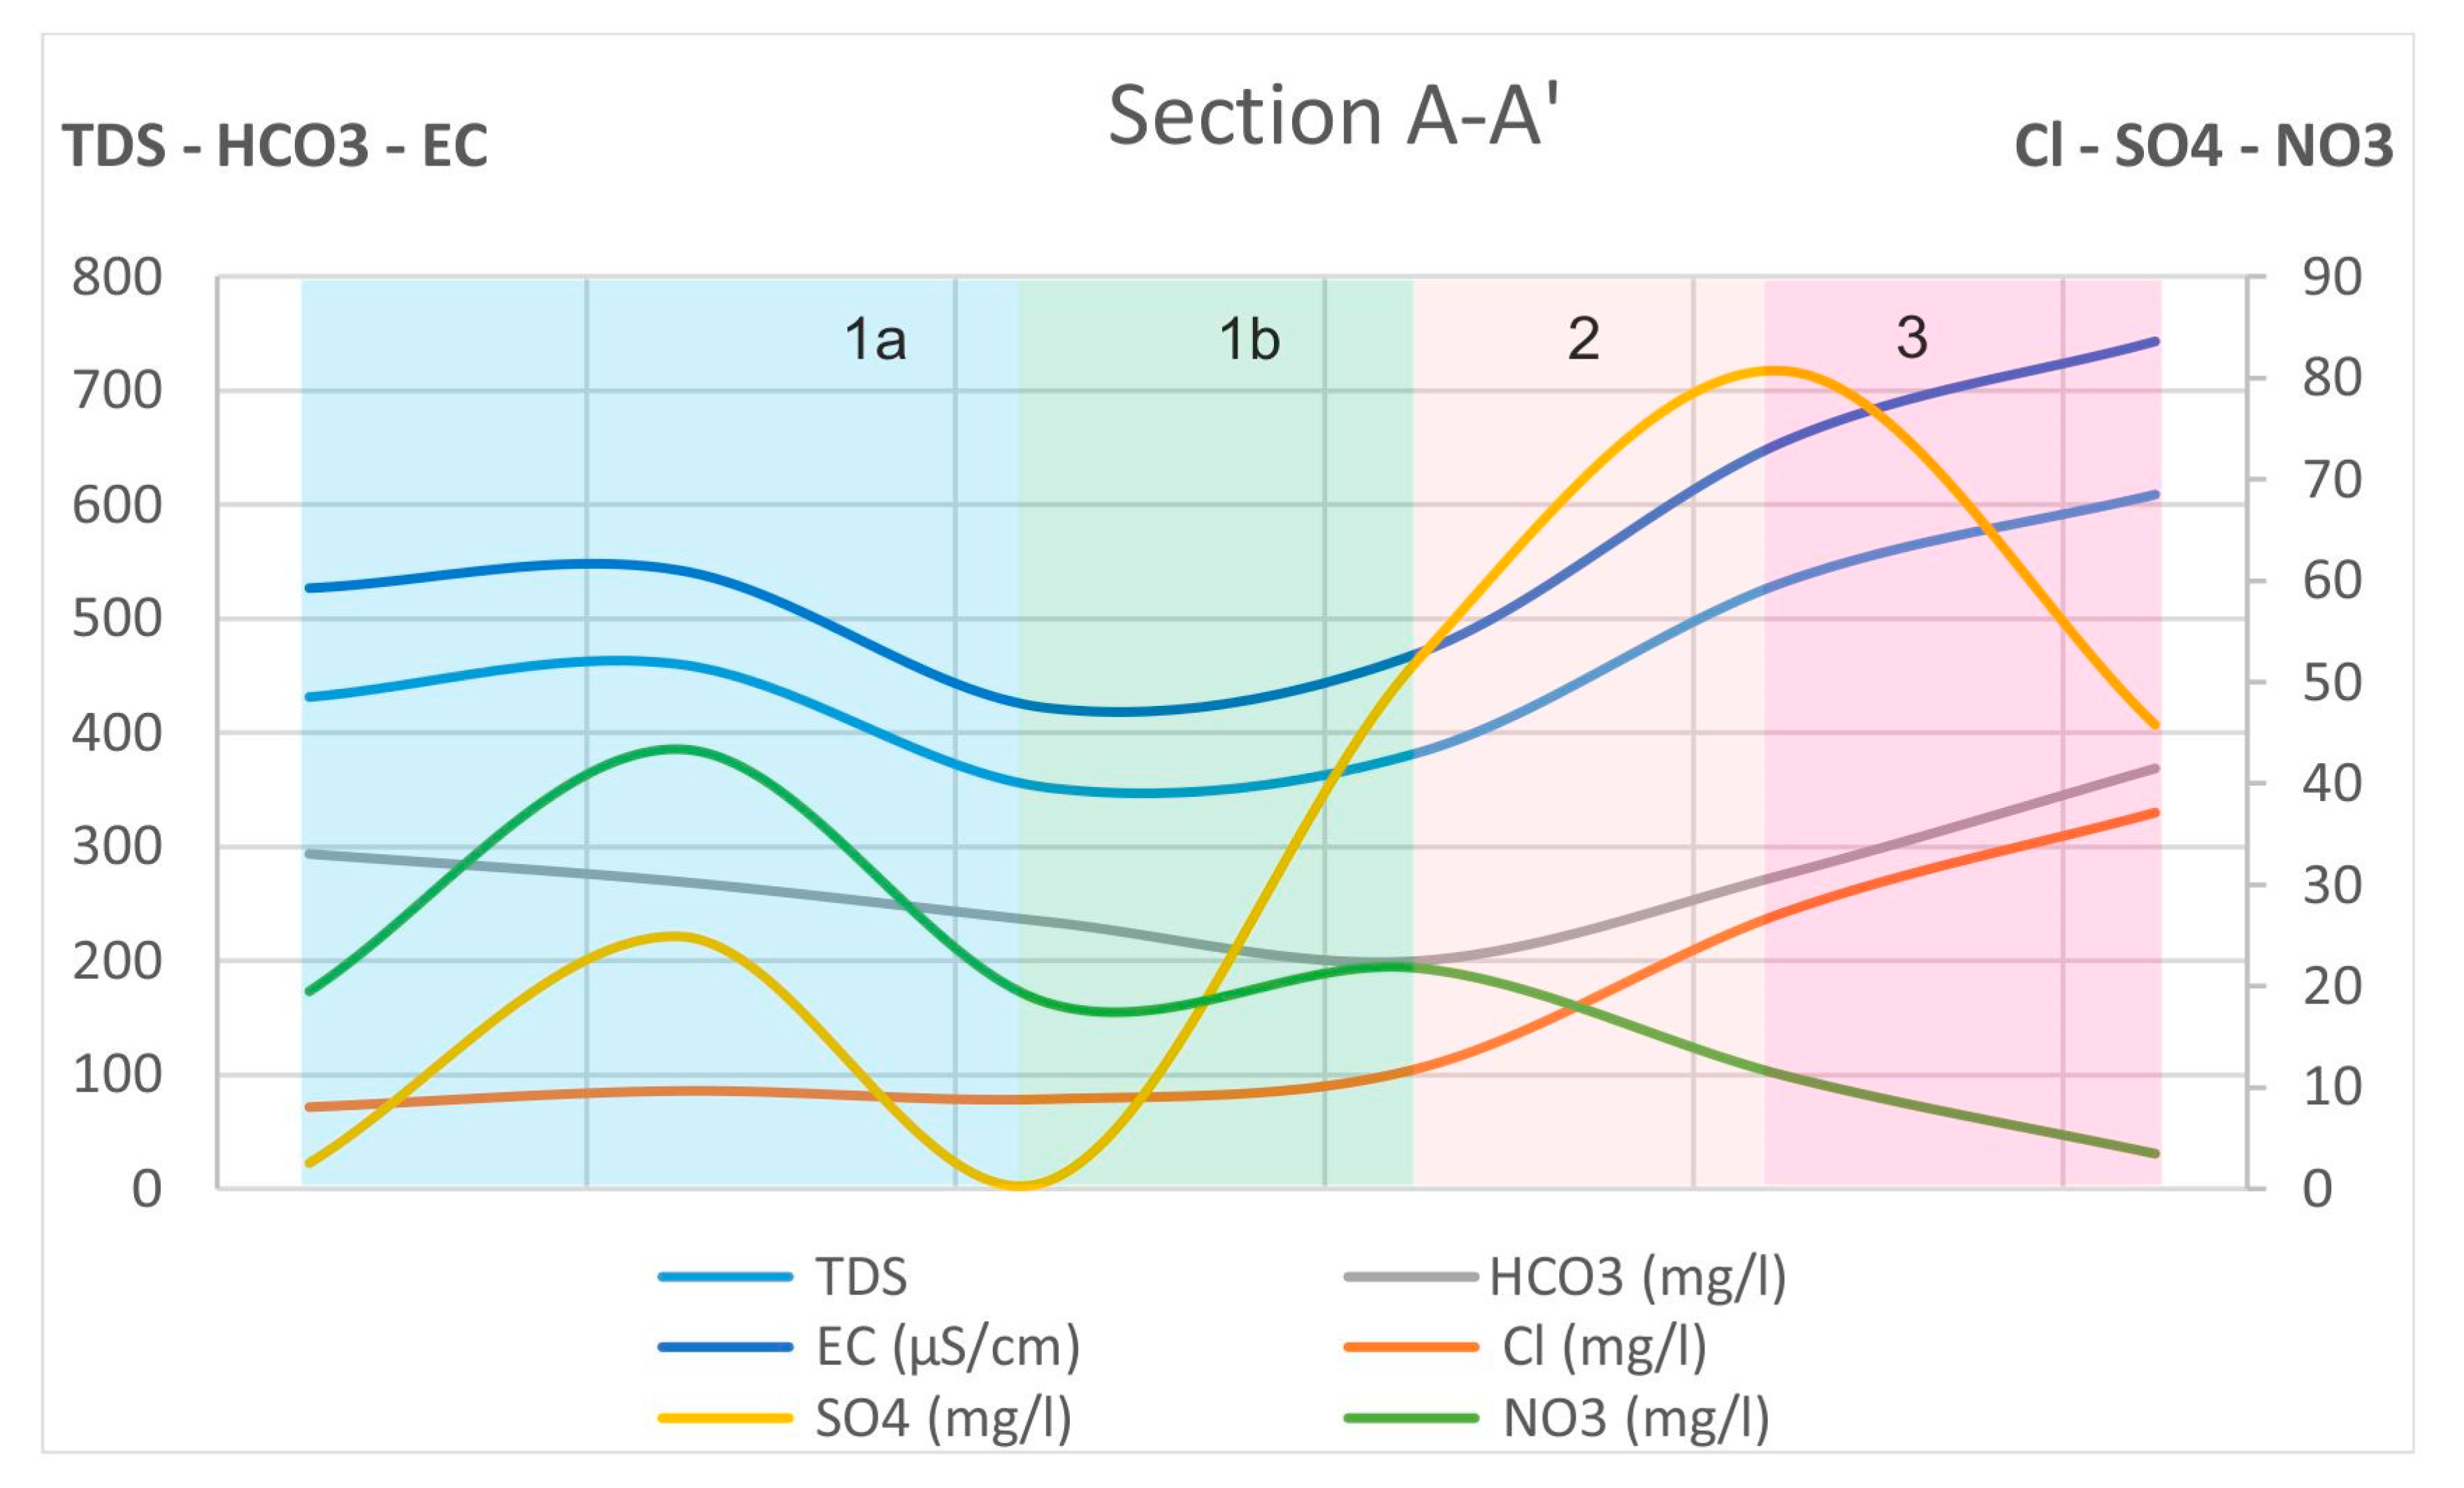
Figure 8.
Variations in the concentration/values of major cations and SI (Saturation Index) of calcite along the groundwater flow.
Figure 8.
Variations in the concentration/values of major cations and SI (Saturation Index) of calcite along the groundwater flow.
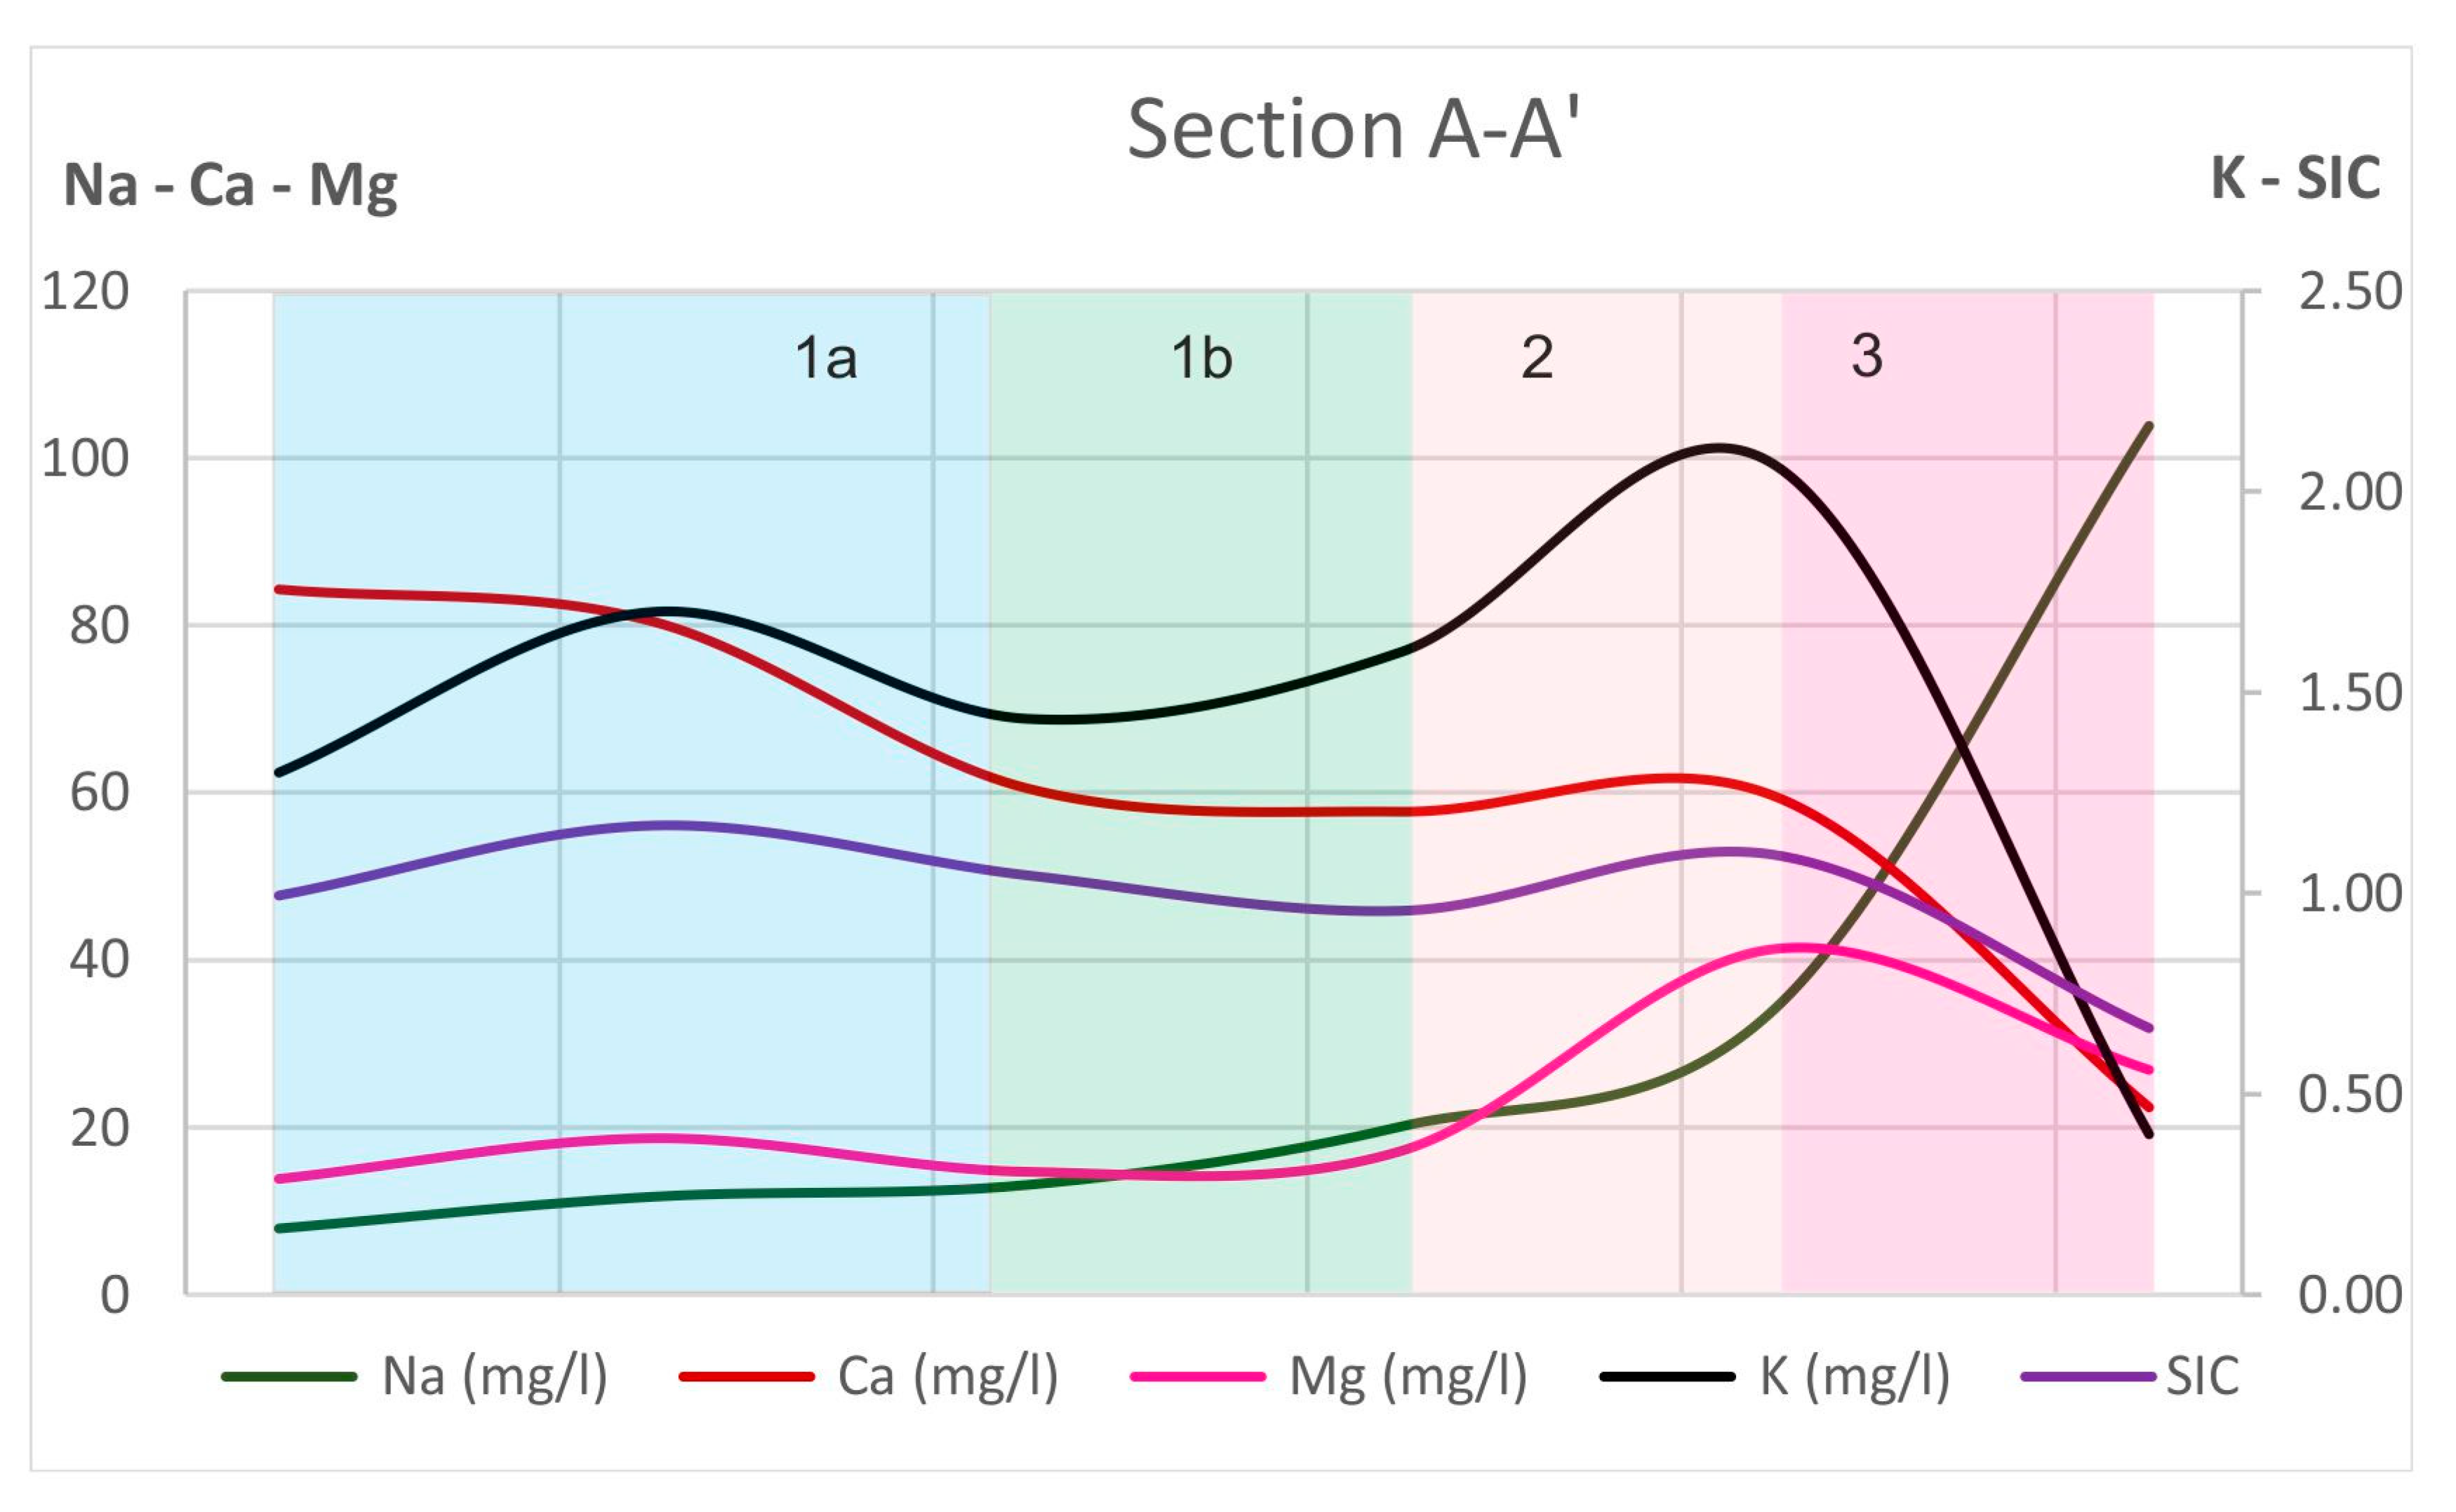
Figure 9.
Plot of (Ca+Mg-SO4-HCO3) and (Na+K-Cl) in meq/L.
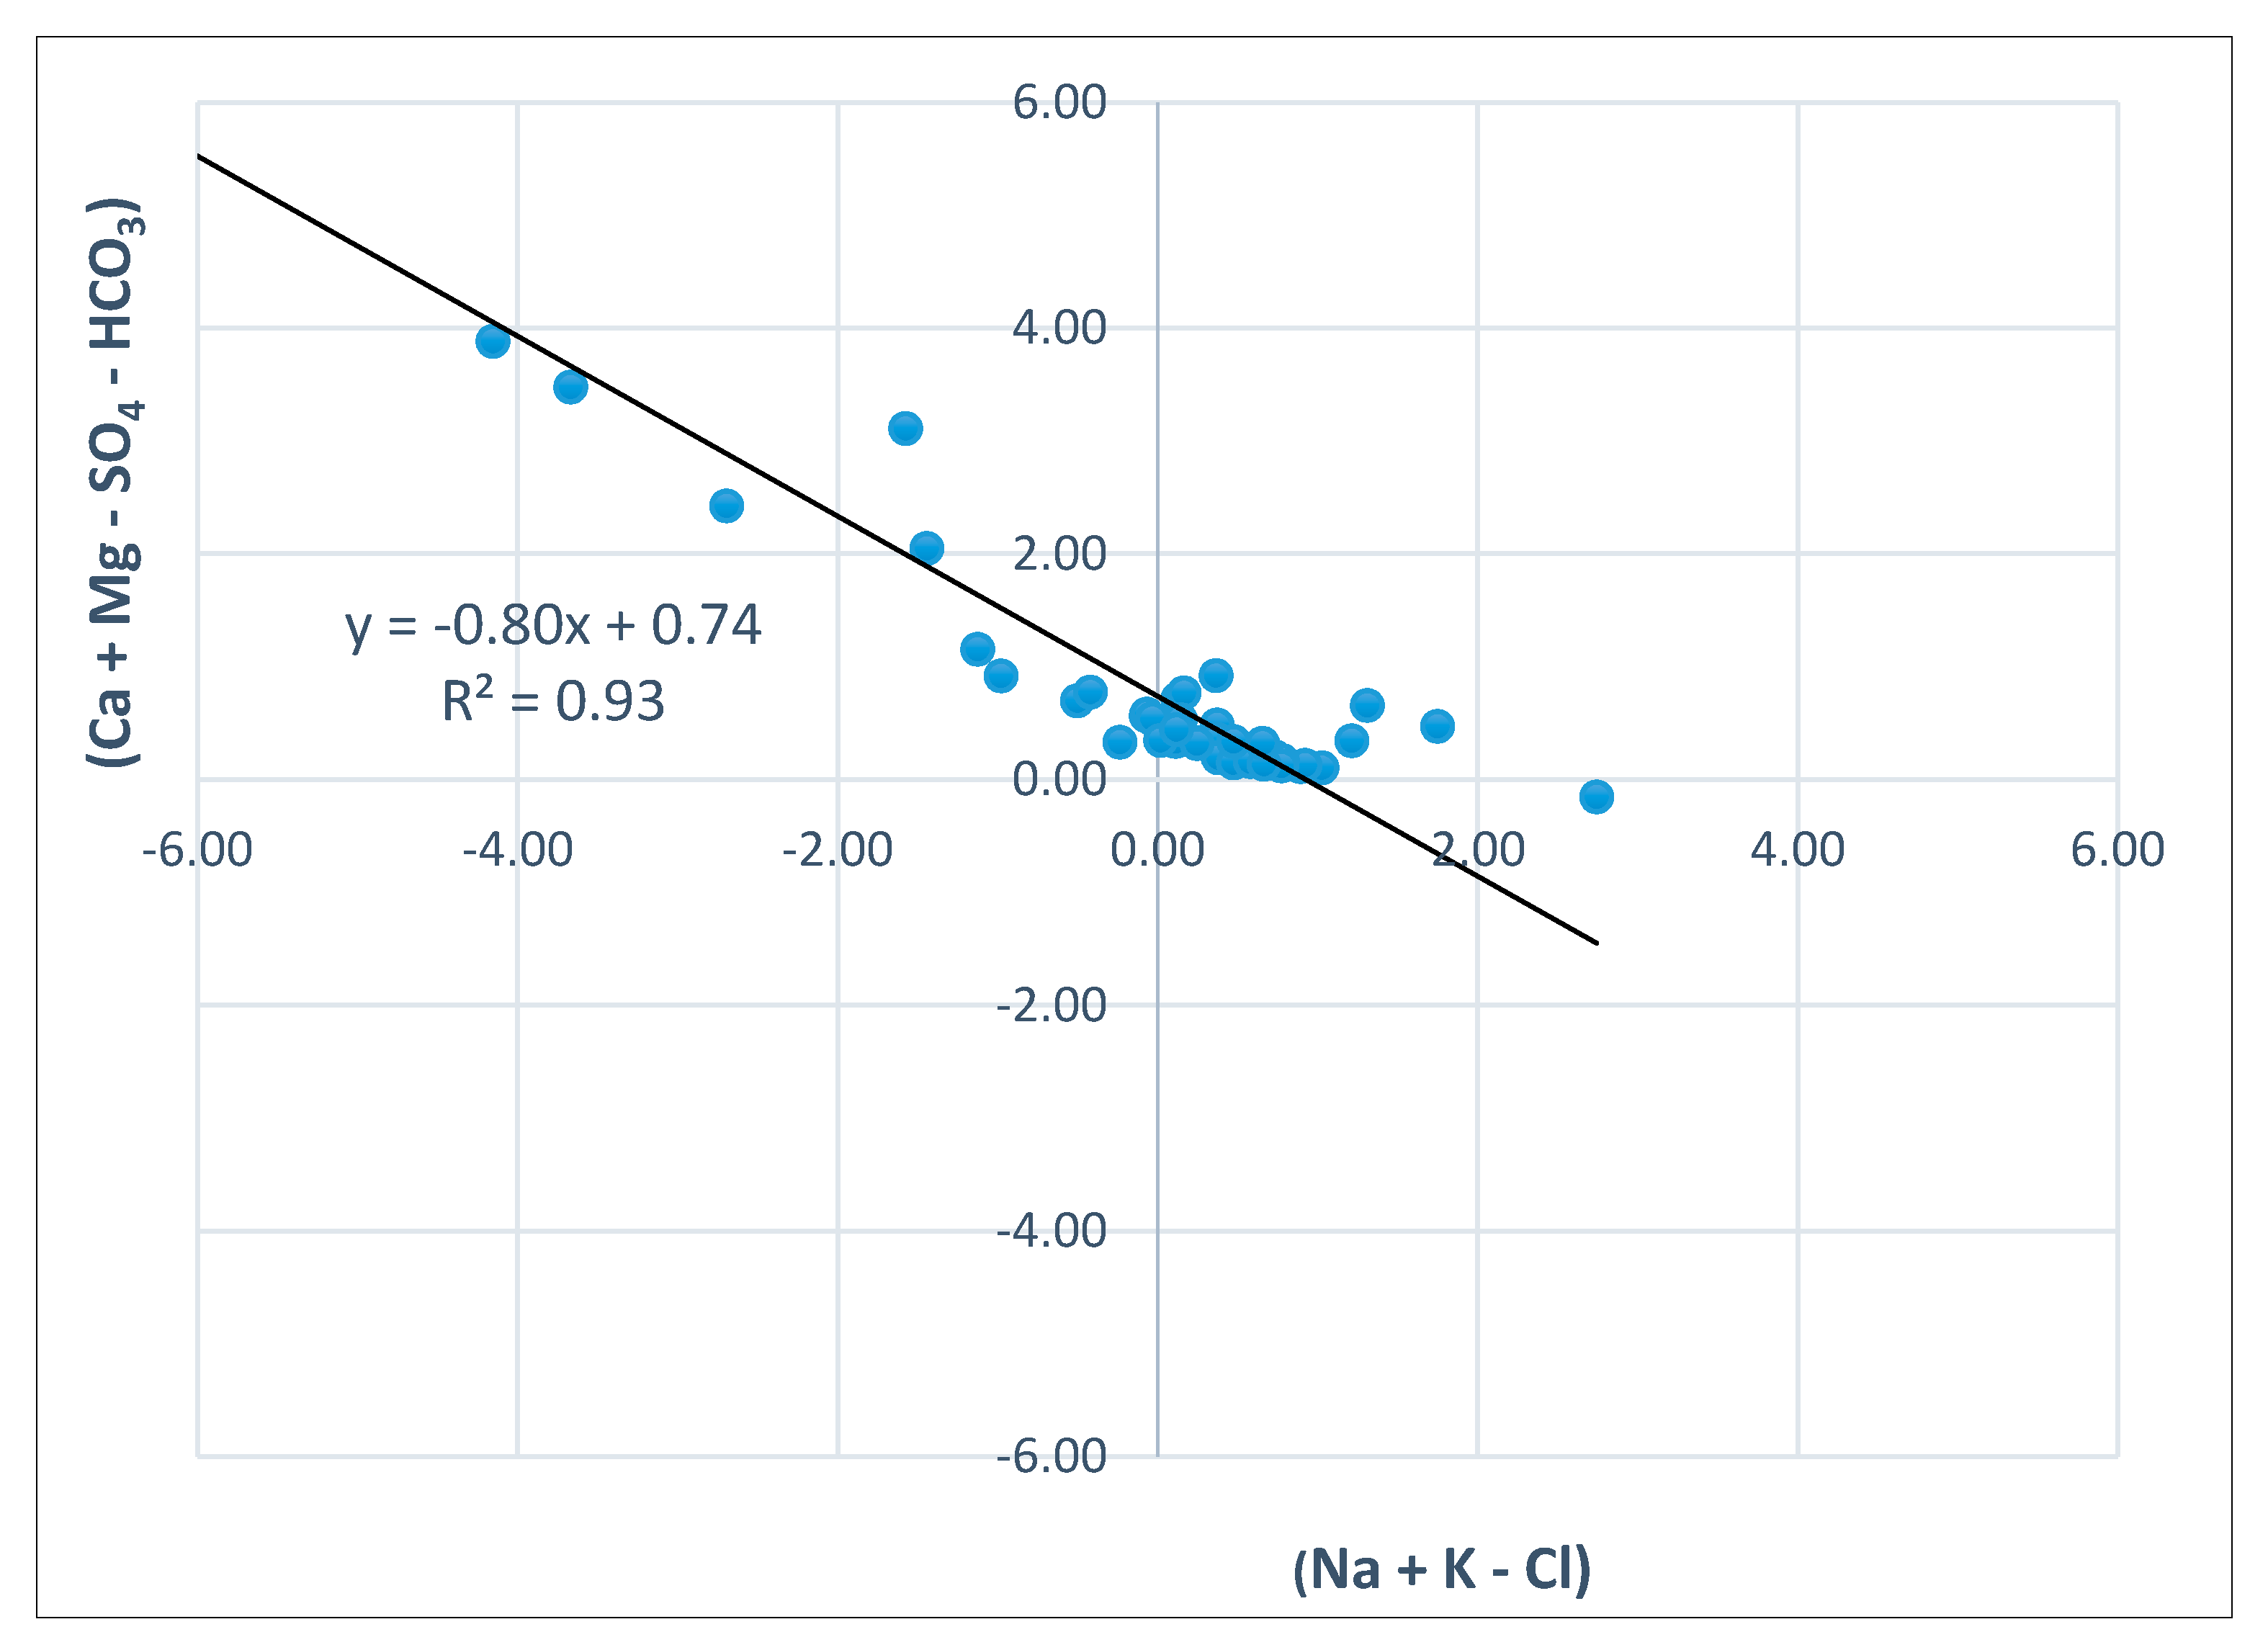
Figure 10.
Plot of (Ca + Mg) and (SO4 + HCO3) in meq/L.
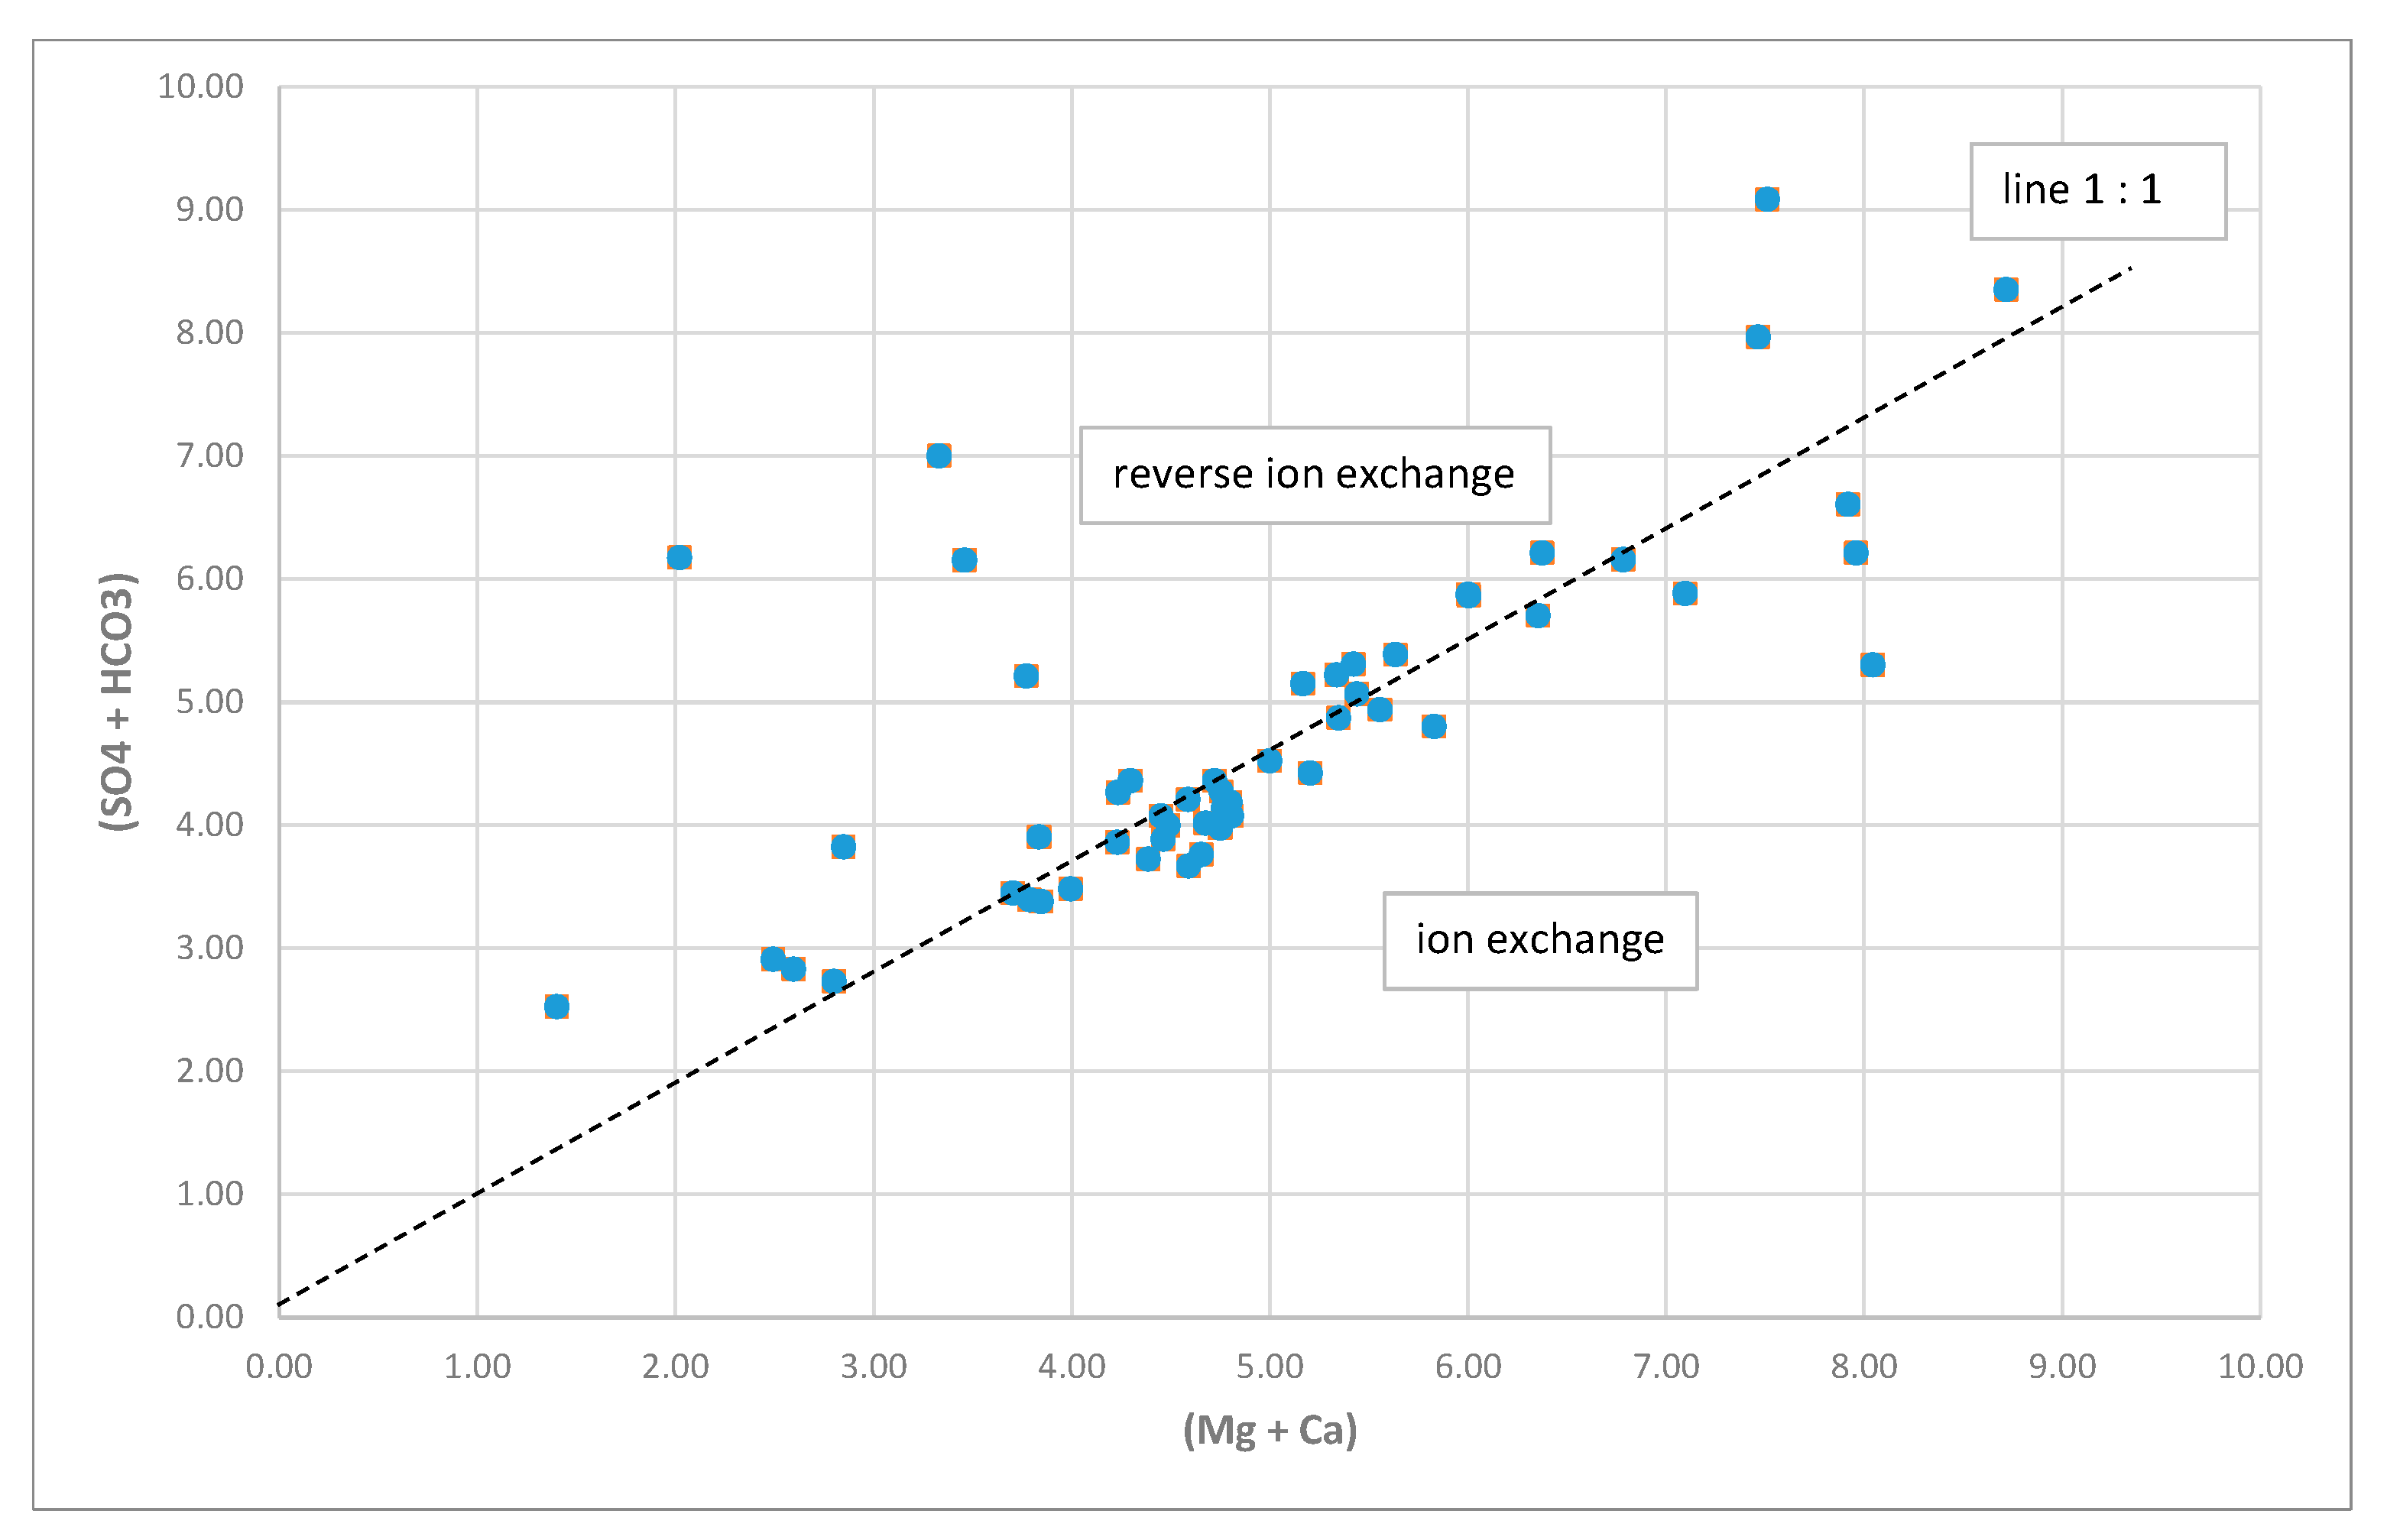
Figure 11.
Local groundwater isotope regression line (Tirnavos subbasin) along with (a) GMWL [62], (b) Thessaly Meteoric Water Line [60] (c) Greek Meteoric Water Line [63].
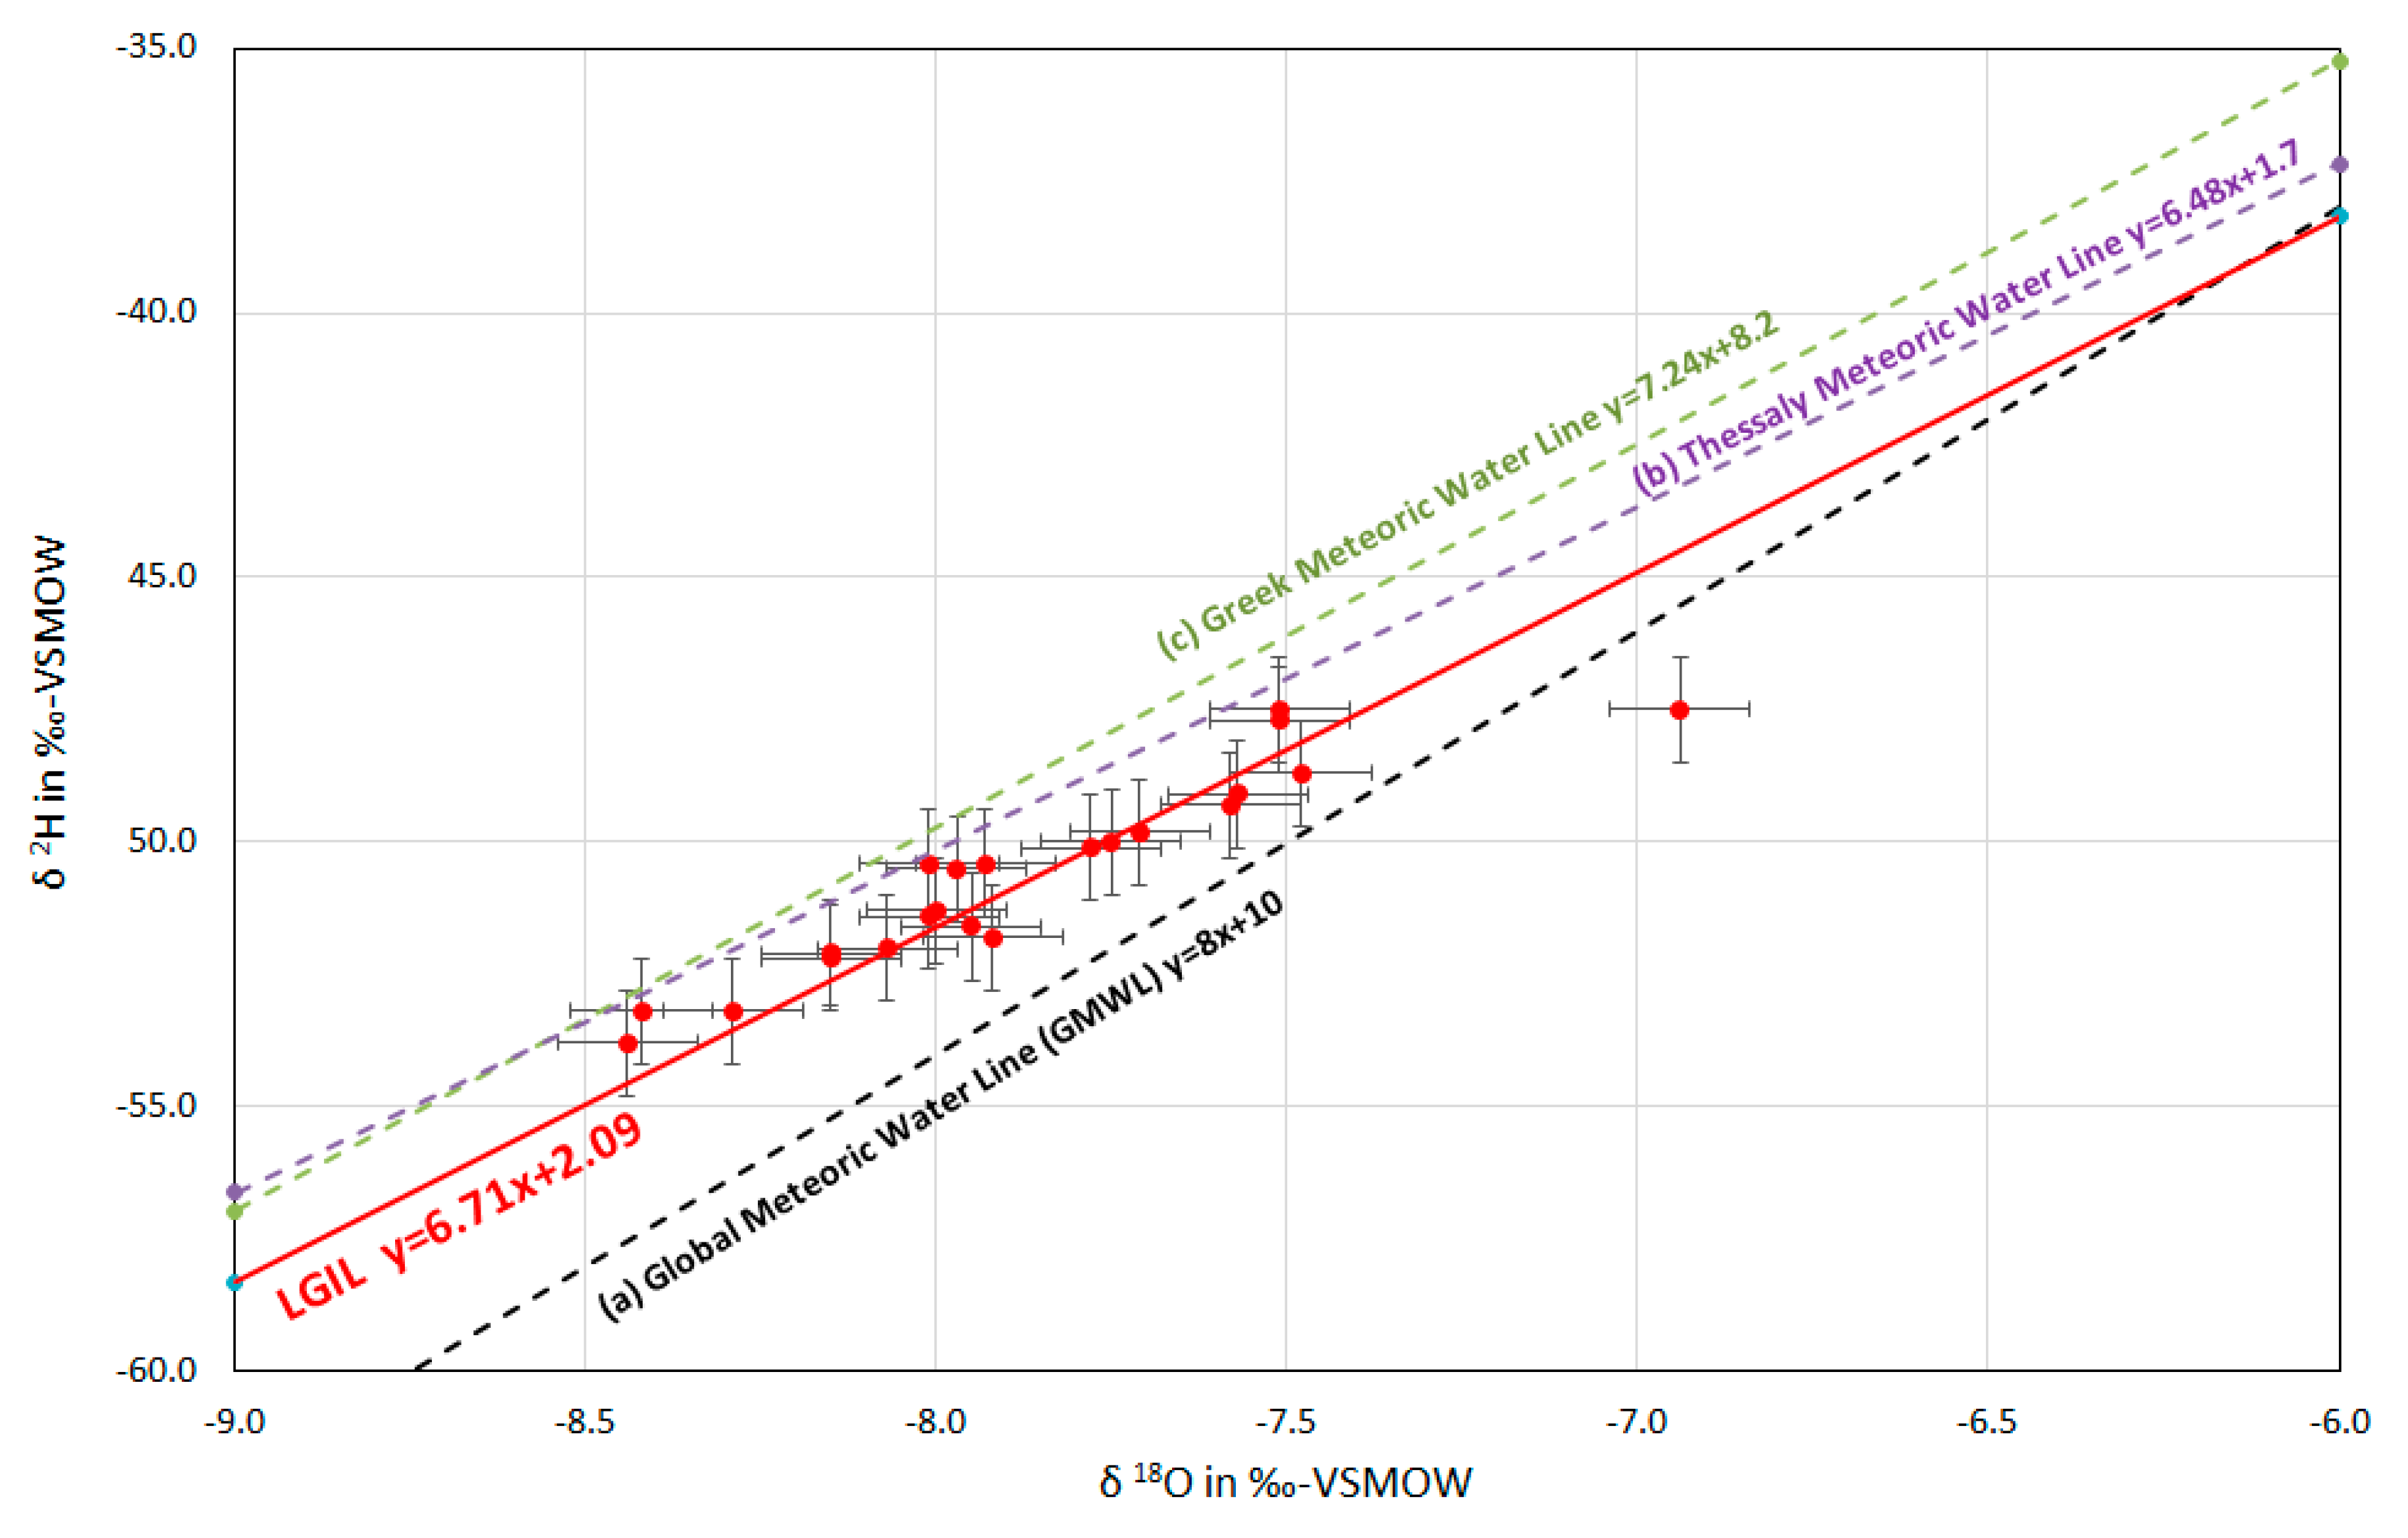
Figure 12.
Spatial distribution of δ18O for groundwater (April 2018) and conceptualization of geological structure tectonic features and flow paths in the Ossa mountain, after [66].
Figure 12.
Spatial distribution of δ18O for groundwater (April 2018) and conceptualization of geological structure tectonic features and flow paths in the Ossa mountain, after [66].
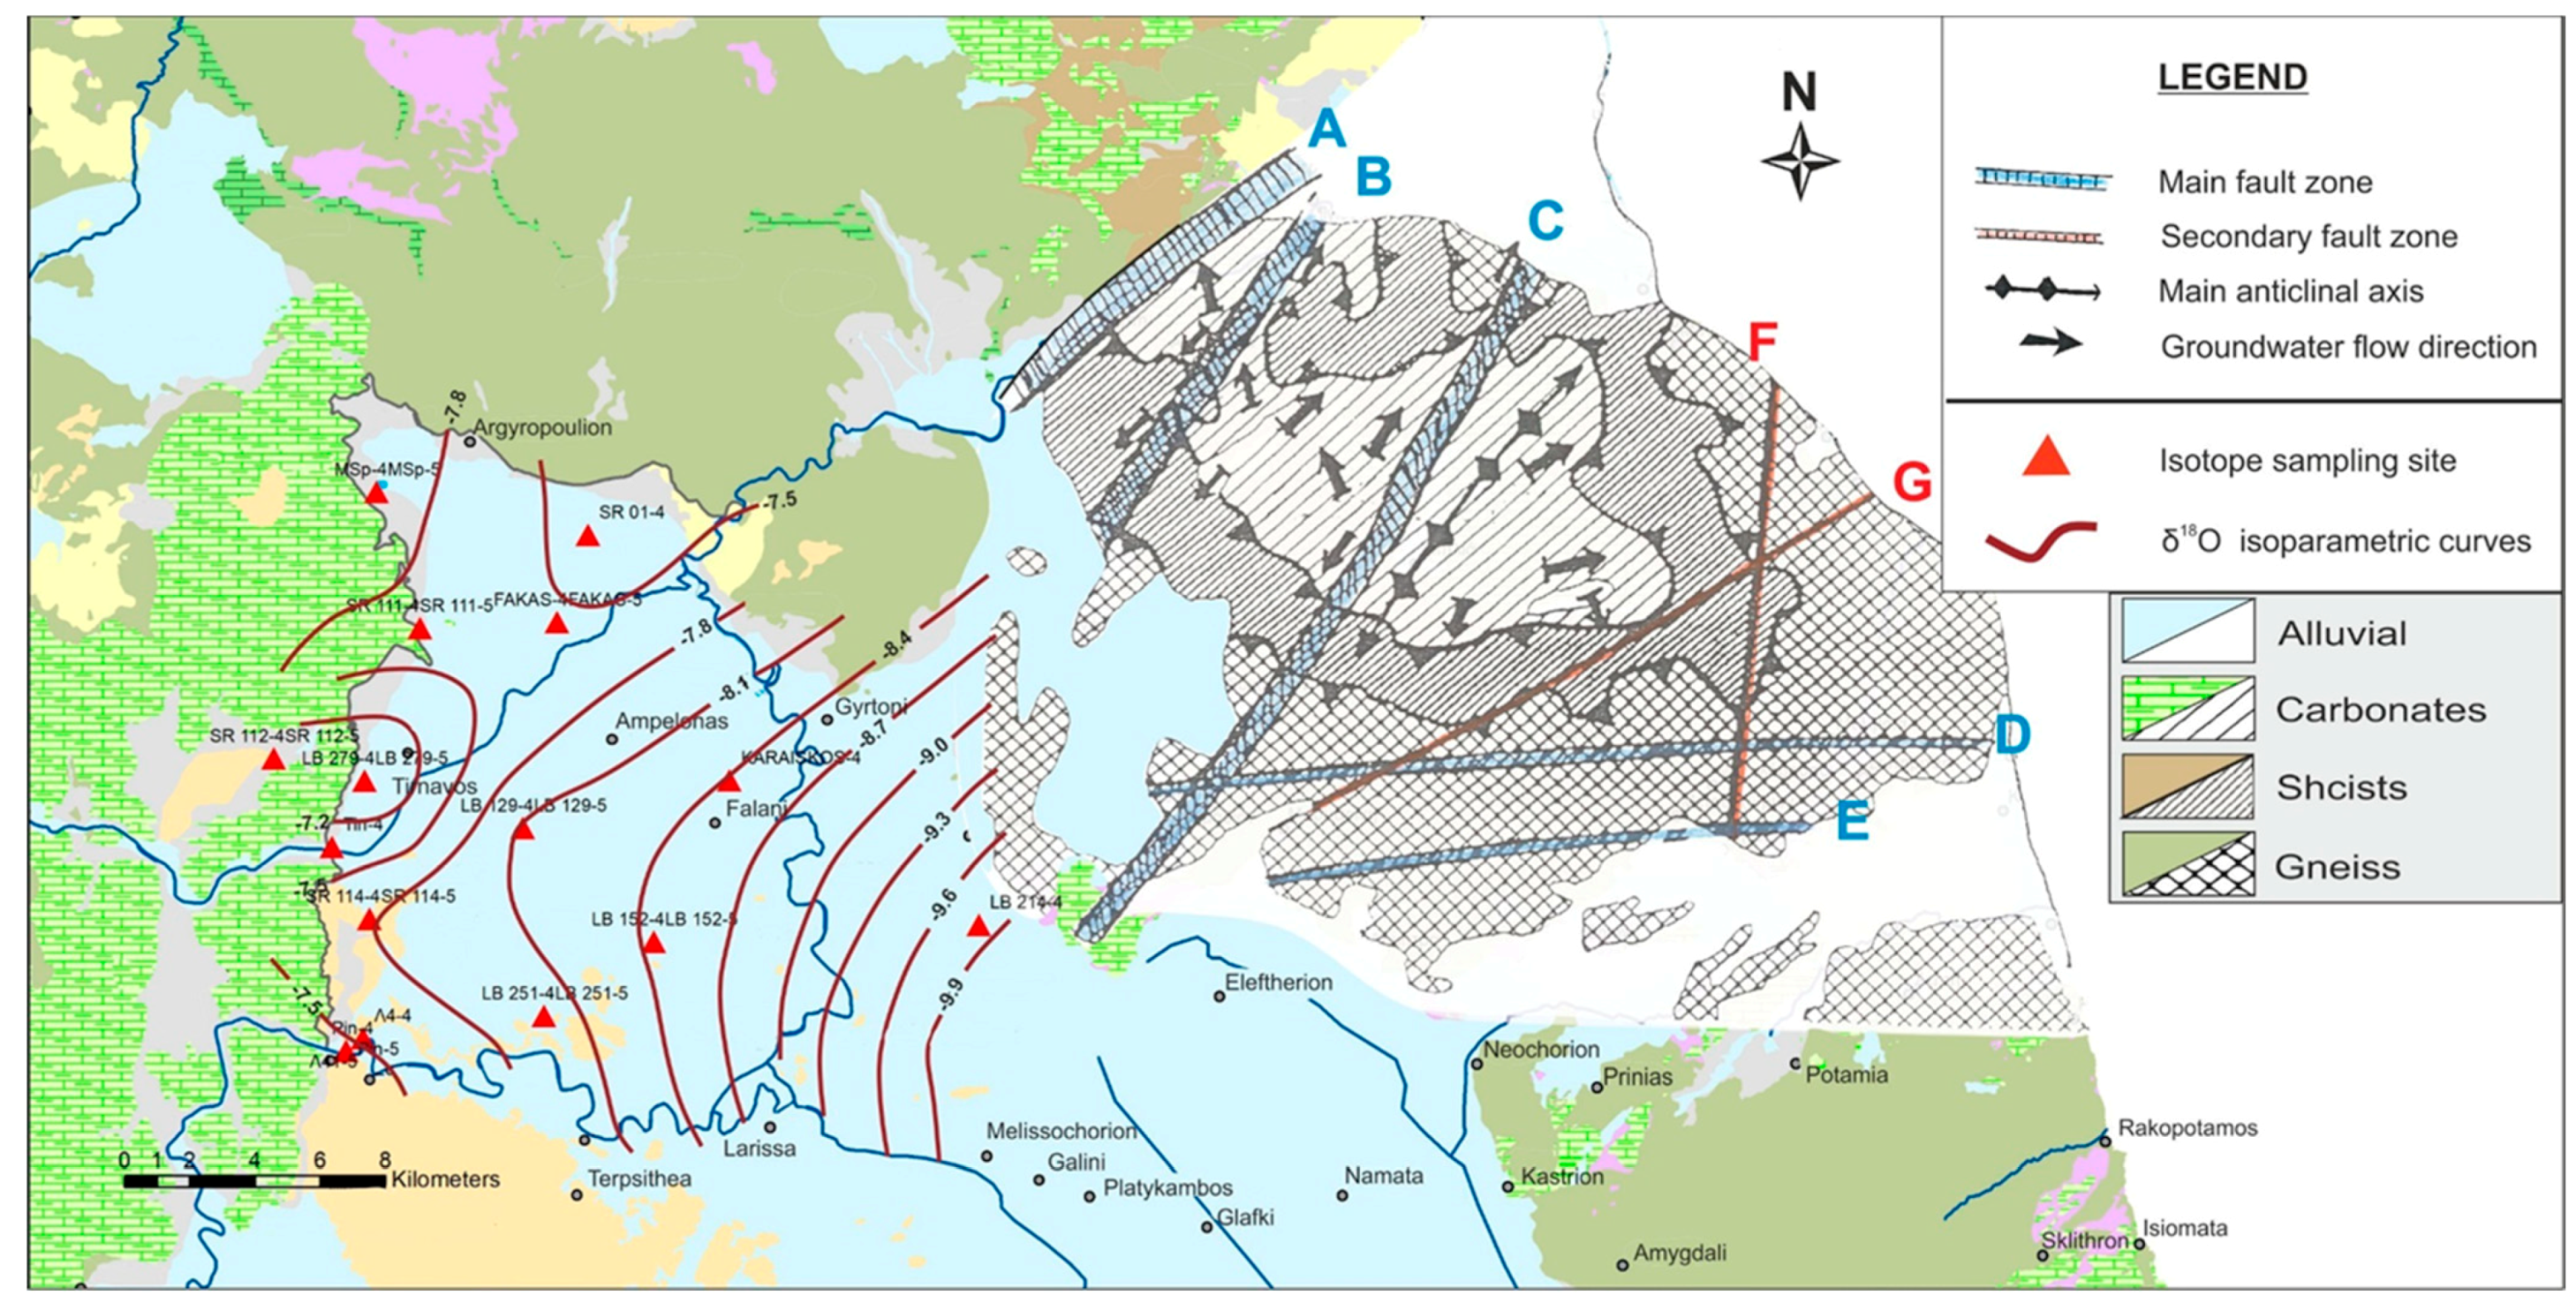
Figure 13.
Groundwater resources evolution conceptualization.

Table 1.
Results of Factor Analysis (FA) with rotated (varimax) factor loadings and communalities. Medium-to-high positive correlation is shown in bold, while medium-to-high negative correlation is shown in bold italics.
Table 1.
Results of Factor Analysis (FA) with rotated (varimax) factor loadings and communalities. Medium-to-high positive correlation is shown in bold, while medium-to-high negative correlation is shown in bold italics.
| Variable | Factor 1 | Factor 2 | Factor 3 | Factor 4 | Factor 5 | Communality |
|---|---|---|---|---|---|---|
| pH | 0.149 | −0.867 | 0.333 | 0.131 | 0.046 | 0.903 |
| EC | 0.921 | 0.29 | 0.165 | −0.130 | −0.006 | 0.976 |
| K | 0.084 | 0.693 | 0.009 | 0.055 | 0.256 | 0.556 |
| Na | 0.918 | −0.252 | 0.094 | −0.157 | 0.062 | 0.944 |
| Ca | 0.017 | 0.883 | 0.232 | 0.133 | 0.085 | 0.859 |
| Mg | 0.673 | 0.421 | 0.147 | −0.232 | −0.312 | 0.803 |
| Cl | 0.941 | 0.17 | 0.019 | 0.02 | −0.015 | 0.915 |
| HCO3 | 0.075 | 0.508 | 0.547 | −0.52 | −0.09 | 0.841 |
| SO4 | 0.965 | −0.073 | 0.017 | 0.001 | 0.074 | 0.942 |
| B | 0.892 | −0.251 | −0.034 | −0.114 | 0.068 | 0.877 |
| Cu | −0.189 | 0.181 | 0.082 | 0.091 | 0.772 | 0.680 |
| Fe | 0.375 | −0.115 | 0.068 | −0.541 | 0.551 | 0.754 |
| Mn | 0.191 | −0.225 | −0.18 | −0.804 | 0.045 | 0.767 |
| NO3 | 0.017 | 0.815 | −0.052 | 0.189 | −0.06 | 0.707 |
| NH4 | −0.013 | −0.036 | 0.083 | −0.897 | −0.104 | 0.823 |
| SICalcite | −0.042 | 0.036 | 0.945 | 0.128 | 0.175 | 0.942 |
| SIDolomite | 0.291 | −0.142 | 0.927 | −0.081 | −0.055 | 0.973 |
| SIGypsum | 0.595 | 0.492 | 0.143 | 0.171 | −0.238 | 0.702 |
| SIHalite | 0.893 | 0.016 | 0.066 | −0.098 | −0.224 | 0.862 |
| Variance | 6.241 | 3.719 | 2.352 | 2.264 | 1.251 | 15.827 |
| % Var | 32.8 | 19.6 | 12.4 | 11.9 | 6.6 | 83.3 |
Publisher’s Note: MDPI stays neutral with regard to jurisdictional claims in published maps and institutional affiliations. |
© 2021 by the authors. Licensee MDPI, Basel, Switzerland. This article is an open access article distributed under the terms and conditions of the Creative Commons Attribution (CC BY) license (http://creativecommons.org/licenses/by/4.0/).
Share and Cite
MDPI and ACS Style
Vrouhakis, I.; Tziritis, E.; Panagopoulos, A.; Stamatis, G. Hydrogeochemical and Hydrodynamic Assessment of Tirnavos Basin, Central Greece. Water 2021, 13, 759. https://doi.org/10.3390/w13060759
AMA Style
Vrouhakis I, Tziritis E, Panagopoulos A, Stamatis G. Hydrogeochemical and Hydrodynamic Assessment of Tirnavos Basin, Central Greece. Water. 2021; 13(6):759. https://doi.org/10.3390/w13060759
Chicago/Turabian StyleVrouhakis, Ioannis, Evangelos Tziritis, Andreas Panagopoulos, and Georgios Stamatis. 2021. "Hydrogeochemical and Hydrodynamic Assessment of Tirnavos Basin, Central Greece" Water 13, no. 6: 759. https://doi.org/10.3390/w13060759
Note that from the first issue of 2016, this journal uses article numbers instead of page numbers. See further details here.