
Optimization of a Completely Mixed Anaerobic Biofilm Reactor (CMABR), Based on Brewery Wastewater Treatment


1
State Key Laboratory of Urban Water Resource and Environment, School of Environment, Harbin Institute of Technology, Harbin 150090, China
2
School of Hydraulic and ElectricPower, Heilongjiang University, 74 Xuefu Road, Nangang District, Harbin 150090, China
*
Author to whom correspondence should be addressed.
Water 2021, 13(5), 606; https://doi.org/10.3390/w13050606
Submission received: 17 October 2020
/
Revised: 22 November 2020
/
Accepted: 30 November 2020
/
Published: 26 February 2021
(This article belongs to the Section Wastewater Treatment and Reuse)
Abstract
:In this study, brewery wastewater was used as the treatment in exploring the optimal conditions and maximum processing efficiency of the completely mixed anaerobic biofilm reactor (CMABR) under the conditions of hydraulic retention time (HRT) (18 h, 24 h, and 30 h) with a rotational speed (70 rpm, 100 rpm, and 130 rpm) and influent total alkalinity (TA) (20 mmol/L, 25 mmol/L, and 30 mmol/L), which was measured by the response surface methodology (RSM). The results indicated that the maximum chemical oxygen demand (COD) removal ratio was achieved under the following conditions: HRT of 21.42 h, rotational speed of 101.34 rpm, and influent TA of 25.22 mmol/L. Analysis by scanning electron microscope (SEM) showed that the microorganisms were successfully immobilized on the polyurethane fillers before the reactor began operation. High-throughput sequencing indicated that Methanothrix and Methanospirillum were the dominant contributors for COD removal in the CAMBR under these optimum conditions.
1. Introduction
With the rapid development of industry and agriculture, the problems of environmental damage, resource shortages, and environmental water quality deterioration are increasing [1]. Therefore, new wastewater treatment technologies, which have high efficiency and low energy consumption have attracted significant attention in recent years [2]. Anaerobic biological treatment technologies have a number of advantages such as a wide range of applications, high reactor loads, and recyclable biogas [3]. Due to these advantages, anaerobic biological treatment technology has been rapidly developed and applied to the treatment of high volumes of wastewater [4].
Anaerobic biological treatment technology has been successfully used to manage agricultural and industrial wastewater (e.g., winery wastewater, dairy wastewater, and brewery wastewater) for over 100 years [5]. Among them, anaerobic biofilm reactors are recognized as being reliable and sustainable for wastewater treatment including the anaerobic moving bed biofilm reactor (AMBBR), anaerobic fluidized bed reactor (AFBR), and anaerobic composite biofilm reactor (ACBR) [6]. However, these traditional anaerobic biofilm reactors have some issues. For example, the anaerobic biological filter (ABF) [7] is difficult to start and is likely to plug and short flow during the operation; this increases the energy consumption and reduces the operating efficiency of the reactor. For plugging and short flow during the operation, this increases the energy consumption and reduces the operating efficiency of the reactor. The upflow anaerobic sludge bed (UASB) reactor [8] is prone to biomass loss when the impact load is increased and there is insufficient fixation of granular sludge in the reactor. In order to prevent the loss of sludge or filler and to separate the digestive gases, fluid, and sludge, traditional anaerobic biofilm reactors generally need to be equipped with a solid–liquid separation device such as an AFBR [9]. However, on these separation devices, the overflow port and the net or sieve screen often encounter problems because they are easily damaged and unsuitable for maintenance [10]. Therefore, it is necessary to develop an anaerobic biofilm reactor with uniformly mixed fillers, simple gas–solid–liquid separation, and low energy consumption.
In this study, based on the traditional anaerobic biofilm reactor, the optimal size of a completely mixed anaerobic biofilm reactor (CMABR) was developed using a computational fluid dynamics (CFD) numerical simulation [11], and a particle image velocimetry (PIV) flow-field test [12]. Brewery wastewater is characterized by a large output, a high concentration of organic matter, and high variation in water quality. The reactor uses the brewery wastewater as the reactor inlet water, polyurethane fillers as the carrier, and an agitator as the power input. The advantages of this reactor are three-fold: (1) it is less apt to problems with filler blockages and short flow compared to AFBR; (2) the biomass of the system is maintained by a biofilm, which is not easily lost compared to the traditional anaerobic sludge method; and (3) compared with an UASB, it does not have a complicated three-phase separator as well as being less liable to sludge loss caused by the increased organic-load ratio.
The main objectives of this research were to (1) explore the factors that influence the operational conditions of the CMABR; (2) evaluate the properties of polyurethane fillers and observe the microorganism growth on the fillers; and (3) investigate the microbial community within the reactor.
2. Materials and Methods
2.1. Characteristics of Wastewater
All the experiments were conducted in a mineral salt medium (MSM) containing KH2PO4 (0.025 g/L), NH4Cl (0.10 g/L), FeCl3·4H2O (2.0 g/L), CaCl2·2H2O (8.0 g/L), and 10 mL of trace element solution. The trace element solution was comprised of H3BO3 (0.05 g/L), CoCl2·6H2O (2.0 g/L), (NH)4 6Mo7O24 (0.09 g/L), MnCl2·4H2O (0.5 g/L), Na2SeO3 (0.1 g/L), CuCl2·2H2O (0.03 g/L), and MgSO4·4H2O (0.1 g/L) [13]. Different volumes of brewage wastewater (from Harbin Beer Songjiang Company, Harbin, China) as organic carbon sources were added to the MSM for the anaerobic fermentation process.
2.2. Reactor Filling Method
The reactor was initiated by aerobic pre-filming and anaerobic film-hanging. Prior to the experiments, the polyurethane fillers were inoculated with 3500 mg/L aerobic sludge taken from the A-A-O tank of a sewage plant (Harbin, China). For inoculation, brewery wastewater, with a chemical oxygen demand (COD) of 1000 mg/L was added. The aerobic sludge was removed after 24 h of full contact, and the water was changed every 24 h. When the COD removal ratio of the reactor reached 80%, the aerobic pre-filming was complete. The polyurethane fillers were then inoculated with 10,000 mg/L anaerobic sludge taken from a secondary sedimentation tank of the sewage plant (Harbin, China). Brewery wastewater with a COD of 1000 mg/L was added. After 24 h of full contact, the anaerobic sludge was removed, and the water was changed every 24 h. When the COD removal ratio of the reactor reached 80%, the anaerobic film hanging was complete. After hanging the film successfully, the anaerobic biofilm reactor was initiated using a low-load startup method [14].
2.3. Reactor Setup and Operation
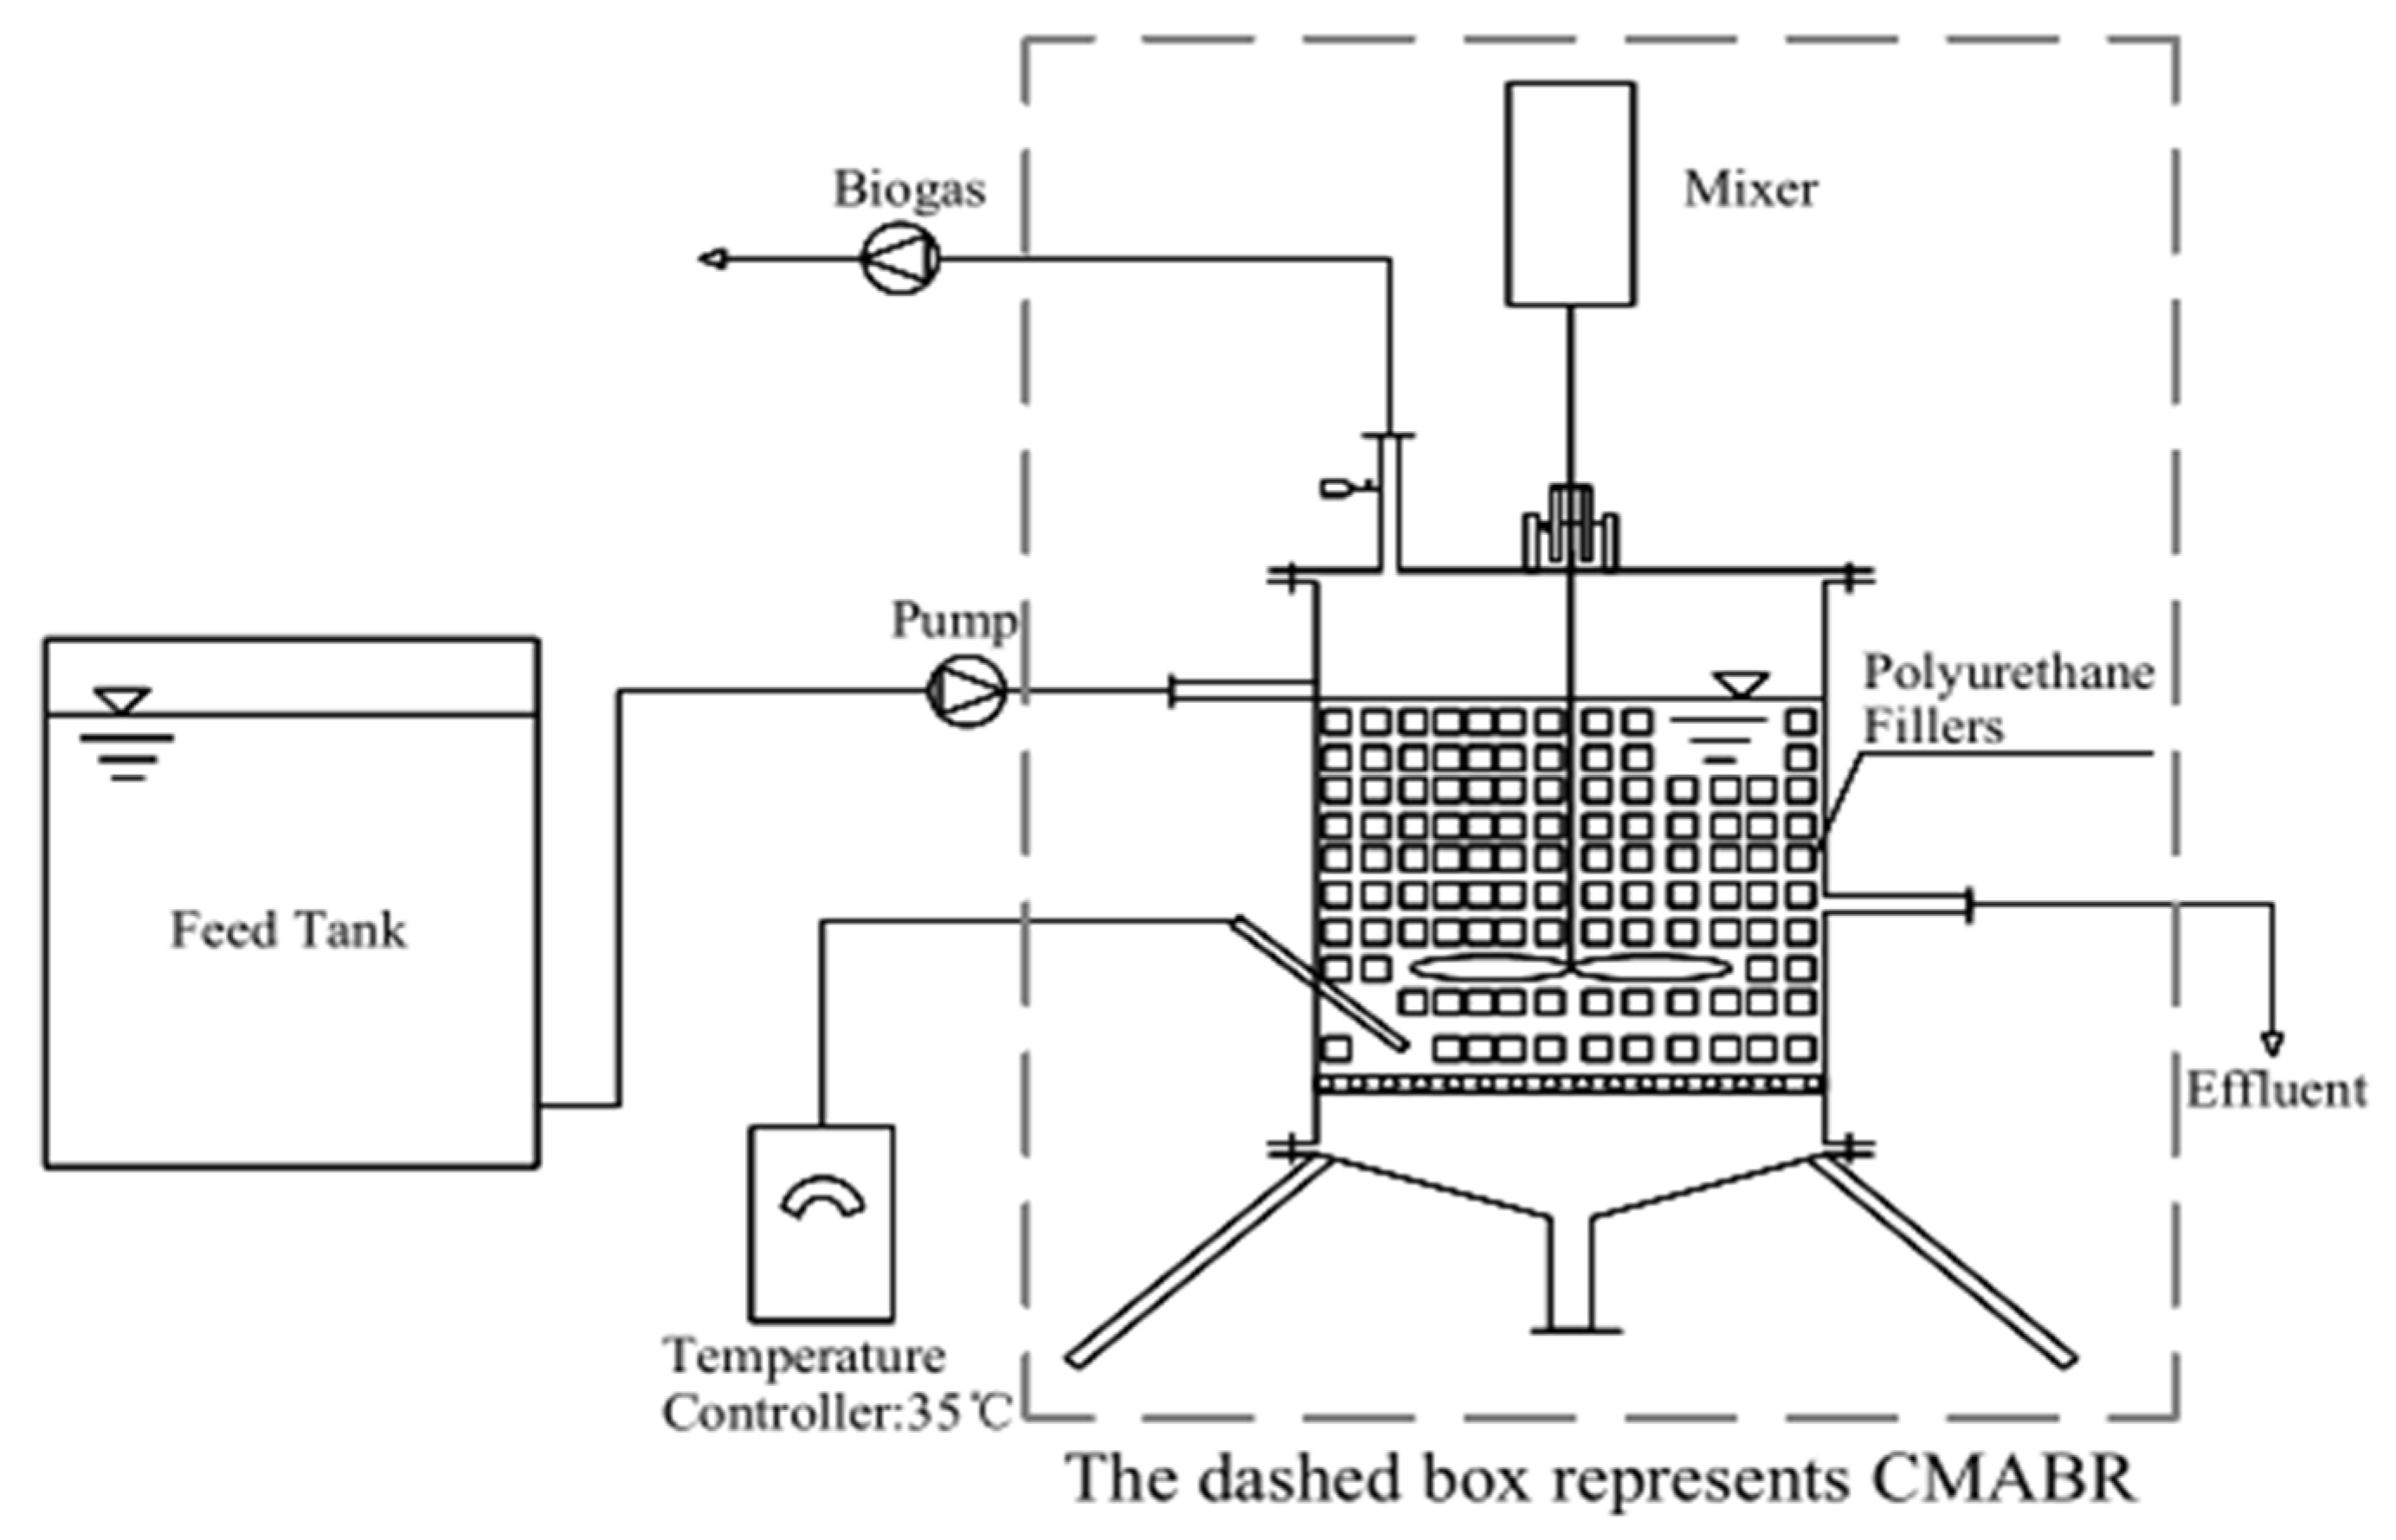
As shown in Figure 1, the bioreactor system was composed of three parts: the CMABR, the feed tank, and the pump. The effective volume of the CAMBR was 21 L. The reactor was set up with a height of 40 cm and an inner diameter of 15 cm. The polyurethane fillers were circulated in the reactor using a paddle. In addition, a water seal device sealed the lid of the reactor.
The reactor was filled with 6.3 L of polyurethane filler, purchased from Bao Sheng Polymer Material Co. Ltd. (Huaian, China). The polyurethane fillers had a sponge-like cubic wall structure, and a specific surface area for the attached biomass growth. The main characteristics of polyurethane fillers were as follows: 10 mm in length, a specific weight of 12.5 g/L ± 7.5 g/L (dry/g/(wet/L)), and a Brunauer–Emmet–Teller (BET) specific surface area of 6500 m2/m3.
The operation process was divided into 17 stages, according to the response surface methodology (RSM) [15], and each stage was operated for six days. Table 1 summarizes the experimental conditions and COD removal ratio. First, the brewage wastewater was prepared in a 21 L feed tank, and the initial pH (7.0) was regulated by 1 mol/L NaHCO3. The effluent was introduced to the CMABR through a pump. The COD concentration, total alkalinity (TA), and pH of the effluent from the reactor were measured for each cycle.
2.4. Condition Optimization
In this study, the RSM was employed to optimize the operating variables influent TA (25 mmol/L, 30 mmol/L, and 35 mmol/L), hydraulic retention time (HRT) (12 h, 18 h, and 24 h), and rotational speed (70 rpm, 100 rpm, and 130 rpm). The levels of these three independent variables were defined according to the Box–Behnken design [16] and 17 stages were required for the procedure. The model for predicting the optimum conditions was expressed according to the following equation:
where Y is COD removal rate; a0 is a constant coefficient; ai is a linear coefficient; aii is a quadratic coefficient; aij is a second order interaction coefficient; and xi and xj are the independent factors [17].
Y = a0 + Σaixi + Σaiixi2 + ΣΣaijxixj
2.5. Analytical Measurements
Water samples were collected from the feeding tank and outlet of the CMABR at the end of each cycle. The water samples collected during the experiments were filtered through 0.45 μm GF/C filters to remove the suspended solids. The TA was measured according to the standard methods (APHA, 2012), and pH was recorded with PHS-3C pH meter (Electric Scientific Instruments, China). The COD concentrations were analyzed using ultraviolet spectrophotometry as per the standard methods. The biofilm and the suspended sludge were investigated with a scanning electron microscope (SEM) (JSM-5610, Japan) operating at 5.0 kV and 10.0 kV, the SEM methodology followed the procedures of Liu et al. [18]. The number of microorganisms was measured using the gravimetric method.
The gravimetric method was conducted as follows: water was used to wash off the sludge on the surface of five or six polyurethane fillers taken from the reactor, put into the crucible, dried at 105 °C in an oven for 24 h, and weighed to obtain the mass (M1). The polyurethane fillers were placed in NaOH solution (1 mol/L) in a water bath for 30 min, and then ultrasonicated for one hour (ultrasonication instrument; SK1200H, China). Finally, the polyurethane fillers were placed in an oven at 105 °C for 24 h and weighed to obtain the mass (M2). The amount of biofilm attached to the polyurethane fillers, per unit weight (g/g), was calculated according to the following equation [19]:
where M1 is the substrates mass after drying for 24 h (g) and M2 is the substrate mass after heating in a water bath, ultrasonication, and drying for 24 h (g).
Biofilm attached to the polyurethane fillers, per unit weight = (M1 − M2)/M2
2.6. DeoxyriboNucleic Acid (DNA) Extraction, Polymerase Chain Reaction (PCR) Amplification, and High-Throughput Sequencing
Extraction of sample DNA: For the DNA extraction, the samples (raw sludge and biofilm on fillers) were washed with phosphate buffer saline (PBS) buffer by shaking, then centrifuged at 12,000 rpm for 2 min, and the precipitate was retained. The DNA was extracted by the OMEGA M5635-02 Kit, according to the manufacturer’s instructions.
Nest PCR was used for DNA amplification to select the V3–V4 region of archaea for two rounds of amplification: the first round of primers was 340F (CCCTAYGGGGYGCASCAG) and 1000R (GGCCATGCACYWCYTCTC); the second round primers were 349F (GYGCASCAGKCGMGAAW) and 806R (GGACTACVSGGGTATCTAAT). The reaction parameters for both rounds of PCR amplification were the same. After amplification, the PCR products were detected on a 2% agarose gel, treated with 0.6x magnetic beads (Agencourt AMPure XP), and eluted with elution buffer. The Qubit 3.0 DNA Detection Kit was used to accurately quantify the recovered DNA.
Sequencing: The Miseq sequencing platform was used.
Result analysis: This included the number of high quality reads and the operational taxonomic units (OTU) of the sample, Shannon, ACE, Chao1, and Simpson index, where for the OTU, a higher number indicates more sequences; Shannon, where a higher number indicates more diversity; ACE, where a higher number indicates more richness; Chao1, where a higher number indicates more richness; and the Simpson, where a higher index value indicates a lower community diversity [20].
3. Results and Discussion
3.1. Box–Behnken Design and Statistical Analysis
The RSM with Box–Behnken design was used to analyze the interactive effects of variables that would significantly affect the COD removal ratio including HRT, influent TA, and rotational speed. The final model gives the following regression equation:
where Y is the predicted response of COD removal ratio, and X1, X2, and X3 represent the values of HRT, rotational speed, and influent TA, respectively.
Y = 96.71 + 2.8X1 − 1.80X2 + 0.35X3 − 0.48X1X2 − 0.87X1X3 + 0.1X2X3 − 2.05X12
− 4.83X22 − 0.66X32
− 4.83X22 − 0.66X32
Table 2 shows the F values, p values, sum of squares, and mean square. According to the results of the regression analysis of RSM, the model was highly significant (p < 0.0001) with an R2 of 0.9957. On investigating the R2 values, the ‘‘Predicted R2” of 0.9756 was in reasonable agreement with the ‘‘Adjusted R2” of 0.9903 for the CMABR. The F-value of 181.82 implies the model was significant [21]. The HRT value (p < 0.0001) and rotational speed (p < 0.0001) were highly significant, the influent TA (p = 0.0315) was significant, the quadratic coefficients of HRT (p < 0.0001) and rotational speed (p < 0.0001) also significantly influenced on the specific removal ratio, and the quadratic coefficients of influent TA (p < 0.0080) were very significant. The interaction between HRT and rotational speed (p = 0.0355) had a significant effect on COD removal. Under the condition of the optimal range of rotational speed, the HRT increased and the COD removal ratio was greatly improved. The interaction between HRT and influent TA (p = 0.0022) had a low influence on COD removal. Compared with these, the interaction between the rotational speed and influent TA (p = NS) had no obvious effect on COD removal [15].
In light of the main and interactive effects of the three factors, the optimal conditions were determined to be HRT of 21.42 h, rotational speed of 101.34 rpm, and influent TA of 25.22 mmol/L. The maximum COD removal ratio (97.56%) could be achieved, according to the model prediction under the optimal conditions.
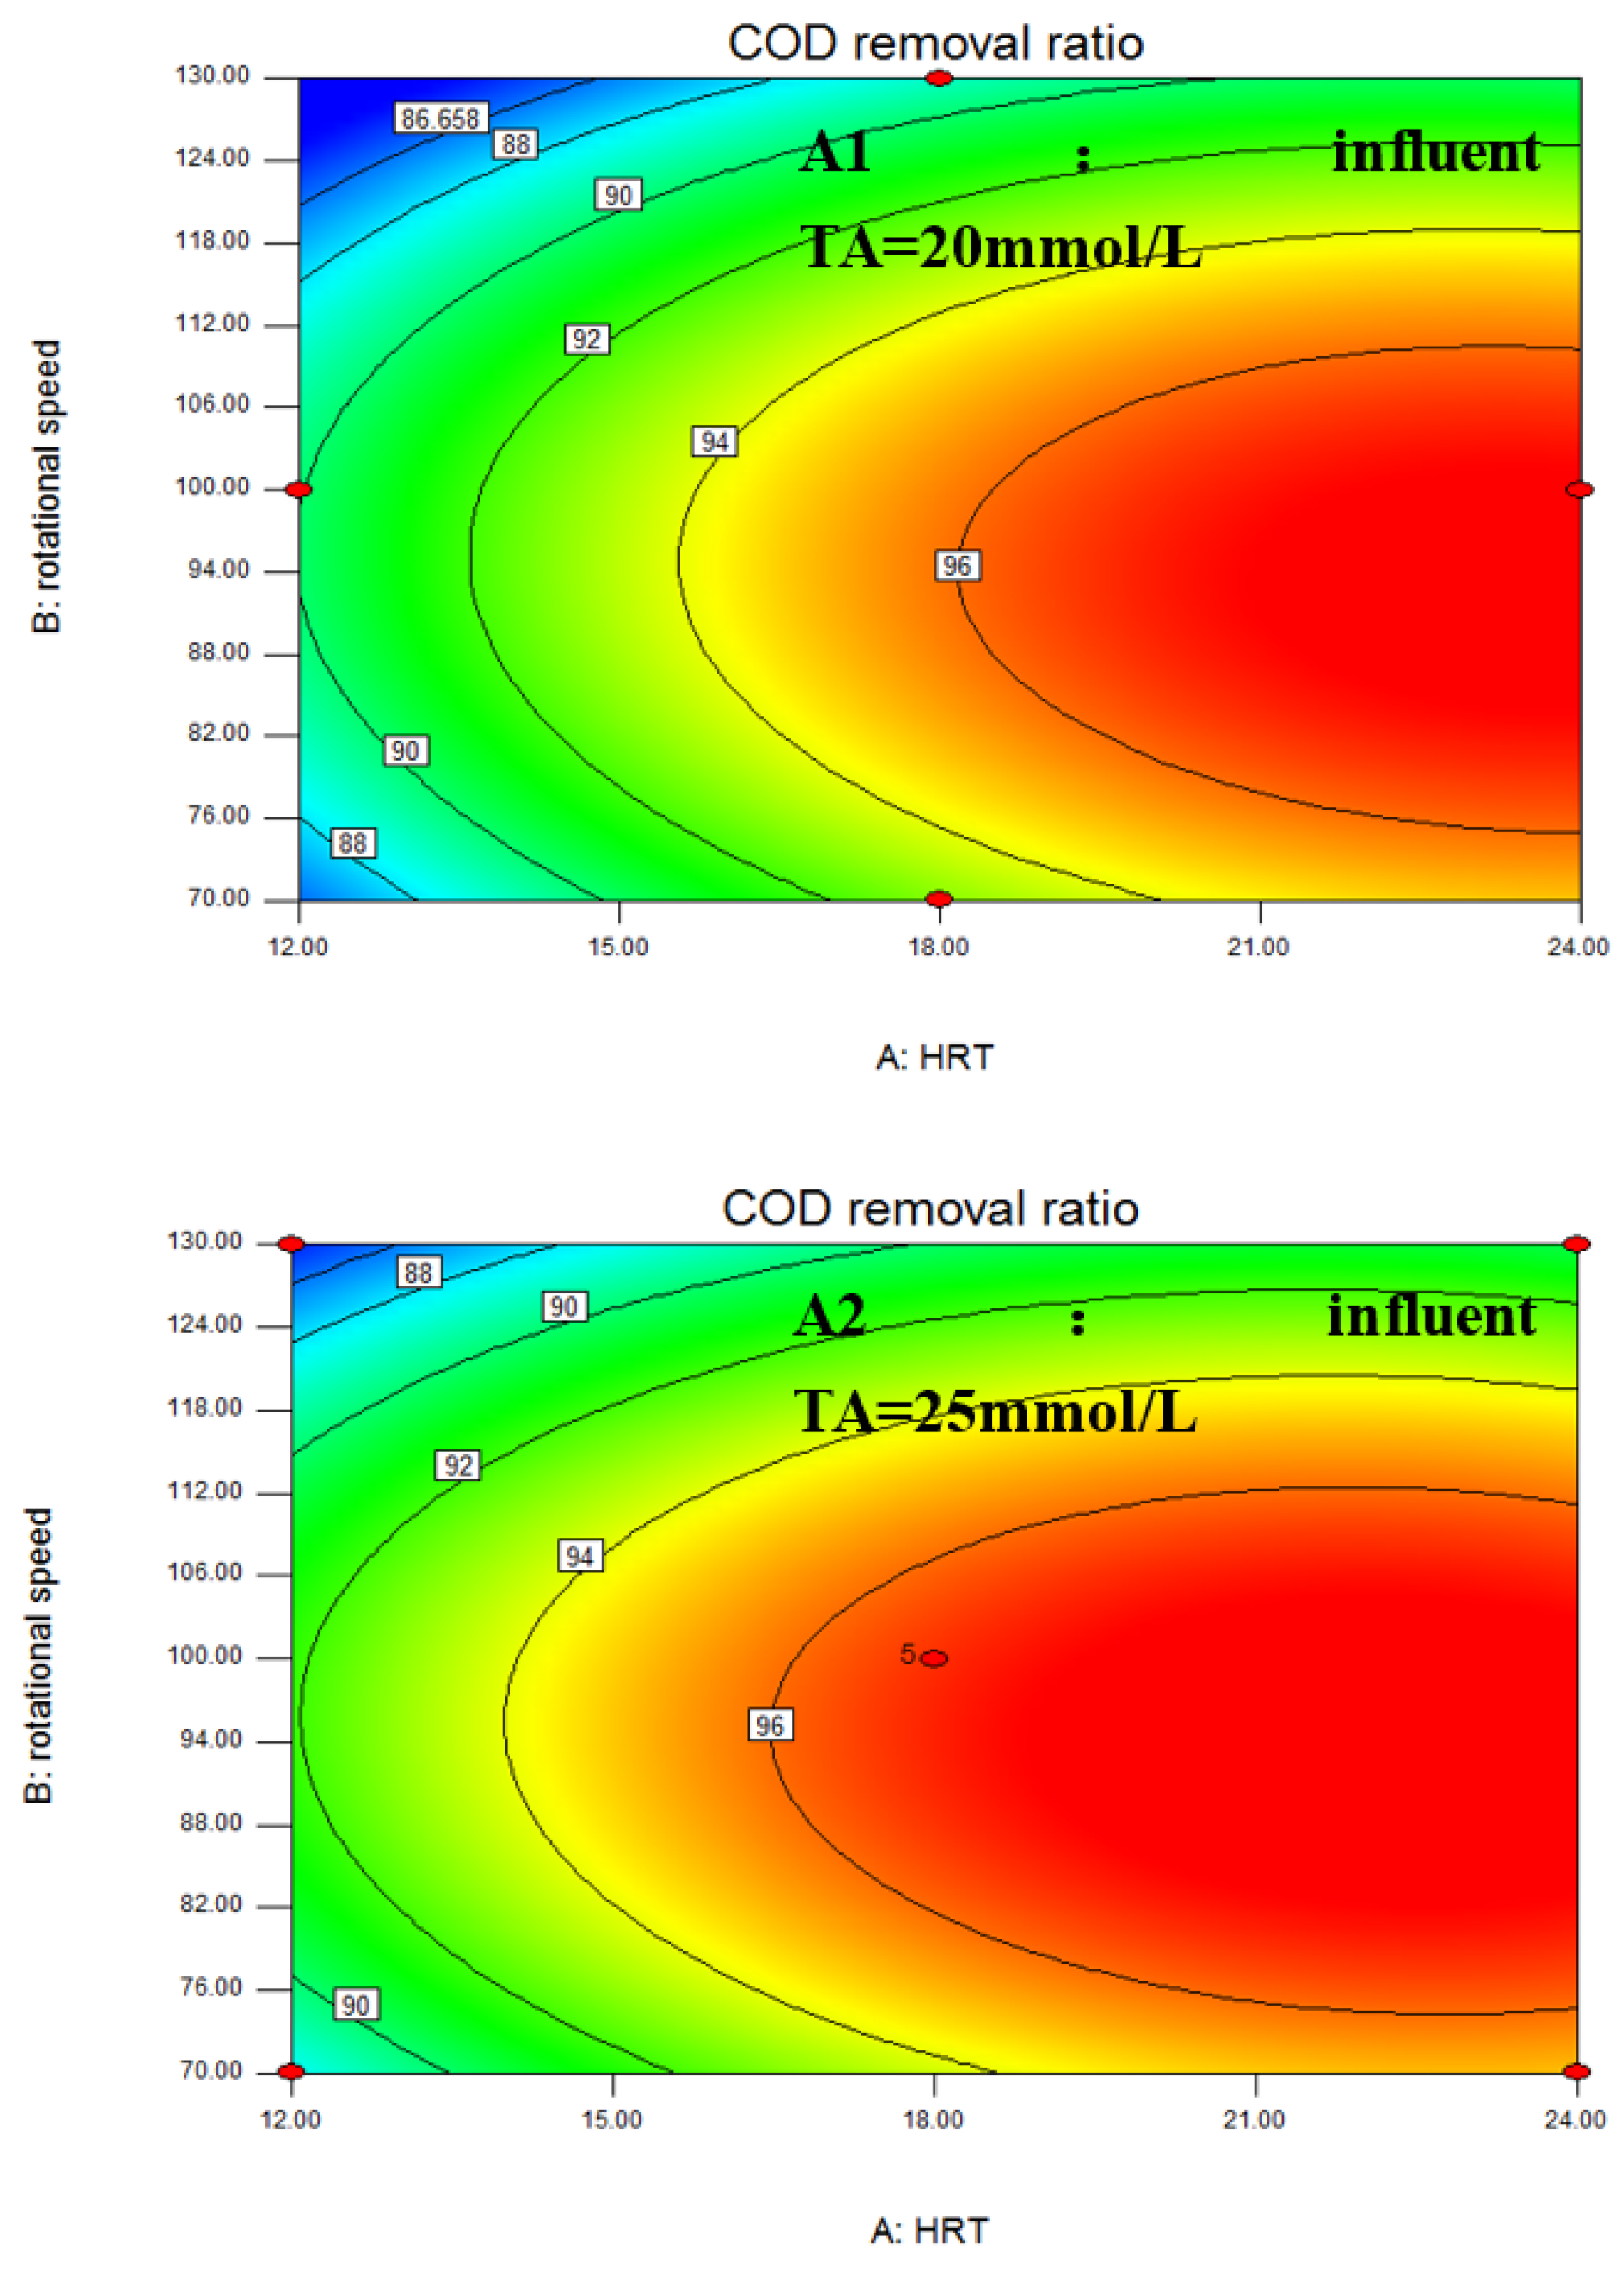
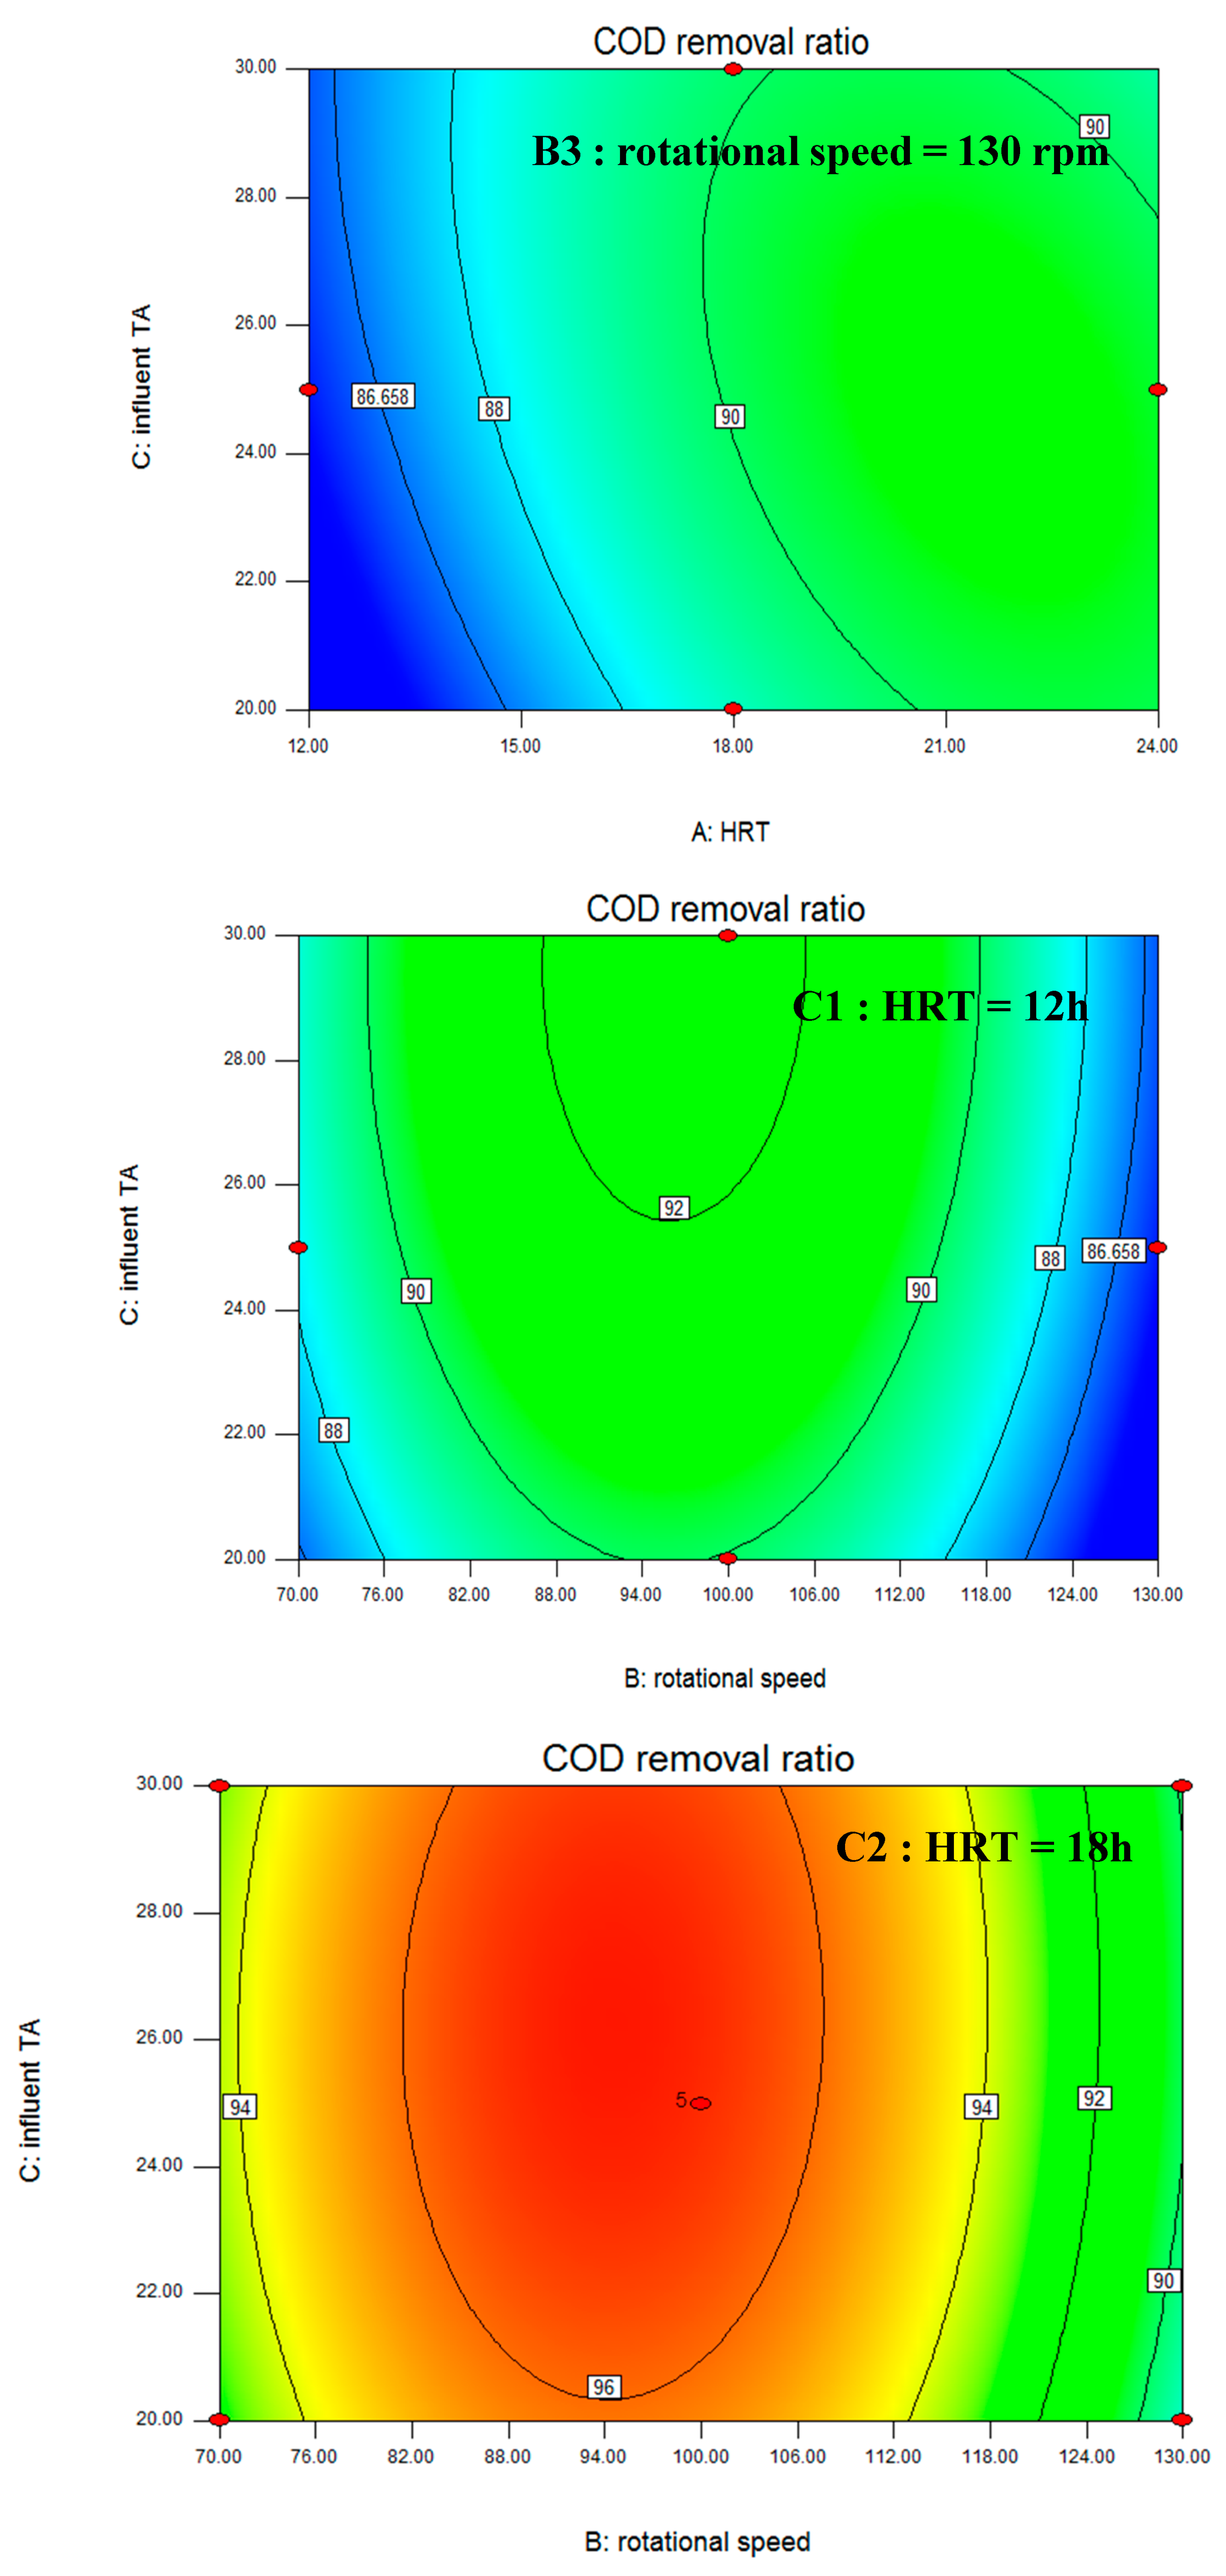
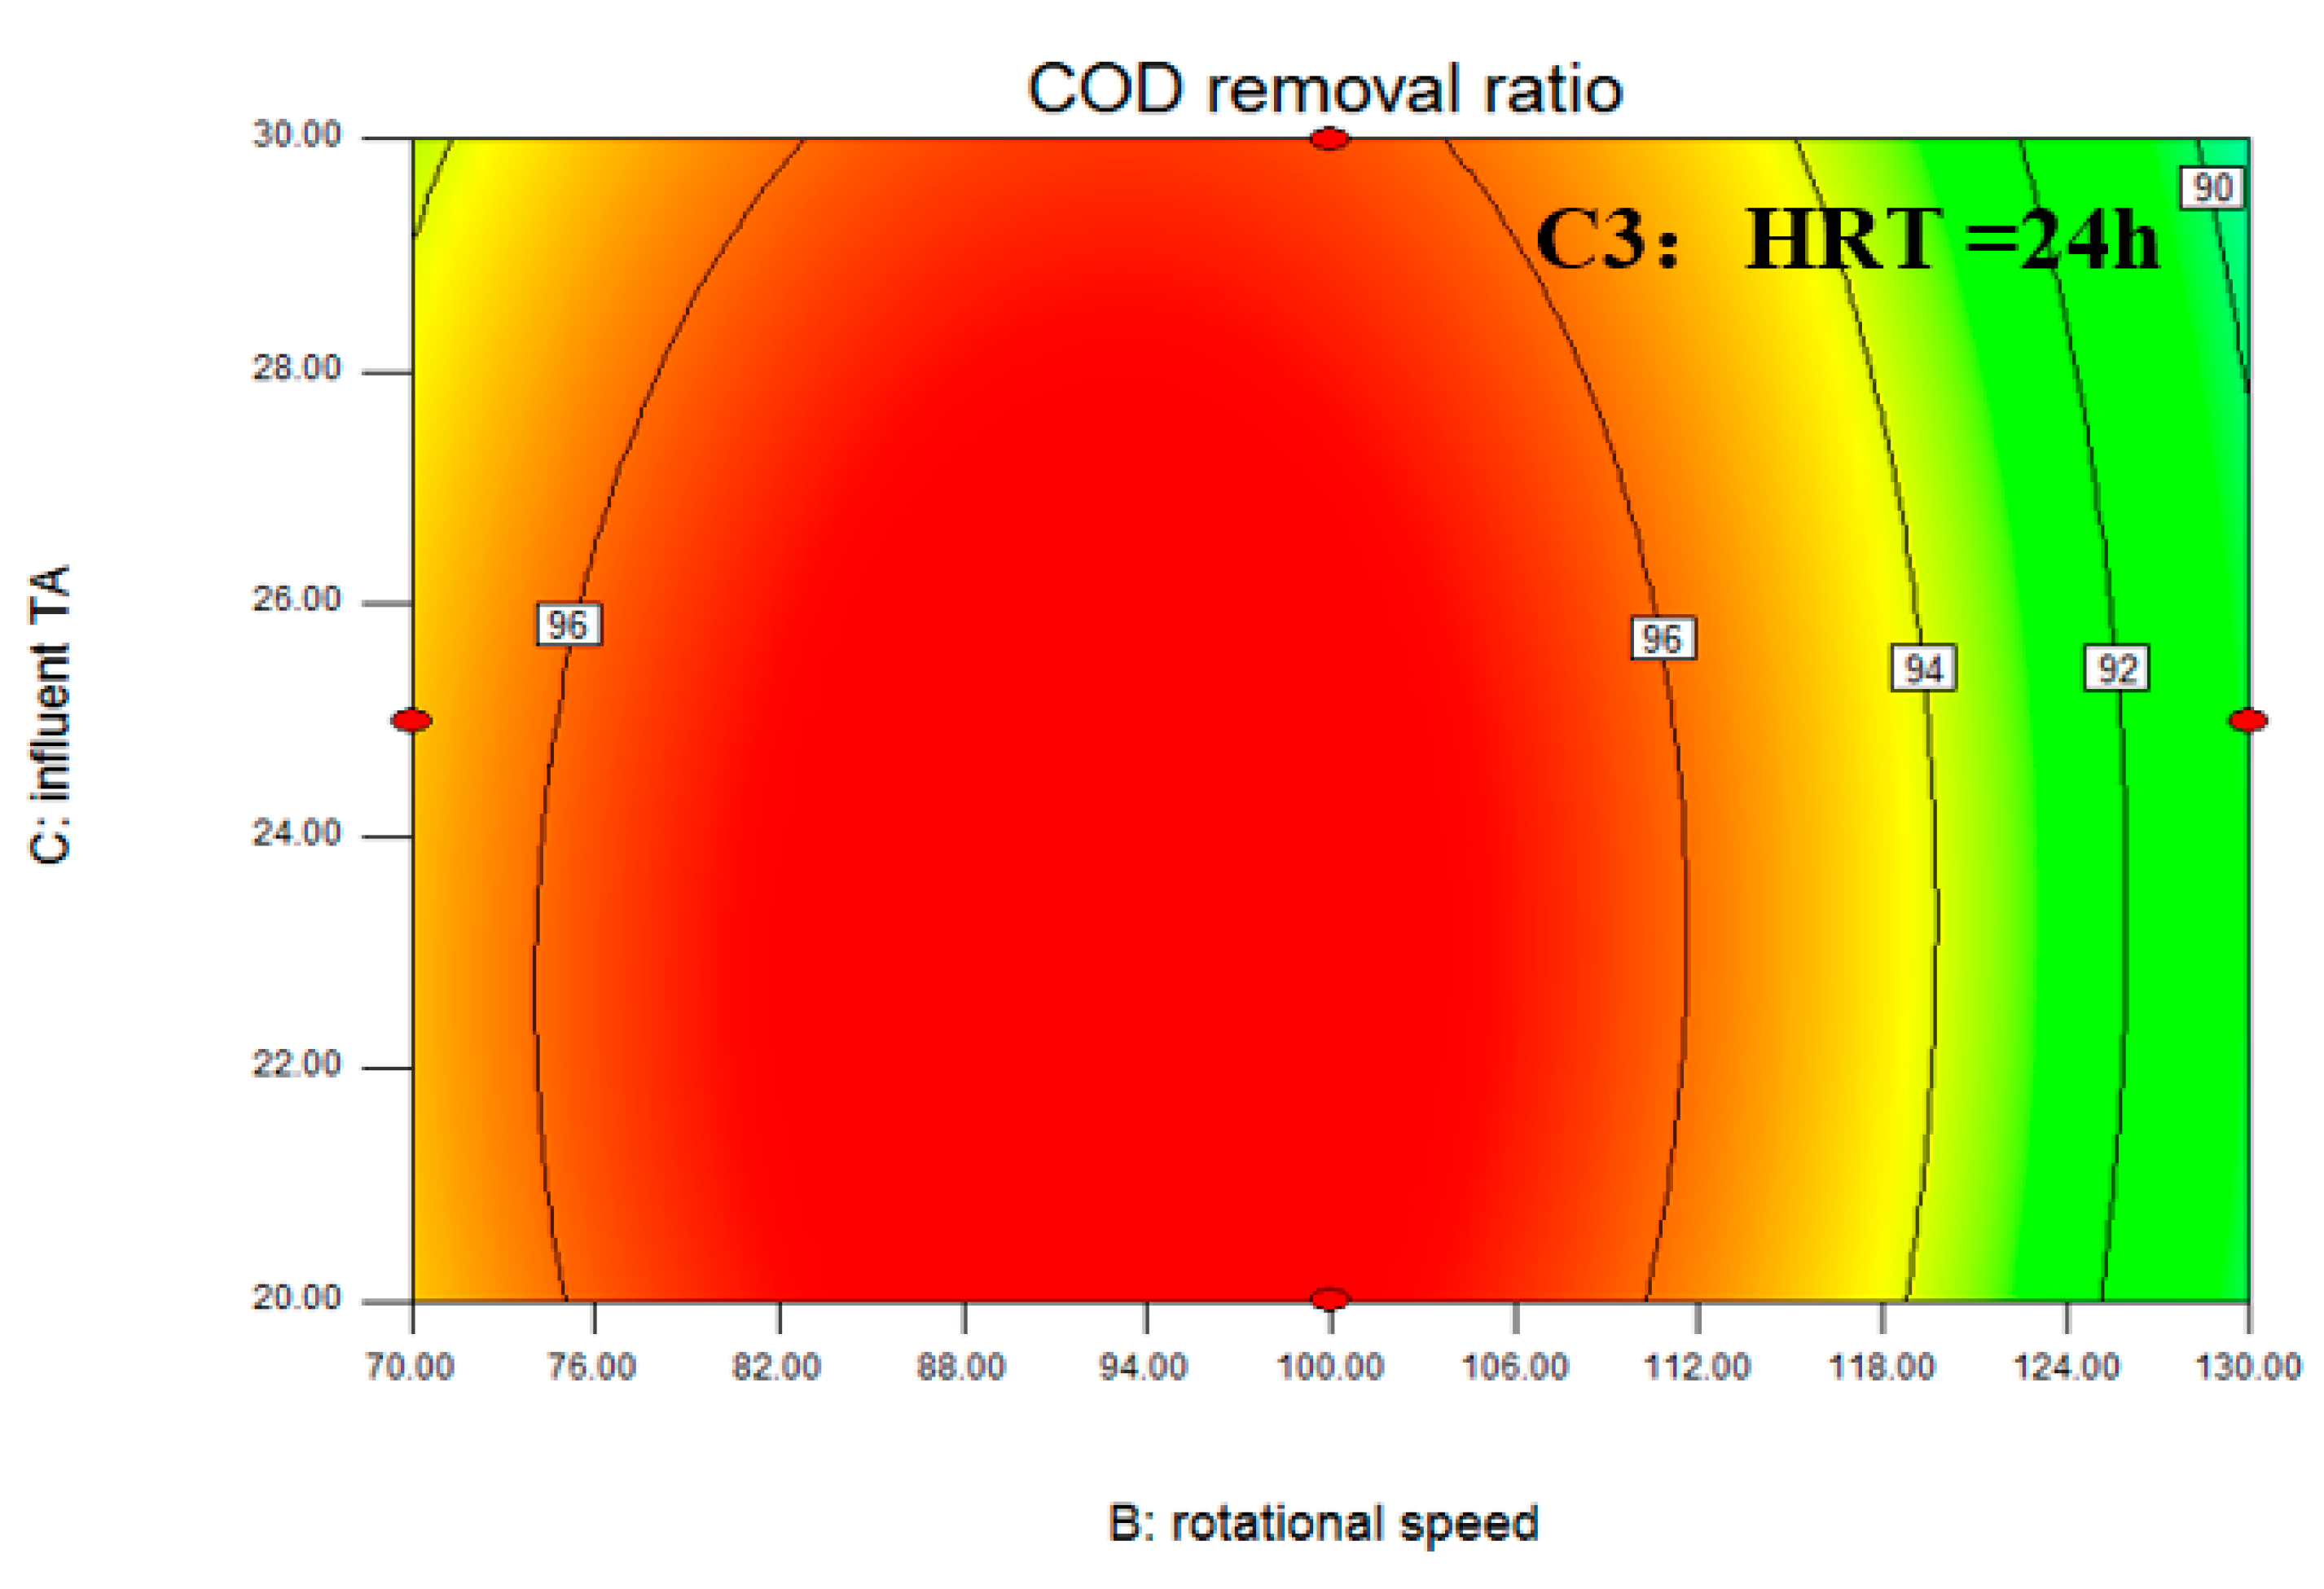
HRT is an important factor affecting the operation of the reactor, and a reasonable HRT can ensure the optimal removal efficiency and economy of the reactor. Figure 2 shows that the COD removal ratio significantly improved with an increase in HRT. These results were consistent with the results of Ravichandrana et al. [22] and can be explained by the fact that an increase in HRT is beneficial for the growth of the microorganisms in the reactor. This might be due to the increased HRT of the reactor, which enabled the microorganisms to better adapt to the new environment, and that the organic pollutants had enough time to degrade successfully.
Figure 2 shows that when the CMABR rotational speed was between 70 rpm and 101.34 rpm, the COD removal ratio increased with increasing rotational speed. This is because a suitable fluid produced by the appropriate rotational speed would enhance the biological mass transfer between the microorganisms and wastewater, and increase the contact area between fillers and wastewater in the reactor, which in turn would improve the COD removal ratio [23]. When the rotational speed of the CMABR exceeded 101.34 rpm, the COD removal ratio decreased with increasing rotational speed. This is because the shearing force of the water flow generated by the excessively high rotational speed makes the biofilm of the fillers easy to fall off, resulting in the reduction of CMABR biomass. Therefore, the COD removal ratio of the CMABR was decreased.
3.2. Completely Mixed Anaerobic Biofilm Reactor (CAMBR) Performance under Optimal Conditions
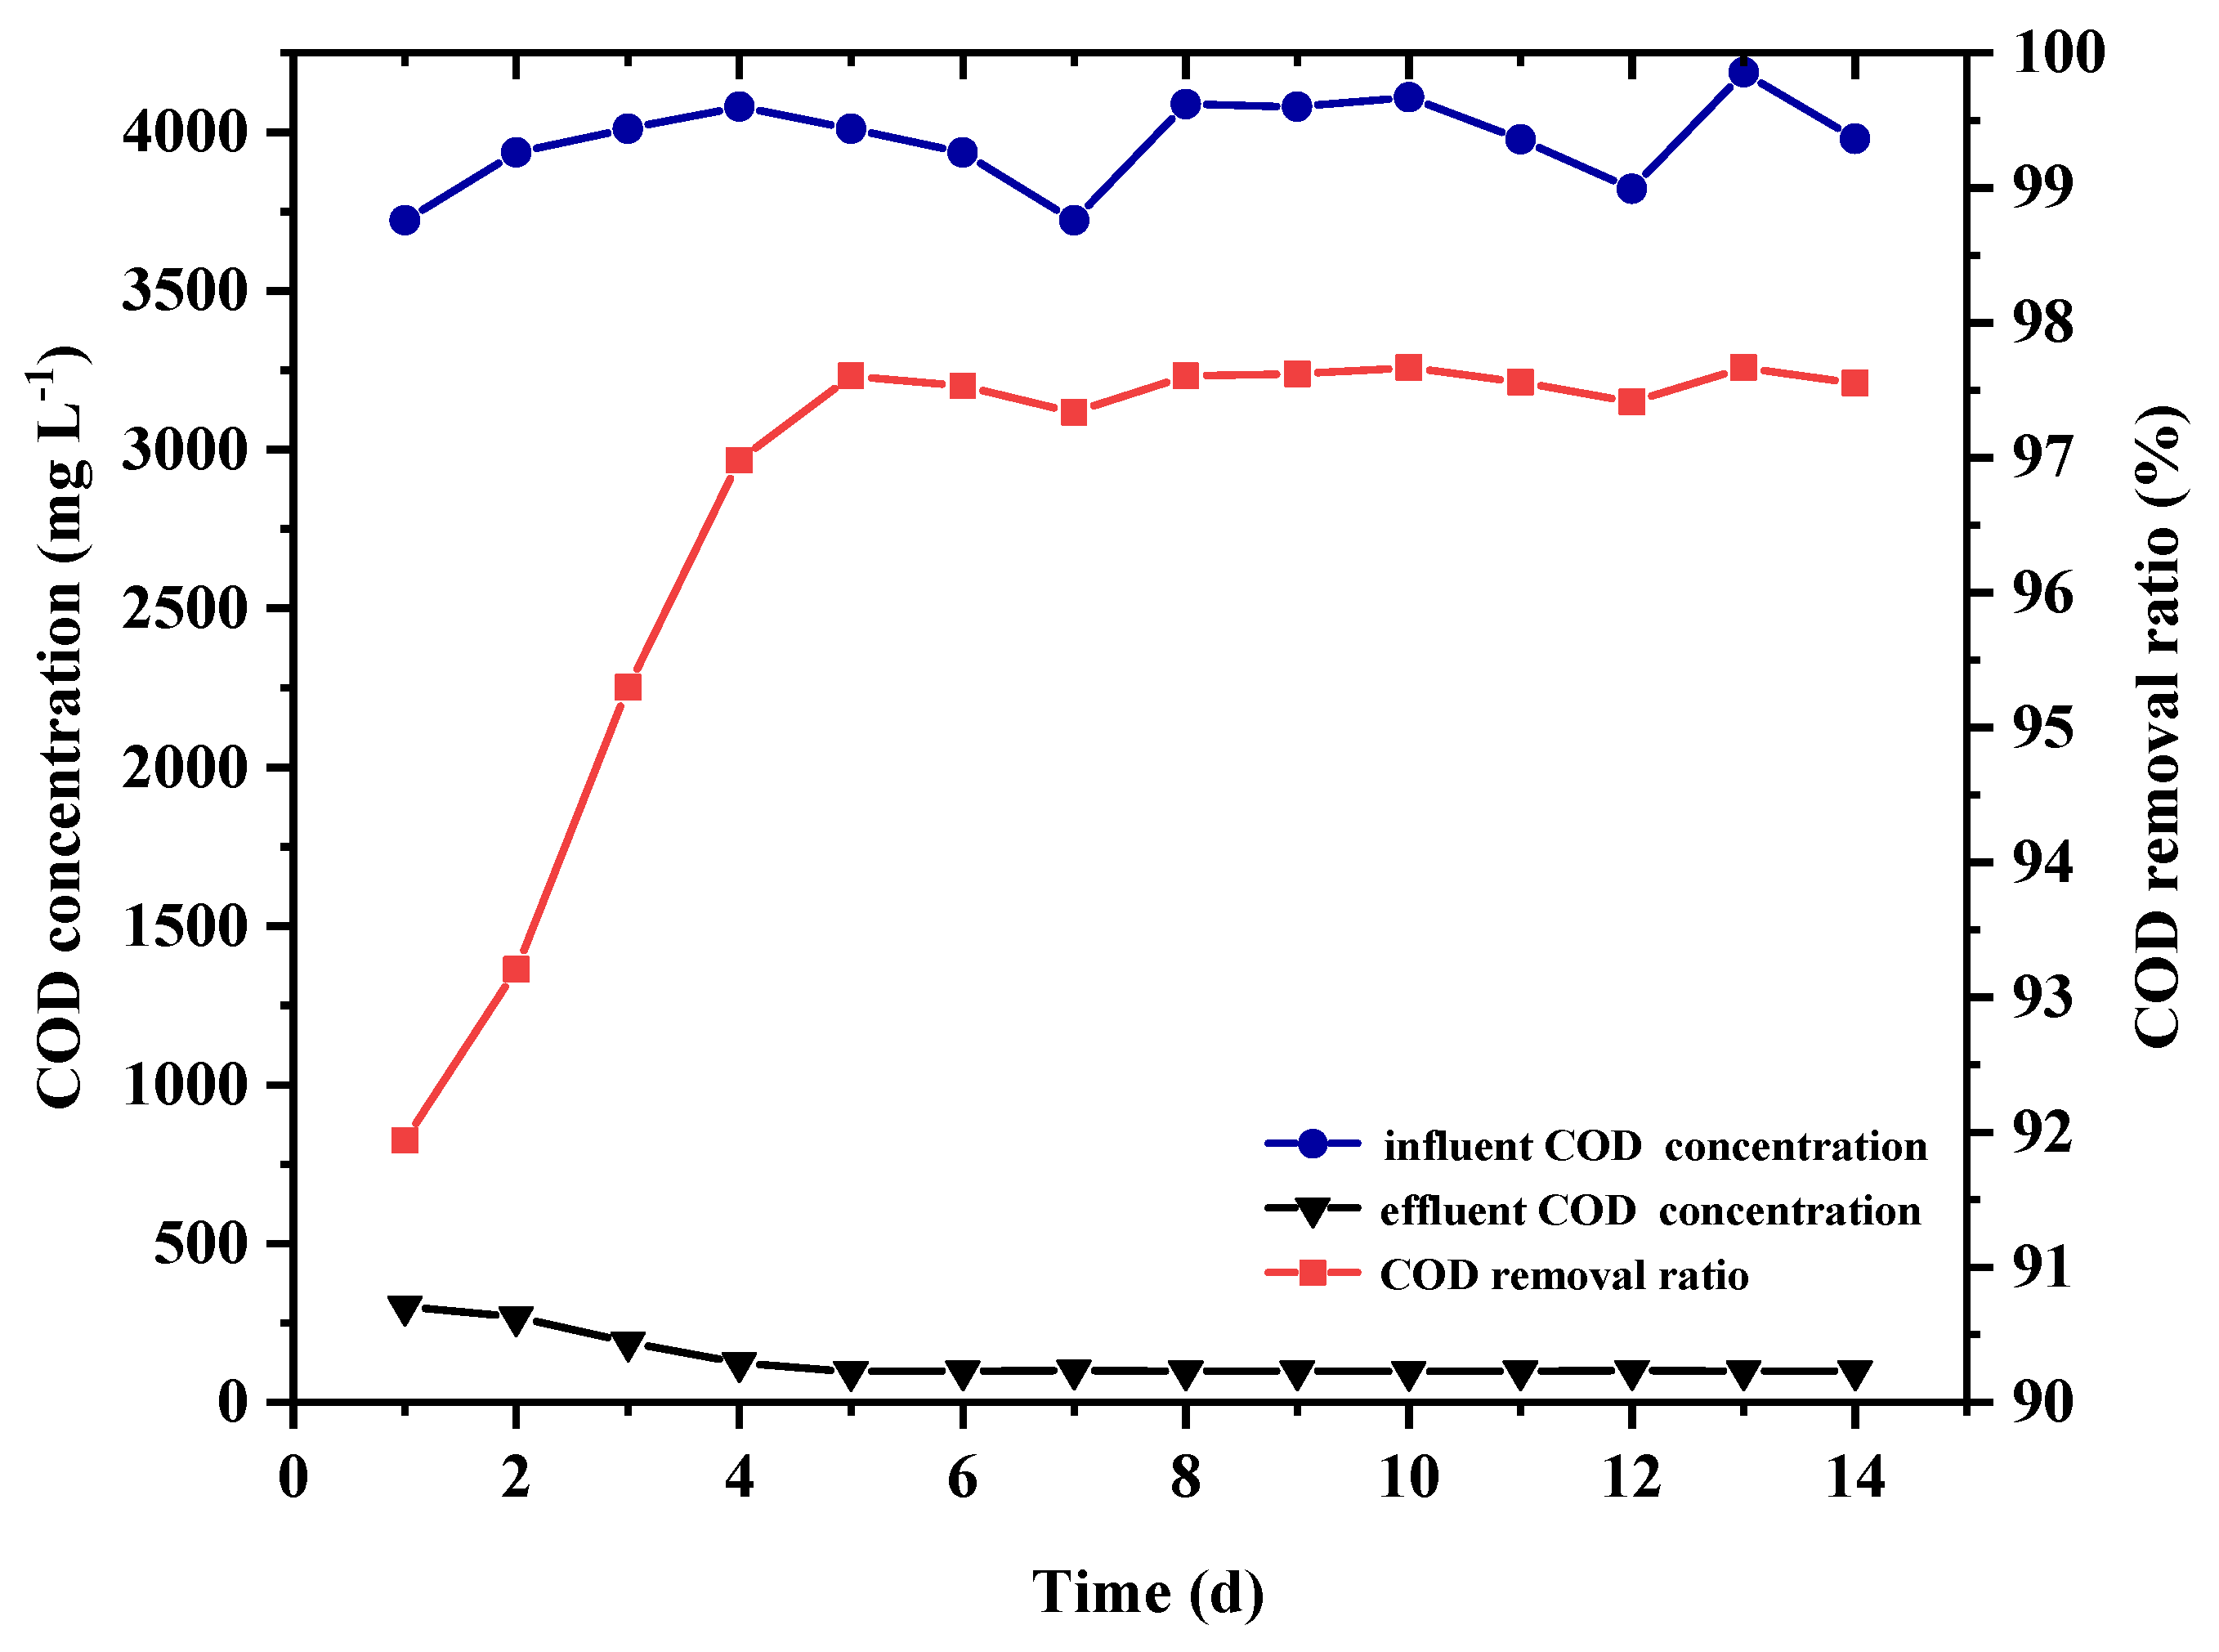
As seen in Section 3.1, maximum COD removal ratio occurred with the HRT of 21.42 h, rotation speed of 101.34 rpm, and influent TA of 25.22 mmol/L. Figure 3 shows that the influent COD concentration was about 4000 mg/L, and the organic loading rate (OLR) was 4.48 kg-COD m−3/day in the reactor. After five days of operation, the reactor remained stable, which can be explained by the microorganisms requiring more time to adapt to the new environment, as described by Shao et al. [24]. The organic pollutant degradation gradually increased through the biofilm on the fillers as the biofilm became denser and more stable during the reactor stabilization, and the COD removal ratio was maintained at 96%.
The OLR in CMABR was only 4.48 kg COD m−3/day compared with the other reactors. For example, Baloch et al. [25] obtained an OLR from the anaerobic granular bed baffled reactor (GRABBR) from the treatment of brewage wastewater of between 2.16 kg COD m−3/day–13.38 kg COD m−3/day, with the COD removal ratio of 93–96%. Parawira et al. [26] reported an OLR from a UASB reactor for the treatment of brewage wastewater as 6.0 kg COD m−3/day, and the COD removal ratio of 60%. Shao et al. [24] reported an OLR for the anaerobic sequencing batch reactor (ASBR) for the treatment of brewage wastewater of 5.0 kg COD m−3/day and a COD removal ratio of 90%. The low OLR was due to the batch operation in the CMABR. Compared with other types of reactors, the organic loading rate of the CMABR was 4.48 kg COD m−3/day and the COD removal ratio reached 96%. This shows that the CMABR had a higher processing efficiency and impact load resistance than the other reactors.
Overall, microorganisms could be denser and more stable using polyurethane filler as the carrier, which increased the reactor processing capacity. These results were in agreement with the conclusions of Miqueleto et al. [27]. As the fillers circulated in the reactor, the contact area between the wastewater and the fillers increased, and the liquid phase mass transfer ratio increased. According to the result of Cubas et al. [28], the liquid phase mass transfer affected the biochemical reaction process. Therefore, the biomass transfer process between the wastewater and the filler was increased, and the biochemical treatment capacity of the microorganism was greatly improved.
3.3. Microbial Community Study of the CMABR
3.3.1. Macrostructure of Reactor Biophase
During the filling process, the color of the fillers gradually deepened from white to yellowish brown, and finally to black as the biofilm grew and compacted on the fillers. This suggests that the biomass on the fillers gradually increased and the biofilm matured and was more compacted. After the reactor operation was stable for a period of time under the HRT of 21.42 h, rotational speed of 101.34 rpm, and influent TA of 25.22 mmol/L, the fillers were taken out from the reactor and the per unit of fillers was measured. The results are shown in Table 3.
Table 3 shows that the average filler film amount per unit was 0.574 ± 0.059 g/g in the reactor. The filling rate of the reactor filler was 30%, under the HRT of 21.42 h, rotational speed of 101.34 rpm, and influent TA of 25.22 mmol/L; when the reactor influent COD concentration was 4000 mg/L, the COD removal ratio reached over 96%, indicating that the reactor had a high degradation ratio of organic pollutants. These results show that under the optimum conditions, the fillers fully contacted with the wastewater, which would be conducive to enhance the effective contact area between the fillers and wastewater. Meanwhile, the microorganisms grew better and remained on the filler, so the reactor could cope with a higher organic load, and the obtained results were consistent with the conclusions of Miqueleto et al. [27].
3.3.2. Microstructure of the CMABR Microbial Phase
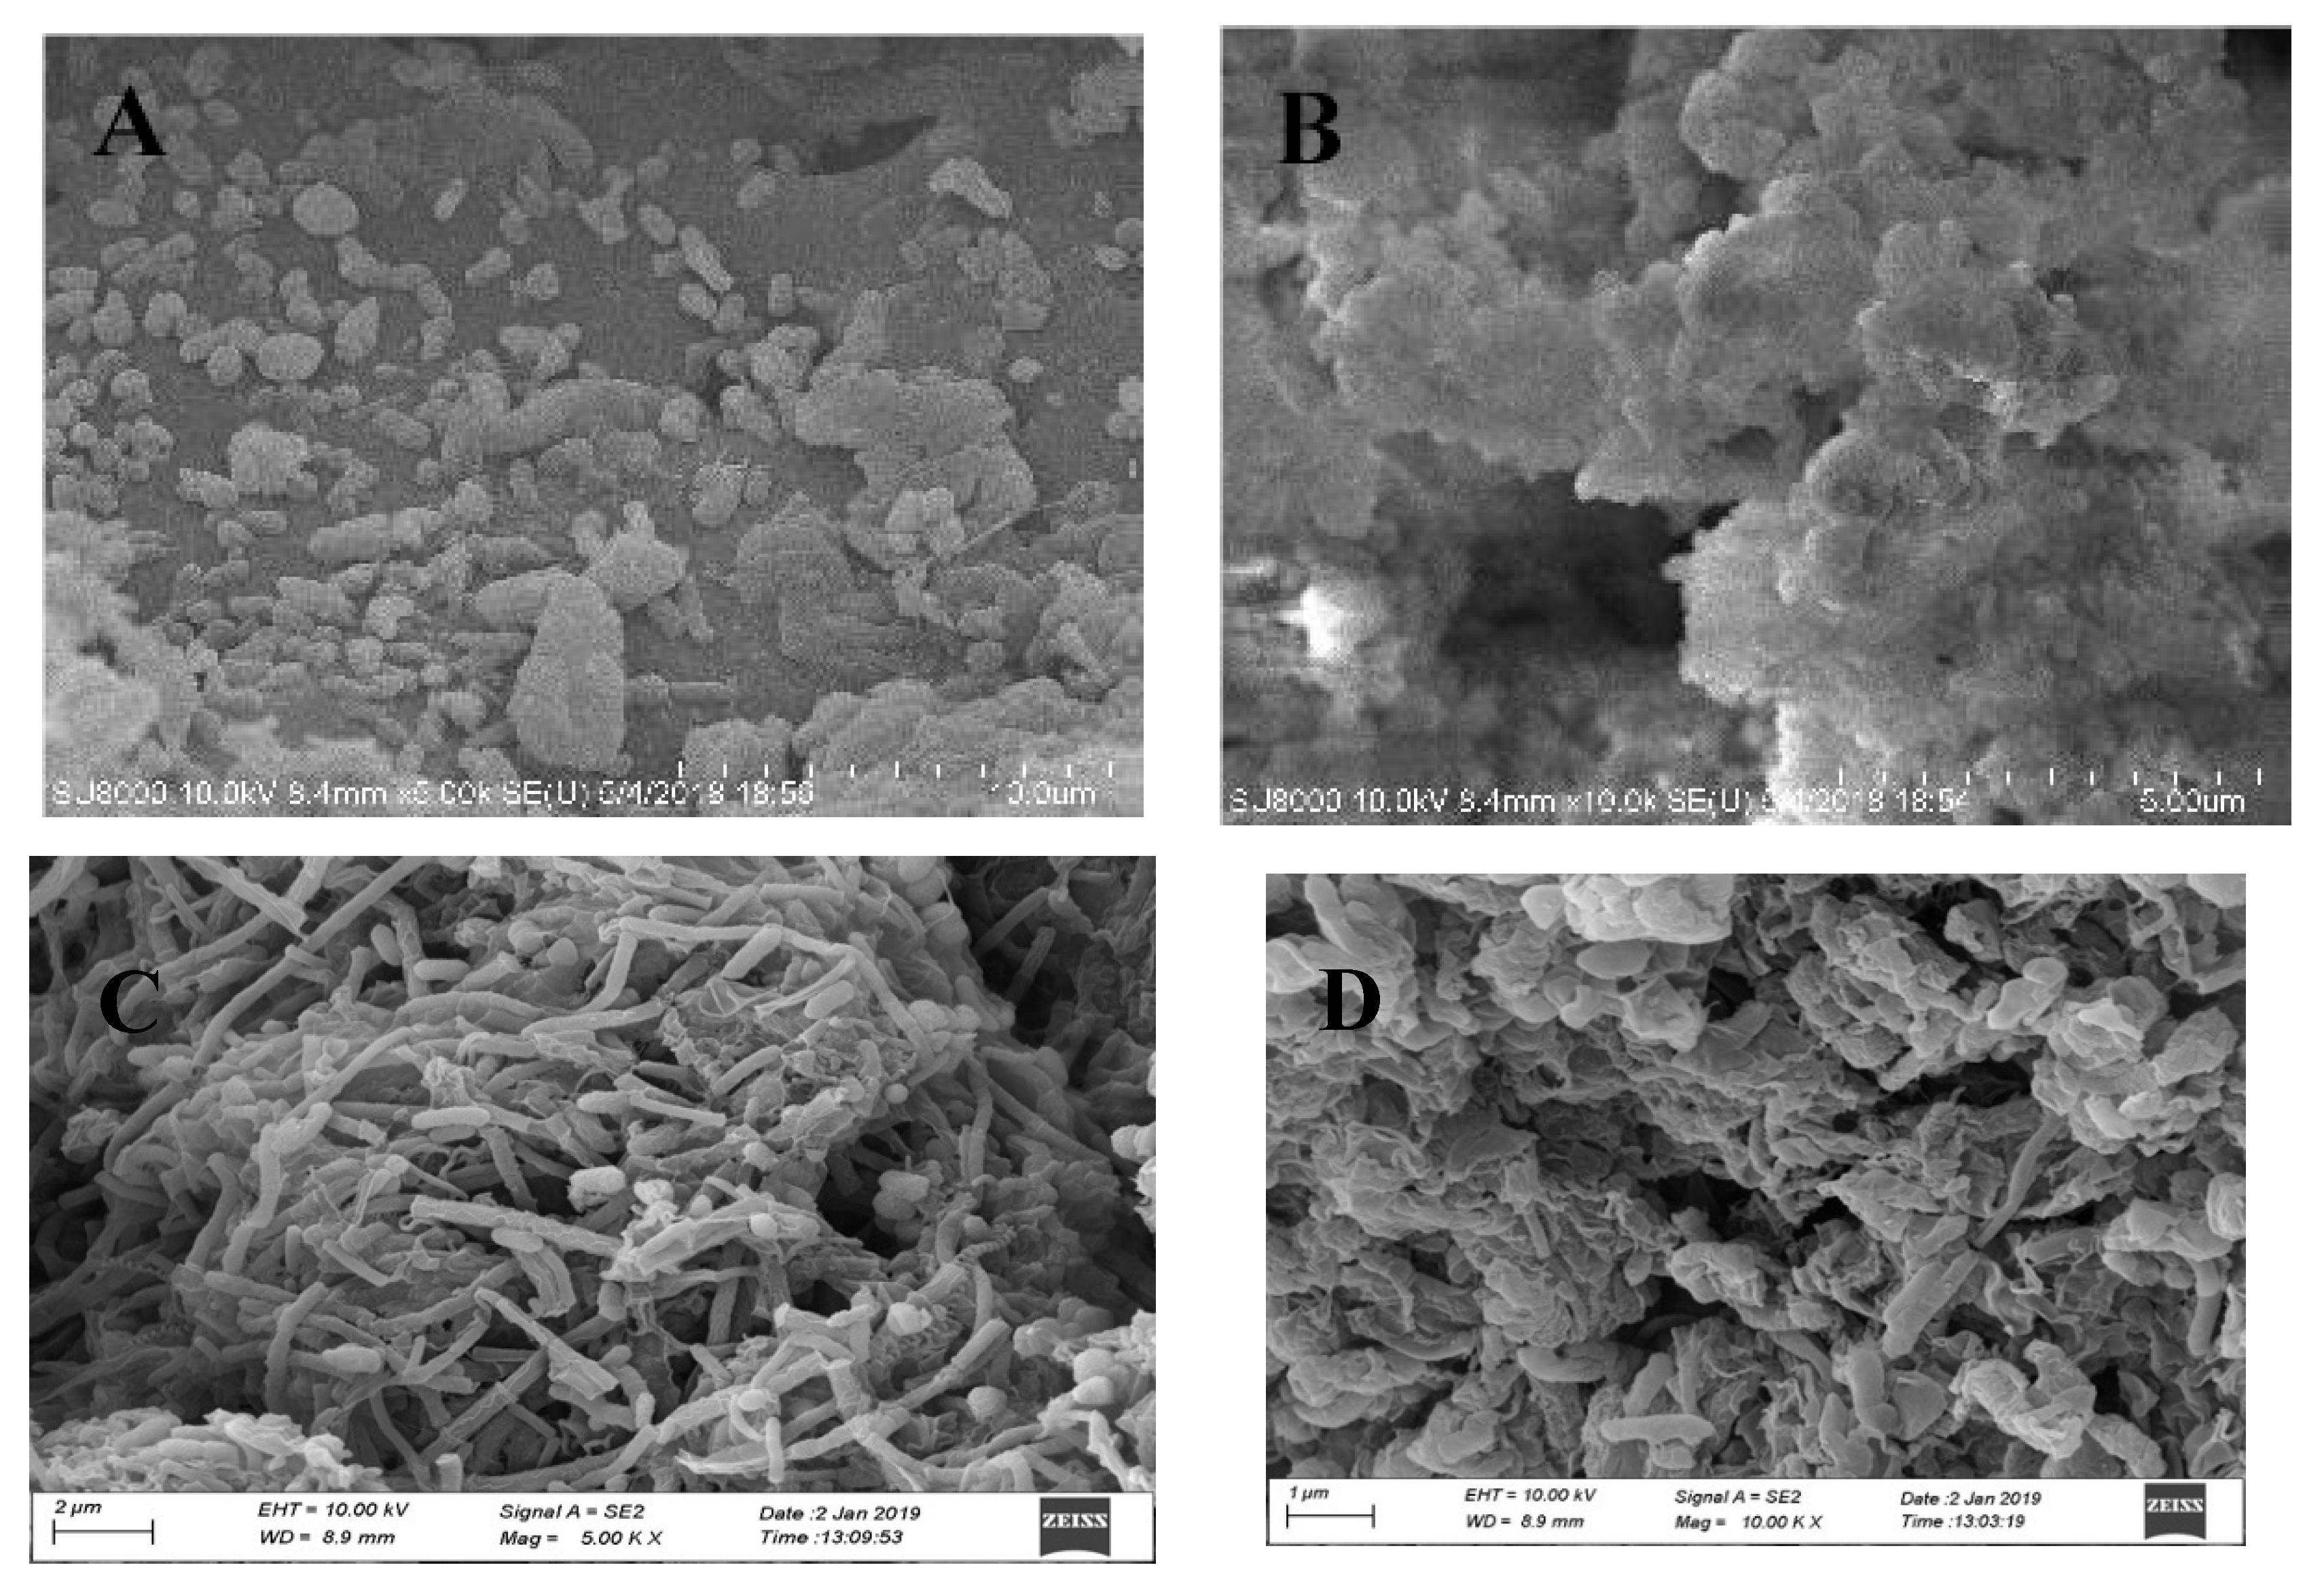
The microbial community of the biofilm after aerobic pre-filming was observed by SEM, and the results are shown in Figure 4A,B. It can be seen that a large number of microorganisms were attached to the surface of the fillers. After the aerobic hanging film, these aerobic bacteria improved the surface properties of the polyurethane fillers, which would be conducive to the anaerobic hanging film of the fillers. Figure 4C,D shows the composition of the microbial community on the surface of the fillers during the stable operation of the CMABR. It can be seen that a large number of microorganisms were attached to the surface of the fillers with a diversity of species including various types of spherical, filamentous, and bracket bacteria. These microorganisms were connected, intertwined, and glued together with the support of extracellular polymeric substances (EPS) [29].
3.3.3. Sequence Analysis of the Microbial Community Structure
Table 4 presents the high quality readings, OTU numbers, Shannon, ACE, Chao1, and Simpson indices of samples Z0 from raw sludge, and Z1 from biofilm on fillers, during stable operation. From Table 4, the number of samples of Z0 and Z1 was 101,014 and 70,858, and the OTU values were 3341 and 1440, respectively. In the analysis of the sample microbial community distribution abundance index, ACE, and Chao1, the ACE and Chao1 values of Z0 were 98,003 and 34,662, while Z1 was 221,517 and 75,698, respectively, indicating that the distribution abundance of microbial communities on the fillers was higher than that of the inoculated sludge. For the Shannon and Simpson analysis of the microbial distribution diversity index of the sample community, it was shown that the Shannon and Simpson values of Z0 were 2.54 and 0.24, while the Z1 were 1.56 and 0.36, respectively. This indicates that the microbial community diversity in Z0 was richer than that in Z1. Analyzing the above data showed that the polyurethane fillers could enrich the microorganisms, and verified that the CAMBR had a higher processing capacity.
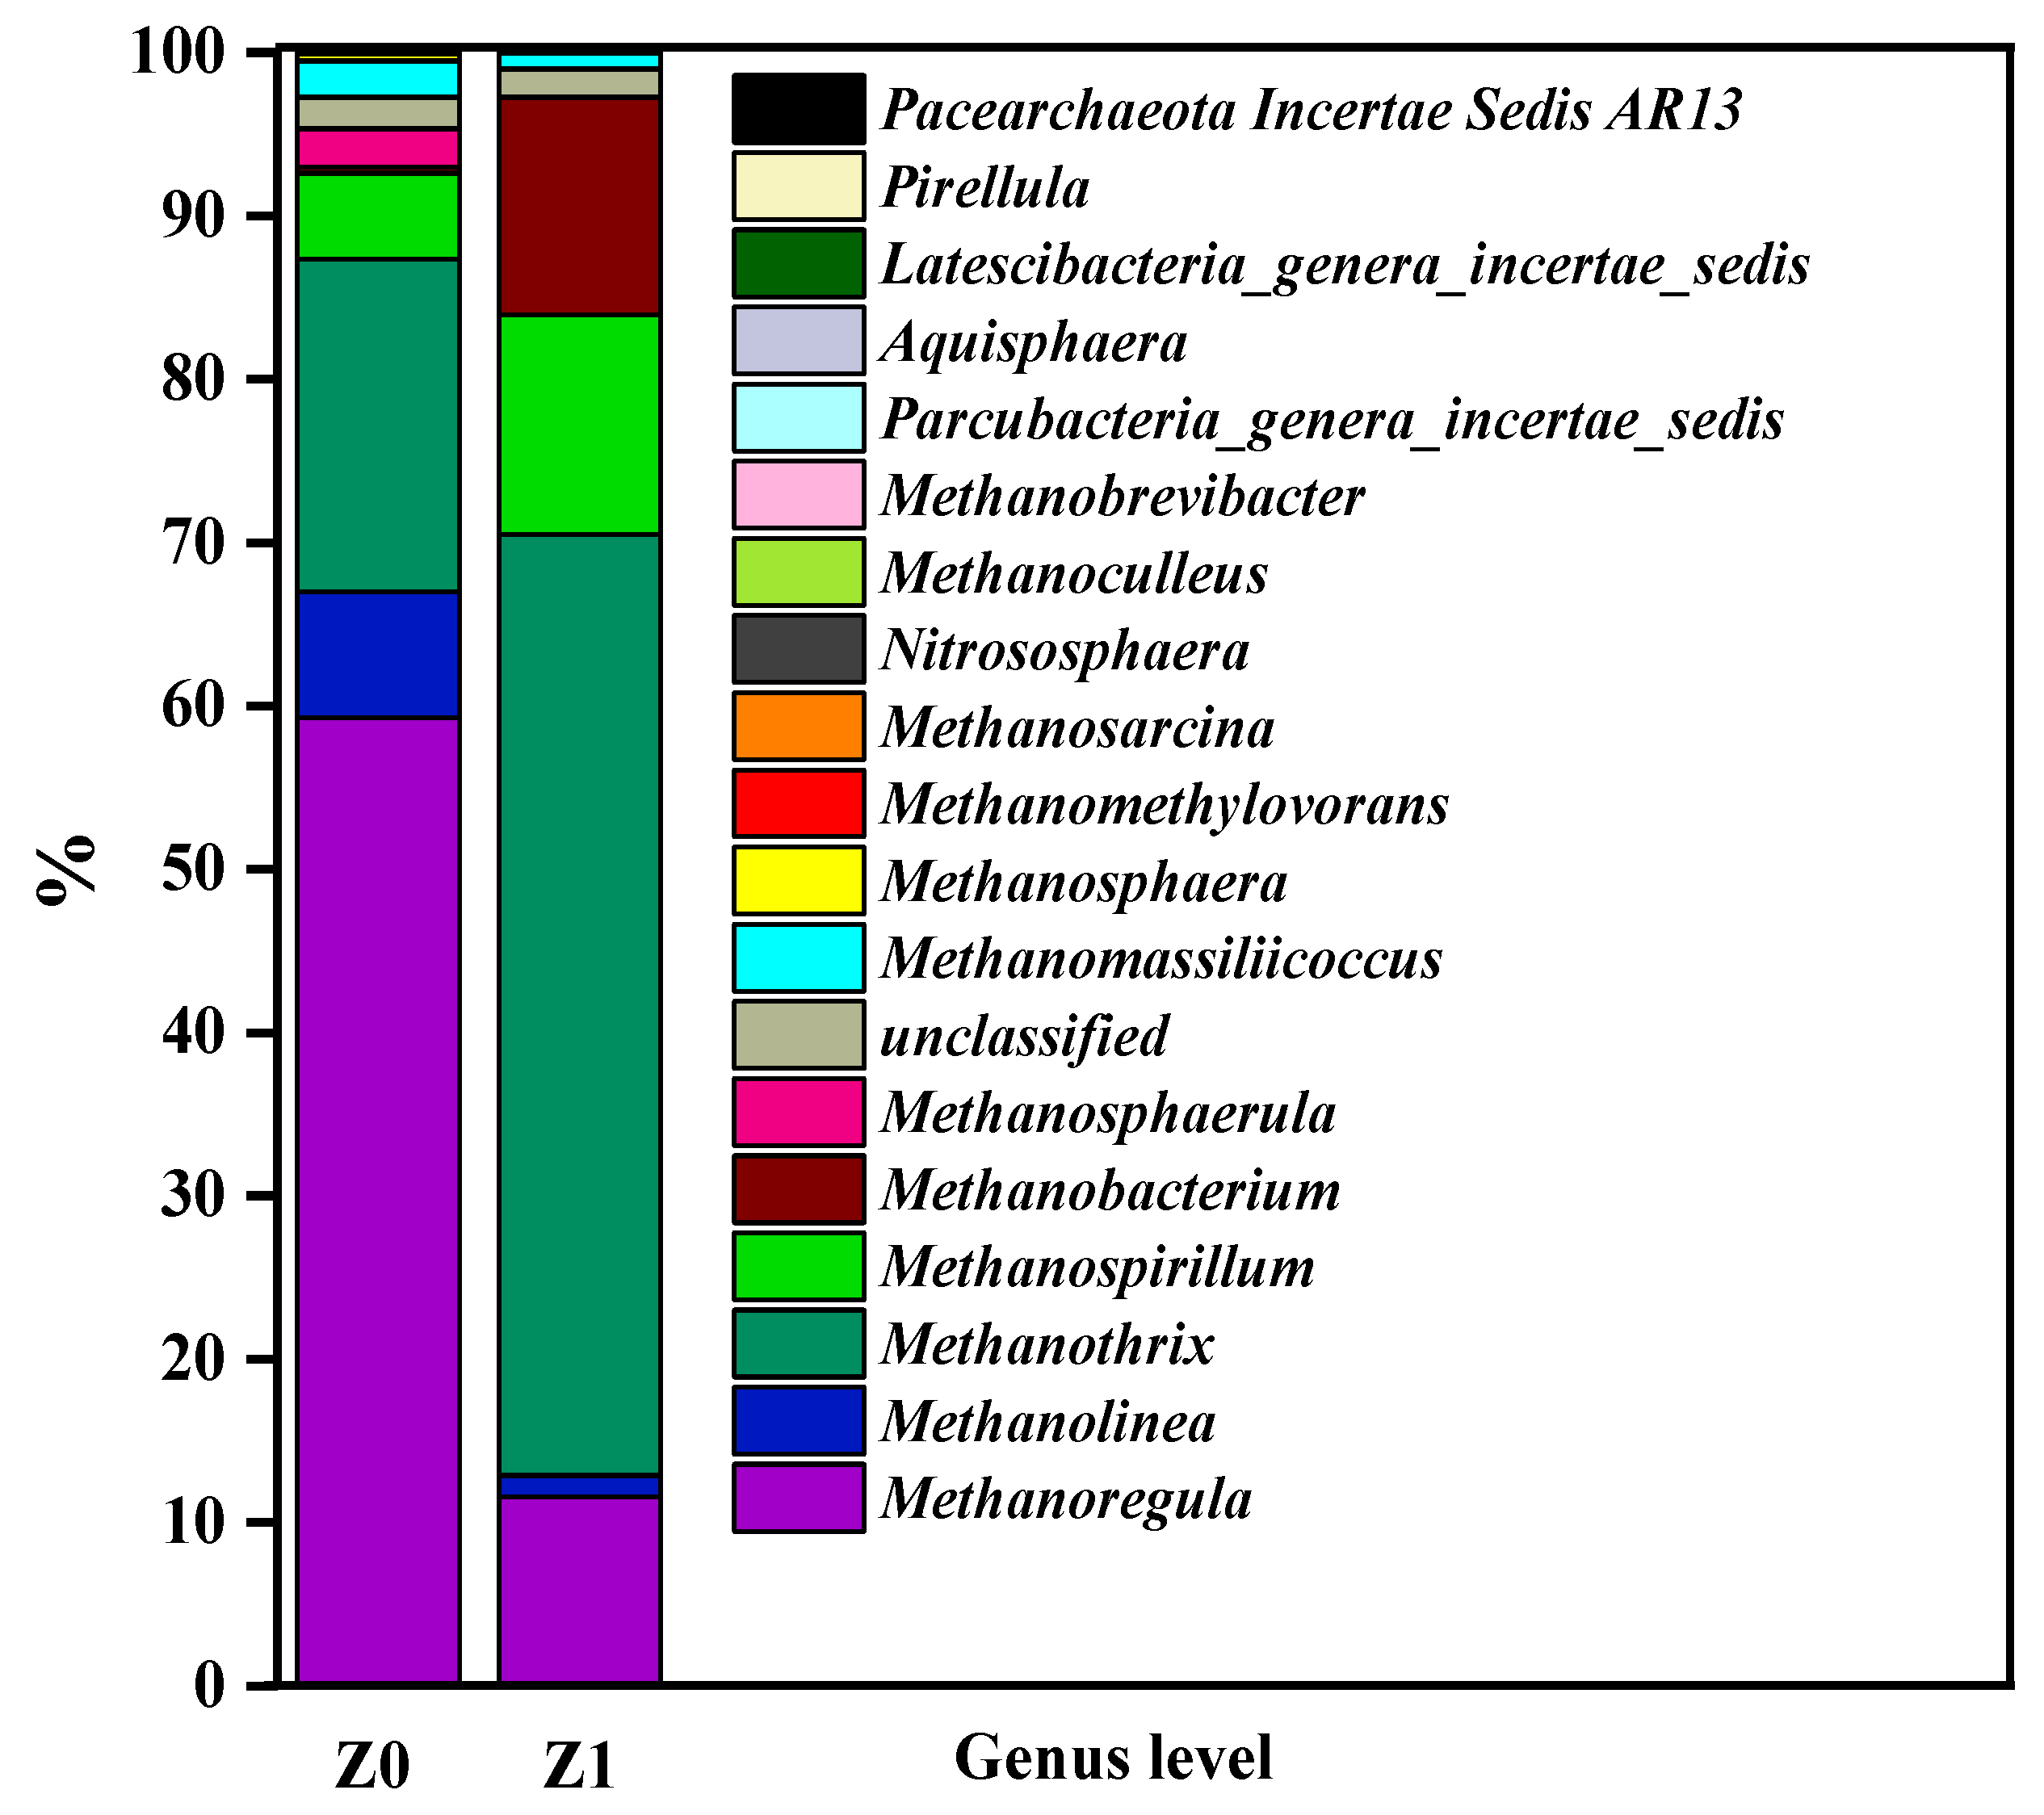
Figure 5 shows the distribution of archaea in the anaerobic inoculated sludge and the biofilm on the fillers during stable reactor operation. After analysis, a total of 18 archaea were detected in the two sample groups. In the anaerobic inoculation sludge, Methanoregula, Methanothrix, Methanolinea, Methanospirillum, Methanosphaerula, and Methanomassiliicoccus were the dominant bacteria with relative abundances of 59.28%, 20.37%, 7.7%, 5.27%, 2.32%, and 2.23%, respectively. After a period of stable operation, the dominant methanogens in the CMABR were converted to Methanoregula (11.59%), Methanolinea (1.32%), Methanothrix (57.6%), Methanospirillum (13.44%), and Methanobacterium (13.31%). As reported by many other studies, Methanoregula belongs to the acetic acid methanogens [30]; Methanolinea belongs to the mesophilic hydrogenotrophic methanogens [31]; Methanothrix belongs to the mesophilic acetic methanogens [32]; Methanospirillum belongs to mesophilic hydrogenotrophic methanogens; and Methanobacterium, Methanosphaerula, and Methanomassicicoccus belong to hydrogenotrophic methanogens.
These results show that the types of biofilm on the fillers were the same as those in the inoculated sludge. However, the dominant genus significantly changed: Methanothrix and Methanospirillum belong to mesophilic acetic methanogens. In the CMABR, the concentrations of acetic acid and ethanol were relatively constant, and the temperature was 35 °C. This provided a suitable growth environment, which made these two the dominant genus. At the same time, the processes of biofilm formation and biological mass transfer cannot be ignored. According to the observations of Lauwers et al. [33], methanogens often participate in the biofilm formation process by attaching to the surface of other microorganisms. A lower concentration of the acetic acid matrix would result in a slower growth rate of acetic acid nutrient microorganisms. The mesophilic hydrogenotrophic methanogens was the dominant archaea group in the early stage of biofilm formation, but was replaced by methanogenous in mature biofilms. The appearance of a large number of Methanothrix in the reactor was consistent with the observation of Ralph et al. [34] on the biofilm of AFBR. Methanothrix did not participate in the initial formation of biofilms, and was mainly found in biofilms attached to the surface of other microorganisms [35], which was consistent with the SEM results in Section 3.3.2. Meanwhile, Methanothrix and Methanospirillum also played key roles in the COD removal process.
4. Conclusions
The maximum COD removal ratio was from the RSM analysis at the HRT of 21.42 h, rotational speed of 101.34 rpm, and influent TA of 25.22 mmol/L. The HRT (p < 0.0001) and rotational speed (p < 0.0001) produced the largest effect. Analysis by SEM demonstrated that the number of Methanothrix gradually increased on the biofilm. High-throughput sequencing showed that the Methanothrix and Methanospirillum were the dominant archaea under stable operation. This study shows that the CMABR has several benefits such as high efficiency, strong biological mass transfer, and a simple reactor structure.
Author Contributions
Conceptualization, D.Z. and W.M.; methodology, K.Z.; software, K.Z.; validation, D.Z., W.M. and K.Z.; formal analysis, W.M.; investigation, K.Z.; resources, D.Z.; data curation, J.L.; writing—original draft preparation, J.L.; writing—review and editing, K.Z.; visualization, C.D.; supervision, K.L.; project administration, D.Z.; funding acquisition, D.Z. All authors have read and agreed to the published version of the manuscript.
Funding
This research work was partly supported by the National Natural Science Foundation of China (No.51778177) and the National Key Research and Development Program China (2016YFB0600502).
Conflicts of Interest
The authors declare there is no conflict of interest.
References
- Han, D.M.; Matthew, J.C.; Cao, G.L. Deep challenges for China’s war on water pollution. Environ. Pollut. 2016, 218, 1222–1233. [Google Scholar] [CrossRef] [Green Version]
- Mark, F. A new wastewater treatment technology for developing countries. Filtr. Sep. 2014, 51, 14–17. [Google Scholar]
- Shi, J.X.; Han, Y.X.; Xu, C.Y. Enhanced anaerobic degradation of selected nitrogen heterocyclic compounds with the assistance of carboxymethyl cellulose. Sci. Total Environ. 2019, 689, 781–788. [Google Scholar] [CrossRef]
- Chen, Y.; Cheng, J.J.; Creamer, K.S. Inhibition of anaerobic digestion process: A review. Bioresour. Technol. 2008, 99, 4044–4064. [Google Scholar] [CrossRef]
- Yang, J.; Wang, D.H.; Luo, Z.F. Influence of reflux ratio on the anaerobic digestion of pig manure in leach beds coupled with continuous stirred tank reactors. Waste Manag. 2019, 97, 115–122. [Google Scholar] [CrossRef]
- Doğan, K.; Emre, O.K.; Bestamin, Ö. A review on anaerobic biofilm reactors for the treatment of dairy industry wastewater. Process Biochem. 2015, 50, 262–271. [Google Scholar]
- Cheng, H.; Lin, H.; Huo, H.; Dong, Y.; Xue, Q.; Cao, L. Continuous removal of ore floatation reagents by an anaerobic–aerobic biological filter. Bioresour. Technol. 2012, 114, 255–261. [Google Scholar] [CrossRef]
- Li, H.; Han, K.Z.; Li, Z.P. Performance, granule conductivity and microbial community analysis of upflow anaerobic sludge blanket (UASB) reactors from mesophilic to thermophilic operation. Biochem. Eng. 2018, 133, 59–65. [Google Scholar] [CrossRef]
- Sen, S.; Demirer, G.N. Anaerobic treatment of real textile wastewater with a fluidized bed reactor. Water Res. 2003, 37, 1868–1878. [Google Scholar] [CrossRef]
- Noor, S.; Soliman, H.M. Experimental assessment of a new device for gas–liquid separation. Chem. Eng. Res. Des. 2019, 149, 45–51. [Google Scholar] [CrossRef]
- Ding, J.; Wang, X.; Zhou, X.F. CFD optimization of continuous stirred-tank (CSTR) reactor for biohydrogen production. Bioresour. Technol. 2010, 101, 7005–7013. [Google Scholar] [CrossRef]
- Biraj, S.T.; Oie, G.D.; Bhola, T. Flow measurements around guide vanes of Francis turbine: A PIV approach. Renew. Energy 2018, 126, 177–188. [Google Scholar]
- Su, J.F.; Ma, M.; Wei, L. Algicidal and denitrification characterization of Acinetobacter sp. J25 against Microcystis aeruginosa and microbial community in eutrophic landscape water. Mar. Pollut. Bull. 2016, 107, 233–239. [Google Scholar] [CrossRef]
- Marin, P.; Alkalay, D.; Guerrero, L. Design and startup of an anaerobic fluidized bed reactor. Water Sci. Technol. 1999, 40, 63–70. [Google Scholar] [CrossRef]
- Su, J.F.; Luo, X.X.; Wei, L. Performance and microbial communities of Mn(II)-based autotrophic denitrification in a Moving Bed Biofilm Reactor (MBBR). Bioresour. Technol. 2016, 211, 743–750. [Google Scholar] [CrossRef]
- Ceylan, H.; Kubilay, S.; Aktas, N. An approach for prediction of optimum reaction conditions for laccase-catalyzed bio-transformation of 1-naphthol by response surface methodology (RSM). Bioresour. Technol. 2008, 99, 2025–2031. [Google Scholar] [CrossRef]
- Sevgi, P.; Perviz, S. Application of response surface methodology with a Box–Behnken design for struvite precipitation. Adv. Powder Technol. 2019, 30, 2396–2407. [Google Scholar]
- Liu, H.J.; Jiang, W.; Wan, D.J. Study of a combined heterotrophic and sulfur autotrophic denitrification technology for removal of nitrate in water. J. Hazard. Mater. 2009, 169, 23–28. [Google Scholar] [CrossRef]
- Cheng, G.D.; Wang, F.; Li, C. Experimental Study on Modification of Polyurethane Foam Plastics Carriers. China Water Wastewater 2012, 28, 86–89. [Google Scholar]
- Hao, T.W.; Wei, L.; Lu, H. Characterization of sulfate-reducing granular sludge in the SANI® process. Water Res. 2013, 47, 7042–7052. [Google Scholar] [CrossRef]
- Rajneesh, S.; Puspendu, B.; Rajesh, R.D. Optimization of organics removal and understanding the impact of HRT on vermifiltration of brewery wastewater. Sci. Total Environ. 2019, 651, 1283–1293. [Google Scholar]
- Ravichandrana, P.; Balajib, K. Effect of HRT on performance of hybrid upflow anaerobic sludge blanket (HUASB) reactor using bio balls in treatment of pulp and paper mill bagasse wash water. Mater. Today Proc. 2020, 22, 627–632. [Google Scholar] [CrossRef]
- Mahin, M.; Parviz, M.; Nasim, K. Efficient hydrogen gas production from molasses in hybrid anaerobic-activated sludge-rotating biological contactor. Int. J. Hydrog. Energy 2019, 44, 2592–2602. [Google Scholar]
- Shao, X.W.; Peng, D.C.; Teng, Z.H. Treatment of brewery wastewater using anaerobic sequencing batch reactor (ASBR). Bioresour. Technol. 2008, 99, 3182–3186. [Google Scholar] [CrossRef]
- Baloch, M.I.; Akunna, J.C.; Collier, P.J. The performance of a phase separated granular bed bioreactor treating brewery wastewater. Bioresour. Technol. 2007, 98, 1849–1855. [Google Scholar] [CrossRef]
- Parawira, W.I.; Kudita, M.G.; Nyandoroh, R.; Zvauya, A. A study of industrial anaerobic treatment of opaque beer brewery wastewater in a tropical climate using a full-scale UASB reactor seeded with activated sludge. Process Biochem. 2005, 40, 593–599. [Google Scholar] [CrossRef]
- Miqueleto, A.P.; Rodrigues, J.A.; Ratusznei, S.M. Treatment of easily degradable wastewater in a stirred anaerobic sequencing batch biofilm reactor. Water Res. 2005, 39, 2376–2384. [Google Scholar] [CrossRef]
- Cubas, S.A.; Foresti, E.; Rodrigues, J.A.D. Influence of the liquid-phase mass transfer on the performance of a stirred anaerobic sequencing batch reactor containing immobilized biomass. Biochem. Eng. J. 2004, 17, 100–105. [Google Scholar] [CrossRef]
- Shi, J.X.; Xu, C.Y.; Han, Y.X. Enhanced anaerobic degradation of nitrogen heterocyclic compounds with methanol, sodium citrate, chlorella, spirulina, and carboxymethylcellulose as co-metabolic substances. J. Hazard. Mater. 2020, 384, 121496. [Google Scholar] [CrossRef]
- Wang, C.; Jin, Y.G.; Ji, C. An additive effect of elevated atmospheric CO2 and rising temperature on methane emissions related to methanogenic community in rice paddies. Agric. Ecosyst. Environ. 2018, 257, 165–174. [Google Scholar] [CrossRef]
- Hiroyuki, I.; Sakai, S.; Sekiguchi, Y.J. Methanolinea tarda gen. nov., sp. nov., a methaneproducing archaeon isolated from a methanogenic digester sludge. Int. J. Syst. Evol. Microbiol. 2008, 58, 294–301. [Google Scholar]
- Su, C.Y.; Deng, Q.J.; Lu, Y.X. Effect of circulation and micro-aeration on sludge characteristics and microbial community in an ABR for treating traditional Chinese medicine wastewater. Environ. Technol. 2020, 41, 3284–3296. [Google Scholar] [CrossRef]
- Lauwers, A.M.; Heinen, W.; Gorris, L.G. Early stages in biofilm development in methanogenic fluidized-bed reactors. Appl. Microbiol. Biotechnol. 1990, 33, 352–358. [Google Scholar] [CrossRef]
- Rw, R.; De, A.; Ra, N. Light and electron microscopic examinations of methane-producing biofilms from anaerobic fixed-bed reactors. Appl. Environ. Microbiol. 1984, 48, 127–136. [Google Scholar]
- Gorris, L.G.; Van, D.J.M.; Van, D.D.C. Biofilm development in laboratory methanogenic fluidized bed reactors. Biotechnol. Bioeng. 1989, 33, 687–693. [Google Scholar] [CrossRef]
Figure 1.
Reactor configuration.

Figure 2.
Response contour plots for the effect of (A1–A3) HRT and rotational speed, (B1–B3) HRT and influent TA, (C1–C3) rotational speed and influent TA on COD removal ratio.
Figure 2.
Response contour plots for the effect of (A1–A3) HRT and rotational speed, (B1–B3) HRT and influent TA, (C1–C3) rotational speed and influent TA on COD removal ratio.

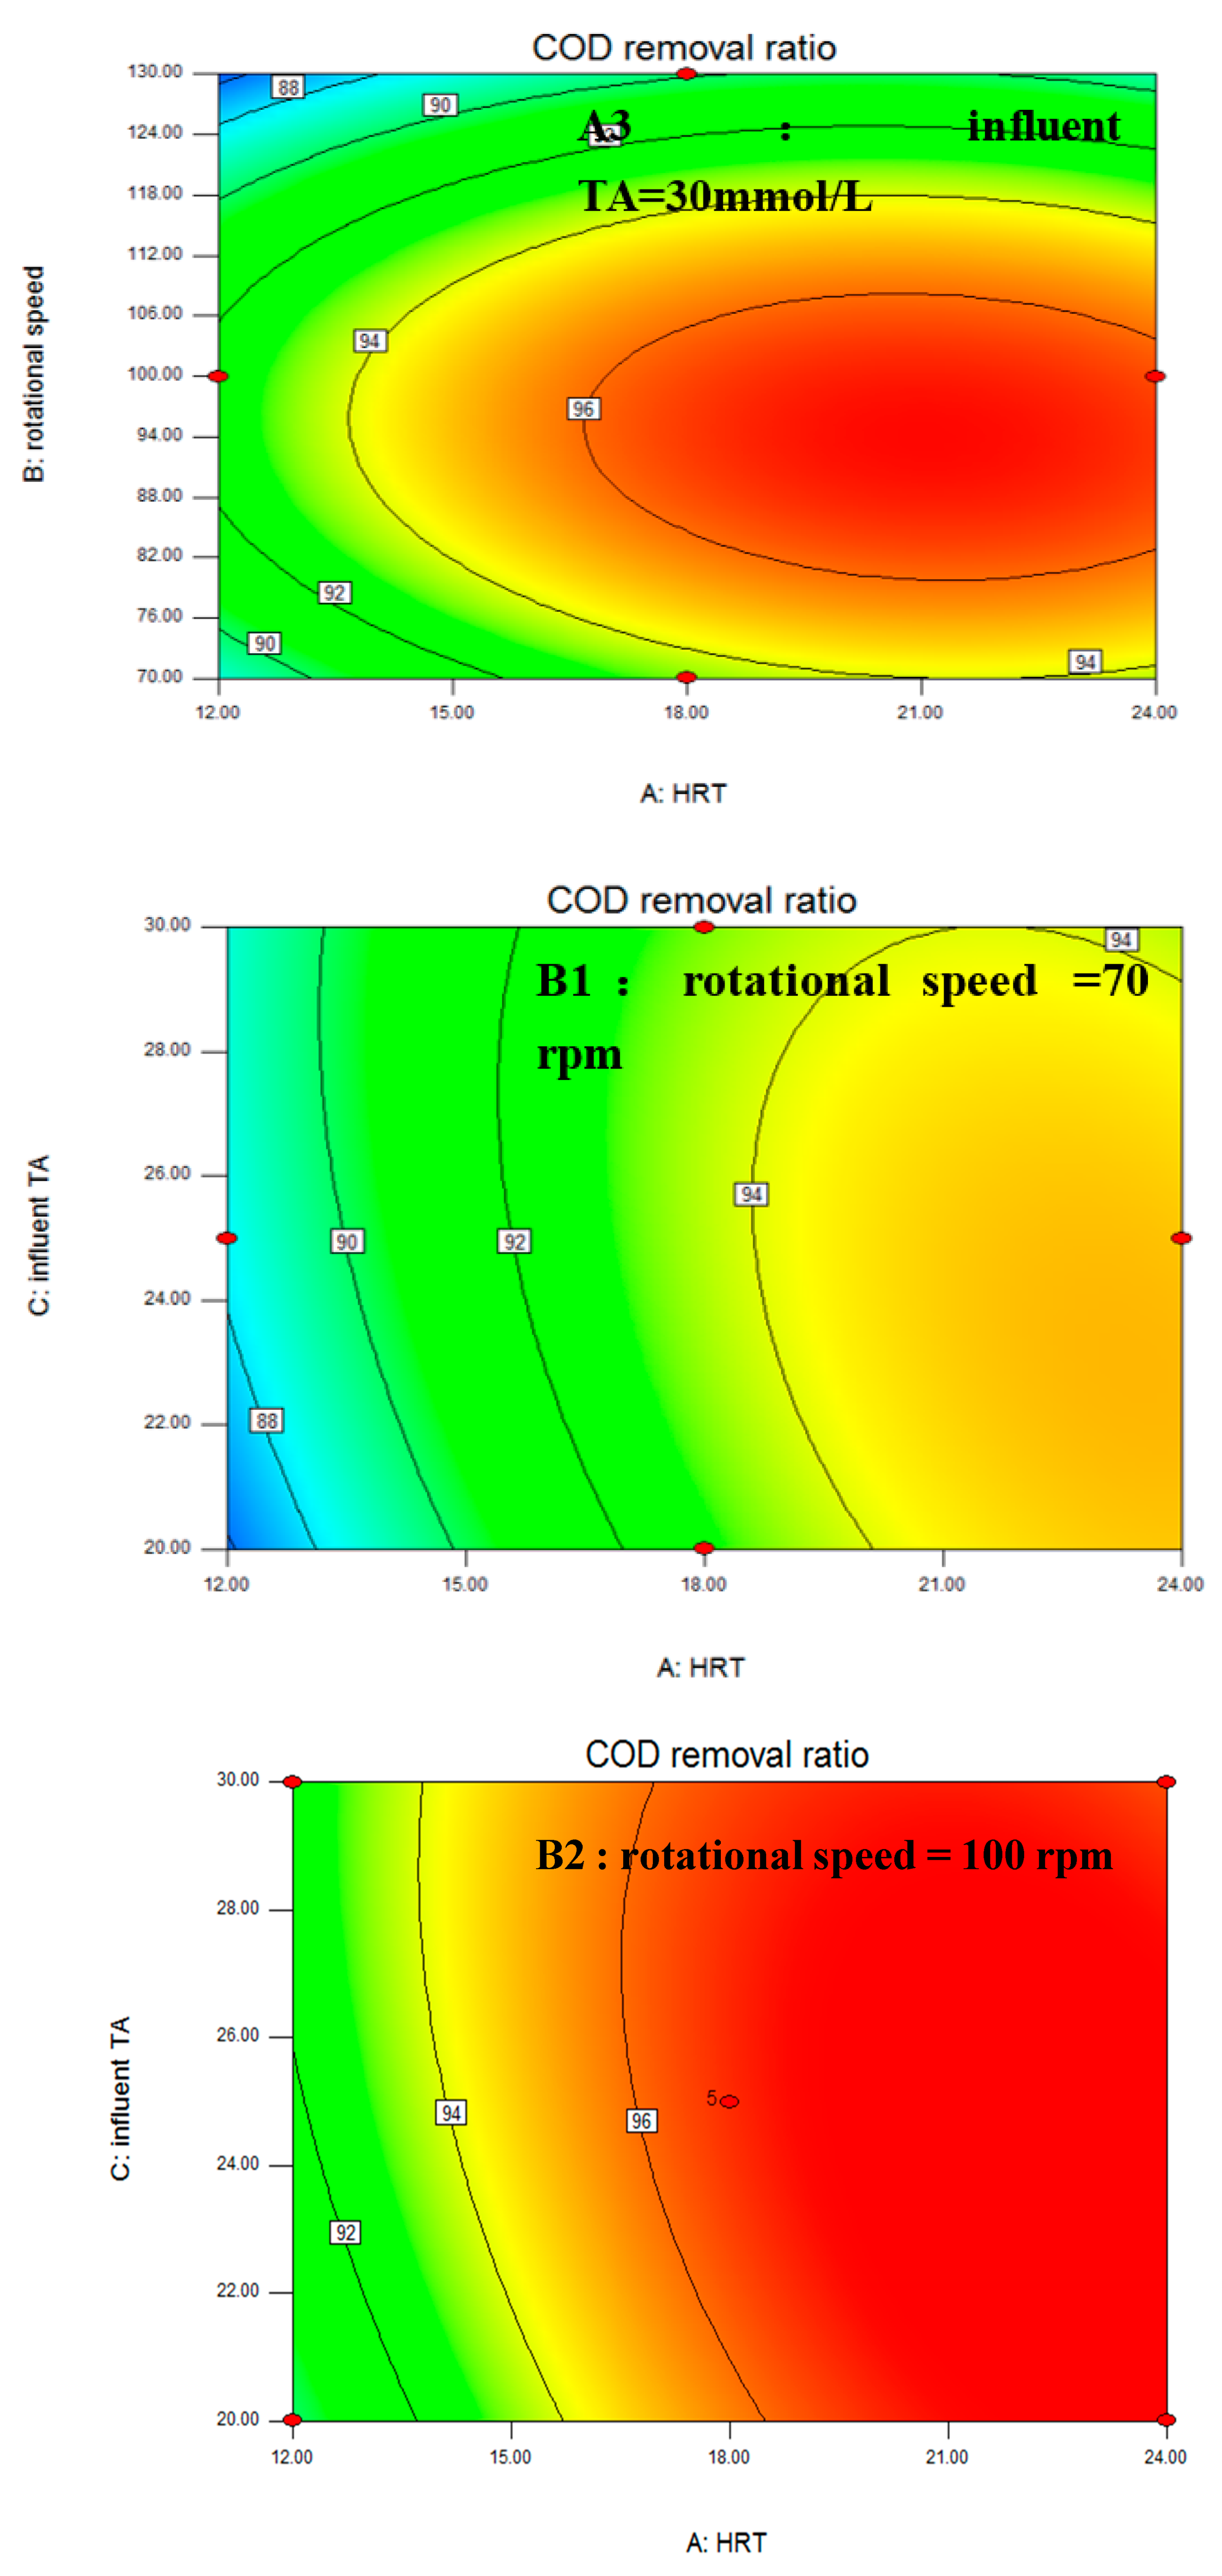


Figure 3.
The change of COD removal ratio.

Figure 4.
Scanning electron microscopy (SEM) results of microbial communities in biofilms. (A) Microbiological phase on the filler surface after aerobic suspension, 5.00 k. (B) Microbiological phase on the filler surface after aerobic suspension, 10.00 k. (C) Microbial phases on the filler surface of the reactor during stable operation, 5.00 k. (D) Microbial phases on the filler surface of the reactor during stable operation, 10.00 k.

Figure 5.
Distribution of the archaea community in the CMABR at genus level classification during anaerobic sludge inoculation and a stable operation. Z0: raw sludge during anaerobic sludge inoculation; Z1: biofilm on fillers during stable operation.
Figure 5.
Distribution of the archaea community in the CMABR at genus level classification during anaerobic sludge inoculation and a stable operation. Z0: raw sludge during anaerobic sludge inoculation; Z1: biofilm on fillers during stable operation.

Table 1.
Box–Behnken experimental design and the corresponding responses.
| Stage | Days | HRT (h) | Rotational Speed (rpm) | Influent TA (mmol/L) | COD Removal Ratio (%) |
|---|---|---|---|---|---|
| 1 | 1–6 | 18.00 | 70.00 | 20.00 | 92.53 |
| 2 | 7–12 | 12.00 | 100.00 | 20.00 | 90.19 |
| 3 | 13–18 | 24.00 | 100.00 | 20.00 | 97.25 |
| 4 | 19–24 | 18.00 | 130.00 | 20.00 | 89.10 |
| 5 | 25–30 | 12.00 | 70.00 | 25.00 | 88.29 |
| 6 | 31–36 | 24.00 | 70.00 | 25.00 | 95.33 |
| 7 | 37–42 | 18.00 | 100.00 | 25.00 | 96.33 |
| 8 | 43–48 | 18.00 | 100.00 | 25.00 | 96.99 |
| 9 | 49–54 | 18.00 | 100.00 | 25.00 | 97.05 |
| 10 | 55–60 | 18.00 | 100.00 | 25.00 | 96.63 |
| 11 | 61–66 | 18.00 | 100.00 | 25.00 | 96.57 |
| 12 | 67–72 | 12.00 | 130.00 | 25.00 | 85.29 |
| 13 | 73–78 | 24.00 | 130.00 | 25.00 | 90.42 |
| 14 | 79–84 | 18.00 | 70.00 | 30.00 | 93.15 |
| 15 | 85–90 | 12.00 | 100.00 | 30.00 | 92.50 |
| 16 | 91–96 | 24.00 | 100.00 | 30.00 | 96.09 |
| 17 | 97–102 | 18.00 | 130.00 | 30.00 | 90.12 |
Table 2.
Results of the regression analysis of the Box–Behnken experimental design.
| Source | Sum of Squares | Mean Square | F Value | p-Value Prob > F |
|---|---|---|---|---|
| Model | 221.13 | 24.57 | 181.82 | <0.0001 *** |
| A-HRT | 65.09 | 65.09 | 481.70 | <0.0001 *** |
| B-rotational speed | 25.81 | 25.81 | 191.01 | <0.0001 *** |
| C-TA | 0.97 | 0.97 | 7.20 | 0.0314 * |
| AB | 0.91 | 0.91 | 6.75 | 0.0355 * |
| AC | 3.01 | 3.01 | 22.28 | 0.0022 ** |
| BC | 0.040 | 0.040 | 0.30 | 0.6033 |
| A2 | 17.69 | 17.69 | 130.88 | <0.0001 *** |
| B2 | 98.31 | 98.31 | 727.48 | <0.0001 *** |
| C2 | 1.82 | 1.82 | 13.45 | 0.0080 ** |
*** Highly significant (p value < 0.001). ** Very significant (0.001 < p value < 0.01). * Significance (0.01 < p value < 0.05).
Table 3.
Reactor hanging film amount.
| Index | Value |
|---|---|
| Average filler film amount per unit (g/g) | 0.574 ± 0.059 |
| Filler weight with 30% rate (g) | 301.908 |
| Average amount of hanging film (g) | 173.295 ± 17.813 |
| Average sludge concentration equivalent (g/L) | 8.252 ± 0.848 |
Table 4.
Differences in the diversity indexes of archaea in the Z0 and Z1 samples.
| Sample Number | Sample Description | No. of Sequences | Shannon | ACE | Chao1 | Coverage | Simpson |
|---|---|---|---|---|---|---|---|
| Z0 | Raw sludge during anaerobic sludge inoculation | 101,014 | 2.54 | 98,003 | 34,662 | 0.97 | 0.24 |
| Z1 | Biofilm on fillers during stable operation | 70,858 | 1.56 | 221,517 | 75,698 | 0.98 | 0.36 |
Publisher’s Note: MDPI stays neutral with regard to jurisdictional claims in published maps and institutional affiliations. |
© 2021 by the authors. Licensee MDPI, Basel, Switzerland. This article is an open access article distributed under the terms and conditions of the Creative Commons Attribution (CC BY) license (http://creativecommons.org/licenses/by/4.0/).
Share and Cite
MDPI and ACS Style
Zhong, D.; Zhu, K.; Ma, W.; Li, J.; Li, K.; Dai, C. Optimization of a Completely Mixed Anaerobic Biofilm Reactor (CMABR), Based on Brewery Wastewater Treatment. Water 2021, 13, 606. https://doi.org/10.3390/w13050606
AMA Style
Zhong D, Zhu K, Ma W, Li J, Li K, Dai C. Optimization of a Completely Mixed Anaerobic Biofilm Reactor (CMABR), Based on Brewery Wastewater Treatment. Water. 2021; 13(5):606. https://doi.org/10.3390/w13050606
Chicago/Turabian StyleZhong, Dan, Kai Zhu, Wencheng Ma, Jinxin Li, Kefei Li, and Changlei Dai. 2021. "Optimization of a Completely Mixed Anaerobic Biofilm Reactor (CMABR), Based on Brewery Wastewater Treatment" Water 13, no. 5: 606. https://doi.org/10.3390/w13050606
Note that from the first issue of 2016, this journal uses article numbers instead of page numbers. See further details here.