Article

Electrochemical Treatment of Effluent for the Removal of Contaminants of Emergent Concern and Culturable Microorganisms

CENSE—Center for Environmental and Sustainability Research, Department of Environmental Sciences and Engineering, NOVA School of Science and Technology, NOVA University Lisbon, 2829-516 Caparica, Portugal
*
Authors to whom correspondence should be addressed.
Water 2021, 13(4), 520; https://doi.org/10.3390/w13040520
Submission received: 31 December 2020 / Revised: 2 February 2021 / Accepted: 13 February 2021 / Published: 17 February 2021
(This article belongs to the Section Wastewater Treatment and Reuse)

Abstract

:
The present work aims to study the electrochemical (EC) process applied for the removal of contaminants of emergent concern (CECs) from wastewater after secondary treatment and the effect of the process on the total culturable microorganisms. The EC experiments were performed in a cylindrical open reactor with 500 mL of effluent, and a fixed current density of 8 mA/cm² was applied through mixed metal oxide electrodes. The experiments were conducted in different sets. In the first round (Set 1), the effluent sample was spiked with three CECs (200 ppb each): caffeine (CAF), carbamazepine (CBZ), and oxybenzone (OXY). For the best treatment period, 6 h, electrodegradation rates ranged from 41 ± 7% for CAF to 95 ± 6% for OXY, with an 87% removal of total culturable microorganisms. In the second round (Set 2), aiming to assess EC process efficiency in a more complex CEC mixture, the effluent was spiked with six more CECs (200 ppb each): diclofenac (DCF), triclosan (TCS), bisphenol A (BPA), 17β-estradiol (E2), 17α-ethinylestradiol (EE2), and ibuprofen (IBU), giving a total of nine CECs. In this case, the EC process allowed decreasing the CEC content by 19–100% (below the limit of detection), depending on the effluent samples, and the culturable microorganisms by 99.98% after a 6 h treatment. By contributing to CEC degradation and microorganism removal, the EC process proved to be a viable remediation and disinfection technology for secondary effluent from wastewater treatment plants.

Graphical Abstract

1. Introduction

Contaminants of emergent concern (CECs) have been found in several aquatic environments, and although their ecological and human health impacts are still unknown, in general, their discharge into natural waterbodies is not regulated [1]. Even though new legislation on wastewater reuse was released in May 2020 (on the minimum requirements for water reuse), the European regulation failed to impose a limit on CEC concentration, however admitting that such a topic should be reviewed in the future [2].
CECs such as pharmaceuticals and personal care products, endocrine-disrupting compounds, agrochemicals, phthalates, flame retardants, and artificial sweeteners, as well as their transformation by-products, reach the environment through different routes. One of the main CEC environmental sources is the effluent from wastewater treatment plants (WWTPs) [3,4,5]. Due to water shortage, wastewater reuse is crucial, although conventional WWTPs were not designed to remove these recalcitrant substances, which can be found in their effluent, ranging from ng/L up to mg/L [4,6].
Another risk arising from improperly treated wastewater is the possibility of exposure to residual waterborne bacteria and viruses, potential vectors of disease transmission [7]. Chlorination, ozonation, and ultraviolet (UV) radiation are some of the most used disinfection processes. UV is widely used as a tertiary treatment, since it does not cause the formation of undesirable disinfection by-products [7,8]. Exposure to UV can damage the microorganism’s DNA and also form photooxidation by-products that kill or damage pathogens and microorganisms [9]. However, some bacteria and viruses are known to be resistant to UV radiation, and others are able to repair and recover after exposure [10].
Advanced oxidation processes, capable of exploiting the high reactivity of hydroxyl radicals generated from chemical precursors, have been tested to improve tertiary treatment success [11]. The electrochemical (EC) process is based on the application of a low-level direct current between a pair of electrodes. This process is able to degrade pollutants from contaminated matrices, as the electric potential enhances the oxidation of CECs, simultaneously promoting the generation of OH [12,13]. The EC process has also been studied in the field of wastewater treatment, for the removal of CECs from wastewater matrices [14,15,16].
The work presented work here was undertaken to extend the application of a simple and low-cost electrochemical reactor, running in batch mode, for the treatment of secondary effluent from wastewater treatment plants, aiming to remove CECs with different physical-chemical properties (e.g., solubility range ~2–2160 mg/L and log Kow ~ 0–4.8) and total microorganisms. For this purpose, three treatment periods were tested for the removal of three CECs. Then, to test the flexibility of the system, the study was conducted using fresh effluent collected on different days, and the complexity was increased by adding six more CECs. All nine CECs (Supplementary Material) used are regularly detected in wastewater and surface and ground waters all over the world [17,18,19]: caffeine (CAF; central nervous system stimulant), carbamazepine (CBZ; anticonvulsive), oxybenzone (OXY; sunscreen agent), diclofenac and ibuprofen (DCF, IBU; nonsteroidal anti-inflammatory drugs), triclosan (TCS; antimicrobial disinfectant), bisphenol A (BPA; plasticizer), 17β-estradiol (E2; naturally occurring estrogen), and 17α-ethinylestradiol (EE2; semisynthetic estrogen).

2. Materials and Methods

2.1. Chemicals and Solvents

All compounds (all analytical grade) were purchased from Sigma-Aldrich (Steinheim, Germany), except triclosan, which was acquired from Labesfal Farma (Tondela, Portugal). Methanol (MeOH), acetonitrile (ACN), acetone (ACE), and formic and nitric acids were gradient grade and purchased from Sigma-Aldrich (Steinhem, Germany), J.T Baker (Germany), Carlo Erba (USA), and Fluka (USA). The ultrapure water used was purified using a Millipore system (Bedford, MA, USA). Individual stock solutions for calibration purposes were prepared at 2000 mg/L in MeOH:ACE (1:1) and stored at 6 °C.

2.2. Effluent Sampling

The effluent used was the liquid fraction collected at the outlet of the secondary settling tank in the months of September and December 2019 and October 2020. The samples were collected at a WWTP from Simarsul, located in Quinta do Conde, Sesimbra, Portugal. This WWTP has the capacity to treat urban wastewater corresponding to about 94,000 equivalent inhabitants, with a tertiary-level treatment performed by UV disinfection.
After collection, samples were filtered through a 2.7 μm microfiber glass filter (MFV4), purchased from Filter Lab (Barcelona, Spain), to remove colloidal particles. Afterward, the effluent was transferred to clear Schott borosilicate glass bottles from Duran (Germany) and appropriately stored and kept protected from direct sunlight exposure.

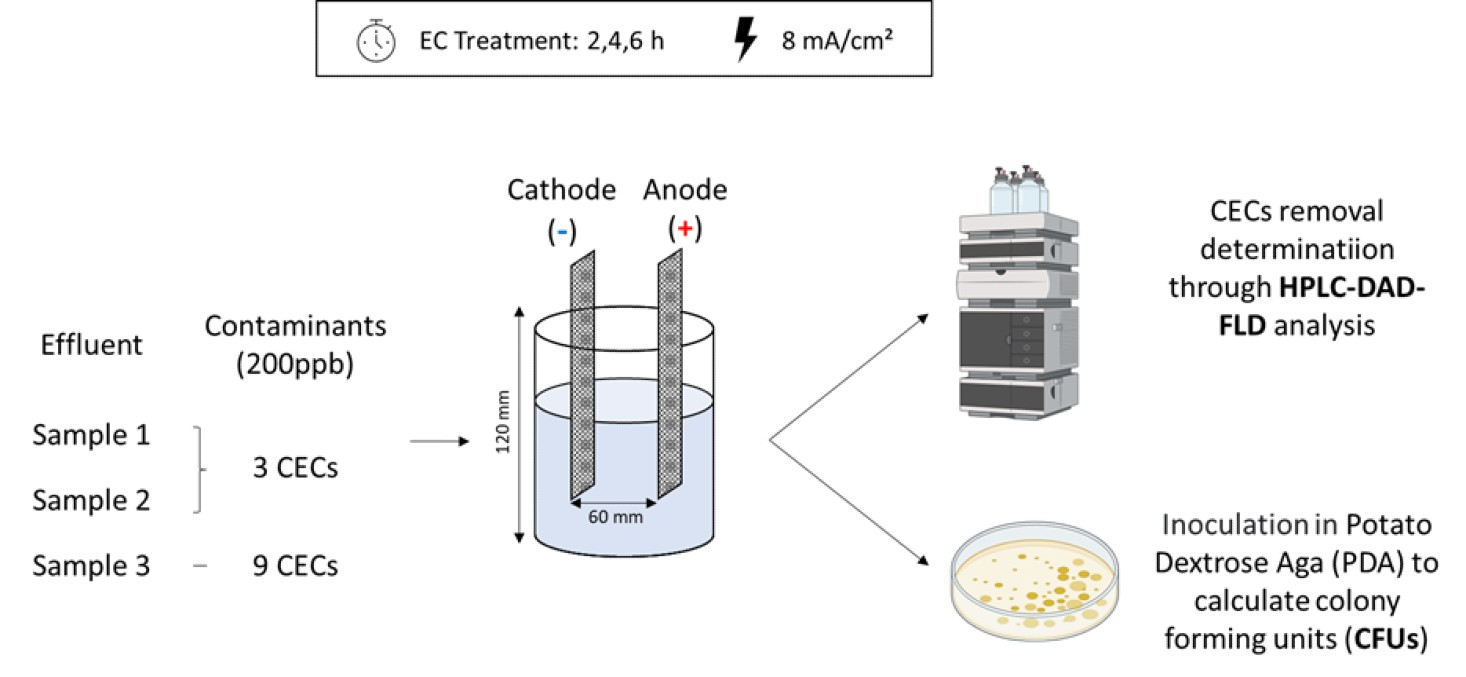
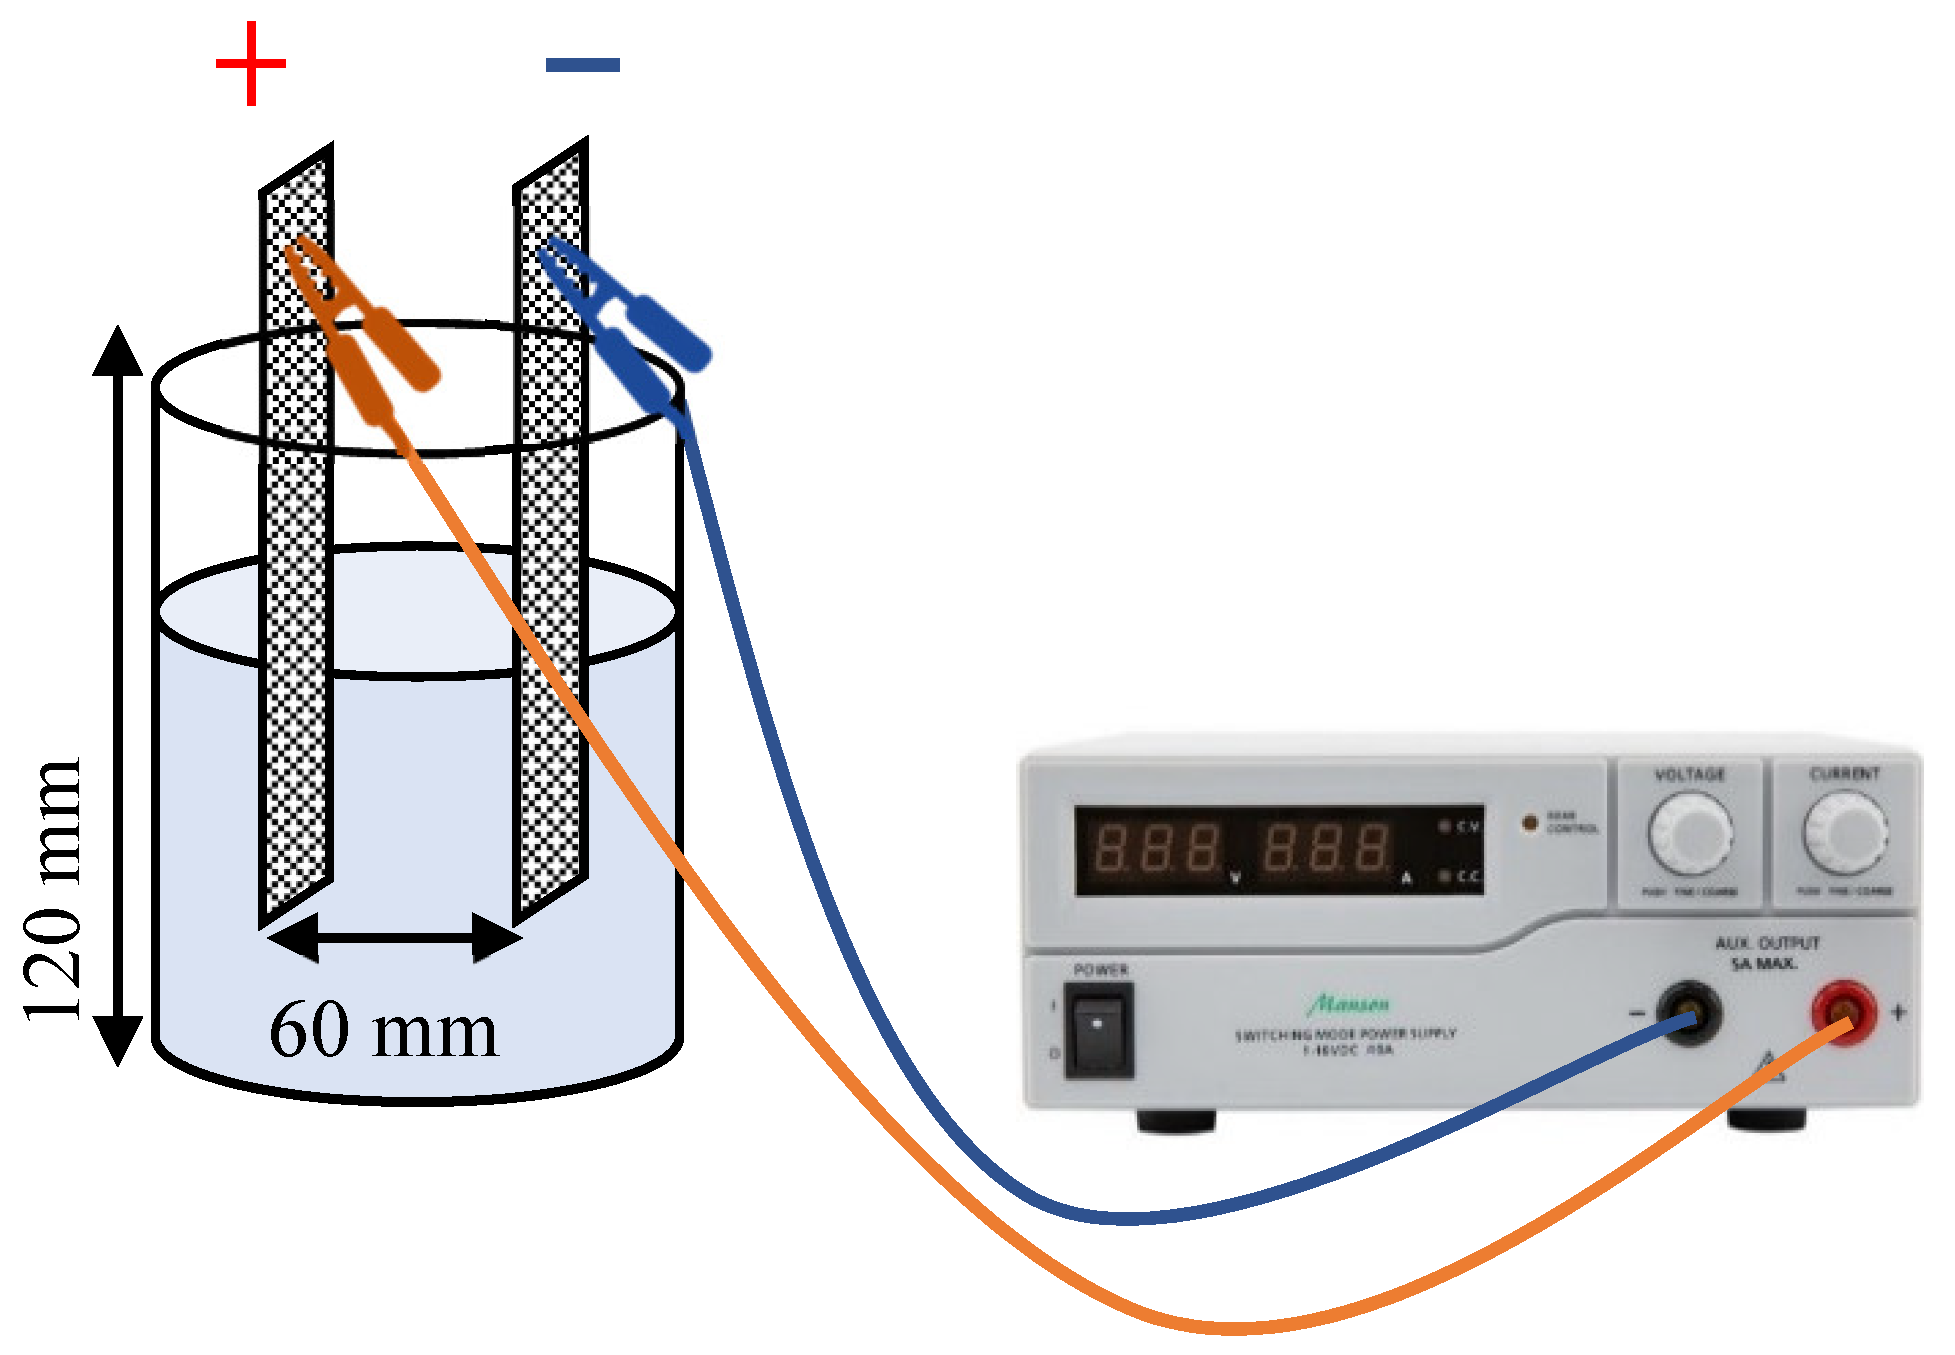
2.3. Electrochemical Reactor

All EC experiments were performed in a cylindrical open reactor, which consisted of a one-compartment glass cell, with an internal diameter of 8 cm and a height of 12 cm, using 500 mL of effluent (stirred every 30 min with a glass rod). All EC assays were performed using a Hewlett Packard E3612A power supply (Palo Alto, USA) to apply a constant current of 50 mA, resulting in a current density of 8 mA/cm². The electrodes used were acquired from FORCE Technology (Brøndby, Denmark) and consisted of two mixed metal oxide mesh electrodes with a height of 90 mm and a length of 20 mm. Both used as anode and cathode, these electrodes were in a fixed position inside the reactor, at a distance of 50 mm from the bottom and 60 mm from each other (Figure 1). All experiments were performed with effluent spiked with CECs (three or nine, depending on the experimental set) at a concentration of 200 ppb each.

2.4. Experimental Design

The experimental work was divided into two different setups (Table 1):
Set 1—evaluation of EC treatment duration: An electric current was applied during different time periods: 2, 4, and 6 h. In this experimental set, the effluent was collected and stored under UV-C radiation to prevent biofilm formation prior to experiments. The effluent was subjected to UV-C photolysis in cycles of 2 h (254 nm; a UVP™ XX-15 Series UV Bench Lamp, 502 × 152 × 108 mm); a distance of 150 ± 50 mm was kept between the UV lamp and the effluent. A total of six assays, three of EC application and three controls (all in duplicate), were performed. The results obtained were used to define the time used in the experimental Set 2.
Set 2—evaluation of EC treatment efficiency using fresh effluent collected on different days (S1, S2, S3): EC treatment was applied to the effluent after sampling (approximately 60 min later) to assess the influence of sample heterogeneity on the CEC (CAF, CBZ, OXY) and culturable microorganism removal (S1, S2). Then, the complexity of the effluent was increased by spiking it with six more CECs (DCF, TCS, BPA, E2, EE2, IBU), giving a total of nine CECs under treatment (S3). A total of 10 assays, 5 of EC application and 5 controls (all in duplicate), were performed.
All experiments were carried out under controlled conditions (22 ± 1 °C; protected from direct sunlight exposure). The voltage drop between working electrodes, pH, and conductivity were measured at the beginning, every 30 min, and at the end of the experiments. The CEC content and culturable microorganisms were determined at the beginning and at the end of the experiments.

2.5. Analytical Methodologies

2.5.1. Effluent Characterization

The pH and conductivity were measured using a pH meter (Metrohm Solitrode with Pt1000) and a conductivity meter (Horiba LAQUAtwin), respectively.

2.5.2. CEC Extraction and Analysis

Before analysis, samples were acidified to pH 2 with nitric acid (HNO3, 50% in water) and concentrated through solid phase extraction (SPE) using Oasis HLB (500 mg, 6 mL) acquired from Waters Corporation (Saint-Quentin en Yvelines, France) in a Visiprep™ SPE Vacuum Manifold, purchased from Sigma-Aldrich (Steinhem, Germany).
The extraction cartridges were conditioned by using 3 × 6 mL MeOH, followed by re-equilibrium with 3 × 6 mL Milli-Q water. Afterward, the effluent sample was passed, at a constant flow (approximately 5 mL/min), through the cartridges, followed by a drying period of approximately 5 min by vacuum. At the end, the retained analytes were eluted with 12 mL of MeOH and collected in 15 mL glass vials.
Determination of CEC concentration was performed using high-pressure liquid chromatography (HPLC). The chromatograph was equipped with a diode array detector (DAD) (G1315B) and with a fluorescence detector (FLD) (1321A), all from Agilent 1 100 Series. Additional equipment included a 1260 Infinity Quaternary Pump (G7111B) and an automatic sampler 1 260 (G7129A). A Poroshell 120 EC—C18 2.7 μm (dimensions: 4.6 × 100 mm2), acquired from Agilent (California, USA), was the column used, equipped with precolumn Onyx SecurityGuard C18 cartridges (dimensions: 5 × 4.6), from Phenomenex (Torrance, CA, USA).
All HPLC runs were performed at a constant flow (1.5 mL/min), in gradient mode, with the oven set to 36 °C. A mixture of ACN/Milli-Q/formic acid (50% in water) was used as an eluent (A: 5/94.5/0.5% and B: 94.5/5/0.5%), with a gradient of 95% of A (1–9 min), followed by 97% of B until 12 min, and 95% of A until 13 min.
For Set 1 and for the first stage of Set 2 (S2), a calibration curve was performed in the range 0.5–12.5 mg/L. For the assays done with sample S3 (Set 2 s stage), another calibration curve was performed, ranging from 0.4 to 13 mg/L. Recovery percentages were calculated in all cases and were between 80% and 120%. Limits of detection and quantification for each contaminant are presented in Supplementary Material.
HPLC analysis, performed before and after the EC process, revealed the presence of possible degradation intermediates and/or degradation sub-products of the CECs. Their identification using LC-MS failed as their concentration was below the analytical limits required.
Although studying their identity and main degradation pathways was not the main goal of this paper, we seek to identify them in the near future with new experiments on a larger scale.

2.5.3. Culturable Microorganisms

Samples were collected at the beginning (spiked and non-spiked effluent) and immediately at the end of the experiments for colony forming unit (CFU) count. The samples were diluted whenever needed, and a 100 μL of aliquot was inoculated in potato dextrose agar (PDA) (5 g/L of potato extract, 20.0 g/L of glucose, and 17.0 g of agar) purchased from Biolife. The petri dishes were incubated at 37 ± 2 °C for 24 h. Afterward, isolate colonies were counted by the naked eye, and results were reported in CFUs per 100 mL. The microbiology data treatment was adapted from the U.S. Environmental Protection Agency (EPA, 2014) recommendations on interpreting microbiology environmental data from low counts.
The CFU/100 mL concentration was estimated using Equation (1):
CFU/mL = (B × Df)/V × 100
in which B is the number of colonies after 24 h (CFU/0.1 mL) and Df is the dilution factor.
Removal efficiency (%) was calculated by applying Equation (2) and based on the adaptation of the procedure described by Von Sperling et al. [20]:
Removal efficiency (%) = (A − B)/A × 100
in which A corresponds to the mean initial CFU count expressed in CFU/100 mL and B corresponds to the mean final CFU count in CFU/100 mL after the applied process.
To calculate the Log reduction factor (LVR), Equation (3) was applied:
LVR =   Log 10 A Log 10 B = Log 10 ( A B )
where A represents the number of viable microorganisms before treatment and B the number of viable microorganisms after treatment.

2.6. Statistical Analysis

The data were statistically treated using one-way ANOVA with a significance set at 5% (p < 0.05), followed by Tukey using SPSS Statistics 20.0 (SPSS Inc., Chicago, USA).

3. Results and Discussion

3.1. Definition of EC Treatment Duration

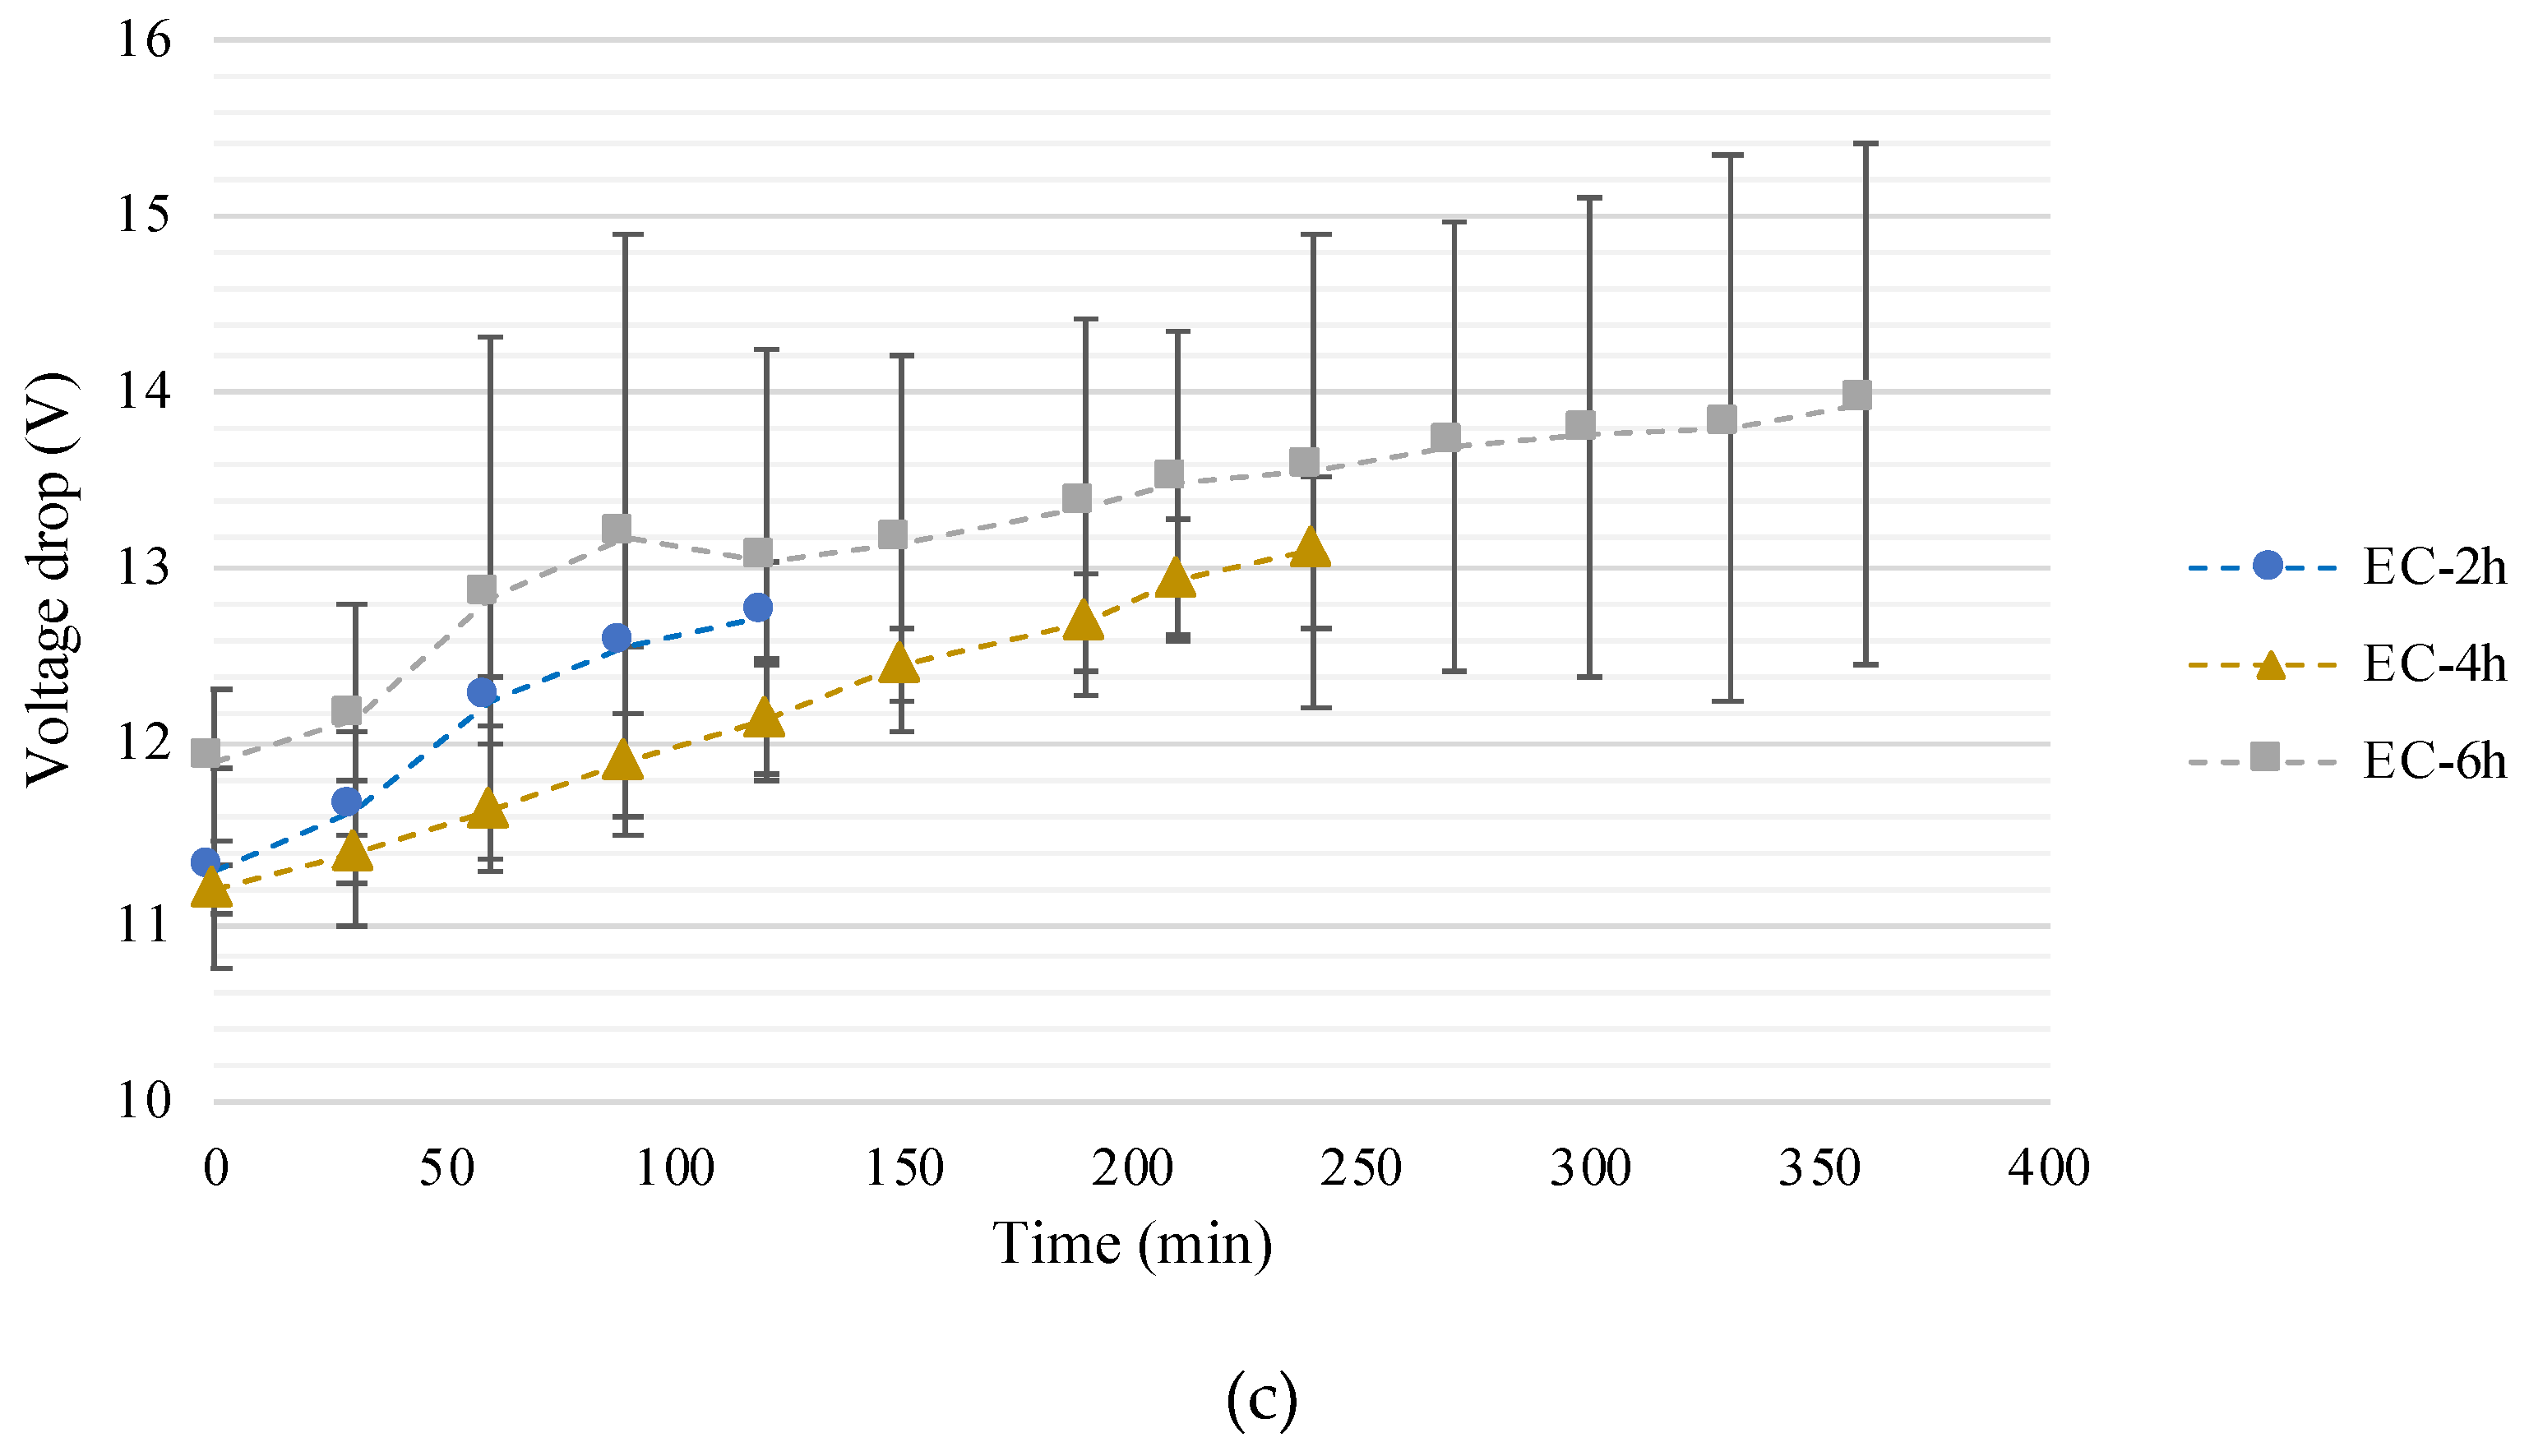
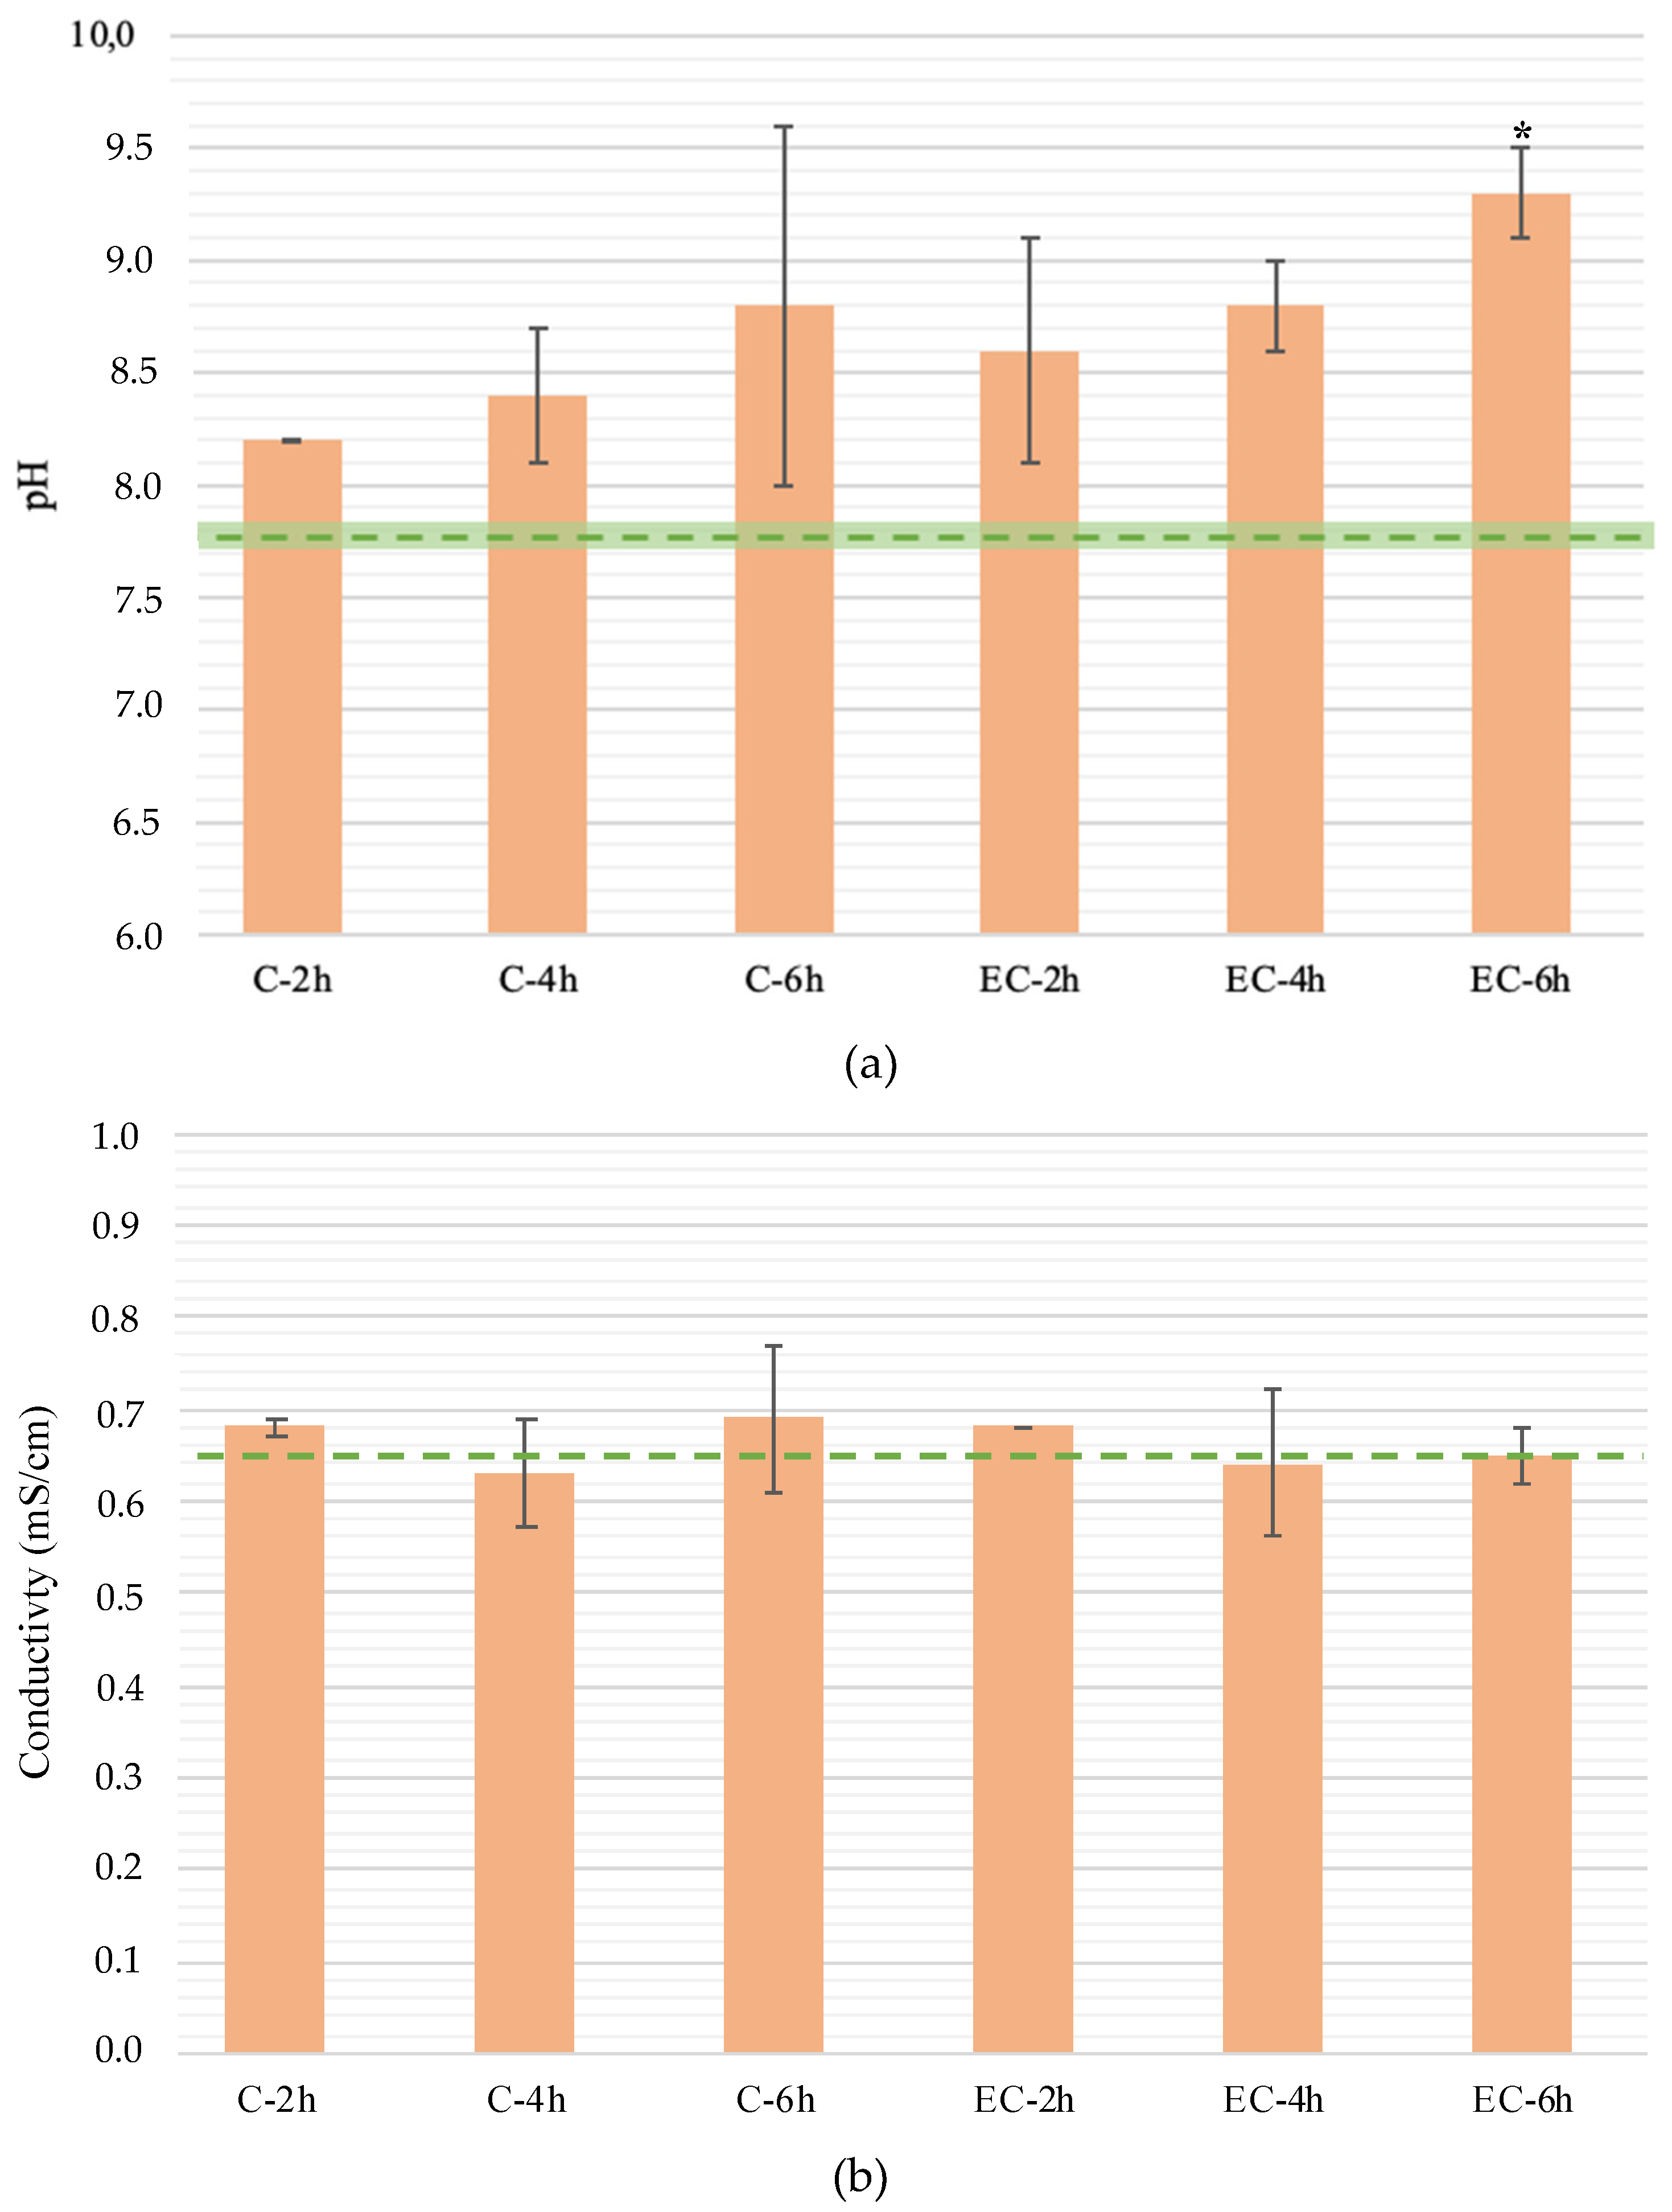
3.1.1. Treatment Time Influence on pH, Conductivity, and Voltage

The effluent used in the experiments presented a pH of 7.8 ± 0.6 and a conductivity of 0.65 ± 0.01 mS/cm (n = 6).
Slight changes were observed in the effluent pH (Figure 2a) when EC was applied during the treatment time, with statistical differences (p < 0.05) being only observed for the treatment carried out for 6 h (EC-6h). The pH increase is attributed to the generation of OH– at the cathode [21] that are not completely counteracted by the H+ formed at the anode.
No statistical differences (p > 0.05) were found in the effluent conductivity (Figure 2b) after the EC application. Conductivity expresses the number of free charges in solution, and although there were ions being produced at the electrodes, conductivity maintained a constant value, indicating that the concentration of other ions decreased with time.
A tendency for a voltage drop increase was observed as the EC treatment time increased (Figure 2c), with a ΔV of +1.5, 1.9, and 2.1 V for EC-2h, EC-4h, and EC-6h, respectively. However, statistical differences (p < 0.05) were only observed in EC-4h (11.2 ± 0.1 and 13.1 ± 0.4 as initial and final values, respectively). This increase is attributed to the depletion of ions in the effluent, although this does not directly correlate with the conductivity. Still, the degradation of dissolved organic matter was observed along the experiments, and a more transparent and lighter effluent solution was distinguished at the end of the experiments (Figure 3). This can, to some extent, explain the increase in the voltage drop.

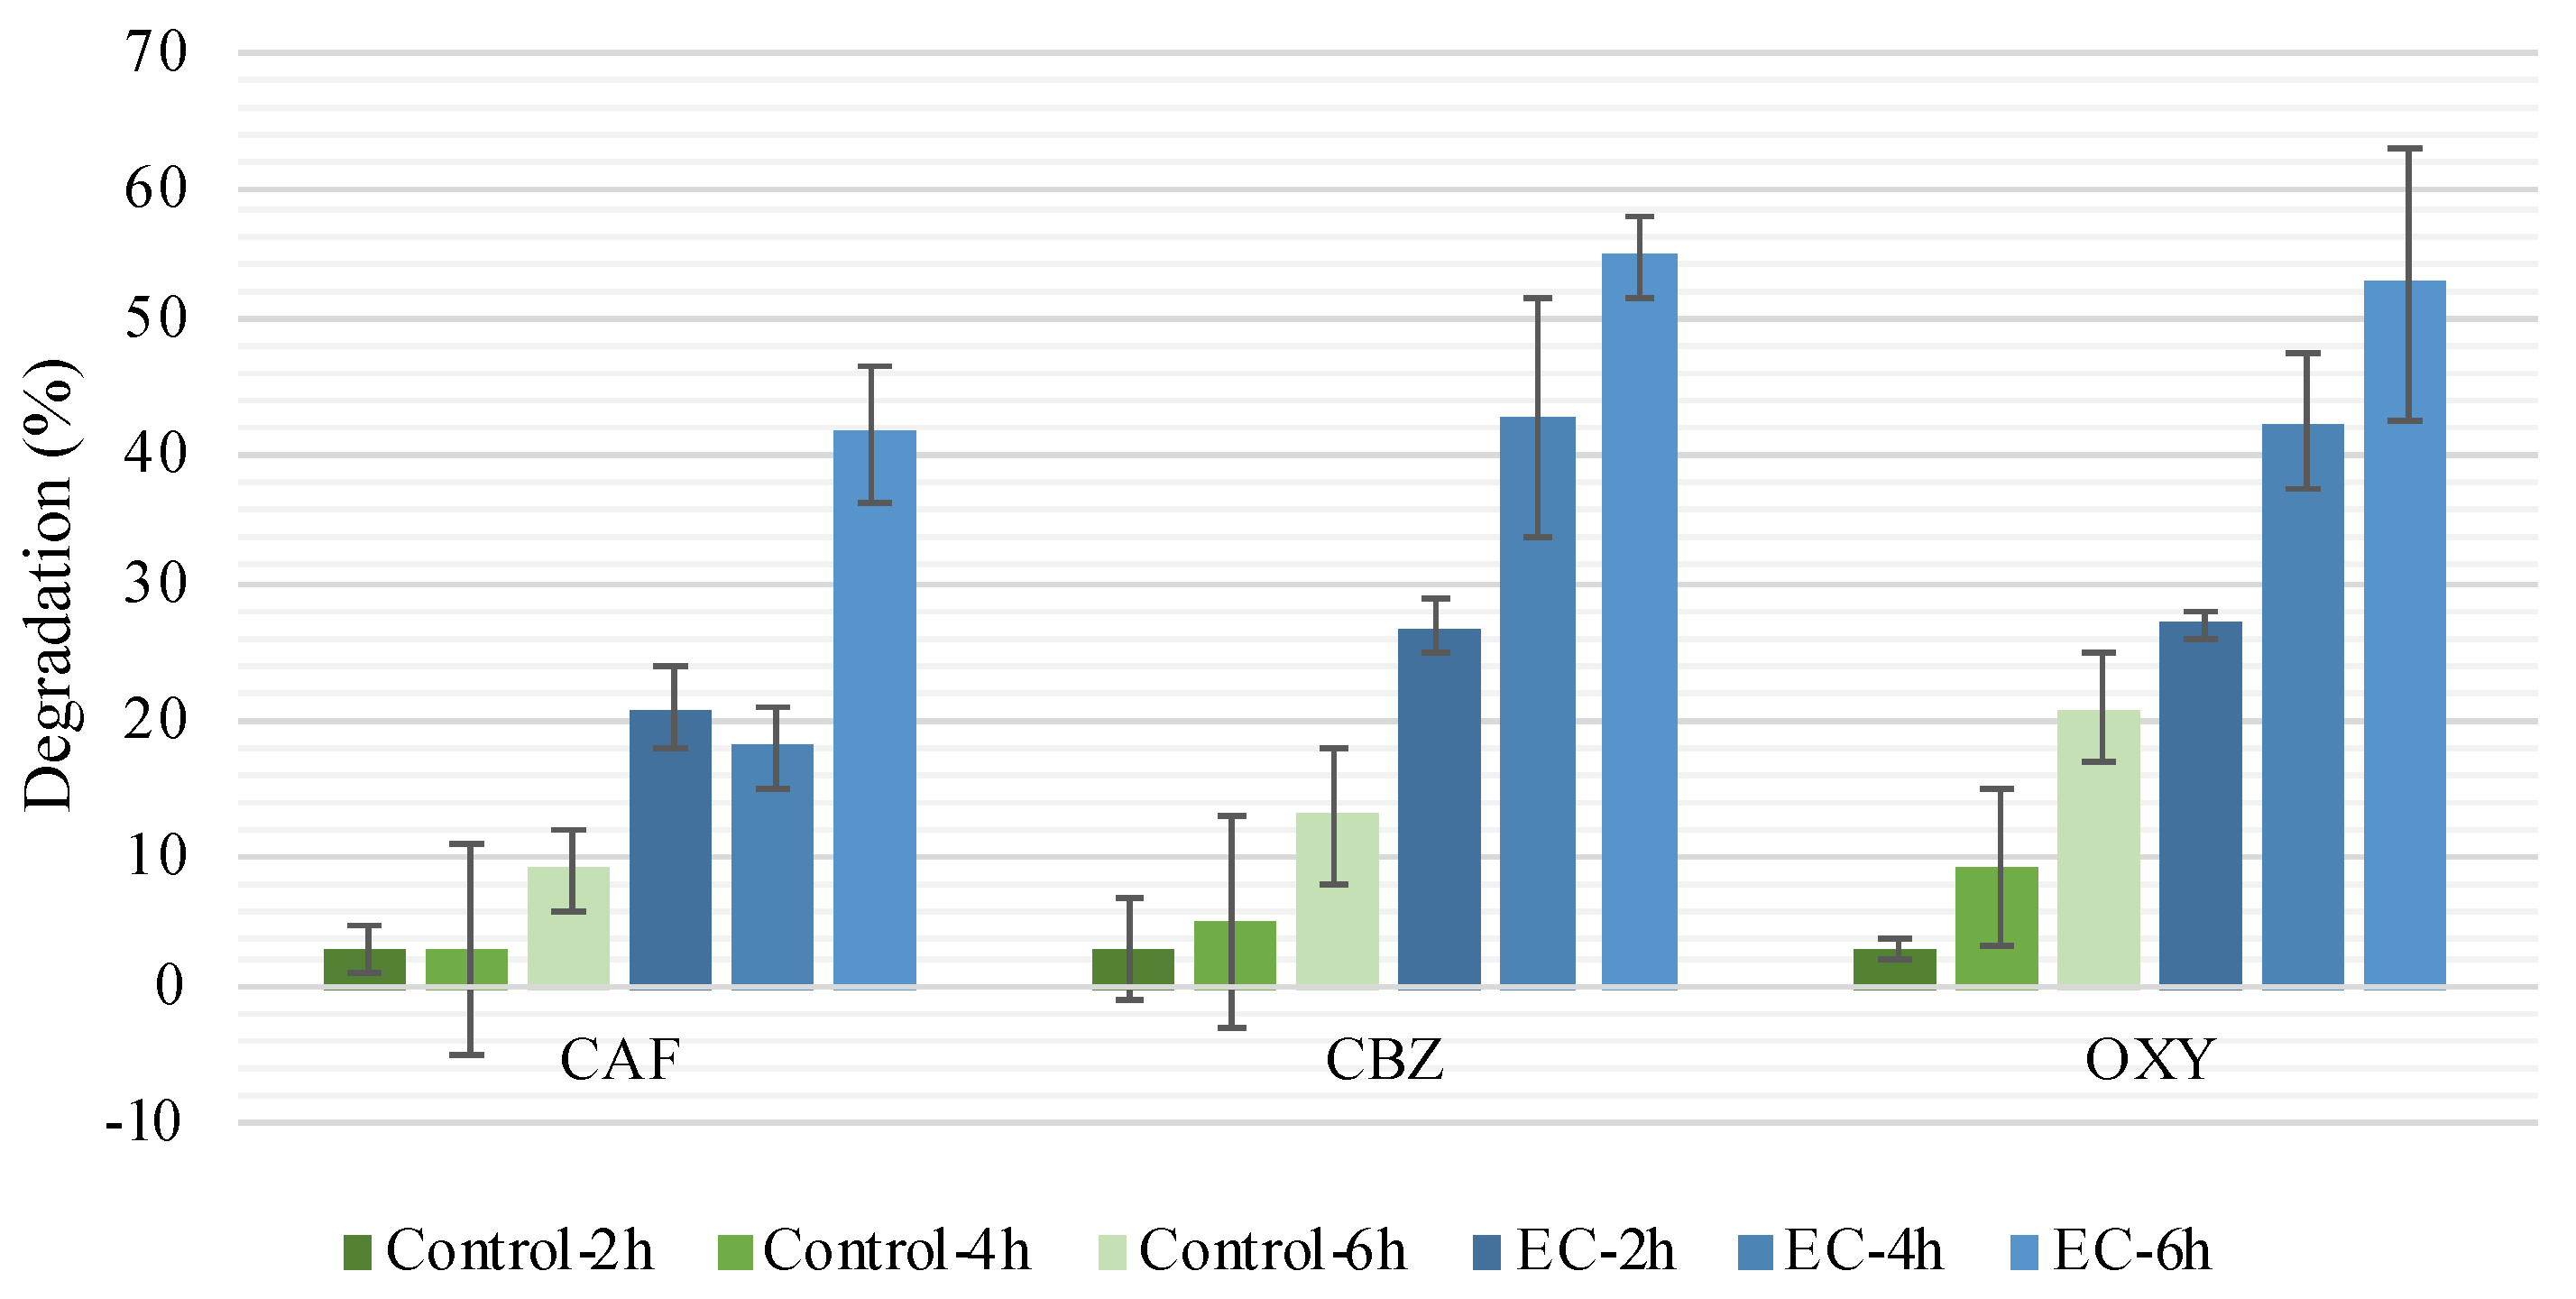
3.1.2. Treatment Time Influence on CEC and Microorganism Removal

In the controls, CEC degradation was between 3% and 21% (Figure 4), the highest value being observed for OXY. As the experiments were carried out protected from direct sunlight exposure, photodegradation was unlikely. Volatilization of the compounds from the effluent was also not expected to be significant, based on the estimated Henry’s law constant of the studied CECs (between 1.1 × 10⁻¹¹ and 1.5 × 10⁻⁸ atm-cu m/mole, the lowest and the highest corresponding to CAF and OXY, respectively; SM) [12]. Thus, and even though the effluent was initially subjected to UV-C, to prevent biofilm formation between the sampling day and the experimental day, the effluent still presented microorganisms (a complete disinfection was not the aim). The controls (spiked effluent, without current application) presented 5.95 × 10⁴, 3.35 × 10⁴, and 5.30 × 10⁴ CFU/100 mL after 2, 4 and 6 h, respectively. Thus, the observed decay was mainly attributed to bioremediation [22]. It should be mentioned that filtration was carried out previously to UV-C to remove suspended solids, but dissolved organic matter (e.g., humic substances) was still present in the filtered effluent, thus influencing UV efficiency [10]. Photoreactivation has also been reported among enteric bacteria after UV disinfection in wastewater [10,23,24].
When the EC process was applied, higher CEC degradation was achieved, with its efficiency increasing with the increasing treatment time (Figure 4). Considering the degradation values of the control experiments, the degradation observed in the EC treatments is mainly due to electrodegradation mechanism. This degradation is attributed to (1) direct anodic oxidation and (2) indirect oxidation in the liquid bulk besides biotic and abiotic factors (e.g., adsorption to organic matter). With the application of electric current in the EC reactors, oxidation and reduction of species was expected [25].
CAF showed to be the CEC least susceptible to electrodegradation as less of this compound was removed, with the maximum degradation of 41 ± 7% after 6 h (EC-6h). CBZ and OXY presented similar levels of removal along the treatment, approximately 27%, 42%, and 53% for EC-2h, EC-4h, and EC-6h, respectively. Compared with controls (without applied current), the effect of applied current enhanced by ~10–70% CAF, CBZ, and OXY removal. The electrodegradation trend was the following: OXY > CBZ > CAF.
A possible explanation for these results is related to the acid ionization constant of these compounds. The CAF and CBZ pKa values (14.0 and 13.9, respectively) were always higher than the solution pH (8–10), being therefore present in their protonated form, whereas OXY, which has a pKa of 8.07, is present in the ionized form (pKa < pH). In this state, ionized form, compounds are considered to be more soluble and consequently easier to degrade [12,26,27], but no significant differences were observed between OXY and CBZ degradation. In this case, the degradation differences are also attributed to the CEC chemical structure. For CAF, it is mostly expected that the OH radical will attack the C4=C8 double bond, although demethylation may also occur [28]. OXY can be hydroxylated either at position C2 or C4 [29]. Finally, CBZ has a heterocyclic structure that is known to ensure its environmental persistence [30], regardless of the fact that it may suffer, to some extent, an OH attack [31,32].
In terms of microorganisms, results show that the EC process is able to reduce the number of total culturable microorganisms, achieving ~1 Log10 (up to 91% reduction) depletion in comparison to the control samples. The effect of a low-density electrical current was also reported for protozoa and metazoan diversity decrease in sewage sludge, except for shelled amoeba, the more resistant organisms [26]. As already mentioned, chlorination and UV radiation are the most common disinfection treatments used in WWTPs. Electrochemical disinfection of secondary effluent has been reported to remove antibiotic-resistant genes and bacteria, suggesting that EC disinfection might be a tool to control antibiotic-resistant vectors [32]. Effluent disinfection may be attributed to the action of oxidants, such as reactive oxygen species (ROS; hydrogen peroxide (H2O2), including the generation of short-lived germicidal agents, such as superoxide (O2) and hydroxyl radical (OH)), and electro-generated chlorine action, even though the action of each one occurs to different extents [33]. The O2 and OH may also react with organic substrates and lead to intermediate species, capable of producing other ROS [34]. One of the main advantages of the EC process is the constant in situ generation of oxidants during treatment, avoiding the storage of chemicals, such as in chlorination, ozonation, and Fenton [35].

3.2. Efficiency of EC Treatment in Different Effluent Samples

3.2.1. General Changes: pH, Conductivity, and Voltage

The initial pH of the effluent samples ranged between ca. 7.97 and 9.54 and conductivity between 0.64 and 1.04 (Table 2). In this set (Set 2), the pH increased (p < 0.05) in all experiments, similarly to what was observed in Set 1. Conductivity decreased in all experiments to 0.59, 0.45, and 0.77 in EC-S1, EC-S2, and EC-S3-6h, respectively. Consequently, the voltage drop increased (Table 2).

3.2.2. EC Efficiency on CECs and Microorganism Removal

Similarly to what happened in Set 1, the pH in EC-S1-6h and EC-S2-6h increased to above 8 (Table 3), and so OXY (pKa 8.07) shifted to its ionized form, while CAF and CBZ remained in the molecular form (pKa > pH), hindering their removal. In these EC experiments, no statistical differences (p > 0.05) were observed for CEC degradation between EC-S1 and EC-S2. Still, it should be mentioned that EC-S1 retrieved high standard deviations from CAF and CBZ (Table 3). CAF remained the most recalcitrant contaminant, with only 19 ± 7% being removed from EC-S1 and 38 ± 5% from EC-S2.
Regarding microorganisms, time zero controls performed with fresh samples registered high CFU counts (>300 CFU/plate) for both effluent samples (S1 and S2), on the order of 106 CFU/100 mL. A reduction in microorganisms was observed on the biotic control (spiked) after 6 h in both samples, with S1 showing a higher reduction value, 0.65 Log10 (77.72% reduction), compared to S2, with 0.13 Log10 (26.7% reduction). Controls for non-spiked samples presented a reduction below 0.04 Log10 after 6 h. Therefore, either the MeOH:ACE present in the stock solution used for spiking or the mixture of CECs (200 ppb each) induced toxicity for the effluent microbial community inhibiting their growth. Nonetheless, the EC treatments presented high microorganism reduction, of 3.21 Log10 (99.94% reduction) in EC-S1 and 3.47 Log10 (99.98% reduction) in EC-S2.

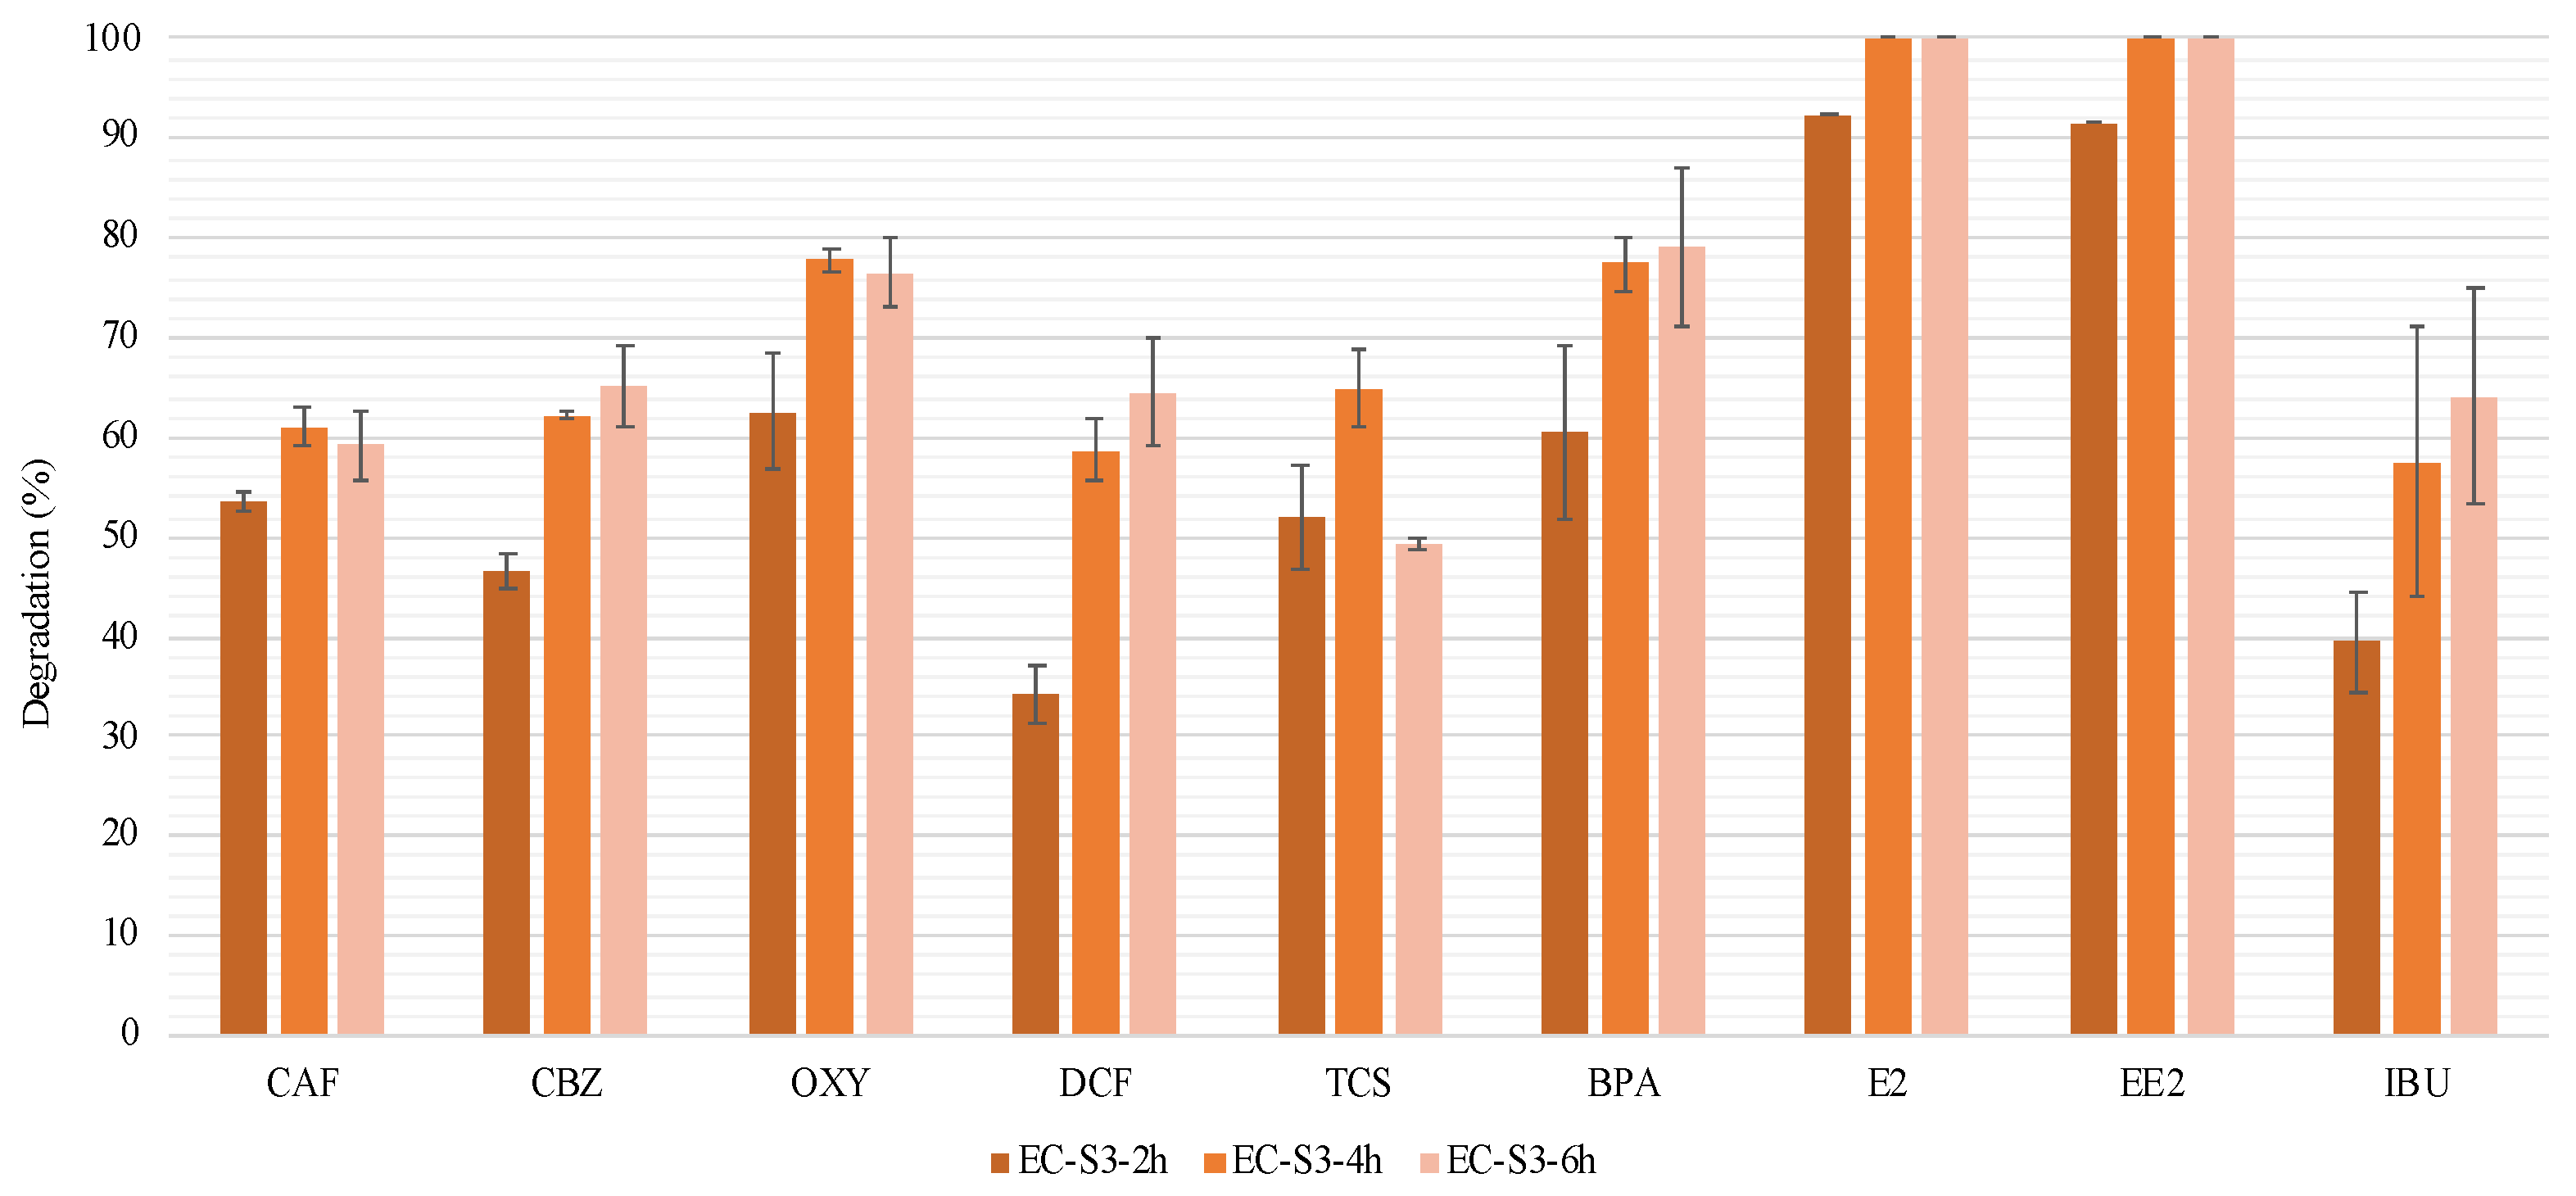
3.2.3. EC Efficiency on a Complex Mixture of CEC and Microorganism Removal

The complexity of the removal processes is expected to increase in effluents containing more CECs, so the EC-S3 experiment was performed after spiking the effluent with a mixture of nine CECs. In this case, the removal was assessed every 2 h.
In general, CEC removal increased along the EC treatment time for all contaminants, with the highest increase observed until 4 h, after which the degradation velocity decreased (Figure 5). At the end of EC-S3-6h, the removal rates were between 100% (for E2 and EE2) and 49.4% (TCS). The differences in the CEC degradation can be explained by the compound characteristics as previously described (pKa and molecular structure).
In terms of molecular structure and considering two of the CECs tested here that present a similar structure, E2 and EE2, electrodegradation is likely initiated by the addition of OH radicals either through (i) abstraction of the hydrogen linked to the C6 of the aliphatic ring or through (ii) oxidation of its hydroxyl group, regardless of the fact that in EE2 the presence of the ethinyl group stabilizes the phenolic ring, increasing its resistance to degradation [36]. The presence of electrophilic halogen groups with a negative inductive effect at the aromatic ring, such as in BPA, or the absence of nucleophilic substituents with an activating effect on the aromatic ring, such as in DCF, makes them more recalcitrant as it decreases their reactivity toward the oxidant agents (OH) and active chlorine species present in the effluent [37]. For TCS, chlorination of the phenolic ring and cleavage of the ether bond are the main degradation pathways [38]. Site-specific hydroxylation on C8 has been proposed as the main result of the CAF reaction with the free hydroxyl radicals. However, N-demethylation may also occur [28].
The electrochemical oxidation of IBU involves decarboxylation and demethylation through the attack on the isobutyl group and the propionic acid by OH, followed by mineralization [39]. For CBZ, a biorecalcitrant pharmaceutical, hydroxylation and bond rupture may occur, which produces lower-molecular-weight compounds, followed by further transformation and mineralization [37]. For OXY, electrochemical oxidation is initiated by the hydroxylation of the parent compound or by the loss of the methyl group [40]. Several unknown compounds were revealed in the effluent extracts after HPLC analysis. These compounds may constitute by-products or degradation intermediates of the studied CECs, possibly as a result of EC application. Their identification should be carried out in the near future.
In Set 2, EC treatment was applied separately until 6 h in three fresh effluent samples (S1, S2, and S3) for assessing CEC degradation and microorganism inactivation. By testing the effluent collected on different days, it was possible to evaluate, to some extent, the efficiency of both treatments in samples with distinct physicochemical characteristics, a scenario closer to the one experienced in WWTPs, where the composition of the effluent is known to vary seasonally, with weather conditions and even throughout the day. It can be observed that the effluent characteristics influence the efficiency of the removal, and EC treatment should be optimized and adapted to effluent characteristics. Thus, a deeper study if the effluent properties that influence EC efficiency should be performed in order to design a model that allows to control and define the EC parameters according the effluent characteristics.

4. Conclusions

A simple electrochemical reactor showed to be a good alternative for the removal of contaminants of emergent concern and microorganisms from real secondary effluents.
The experimental work was divided into two major setups, one (Set 1) testing the feasibility of the EC process after 2, 4 and 6 h and one (Set 2) in which different effluent samples were used for the tests and the complexity was increased by increasing the number of CECs from three to nine. It should be mentioned that in all experimental rounds, real effluent samples were used, the samples used in Set 2 being collected 1 h before the experiments.
In Set 1, the highest overall electrodegradation was achieved with longer EC application. EC treatment (reaching 100% degradation) also led to an overall ~1 Log10 reduction of total microorganisms in the effluent. In fact, inactivation of total culturable microorganisms was achieved in all EC experiments (Sets 1 and 2). Similarly to Set 1, the highest inactivation value (3.47 Log reduction) for Set 2 was obtained with a fresh secondary effluent sample, S2 (EC-S2-6h). However, a stagnation in the CEC removal was observed after 4 h of treatment when effluent S3 was used, compared to the other effluent samples (Set 1 and Set 2 samples S1 and S3). Thus, a more comprehensive study should be performed to define the main effluent characteristics that influence EC efficiency, aiming to define the EC parameters to be applied according to the effluent properties, i.e., fit-for-purpose design.

Supplementary Materials

The following are available online at https://www.mdpi.com/2073-4441/13/4/520/s1, Table S1: Physicochemical properties of each contaminant of emergent concern used in this study, Table S2: HPLC-DAD-FLD limit of detection and quantification.

Author Contributions

J.D.: Writing—Original Draft, Investigation; C.G.: Investigation, Formal analysis; P.G.: Conceptualization, Writing—Review & Editing, Supervision; A.B.R.: Validation; Writing—Review & Editing; Resources; N.C.: Conceptualization, Writing—Review & Editing, Funding acquisition. All authors have read and agreed to the published version of the manuscript.

Funding

This work has received funding from the European Union’s Horizon 2020 research and innovation program under the Marie Skłodowska-Curie grant agreement No. 778045; project CEMOWAS2 (SOE2/P5/F0505), co-financed by the European Regional Development Fund (FEDER); and Portuguese Foundation for Science and Technology (FCT) through grant UIDB/04085/2020 (strategic project for CENSE). FCT is also acknowledged for N. Couto’s contract established under Individual Call to Scientific Employment Stimulus (CEECIND/04210/2017).

Institutional Review Board Statement

Not applicable.

Informed Consent Statement

Not applicable.

Data Availability Statement

All data is contained within the article or supplementary material.

Acknowledgments

Cristina Santos, Olga Paredes and the Laboratory of Control and Process from SIMARSUL—Águas de Portugal are acknowledged for providing effluent samples. This work is anchored by the RESOLUTION LAB, a laboratory at NOVA School of Science and Technology.

Conflicts of Interest

Authors certify that they have NO affiliations with or involvement in any organization or entity with any financial interest or non-financial interest in the subject matter or materials discussed in this manuscript.

References

  1. López-Serna, R.; Posadas, E.; García-Encina, P.A.; Muñoz, R. Removal of Contaminants of Emerging Concern from Urban Wastewater in Novel Algal-Bacterial Photobioreactors. Sci. Total Environ. 2019, 662, 32–40. [Google Scholar] [CrossRef] [Green Version]
  2. The European Parliament and the Council of the European Union. Regulation (EU) 2020/741, Minimum Requirements for Water Reuse. Off. J. Eur. Union 2020, 2019, L 177/32. [Google Scholar]
  3. Nawaz, T.; Sengupta, S. Chapter 4—Contaminants of Emerging Concern: Occurrence, Fate, and Remediation. In Advances in Water Purification Techniques: Meeting the Needs of Developed and Developing Countries; Elsevier: Amsterdam, The Netherlands, 2018; pp. 67–114. [Google Scholar]
  4. Salimi, M.; Esrafili, A.; Gholami, M.; Jonidi Jafari, A.; Rezaei Kalantary, R.; Farzadkia, M.; Kermani, M.; Sobhi, H.R. Contaminants of Emerging Concern: A Review of New Approach in AOP Technologies. Environ. Monit. Assess. 2017, 189. [Google Scholar] [CrossRef]
  5. Starling, M.C.V.M.; Amorim, C.C.; Leão, M.M.D. Occurrence, Control and Fate of Contaminants of Emerging Concern in Environmental Compartments in Brazil. J. Hazard. Mater. 2019, 17–36. [Google Scholar] [CrossRef] [PubMed]
  6. Krzeminski, P.; Tomei, M.C.; Karaolia, P.; Langenhoff, A.; Almeida, C.M.R.; Felis, E.; Gritten, F.; Andersen, H.R.; Fernandes, T.; Manaia, C.M.; et al. Performance of Secondary Wastewater Treatment Methods for the Removal of Contaminants of Emerging Concern Implicated in Crop Uptake and Antibiotic Resistance Spread: A Review. Sci. Total Environ. 2019, 1052–1081. [Google Scholar] [CrossRef] [Green Version]
  7. Lee, E.C. Electrokinetic Improvement of Soft Clay Using Electrical Vertical Drains. In Ground Improvement Case Histories: Chemical, Electrokinetic, Thermal and Bioengineering Methods; Butterworth Heinemann: Oxford, UK, 2015. [Google Scholar] [CrossRef]
  8. Collivignarelli, M.C.; Abbà, A.; Benigna, I.; Sorlini, S.; Torretta, V. Overview of the Main Disinfection Processes for Wastewater and Drinking Water Treatment Plants. Sustainability 2018, 10, 86. [Google Scholar] [CrossRef] [Green Version]
  9. Kauser, I.; Ciesielski, M.; Poretsky, R.S. Ultraviolet Disinfection Impacts the Microbial Community Composition and Function of Treated Wastewater Effluent and the Receiving Urban River. PeerJ 2019, 2019. [Google Scholar] [CrossRef]
  10. Mamane, H. Impact of Particles on UV Disinfection of Water and Wastewater Effluents: A Review. Hadas Mamane School of Mechanical Engineering, Faculty of Engineering, Tel-Aviv. Rev. Chem. Eng. 2008, 24, 67–157. [Google Scholar] [CrossRef]
  11. Tröster, I.; Fryda, M.; Herrmann, D.; Schäfer, L.; Hänni, W.; Perret, A.; Blaschke, M.; Kraft, A.; Stadelmann, M. Electrochemical Advanced Oxidation Process for Water Treatment Using DiaChem® Electrodes. Diam. Relat. Mater. 2002, 11, 640–645. [Google Scholar] [CrossRef]
  12. Ferreira, A.R.; Couto, N.; Guedes, P.; Pinto, J.; Mateus, E.P.; Ribeiro, A.B. Electrodialytic 2-Compartment Cells for Emerging Organic Contaminants Removal from Effluent. J. Hazard. Mater. 2018, 358, 467–474. [Google Scholar] [CrossRef]
  13. Magro, C.; Mateus, E.P.; Paz-Garcia, J.M.; Ribeiro, A.B. Emerging Organic Contaminants in Wastewater: Understanding Electrochemical Reactors for Triclosan and Its by-Products Degradation. Chemosphere 2020, 247. [Google Scholar] [CrossRef] [Green Version]
  14. Gadipelly, C.; Pérez-González, A.; Yadav, G.D.; Ortiz, I.; Ibáñez, R.; Rathod, V.K.; Marathe, K.V. Pharmaceutical Industry Wastewater: Review of the Technologies for Water Treatment and Reuse. Ind. Eng. Chem. Res. 2014, 53, 11571–11592. [Google Scholar] [CrossRef]
  15. Morais, R.L.; Garcia, L.F.; Moreno, E.K.G.; Thomaz, D.V.; de Brito Rodrigues, L.; Brito, L.B.; Lobón, G.S.; de Oliveira, G.A.R.; Rodrigues, M.F.; Vaz, B.G.; et al. Electrochemical Remediation of Industrial Pharmaceutical Wastewater Containing Hormones in a Pilot Scale Treatment System. Eclet. Quim. 2019, 44, 40–52. [Google Scholar] [CrossRef]
  16. Zaied, B.K.; Rashid, M.; Nasrullah, M.; Zularisam, A.W.; Pant, D.; Singh, L. A Comprehensive Review on Contaminants Removal from Pharmaceutical Wastewater by Electrocoagulation Process. Sci. Total Environ. 2020, 726, 138095. [Google Scholar] [CrossRef] [PubMed]
  17. Bahlmann, A.; Brack, W.; Schneider, R.J.; Krauss, M. Carbamazepine and Its Metabolites in Wastewater: Analytical Pitfalls and Occurrence in Germany and Portugal. Water Res. 2014, 57, 104–114. [Google Scholar] [CrossRef] [PubMed]
  18. Liu, Q.; Li, M.; Liu, X.; Zhang, Q.; Liu, R.; Wang, Z.; Shi, X.; Quan, J.; Shen, X.; Zhang, F. Removal of Sulfamethoxazole and Trimethoprim from Reclaimed Water and the Biodegradation Mechanism. Front. Environ. Sci. Eng. 2018, 12. [Google Scholar] [CrossRef]
  19. Vieno, N.; Sillanpää, M. Fate of Diclofenac in Municipal Wastewater Treatment Plant—A Review. Environ. Int. 2014, 28–39. [Google Scholar] [CrossRef]
  20. von Sperling, M.; Verbyla, M.E.; Oliveira, S.M.A.C. Removal Efficiencies. In Assessment of Treatment Plant Performance and Water Quality Data: A Guide for Students, Researchers and Practitioners; IWA Publishing: London, UK, 2020; pp. 181–206. [Google Scholar]
  21. Tung, C.H.; Shen, S.Y.; Chang, J.H.; Hsu, Y.M.; Lai, Y.C. Treatment of Real Printing Wastewater with an Electrocatalytic Process. Sep. Purif. Technol. 2013, 117, 131–136. [Google Scholar] [CrossRef] [Green Version]
  22. Gavrilescu, M.; Demnerová, K.; Aamand, J.; Agathos, S.; Fava, F. Emerging Pollutants in the Environment: Present and Future Challenges in Biomonitoring, Ecological Risks and Bioremediation. New Biotechnol. 2015, 32, 147–156. [Google Scholar] [CrossRef]
  23. Basu, S.; Page, J.; Wei, I.W. UV Disinfection of Treated Wastewater Effluent: Influence of Color, Reactivation and Regrowth of Coliform Bacteria. 2007. Available online: https://repository.library.northeastern.edu/files/neu:329986; http://hdl.handle.net/2047/D20237267 (accessed on 15 December 2020).
  24. Huang, J.J.; Xi, J.; Hu, H.Y.; Li, Y.; Lu, S.Q.; Tang, F.; Pang, Y.C. UV Light Tolerance and Reactivation Potential of Tetracycline-Resistant Bacteria from Secondary Effluents of a Wastewater Treatment Plant. J. Environ. Sci. 2016, 41, 146–153. [Google Scholar] [CrossRef] [PubMed]
  25. Klavarioti, M.; Mantzavinos, D.; Kassinos, D. Removal of Residual Pharmaceuticals from Aqueous Systems by Advanced Oxidation Processes. Environ. Int. 2009, 35, 402–417. [Google Scholar] [CrossRef] [PubMed]
  26. Guedes, P.; Couto, N.; Almeida, J.; Rodrigues, A.M.; Mateus, E.P.; Ribeiro, A.B. Electrodialytic Treatment of Sewage Sludge: Influence on Microbiological Community. Int. J. Environ. Sci. Technol. 2018, 15, 1103–1112. [Google Scholar] [CrossRef]
  27. Oh, S.; Shin, W.S.; Kim, H.T. Effects of PH, Dissolved Organic Matter, and Salinity on Ibuprofen Sorption on Sediment. Environ. Sci. Pollut. Res. 2016, 23, 22882–22889. [Google Scholar] [CrossRef] [Green Version]
  28. Dalmázio, I.; Santos, L.S.; Lopes, R.P.; Eberlin, M.N.; Augusti, R. Advanced Oxidation of Caffeine in Water: On-Line and Real-Time Monitoring by Electrospray Ionization Mass Spectrometry. Environ. Sci. Technol. 2005, 39, 5982–5988. [Google Scholar] [CrossRef]
  29. Ye, Z.; Steter, J.R.; Centellas, F.; Lluís Cabot, P.; Sirés, I. Photoelectro-Fenton as Post-Treatment for Electrocoagulated 2 Benzophenone-3-Loaded Synthetic and Urban Wastewater. J. Clean. Prod. 2019, 208, 1393–1402. [Google Scholar] [CrossRef]
  30. Yu, Y.; Liu, Y.; Wu, L. Sorption and Degradation of Pharmaceuticals and Personal Care Products (PPCPs) in Soils. Environ. Sci. Pollut. Res. 2013, 20, 4261–4267. [Google Scholar] [CrossRef] [PubMed]
  31. Liang, L.; Gao, S.; Zhu, J.; Wang, L.; Xiong, Y.; Xia, X.; Yang, L. The Enhanced Photocatalytic Performance toward Carbamazepine by Nitrogen-Doped Carbon Dots Decorated on BiOBr/CeO2: Mechanism Insight and Degradation Pathways. Chem. Eng. J. 2020, 391. [Google Scholar] [CrossRef]
  32. Wu, Y.; Yang, Y.; Liu, Y.; Zhang, L.; Feng, L. Modelling Study on the Effects of Chloride on the Degradation of Bezafibrate and Carbamazepine in Sulfate Radical-Based Advanced Oxidation Processes: Conversion of Reactive Radicals. Chem. Eng. J. 2019, 358, 1332–1341. [Google Scholar] [CrossRef]
  33. Jeong, J.; Kim, J.Y.; Yoon, J. The Role of Reactive Oxygen Species in the Electrochemical Inactivation of Microorganisms. Environ. Sci. Technol. 2006, 40, 6117–6122. [Google Scholar] [CrossRef]
  34. Collin, F. Chemical Basis of Reactive Oxygen Species Reactivity and Involvement in Neurodegenerative Diseases. Int. J. Mol. Sci. 2019, 20, 2407. [Google Scholar] [CrossRef] [Green Version]
  35. Li, H.; Zhang, Z.; Duan, J.; Li, N.; Li, B.; Song, T.; Sardar, M.F.; Lv, X.; Zhu, C. Electrochemical Disinfection of Secondary Effluent from a Wastewater Treatment Plant: Removal Efficiency of ARGs and Variation of Antibiotic Resistance in Surviving Bacteria. Chem. Eng. J. 2020, 392. [Google Scholar] [CrossRef]
  36. Xu, N.; Zhang, Y.; Tao, H.; Zhou, S.; Zeng, Y. Bio-Electro-Fenton System for Enhanced Estrogens Degradation. Bioresour. Technol. 2013, 138, 136–140. [Google Scholar] [CrossRef]
  37. García-Espinoza, J.D.; Mijaylova-Nacheva, P.; Avilés-Flores, M. Electrochemical Carbamazepine Degradation: Effect of the Generated Active Chlorine, Transformation Pathways and Toxicity. Chemosphere 2018, 192, 142–151. [Google Scholar] [CrossRef]
  38. Canosa, P.; Morales, S.; Rodríguez, I.; Rubí, E.; Cela, R.; Gómez, M. Aquatic Degradation of Triclosan and Formation of Toxic Chlorophenols in Presence of Low Concentrations of Free Chlorine. Anal. Bioanal. Chem. 2005, 383, 1119–1126. [Google Scholar] [CrossRef] [PubMed]
  39. Skoumal, M.; Rodríguez, R.M.; Cabot, P.L.; Centellas, F.; Garrido, J.A.; Arias, C.; Brillas, E. Electro-Fenton, UVA Photoelectro-Fenton and Solar Photoelectro-Fenton Degradation of the Drug Ibuprofen in Acid Aqueous Medium Using Platinum and Boron-Doped Diamond Anodes. Electrochim. Acta 2009, 54, 2077–2085. [Google Scholar] [CrossRef]
  40. Zhou, C.; Wang, Y.; Chen, J.; Niu, J. Electrochemical Degradation of Sunscreen Agent Benzophenone-3 and Its Metabolite by Ti/SnO2-Sb/Ce-PbO2 Anode: Kinetics, Mechanism, Toxicity and Energy Consumption. Sci. Total Environ. 2019, 688, 75–82. [Google Scholar] [CrossRef]
Figure 1. Electrochemical reactor setup.
Water 13 00520 g001
Figure 2. Final effluent (a) pH, (b) conductivity, and (c) voltage drop along the Set 1 experiments. Effluent initial pH and conductivity represented as green dashed line and the standard deviation range represented by the green shadow in (a) and (b), respectively. In (a) to (c) standard deviation range represented by the black line; * represents statistical differences in relation to initial effluent value.
Water 13 00520 g002aWater 13 00520 g002b
Figure 3. Effluent in the control and after applying electrochemical (EC) treatment for 6 h (EC-6h, Set 1).
Water 13 00520 g003
Figure 4. Caffeine (CAF), carbamazepine (CBZ) and oxybenzone (OXY) degradation in Set 1 experiments for controls (no current applied) and EC treatment after 2, 4 and 6 h. Standard deviation range represented by the black line.
Water 13 00520 g004
Figure 5. CECs degradation in EC-S3 experiments conducted for 2, 4 and 6 h. Standard deviation range represented by the black line.
Water 13 00520 g005
Table 1. Experimental design.
SetExperiment CodeEC a
Duration (h)
Treatment Duration (h)Number of CECs
(spiked at 200 ppb)
Effluent
Code
Sampling Date
1EC-2h223- bSep. 2019
EC-4h44
EC-6h66
C-2h-2
C-4h-4
C-6h-6
2 *EC-S1-6h663S1Dec. 2019
EC-S2-6h663S2Dec. 2019
EC-S3-2h229S3Oct. 2020
EC-S3-4h449S3Oct. 2020
EC-S3-6h669S3Oct. 2020
a Current density of 8 mA/cm2 was applied in all EC treatments; b in Set 1, the effluent was collected and stored under controlled conditions until use; * controls were also performed but are not represented in the table for simplicity.
Table 2. Effluent pH, conductivity, and voltage drop (mean ± standard deviation) along the EC experiments of Set 2.
Experiment
Code
pHConductivity (mS/cm)Voltage Drop (V)
InitialFinalInitialFinalInitialFinal
EC-S1-6h7.97 ± 0.009.06 ± 0.320.64 ± 0.000.59 ± 0.0211.6 ± 0.413.5 ± 0.6
EC-S2-6h8.13 ± 0.109.53 ± 0.330.48 ± 0.050.45 ± 0.0013.4 ± 0.115.5 ± 0.8
EC-S3-2h7.77 ± 0.009.54 ± 0.220.98 ± 0.000.91 ± 0.0330.8 ± 2.831.8 ± 1.8
EC-S3-4h9.16 ± 0.170.77 ± 0.0226.7 ± 0.031.2 ± 1.0
EC-S3-6h9.54 ± 0.200.77 ± 0.0325.1 ± 4.935.2 ± 9.1
Table 3. Caffeine (CAF), carbamazepine (CBZ) and oxybenzone (OXY) degradation (mean ± standard deviation) in the Set EC experiments using effluents S1 and S2.
Experiment CodeCAFCBZOXY
EC-S1-6h19.0 ± 36.040.0 ± 21.095.0 ± 5.0
EC-S2-6h38.5 ± 10.561.0 ± 8.099.0 ± 0.0
Publisher’s Note: MDPI stays neutral with regard to jurisdictional claims in published maps and institutional affiliations.

