
Experimental Study on the Optimal Strategy for Power Regulation of Governing System of Hydropower Station


China Institute of Water Resources and Hydropower Research, Beijing 100038, China
*
Author to whom correspondence should be addressed.
Water 2021, 13(4), 421; https://doi.org/10.3390/w13040421
Submission received: 15 January 2021
/
Revised: 2 February 2021
/
Accepted: 2 February 2021
/
Published: 5 February 2021
(This article belongs to the Special Issue Hydraulic Transient of Hydropower Station and Pump Station)
Abstract
:Active power instability during the power regulation process is a problem that affects the operation security of hydropower stations and the power grid. This paper focuses on the dynamic response to power regulation of a hydro-turbine governor in the power control mode. Firstly, the mathematical model for the hydro-turbine governing system connected to the power grid is established. Then, considering the effect of water hammer and the guide vane operating speed on power oscillation and reverse power regulation, a novel control strategy based on the S-curve acceleration and deceleration control algorithm (S-curve control algorithm) is proposed to improve power regulation. Furthermore, we carried out field tests in a real hydropower station in order to compare the regulation quality of the novel control strategy based on the S-curve control algorithm with the traditional linear control strategy. Finally, the obtained results show that the proposed optimal control strategy for the hydro-turbine governor improves the stability of power regulation by effectively suppressing reverse power regulation and overshoot. This study provides a good solution for the instability of power and reverse power regulation during the regulation process of the hydro-turbine governor in the power control mode.
1. Introduction
Currently, hydropower has developed rapidly because of its good resource characteristics and regulation ability [1,2,3,4]. Renewable energy sources, such as wind power and solar energy, are random and intermittent [5,6,7]. With the massive integration of these energy sources into the power grid, the issues of operational safety and stability of the power grid have become increasingly prominent concerns. Hydropower is an important peak-regulating and frequency-modulating backbone power source in the power system [8]. Therefore, the stability and regulation quality of its load regulation transition process directly affect the safety, stability, and source coordination of the power grid [9,10]. Furthermore, power dispatching departments are bringing forth higher requirements and standards for the frequency, voltage, and power of the grid-connected hydro-generator unit in order to make better use of the excellent regulation ability of hydropower.
On the one hand, the hydro-turbine governor is the core piece of equipment for controlling the frequency and power of the hydro-generator unit, so its regulating performance directly affects the operational stability of the hydropower station and the power system. Therefore, many scholars are studying its stability. Yu et al. [11] simulated the small load fluctuation process under the isolated and interconnected operation of two hydropower stations and analyzed the stability of the hydro-turbine governing system (HTGS) during a small load disturbance. Xu et al. [12] developed a novel model of the HTGS and used it to analyze the dynamic stability of the HTGS during operation, finding that nonlinear turbine characteristics affected the stability of the HTGS under a load disturbance [13]. Yang et al. [14] studied ultra-low frequency oscillations of hydropower generating systems through theoretical analysis and a physical model experiment. Considering the hydro-turbine nonlinearity, the stability analysis of the hydro-turbine governor was carried out under different control modes [15]. According to [16,17], the accident of the Sayano-Shushenskaya hydropower plant in Russia was caused by operations in the instability zones. In [18,19], authors studied the ultra-low frequency oscillation of hydropower stations with a surge tank and proposed some methods to suppress the oscillation to improve the stability of the hydropower generating system. In [20,21], considering the effect of water hammer in the penstock system, the authors researched the dynamic performance of the hydropower system. The above-mentioned literature has an important reference value for analyzing the stability of the HTGS.
In addition, in the process of load adjustment of grid-connected hydropower units, problems such as reverse power regulation, overshoot, and instability often occur [22,23,24,25]. Therefore, many scholars have researched the controls in the process of power regulation. At present, there are two main load regulation modes for the hydro-turbine governor: opening control mode and power control mode [23,24]. In practice, the power control mode shows higher regulation quality in terms of regulating speed and stability compared with the opening control mode [22,23,24,25], so it is becoming a priority in hydropower system research. In [26,27], the authors investigated the frequency stability of a hydro-generator unit with a surge tank in frequency control and power control modes [26]. The results showed that power control achieves better frequency stability compared with frequency control but at the expense of rapidity [26]. Guo and Yang [28] established nonlinear state equations for the opening control and the power control mode and investigated the performance of PFR (Primary Frequency Regulation) under different control modes. An et al. [29] and Fu et al. [30,31] researched the dynamic performance of PFR in the opening control mode and power control mode and developed a method to improve the regulating ability. In [32,33], some optimal strategies were proposed to improve the regulating ability and quality in the power control mode. Moreover, from the point of view of engineering application, Chen and Li [34] designed an adaptive PID (Proportion-Integration -Differentiation) controller governor for the power control mode in a real hydropower station. The above literature is very valuable for the research of a governor in power control mode.
Meanwhile, the traditional linear control strategy has played an important role in the process of power regulation of a hydro-turbine governor, but it cannot meet the high standard requirements of the power grid for power regulation quality. Meanwhile, it is difficult to solve the reverse power regulation problem and fast response to load. Motivated by the power regulation of the three-stage speed regulation of hydro-turbine governor in [32,33], we propose to apply the S-curve control algorithm to power regulation. In order to solve the limitation of linear control strategy, this control algorithm was first proposed by Ahintas et al. [35] in 2001. At present, this control algorithm featuring rapidity, stability, and high precision in the control process is widely used in complex control fields such as CNC (Computer numerical control) machine tools, stepping motors, and robots [36,37,38].
Motivated by the above discussions, the purpose of this paper is to improve the dynamic response of power regulation of a hydro-turbine governor by the S-curve control strategy while considering water hammer in the power control mode. The novelty and innovations of the paper are as follows:
- (1)
- Establishing a reasonable mathematical model of HTGS considering nonlinear turbine characteristics in the power control mode.
- (2)
- Proposing a novel power control strategy based on the S-curve control algorithm to effectively suppress the power oscillation and reverse power regulation under the power control mode.
- (3)
- Verifying the excellence of the proposed optimal control strategy based on the S-curve control algorithm by conducting field tests in a real hydropower station.
The rest of the paper is organized as follows. In Section 2, mathematical models of the HTGS for the active power mode are established. A novel control strategy to improve power regulation is detailed in Section 3. A comparison between two different power control strategies is included in Section 4. Some useful conclusions and future research suggestions are given in Section 5.
2. Mathematical Model
The HTGS is a complicated nonlinear control system with hydraulic-mechanical-electrical coupling [11,12,13,14,15]. It mainly consists of the hydro-turbine governor, hydro-turbine, water diversion system, generator, and grid load.
2.1. Hydro-Turbine Governing System Model
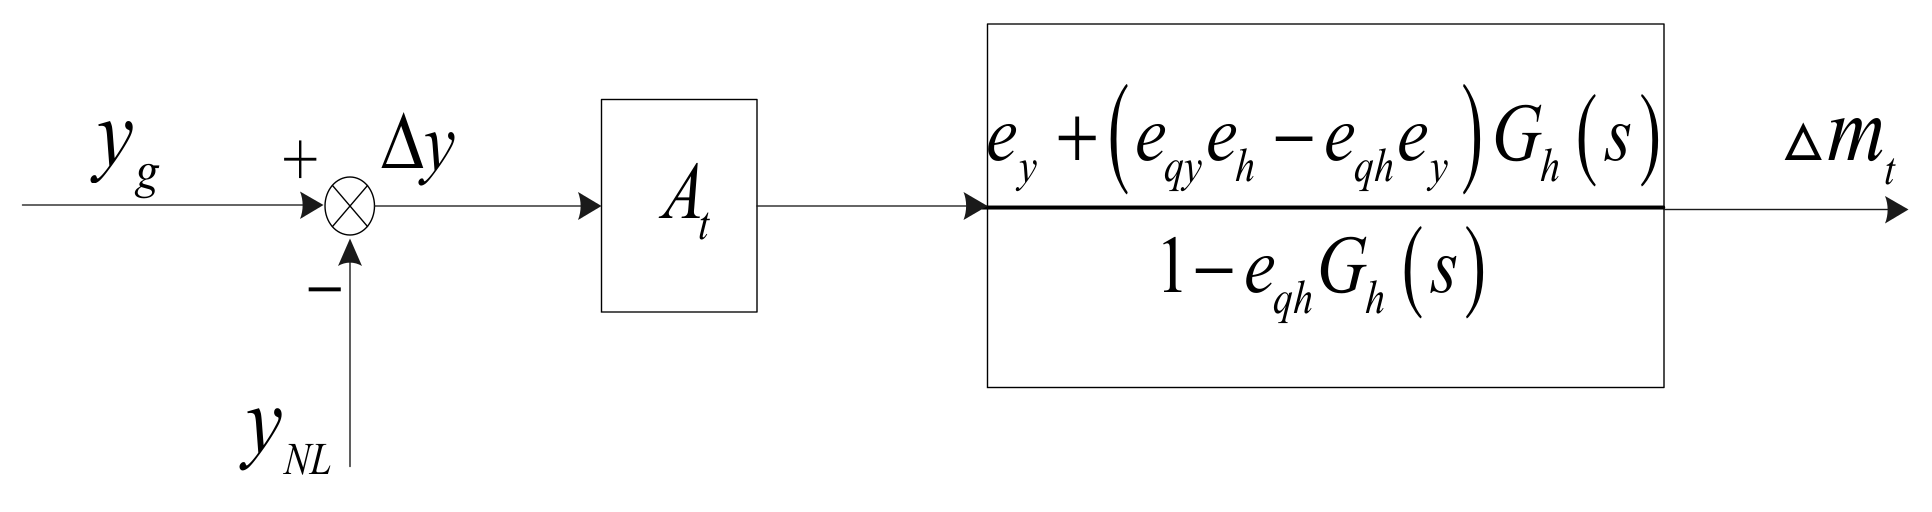
A hydro-turbine governor mainly consists of two parts: a controller and a hydraulic servo system as shown in Figure 1. The parallel PID (proportional integral differential) control model is usually applied here. Its transfer function is shown in Equation (1). The transfer function servo system model is shown in Equation (2):
In the model, f is the unit frequency; Cf is the given value of the target frequency; Ef is the unit frequency regulation dead zone; KP is the proportional gain; KI is the integral gain; KD is the differential gain; TD is the differential time constant; bp is the permanent difference coefficient; Ty1 is the pure delay time of the servo system; Ty is the servomotor time constant; s is a Laplace operator; is the highest opening speed of the servomotor; is the highest closing speed of the servomotor; is the upper limit of the servomotor, which is in a fully open position in most cases; and is the lower limit of the servomotor, which is in a fully closed position in most cases. EP is the unit power regulation dead zone. ep is the power difference coefficient. Pc is the set value of the power, and PG is the measured power value of the hydro-generator unit. As shown in Figure 1, KD and TD are equal to zero, and Equation (1) can be simplified to Equation (3):
2.2. Hydraulic Turbine Model
For a Francis turbine, its dynamic characteristics can be described with five variables, as shown in the following equations [39,40]:
where mt is the output torque of the hydro-turbine; h is the water head; q is the flow rate of the hydro-turbine; x is the speed of the hydro-generator unit; and a is the opening of the hydro-turbine guide vane. Since the opening of the guide vane and the stroke y of the main servomotor are approximately linear, a can be substituted with y. Under slight fluctuations, the linear hydro-turbine model [24,40,41] based on six transfer coefficients can be obtained by means of expanding Equation (4) in series near the operating point and only retaining the linear term:
In Equation (5), is the relative value of the hydro-turbine torque increment; is the relative value of the flow increment; is the relative value of the water head increment; is the relative value of the speed increment; is the relative value of the stroke increment of the servomotor; , , , , , and .
Considering that there is a nonlinear relationship between the turbine guide vane opening and the active power of the hydro-generator unit and that the speed of the hydro-generator unit is almost constant during the load regulation when the unit is connected to the grid, the model of the turbine and water diversion system under load regulation is shown in Figure 2, and Equation (5) can be further expressed with Equation (6):
In Equation (6) and Equation (7), is the transfer function of the pressure water diversion system; is the gain coefficient of the hydro-turbine; is the full-load opening of the hydro-generator unit; is the no-load opening of the hydro-generator unit; and is the correction coefficient, which is equal to one in most cases. When major nonlinearity exists between the main servomotor stroke and the active steady-state value of the hydro-generator unit, the correction coefficient ranges from 0.8 to 1.2.
2.3. Penstock System Model
If the head loss of the pipeline system is not taken into account for the pressure diversion system without pressure regulating equipment, the elastic water hammer model [42] is applied, and its transfer function is obtained by Laplace transformation in the form of a relative deviation of variables, as shown in Equation (8):
In Equation (9), Tw is the inertia time constant of the water flow, and its unit is s; Tr is the phase length of the water hammer wave, and its unit is s; and s is a Laplace operator. The inertia time constant Tw of the water flow is a significant indicator for the hydraulic characteristics of the pressure diversion system. Additionally, L is the length of the pressure pipeline; v is the velocity of the water flow in the pressure pipeline; g is the acceleration due to gravity; and H is the hydro-turbine head. A larger value of Tw indicates larger inertia of water flow, a more obvious water hammer effect, and a greater reverse regulation of the active power in the process of the guide vane operation. Therefore, this parameter is a significant factor affecting the power regulation of the hydro-generator unit.
2.4. Generator Model
The generator and load model are subject to the classical first-order linear model [41,43], as shown in Equation (10):
In this equation, Ta is the inertia time constant of the hydro-generator unit; is the relative value of the turbine speed increment; is the relative value of the main torque increment of the hydro-turbine; is the relative value of the generator load torque deviation; and en is the comprehensive self-regulation coefficient of the generator load.
3. Methods
3.1. Brief Introduction to Active Power Regulation
As the core equipment for controlling the frequency and power of the hydro-generator unit, the hydro-turbine governor has two main power regulation modes in the grid-connected state: opening control mode and power control mode [23,31,33]. The load regulation principle is shown in Figure 3. When the hydro-turbine governor is in the opening control mode, the closed-cycle control of the active power of the hydro-generator unit is mainly realized by the monitoring and controlling system. The hydro-turbine governor receives increase and decrease pulse signals from the local control unit (LCU) of the monitoring and controlling system and then opens or closes the guide vane to adjust the active power of the hydro-generator unit. When the hydro-turbine governor is in the power control mode, the LCU directly transmits the target value of the active power to the hydro-turbine governor through a communication or analog signal. Then, the hydro-turbine governor performs closed-cycle power control through the PI regulation mode according to power deviations. This study analyzes the dynamic response of power regulation for the hydro-turbine governor in the power control mode.
3.2. Problem Formulation
In the process of increasing or decreasing the power of the hydro-power unit during grid-connected operation, the inertia time constant Tw of the water flow, the closing time Tc of the guide vane and other nonlinear factors, an improper setting of the monitoring system or governor regulation parameters, and other human factors will easily cause power oscillations, fluctuations, and reverse regulation. As shown in Figure 4a, the power of the hydro-generator unit shows a severe oscillation and fluctuation when it is dropping to the target power. As shown in Figure 4a–c, the power of the hydro-generator unit changes in the opposite direction due to water hammer caused by the guide vane at the moment when the power is increased or decreased. In other words, the power is reversely regulated. Related problems, such as power oscillation, power fluctuation, and reverse regulation, widely exist in the operation of the hydro-generator unit. These problems seriously disturb the operation safety and stability of the power plant and the power system.
3.3. Power Oscillation Versus Reverse Power Regulation
When the hydro-turbine generator unit carries on the load adjustment, the opening of the guide vanes will change, and the flow and the hydraulic torque of the hydro-turbine will also change. Due to the inertia time constant of the water flow of the hydro-turbine, the change of flow will cause water hammer in the water diversion system, and the occurrence of water hammer will also cause the change of the hydraulic torque of the hydro-turbine. The impact of the water hammer phenomenon in the water diversion system on the characteristics of the hydro-turbine cannot be ignored, especially since its impact is opposite to the movement of the guide vane at the beginning. When the load increases, it is necessary to increase the opening of the guide vanes to increase the flow rate to increase the hydraulic torque of the hydro-turbine, but the negative water hammer caused by the moment of the increase in flow reduces the working head of the turbine, reducing the hydraulic torque of the hydro-turbine, and the active power output. Similarly, in the case of reduced load, the positive water hammer caused by the decrease of the opening of the guide vanes increases the working head, and the active power output by the hydro-turbine generator unit increases instead, which is commonly referred to as the reverse power regulation of the hydro-turbine generator unit. The amount of the reverse power regulation is related to the instantaneous change of the unit flow. The greater the instantaneous change of the flow leads to the greater the reverse power regulation. The reverse power regulation and improper regulation parameters will further lead to power fluctuation and oscillation. Therefore, in order to reduce the reverse power regulation, it is necessary to slow down the speed of the opening of the guide vane change.
3.4. S-curve Regulation for Power Oscillation Control
In order to solve the above problems during power control mode, a novel control strategy based on an S-curve control algorithm is proposed, as shown in Figure 5a,b. Figure 5a shows the action speed variation curve of the turbine guide vane under the S-curve control algorithm. Figure 5b shows the position change of the guide vane curve under a conventional linear control algorithm and an S-curve control algorithm. The MA curve is the action curve under the conventional linear control algorithm, and the MB curve is the action curve under the S-curve control algorithm.
The S-curve control algorithm is derived from the shape of the speed curve in the system acceleration and deceleration process [44]. It is an acceleration and deceleration motion control algorithm with stable speed changes. The acceleration of the S-curve acceleration and deceleration is continuously changing, and the speed change is also relatively gentle, which can effectively reduce the impact and oscillation [45]. The movement curve process can be divided into 7 stages: acceleration, acceleration, uniform acceleration, deceleration, uniform speed, acceleration and deceleration, and uniform deceleration. It means that the acceleration of acceleration and deceleration is constant during the process of acceleration and deceleration, and the sudden change of acceleration is avoided to reduce the acceleration caused by the sudden change of mechanical system vibration. The S-curve acceleration and deceleration algorithm can obtain smooth speed and acceleration.
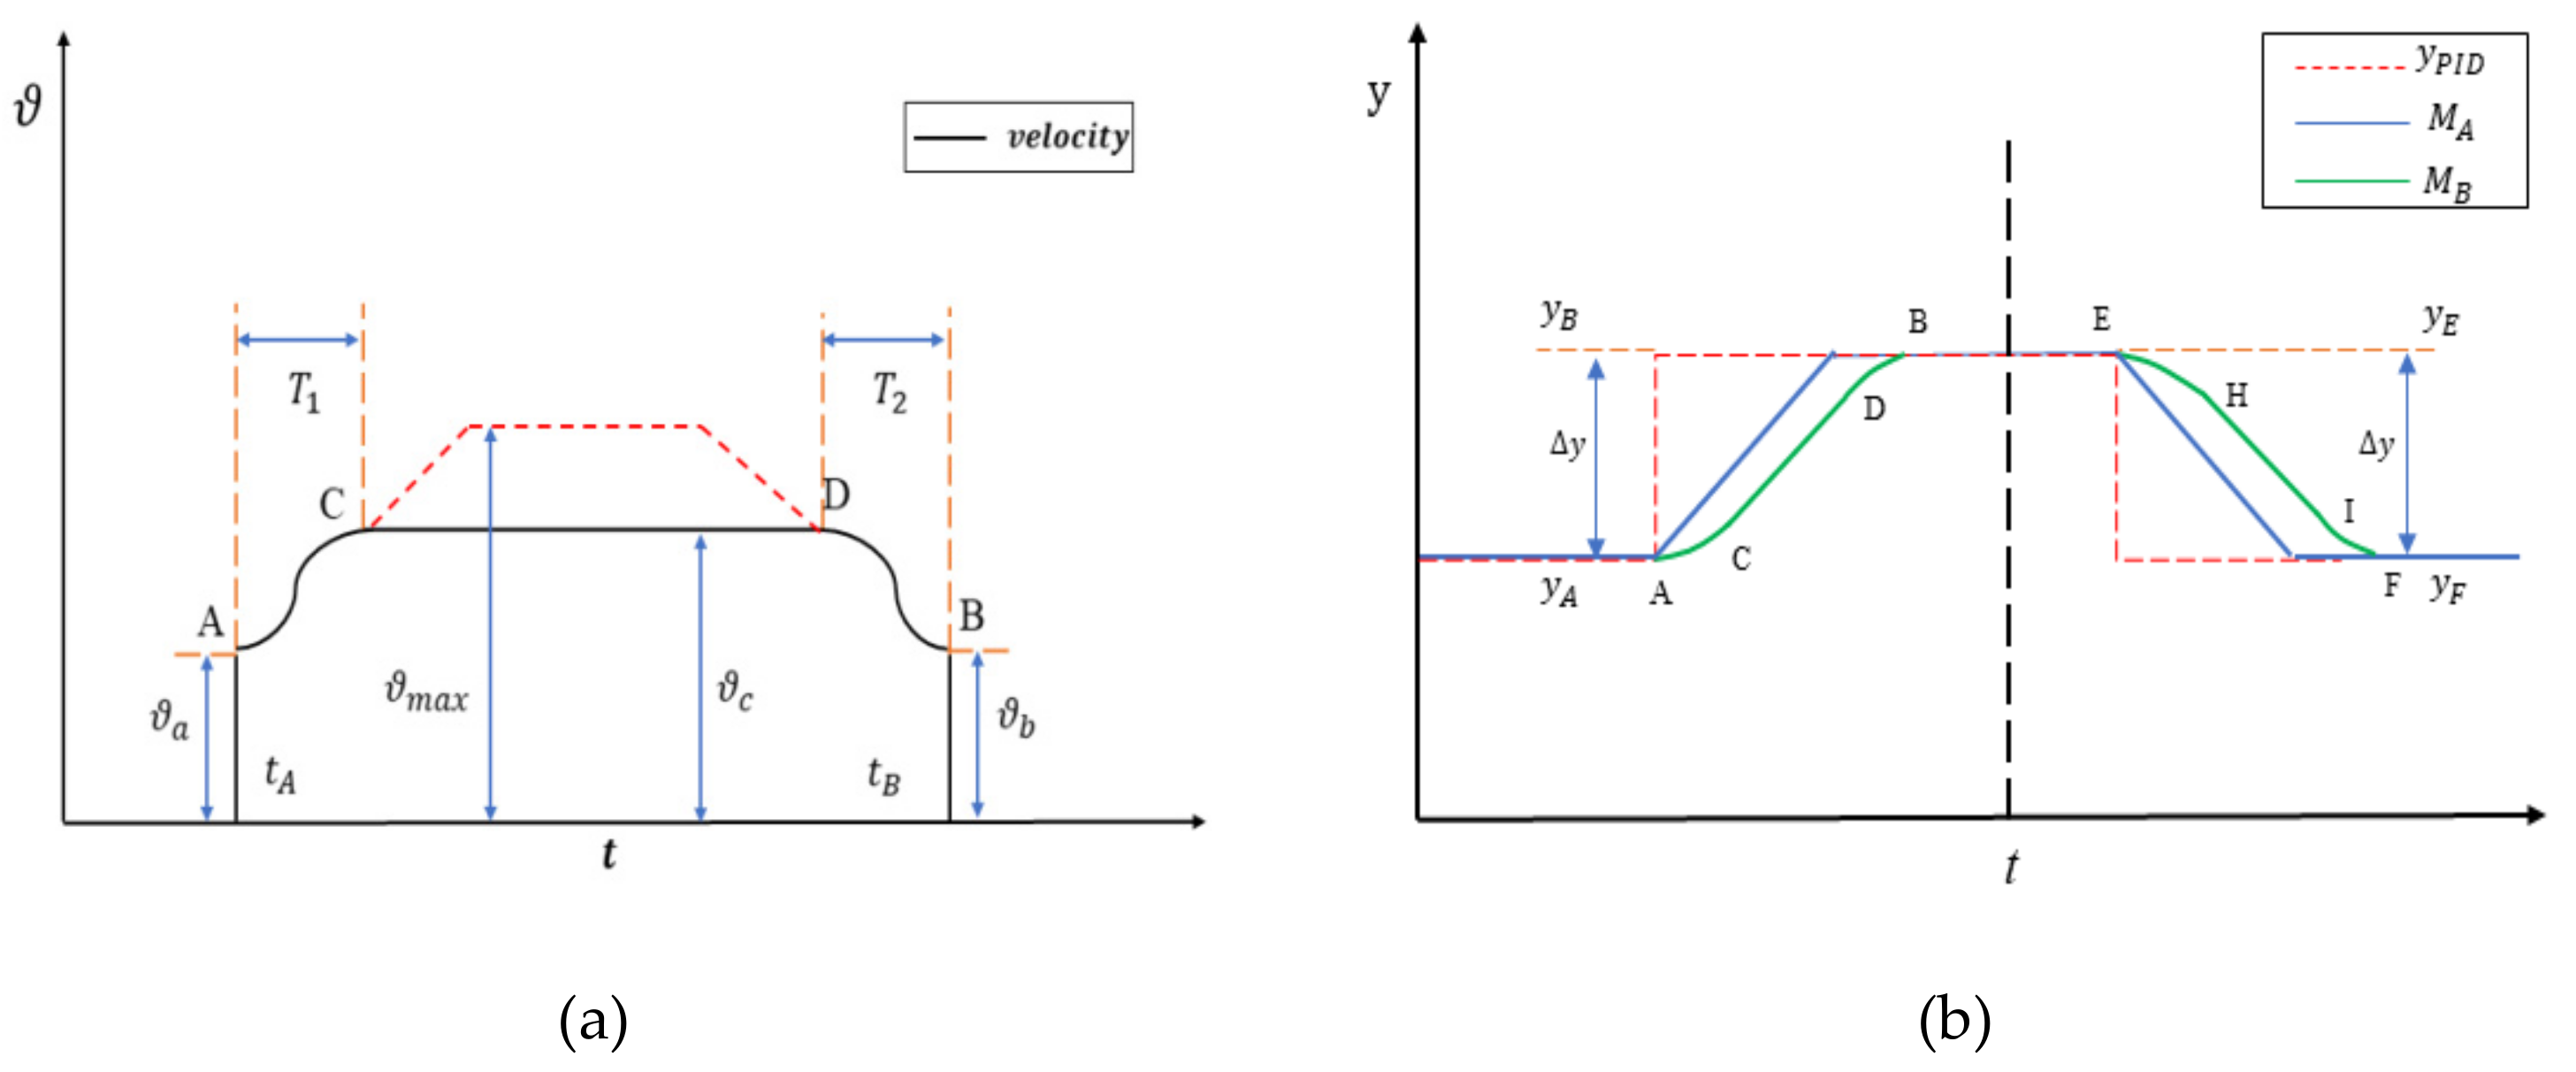
The following will introduce the S-curve control algorithm based on the principle of the hydro-turbine governor controlling the movement of the servomotor. The S-curve control algorithm controls the action of the guide vane by buffering and changing the speed, thus reducing water hammer caused by instantaneous actions of the guide vane. In the process of moving the guide vane from the position yA to the target position yB, the movement is divided into three sections: A to C, C to D, and D to B. In the section from A to C, the guide vane accelerates slowly from the initial speed ϑa to the constant speed ϑc. In the section from C to D, the guide vane moves at the constant speed ϑc. When approaching the target position from D to B, the guide vane slowly decelerates from the constant speed ϑc to ϑb until it stops. The range, time, and speed of moving from A to C and from D and B can be adjusted by setting parameters. Since the buffer acceleration and deceleration control algorithm is applied, water hammer produced by the instantaneous action of the guide vane is alleviated, thus effectively suppressing the power oscillation, fluctuation, and reverse regulation of the hydro-generator unit. Thanks to the conventional linear control algorithm, the governor controls the guide vane to move from the current position yA to the target position yB at a constant speed. Under such a circumstance, the guide vane will produce a great impact at the moment of opening and closing, resulting in water hammer and degrading the stability of the dynamic response of power regulation of the hydro-generator unit.
3.5. Power Regulation Dynamic Response Index
The power stability index refers to the ratio of the peak-to-peak value of a continuous fluctuation of the unit output power to the rated power Pr of the hydro-generator unit when the hydro-generator unit is in the grid-connected operation mode and the turbine governor is in the power regulation mode. Meanwhile, the index is the maximum interval of a relative deviation between the actual output power of the unit and the set value Pset (target value). The power fluctuation curve of the hydro-generator unit is shown in Figure 6. The index can be calculated by Equation (11), where is the power stability index; is the maximum peak value of the output power from the hydro-generator unit in the continuous fluctuation period, and its unit is MW; is the minimum valley value of the output power from the hydro-generator unit in the continuous fluctuation period, and its unit is MW; and is the rated power of the hydro-generator unit, and its unit is MW:
The curve of dynamic response to power regulation is shown in Figure 7. P0 is the current value of power from the hydro-generator unit; P1 is the target value of power; Pr is the rated power; Pfp is the reverse peak power; is the power overshoot; ts is the settling time; tM is the time to reach the peak value; t0.9 is the rise time; thx is the hysteretic time; and tfp is the time to reach the reverse peak value.
The dynamic response of power regulation is subject to the following requirements [46]:
- (1)
- The maximum overshoot of the active power must not exceed 45% of the disturbance .
- (2)
- When the target value variation of the active power is not less than 25% of the rated active power Pr of the hydro-generator unit, the power regulation time ts cannot exceed 45 s; when the power variation is equivalent to 5–25% of the rated active power, the power regulation time ts cannot exceed 30–45 s.
- (3)
- Within the power regulation time ts, the fluctuation Z with the power deviation greater than 5% of Pr cannot occur more than twice.
4. Results and Discussion
4.1. Engineering Case
A field test was carried out on the hydro-generator unit in a real hydropower station in China, and the main parameters of the test unit are listed in Table 1. The test data were obtained from the data acquisition system of the unit governor. The data collected in real-time mainly included the frequency, power, and set power of the hydro-generator unit, and the guide vane opening. Tests with variations of 5%, 10%, 20%, and 40% were performed at 50% rated power. With the help of the above tests, the dynamic response process of power regulation was compared between the control strategy based on an S-curve algorithm and the conventional linear control strategy.
4.2. Comparison of Small Power Change Test
The test featuring variations with slight amplitude was performed at 50% rated power, and tests with power variations of 5% and 10 % were carried out at the same time. Under the stable power regulation, the monitoring system directly allocates 55% and 60% of the target power regulation values to the governor for 50–55–50% and 50–60–50% power regulation tests, respectively. The field test curves are shown in Figure 8a and Figure 9a show the power regulation test curves under the S-curve control strategy. Figure 8b and Figure 9b show the power regulation test curves under the linear control strategy.
The test featuring variations with slight amplitude was performed at 50% rated power, and tests with power variations of 5% and 10% were carried out at the same time. Under the stable power regulation, the monitoring system directly allocates 55% and 60% of the target power regulation values to the governor for 50–55–50% and 50–60–50% power regulation tests, respectively. The field test curves are shown in Figure 8 and Figure 9. Figure 8a and Figure 9a show the power regulation test curves under the S-curve control strategy. Figure 8b and Figure 9b show the power regulation test curves under the linear control strategy.
According to the definition of relevant indexes of the dynamic response of the power regulation in Section 3, the test data in Figure 8a,b and Figure 9a,b are calculated in. The table presents calculated values of dynamic response indexes of the above tests. In Table 2, S represents S-curve control strategy, L represents traditional linear control strategy. According to Figure 8 and Figure 9 and Table 2, the power regulation in the power regulation tests with small variations of 5% and 10% can finally realize a stable state under the two different control strategies. However, the power and under the S-curve control strategy are lower than those under the linear control strategy, indicating that the S-curve control strategy ensures higher stability. The power and under the S-curve control strategy are very small, which shows that it is more effective to suppress reverse power regulation. In addition, reflects the regulation time of the dynamic response, and the S-curve control strategy also works effectively. According to comprehensive test results, the S-curve control strategy works effectively in the process of small-scale power regulation.
4.3. Comparison of Large Power Change Test
A large power change test was implemented at 50% rated power. Power regulation tests with 20% and 40% of the rated power were carried out under two different control strategies. At 50% rated power, the monitoring system directly allocates 70% and 90% of the target power regulation values to the governor for 50–70–50% and 50–90–50% power regulation tests, respectively. Field test curves are shown in Figure 10 and Figure 11. Power regulation test curves under the S-curve control strategy are shown in Figure 10a and Figure 11a,b. Power regulation test curves under the linear control strategy are shown in Figure 10b and Figure 11c,d.
Table 3 shows the calculated values of dynamic response indexes for power regulation at 20% and 40% of the rated power. According to calculated values of indexes in Table 3 and test curves in Figure 10a,b, it can be concluded that both the overshoot and peak value of the reverse regulation under the linear control strategy are large during the regulation at 20% rated power. The overshoot reaches 8.5% during regulation by increasing the power by 20%, and the peak value of the reverse regulation reaches 4.9% during regulation by decreasing the power by 20%. However, all the above values under the S-curve control strategy are equal to zero, indicating that the strategy can effectively suppress the power overshoot and reverse regulation peak value during a dynamic response of power regulation. Figure 11a–d shows dynamic response curves representing 40% power variation amplitudes. According to the calculated values listed in Table 3, the S-curve control strategy ensures higher stability and quality of power regulation. However, it should be noted that the linear control strategy ensures a shorter regulation time . This indicates that the linear control strategy has used a faster guide vane action mode under a large power variation range to achieve faster power regulation and a better control effect. But this mode has resulted in a power overshoot of 21% and a reverse regulation peak value of 9.7%, thus increasing instability during power regulation.
4.4. Discussion
All the above field tests have proven that the S-curve control strategy has a good regulating ability and excellent regulating performance in the process of dynamic response to power regulation. This strategy provides a solution to problems caused by large power overshoot and reverse regulation of the hydro-turbine governor in the power regulation mode. It has been applied to many large power stations, fully proving its reliability in engineering practice.
When the hydro-turbine generator unit performs power adjustment, at the beginning of the movement of the guide vanes (A to C or E to H), the hydro-turbine governor based on the S-curve control strategy makes the guide vanes move at a slower rate to achieve the purpose of reducing the reverse power regulation. After the opening of the guide vanes starts to change (C to D or H to I), the governor increases the speed of the guide vane change to speed up the power adjustment speed. When approaching the target power (D to B or I to F), the governor reduces the power adjustment speed again to reduce the power overshoot. In addition, the regulation parameters of the controller need to be adjusted and determined through field tests.
The value of reflects the index of steady-state stability of the power control system. It can be seen from Table 2 and that the S-curve control strategy is significantly better than the conventional linear control strategy in the above field test. Another important indicator that reflects the overshoots are basically zero under the newly proposed S-curve control strategy, while the overshoots are very obvious in the traditional linear control strategy. Indicators and reflect the magnitude of reverse power regulation. The values in Table 2 and Table 3 show that the newly proposed S-curve control strategy is very effective in suppressing reverse power regulation. The effect of suppressing reverse power regulation becomes more obvious with the increase in the amplitude of power adjustment. In addition, it should be noted that the improvement of the regulation time of the entire transition process is not particularly obvious. It can be seen from Table 3 that the adjustment times are 34.7 and 33.4 s during the adjustment process with power regulation with 40% rated power change. This shows that this proposed control strategy to reduce the reverse power regulation is to sacrifice the regulation time. In a word, the newly proposed control strategy is very effective in improving reverse power regulation and overshoot.
It should be noted that all the above field tests were carried out with specified PID parameters. A quantitative analysis was not performed in relation to the impact caused by the inertia time constant Tw of the water flow, the acceleration inertia time constant Ta of the hydro-generator unit, or the closing time of the guide vane in the dynamic response process and the regulation parameters of the controller. Therefore, in the future, quantitative analysis of the basic theory and a simulation test will be applied to implement an in-depth study on the above factors.
5. Conclusions
In this study, the power control strategy of a hydro-turbine governor in the power control mode was optimized by an S-curve control algorithm. The dynamic response process of power regulation under the traditional control algorithm and the S-curve control algorithm were compared through field tests. The main conclusions are presented below.
- (1)
- In comparison with the conventional linear control algorithm, the S-curve control algorithm greatly promotes the regulation speed, precision, and stability in the dynamic response process of power regulation, especially in the power regulation process with large power variations.
- (2)
- The S-curve control algorithm adopts the slow acceleration mode when the guide vane starts and stops moving in the process of power regulation. This helps prevent the impact caused by the guide vane at the moment of movement, relieve the water hammer effect, and reduce the peak value of the reverse power regulation and the power overshoot.
- (3)
- Nonlinear factors of the hydro-generator unit, such as the inertia time constant Tw of the water flow, acceleration inertia time constant Ta of the unit, and nonlinear relation between the guide vane opening and the turbine output power, will affect the power regulation quality of dynamic response.
The S-curve control algorithm of the hydro-turbine governor in the power control mode could be a direct and efficient tool for further research and engineering applications. This paper focused on the optimization of the power control strategy of the hydro-turbine governor in the power control mode. Some factors of the system, like the excitation system and AGC, were neglected. Future research will include additional improvement of the control strategy by taking into account the effects of disturbances from other systems.
Author Contributions
Conceptualization, C.W. and D.-K.W. and J.-M.Z.; formal analysis, C.W.; investigation, C.W.; writing—original draft preparation, C.W.; writing—review and editing, D.-K.W. and J.-M.Z. project administration, D.-K.W.; All authors have read and agreed to the published version of the manuscript.
Funding
This work was supported by the National Key Research and Development Project of China under Grant 2018YFB0905203 and the IWHR Research & Development Support Program of China under Grant AU0145B202020 and AU0145B202018.
Institutional Review Board Statement
Not applicable.
Informed Consent Statement
Not applicable.
Data Availability Statement
The data presented in this study are available in the article.
Acknowledgments
The authors would like to express their sincere gratitude to the anonymous reviewers for their constructive comments and the Editor of the journal. Their detailed suggestions have resulted in an improved manuscript.
Conflicts of Interest
The authors declare no conflict of interest. The funders had no role in the design of the study; in the collection, analyses, or interpretation of data; in the writing of the manuscript, or in the decision to publish the results.
References
- Hydropower Status Report. Available online: https://www.hydropower.org/statusreport (accessed on 10 May 2020).
- China Renewable Energy Development Report 2019. Available online: https://www.natureindex.com/institution-outputs/china/china-renewable-energy-engineering-institute-creei-power-china/5588b4e2140ba0e07b8b456e (accessed on 1 November 2019).
- China Electricity Council. Available online: https://www.cec.org.cn (accessed on 1 May 2020).
- China National Energy Administration. Available online: http://www.nea.gov.cn (accessed on 1 March 2020).
- Hou, H.; Xu, T.; Wu, X.; Wang, H.; Tang, A.; Chen, Y. Optimal capacity configuration of the wind-photovoltaic-storage hybrid power system based on gravity energy storage system. Appl. Energy 2020, 271, 115052. [Google Scholar] [CrossRef]
- Campos, R.A.; do Nascimento, L.R.; Rüther, R. The complementary nature between wind and photovoltaic generation in Brazil and the role of energy storage in utility-scale hybrid power plants. Energy Convers. Manag. 2020, 221, 113160. [Google Scholar] [CrossRef]
- Poompavai, T.; Kowsalya, M. Control and energy management strategies applied for solar photovoltaic and wind energy fed water pumping system: A review. Renew. Sustain. energy Rev. 2019, 107, 108–122. [Google Scholar] [CrossRef]
- Nautiyal, H.; Goel, V. Sustainability assessment of hydropower projects. J. Clean. Prod. 2020, 265. [Google Scholar] [CrossRef]
- Li, H.; Xu, B.; Riasi, A.; Szulc, P.; Chen, D.; M’zoughi, F.; Skjelbred, H.I.; Kong, J.; Tazraei, P. Performance evaluation in enabling safety for a hydropower generation system. Renew. Energy 2019, 143, 1628–1642. [Google Scholar] [CrossRef]
- Li, H.; Chen, D.; Gao, X.; Wang, X.; Han, Q.; Wu, C. Fast-slow dynamics of a hydropower generation system with multi-time scales. Mech. Syst. Signal Process. 2018, 110, 458–468. [Google Scholar] [CrossRef]
- Yu, X.; Yang, X.; Jian, Z. Stability analysis of hydro-turbine governing system including surge tanks under interconnected operation during small load disturbance. Renew. Energy 2019, 133, 1426–1435. [Google Scholar] [CrossRef]
- Xu, B.; Chen, D.; Zhang, H.; Wang, F. Modeling and stability analysis of a fractional-order Francis hydro-turbine governing system. Chaos, Solitons & Fractals 2015, 75, 50–61. [Google Scholar]
- Xu, X.; Guo, W. Stability of speed regulating system of hydropower station with surge tank considering nonlinear turbine characteristics. Renew. Energy 2020, 162, 960–972. [Google Scholar] [CrossRef]
- Yang, W.; Yang, J.; Zeng, W.; Tang, R.; Hou, L.; Ma, A.; Zhao, Z.; Peng, Y. Experimental investigation of theoretical stability regions for ultra-low frequency oscillations of hydropower generating systems. Energy 2019, 186. [Google Scholar] [CrossRef]
- Liu, D.; Wang, X.; Peng, Y.; Zhang, H.; Xiao, Z.; Han, X.; Malik, O.P. Stability analysis of hydropower units under full operating conditions considering turbine nonlinearity. Renew. Energy 2020, 154, 723–742. [Google Scholar] [CrossRef]
- Leonov, G.A.; Kuznetsov, N.V.; Solovyeva, E.P. A simple dynamical model of hydropower plant: stability and oscillations. IFAC-PapersOnLine 2015, 48, 656–661. [Google Scholar] [CrossRef]
- Kuznetsov, N.V.; Yuldashev, M.V.; Yuldashev, R.V. Analytical-numerical analysis of closed-form dynamic model of Sayano-Shushenskaya hydropower plant: stability, oscillations, and accident. Commun. Nonlinear Sci. Numer. Simul. 2021, 93. [Google Scholar] [CrossRef]
- Wang, G.; Xu, Z.; Guo, X.; Xiao, L. Mechanism analysis and suppression method of ultra-low-frequency oscillations caused by hydropower units. Int. J. Electr. Power Energy Syst. 2018, 103, 102–114. [Google Scholar] [CrossRef]
- Yu, X.; Yang, X.; Liu, Z.; Zhang, J. Mechanism and quantified criteria of stability characteristics of hydropower plants with surge tanks during regulation. Int. J. Electr. Power Energy Syst. 2020, 122. [Google Scholar] [CrossRef]
- Guo, W.; Peng, Z. Order reduction and dynamic performance of hydropower system with surge tank for grid-connected operation. Sustain. Energy Technol. Assessments 2020, 40. [Google Scholar] [CrossRef]
- Guo, W.; Yang, J. Dynamic performance analysis of hydro-turbine governing system considering combined effect of downstream surge tank and sloping ceiling tailrace tunnel. Renew. Energy 2018, 129, 638–651. [Google Scholar] [CrossRef]
- He, C.; Dong, H.; Dong, P.; Su, H.; Wang, X.; Ding, Y. Engineering analysis and optimization on typical control strategy of primary frequency modulation and automatic generation control of hydropower unit. Autom. Electr. Power Syst. 2015, 39, 146–150. [Google Scholar]
- Bao, H.; Long, Y.; Fu, L.; Wei, J. Study on stability of load regulation transition process of hydro turbine governor in power regulation mode. Trans. Chin. Soc. Agric. Eng. 2019, 35. [Google Scholar] [CrossRef]
- Wei, S. Hydraulic Turbine Regulation; Huazhong University of Science and Technology Press: Wuhan, China, 2009. [Google Scholar]
- Yang, W.; Yang, J.; Guo, W.; Zeng, W.; Wang, C.; Saarinen, L.; Norrlund, P. A mathematical model and its application for hydro power units under different operating conditions. Energies 2015, 8, 10260–10275. [Google Scholar] [CrossRef]
- Yang, W.; Yang, J.; Guo, W.; Norrlund, P. Frequency stability of isolated hydropower plant with surge tank under different turbine control modes. Electr. Power Components Syst. 2015, 43, 1707–1716. [Google Scholar] [CrossRef] [Green Version]
- Yang, W.; Norrlund, P.; Chung, C.Y.; Yang, J.; Lundin, U. Eigen-analysis of hydraulic-mechanical-electrical coupling mechanism for small signal stability of hydropower plant. Renew. Energy 2018, 115, 1014–1025. [Google Scholar] [CrossRef]
- Guo, W.; Yang, J. Stability performance for primary frequency regulation of hydro-turbine governing system with surge tank. Appl. Math. Model. 2018, 54, 446–466. [Google Scholar] [CrossRef]
- An, H.; Yang, J.; Yang, W.; Cheng, Y.; Peng, Y. An improved frequency dead zone with feed-forward control for hydropower units: performance evaluation of primary frequency control. Energies 2019, 12. [Google Scholar] [CrossRef] [Green Version]
- Fu, L.; Wei, J.; Huang, B. Study on factors of influence on electricity contribution of primary frequency modulation of hydro-power unit. Water Resour. Hydropower Eng. 2020, 51, 103–110. [Google Scholar]
- Du, L.; Bao, H.; Huang, B. Study on active power regulation of hydropower unit monitoring system. J. Hydroelectr. Eng. 2020, 39, 62–71. [Google Scholar]
- Wei, J.; Guili, Z.; Zuohong, M.; Pei, Z. Power regulation mode study based on three-stage speed regulation of hydropower unit. Hydropower Autom. Dam Monit. 2014, 38, 26–30. [Google Scholar]
- Fu, L. Optimization of governor power mode for hydro-turbine units with slope ceiling tail tunnels. J. Hydroelectr. Eng 2018, 37, 88–95. [Google Scholar]
- Chen, Y.; Li, X. Active power regulation based on adaptive PID controller. Large Electr. Mach. Hydraul. Turbine 2016, 2016, 62–64. [Google Scholar]
- Erkorkmaz, K.; Altintas, Y. High speed CNC system design. Part I: Jerk limited trajectory generation and quintic spline interpolation. Int. J. Mach. Tools Manuf. 2001, 41, 1323–1345. [Google Scholar] [CrossRef]
- Li, D.; Wu, J.; Wan, J.; Wang, S.; Li, S.; Liu, C. The implementation and experimental research on an S-curve acceleration and deceleration control algorithm with the characteristics of end-point and target speed modification on the fly. Int. J. Adv. Manuf. Technol. 2017, 91, 1145–1169. [Google Scholar] [CrossRef]
- Lu, T.-C.; Chen, S.-L.; Yang, E.C.-Y. Near time-optimal s-curve velocity planning for multiple line segments under axis constraints. IEEE Trans. Ind. Electron. 2018, 65, 9582–9592. [Google Scholar] [CrossRef]
- Tsai, Y.-F.; Farouki, R.T.; Feldman, B. Performance analysis of CNC interpolators for time-dependent feedrates along PH curves. Comput. Aided Geom. Des. 2001, 18, 245–265. [Google Scholar] [CrossRef]
- Chen, Z.; Yuan, X.; Ji, B.; Wang, P.; Tian, H. Design of a fractional order PID controller for hydraulic turbine regulating system using chaotic non-dominated sorting genetic algorithm II. Energy Convers. Manag. 2014, 84, 390–404. [Google Scholar] [CrossRef]
- Fang, H.; Chen, L.; Dlakavu, N.; Shen, Z. Basic modeling and simulation tool for analysis of hydraulic transients in hydroelectric power plants. IEEE Trans. energy Convers. 2008, 23, 834–841. [Google Scholar] [CrossRef]
- Working Group Prime Mover and Energy Supply. Hydraulic turbine and turbine control models for system dynamic studies. IEEE Trans. Power Syst. 1992, 7, 167–179. [Google Scholar] [CrossRef]
- Zheng, Y.; Zhang, J. Transient Process of Hydraulic Unit; Peking University Press: Beijing, China, 2008. [Google Scholar]
- Guo, W.; Yang, J.; Wang, M.; Lai, X. Nonlinear modeling and stability analysis of hydro-turbine governing system with sloping ceiling tailrace tunnel under load disturbance. Energy Convers. Manag. 2015, 106, 127–138. [Google Scholar] [CrossRef]
- Wang, L.; Cao, J. A look-ahead and adaptive speed control algorithm for high-speed CNC equipment. Int. J. Adv. Manuf. Technol. 2012, 63, 705–717. [Google Scholar] [CrossRef]
- Song, F.; Yu, S.; Chen, T.; Sun, L.-N. Research on CNC simulation system with instruction interpretations possessed of wireless communication. J. Supercomput. 2016, 72, 2703–2719. [Google Scholar] [CrossRef]
- State Standard of the People’s Republic of China. Test code of Control Systems for Hydraulic Turbines GB/T9652.1-2019; China Standards Press: Beijing, China, 2019. [Google Scholar]
Figure 1.
Structure of the mathematical model of the hydro-turbine governor.
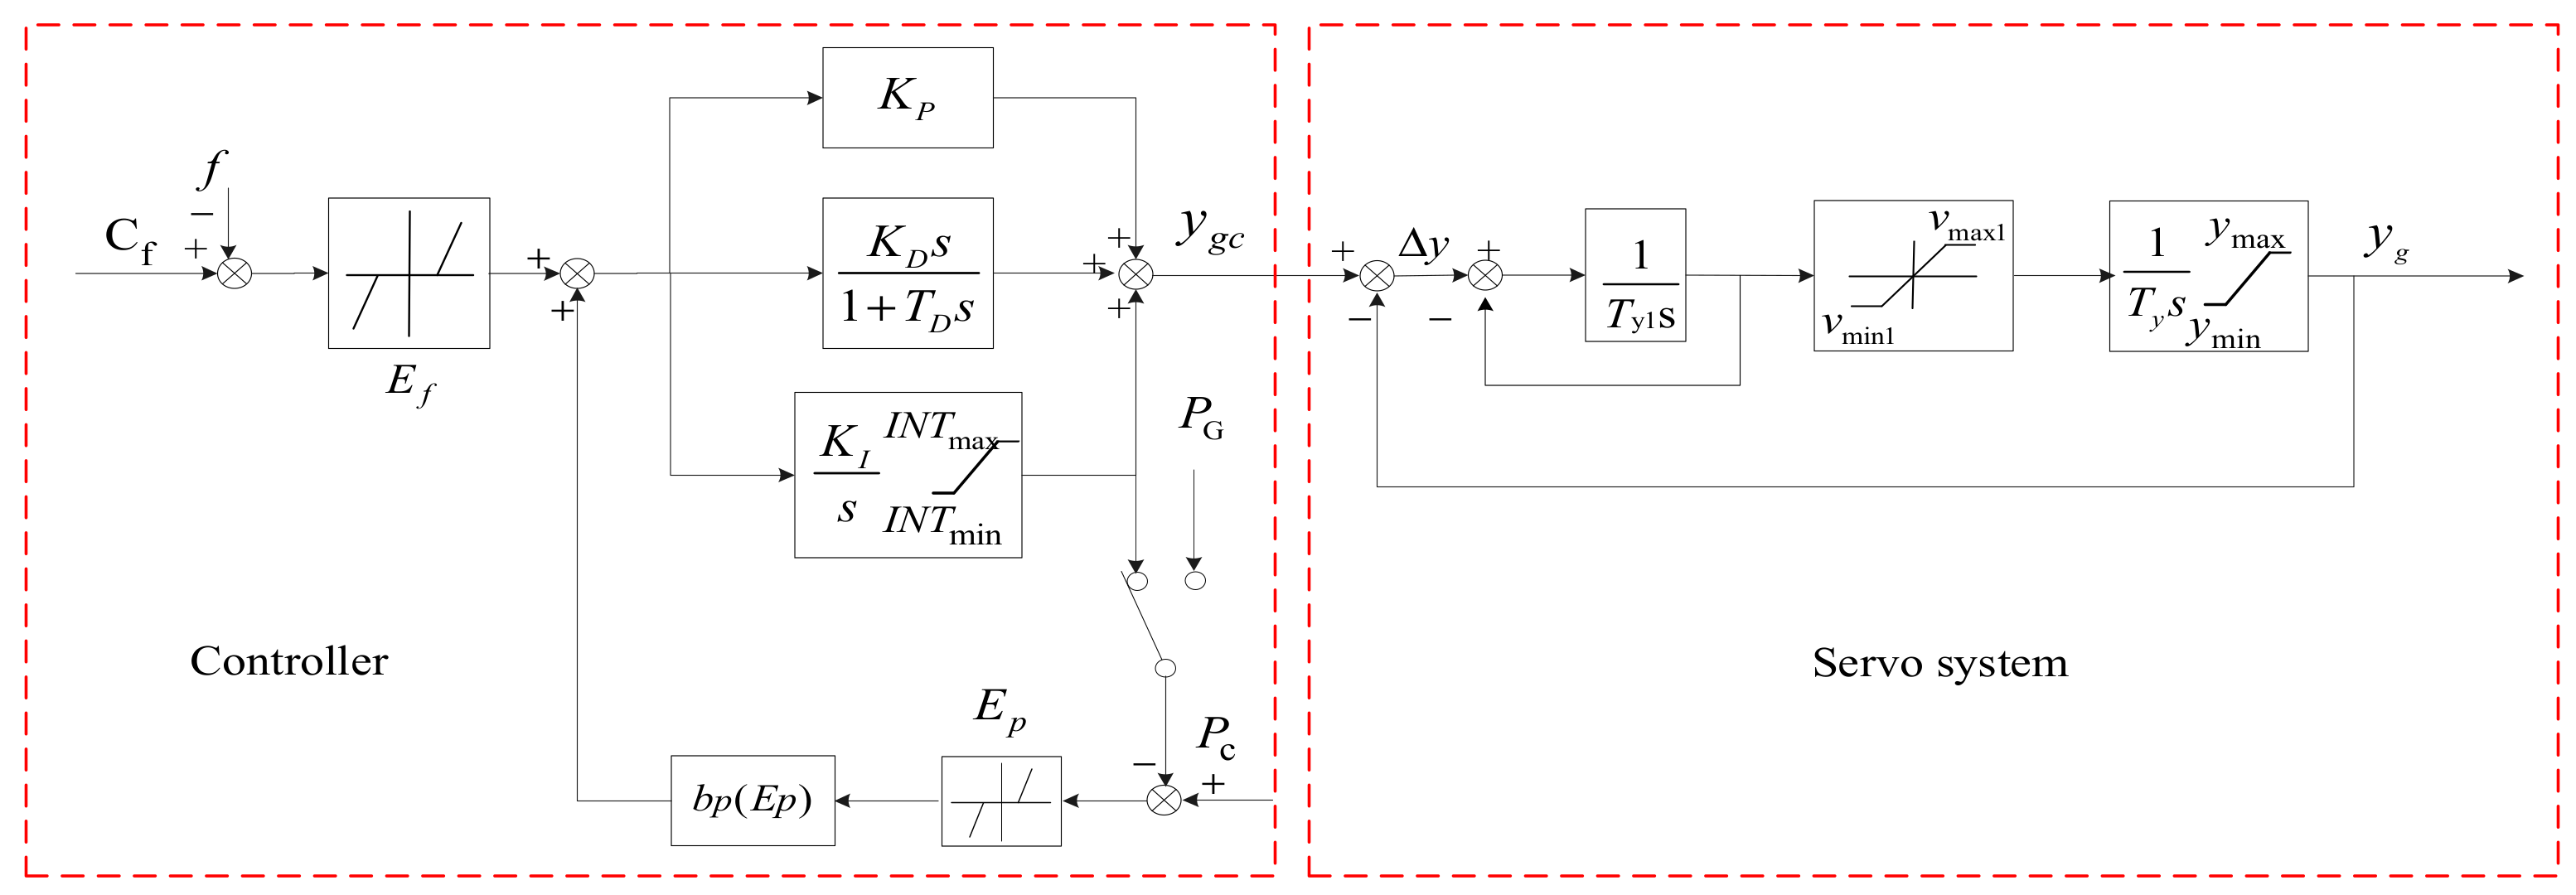
Figure 2.
Hydro-turbine model under load regulation.

Figure 3.
Grid-connected operation structure diagram of the hydro-turbine governor.
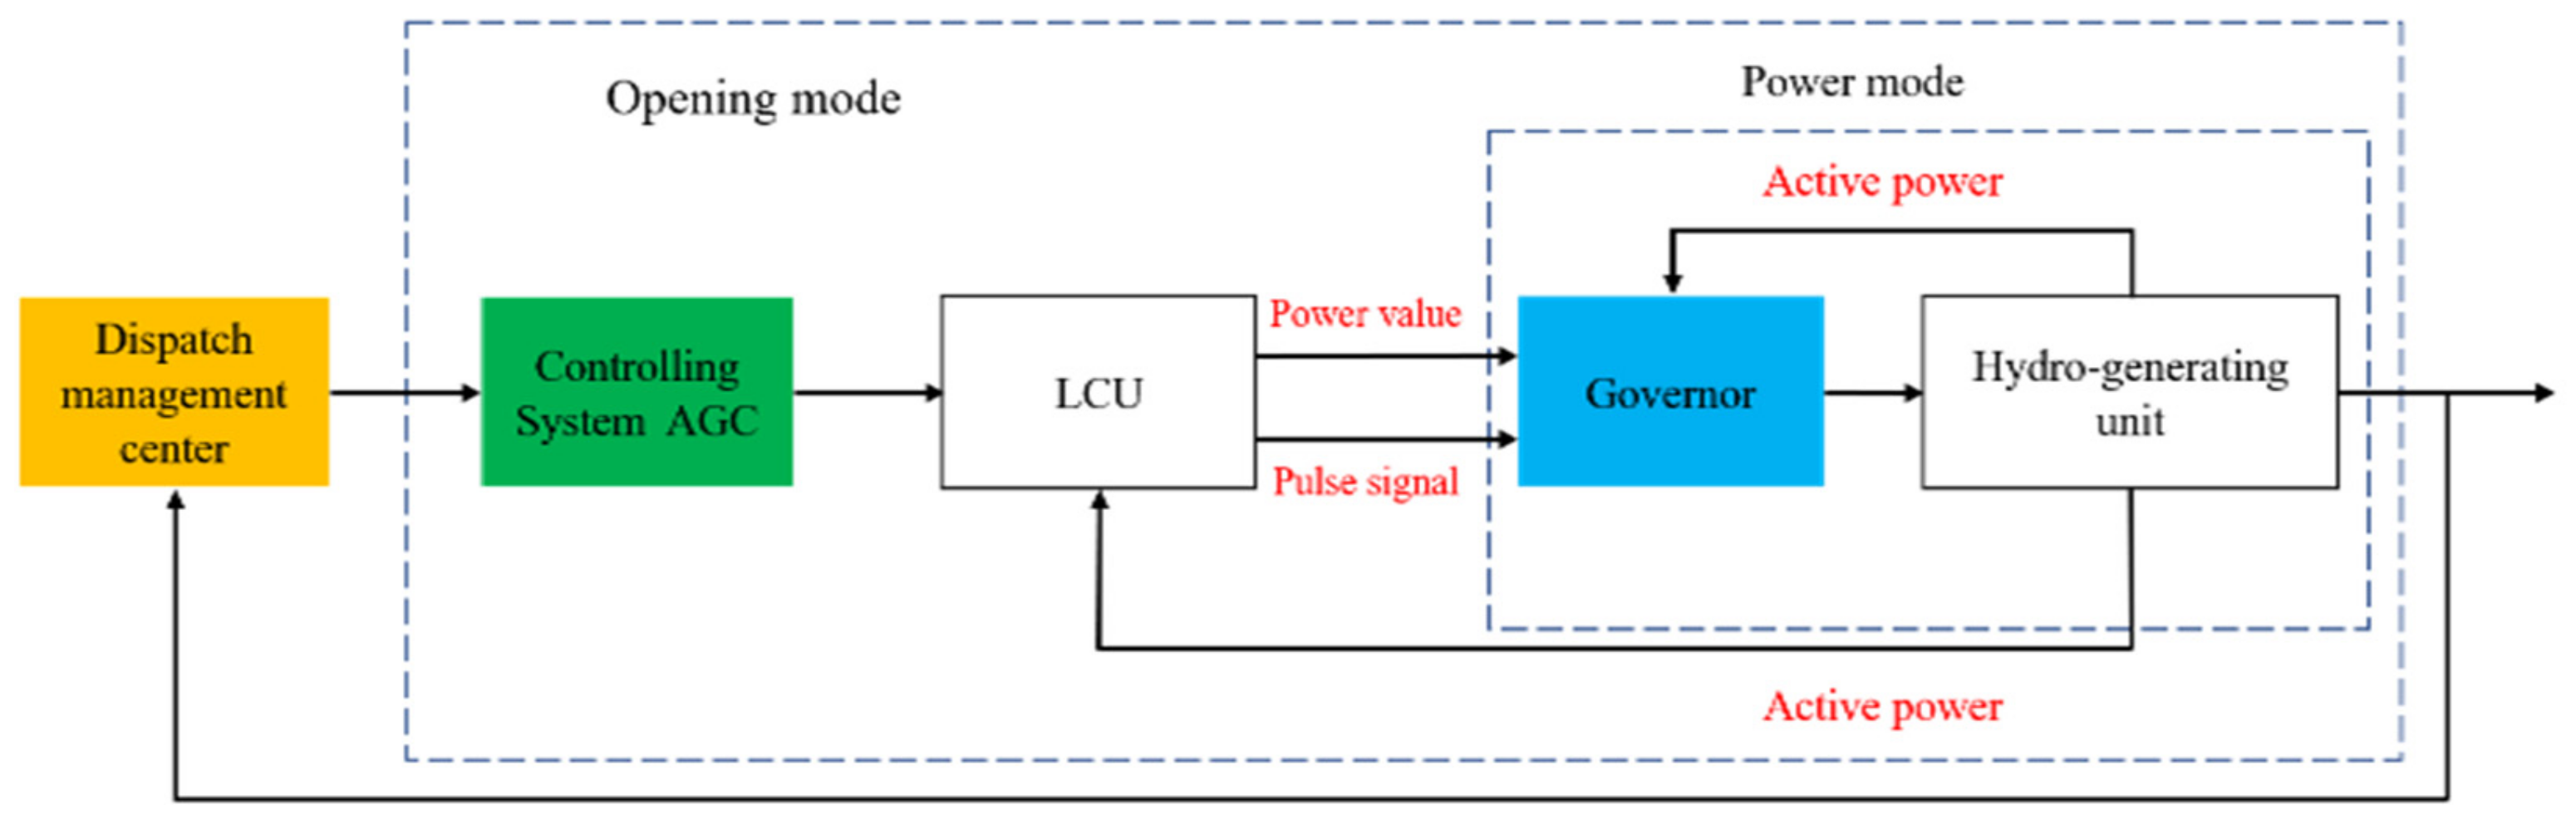
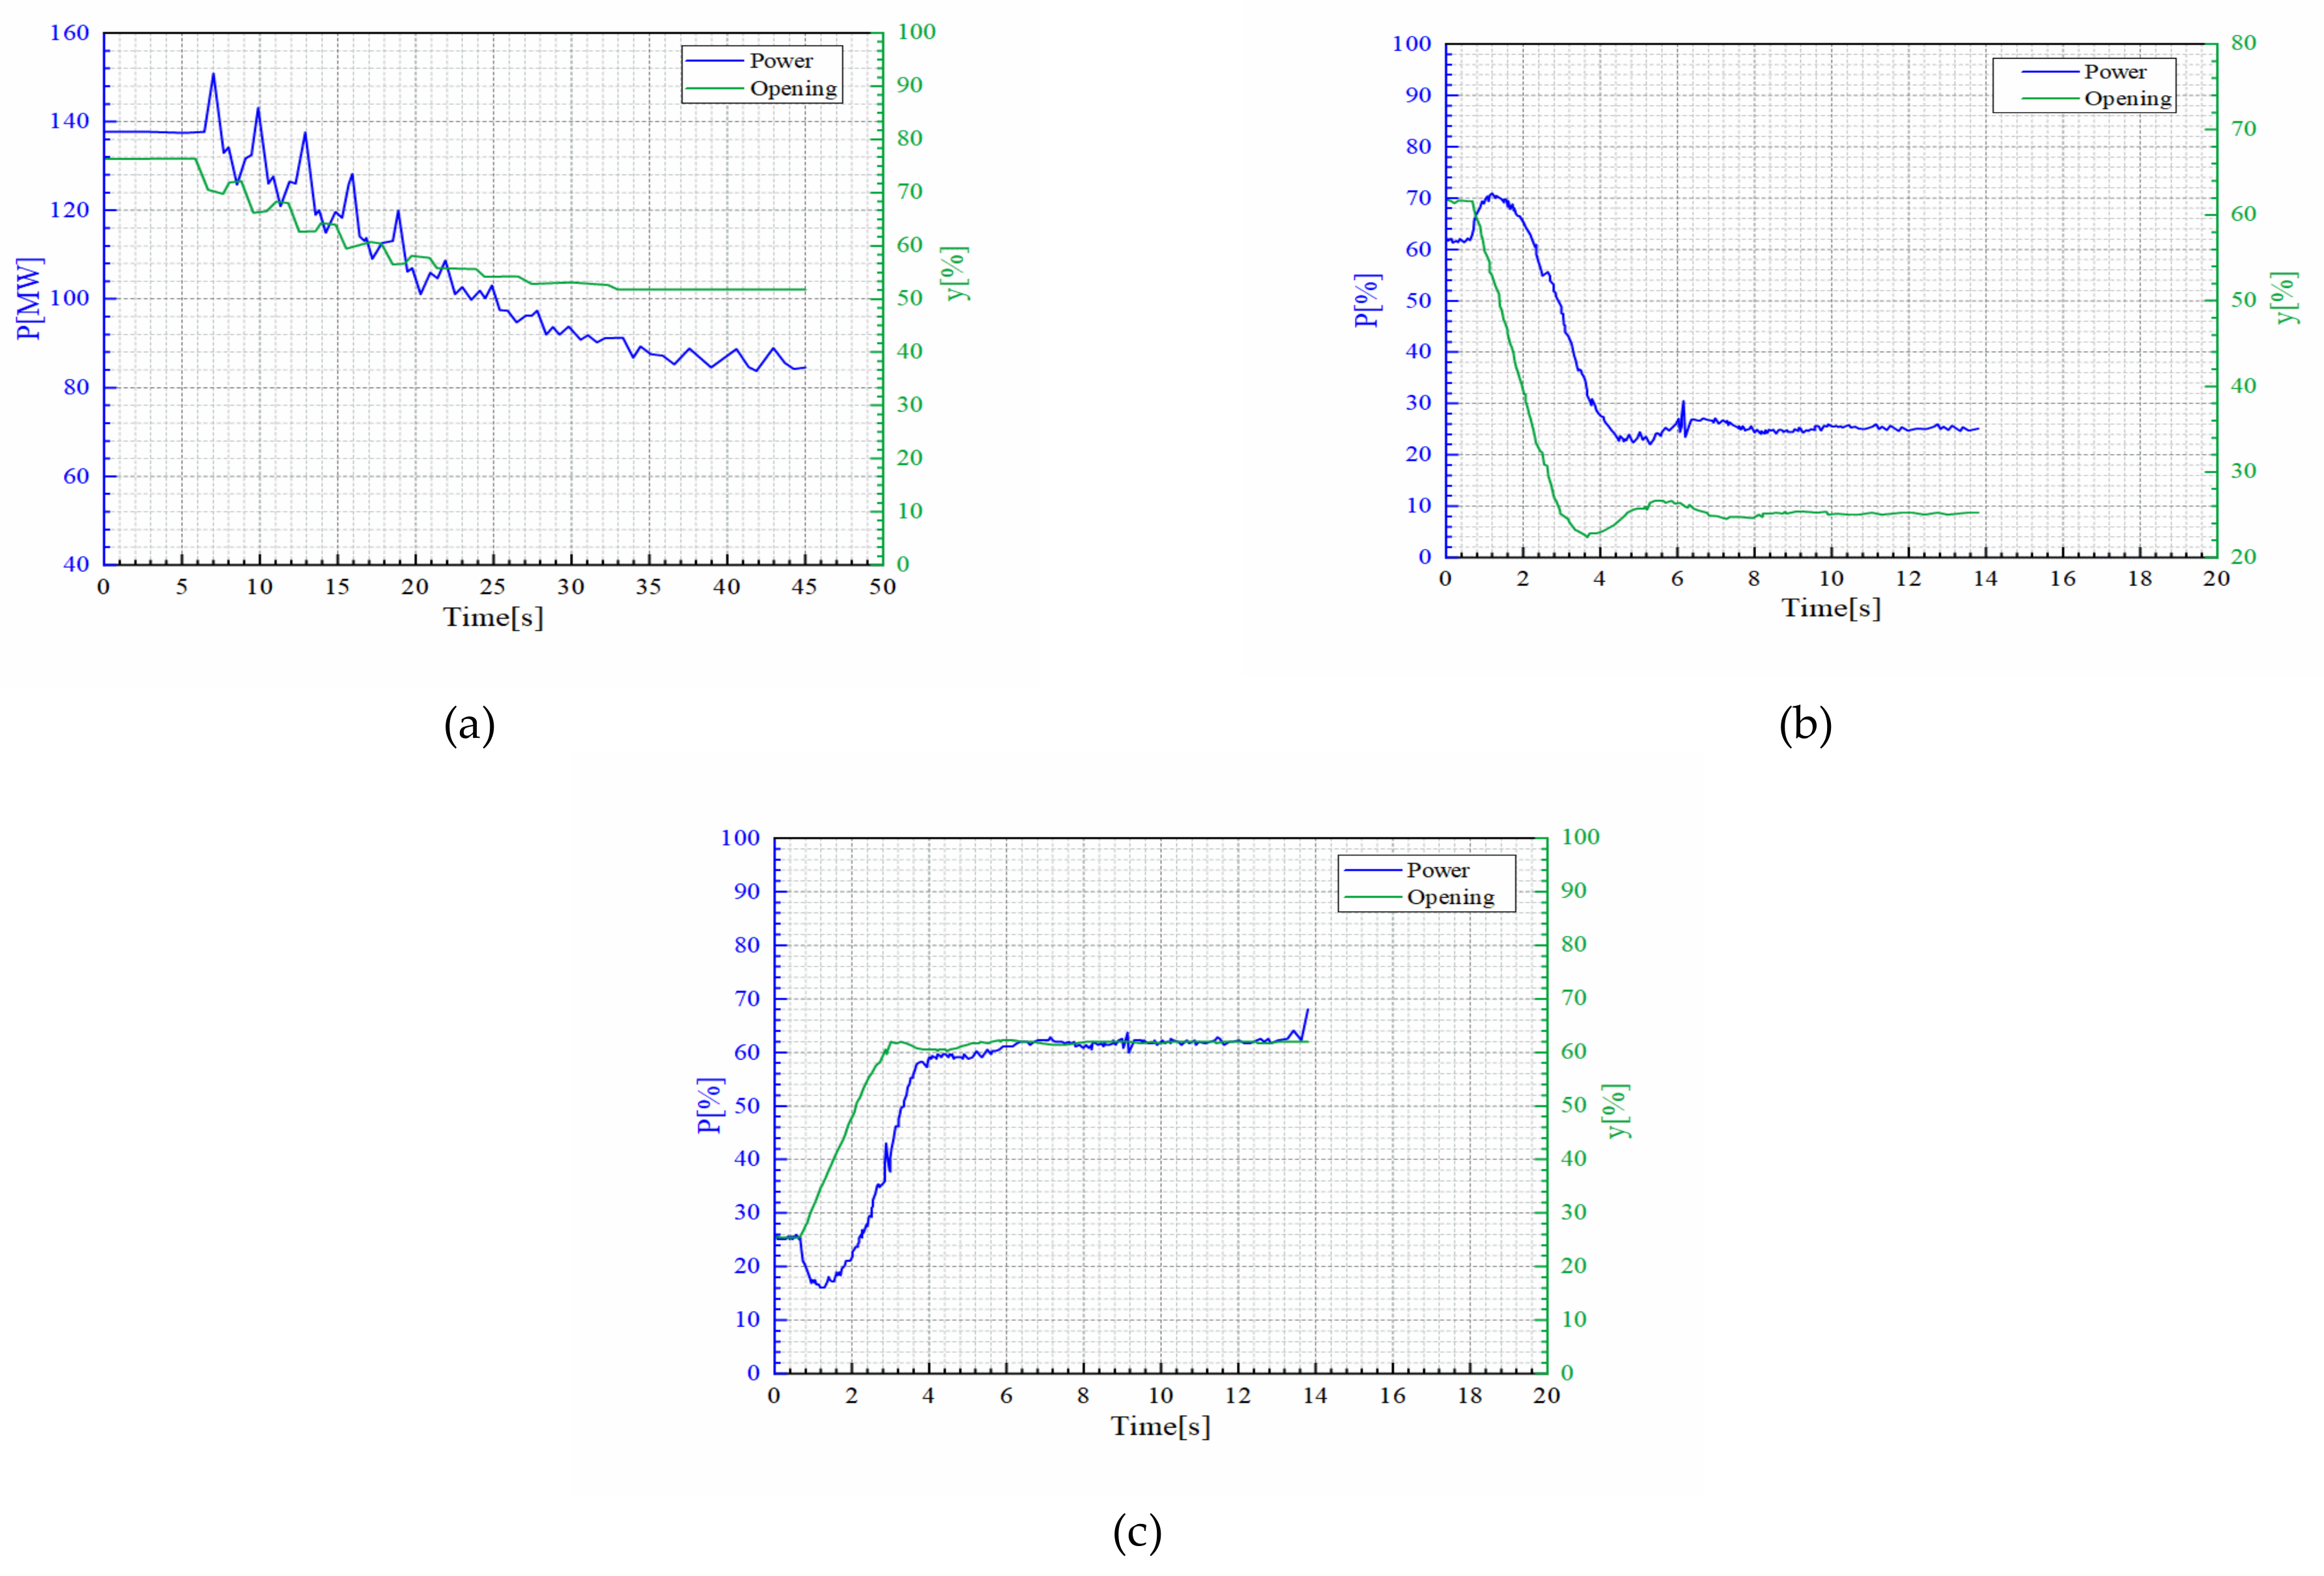
Figure 4.
Instability of hydropower unit power regulation. (a) Power oscillation; (b) Reverse power regulation; (c) Reverse power regulation.
Figure 4.
Instability of hydropower unit power regulation. (a) Power oscillation; (b) Reverse power regulation; (c) Reverse power regulation.

Figure 5.
S-curve acceleration and deceleration control algorithm. (a) The action speed variation curve of the guide vane; (b) The position change of the guide vane curve.
Figure 5.
S-curve acceleration and deceleration control algorithm. (a) The action speed variation curve of the guide vane; (b) The position change of the guide vane curve.

Figure 6.
Hydropower unit power fluctuation curve.

Figure 7.
Dynamic response of power regulation.
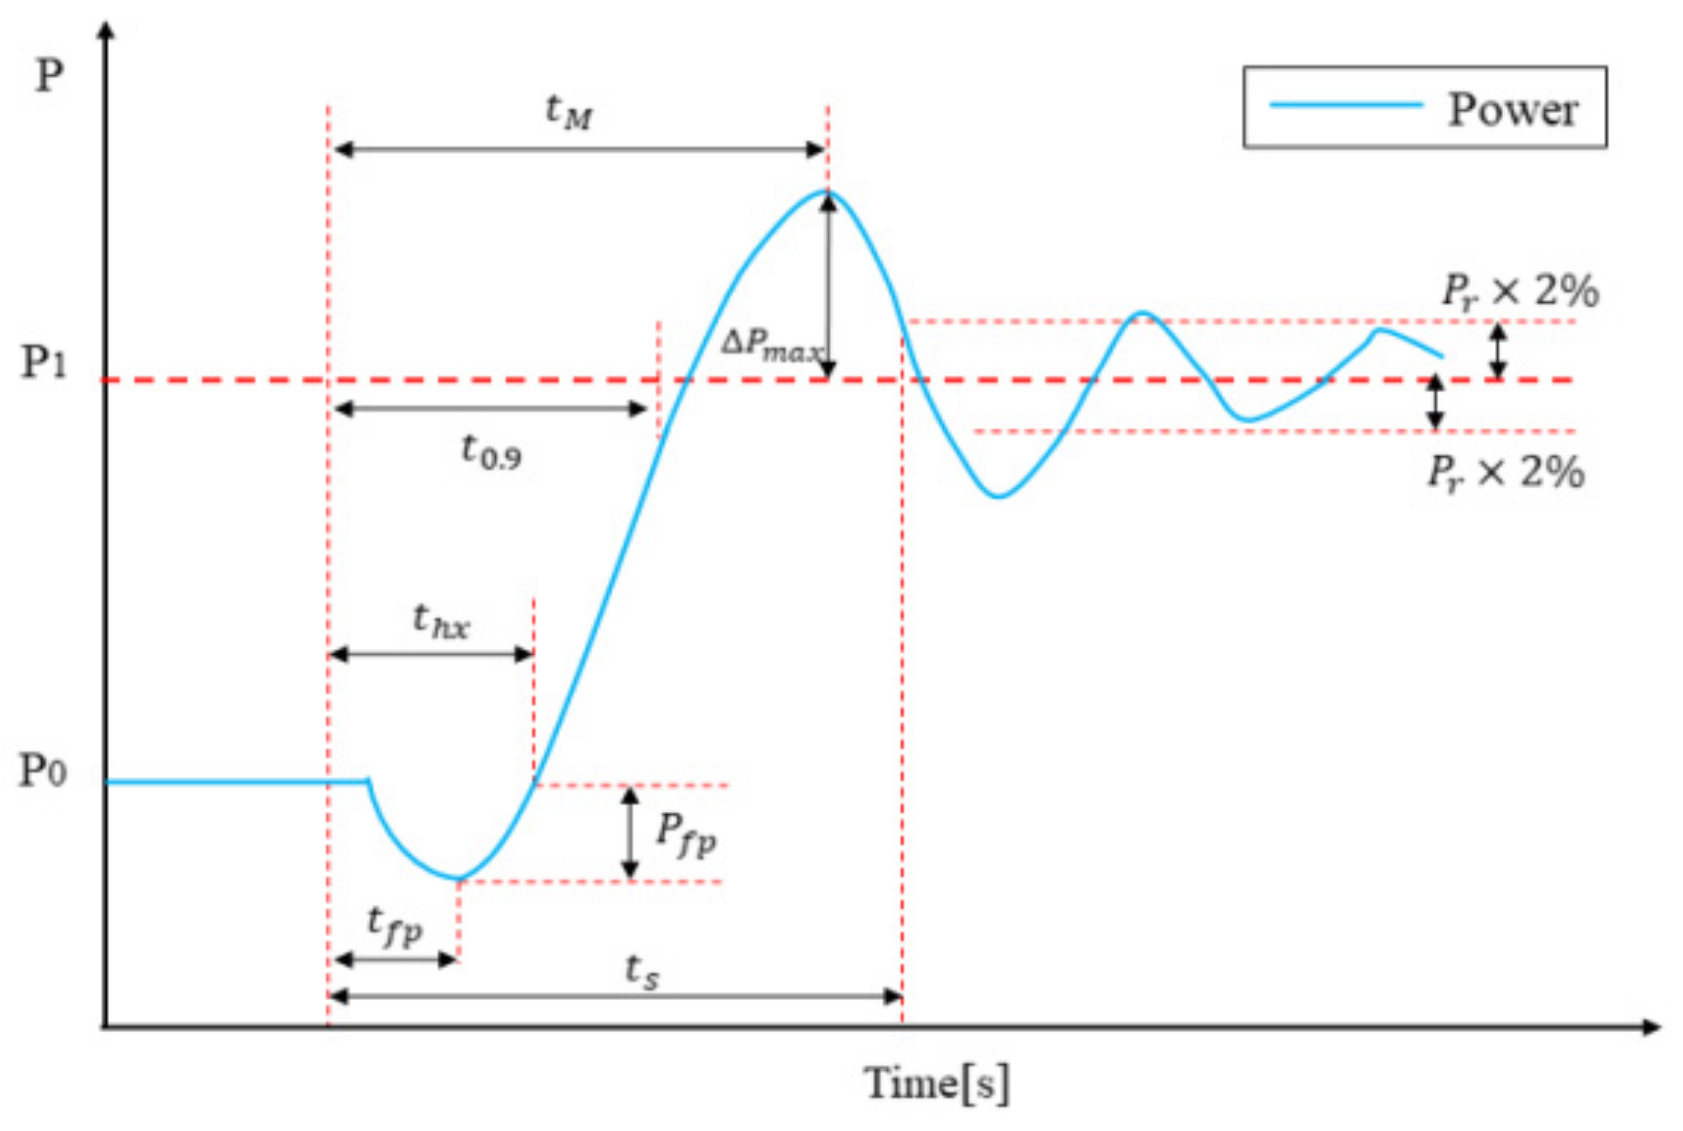
Figure 8.
Power regulation with 5% rated power change. (a) The S-curve control strategy; (b) The conventional linear control strategy.
Figure 8.
Power regulation with 5% rated power change. (a) The S-curve control strategy; (b) The conventional linear control strategy.

Figure 9.
Power regulation with 10% rated power change. (a) The S-curve control strategy; (b) The conventional linear control strategy.
Figure 9.
Power regulation with 10% rated power change. (a) The S-curve control strategy; (b) The conventional linear control strategy.
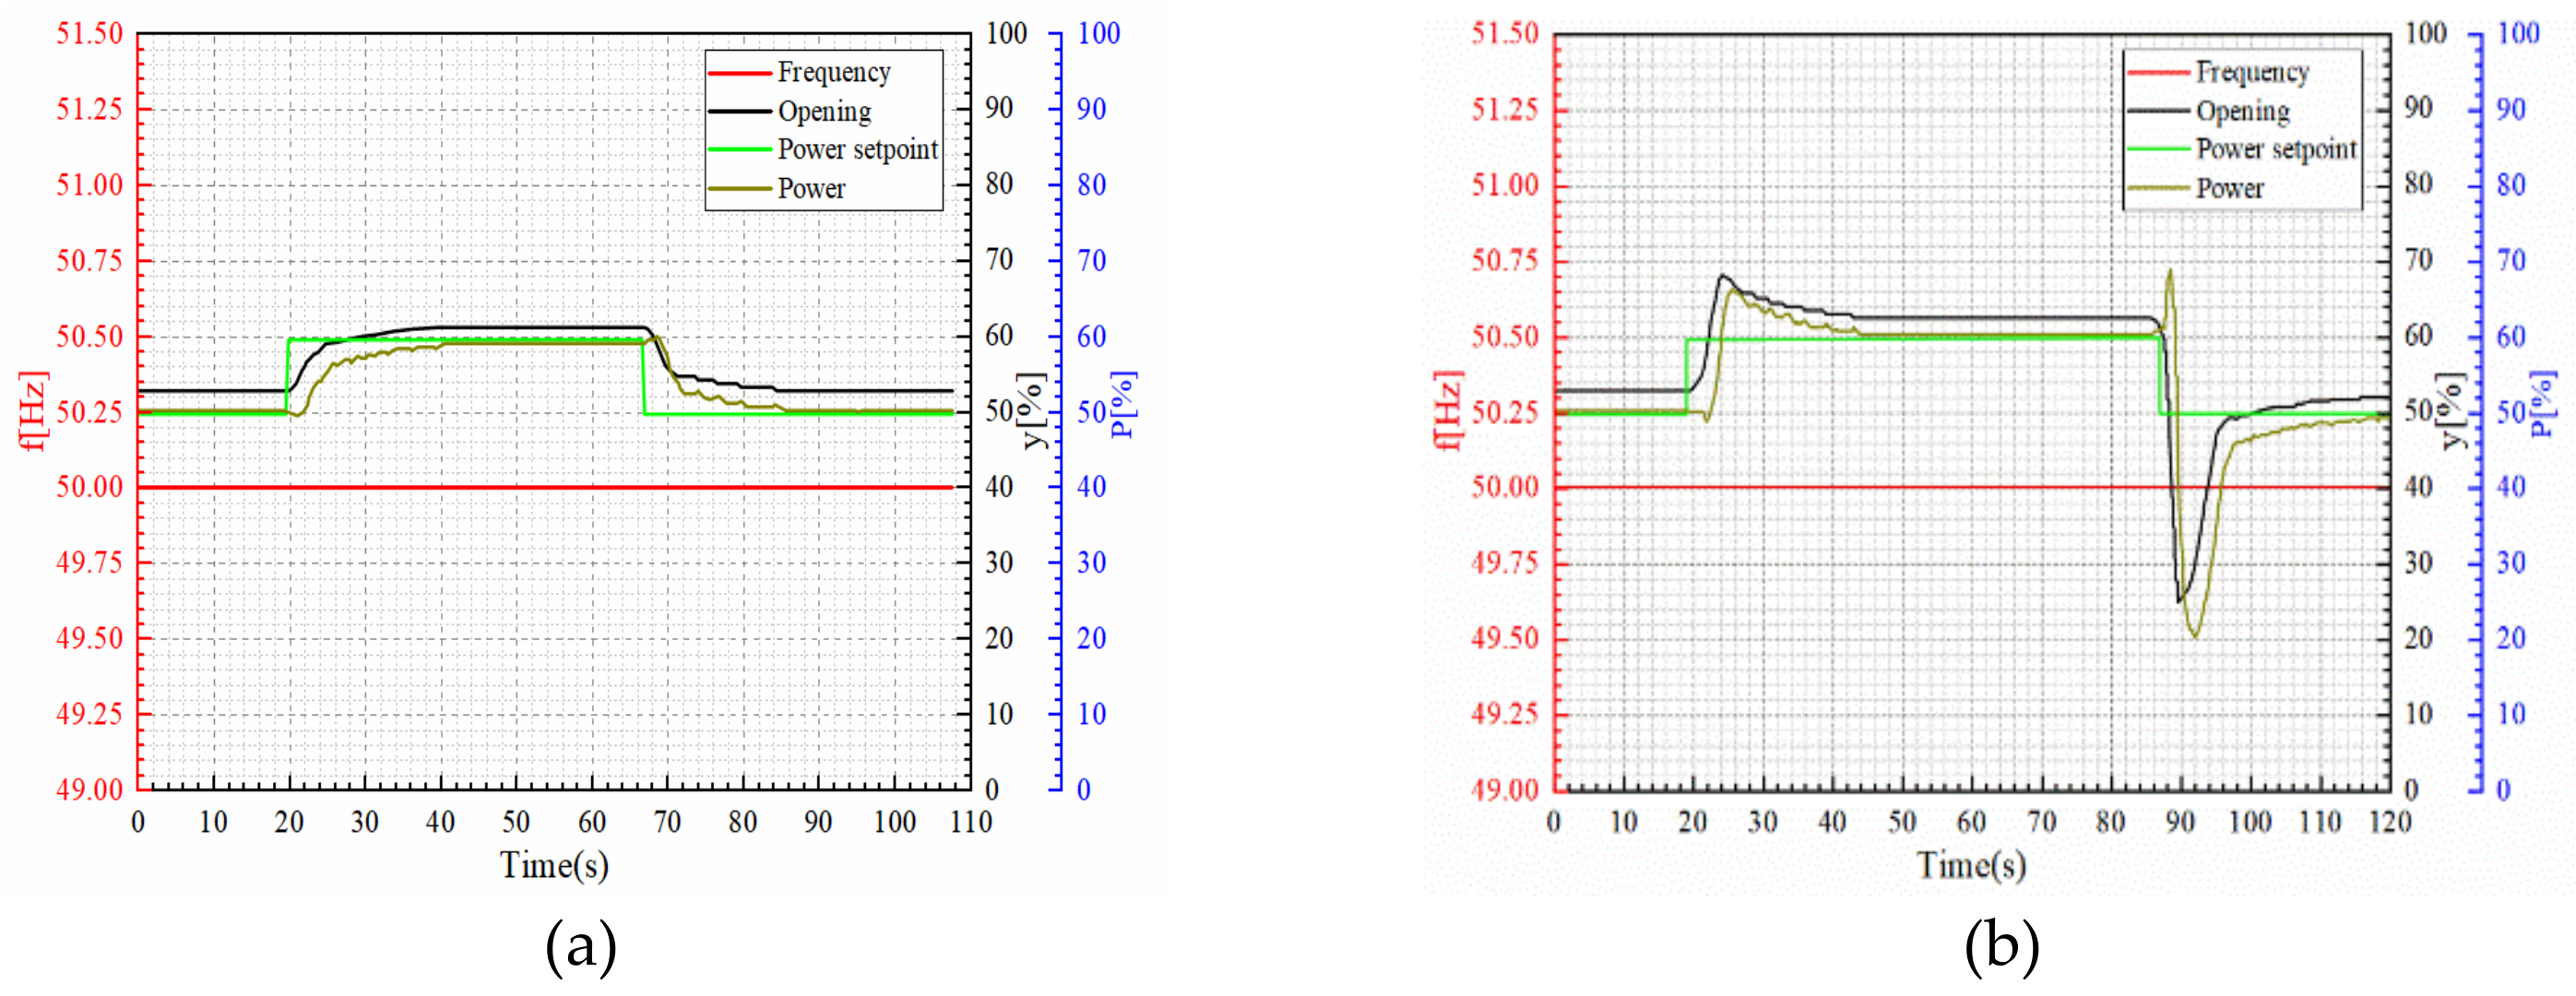
Figure 10.
Power regulation with 20% rated power change. (a) The S-curve control strategy; (b) The conventional linear control strategy.
Figure 10.
Power regulation with 20% rated power change. (a) The S-curve control strategy; (b) The conventional linear control strategy.
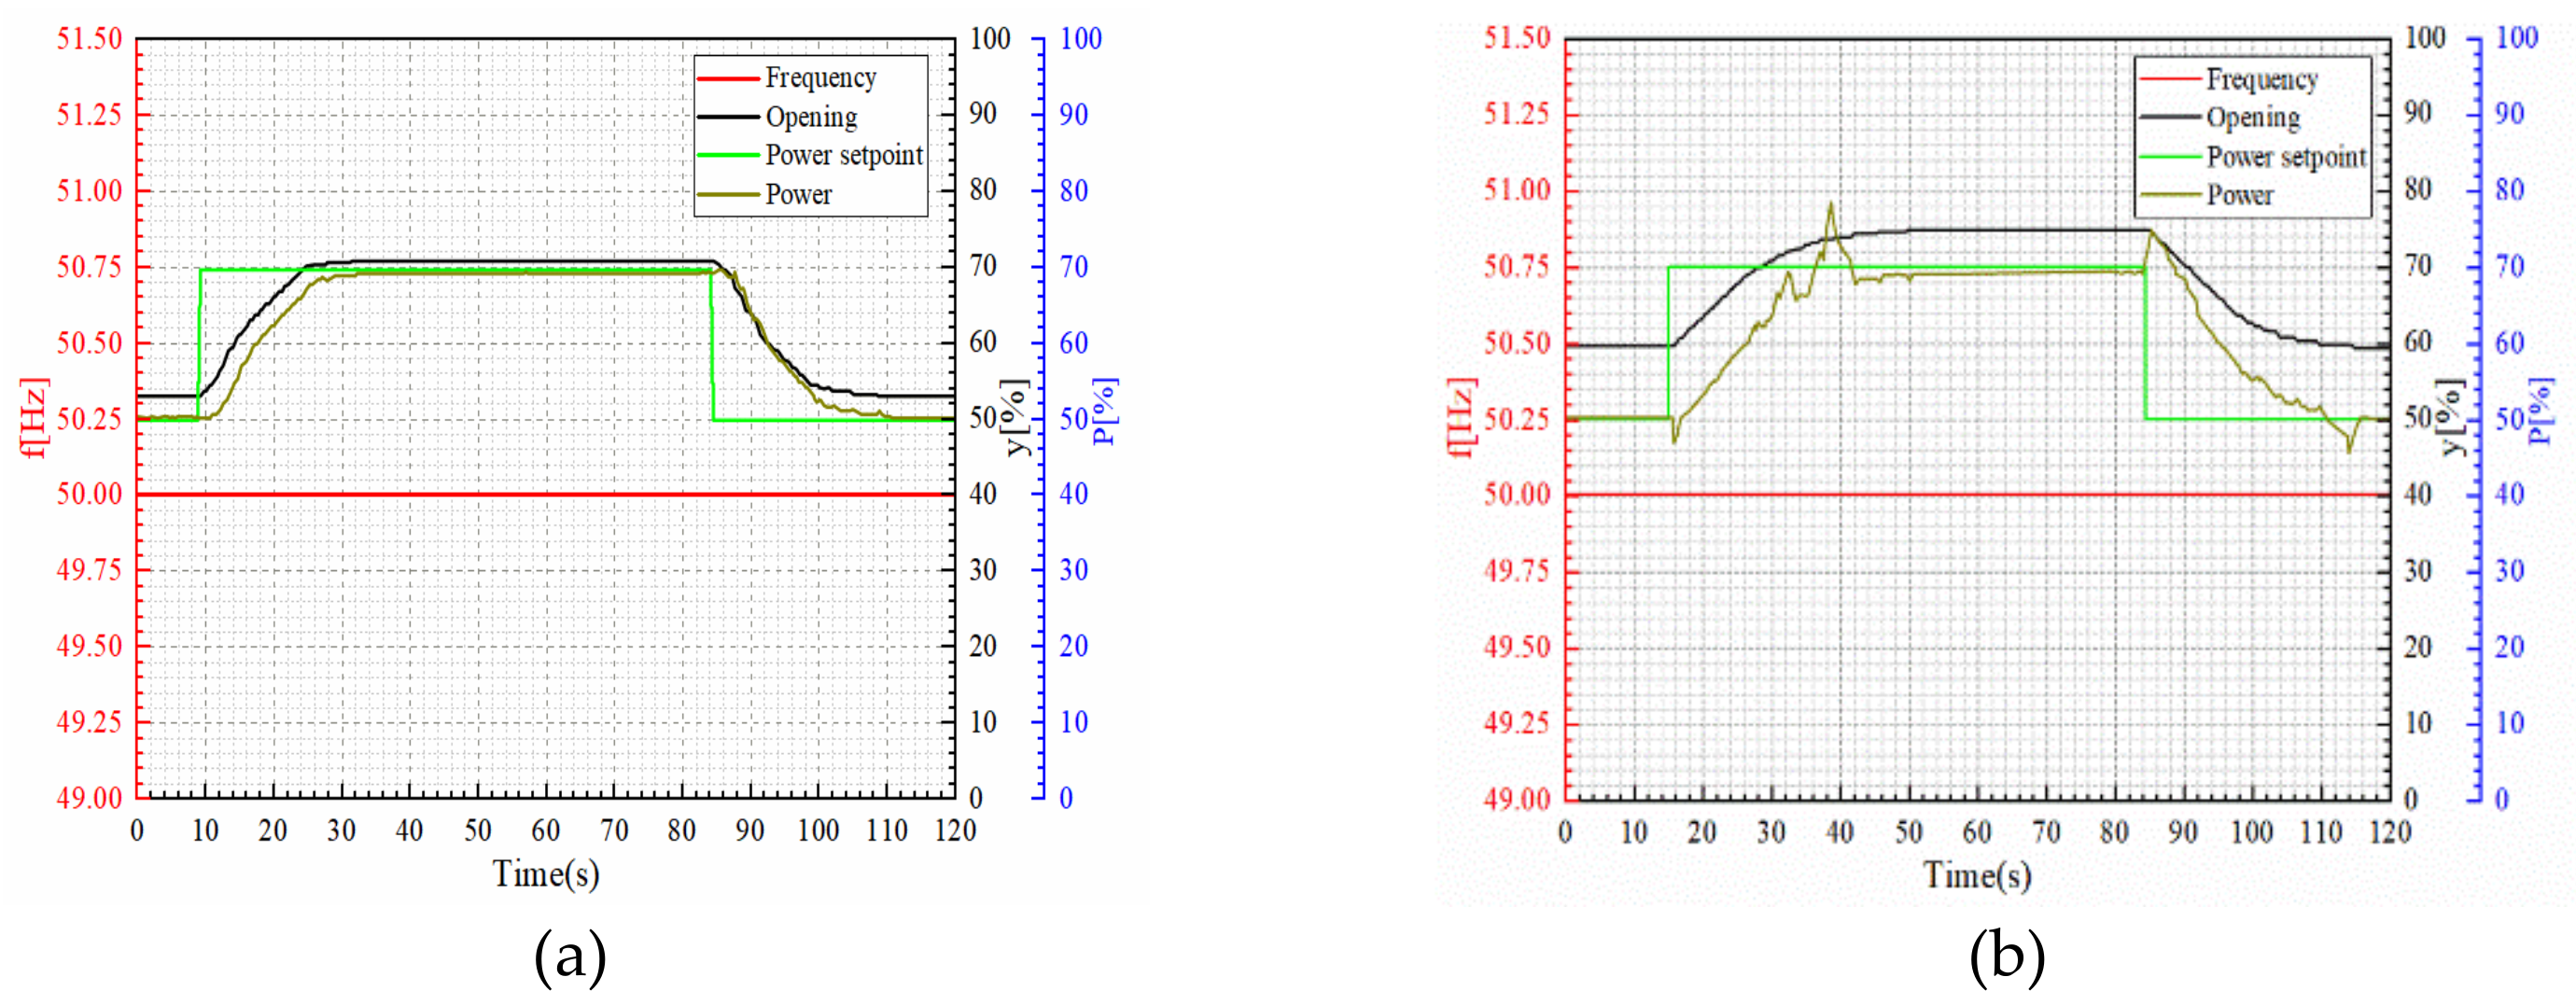
Figure 11.
Power regulation with 40% rated power change. (a) Increase power by the S-curve control strategy; (b) Reduce power by the S-curve control strategy; (c) Increase power by the conventional linear control strategy; (d) Reduce power by the conventional linear control strategy.
Figure 11.
Power regulation with 40% rated power change. (a) Increase power by the S-curve control strategy; (b) Reduce power by the S-curve control strategy; (c) Increase power by the conventional linear control strategy; (d) Reduce power by the conventional linear control strategy.


Table 1.
Main Parameters of Hydropower Unit.
| Main Parameters | |||
|---|---|---|---|
| Turbine model | HL-LJ-630 | Generator model | SF140-64/13500 |
| Rated water head | 44 m | Rated capacity | 140 MVA |
| Rated speed | 93.75 r/min | Rated voltage | 10.5 kV |
| Rated output | 142.90 MW | Moment of inertia GD2 | 60,000 kN m2 |
| Rated flow rate | 352.57 m3/s | Rated power factor | 0.9 |
| Rate deficiency | 93.9% | Unit inertia time | 11.93 s |
Table 2.
Dynamic response index of power regulation.
| S | L | S | L | S | L | S | L | S | L | |
| Increase 5% | 0.5 | 0.8 | 0 | 2.5 | 0.7 | 3.1 | 1.8 | 2.6 | 6.8 | 9.6 |
| Decrease 5% | 0.3 | 0.9 | 0 | 0.8 | 0 | 0.6 | 0 | 1.2 | 8.02 | 9.9 |
| Increase 10% | 0.4 | 2 | 0 | 5.6 | 0.7 | 1.1 | 1.6 | 2.8 | 14.2 | 18.8 |
| Decrease 10% | 0.5 | 1.8 | 0 | 28 | 0.5 | 9.2 | 0.4 | 0.7 | 13.9 | 26 |
Table 3.
Dynamic Response Index of Power Regulation.
| S | L | S | L | S | L | S | L | S | L | |
| Increase 20% | 0.4 | 1.3 | 0 | 8.5 | 0 | 2.9 | 0 | 0.6 | 18.2 | 25.7 |
| Decrease 20% | 0.6 | 1.2 | 0 | 4.4 | 0 | 4.9 | 0 | 1.5 | 22.2 | 28.4 |
| Increase 40% | 0.5 | 1.5 | 0 | 9.3 | 0.2 | 4.6 | 0.6 | 1.7 | 34.7 | 23 |
| Decrease 40% | 0.4 | 1.1 | 0 | 21 | 0.4 | 9.7 | 0.5 | 1.8 | 33.4 | 24 |
Publisher’s Note: MDPI stays neutral with regard to jurisdictional claims in published maps and institutional affiliations. |
© 2021 by the authors. Licensee MDPI, Basel, Switzerland. This article is an open access article distributed under the terms and conditions of the Creative Commons Attribution (CC BY) license (http://creativecommons.org/licenses/by/4.0/).
Share and Cite
MDPI and ACS Style
Wang, C.; Wang, D.-K.; Zhang, J.-M. Experimental Study on the Optimal Strategy for Power Regulation of Governing System of Hydropower Station. Water 2021, 13, 421. https://doi.org/10.3390/w13040421
AMA Style
Wang C, Wang D-K, Zhang J-M. Experimental Study on the Optimal Strategy for Power Regulation of Governing System of Hydropower Station. Water. 2021; 13(4):421. https://doi.org/10.3390/w13040421
Chicago/Turabian StyleWang, Cong, De-Kuan Wang, and Jian-Ming Zhang. 2021. "Experimental Study on the Optimal Strategy for Power Regulation of Governing System of Hydropower Station" Water 13, no. 4: 421. https://doi.org/10.3390/w13040421
Note that from the first issue of 2016, this journal uses article numbers instead of page numbers. See further details here.