Article

Emergy Analysis and Ecological Spillover as Tools to Quantify Ecological Compensation in Xuchang City, Qingyi River Basin, China

1
School of Water Conservancy Engineering, Zhengzhou University, Zhengzhou 450001, China
2
Kaifeng Hydrology and Water Resources Survey Bureau, Kaifeng 475000, China
3
Water Resources Department, China Institute of Water Resources and Hydropower Research, Beijing 100038, China
*
Author to whom correspondence should be addressed.
Water 2021, 13(4), 414; https://doi.org/10.3390/w13040414
Submission received: 5 December 2020 / Revised: 26 January 2021 / Accepted: 1 February 2021 / Published: 4 February 2021
(This article belongs to the Section Water Resources Management, Policy and Governance)

Abstract

:
As an effective means to coordinate cost–benefit allocation of ecological protection between upstream and downstream cities, ecological compensation is often used to improve collaborative basin-wide freshwater resources management. Yet, due to the complex relationships between upstream and downstream ecosystem services, calculating eco-compensation is not an easy task. We used ecological spillover (the amount of local ecosystem services not used in the region and thus flows to downstream areas) and emergy analysis to determine the amount of eco-compensation that the city of Xuchang should pay to the upstream city of Xinzheng (Qingyi River Basin, China) from 2010 to 2014. Eco-compensation was determined by deducting the emergy of the local, self-supplied ecosystem services of Xuchang City, calculated using an ecological-water-footprint-based analysis, from the emergy of the total ecosystem services used in Xuchang, and monetized accordingly. The results showed that the self-supplied ecosystem services decreased from 2010 to 2014 and, thus, Xuchang relied more on the ecological spillover services flowing from Xinzheng. As a result, eco-compensation increased from 990 million Chinese Yuan (¥) in 2010 to ¥509 billion in 2014, mostly due to increased demands for water purification and reduced precipitation around Xuchang. This method can be further enhanced by introducing larger datasets and can be replicated elsewhere to accurately determine ecological compensation, ensuring basin-wide collaboration towards the sustainable management of freshwater resources.

1. Introduction

River basins are typical freshwater sources for aquatic and terrestrial ecosystems, but also major sources of freshwater for humans. The upstream and downstream areas of a river basin are closely related. Freshwater from the upper parts flows downstream, providing upstream, midstream, and downstream ecosystems and societies with numerous services associated with energy, water, food, sanitation, etc. [1]. Thus, conflicts often arise among a basin’s human communities on the protection and sustainable use of these natural resources: (i) upstream areas are responsible for protecting vegetation, ecosystems, and freshwater resources, and this often restricts their development; (ii) downstream areas are provided with upstream high-quality water, and are, thus, developed more rapidly, compared to the upstream ones. To account for this unbalanced development between upstream and downstream communities, downstream communities are required to pay an ecological compensation (eco-compensation; taxes, fees, subsidies) to upstream ones to coordinate losses and benefits among stakeholders, solve contradictions, and maximize benefits for all communities in a basin [2]. In addition, the implementation of the ecological compensation scheme can promote the ecological protection of upstream areas and improve ecosystem services of the river basin. This scheme has been effectively applied in forests, wetlands, river basins, groundwater, and agricultural areas [3,4,5,6,7,8,9,10]. Payment for ecosystem/environmental services on the basin scale, a concept similar to China’s eco-compensation, has become a primary means to ensure protection of freshwater resources and balanced global human development [11].
There has been much controversy among studies on determining eco-compensation methods, processes and standards [12,13]. Quantitative eco-compensation methods include three types: (i) The cost-based method, which refers to compensating for direct input costs or opportunity costs for ecological protection and construction. Payments for basin services (eco-compensation) [14] and hydropower production services [15] were determined based on opportunity costs, the most common cost-based approach. (ii) Willingness-to-pay analysis, a contingent valuation method that determines eco-compensation based on the consumers’ willingness to pay for basin protection measures and initiatives. Willingness-to-pay-based eco-compensation has been determined for downstream river communities of the Colombian Andes [16] and the Mida Creek, Kenya [17]. (iii) The ecosystem service valuation method, accounting for ecosystem-service values provided by ecological protection, to determine compensation standards. Cost–benefit and conditional evaluation analysis has been used to evaluate ecosystem services within the Emscher River Restoration Project, Germany [18]. Water yield by forests in the upper reaches of the Miyun Reservoir, China, was evaluated using the InVEST model, water services were evaluated using economic methods and eco-compensation standards for the downstream areas were determined by analyzing the spatial flow of these ecosystem services [19]. Emergy analysis has been used to evaluate ecosystem services from 2000 to 2015 across the Erhai Lake Basin, China, determining eco-compensation based on the annual variation of ecosystem-service values [20]. These methods are important for determining eco-compensation but have both advantages and disadvantages [21]. The cost-based method has strong operability, but ignores the economic value of ecosystem services. Willingness-to-pay analysis maximizes the benefits of all participants across basins but is much affected by opinion-based subjectivity. The ecosystem-service valuation method is a suitable quantitative method but the value of ecosystem services and its association with eco-compensation has often been an issue of controversy.
The use of ecological spillover (the part of a region’s ecosystem services not used/consumed in the region) as a standard for determining eco-compensation has been suggested by Fu et al. [22]. This method evaluates the ecosystem services not used in the upstream, flowing downstream and used by the downstream communities to determine the amount of eco-compensation. Emergy analysis (the available solar energy used to develop a service or product) was used to evaluate the supply of ecosystem services from the upstream Weihe River Basin (west-central China) [23], and local consumption was calculated using the water footprint method to determine eco-compensation based on the ecological spillover. However, (i) when the ecological spillover is used to determine eco-compensation, the actual eco-compensation should be evaluated not only by evaluating the ecological spillover flowing from the upstream to the downstream areas but also the part of the spillover that is actually consumed by the downstream areas (and not by self-supplied, local ecosystem services); and (ii) although emergy analysis has acknowledged advantages over other methods [24], further research is necessary to develop in-depth, accurate quantitative methods for emergy-based economic valuation systems.
There are serious aquatic ecological problems in Xuchang City, Qingyi River Basin, China, and the establishment of an eco-compensation scheme can promote ecological protection in the upper reaches of the basin. The purpose of this study was to evaluate the eco-compensation that Xuchang City, Qingyi River Basin, China, should pay to upstream basin areas, using the ecological spillover of freshwater ecosystem services as a proxy. The emergy of the local, downstream self-supplied ecosystem services was calculated and subtracted from the total emergy of ecosystem services of the downstream area, and eco-compensation was calculated by converting the ecological spillover used in the downstream into monetary terms. Our method could be replicated elsewhere to adjust current eco-compensation standards based on a more accurate rationale, accounting not only for the upstream-to-downstream ecological spillover but also for the part of the spillover that is actually used by the downstream areas, thus leading to more equitable/balanced eco-compensations.

2. Materials and Methods

2.1. Study Area and Available Data

2.1.1. Study Area

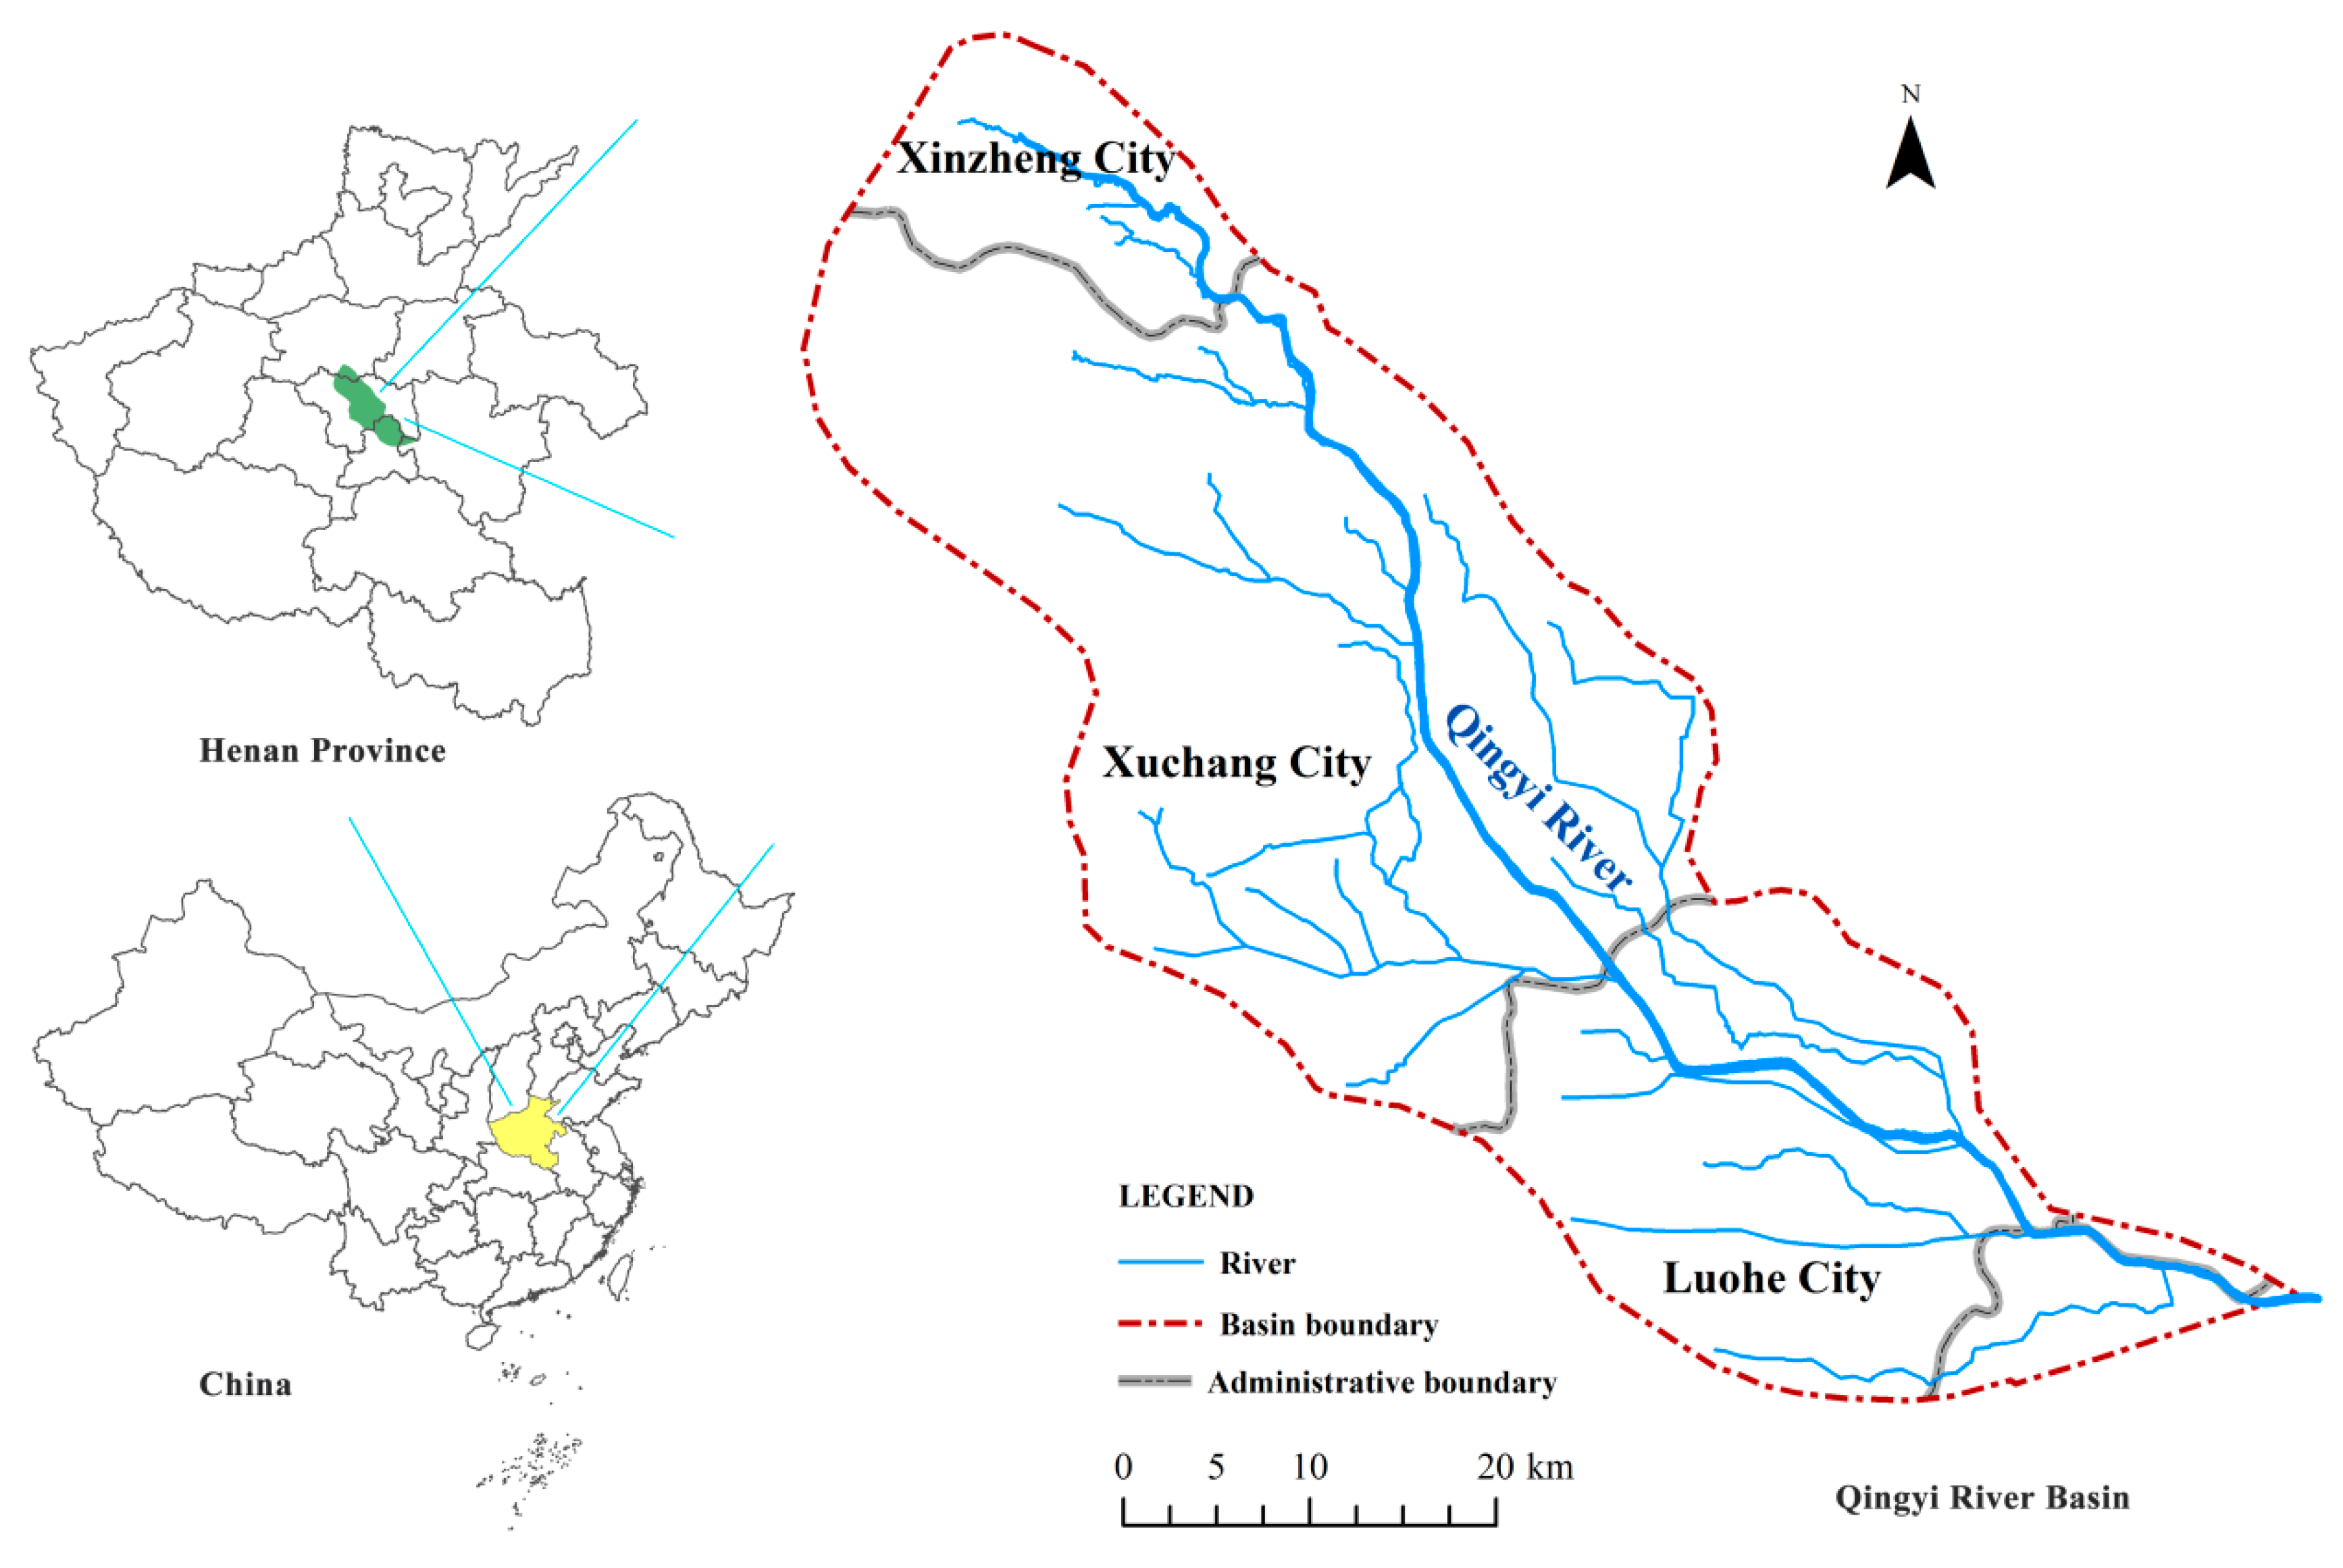
The Qingyi River Basin is located in Henan Province, China. The Qingyi River originates from southwestern Xinzheng City (part of the Zhengzhou City), flows through Xuchang and Luohe and empties into the Yinghe River. The total length of the river is 149 km, and the basin area is 2362 km2, while the length of the river in Xuchang is 79 km with an area of 1585 km2, accounting for 67.1% of the total basin area. Qingyi River is one of the three major rivers in Xuchang City, running through the urban area of Xuchang from north to south. It has important functions including flood control, drought resistance, irrigation, production and life, landscape, and ecological water use, which has made tremendous contributions to the economic and social development, and ecological-civilization construction of Xuchang. In recent years, the balance between supply and demand of water resources has been impacted by climate change and human activities. In addition, increasing amounts of wastewaters from human activities have greatly deteriorated the basin’s water quality. In 2014, for example, the water quality of most sections in the Qingyi River of Xuchang was assessed as severely polluted, and some sections as polluted. The double burden of water quantity and quality has led to the severe degradation of freshwater ecosystem services in the Qingyi River Basin, which has higher requirements for the whole basin’s ecological protection. Xinzheng, the upstream water-source area, undertakes the primary responsibility of ecological basin protection, but as the main body of the Qingyi River Basin, Xuchang enjoys a more abundant water-resource supply, which plays a vital role in local economic development. As a result, there is no upstream initiative in water ecosystem protection, aggravating the deterioration of the ecosystem in the river basin. The implementation of the eco-compensation scheme is of great significance to coordinate upstream and downstream interests, and recover the ecosystem services of the whole basin.

2.1.2. Data Sources

Our study spanned the 2010–2014 period. Social and economic data (Engel coefficient, investment in water resources etc.) were obtained from the Statistical Yearbook of Henan Province [25,26,27,28,29] and the Statistical Yearbook of Xuchang City [30]. Water-resource data (precipitation, runoff, water supply and demand etc.) were obtained from the Water Resources Bulletin of Xuchang City [31,32,33,34,35], while solar transformities were available from the results of Odum [36], and Lan et al. [37]. Crop prices were available from the compilation of cost and income data of agricultural products in China [38,39,40,41,42].

2.2. Ecological Spillover as Eco-Compensation Proxy

The protection of freshwater resources in upstream areas ensures enhanced ecosystem services, and facilitates increased rates of anthropogenic development in downstream areas. Ecological spillover flows from upstream to downstream areas; thus, downstream areas should compensate upstream ones based on the economic value of the ecological spillover used by the downstream areas. For a downstream area, freshwater-ecosystem services include the local, self-supplied services and upstream ecological spillover. To calculate the ecological spillover used by the downstream areas, we evaluated the local, self-supplied economic, social, and ecological ecosystem services in the Qingyi River Basin downstream of Xuchang and subtracted them from the total values of economic, social and ecological ecosystem services used in Xuchang. Emergy analysis was used to quantify economic, social, and ecological values of upstream ecosystem services; ecological water-footprint analysis was used to evaluate the local, self-supplied downstream ecosystem services. Ecological spillover was finally converted into monetary terms and used as a proxy for eco-compensation (Figure 1).

2.3. Economic, Social, and Ecological Values of Ecosystem Services

Emergy analysis quantifies relationships between natural resources and human economic activities. Emergy is described as the availability of energy of one kind that is directly and indirectly used up in transformations for a product or service [36,43]. Generally, the emergy of all substances and energies, such as natural resources, commodities, information, and services is expressed as the amount of solar energy required to produce them [44]. Solar transformity is the solar emergy required to create one joule of a service or product, which is calculated by solar emergy divided by its available energy [45]. By integrating different components of the eco-economic system using solar transformity, emergy analysis can realize the comprehensive comparison of natural resources and human commodities with emergy as the unit, and the equation is as follows:
E M = τ × B
where EM is emergy (sej); τ is solar transformity (sej/J or sej/g); and B is energy or substance (J or g).
Emergy theory avoids the defect that economic methods equate the value of natural resources with its market value [46]. However, emergy theory is not used to replace monetary evaluation, but to make up for and improve traditional economic methods. According to the method of emergy analysis, the conversion between solar emergy and monetary terms can be realized through emergy/money ratio (EDR), so as to solve the difficulty of unified measurement of natural-resource, economic, and social benefits. Emergy/money ratio refers to the emergy equivalent to the monetary unit of a region, expressed as the ratio of the region’s total emergy to its gross national product GNP [37,43]. The equation used in this study was the following:
E M ¥ = E M ÷ E D R
where EM¥ is emergy-money [47] (in EM yuan; ¥, the symbol of the Chinese yuan); and EDR is the emergy/money ratio (sej/¥).
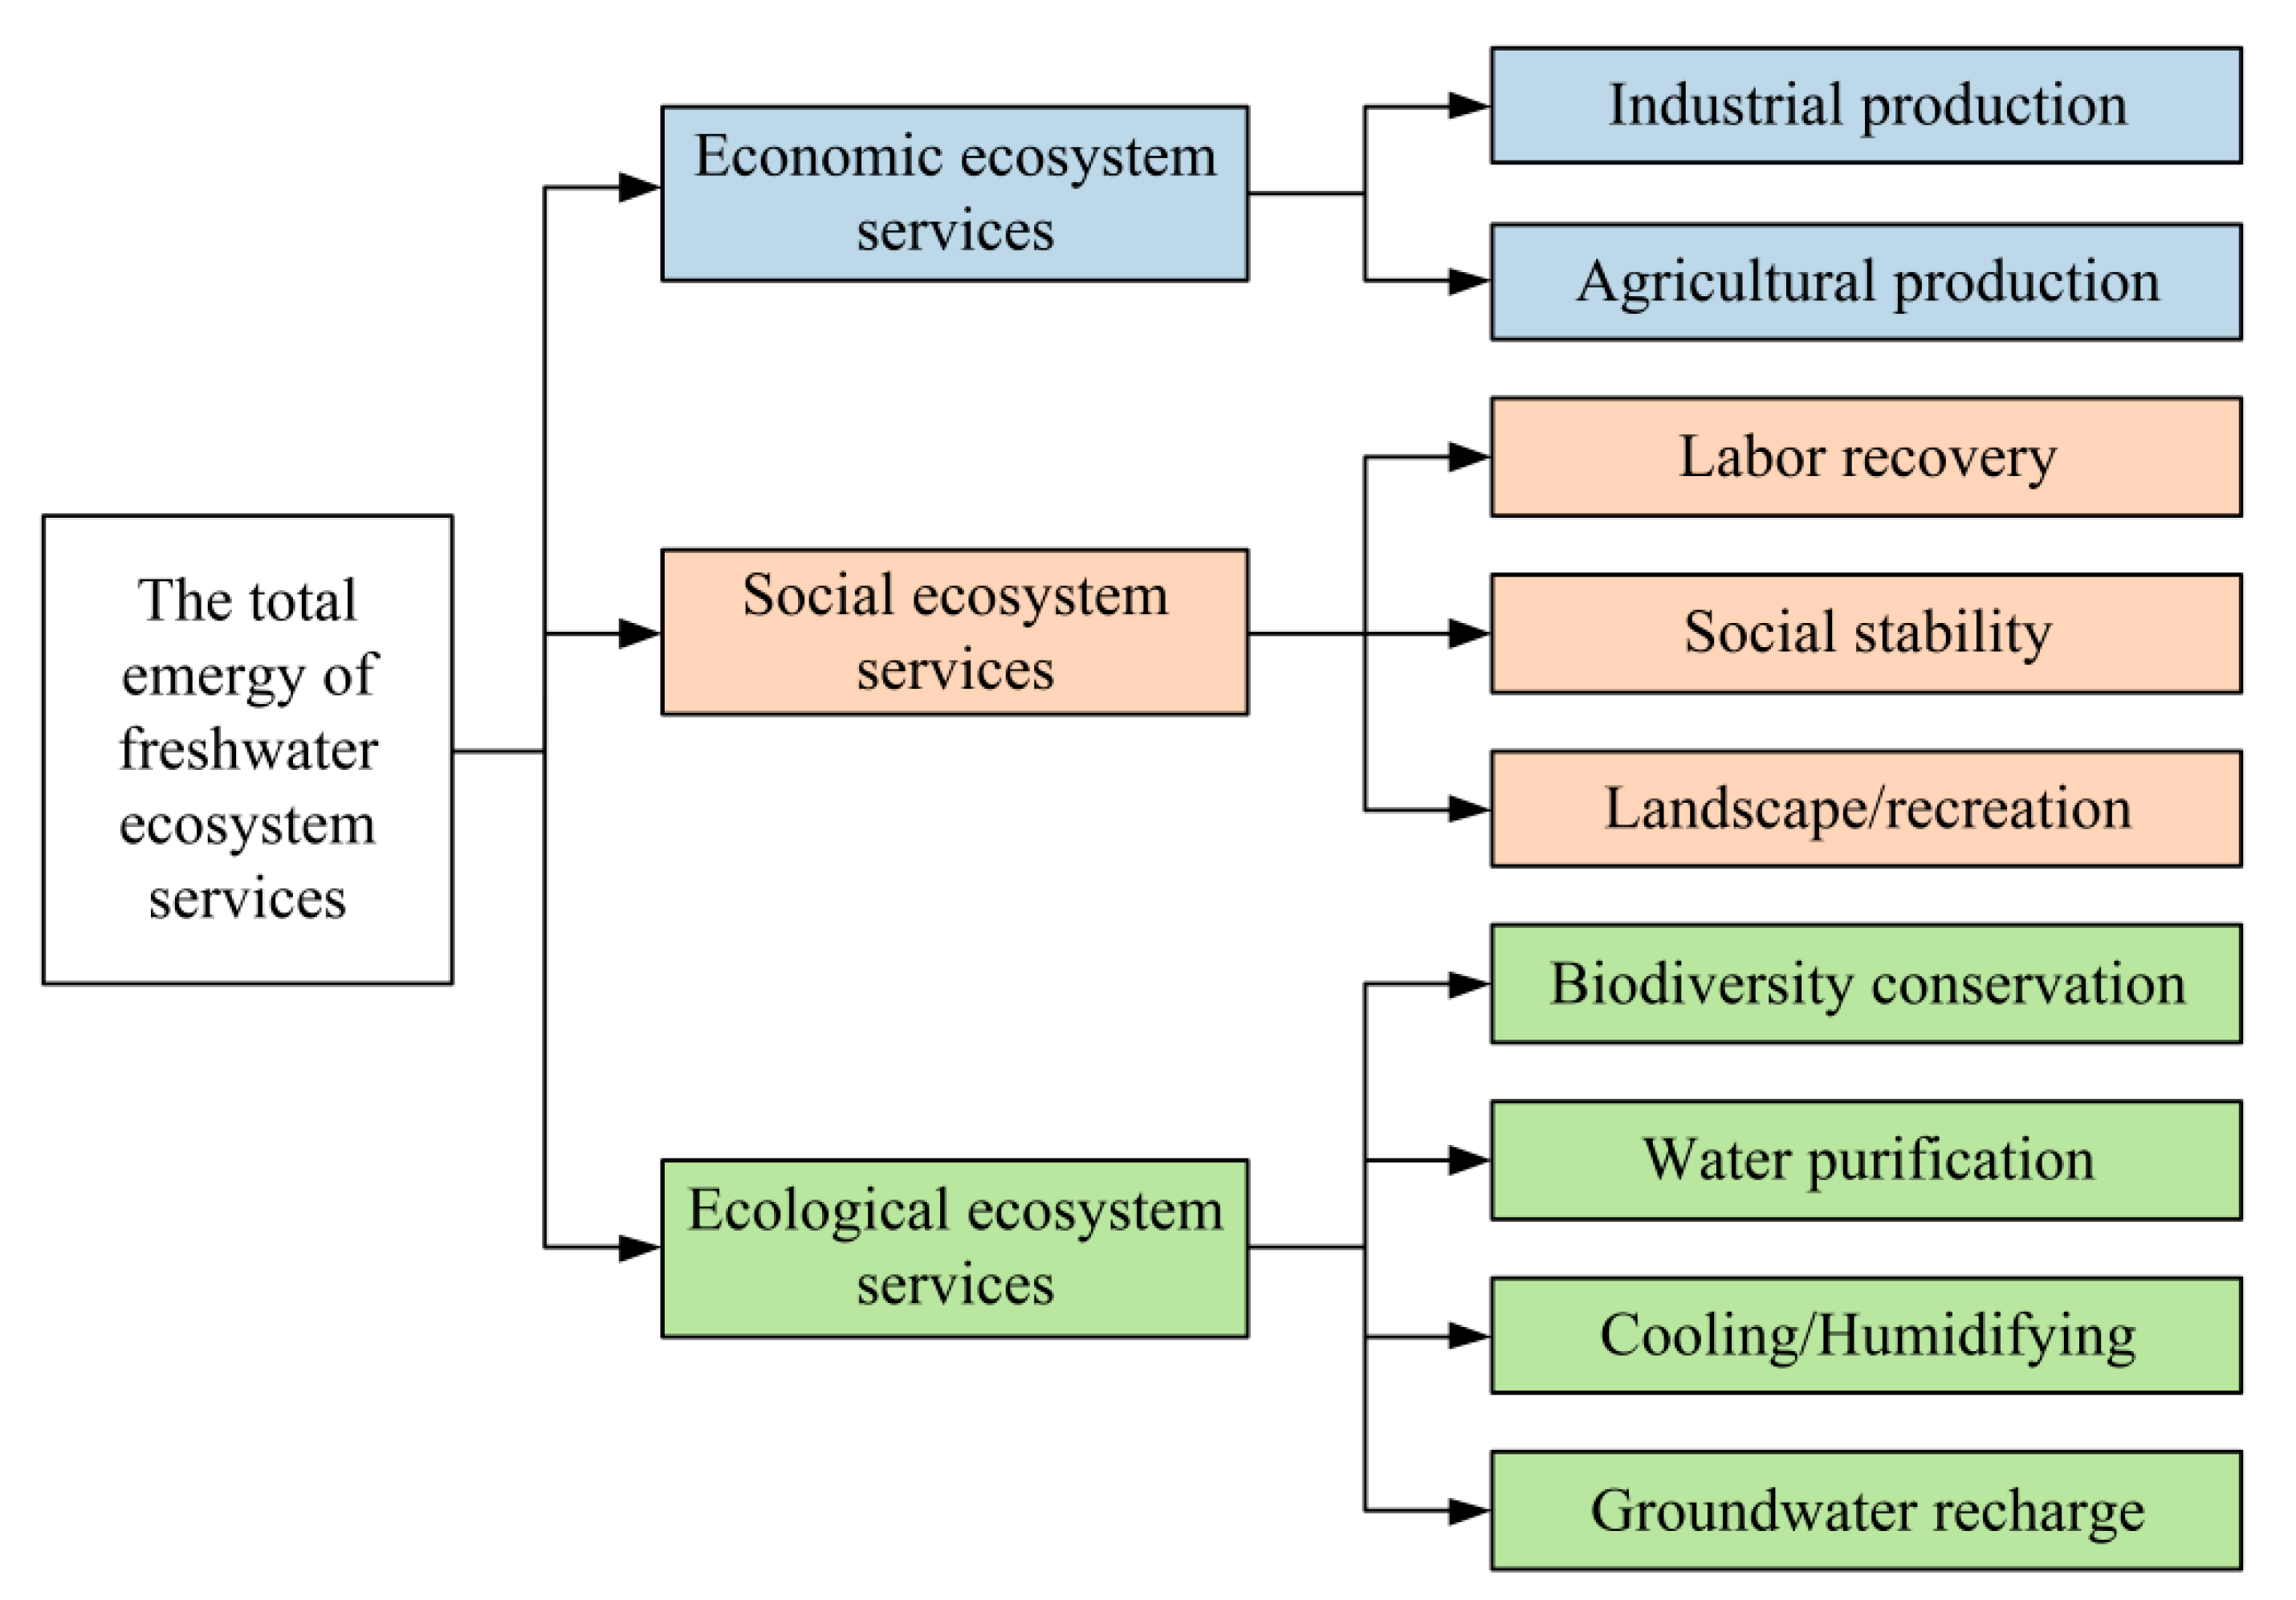
Ecosystem services involve economic, social, and ecological values with different dimensions. On the basis of emergy analysis, the eco-economic value of freshwater ecosystem services of the basin river can be unified and scientifically quantified. By analyzing upstream economic, social, and ecological services of water resources flowing to the lower reaches of the Qingyi River, we determined nine freshwater ecosystem services in the Qingyi River Basin downstream of Xuchang (Figure 2), and summed them up as total ecosystem services:
E M T E = E M E + E M S + E M E E
where EMTE is the total emergy of freshwater ecosystem services (sej); EME is the emergy of economic ecosystem services (sej); EMS is the emergy of social ecosystem services (sej); and EMEE is the emergy of ecological ecosystem services (sej).

2.3.1. Emergy-Based Evaluation of the Downstream Economic Ecosystem Services (EME)

We defined two endpoints to evaluate ecosystem services that benefit the local economy: industrial production and agricultural production (Figure 2).
In industrial production, water is used to cool mechanical equipment, as a medium in the reaction of chemicals, and to dissolve minerals and trace elements. The following equations were used [48]:
E M I P = W C R I × E M I Y = E M I W E M I U × E M I Y
E M I W = W I × τ I
where EMIP is the emergy of industrial production (sej); WCRI is the contribution rate of water resources in industrial production (%); EMIY is the total emergy output in the industrial system (sej); EMIW is the emergy of water input in industrial production (sej); EMIU is the total emergy input in the industrial system (sej); WI is the amount of industrial water (m3); τI is the solar transformity of industrial water (sej/m3); and water solar transformity is calculated based on the method proposed by Lv and Wu [49]. The above values refer to annual totals.
In agricultural production, water is used for irrigation, and for the production of agricultural and sideline products. We used the following equations:
E M A P = W C R A × E M A Y = E M A W E M A U × E M A Y
E M A W = W A × τ A
where EMAP is the emergy of agricultural production (sej); WCRA is the contribution rate of water resources in agricultural production (%); EMAY is the total emergy output in the agricultural system (sej); EMAW is the emergy of water input in agricultural production (sej); EMAU is the total emergy input in the agricultural system (sej); WA is the amount of agricultural water (m3); and τA is the solar transformity of agricultural water (sej/m3).

2.3.2. Emergy-Based Evaluation of Downstream Social Ecosystem Services (EMS)

We defined three endpoints to evaluate social ecosystem services that benefit the local society: labor-recovery, social-stability, and landscape/recreation values (Figure 2).
Labor recovery is the potential of a system to maintain survival and health. Fresh water is used as domestic water, thus improving the labor recovery. We used the following equations:
E M L R = W C R I × E M I Y = E M L W E M L U × E M L Y × E
E M L W = W L × τ L
where EMLR represents the emergy of the labor-recovery service (sej); WCRL represents the contribution rate of water resources in the life of humans (%); EMLY represents the emergy of per capita disposable income (sej); EMLW represents the emergy of per capita domestic water (sej); EMLU represents the total emergy input in the living system (sej); E represents the Engel coefficient; WL represents the amount of domestic water (m3); and τL represents the solar transformity of domestic water (sej/m3).
Social stability is related to the normal operation of a society; a certain quantity and quality of water resources can guarantee national water security and food security, and maintain social stability. The following equation was used [50]:
E M S S = ( R 1 + R 2 ) × E D R
where EMSS represents the emergy of the social-stability service (sej); R1 represents the cost of water conservation and protection (¥); and R2 represents the investment in water-conservancy projects (¥).
Landscape/recreation service refers to the visual and spiritual enjoyment brought by water resources. Abundant water resources can enhance the aesthetic value of natural landscapes such as rivers and lakes, and increase the interest of recreational aquatic activities. We used the following equation:
E M L E = V × A × E D R
where EMLE denotes the emergy of the landscape/recreation service (sej); V denotes the equivalent landscape and recreation value per unit water area (¥/hm2), calculated by value equivalent factor referring to the method of Xie et al. [51]; and A denotes the water area (hm2).

2.3.3. Emergy-Based Evaluation of Downstream Ecological Ecosystem Services (EMEE)

We defined four endpoints to evaluate ecological ecosystem services that benefit the local ecosystem: biodiversity-conservation, water-purification, cooling/humidifying, and groundwater-recharge values (Figure 2).
Biodiversity conservation means that water resources provide a living environment and life elements for aquatic organisms, so that the genetic information of species can be preserved and transmitted [52]. We used the following equation:
E M B P = B × R × τ B
where EMBP is the emergy of the biodiversity-conservation service (sej); B is the total number of aquatic species (species), obtained from the research results of Chai [53]; R is the proportion of biological activity area to global area (%); and τB is the solar transformity of biological species, taking 1.26 × 1025 (sej/species) from the research of Lan et al. [37].
A freshwater ecosystem has a certain self-purification function. The concentration of water pollutants can be reduced by dilution, diffusion, sedimentation, oxidation–reduction, and microbial decomposition to realize the natural purification of water. The following equation was used:
E M S P = i = 1 n M i × μ i × τ i
where EMSP represents the emergy of the water-purification service, and i = 1, 2, ··, n represents the categories of major pollutants. According to the Water Resources Bulletin of Xuchang City [31,32,33,34,35], the major pollutants in the Qingyi River Basin are COD and ammonia nitrogen (NH3–N). Mi represents the pollutant discharge (t/a); μi represents the pollutant degradation coefficient (/day), referring to the simulation results of μ1 = 0.15/day and μ2 = 0.18/day, which were obtained by Chen using the EFDC (Environmental Fluid Dynamics Computer Code) model [54]; τi represents the pollutant solar transformity (sej/t), with the transformity of COD being τ1 = 6.89 × 10¹⁰ sej/g from the research of Zhao et al. [55], and the transformity of NH3–N being τ2 = 7.00 × 10⁹ sej/g from the research of Carey et al. [56].
Cooling/humidifying services refer to water bodies participating in atmospheric circulation through evaporation, increasing air humidity, and regulating the air temperature by absorbing heat. The following equations were used:
E M C H = L × G × τ V
L = 2507.4 2.39 t
where EMCH denotes the emergy of the cooling and humidifying service (sej); L denotes the latent heat of evaporation (J/g); G denotes evaporation (g), which was calculated on the basis of the average evaporation depth of the study area, and data were obtained from Qingyi River project team [57]; τV denotes the solar transformity of vapor (sej/J), from the research of Lan (2002); and t denotes the annual mean temperature (°C).
Groundwater recharge means that, when the level of surface water is higher than that of groundwater, the water bodies of rivers and lakes recharge the groundwater through osmosis. We used the following equation:
E M W R = P × θ × k × τ W
where EMWR is the emergy of the groundwater-recharge service (sej); P is the precipitation of the study area (m3); θ is the runoff coefficient; k is the recharge coefficient of the basin ecosystem, with the runoff and recharge coefficients being θ = 0.101 and k = 0.024, respectively, according to Qingyi River project team [57]; and τW is the solar transformity of groundwater (sej/m3).

2.4. Emergy Analysis of the Local, Self-Supplied Ecosystem Services

On the basis of the total emergy of freshwater ecosystem services in the Qingyi River Basin of Xuchang, the ecological water-footprint method was used to construct the self-supply capacity coefficient to determine the local, self-supplied ecosystem services. The ecological water footprint is defined as the ratio of ecological water-footprint demand and supply, which is used to quantitatively evaluate the utilization of freshwater ecosystems by humans. The equation is as follows:
E M S E = f × E M T E = E S w E F w × E M T E
where EMSE represents the emergy of the self-supplied value of ecosystem services (sej); f represents the coefficient of self-supply capacity; ESw represents ecological water-footprint supply (hm2); and EFw represents ecological water-footprint demand (hm2).

2.4.1. Ecological Water-Footprint Demand (EFw)

According to ecological water-footprint demand, the amount of water resources that are used to maintain the production, living, and ecological needs of a population is converted into the productive land area of water resources, which is used to reflect the utilization of eco-economic functions of a water ecosystem:
E F w = N × e f w = r w × ( W / P w )
where N is the number of people in the study area (people); efw is the per capita ecological water footprint (hm2/people); rw is the global equivalence factor of water resources using 5.19 on the basis of the research of the World Wide Fund for Nature (WWF) in 2000; W is water consumption (m3); and Pw is the global average production capacity of water resources (m3/hm2), using 3140 m3/hm2 from the research of Su et al. [58].

2.4.2. Ecological Water-Footprint Supply (ESw)

Ecological water-footprint supply, namely, the carrying capacity of water resources, reflects the ability of local freshwater resources to support the sustainable development of resources, the environment, and society in the study area. It was estimated that at least 60% of the carrying capacity of freshwater resources of a country or region should be used to maintain an ecosystem, so the ecological-protection coefficient of 0.4 is introduced [59]:
E S w = N × e s w = 0.4 × r j × y j × ( Q / P w )
where esw is the per capita water-resource carrying capacity (hm2/people); yj is the yield factors of water resources calculated by the water-production modulus referring to the method of Xiong and Xie [60]; and Q is the total water resources of the study area (m3).

2.5. Ecological Compensation

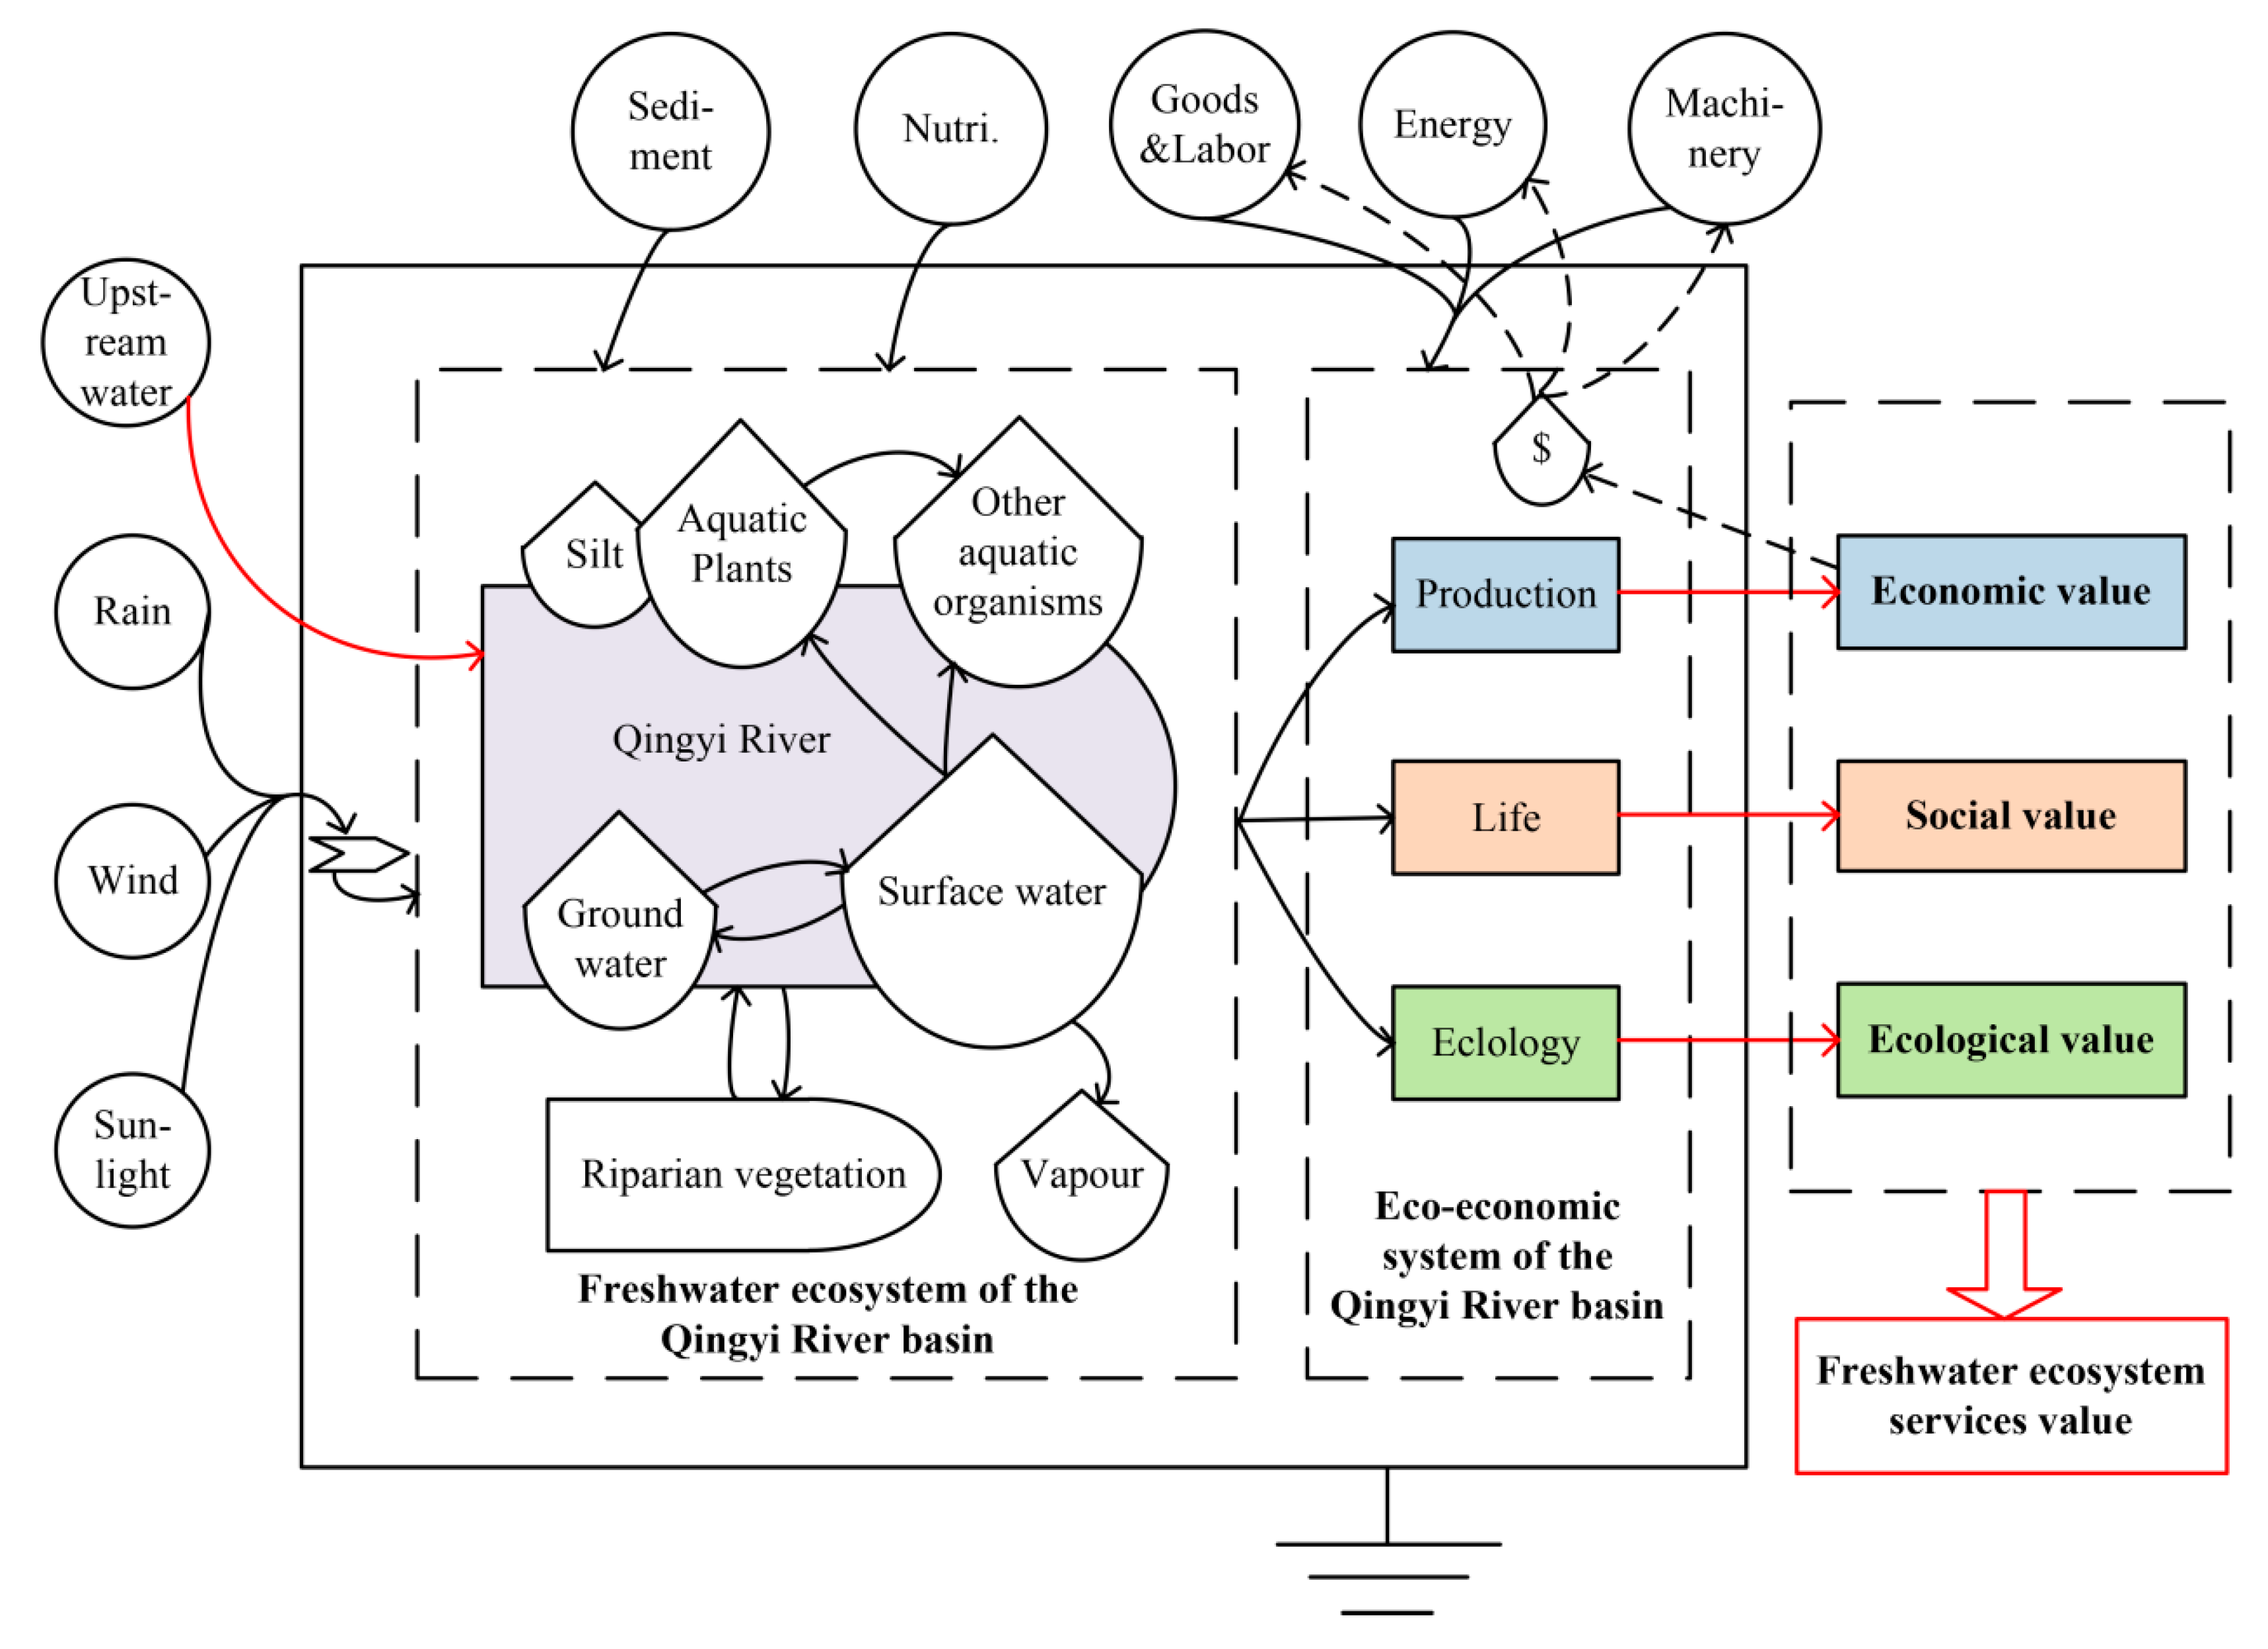
In the Qingyi River Basin, the most upstream city (southwest of Xinzheng) is responsible for protecting natural vegetation and conserving freshwater resources, while the downstream Xuchang City (mainly in the north) consumes part of the upstream-oriented and protected freshwater resources for free. Thus, Xuchang needs to compensate Xinzheng for the conservation/protection measures the latter applies (Figure 3). The eco-compensation amount depends on the part of the ecological spillover flowing from Xinzheng that is used by Xuchang. To this part, we should also include renewable resources (sunlight, wind, rain) and non-renewable resources (soil sediments, nutrients) that are transferred within the spillover, ensuring the growth of aquatic animals and plants as an essential element of life, and regulating the climate through evaporation and heat dissipation. Then, economic, social, and ecological values of freshwater ecosystem services in Xuchang are improved, that is, upstream ecological spillover was obtained by downstream Xuchang (Figure 4).
Ecological spillover used in the downstream can be calculated by deducting the local, self-supplied ecosystem services from the total emergy of freshwater ecosystem services used in the Qingyi River Basin of Xuchang. Ecological spillover can be transformed into monetary terms, which is considered the amount of ecological compensation of the river basin. The equations are as follows:
E M O E = E M T E E M S E
E C = E M O E ÷ E D R
where EMOE represents ecological spillover used in the upstream (sej); and EC represents the amount of ecological compensation of the river basin (¥).
If the ecological spillover used in the upstream is positive, it means that the local, self-supplied value of ecosystem services in Xuchang is insufficient, which is shown as the ecological deficit. In order to meet social development, this area must rely on the value of external ecosystem services originating from Xinzheng. Therefore, Xinzheng should charge eco-compensation funds to restrain the unreasonable use of water resources in Xuchang. Otherwise, it means that the value of freshwater ecosystem services provided by Xuchang is enough for its life and production, and there is no additional payment to Xinzheng. Due to the small area of the Qingyi River Basin in Xinzheng, the ecological protection of Xinzheng mainly benefits Xuchang. For the most downstream Luohe, the upstream water mainly comes from Xuchang’s natural runoff, agricultural recession, and industrial drainage.

3. Results

3.1. Emergy and Monetary Value of Freshwater Ecosystem Services

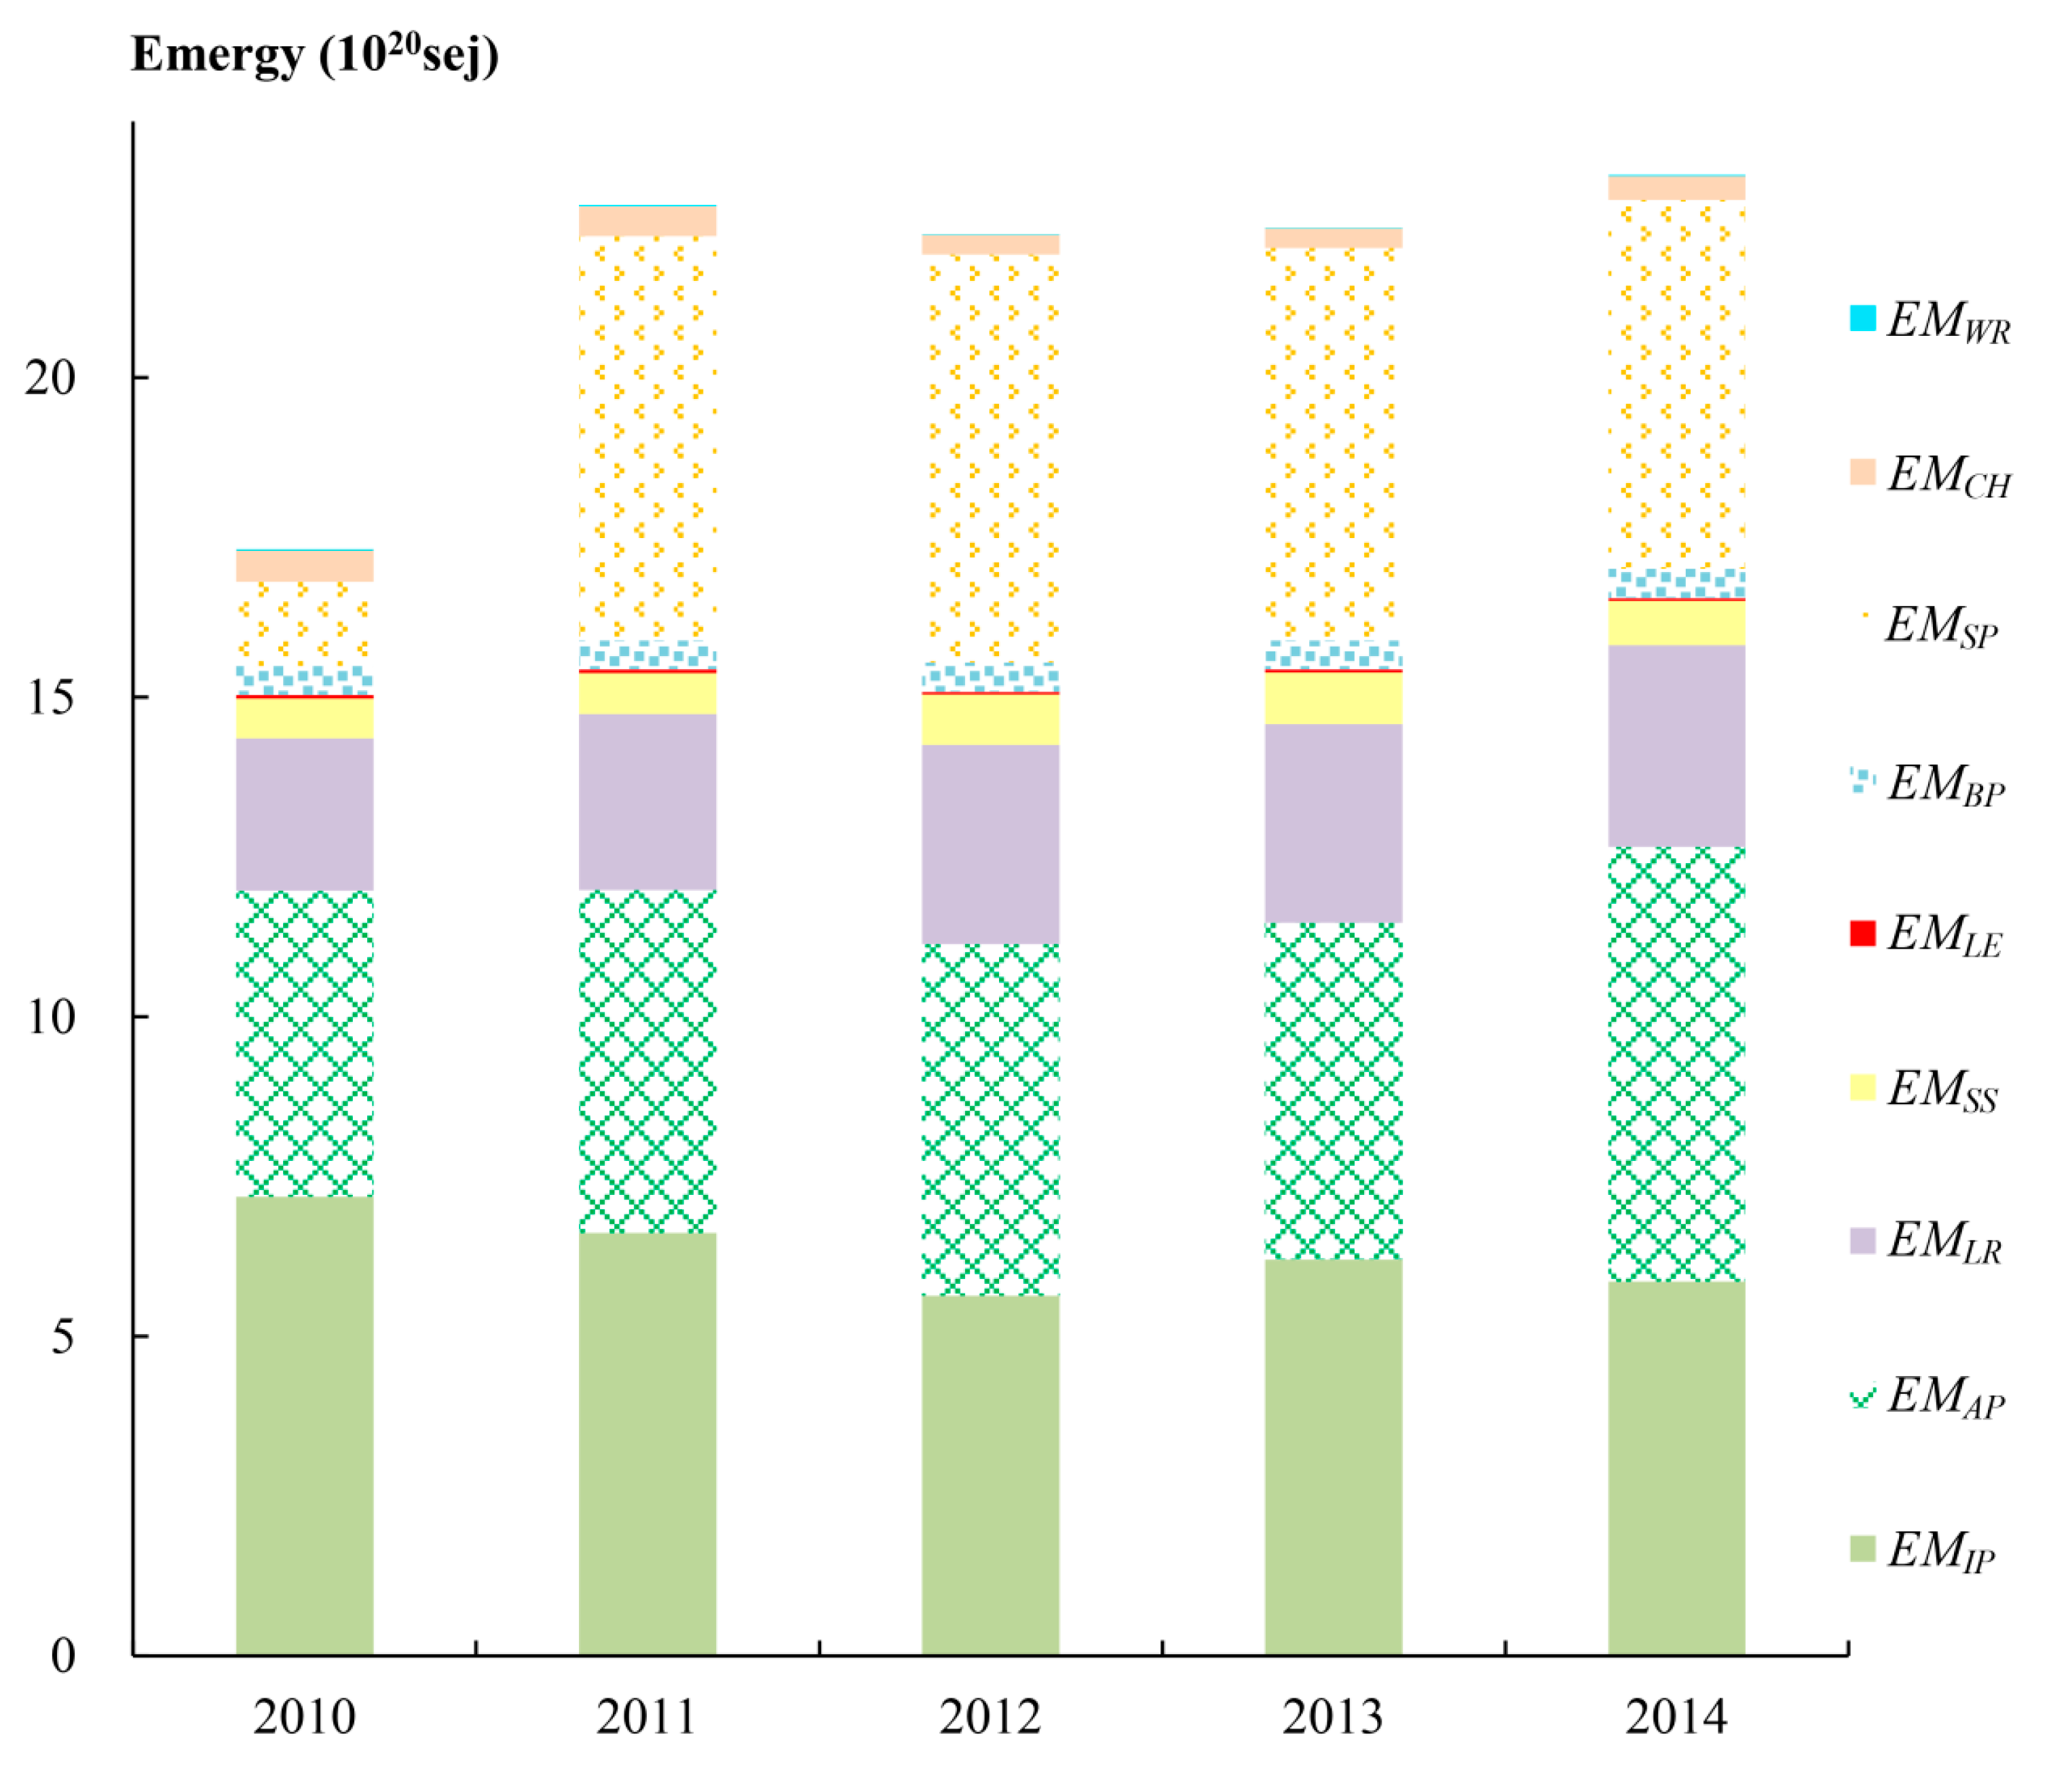
The emergy of economic ecosystem services (industrial and agricultural production) in the Qingyi River Basin of Xuchang from 2010 to 2014 ranged from 11.14 × 10²⁰ sej (in 2012) to 12.66 × 10²⁰ sej (in 2014) (Table 1). Higher emergy was calculated for industrial production sector, ranging from 5.64 × 10²⁰ sej (2012) to 7.19 × 10²⁰ sej (2010), and lower for agricultural sector, ranging from 4.78 × 10²⁰ sej (2010) to 6.80 × 10²⁰ sej (2014) (Table 1; Figure 5). The emergy of social ecosystem services (labor recovery, social stability and landscape/recreation) in the Qingyi River Basin of Xuchang from 2010 to 2014 ranged from 3.06 × 10²⁰ sej (in 2010) to 3.96 × 10²⁰ sej (in 2013) (Table 1). Higher emergy was calculated for labor-recovery services, ranging from 2.39 × 10²⁰ sej (2010) to 3.15 × 10²⁰ sej (2014), lower for social-stability services, ranging from 0.62 × 10²⁰ sej (2010) to 0.81 × 10²⁰ sej (2013), and lowest for the landscape/recreation services, ranging from 0.04 × 10²⁰ sej (2012–2014) to 0.05 × 10²⁰ sej (2010–2011) (Table 1; Figure 5). The emergy of ecological ecosystem services (biodiversity conservation, water purification, air cooling/humidifying and groundwater recharge) in the Qingyi River Basin of Xuchang from 2010 to 2014 ranged from 2.33 × 10²⁰ sej (in 2010) to 7.31 × 10²⁰ sej (in 2011) (Table 1). The highest emergy was calculated for water-purification services, ranging from 1.32 × 10²⁰ sej (2010) to 6.39 × 10²⁰ sej (2012), and the largest increase in 2010–2011, from 1.32 × 10²⁰ sej (2010) to 6.32 × 10²⁰ sej (2011) (Table 1; Figure 5). Biodiversity conservation, air cooling/humidifying, and groundwater recharge had little difference, with higher emergy calculated for biodiversity-conservation services, 0.50 × 10²⁰ sej (2010–2014), lower for air cooling/humidifying services, ranging from 0.30 × 10²⁰ sej (2012–2013) to 0.49 × 10²⁰ sej (2010), and the lowest for groundwater-recharge services, ranging from 0.01 × 10²⁰ sej (2012–2013) to 0.02 × 10²⁰ sej (2010, 2011, 2014) (Table 1; Figure 5). The total emergy of freshwater ecosystem services in the Qingyi River Basin of Xuchang ranged from 17.36 × 10²⁰ sej (2010) to 23.21 × 10²⁰ sej (2014) in 2010–2014 (Table 1).

3.2. Ecological Compensation Based on Ecological Spillover

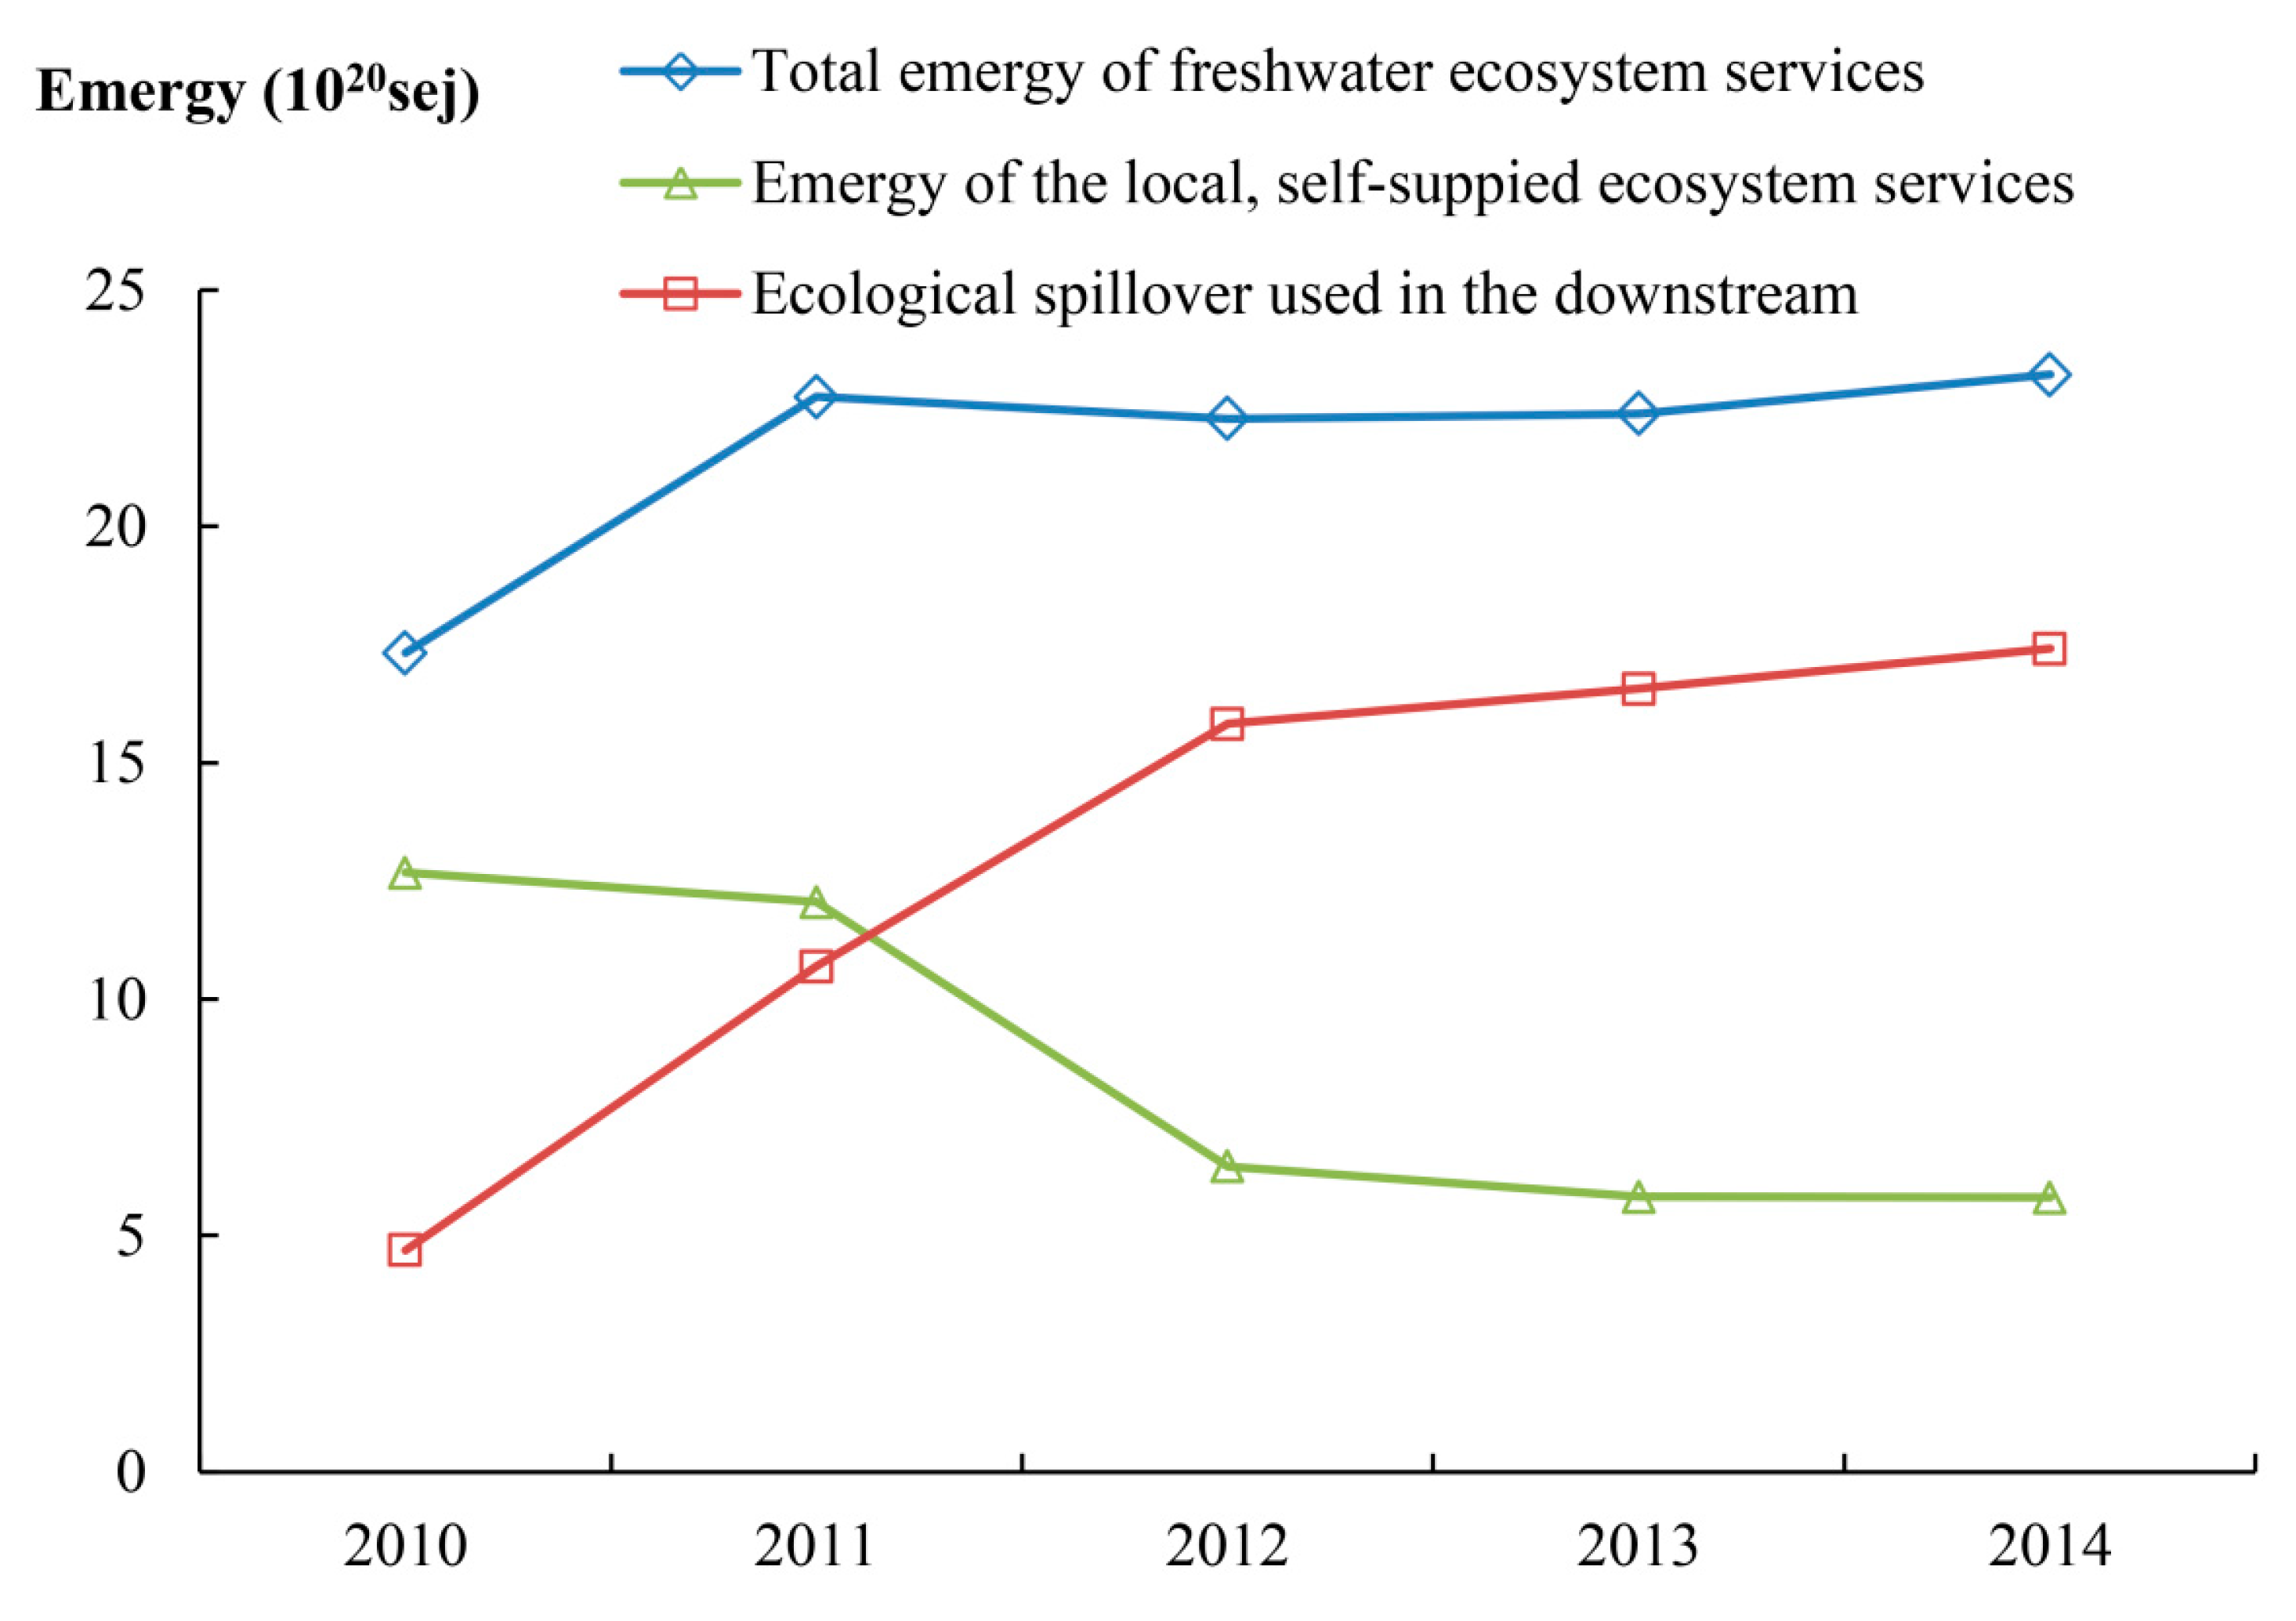
Ecological water-footprint demand in Xuchang from 2010 to 2014 ranged from 596,685 hm2 (2014) to 682,634 hm2 (2012), ecological water-footprint supply from 2010 to 2014 ranged from 149,736 hm2 (2014) to 471,318 hm2 (2010), and the coefficient of self-supply capacity from 2010 to 2014 decreased from 0.73 (2010) to 0.25 (2014) (Table 2). Based on the total emergy of ecosystem services and the self-supply capacity coefficient, the range of the local, self-supplied ecosystem services from 2010 to 2014 was evaluated to be from 5.80 × 10²⁰ sej (2014) to 12.67 × 10²⁰ sej (2011). Therefore, the ecological spillover used by Xuchang from 2010 to 2014 ranged from 4.69 × 10²⁰ sej (2010) to 17.41 × 10²⁰ sej (2014) (Table 2; Figure 6). Converting ecological spillover into monetary value, the amount of ecological compensation in the Qingyi River Basin of Xuchang from 2010 to 2014 was from ¥0.99 × 10⁹ (2010) to ¥5.09 × 10⁹ (2014) (Table 2).

4. Discussion

4.1. Freshwater Ecosystem Services

Table 1 and Figure 5 show that the total emergy of freshwater ecosystem services in the Qingyi River Basin of Xuchang was the lowest in 2010, while it increased heavily in 2011. The emergy of freshwater ecosystem services was relatively stable from 2011 to 2014. This trend was mainly affected by ecological ecosystem services, and economic and social ecosystem services changed little during the study period. According to the survey and Figure 5, the discharge of pollutants in Qingyi River Basin of Xuchang was low in 2010. Low pollutants lead to low self-purification service embodied by natural water through dilution and settlement, resulting in low ecological value of freshwater ecosystem. The emergy of the water-purification service was relatively high during 2011–2014 due to the rapid growth of COD and NH3–N emissions from riverside factories, and the influence of pollutant solar transformity. Considering different reference standards, the pollutant solar transformity may be calculated differently by other scholars.
Table 1 also shows that economic ecosystem services dominated the total emergy of freshwater ecosystem services from 2010 to 2014. In 2010, ecological ecosystem services were the lowest, while from 2011 to 2014, such services far exceeded social ecosystem services, in second place among the three ecosystem services. These show that the water-purification service had great impact on the total emergy of freshwater ecosystem services in Xuchang due to the increased pollution load in the Qingyi River Basin. Aguilar surveyed the attitudes of over 1000 U.S. households on the payment for watershed conservation and ecosystem services [61]. Results showed that willingness to pay for water purification was the highest, followed by provisioning of habitats for threatened plant and animal species, flood control, and landscape aesthetics. The study of Aguilar [61] illustrates the importance of water purification in different ways. Therefore, attention should be paid to water-pollution treatment to reduce the burden of river basins.

4.2. The Local, Self-Supplied Freshwater Ecosystem Services

The local, self-supplied freshwater ecosystem services in the Qingyi River Basin of Xuchang decreased by approximately 42% from 2010 to 2014, which was mainly related to the continuous decline of the self-supply capacity in Xuchang City (Table 2). According to the hydrology, water resources, and ecological water data of Xuchang, precipitation was the main reason for the decline in the self-supply level of freshwater ecosystem services. In 2010 and 2011, precipitation in Xuchang was 12.7% and 4.1%, respectively, higher than the multiyear average. In 2012–2014, it decreased by 31.2%, 33.0%, and 20.3%, respectively, from the multiyear average. The change in precipitation led to the continuous reduction in the yield factors of water resources and the total water resources in Xuchang; thus, ecological water-footprint supply has continued to decline. Bangash [62] observed the same pattern. He predicted that the frequency of floods and extended droughts in the Mediterranean basin will continue to increase, and climate change is expected to reduce water-supply services by between 3% and 49%. Given the small change of ecological water-footprint demand from 2010 to 2014, the self-supply capacity of water ecosystem services in the study area was constantly reduced. Proactive management of the basin should be implemented to adapt to different freshwater ecosystem services under the changing climate.

4.3. Ecological Compensation of River Basin

Table 2 shows that the amount of eco-compensation in the Qingyi River Basin of Xuchang increased from 2010 to 2014, ranging from ¥990 million (2010) to ¥509 billion (2014). Especially in 2011 and 2012, the growth rate of ecological spillover nearly doubled due to the combined effect of increased water pollution and reduced precipitation (Figure 6). By analyzing the change in water-ecosystem service value in the Erhai Lake Basin from 2000 to 2015, Zhong [20] concluded that the emdollar change of regulation services (including climate regulation, water purification, and water retention) should be regarded as the ecological compensation standard. In his research, Saraswat [63] found that payments for ecosystem services should consider the effects of climate change and extreme weather conditions. The two studies above also prove that climatic and environmental changes have great impact on ecological compensation. Therefore, the basin management in Xuchang should focus on controlling pollutant discharge and optimizing water-resource allocation. The anthropocentric economic approach to quantify ecological compensation tends to ignore the impact of environmental and climatic water factors. On the basis of the three economic methods of conservation cost, market value, and payment ability, Sun calculated the payment standards for ecosystem services in the Middle Route of the South-to-North Water Diversion project using average data from 2006 to 2015 [64]. However, it is impossible to conduct dynamic analysis of the annual variation of the compensation amount.
By calculating the profit and loss of ecosystem services, and analyzing the willingness to pay of residents, Qiao [65] concluded that eco-compensation for the upper reaches of the Weihe River Basin in China was ¥2483 million and ¥24 million, respectively, and results were quite different. The method of profit and loss of ecosystem services only considers changes in upstream ecosystem services, but ignores the actual impact on downstream services, leading to a large result. Analysis of willingness to pay mainly focuses on human preferences, but ignores the function and value of ecosystem services, leading to a small result. By analyzing the evolution of payments for ecosystem-service mechanisms in South Africa, Turpie [66] indicated that the relationship between ecosystem quality and service delivery should be further quantified in physical terms. The proposed method in this study fully considers the physical connection between the upper and lower reaches of the Qingyi River Basin and the formation mechanism of freshwater ecosystem services. Ecological spillover and emergy theory were used as tools to determine an appropriate amount of ecological compensation.

5. Conclusions

A new method for quantifying eco-compensation was demonstrated for Xuchang City, Qingyi River Basin, combining emergy analysis and ecological spillover. We showed that eco-compensation increased from 2010 to 2014 due to increased need for water self-purification, and due to reduced amounts of precipitation around Xuchang, that lead the city to use more ecological services from the upstream-oriented spillover. The results indicate that Xuchang City is increasingly dependent on the ecosystem services of upstream spillover, and it urgently needs eco-compensation funds to coordinate the interest relationship of Xuchang and Xinzheng. This study can provide reference for the negotiation of eco-compensation standard between the two cities.
Within the process of calculating the ecological water footprint (an internal component of eco-compensation valuation), global variables (the global equivalence factors of water resources and the global average production capacity of water resources) highly influence the calculations. Thus, they should be carefully revisited to avoid errors occurring from localizing such global variables, while studies should focus on obtaining local data to accurately determine the relevant variables in a local scale.

Author Contributions

Conceptualization: H.L. and C.L.; methodology: H.L.; software: H.L. and M.L.; validation: H.L., C.L. and M.L.; data curation: C.G. and Y.L.; writing—original draft preparation: H.L.; writing—review and editing: H.L., C.L., M.L., Z.W. and D.Y.; visualization: H.L. and C.L. All authors have read and agreed to the published version of the manuscript.

Funding

This research was funded by the National Natural Science Foundation of China (no. NSCF-51909240 and no. NSCF-52079125).

Institutional Review Board Statement

Not applicable.

Informed Consent Statement

Not applicable.

Data Availability Statement

Not applicable.

Acknowledgments

The authors would like to express their sincere gratitude to the anonymous reviewers for their constructive comments and the Editor of the journal. Their detailed suggestions have resulted in an improved manuscript.

Conflicts of Interest

The authors declare that they have no conflict of interest.

References

  1. Parker, H.; Oates, N. How Do Healthy Rivers Benefit Society? A Review of Evidence; Working Paper 430; Overseas Development Institute and World Wildlife Fund: London, UK, 2016. [Google Scholar]
  2. Zheng, H.; Zhang, L. Chinese Practices of Ecological Compensation and Payments for Ecological and Environmental Services and Its Policies in River Basins; Working Paper 46923; The World Bank: Beijing, China, 2006. [Google Scholar]
  3. Sgroi, F.; Foderà, M.; Dana, L.; Mangiapane, G.; Tudisca, S.; Trapani, A.M.D.; Testa, R. Evaluation of payment for ecosystem services in Mediterranean forest: An empirical survey. Ecol. Eng. 2016, 90, 399–404. [Google Scholar] [CrossRef]
  4. Lv, C.M.; Ling, M.H.; Wu, Z.N.; Guo, X.; Cao, Q.Q. Quantitative assessment of ecological compensation for groundwater overexploitation based on emergy theory. Environ. Geochem. Health 2020, 42, 733–744. [Google Scholar] [CrossRef]
  5. Liu, J.Y.; Dou, S.Q.; Hmeimar, A.E.H. Cost-effectiveness analysis of different types of payments for ecosystem services: A case in the urban wetland ecosystem. J. Clean. Prod. 2020, 249, 119325. [Google Scholar]
  6. Mombo, F.; Lusambo, L.; Speelman, S.; Buysse, J.; Munishi, P.; van Huylenbroeck, G. Scope for introducing payments for ecosystem services as a strategy to reduce deforestation in the Kilombero wetlands catchment area. Forest. Policy Econ. 2014, 38, 81–89. [Google Scholar] [CrossRef]
  7. Wu, Z.N.; Guo, X.; Lv, C.M.; Wang, H.L.; Di, D.Y. Study on the quantification method of water pollution ecological compensation standard based on emergy theory. Ecol. Indic. 2018, 92, 189–194. [Google Scholar] [CrossRef]
  8. Zhang, M.; Zhou, J.; Zhou, R. Interval Multi-Attribute Decision of Watershed Ecological Compensation Schemes Based on Projection Pursuit Cluster. Water 2018, 10, 1280. [Google Scholar] [CrossRef] [Green Version]
  9. Bohlen, P.J.; Lynch, S.; Shabman, L.; Clark, M.; Shukla, S.; Swain, H. Paying for environmental services from agricultural lands: An example from the northern Everglades. Front. Ecol. Environ. 2009, 7, 46–55. [Google Scholar] [CrossRef]
  10. Liu, M.C.; Liu, W.W.; Yang, L.; Jiao, W.J.; He, S.Y.; Min, Q.W. A dynamic eco-compensation standard for Hani Rice Terraces System in southwest China. Ecosyst. Serv. 2019, 36, 100897. [Google Scholar] [CrossRef]
  11. Farley, J.; Costanza, R. Payments for ecosystem services: From local to global. Ecol. Econ. 2010, 69, 2060–2068. [Google Scholar] [CrossRef]
  12. Diswandi, D. A hybrid Coasean and Pigouvian approach to Payment for Ecosystem Services Program in West Lombok: Does it contribute to poverty alleviation? Ecosyst. Serv. 2017, 23, 138–145. [Google Scholar] [CrossRef]
  13. Jenkins, W.A.; Murray, B.C.; Kramer, R.A.; Faulkner, S.P. Valuing ecosystem services from wetlands restoration in the Mississippi Alluvial Valley. Ecol. Econ. 2010, 69, 1051–1061. [Google Scholar] [CrossRef]
  14. Atisa, G.; Bhat, M.G.; McClain, M.E. Economic Assessment of Best Management Practices in the Mara River Basin: Toward Implementing Payment for Watershed Services. Water Resour. Manag. 2014, 28, 1751. [Google Scholar] [CrossRef] [Green Version]
  15. Kaura, M.; Arias, M.E.; Benjamin, J.A.; Oeurng, C.; Cochrane, T.A. Benefits of forest conservation on riverine sediment and hydropower in the Tonle Sap Basin, Cambodia. Ecosyst. Serv. 2019, 39, 101003. [Google Scholar] [CrossRef]
  16. Sanchez, R.M.; Maldonado, J.H.; Wunder, S.; Almanza, C.B. Heterogeneous users and willingness to pay in an ongoing payment for watershed protection initiative in the Colombian Andes. Ecol. Econ. 2012, 75, 126–134. [Google Scholar] [CrossRef]
  17. Owuor, M.A.; Mulwa, R.; Otieno, P.; Icely, J.; Newton, A. Valuing mangrove biodiversity and ecosystem services: A deliberative choice experiment in Mida Creek, Kenya. Ecosyst. Serv. 2019, 40, 101040. [Google Scholar] [CrossRef]
  18. Gerner, N.V.; Nafo, I.; Winking, C.; Wencki, K.; Strehl, C.; Wortberg, T.; Niemann, A.; Anzaldua, G.; Lago, M.; Birk, S. Large-scale river restoration pays off: A case study of ecosystem service valuation for the Emscher restoration generation project. Ecosyst. Serv. 2018, 30, 327–338. [Google Scholar] [CrossRef]
  19. Pei, S.; Zhang, C.X.; Liu, C.L.; Liu, X.N.; Xie, G.D. Forest ecological compensation standard based on spatial flowing of water services in the upper reaches of Miyun Reservoir, China. Ecosyst. Serv. 2019, 39, 100983. [Google Scholar] [CrossRef]
  20. Zhong, S.Z.; Geng, Y.; Huang, B.B.; Zhu, Q.H.; Cui, X.W.; Wu, F. Quantitative assessment of eco-compensation standard from the perspective of ecosystem services: A case study of Erhai in China. J. Clean. Prod. 2020, 263, 121530. [Google Scholar] [CrossRef]
  21. Lai, M.; Wu, S.H.; Yin, Y.H.; Pan, T. Accounting for eco-compensation in the three-river headwaters region based on ecosystem service value. Acta Ecol. Sin. 2015, 35, 227–236. [Google Scholar]
  22. Fu, R.M.; Miao, X.L. A new financial transfer payment system in ecological function areas in China: Based on the spillover ecological value measured by the expansion emergy analysis. Econ. Resour. J. 2015, 50, 47–61. [Google Scholar]
  23. Wang, Y.Q.; Li, G.P. Study of watershed spillover ecological value compensation based on expansion emergy: A case of Weihe watershed upstream. China Popul. Resour. Environ. 2016, 26, 69–75. [Google Scholar]
  24. Hau, J.L.; Bakshi, B.R. Promise and problems of emergy analysis. Ecol. Model. 2004, 178, 215–225. [Google Scholar] [CrossRef]
  25. Henan Province Bureau of Statistics. The Statistical Yearbook of Henan Province (2011); China Statistics Press: Beijing, China, 2011. Available online: http://www.ha.stats.gov.cn/ (accessed on 5 July 2016).
  26. Henan Province Bureau of Statistics. The Statistical Yearbook of Henan Province (2012); China Statistics Press: Beijing, China, 2012. Available online: http://www.ha.stats.gov.cn/ (accessed on 5 July 2016).
  27. Henan Province Bureau of Statistics. The Statistical Yearbook of Henan Province (2013); China Statistics Press: Beijing, China, 2013. Available online: http://www.ha.stats.gov.cn/ (accessed on 5 July 2016).
  28. Henan Province Bureau of Statistics. The Statistical Yearbook of Henan Province (2014); China Statistics Press: Beijing, China, 2014. Available online: http://www.ha.stats.gov.cn/ (accessed on 5 July 2016).
  29. Henan Province Bureau of Statistics. The Statistical Yearbook of Henan Province (2015); China Statistics Press: Beijing, China, 2015. Available online: http://www.ha.stats.gov.cn/ (accessed on 5 July 2016).
  30. Xuchang Bureau of Statistics. The Statistical Yearbook of Xuchanng City (2015); Xuchang Statistics Bureau Publications: Xuchang, China, 2015.
  31. Xuchang Water Conservancy Bureau. The Water Resources Bulletin of Xuchang City (2010); Xuchang Water Conservancy Bureau Publications: Xuchang, China, 2010.
  32. Xuchang Water Conservancy Bureau. The Water Resources Bulletin of Xuchang City (2011); Xuchang Water Conservancy Bureau Publications: Xuchang, China, 2011.
  33. Xuchang Water Conservancy Bureau. The Water Resources Bulletin of Xuchang City (2012); Xuchang Water Conservancy Bureau Publications: Xuchang, China, 2012.
  34. Xuchang Water Conservancy Bureau. The Water Resources Bulletin of Xuchang City (2013); Xuchang Water Conservancy Bureau Publications: Xuchang, China, 2013.
  35. Xuchang Water Conservancy Bureau. The Water Resources Bulletin of Xuchang City (2014); Xuchang Water Conservancy Bureau Publications: Xuchang, China, 2014.
  36. Odum, H.T. Environment Accounting: Emergy and Environment Decision Making; John Wiley & Sons: New York, NY, USA, 1996. [Google Scholar]
  37. Lan, S.F.; Qin, P.; Lu, H.F. Emergy Analysis of Ecological-Economic System; Chemical Industry Press: Beijing, China, 2002. [Google Scholar]
  38. Price Division of National Development and Reform Commission. Compilation of Cost and Income Data of Agricultural Products in China (2011); Chinese Statistics Press: Beijing, China, 2011.
  39. Price Division of National Development and Reform Commission. Compilation of Cost and Income Data of Agricultural Products in China (2012); Chinese Statistics Press: Beijing, China, 2012.
  40. Price Division of National Development and Reform Commission. Compilation of Cost and Income Data of Agricultural Products in China (2013); Chinese Statistics Press: Beijing, China, 2013.
  41. Price Division of National Development and Reform Commission. Compilation of Cost and Income Data of Agricultural Products in China (2014); Chinese Statistics Press: Beijing, China, 2014.
  42. Price Division of National Development and Reform Commission. Compilation of Cost and Income Data of Agricultural Products in China (2015); Chinese Statistics Press: Beijing, China, 2015.
  43. Brown, M.T.; Ulgiati, S. Energy quality, emergy, and transformity: H.T. Odum’s contributions to quantifying and understanding systems. Ecol. Model. 2004, 178, 201–213. [Google Scholar] [CrossRef]
  44. Herendeen, R.A. Energy analysis and EMERGY analysis—A comparison. Ecol. Model. 2004, 178, 227–237. [Google Scholar] [CrossRef]
  45. Fonseca, A.M.P.; Marques, C.A.F.; Pinto-Correia, T.; Campbell, D.E. Emergy analysis of a silvo-pastoral system, a case study in southern Portugal. Agroforest. Syst. 2016, 90, 137–157. [Google Scholar] [CrossRef]
  46. Yang, Q.; Liu, G.Y.; Hao, Y.; Zhang, L.X.; Giannetti, B.F.; Wang, J.J.; Casazza, M. Donor-side evaluation of coastal and marine ecosystem services. Water Res. 2019, 166, 115028. [Google Scholar] [CrossRef]
  47. Dan, C. Keeping the Books for the Environment and Society: The Unification of Emergy and Financial Accounting Methods. J. Environ. Account. Manag. 2013, 1, 25–41. [Google Scholar]
  48. Lv, C.M.; Zhang, W.Y.; Ling, M.H.; Li, H.Q.; Zhang, G.J. Quantitative analysis of eco-economic benefits of reclaimed water for controlling urban dust. Environ. Geochem. Health 2020, 42, 2963–2973. [Google Scholar] [CrossRef]
  49. Lv, C.M.; Wu, Z.N. Emergy analysis of regional water ecological-economic system. Ecol. Eng. 2009, 35, 703–710. [Google Scholar] [CrossRef]
  50. Di, D.Y.; Wu, Z.N.; Guo, X.; Lv, C.M.; Wang, H.L. Value Stream Analysis and Emergy Evaluation of the Water Resource Eco-Economic System in the Yellow River Basin. Water 2019, 11, 710. [Google Scholar] [CrossRef] [Green Version]
  51. Xie, G.D.; Zhang, C.X.; Zhang, L.M.; Chen, W.H.; Li, S.M. Improvement of the evaluation method for ecosystem service value based on per unit area. J. Nat. Resour. 2015, 30, 1243–1254. [Google Scholar]
  52. Asah, S.T.; Blahna, D.J. Involving Stakeholders’ Knowledge in Co-designing Social Valuations of Biodiversity and Ecosystem Services: Implications for Decision-Making. Ecosystems 2020, 23, 324–337. [Google Scholar] [CrossRef]
  53. Chai, J.X. Study on Plant Community Allocation and Functional Improvement in the Riparian Zone of the Qingyi River Basin. Master’s Thesis, Zhengzhou University, Zhengzhou, China, 2019. [Google Scholar]
  54. Chen, H.M. Study on Dynamic Water Environmental Capacity of Qingyi River Basin (Xuchang). Master’s Thesis, Zhengzhou University, Zhengzhou, China, 2016. [Google Scholar]
  55. Zhao, Y.B.; Yang, M.Z.; Ni, H.G. An emergy-GIS method of selecting areas for sponge-like urban reconstruction. J. Hydrol. 2018, 564, 640–650. [Google Scholar] [CrossRef]
  56. Carey, R.O.; Migliaccio, K.W.; Brown, M.T. Nutrient discharges to Biscayne Bay, Florida: Trends, loads, and a pollutant index. Sci. Total Environ. 2011, 409, 530–539. [Google Scholar] [CrossRef]
  57. Qingyi River Project Team. The Status Water Resources Evaluation Report of Qingyi River Basin of Xuchang; Zhengzhou University: Zhengzhou, China, 2018; Unpublished work. [Google Scholar]
  58. Su, Y.; Gao, W.J.; Guan, D.J.; Su, W.C. Dynamic assessment and forecast of urban water ecological footprint based on exponential smoothing analysis. J. Clean. Prod. 2018, 195, 354–364. [Google Scholar] [CrossRef]
  59. Huang, L.N.; Zhang, W.X.; Jiang, C.L.; Fan, X.Q. Ecological footprint method in water resources assessment. Acta Ecol. Sin. 2008, 28, 1279–1286. [Google Scholar]
  60. Xiong, N.N.; Xie, S.Y. A study of the spatio-temporal evolution of water resource ecological footprint and ecological carrying capacity of Chengdu. J. Southwest Univ. (Nat. Sci. Ed.) 2019, 41, 118–126. [Google Scholar]
  61. Aguilar, F.X.; Obeng, E.A.; Cai, Z. Water quality improvements elicit consistent willingness-to-pay for the enhancement of forested watershed ecosystem services. Ecosyst. Serv. 2018, 30, 158–171. [Google Scholar] [CrossRef]
  62. Bangash, R.F.; Passuello, A.; Sanchez-Canales, M.; Terrado, M.; López, A.; Elorza, J.F.; Ziv, G.; Acuña, V.; Schuhmacher, M. Ecosystem services in Mediterranean river basin: Climate change impact on water provisioning and erosion control. Sci. Total Environ. 2013, 458–460, 246–255. [Google Scholar] [CrossRef]
  63. Saraswat, C.; Kumar, P.; Kem, D.; Avtar, R.; Ramanathan, A.L. Payment of Ecosystem Service to Alleviate Poverty from Kyrgyz Republic in Central Asia Considering Climate Change and Extreme Weather Condition. J. Clim. Chang. 2015, 1, 119–128. [Google Scholar] [CrossRef]
  64. Sun, J.; Dang, Z.L.; Zheng, S.K. Development of payment standards for ecosystem services in the largest interbasin water transfer projects in the world. Agric. Water Manag. 2017, 182, 158–164. [Google Scholar] [CrossRef]
  65. Qiao, X.N.; Yang, Y.J.; Yang, D.G.; Li, C.L. Standards of payments for ecosystem services in watershed: Taking Weihe River Basin as an example. J. Nat. Resour. 2012, 10, 1666–1676. [Google Scholar]
  66. Turpie, J.K.; Marais, C.; Blignaut, J.N. The working for water programme: Evolution of a payments for ecosystem services mechanism that addresses both poverty and ecosystem service delivery in South Africa. Ecol. Econ. 2008, 65, 788–798. [Google Scholar] [CrossRef] [Green Version]
Figure 1. Conceptual framework for quantifying eco-compensation based on both upstream-to-downstream flowing ecological spillover and the local, self-supplied ecosystem services in the downstream.
Water 13 00414 g001
Figure 2. Economic, social, and ecological components of freshwater ecosystem services in the Qingyi River Basin, Xuchang, China.
Water 13 00414 g002
Figure 3. Location of the Qingyi River Basin, Henan Province, China.
Water 13 00414 g003
Figure 4. Energy-conversion diagram of formation process of freshwater-ecosystem-service values in Qingyi River Basin of Xuchang.
Water 13 00414 g004
Figure 5. Annual variation of emergy of freshwater ecosystem services for Xuchang, Qingyi River Basin, from 2010 to 2014. For emergy abbreviations see Section 2.3.1.
Water 13 00414 g005
Figure 6. Annual values and trends of the amount (emergy) of ecological spillover used by Xuchang, the total emergy of freshwater ecosystem services and the emergy of self-supplied ecosystem services from 2010 to 2014. The results were extracted from Table 1 and Table 2.
Water 13 00414 g006
Table 1. Emergy of freshwater ecosystem services in Qingyi River Basin of Xuchang from 2010 to 2014.
Ecosystem ServicesService TypesEquationEmergy (1020 sej)
20102011201220132014
EconomicWater input industryEquations (4) and (5)7.196.625.646.205.86
Water input agricultureEquations (6) and (7)4.785.365.505.276.80
Economic ecosystem servicesSection 2.3.111.9711.9811.1411.4712.66
SocialLabor recoveryEquations (8) and (9)2.392.763.113.113.15
Social stabilityEquation (10)0.620.640.790.810.70
Landscape/recreationEquation (11)0.050.050.040.040.04
Social ecosystem servicesSection 2.3.23.063.453.943.963.89
EcologicalBiodiversity conservationEquation (12)0.500.500.500.500.50
Water purificationEquation (13)1.326.326.396.145.77
Air cooling/humidifyingEquations (14) and (15)0.490.470.300.300.37
Groundwater rechargeEquation (16)0.020.020.010.010.02
Ecological ecosystem servicesSection 2.3.32.337.317.206.956.66
Eco-economicTotal emergy of freshwater ecosystem servicesEquation (3)17.3622.7422.2822.3823.21
See Section 2.3 for the specific equations.
Table 2. Ecological compensation in Qingyi River Basin of Xuchang based on ecological spillover from 2010 to 2014.
ItemsEquation20102011201220132014
Ecological water-footprint demand (hm2)Equation (18)646,271647,924682,634634,701596,685
Ecological water-footprint supply (hm2)Equation (19)471,318342,937201,015164,758149,736
The coefficient of self-supply capacityEquation (17)0.730.530.290.260.25
The local, self-supplied services (1020 sej)Equation (17)12.6712.056.465.825.80
Emergy of cological spillover (1020 sej)Equation (20)4.6910.6915.8216.5617.41
Emergy/money ratio (1011 sej/¥)Section 2.34.744.413.953.773.42
Ecological compensation (109¥)Equation (21)0.992.424.004.395.09
All equations are shown in Section 2.3, Section 2.4 and Section 2.5.
Publisher’s Note: MDPI stays neutral with regard to jurisdictional claims in published maps and institutional affiliations.