
A Synthesis of Social and Economic Benefits Linked to Green Infrastructure


1
School of Engineering, Southern Illinois University Edwardsville, 61 Circle Dr, Edwardsville, IL 62026, USA
2
Blueberry River First Nations, Blueberry Reserve Rd, Buick, BC V0C 2R0, Canada
3
Chicago Metropolitan Agency for Planning, 233 S Wacker Dr 800, Chicago, IL 60606, USA
*
Author to whom correspondence should be addressed.
Water 2021, 13(24), 3651; https://doi.org/10.3390/w13243651
Submission received: 1 January 2021
/
Revised: 16 May 2021
/
Accepted: 27 May 2021
/
Published: 20 December 2021
(This article belongs to the Special Issue Case Studies of Green Infrastructure Adoption)
Abstract
:Green infrastructure (GI) is a land development approach that uses a network of natural and built areas and waterways to create healthier urban environments. This study presents a synthesis of GI planning and adoption in 16 cities selected from around the world; 12 of these cities are located in the United States. The study highlights key socio-economic benefits associated with GI adoption and documents analytical procedures used to quantify the benefits linked to GI implementation. The benefits as identified and reported in this study are qualitative rather than quantitative.
1. Introduction
Green infrastructure can be defined as a network of natural and semi-natural areas strategically planned and designed to manage a variety of urbanization challenges, including flooding, poverty, harmful effects of conventional transportation modes, depletion of urban wildlife species and their habitat, and deterioration air quality [1,2,3,4]. This integration of natural and engineered systems provides more resilient infrastructure with multiple natural ecosystem goods and services to people and wildlife [1,2,3,4].
While GI aims to address a wide variety of challenges, this study primarily and deliberately focuses on the use of GI for stormwater management. In this context, GI is often viewed as an alternative to traditional or “gray” stormwater infrastructure [1]. Where possible, additional benefits beyond the realm of stormwater management were also outlined in the paper, nonetheless.
Urban storm runoff, if not properly managed, can affect the physical, chemical, and biological conditions of downstream water bodies [3], leading to flooding, stream bank erosion, and water quality problems [1,2,3,5,6]. Excess wet weather flows into storm drains and can readily lead to combined sewer overflow events (CSOs) [6], which discharge millions of tons of untreated wastewater into creeks, lakes, and rivers, causing impairment of these water bodies with detrimental effects on human, plant, or animal health [7,8].
Urban stormwater management has previously been handled with the use of end-of-pipe techniques that carry storm runoff away from buildings and communities as fast as possible through a network of pipes, tunnels, and ditches [9,10,11,12,13]. This practice, known as traditional or conventional stormwater conveyance systems or gray infrastructure, does not necessarily support infiltration, groundwater recharge, and protection of downstream water quality [9,14]. Unlike gray infrastructure, GI refers to “natural or semi-natural networks of green (soil covered or vegetated) and blue (water-covered) spaces and corridors that maintain and enhance ecosystem services” [15,16]. This means that the concept of GI draws from nature to support sustainable stormwater management with a wide variety of environmental, social, and economic benefits to the community [10,17].
Green infrastructure adoption may be cost effective in operation and maintenance (e.g., controlling Combined Sewer Overflow (CSO) volumes at lower costs) compared to that of gray infrastructure [18], and research indicated that shifting from gray to GI could result in perceptible social and economic benefits, creating opportunities for savings on stormwater management costs and improving community livability [5,19,20,21]. In recent years, GI adoption in urban planning has increasingly gained popularity in metropolitan areas to minimize CSO events, protect water quality, and improve sustainability of communities. While the environmental benefits of GI implementation have been largely documented (e.g., [22,23,24,25]), relatively limited quantitative information exists about the socioeconomic benefits associated with GI practices, let alone the methods for quantifying their socioeconomic benefits. Thus, a synthesis of GI adoption plans is a necessary step for exploring the potential social and economic benefits that can be derived from GI adoption as an established approach to building resilient communities. The specific objectives of this study were to (1) summarize socioeconomic benefits attributed to GI adoption in 16 cities, and (2) document the methods used to estimate these benefits.
2. Methodology
This study was driven by the needs of a stakeholder who was interested in GI planning and programs from United States metro areas of the size (i.e., population-based) of the City of St. Louis, Missouri, with the objective to understand the short-term and long-term returns of incorporating GI practices in city planning. The population of St. Louis was used as a selection criterion of the cities examined in this study. St. Louis is approximately 21,900 km2 and home to 320,000 inhabitants according to the 2010 United States Census data [26]. The St. Louis Metropolitan Sewer District (MSD) is the nation’s fourth largest sewer system, covering 525 square miles with 9600 square miles of sanitation and stormwater systems. Sixteen metro areas with GI adoption programs were selected for the study (Table 1). The cities were selected such that all the major cities in United States are somehow represented. An additional five cities were selected from outside the United States to gain a worldwide perspective.
A review of technical and case study reports, unpublished reports, project summaries, fact sheets, government publications, conference proceedings, and compilation of documents through web search engines and library resources was conducted for the 16 cities. It should be noted that no formal survey was conducted with city officials for this study. The information collected for each of the 16 metro areas include, among others, stormwater billing systems, stormwater policy and/or regulations for protecting green space, incentives provided to citizens for adoption GI practices, status (i.e., active or inactive) of long-term GI adoption plans, agencies responsible for implementation of GI projects, social and economic benefits gained from GI adoption, and analyses/methods conducted to estimate the benefits. Information on the St. Louis’ GI adoption plan was not included in the study, mainly because the plan was at its developmental stage with pilot-scale initiatives and limited quantified outputs at the time of this study.
3. Long-term GI Adoption Plans Reviewed
3.1. Overview of Long-Term GI Plans Reviewed
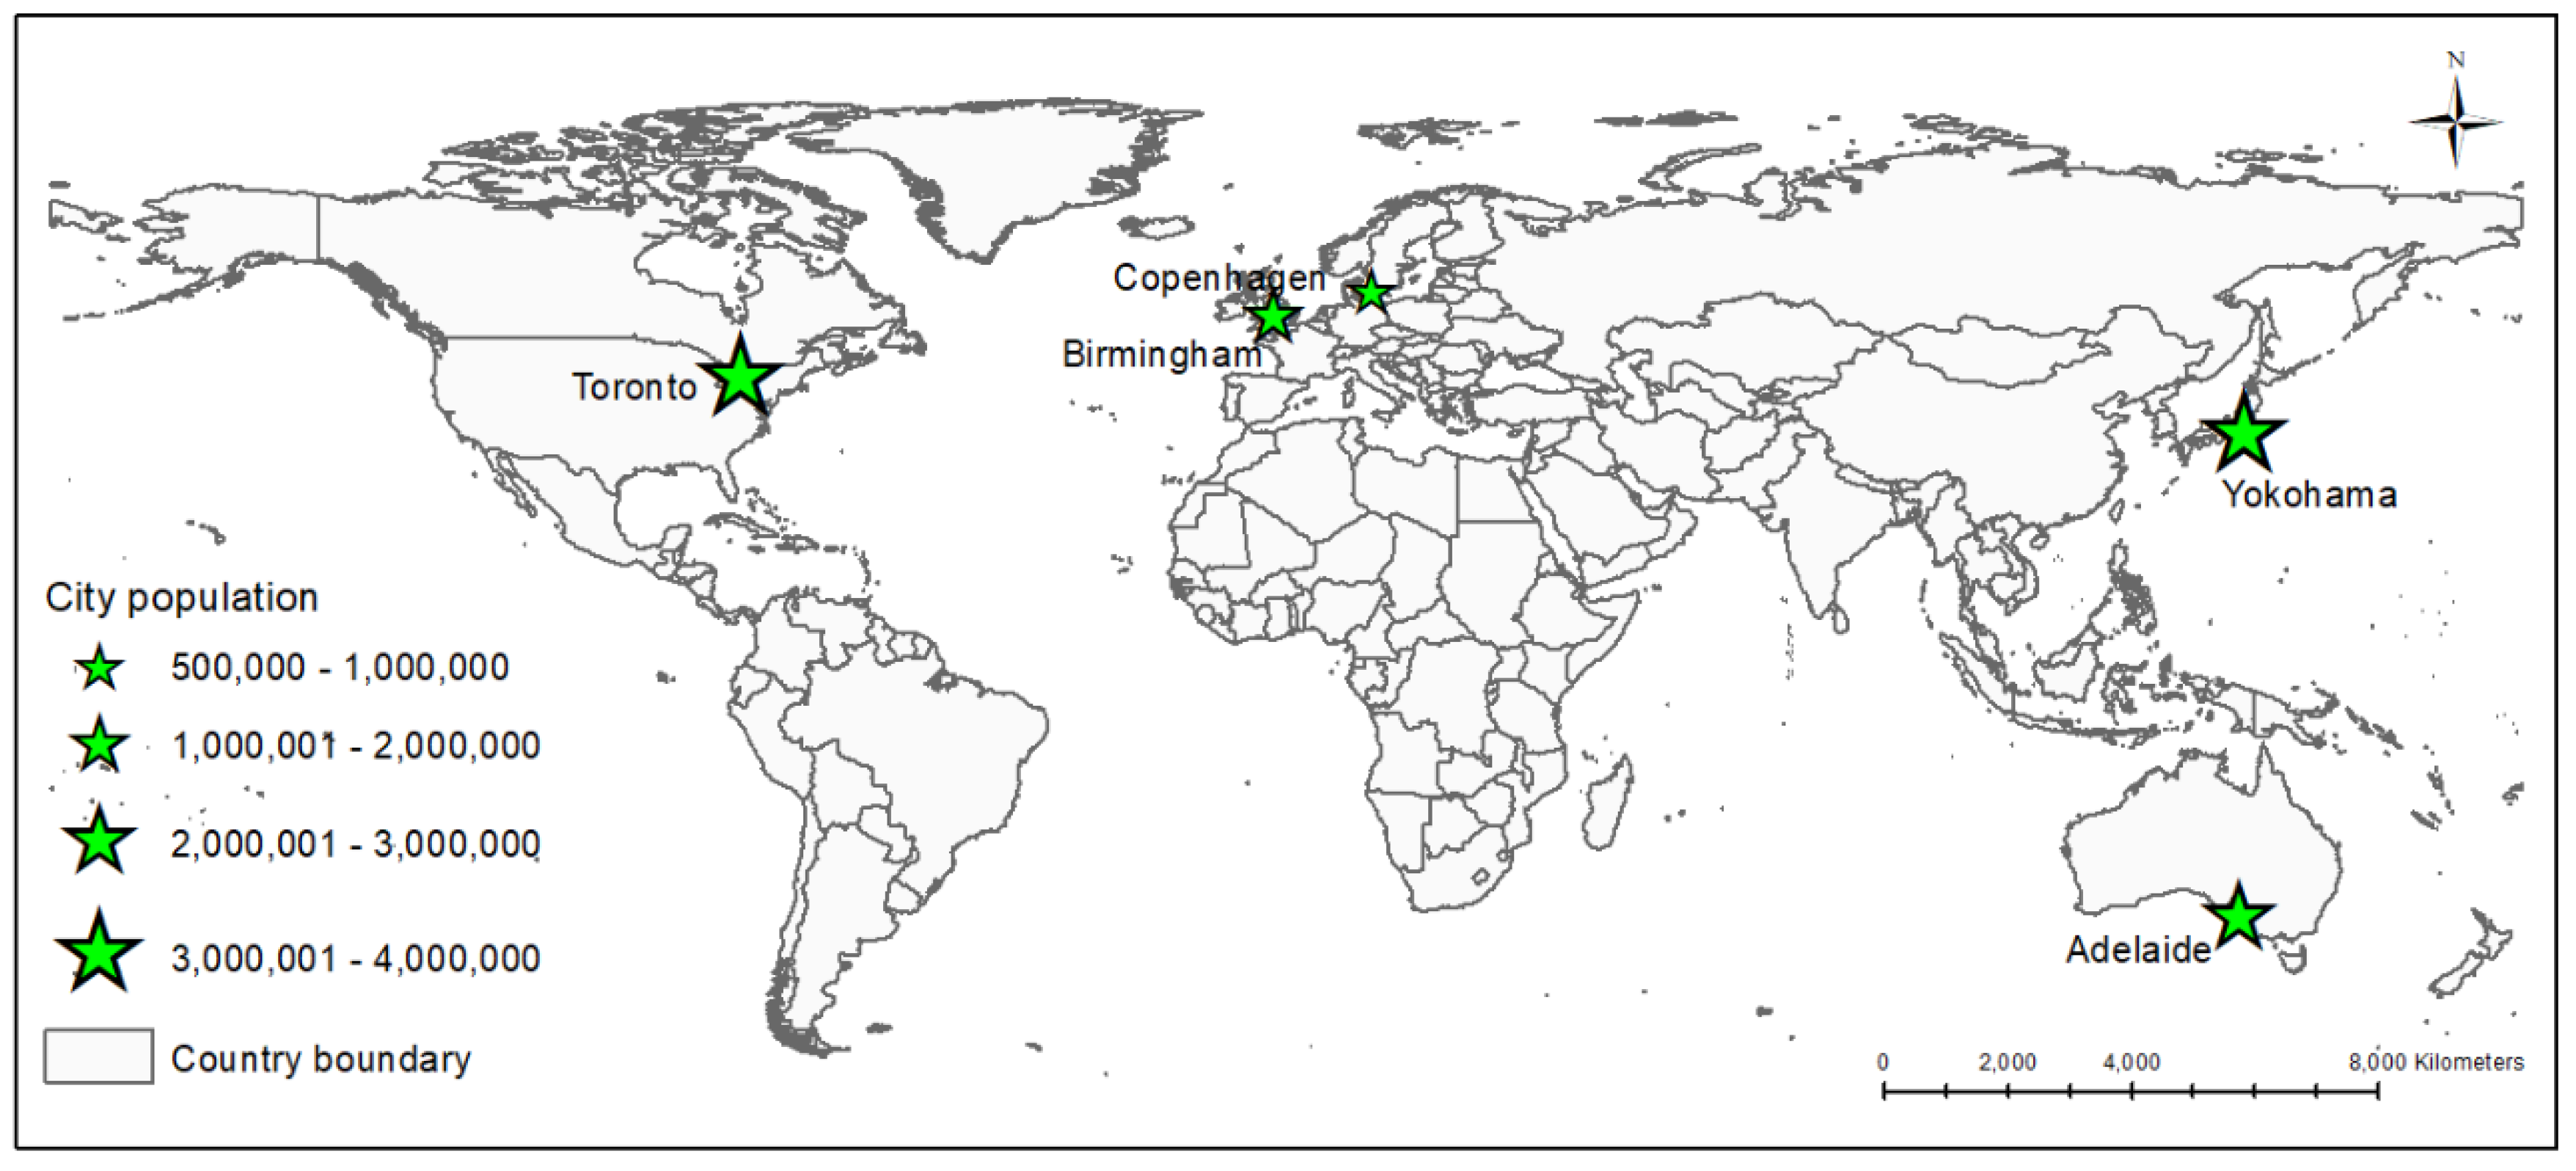
The metro population served by the 16 GI adoption plans reviewed in this study range from 1.5 million (Milwaukee Metropolitan Area) to 35 million (Greater Tokyo Area) inhabitants, with land areas covering 3000 km2 for Copenhagen to 1,200,000 km2 for Adelaide (Table 1, Figure 1 and Figure 2). The population data were based on the information available during the time of this study, indicating that changes in the population size at publication of this document may not be herein reflected.
Among the cities reviewed within the United States, Chicago, Austin, Kansas City, Los Angeles, and Seattle did not have long-term GI adoption planning; however, they had various programs that support implementation of GI practices. For example, in October 2013, the mayor of Chicago announced the “Green Stormwater Infrastructure Strategy” with the goal of reducing basement flooding and CSO in the city [27]. Similarly, the City of Austin adopted a number of initiatives such as “The Green Alley Initiative” and “Green Roof Program” to support green stormwater management practices. The goals of these initiatives were to improve water quality by reducing flooding and erosion and decrease landscape irrigation with the use of potable water in Austin [28]. In Los Angeles, a number of GI adoption pilot programs, consisting of “Green Streets Program”, “Downspout Disconnection Program”, “Stormwater Program”, and “Million Trees Los Angeles Initiative” were put in place to encourage implementation of GI practices in the city for capturing precipitation and urban runoff, as well as increasing groundwater recharge and water reuse [29]. Kansas City also planned to reduce discharge of CSO events using both green and gray infrastructure by five billion gallons per year by 2025, with an estimated cost of $2.5 billion as part of the 2010 consent decree with the United States Environmental Protection Agency [27]. The city planned to install 130 individual GI units in a 100-acre portion of the Marlborough neighborhood with the pilot project baptized as the “Middle Blue River Basin Green Solutions Pilot Project” [30]. Seattle’s “Comprehensive Drainage Plan” aimed at promoting adoption of GI practices to protect aquatic biota and creek channels, improve water quality, and reduce the volume of storm runoff [27].
Other United States’ cities such as Cleveland, Milwaukee, Nashville, New York, Philadelphia, and Portland have long-term GI adoption plans that were at the implementation phase at the time of this synthesis. Cleveland’s GI plan, titled “Project Clean Lake Green Infrastructure Plan”, is a long-term (2012–2023) GI plan overseen by the Northeast Ohio Regional Sewer District (NEORSD) with an estimated cost of USD 42 million to reduce CSOs. The city of Milwaukee, known for its brewing traditions, initiated the “Regional Green Infrastructure Plan” with a 2035 vision of having zero basement backups, zero CSOs, and clean water resources. Projected over 22 years (2013–2035), this plan has an estimated cost of USD 1.3 billion for full implementation. The associated website “H2OCapture.com” was designed to educate and engage the public in GI principles and the plan [19,31]. The “Green Infrastructure Master Plan” of Nashville was finalized and approved in fall 2009 to install GI practices within the city’s 32 km2 of combined sewer system (CSS) area for reducing storm runoff inflows to the CSSs [32]. New York City’s “NYC Green Infrastructure Plan” was initiated to improve the quality of life over a timeframe of 20 years (2010–2030), with an estimated cost of USD 1.6 billion by using decentralized stormwater retention and detention measures for treating runoff from 10% of impervious surfaces in the combined sewer watersheds (DEP 2010). The 25-year (June 2011–June 2036) “Green City, Clean Waters Program” of Philadelphia was implemented with USD 1.67 billion to improve the quality of life for residents and visitors (PWD 2009). Portland, the City of Roses, also launched a 5-year plan in 2008 called “Gray to Green (G2G) Initiative” with USD 50 million to encourage GI adoption for reducing CSO, basement flooding, and peak flow events while and protecting downstream water bodies [20].
Birmingham (UK) established “Parks and Open Space Strategy” for protecting parks and open spaces through careful planning, design, management, and maintenance of these spaces in the city from 2006 to 2021 [33]. In addition, the city assured that nature resources are protected and accessible to future generations under the umbrella of “Nature Conservation Strategy” [34]. The “Green Living Spaces Plan” of Birmingham is intended to help preserve and enhance networks of green space across the city. The plan supports the existing “Parks and Open Space Strategy” and “Nature Conservation Strategy”, aiming at making a healthy city through effective long-term maintenance of natural green spaces and water bodies [35]. In Toronto, the Water Infrastructure Management section of the Toronto Water Division launched a 25-year (2003–2028) stormwater plan with USD 1 billion named “Wet Weather Flow Master Plan”. This is a comprehensive strategy to deal with surface water quantity and quality, sewage overflows, habitat protection, and stormwater management at the source using both traditional and green stormwater control measures [27,36]. The city of Copenhagen uses various policies and plans that promote green space in the city. These plans include the “Five Finger Plan”, “Copenhagen Climate Change Adaptation Plan”, “Eco-metropolis”, and “Pocket Parks, Trees and Other Green Areas” and seek to ensure that people living in Copenhagen have access to open spaces, parks, and natural areas. The City of Yokohama with the “Yokohama Green-Up Plan”, “Climate Change Initiative”, and “Eco-City Initiative” aims at protecting green spaces in the city. The “Yokohama Green-Up Plan” is a multi-year plan initiated by the city in 2009 to preserve the city’s green space for future generations. In parallel, the “Climate Change Initiative” aims at conservation and creation of natural environment and green space, while the “Eco-City Initiative” would help rehabilitate green networks along the coast, enhance ecological sustainability of the city, and provide recreational opportunities to citizens. In Adelaide (Australia), “Sustainable Landscapes Project”, “30 Year Plan for Greater Adelaide”, “GI Project at the Botanic Gardens of Adelaide”, and “202020 Vision” were adopted for promoting GI practices in Adelaide so that people can live and thrive in a surrounding healthy and beautiful environment.
3.2. Methods Used to Quantify Socioeconomic Benefits of GI Adoption
Various analyses were conducted to evaluate the socioeconomic benefits associated with GI adoption for the 16 metro areas reviewed in this study (Table 1). As shown in Table 2, these evaluation methods include triple-bottom-line (TBL) analysis, cost–benefit analysis, life cycle assessment, cost effectiveness analysis, business case analysis, literature review, benefit or value transfer method, survey instrument, and computational modeling.
4. Social Benefits of GI
Research showed that implementation of GI practices could help improve existing built areas by converting them into greener environments, improving the quality of life through beautification of these locations, and creation of recreational opportunities that in turn would support reduction in crime rate and stress [19]. Increased physical activities have often been linked to access to safe and good quality green space [37]. Physical activities can help reduce obesity, enhance mental well-being, and increase social interaction and integration (HHS 2008, National Prevention Council 2011). Green space is particularly beneficial to individuals who are vulnerable to social exclusion [37]. The social benefits associated with the 16 GI plans reviewed in this study are discussed below.
4.1. Reduction of Urban Heat Island Effect and Heat Stress
In urban environments, buildings and pavement impervious surfaces such as concrete and asphalt, replace open land and vegetation, creating a different thermal bulk properties (i.e., heat capacity and thermal conductivity) and surface radiative properties of material surfaces in the built environment [38,39]. These surfaces absorb rather than reflect solar radiation, causing surface temperatures and overall ambient temperature to rise in urban areas compared to rural surroundings [38,39]. This creates an “island” of higher temperature in the urban landscape. Urban heat island could create health problems to residents as heat waves may lead to heat stroke and even death [40]. Due to heat island effects, central Los Angeles is typically 5°F warmer than the surrounding suburban areas during summer [29]. Implementation of GI practices (green roof, trees, green walls, and rain gardens) provide vegetative shade that can lower the temperature within buildings and the surrounding air temperature through evapotranspiration [39]. Green space helps to mitigate the effects of urban heat island by reducing heat stress, leading eventually to improvement in public health. The TBL analysis conducted in Philadelphia predicted a reduction in fatalities caused by excessive heat and heat stress over the next 40 years from the year 2009 [41]. Similarly, a study to evaluate the benefits and costs of green roof in the City of Toronto revealed that a widespread adoption of green roof in the city would help reduce the local ambient air temperature by a range of 0.5 °C to 2 °C [42]. The City of Adelaide also reported that GI adoption could help lower heat stress, heatstroke, and heat related death of residents (Ely and Pitman 2012). Chicago, Los Angeles, Austin, Milwaukee, and Seattle (Table 1) are also in the same mindset, reporting that GI adoption is a necessary step for reducing the effects of urban heat island (Table 3) [27,43].
4.2. Beautification of Existing Urban Areas
The lack of access to sufficient green space has been a major problem that communities generally face in urban areas. This may influence the physical and emotional health of urban dwellers [44]. Creation of new green spaces by incorporating GI practices in new developments and gentrification projects has been shown to improve community livability and provide opportunities to stay healthy through recreational activities [44]. The TBL analysis conducted by the City of Philadelphia estimated that in over 40 years the monetized present value of recreational benefits from GI adoption would amount to USD 520 million [45]. Milwaukee Metropolitan Sewer District (MMSD) also estimated that GI incorporation (green alleys and bioretention areas) in its combined sewer service areas could increase recreational areas by 275 acres. Predictions with benefit or value transfer method in Birmingham (United Kingdom) estimated the annual value of recreational benefits for GBP 7.4 million (USD 12.6 million) for expanding woodland and GBP 0.17 million (USD 0.3 million) for wetland, with an aesthetic appreciation of woodland estimated at GBP 8.6 million (USD 14.7 million) [21]. An analysis of the feedback from a survey instrument in the City of Adelaide allowed us to conclude that 47% and 42% of the 76 respondents strongly agreed that GI adoption would provide attractive living space through enhancement of the beauty of the surrounding environments and increase recreational opportunities, respectively [46].
4.3. Environmental Equity
Implementation of GI practices in minority and low-income neighborhoods could enhance access to green space, create hope, and improve community livability [20]. The case of GI adoption in socially disadvantaged and minority neighborhoods in Portland, Oregon, is an example [20]. Philadelphia and Cleveland have also reported similar environmental equity benefits derived from GI implementation for their neighborhoods under GI adoption plans (Table 3, [27,47]).
4.4. Creation of Green Jobs
The construction and maintenance of any infrastructure require a workforce. Green infrastructure also falls under this category and requires both skilled and unskilled labor for the construction and maintenance of the practices. The direct outcome for the need of a permanent workforce for GI projects is the creation of green jobs, which will ultimately lead to income generation in a number of households. Nearly 250 people could be employed in green jobs in Philadelphia annually [41], equating to an estimated present value of USD 125 million in savings of social assistance costs (i.e., food stamps and homeless expenditure) over a 40-year period [45]. In the same context, an annual reduction of USD 5.5 million in social assistance costs with a present worth of USD 68 million over a 20-year period was estimated for the City of Milwaukee with the creation of green jobs [48].
4.5. Improvement in Air Quality and Human Health
Vegetation improves air quality by filtering airborne pollutants and toxic gases such as and particulate matter (PM10) and ozone (O3) [22,49,50]. Reduction of energy consumption in buildings with the implementation of GI practices also improves air quality by decreasing emission of sulfur dioxide (SO2) and nitrogen dioxide (NO2) [22,45]. Improvement in air quality is directly associated with public health improvement (American Rivers 2012). If the City of Philadelphia’s GI plan is fully adopted, air quality would be improved in the city and the frequency and severity of respiratory illness would be reduced, corresponding to a USD 130 million present value of health benefits over a 40-year period [45]. In Portland, Oregon, 0.4 hectare of ecoroof was shown to remove approximately 4 kg of PM10 per year, 1 square meter of green street facility removes 18 g of PM10 annually, and one tree removes approximately 90 g of PM10 per year [20]. The trees planted in New York City are expected to reduce 129 tons of ozone, 63 tons of PM10, and 193 tons of NO2 per year [51]. In a similar study, Banting et al. (2005) reported that the economic value for reducing carbon monoxide (CO), NO2, O3, PM10, and SO2 using green roof in the City of Toronto, Canada, would be about USD 2 million per year [42].
4.6. Reduction in Flooding and Combined Sewer Overflow Events
In recent years, concerns over the increasing number of flood events have prompted interest in better management and reduction of flood risks in urban settings with adoption of GI practices. Urbanization generally intensifies flood risks through increased runoff rate and volume, decreased time of concentration, reduced water infiltration, and channel deformation [52,53]. In combined sewersheds, urbanization can lead to increased CSO events, resulting in impairment of downstream waters and deterioration of aquatic life [7]. Plant and tree stands could delay runoff velocity, reduce runoff volume, extend runoff time of concentration, and promote infiltration into the soil profile [54]. By promoting infiltration and evapotranspiration, GI practices help reduce flood risks and CSO events, while improving community livability. In addition, the pressure on sewer system during rain events is diminished when the volume of stormwater seeping into the sewer system is reduced. Research found that one million trees can capture 1.9 billion gallons of stormwater per year in LA area [29]. Green infrastructure plans in cities such as Chicago, Kansas City, Milwaukee, Nashville, New York City, Philadelphia, Portland, and Seattle are anticipated to help address flood and CSO issues (Table 3, [30,31,32,55]).
4.7. Reduction in Domestic Violence and Crime Rate
Even though the role of GI adoption in domestic and crime rate reduction is not well documented, it is generally accepted that GI practices could help reduce mental fatigue and stress, which in turn could be linked to reduction in domestic violence and crime rate. The reduction of crime rate associated with GI adoption could be explained by the fact that GI encourages walkability and outdoor activities, thus discouraging crimes by increasing the probability of crime watch. Cities such as Milwaukee, Nashville, and Copenhagen acknowledged the role of GI adoption in lowering crime rate and reinforce the sense of community through increased social interactions (Table 3, [32,48,56]). Well-maintained green areas are believed to be important for reducing mental fatigue, violent emotions in individuals, leading to reduction in crime rate and domestic violence in communities [20,57].
4.8. Other Social Benefits
Implementation of GI practices plays a major role in creating attractive streetscapes to enhance walkability and pedestrian environment and abate traffic noise in adjacent residential areas [29,43,57] (Table 3). Likewise, the quality of life translated in stress reduction as well as improvement in physical and mental health is highlighted with implementation of GI practices in Cleveland, Austin, Kansas City, Milwaukee, New York, Portland, Birmingham, Copenhagen, and Adelaide (Table 3). Planning for GI adoption would also provide space for urban agriculture and community gardens (Table 3, [42,57]).
5. Economic Benefits of GI
Green infrastructure provides multiple economic advantages. Adoption of GI practices was shown to add value to properties in Adelaide according to a survey instrument in which 33% of the respondents agreed to this with a mention of “very” (Table 4, [46]). The GI plans for the 16 cities reviewed allowed us to identify some of these economic benefits.
5.1. Green jobs
Philadelphia’s TBL analysis showed that GI adoption projects helped to create nearly 250 green jobs [41], estimated with a present value benefit of USD 125 million of saving on social costs over a 40-year period [45]. Similar predictions were made for GI implementation plans in Milwaukee, where the creation of green jobs would reduce social costs estimated at USD 5.5 million with a present worth of USD 68 million over a 20-year period (Table 4, [48]). It should be noted that green jobs are jobs that contribute to the preservation or restoration of environment quality.
5.2. Energy Savings
Implementation of GI practices in a watershed would result in reduction of runoff volume, leading to a decrease in energy costs for pumping and treating combined sewer systems [7]. In Philadelphia, the TBL analysis conducted for the GI adoption plan indicated that a net energy saving over a 40-year period in the city could approximate 370 million kWh (kilowatt hours) or USD 34 million in monetary value [45]. Model predictions for energy savings estimated an annual total energy saving of USD 3600 for the green roof implemented on the City Hall in Chicago [58]. Initiatives of ecoroof projects in the city of Portland would translate into more than 8270 kWh per acre per year, 155 kWh per year per green street facility, and more than 11 kWh per year per tree of energy savings [20]. A reduction of 1.8 million kWh of energy use over a 20-year period in the CSS area was estimated for Milwaukee, resulting in USD 98,000 to USD 143,000 savings [48]. In New York City, shading from street trees provide approximately USD 27.8 million per year in energy savings (Table 4, [51]). Similarly, implementation of the Toronto green roof plan would result in USD 21 million per year savings (Table 4; [42]), and Birmingham in the United Kingdom could save USD 0.7 million (GBP 0.39 million) per year in energy costs for heathland areas (heathland refers to shrubland habitat, which usually grows on freely-drained infertile soils), and USD 0.8 million per year (GBP 0.48 million) for grassland areas (Table 4, [21]).
5.3. Property Values
Research showed that property values were higher in areas with trees and vegetation compared to similar areas without vegetation [59]. With the GI adoption planned for the city, greened neighborhoods, near park, and green areas would see 2% to 5% on average (Table 4, [41]). In Seattle, increases in the value of properties located in close proximity to green areas averaged 5% (Table 4, [55]). The value of homes located near green streets, swales, and other GI practices was projected to increase by 3% to 5% (Table 4; [20]). The CSS area of Milwaukee has also seen an increase of USD 68 million in property values [48]. A neighborhood garden implemented in New York City raised the surrounding property values by 9% within five years of the opening of the garden [51]. It is believed that implementation of GI practices has increased tourism and opportunities for business activities in Birmingham and Copenhagen (Table 4).
5.4. Infrastructure Capital and Sewer Treatment Costs
Implementation of porous pavement and green alleys in the CSS area in Milwaukee would result in 66 to 77% reduction per stormwater unit storage cost, which will ultimately lead to a saving for constructing stormwater infrastructure (Table 4, [48]). In Toronto, downspout disconnection saved about USD 140 million in stormwater infrastructure costs between 1998 and 2011 (Table 4, [27], and approximately USD 279 million in municipal infrastructure capital costs could also be saved with implementation of green roofs [27]. There was an estimated reduction in stormwater pumping costs from deep tunnels with the implementation of GI practices in Milwaukee and New York City (Table 4), leading to increases in public and private infrastructure life span in Austin, Portland, and Adelaide (Table 4). Green infrastructure adoption plans for the cities of Nashville, Philadelphia, and Portland also highlighted reductions in their stormwater fees (Table 4). In Copenhagen and Adelaide, GI adoption is held in high regards with respect to urban agriculture, which in turn help reduce food bills (Table 4).
5.5. Flood Events and Associated Costs
6. Conclusions
This work focused on social and economic benefits gained from GI adoption implementation in 12 cities of the United States, Copenhagen, Adelaide, Toronto, and Tokyo. The evaluation methods used to quantify GI adoption benefits as reported by the city programs include TBL analysis, cost–benefit analysis, life cycle assessment, cost effectiveness analysis, business case analysis, literature review, benefit or value transfer method, survey instrument, and computational modeling.
On the basis of the review and program examined, we found that GI adoption could help lower heat stress, heatstroke, and heat-related death of residents. Creation of new green spaces, by incorporating GI practices, has been shown to improve community livability and provide opportunities to stay healthy through recreational activities. The direct outcome for the need of a permanent workforce for GI projects is the creation of green jobs, which would ultimately lead to income generation in a number of households. Vegetation improves air quality by filtering airborne pollutants and toxic gases such as particulate matter and ozone. Reduction of energy consumption in buildings with the implementation of GI practices also improves air quality by decreasing emission of sulfur dioxide and nitrogen dioxide. GI encourages walkability and outdoor activities, thus discouraging crimes by increasing the probability of crime watch.
The economic benefits from GI adoption have been estimated in millions of dollars. Implementation of GI practices in a watershed would result in reduction of runoff volume, leading to a decrease in energy costs for pumping and treating combined sewer systems. This analysis also showed that property values were higher in areas with trees and vegetation compared to similar areas without vegetation.
Author Contributions
R.S. conducted this study as part of his graduate research activities under the guidance of Laurent Ahiablame in collaboration with the St. Louis Metropolitan Sewer District. R.S. wrote the initial draft of the manuscript. L.A. supervised and guided this work. L.A. edited and improved the manuscript. All authors have read and agreed to the published version of the manuscript.
Funding
The authors are grateful for the financial support from the St. Louis Metropolitan Sewer District.
Informed Consent Statement
Not applicable.
Data Availability Statement
No new data were created or analyzed in this study. Data sharing is not applicable to this article.
Acknowledgments
The views and opinions of authors expressed herein do not state or reflect those of their employers and the St. Louis Metropolitan Sewer District. Thanks to Jianpeng “Jim” Zhou and Susan Morgan for their support throughout this project.
Conflicts of Interest
The authors declare no conflict of interest.
References
- Ahiablame, L.M.; Engel, B.A.; Chaubey, I. Effectiveness of low impact development practices: Literature review and suggestions for future research. Water Air Soil Pollut. 2012, 223, 4253–4273. [Google Scholar] [CrossRef]
- USEPA (United States Environmental Protection Agency). Benefits of Green Infrastructure; USEPA: Washington, DC, USA, 2021. [Google Scholar]
- European Commission; Expert Group on the Urban Environment. European Sustainable Cities; Nuclear Safety and Civil Protection: Brussels, Belgium, 1996. [Google Scholar]
- Chen, Y.; Whalley, A. Green infrastructure: The effects of urban rail transit on air quality. Am. Econ. J. Econ. Policy 2021, 4, 58–97. [Google Scholar] [CrossRef] [Green Version]
- CH2MHILL. Lancaster’s Green Infrastructure Plan; CH2M Hill Inc.: City of Lancaster, PA, USA, 2011. [Google Scholar]
- USEPA (US Environmental Protection Agency). Combined Sewer Overflow Management Fact Sheet. Sewer Separation; EPA-832-F-99-041; Office of Water: Washington, DC, USA, 1999. [Google Scholar]
- Buckley, M.; Souchlas, T.; Odefey, J.; Detwiler, S.; Rousseau, K.; Trice, A.; Blackwell, R.; O’Hara, K.; Brown, S.; Raviprakash, P. Banking on Green: A look at How Green Infrastructure Can Save Municipalities Money and Provide Economic Benefits Community-Wide; American Rivers, the Water Environment Federation, the American Society of Landscape Architects and ECONorthwest: Washington, DC, USA, 2012. [Google Scholar]
- Phillips, P.; Chalmers, A.; Gray, J.; Kolpin, D.; Foreman, W.; Wall, G. Combined sewer overflows: An environmental source of hormones and wastewater micropollutants. Environ. Sci. Technol. 2012, 46, 5336–5343. [Google Scholar] [CrossRef] [PubMed]
- CEI (Comprehensive Environmental Inc.). New Hampshire Stormwater Manual. In Stormwater and Antidegradation; WD-08-20A; Comprehensive Environmental Inc. & New Hampshire Department of Environmental Services: Concord, NH, USA, 2008; Volume 1. [Google Scholar]
- Davis, A.P. Green Engineering Principles Promote Low-Impact Development; ACS Publications: Washington, DC, USA, 2005. [Google Scholar]
- DoD (Department of Defense). The Low Impact Development Manual; UFC-3-210-10; Department of Defense: Fort Meade, MD, USA, 2004. [Google Scholar]
- PGCo (Prince George’s County). Low-Impact Development Design Manual; Department of Environmental Resources, Prince George’s County: Largo, MD, USA, 1999. [Google Scholar]
- Pauleit, S.; Ambrose-Oji, B.; Andersson, E.; Anton, B.; Buijs, A.; Haase, D.; Elands, B.; Hansen, R.; Kowarik, I.; Kronenberg, J.; et al. Advancing Urban Green Infrastructure in Europe: Outcomes and Reflections from the GREEN SURGE Project. Urban For. Urban Green. 2019, 40, 4–16. [Google Scholar] [CrossRef]
- USEPA (US Environmental Protection Agency). Low Impact Development (LID): A Literature Review; EPA-841-B-00-005; Office of Water: Washington, DC, USA, 2000. [Google Scholar]
- Naumann, S.; Davis, M.; Kaphengst, T.; Pieterse, M.; Rayment, M. Design, implementation and cost elements of Green Infrastructure projects. Final Rep. Eur. Comm. Bruss. 2011, 138. Contract no. 070307/2010/577182/ETU/F.1, Ecologic institute and GHK Consulting. [Google Scholar]
- Jones, S.; Somper, C. The role of green infrastructure in climate change adaptation in London. Geogr. J. 2014, 180, 191–196. [Google Scholar] [CrossRef]
- Davis, A.P.; Hunt, W.F.; Traver, R.G.; Clar, M. Bioretention technology: Overview of current practice and future needs. J. Environ. Eng. 2009, 135, 109–117. [Google Scholar] [CrossRef]
- MacMullan, E.; Reich, S. The Economics of Low-Impact Development: A Literature Review; ECONorthwest: Eugene, OR, USA, 2007. [Google Scholar]
- CH2MHILL. Milwaukee Metropolitan Sewer District Regional Green Infrastructure Plan; Milwaukee Metropolitan Sewer District: Milwaukee, WI, USA, 2013. [Google Scholar]
- ENTRIX. Inc. Portland’s Green Infrastructure: Quantifying the Health, Energy, and Community Livability Benefits; City of Portland Bureau of Environmental Services: Portland, OR, USA, 2010. [Google Scholar]
- Hölzinger, O. The Value of Green Infrastructure in Birmingham and the Black Country—The Total Economic Value of Ecosystem Services Provided by the Urban Green Infrastructure; Wildlife Trust for Birmingham and the Black Country: Birmingham, UK, 2011. [Google Scholar]
- Wang, Y.; Bakker, F.; De Groot, R.; Wörtche, H. Effect of ecosystem services provided by urban green infrastructure on indoor environment: A literature review. Build. Environ. 2014, 77, 88–100. [Google Scholar] [CrossRef]
- Vogel, J.R.; Moore, T.L.; Coffman, R.R.; Rodie, S.N.; Hutchinson, S.L.; McDonough, K.R.; McLemore, A.J.; McMaine, J.T. Critical review of technical questions facing low impact development and green infrastructure: A perspective from the Great Plains. Water Environ. Res. 2015, 87, 849–862. [Google Scholar] [CrossRef] [PubMed]
- Tzoulas, K.; Korpela, K.; Venn, S.; Yli-Pelkonen, V.; Kaźmierczak, A.; Niemela, J.; James, P. Promoting ecosystem and human health in urban areas using Green Infrastructure: A literature review. Landsc. Urban Plan. 2007, 81, 167–178. [Google Scholar] [CrossRef] [Green Version]
- Planning for Green Infrastructure: The Spatial Effects of Parks, Forests, and Fields on Helsinki’s Apartment Prices. Ecol. Econ. 2017, 132, 279–289. [CrossRef] [Green Version]
- USCensus. US Census, Census Interactive Population Search. 2010. Available online: http://www.census.gov/2010census/popmap/ipmtext.php?fl=29 (accessed on 6 October 2014).
- Garrison, N.; Hobbs, K. Rooftops to Rivers II: Green Strategies for Controlling Stormwater and Combined Sewer Overflows; Natural Resources Defense Council: New York, NY, USA, 2011. [Google Scholar]
- USEPA (US Environmental Protection Agency). Green Infrastructure Program Community Partner Profiles—Region 6; US Environmental Protection Agency: Austin, TX, USA, 2011. Available online: http://water.epa.gov/infrastructure/greeninfrastructure/upload/Region-6.pdf (accessed on 28 April 2014).
- Chau, H.-F. Green Infrastructure for Los Angeles: Addressing Urban Runoff and Water Supply through Low Impact Development. 2009. Available online: http://environmentla.org/pdf/LID-Paper_4-1-09_530pm.pdf (accessed on 15 December 2014).
- KCWater. Services. Kansas City’s Overflow Control Program: Middle Blue River Basin Green Solutions Pilot Project Final Report; Kansas City Water Services: Kansas City, MO, USA, 2013. [Google Scholar]
- Civic and Federation. Managing Urban Stormwater with Green Infrastructure: Case Studies of Five U.S. Local Governments, Managing Urban Stormwater with Green Infrastructure: Case Studies of Five US Local Governments; The Center for Neighborhood Technology: Chicago, IL, USA, 2007. [Google Scholar]
- MWS. (Metro Water Services). Metropolitan Government of Nashville and Davidson County Green Infrastructure Master Plan; Metro Water Services: Nashville, TN, USA, 2009. [Google Scholar]
- BCC (Birmingham City Council). The Birmingham Plan: The Future of Birmingham’s Parks and Open Spaces; Birmingham City Council: Birmingham, UK, 2006. [Google Scholar]
- BCC (Birmingham City Council). Nature Conservation Strategy for Birmingham; Birmingham City Council: Birmingham, UK, 1997. [Google Scholar]
- BCC (Birmingham City Council). Making Birmingham Green: Green Living Spaces Plan. Development Directorate; Birmingham City Council: Birmingham, UK, 2013. [Google Scholar]
- Bowering, T.; Li, A. Wet Weather Flow Management Guidelines; Toronto Water Infrastructure Management: Toronto, TO, Canada, 2006. [Google Scholar]
- Atkinson, G.; Brunt, A.; Bryant, R.; Doick, K.; Lawrence, V. Benefits of Green Infrastructure, Report to DEFRA and CLG; contract no. WC0807; Forest Research: Farnham, UK, 2010. [Google Scholar]
- Arrau, C.P.; Peña, M.A. The Urban Heat Island (UHI) Effect. 2011. Available online: http://www.urbanheatislands.com/ (accessed on 20 April 2014).
- Killingsworth, B.; Lemay, L.; Peng, T. The Urban Heat Island Effect and Concrete’s Role in Mitigation. 2011. Available online: http://www.nrmca.org/members/ConcreteInFocus/Enviro%20Library/NRC-S0511_urban.pdf (accessed on 20 July 2014).
- USEPA (US Environmental Protection Agency). Cooling Summertime Temperatures: Strategies to Reduce Urban Heat Islands; Publication Number: 430-F-03-014; United States Environmental Protection Agency: Washington, DC, USA, 2003. [Google Scholar]
- PWD. Green City Clean Waters: The City of Philadelphia’s Program for Combined Sewer Overflow Control—A Long Term Control Plan Update, Summary Report; Philadelphia Water Department: Philadelphia, PA, USA, 2009. [Google Scholar]
- Banting, D.; Doshi, H.; Li, J.; Missios, P.; Au, A.; Currie, B.A.; Verrati, M. Report on the Environmental Benefits and Costs of Green Roof Technology for the City of Toronto; City of Toronto and Ontario Centres of Excellence—Earth and Environmental Technologies; Department of Architectural Science, Ryerson University: Toronto, ON, Canada, 2005. [Google Scholar]
- USEPA (US Environmental Protection Agency). Green Infrastructure Case Studies: Municipal Policies for Managing Stormwater with Green Infrastructure; EPA-841-F-10-004; Office of Wetlands, Oceans and Watersheds: Washington, DC, USA, 2010. [Google Scholar]
- Wolch, J.R.; Byrne, J.; Newell, J.P. Urban green space, public health, and environmental justice: The challenge of making cities ‘just green enough’. Landsc. Urban Plan. 2014, 125, 234–244. [Google Scholar] [CrossRef] [Green Version]
- Stratus and Consulting Inc. A Triple Bottom Line Assessment of Traditional and Green Infrastructure Options for Controlling CSO Events in Philadelphia’s Watersheds; City of Philadelphia Water Department: Philadelphia, PA, USA, 2008. [Google Scholar]
- Sustainable and Focus. Green Infrastructure Survey Prepared for the Botanic Gardens of Adelaide; Sustainable Focus Pty Ltd.: Adelaide, SA, Australia, 2013. [Google Scholar]
- NEORSD (Northeast Ohio Regional Sewer District). Project Clean Lake Green Infrastructure Plan; Northeast Ohio Regional Sewer District: Cleveland, OH, USA, 2012. [Google Scholar]
- MMSD (Milwaukee Metropolitan Sewerage District). Determining the Potential of Green Infrastructure to Reduce Overflows in Milwaukee; Milwaukee Metropolitan Sewer District: Milwaukee, WI, USA, 2011. [Google Scholar]
- Nowak, D.J. The Effects of Urban Trees on Air Quality; USDA Forest Service: Washington, DC, USA, 2002; pp. 96–102. [Google Scholar]
- Yang, J.; McBride, J.; Zhou, J.; Sun, Z. The urban forest in Beijing and its role in air pollution reduction. Urban For. Urban Green. 2005, 3, 65–78. [Google Scholar] [CrossRef]
- DEP (Department of Environmental Protection). NYC Green Infrastructure Plan: A Sustainable Strategy for Clean Waterways; Department of Environmental Protection: New York, NY, USA, 2010. [Google Scholar]
- O’Driscoll, M.; Clinton, S.; Jefferson, A.; Manda, A.; McMillan, S. Urbanization effects on watershed hydrology and in-stream processes in the southern United States. Water 2010, 2, 605–648. [Google Scholar] [CrossRef]
- Stefan, H.G.; Erickson, T.O. Groundwater Recharge in a Coldwater Stream Watershed during Urbanization. In Minnesota Pollution Control AGENCY, Report 524; Minnesota Pollution Control Agency: St. Paul, MN, USA, 2009. [Google Scholar]
- Podolsky, L.; MacDonald, E. Green Cities Great Lakes: Using Green Infrastructure to Reduce Combined Sewer Overflows; EcoJustice: Toronto, TO, Canada, 2008. [Google Scholar]
- USEPA. (US Environmental Protection Agency). Case Studies Analyzing the Economic Benefits of Low Impact Development and Green Infrastructure Programs; US Environmental Protection Agency: Washington, DC, USA, 2013. [Google Scholar]
- Surma, M. Green Infrastructure Planning as a part of Sustainable Urban Development–case studies of Copenhagen and Wroclaw. Proc. Latv. Univ. Agric. 2013, 3, 22–32. [Google Scholar]
- Ely, M.; Pitman, S. Green infrastructure. Life support for human habitats. The compelling evidence for incorporating nature into urban environments. Green Infrastruct. Evid. Base 2014, 380. [Google Scholar]
- Peck, S. Green roofs: Infrastructure for the 21st century: Exploiting the last urban frontier. Interface J. Roof Consult. Inst. 2001, 27, 8–12. [Google Scholar]
- Hastie, C. The Benefits of Urban Trees: A Summary of the Benefits of Urban Trees Accompanied by a Selection of Research Papers and Pamphlets; Warwick District Council: Warwick, UK, 2003. [Google Scholar]
Figure 1.
Map showing cities with GI adoption plans in the United States examined in this study.
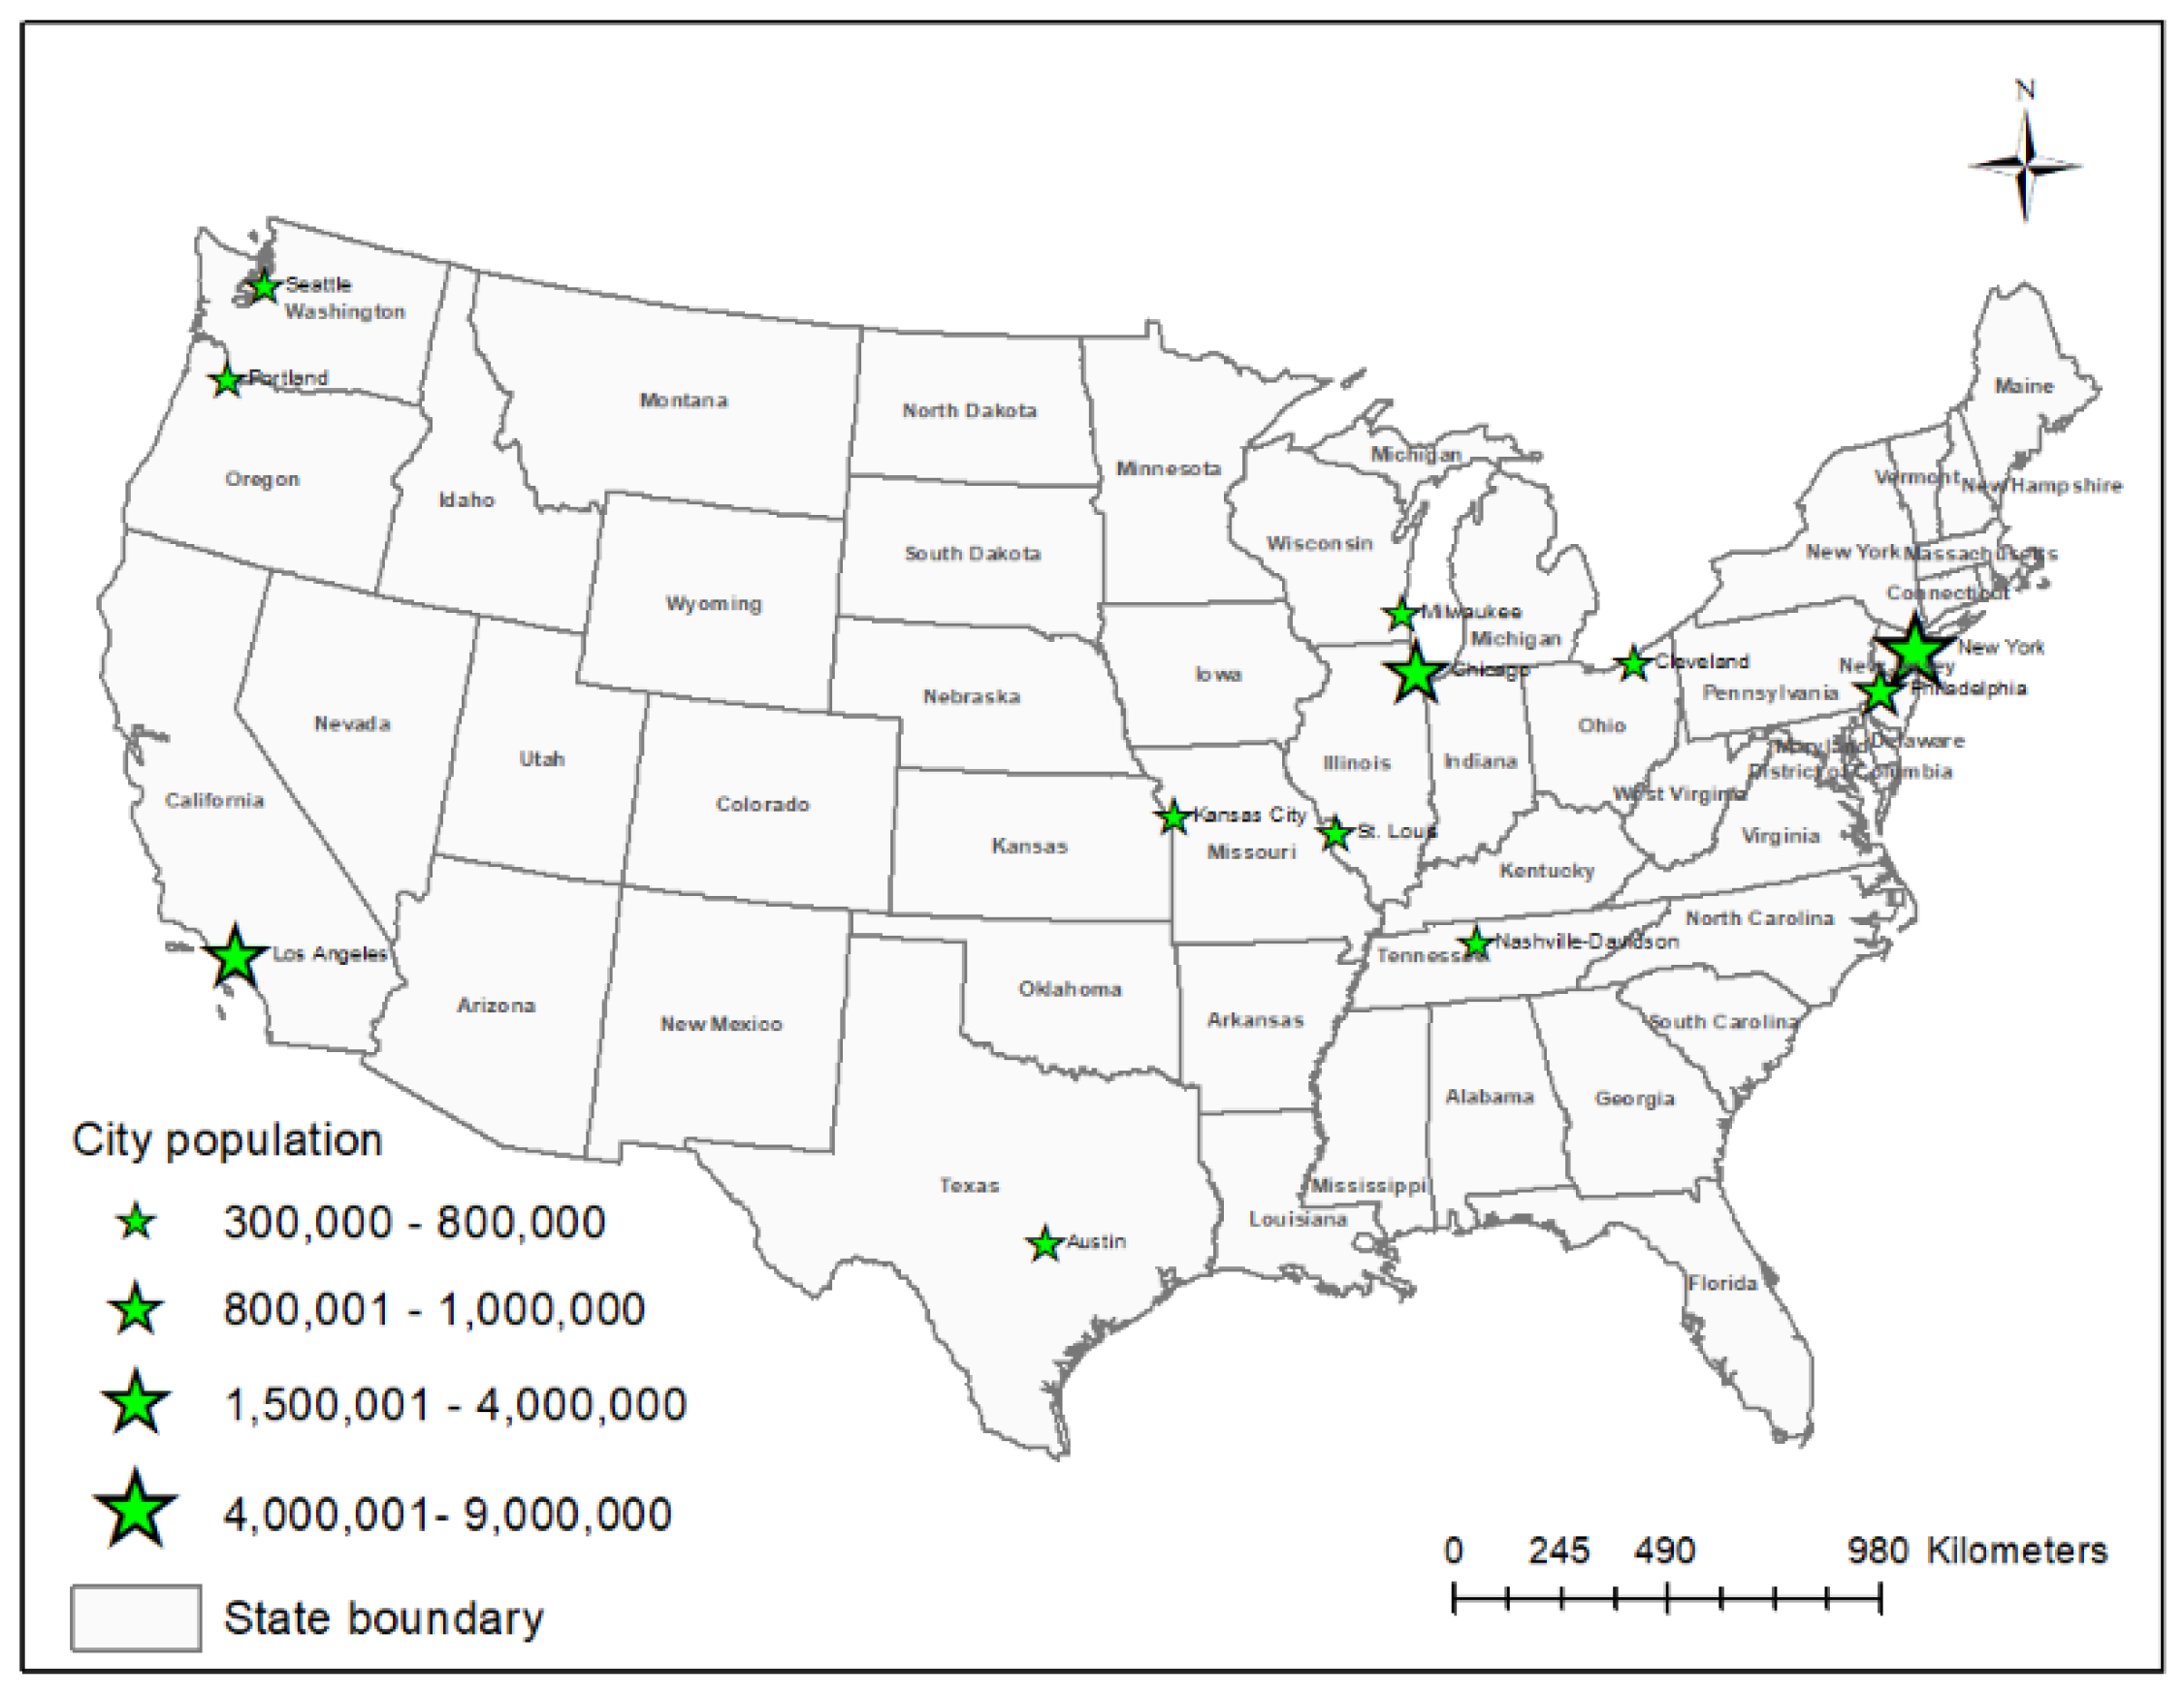
Figure 2.
Map showing world cities with GI adoption plans examined in this study.

Table 1.
Description of cities and GI adoption plans examined in this study.
| Metropolis | State/Country | Population Size * | Area, sq.km (sq. mi.) * | Rank 1 | City of Interest | Name of GI Program/Plan | Implementation Period |
|---|---|---|---|---|---|---|---|
| Chicago metropolitan area | Illinois, USA | 9,461,105 | 28,160 (10,874) | 3 | Chicago | Green Stormwater Infrastructure Strategy | 2013–2018 |
| Cleveland metropolitan area | Ohio, USA | 2,068,283 | 5173 (1997) | 28 | Cleveland | Project Clean Lake Green Infrastructure Plan | 2012–2023 |
| Greater Austin | Texas, USA | 1,716,289 | 11,100 (4286) | 35 | Austin | Green Roof Program Green Alley Initiative | 2010–2015 - |
| Kansas City metropolitan area | Missouri, USA | 2,009,342 | 20,596 (7952) | 30 | Kansas City, Missouri | Middle Blue River Basin Green Solutions Pilot Project | 2011–2017 |
| Los Angeles metropolitan area | California, USA | 12,828,837 | 12,520 (4850) | 2 | Los Angeles | Green Streets LA program Los Angeles Downspout Disconnection Program City of Los Angeles Stormwater Program Million Trees LA Initiative | - Initiated in 2008 - Started in 2007 |
| Milwaukee metropolitan area | Wisconsin, USA | 1,555,908 | 3781 (1460) | 33 | Milwaukee | Regional Green Infrastructure Plan | 2013–2035 |
| Nashville metropolitan area | Tennessee, USA | 1,670,890 | 16,520 (7484) | 35 | Nashville | Green Infrastructure Master Plan | Approved in 2009 |
| New York metropolitan area | New York, USA | 19,567,410 | 34,490 (13,318) | 1 | New York City | NYC Green Infrastructure Plan | 2010–2030 |
| Philadelphia metropolitan area | Pennsylvania, USA | 5,965,343 | 11,989 (4629) | 7 | Philadelphia | Green City, Clean Waters Program | 2011–2036 |
| Portland metropolitan area | Oregon, USA | 2,226,009 | 17,310 (6684) | 19 | Portland | Gray to Green (G2G) Initiative | 2008–2013 |
| Seattle metropolitan area | Washington, USA | 3,439,809 | 21,202 (8186) | 13 | Seattle | Comprehensive Drainage Plan | Started in 1999 |
| Birmingham metropolitan area | United Kingdom | 3,701,107 | - | - | Birmingham | Green Living Spaces Plan | Approved in 2013 |
| Copenhagen metropolitan area | Denmark | 1,969,941 | 3028 (1169) | - | Copenhagen | Five Finger Plan Copenhagen Climate Change Adaptation Plan Eco-metropolis Pocket Parks, Trees and Other Green Areas | - - 2007–2015 2009–2015 |
| Greater Tokyo area | Japan | 34,607,069 | 13,754 (5310) | - | Yokohama | Yokohama Green-Up Plan Climate Change Initiative Eco-city Initiative | 2009–2018 - - |
| Greater Toronto | Canada | 5,583,064 | 7125 (2751) | - | Toronto | Wet Weather Flow Master Plan | 2003–2028 |
| South Australia (Note: South Australia is a state in the southern central part of Australia) | Australia | 1,650,600 | 1,043,514 (402,903) | - | Adelaide | Sustainable Landscapes Project 30 Year Plan for Greater Adelaide Green Infrastructure Project at the Botanic Gardens of Adelaide 202020 vision | - 2010–2040 - 2013–2020 |
Notes: 1 On the basis of population (for U.S. municipalities only). * Source: United States Census Bureau, Office for National Statistics (UK), Statistics Denmark, Statistics Canada, Australian Bureau of Statistics, Wikipedia.
Table 2.
Summary of methods used to quantify social and economic benefits of GI adoption.
| Metropolis | City | Triple Bottom Line | Benefit-Cost | Life Cycle Assessment | Cost Effectiveness | Business Case Analysis | Simulation Modeling | Literature Review | Benefit or Value Transfer Approach | Questionnaire (Survey) |
|---|---|---|---|---|---|---|---|---|---|---|
| Chicago metropolitan area | Chicago | √ 1 | ||||||||
| Cleveland metropolitan area | Cleveland | √ 2 | √ | |||||||
| Greater Austin | Austin | √ | ||||||||
| Kansas City metropolitan area | Kansas City, Missouri | √ | ||||||||
| Los Angeles metropolitan area | Los Angeles | √ | ||||||||
| Milwaukee metropolitan area | Milwaukee | √ | √ 3 | |||||||
| Nashville metropolitan area | Nashville | √ | ||||||||
| New York metropolitan area | New York | √ | √ | |||||||
| Philadelphia metropolitan area | Philadelphia | √ | ||||||||
| Portland metropolitan area | Portland | √ | √ | √ 4 | √ | |||||
| Seattle metropolitan area | Seattle | √ | √ | √ | ||||||
| Birmingham metropolitan area | Birmingham | √ | ||||||||
| Copenhagen metropolitan area | Copenhagen | √ | ||||||||
| Greater Tokyo area | Yokohama | √ | ||||||||
| Greater Toronto | Toronto | √ | ||||||||
| South Australia | Adelaide | √ | √ |
Notes: 1 Bin-method energy model developed by American Society of Heating, Refrigerating and Air Conditioning Engineers (ASHRAE) was used by City Hall, Chicago, to estimate energy cost savings due to cooling effect of green roof. 2 IMPLAN (IMpact Analysis for PLANning) model was used to determine the economic impact due to maintenance spending on GIs. 3 Milwaukee Metropolitan Sewerage District (MMSD) applied the System for Urban Stormwater Treatment and Analysis Integration (SUSTAIN) model to identify the most cost-effective set of LID/GI practices in terms of runoff volume reduction. 4 UFORE (Urban Forest Effects) model from the U.S. Forest Service (USFS) was used to estimate air pollution removed in terms of particulate matter by trees and shrubs for improving air quality and health.
Table 3.
Social benefits associated with GI adoption in the cities examined in this study.
| Metropolis | Reduction of Urban Heat Island Effect and Heat Stress | Enhancement of Aesthetics and Increase in Recreational Opportunities | Creation of Attractive Streetscapes Enhancing Pedestrian Environment | Equitable Access to Healthy Neighborhoods | Improvement of Quality of Life (Enhancement of Physical and Mental Health, and Reduction of Stress) | Creation of Green Job * | Improvement of Air Quality and Human Health | Reduction of Flooding and Combined Sewer Overflow * (CSO) | Reduction of Domestic Violence and Crime Rate | Providing Space for Urban Agriculture and Community Gardens | Noise Abatement |
|---|---|---|---|---|---|---|---|---|---|---|---|
| Chicago metropolitan area | √ | √ | √ | √ | |||||||
| Cleveland metropolitan area | √ | √ | √ | √ | √ | ||||||
| Greater Austin | √ | √ | √ | √ | √ | ||||||
| Kansas City metropolitan area | √ | √ | √ | √ | √ | √ | |||||
| Los Angeles metropolitan area | √ | √ | √ | √ | √ | ||||||
| Milwaukee metropolitan area | √ | √ | √ | √ | √ | √ | |||||
| Nashville metropolitan area | √ | √ | √ | √ | √ | ||||||
| New York metropolitan area | √ | √ | √ | √ | √ | ||||||
| Philadelphia metropolitan area | √ | √ | √ | √ | √ | √ | |||||
| Portland metropolitan area | √ | √ | √ | √ | √ | √ | √ | √ | |||
| Seattle metropolitan area | √ | √ | √ | √ | |||||||
| Birmingham metropolitan area | √ | √ | √ | √ | √ | ||||||
| Copenhagen metropolitan area | √ | √ | √ | √ | |||||||
| Greater Tokyo Area (City of Yokohama) | √ | √ | √ | ||||||||
| Greater Toronto | √ | √ | √ | √ | √ | ||||||
| Adelaide (South Australia) | √ | √ | √ | √ | √ | √ | √ |
Note: * May also contribute to economic benefits.
Table 4.
Economic benefits associated with GI adoption in the cities examined in this study.
| Metropolis | Creation of Green Job * | Reduction of Energy Bills | Increase in Property Values | Reduction of Infrastructure Cost and Treatment Cost | Reduction of Flood and Associated Cost | Reduction of Pumping Costs | Increase in Life Span of Infrastructure | Reduction of Stormwater Fees | Increase in Tourism | Increase in Business Activity | Reduction of food Bills due to Urban Agriculture Production |
|---|---|---|---|---|---|---|---|---|---|---|---|
| Chicago metropolitan area | √ | √ | |||||||||
| Cleveland metropolitan Area | √ | √ | √ | √ | |||||||
| Greater Austin | √ | √ | √ | ||||||||
| Kansas City metropolitan Area | √ | √ | √ | √ | |||||||
| Los Angeles metropolitan area | √ | √ | √ | √ | |||||||
| Milwaukee metropolitan area | √ | √ | √ | √ | √ | ||||||
| Nashville metropolitan area | √ | √ | √ | √ | √ | ||||||
| New York metropolitan area | √ | √ | √ | √ | |||||||
| Philadelphia metropolitan area | √ | √ | √ | √ | √ | ||||||
| Portland metropolitan area | √ | √ | √ | √ | √ | ||||||
| Seattle metropolitan area | √ | √ | √ | ||||||||
| Birmingham metropolitan area | √ | √ | √ | √ | √ | √ | |||||
| Copenhagen metropolitan area | √ | √ | √ | √ | √ | ||||||
| Greater Tokyo Area (City of Yokohama) | √ | ||||||||||
| Greater Toronto | √ | √ | √ | √ | √ | ||||||
| South Australia (Adelaide) | √ | √ | √ | √ | √ |
Note: * May also contribute to social benefits.
Publisher’s Note: MDPI stays neutral with regard to jurisdictional claims in published maps and institutional affiliations. |
© 2021 by the authors. Licensee MDPI, Basel, Switzerland. This article is an open access article distributed under the terms and conditions of the Creative Commons Attribution (CC BY) license (https://creativecommons.org/licenses/by/4.0/).
Share and Cite
MDPI and ACS Style
Shakya, R.; Ahiablame, L. A Synthesis of Social and Economic Benefits Linked to Green Infrastructure. Water 2021, 13, 3651. https://doi.org/10.3390/w13243651
AMA Style
Shakya R, Ahiablame L. A Synthesis of Social and Economic Benefits Linked to Green Infrastructure. Water. 2021; 13(24):3651. https://doi.org/10.3390/w13243651
Chicago/Turabian StyleShakya, Ranish, and Laurent Ahiablame. 2021. "A Synthesis of Social and Economic Benefits Linked to Green Infrastructure" Water 13, no. 24: 3651. https://doi.org/10.3390/w13243651
Note that from the first issue of 2016, this journal uses article numbers instead of page numbers. See further details here.