Article

Driving Force Analysis of Agricultural Economic Growth Related to Water Utilization Effects Based on LMDI Method in Ningxia, Northwest China

1
Power China Chengdu Engineering Co., Ltd., Chengdu 610072, China
2
State Key Laboratory of Simulation and Regulation of Water Cycle in River Basin, China Institute of Water Resources and Hydropower Research, Beijing 100038, China
3
School of Civil Engineering, Tianjin University, Tianjin 300072, China
4
College of Forestry, Sichuan Agricultural University, Chengdu 611130, China
*
Author to whom correspondence should be addressed.
Water 2021, 13(24), 3639; https://doi.org/10.3390/w13243639
Submission received: 4 November 2021 / Revised: 7 December 2021 / Accepted: 13 December 2021 / Published: 17 December 2021
(This article belongs to the Special Issue Improving Agricultural Water Productivity in the Dry Areas)

Abstract

:
Agricultural economy is usually studied by total factor analysis, while it is uncertain what factors affect agricultural production in the perspective of water utilization. The aim of this study was to investigate driving forces of agricultural economy related to water utilization effects in Ningxia during 2007 to 2017. The logarithmic mean Divisia index (LMDI) method was selected to decompose the driving forces of agricultural production value. Results showed that the agricultural production value increased significantly in 2007–2017 in all of Ningxia and in each city. In terms of the whole region, the effect of agriculture water efficiency played a leading and positive role in the increase of the agricultural production value. The effects of water stress, water utilization structure, and water resource endowment all showed a negative driving force, while population exerted a positive effect. For five cities, the effect of agriculture water efficiency and water utilization structure showed no spatial difference; whereas the other effects expressed different driving forces between cities in the northern plain area and southern hilly area due to varied natural conditions and agricultural activities. The results of this research suggested that the first and foremost strategy of agricultural development and water resource management in Ningxia should be to promote water-saving irrigation and optimize agricultural structure.

1. Introduction

With the rapid progress of urbanization and industrialization, agriculture developed relatively slowly and lagged behind other industries in China [1,2]. To understand the pathway of agricultural development, it is necessary to identify the critical elements of agricultural production. The influencing factors of agricultural production are complicated, including multiple dimensions such as society, economy, and natural environment [3]. Existing studies mostly analyze the growth of agricultural total factor productivity in China based on traditional factors such as capital, labor force, technology, and so forth [4,5,6], but paid little attention to natural elements such as water resources.
Water is one of the most essential natural resources for all life on earth [7]. In global terms, agricultural water consumption accounts for approximately 70% of total water use [8,9], and will continue to be the largest freshwater user until 2050 for all regions [10]. As a largely agricultural country, agriculture accounts for more than 60% of total water consumption in China, of which irrigation withdrawals account for more than 90% of total agricultural water use [11,12]. Due to the rapid growth of water demand in nonagricultural sectors, such as industry, households, and environment, agricultural water shortage is subject to increasing pressure [13,14]. Several studies have demonstrated that crop yields decrease with decreasing irrigation water [15,16] and have a negative impact on the agricultural output value [17]. Agricultural development is unsustainable due to agricultural water shortages [18], indicating that a reliable water supply is a crucial input for agricultural economy. However, agricultural water supply changes with stream flows and irrigation allocation are complex due to the influence of natural conditions and human activities, which means multiple uncertainties of agricultural water such as technology selection, water-saving consciousness, and so forth [19]. As the principal part of an irrigation system, agricultural water connects each procedure of irrigating activity, and its utilization characteristics can reflect different influencing factors, both naturally and artificially. Therefore, it is necessary to identify the key elements of agricultural production from the perspective of water resources.
Structural and index decomposition analyses could be an applicable method to identify the main drivers of changes of agricultural production over time. Logarithmic mean Divisia index (LMDI) decomposition is one classic method of index decomposition [20,21]. The LMDI eliminates problems of residual term and zero values in decomposition calculations, which can be applied in decomposition of both quantitative and intensity indicators. This approach has been widely employed in carbon emission and energy-related studies [22,23,24]. Moreover, some researchers began to use the LMDI model in the field of water resources. To analyze the driving force underlying the change in the agricultural water footprint, Zhao and Chen accounted for the Chinese agricultural water footprint from 1990 to 2009 based on the LMDI method, indicating that water efficiency improvement and dietary structure adjustment were the most effective approaches for controlling the Chinese agricultural water footprint [25]. Liu et al. analyzed and compared the driving forces of per capita water footprint changes in six regions of north China by using LMDI for the purpose of optimizing agricultural production and relieving water stress [26]. Zhao et al. quantified the green and blue water footprint of main crops in Suzhou, and analyzed the driving forces of water footprint change during 2001 to 2010 based on the LMDI model [27]. Shi et al. used the LMDI method to investigate the four factors driving the spatial–temporal differences in the water footprints of the major crops in five regions of Northwest China, with implications for conserving agricultural water [28]. Collectively, these studies put more emphasis on water footprint and crop production, and no previous study has applied the LMDI model to examine the contribution of driving factors of agricultural economy from the perspective of water use.
Therefore, to fill the knowledge gap noted above, the Ningxia Hui Autonomous Region, located in northwestern China, was selected as the study area in this research to investigate driving forces of agricultural economy related to water utilization effects. The main aims of this study were to: (1) analyze the variation trend of agricultural production value and its influencing factors with regard to water resources in Ningxia; (2) illustrate the contribution of driving factors to changes in agricultural production value in all of Ningxia; and (3) identify the spatial difference of driving indicators’ contributions and potential causes among five cities of Ningxia. The findings of this research will be helpful for capturing shortages of water utilization in agricultural development, and may provide guidance for agricultural water management and relevant policy-making work.

2. Materials and Methods
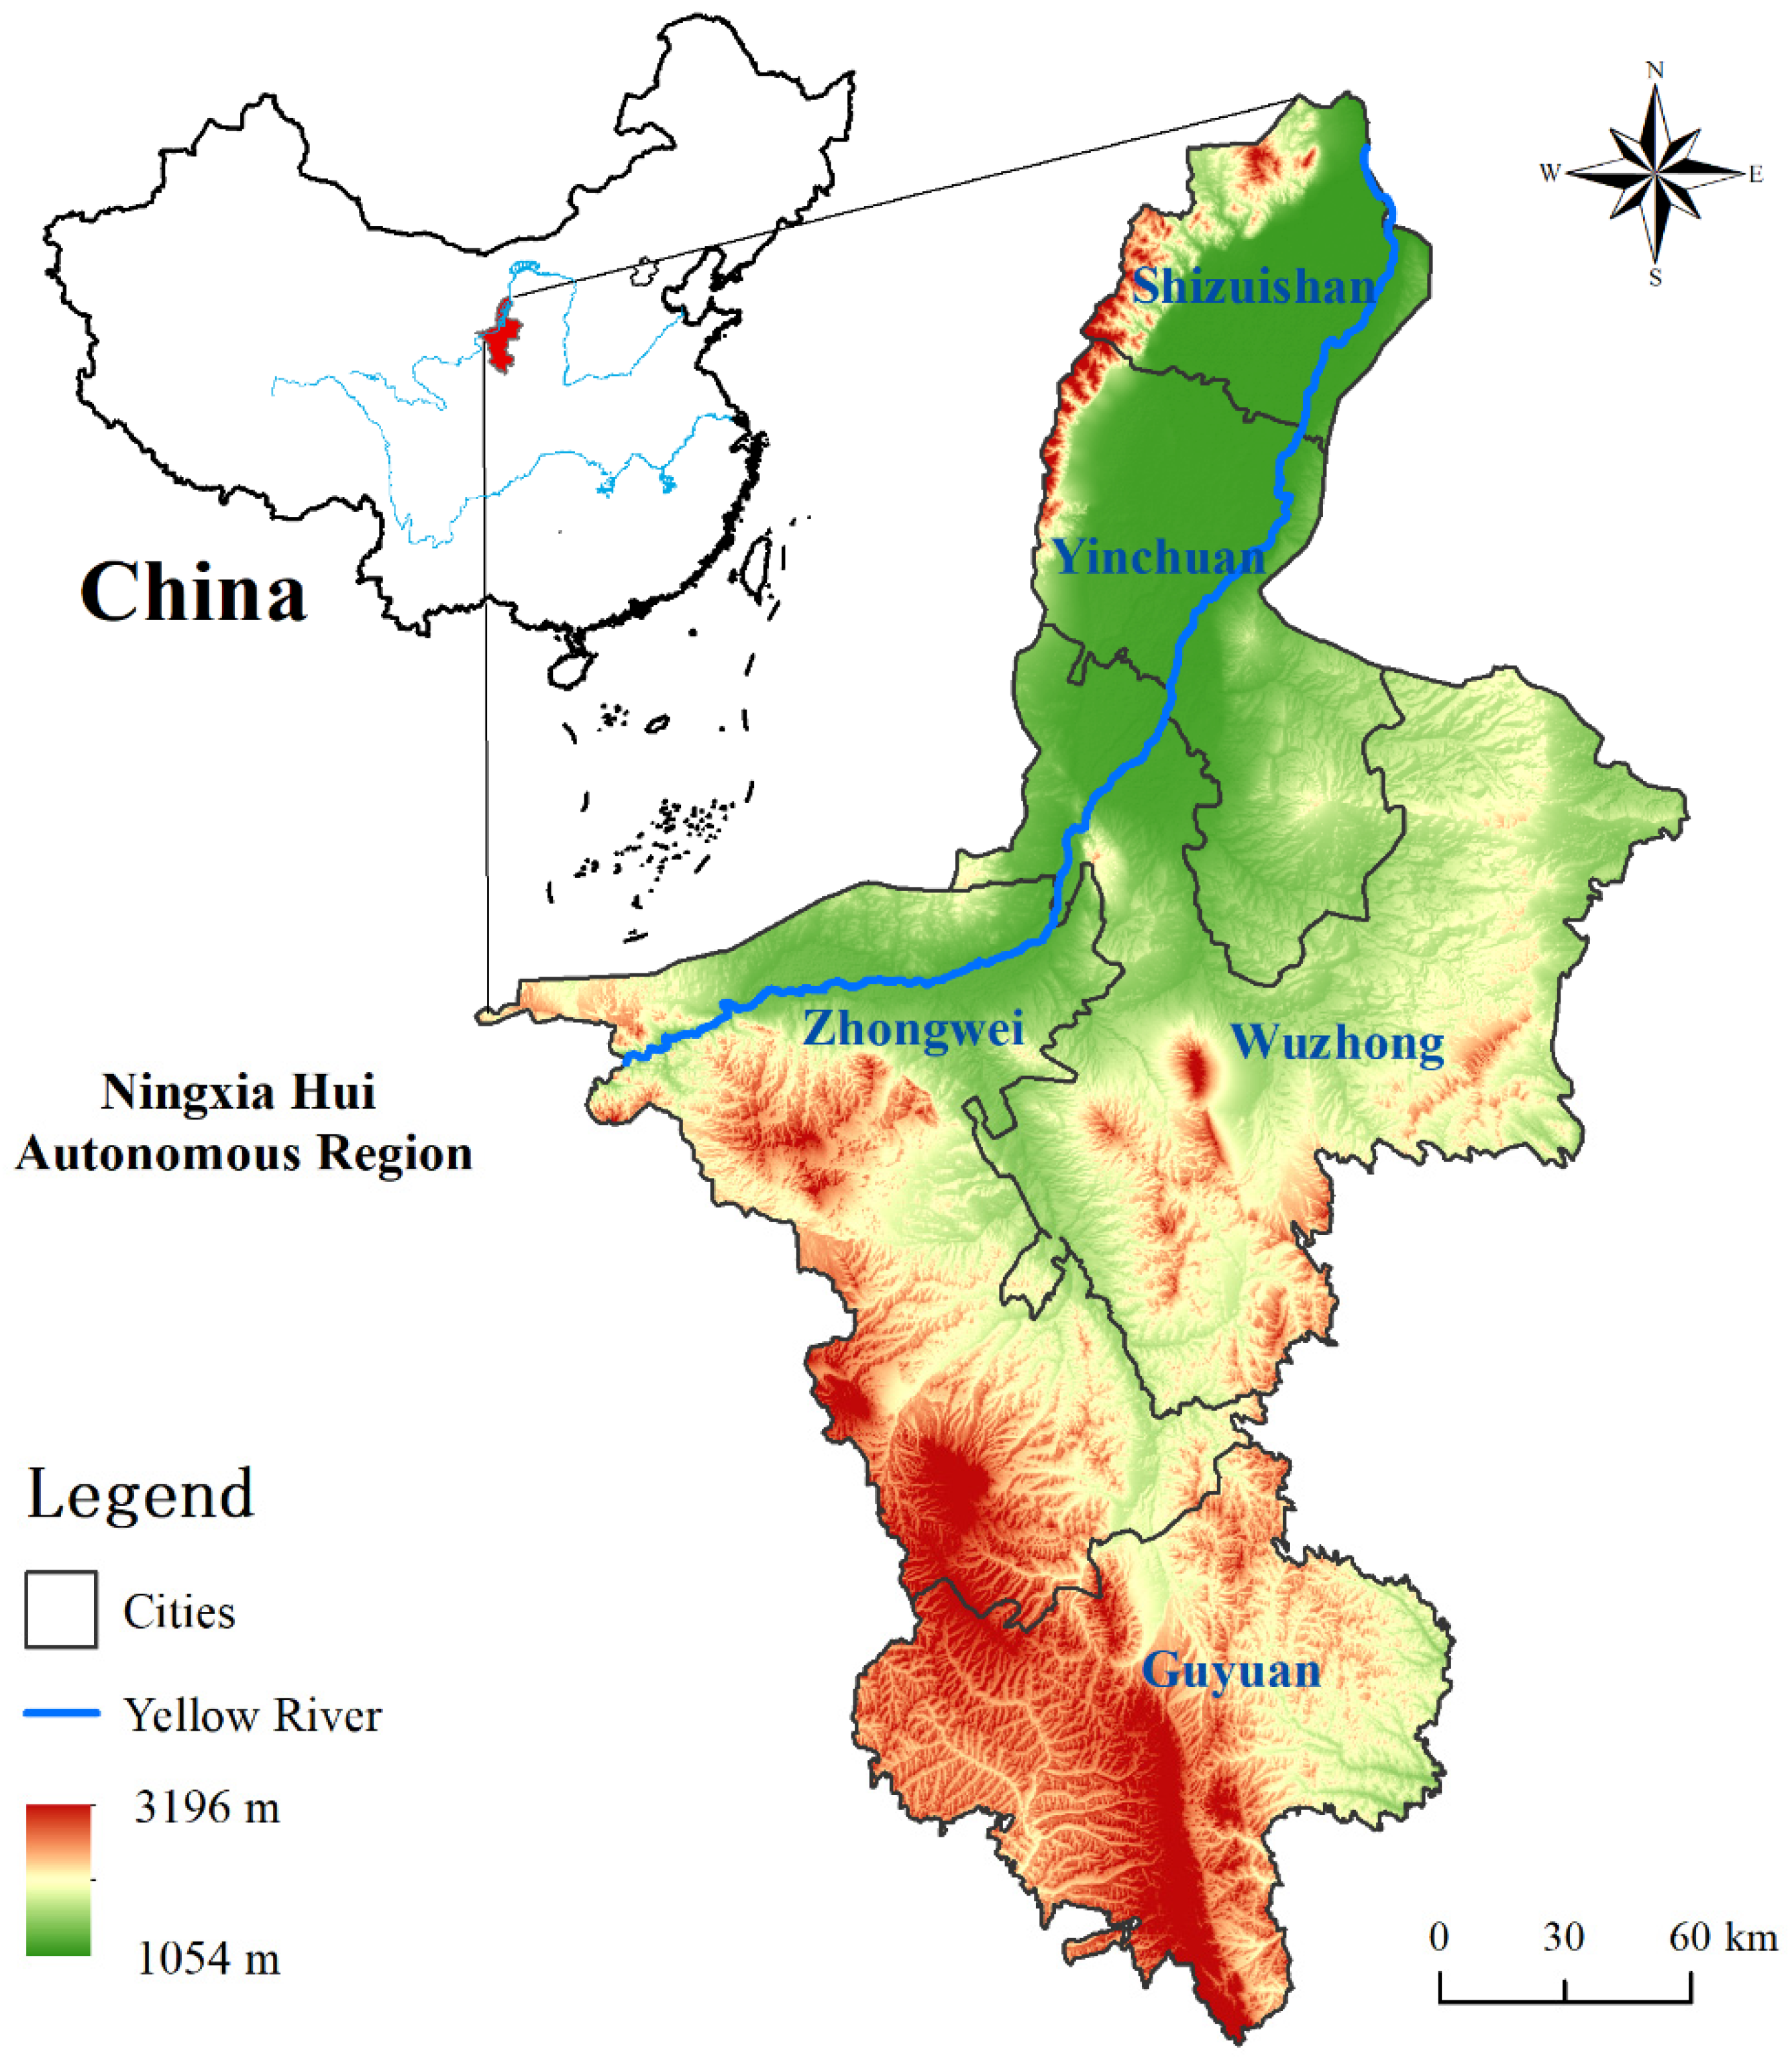
2.1. Study Area

The Ningxia Hui Autonomous Region (35°14′–39°23′ N, 104°17′–107°39′ E) is located in the upper reaches of the Yellow River Basin in western China, adjacent to Gansu Province, Inner Mongolia Autonomous Region, and Shaanxi Province. Ningxia consists of five prefecture-level cities, including Yinchuan, Shizuishan, Wuzhong, Guyuan, and Zhongwei, with Yinchuan as its capital (Figure 1). The terrain of Ningxia is high in the south and low in the north, descending in a ladder form. The Yellow River enters from Zhongwei City, slanting across the plain to the northeast and flowing out from Shizuishan City. The terrain is divided into three major plates: the northern Yellow River irrigation area, the central arid zone, and the southern mountainous area. Ningxia has a temperate continental arid and semiarid climate, and the precipitation distribution is extremely uneven, decreasing from south to north. The annual average precipitation in the southeast of Liupanshan mountain in southern Ningxia is around 800 mm, while it is only 149 mm in the Yellow River irrigation area in the north. The arid areas with annual precipitation below 400 mm account for 80% of the total area of the region. The cultivated land is mainly distributed in the middle and north of Ningxia. Benefitting from the Yellow River, the natural resources of sunlight, temperature, water, and soil in the arid zone of the central-northern Ningxia are well coordinated. Therefore, paddy and irrigable land are mainly distributed in the mid-north, while dry land is distributed in southern areas such as Guyuan and Wuzhong. The unbalanced distribution of water and soil resources has shaped the unique pattern of agriculture in Ningxia, which has a profound impact on regional grain production and high-quality agricultural development.

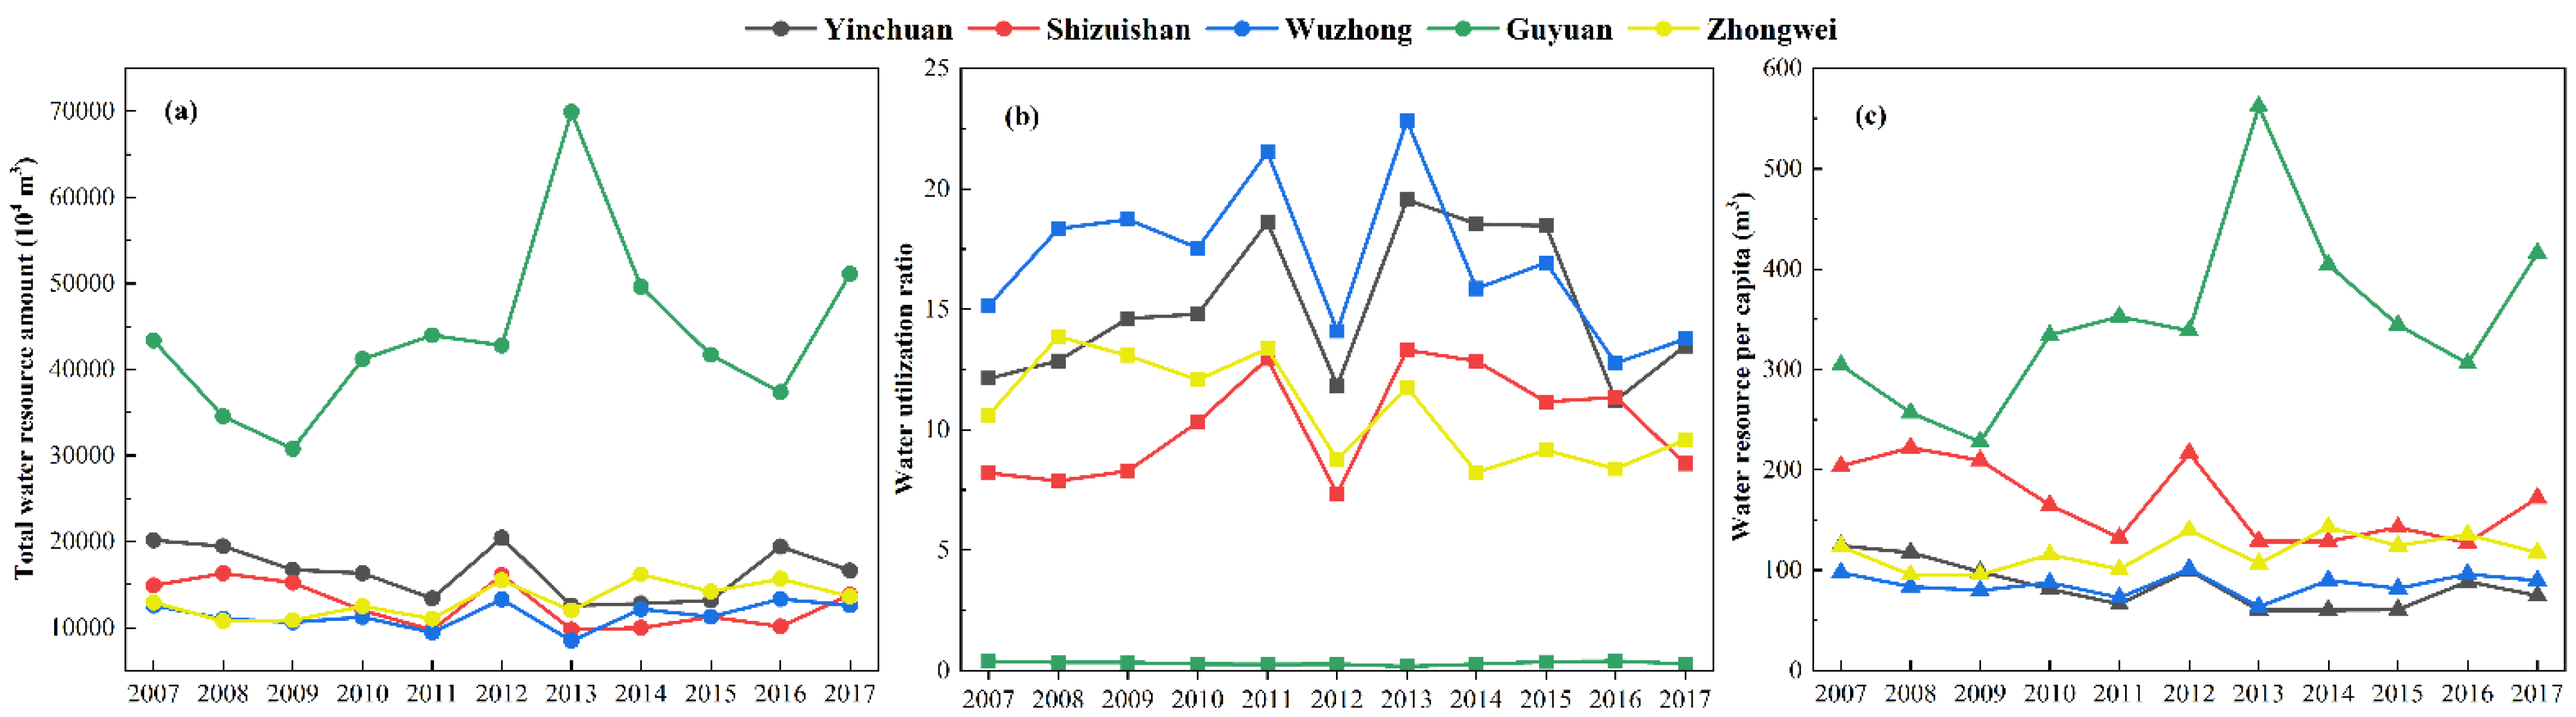
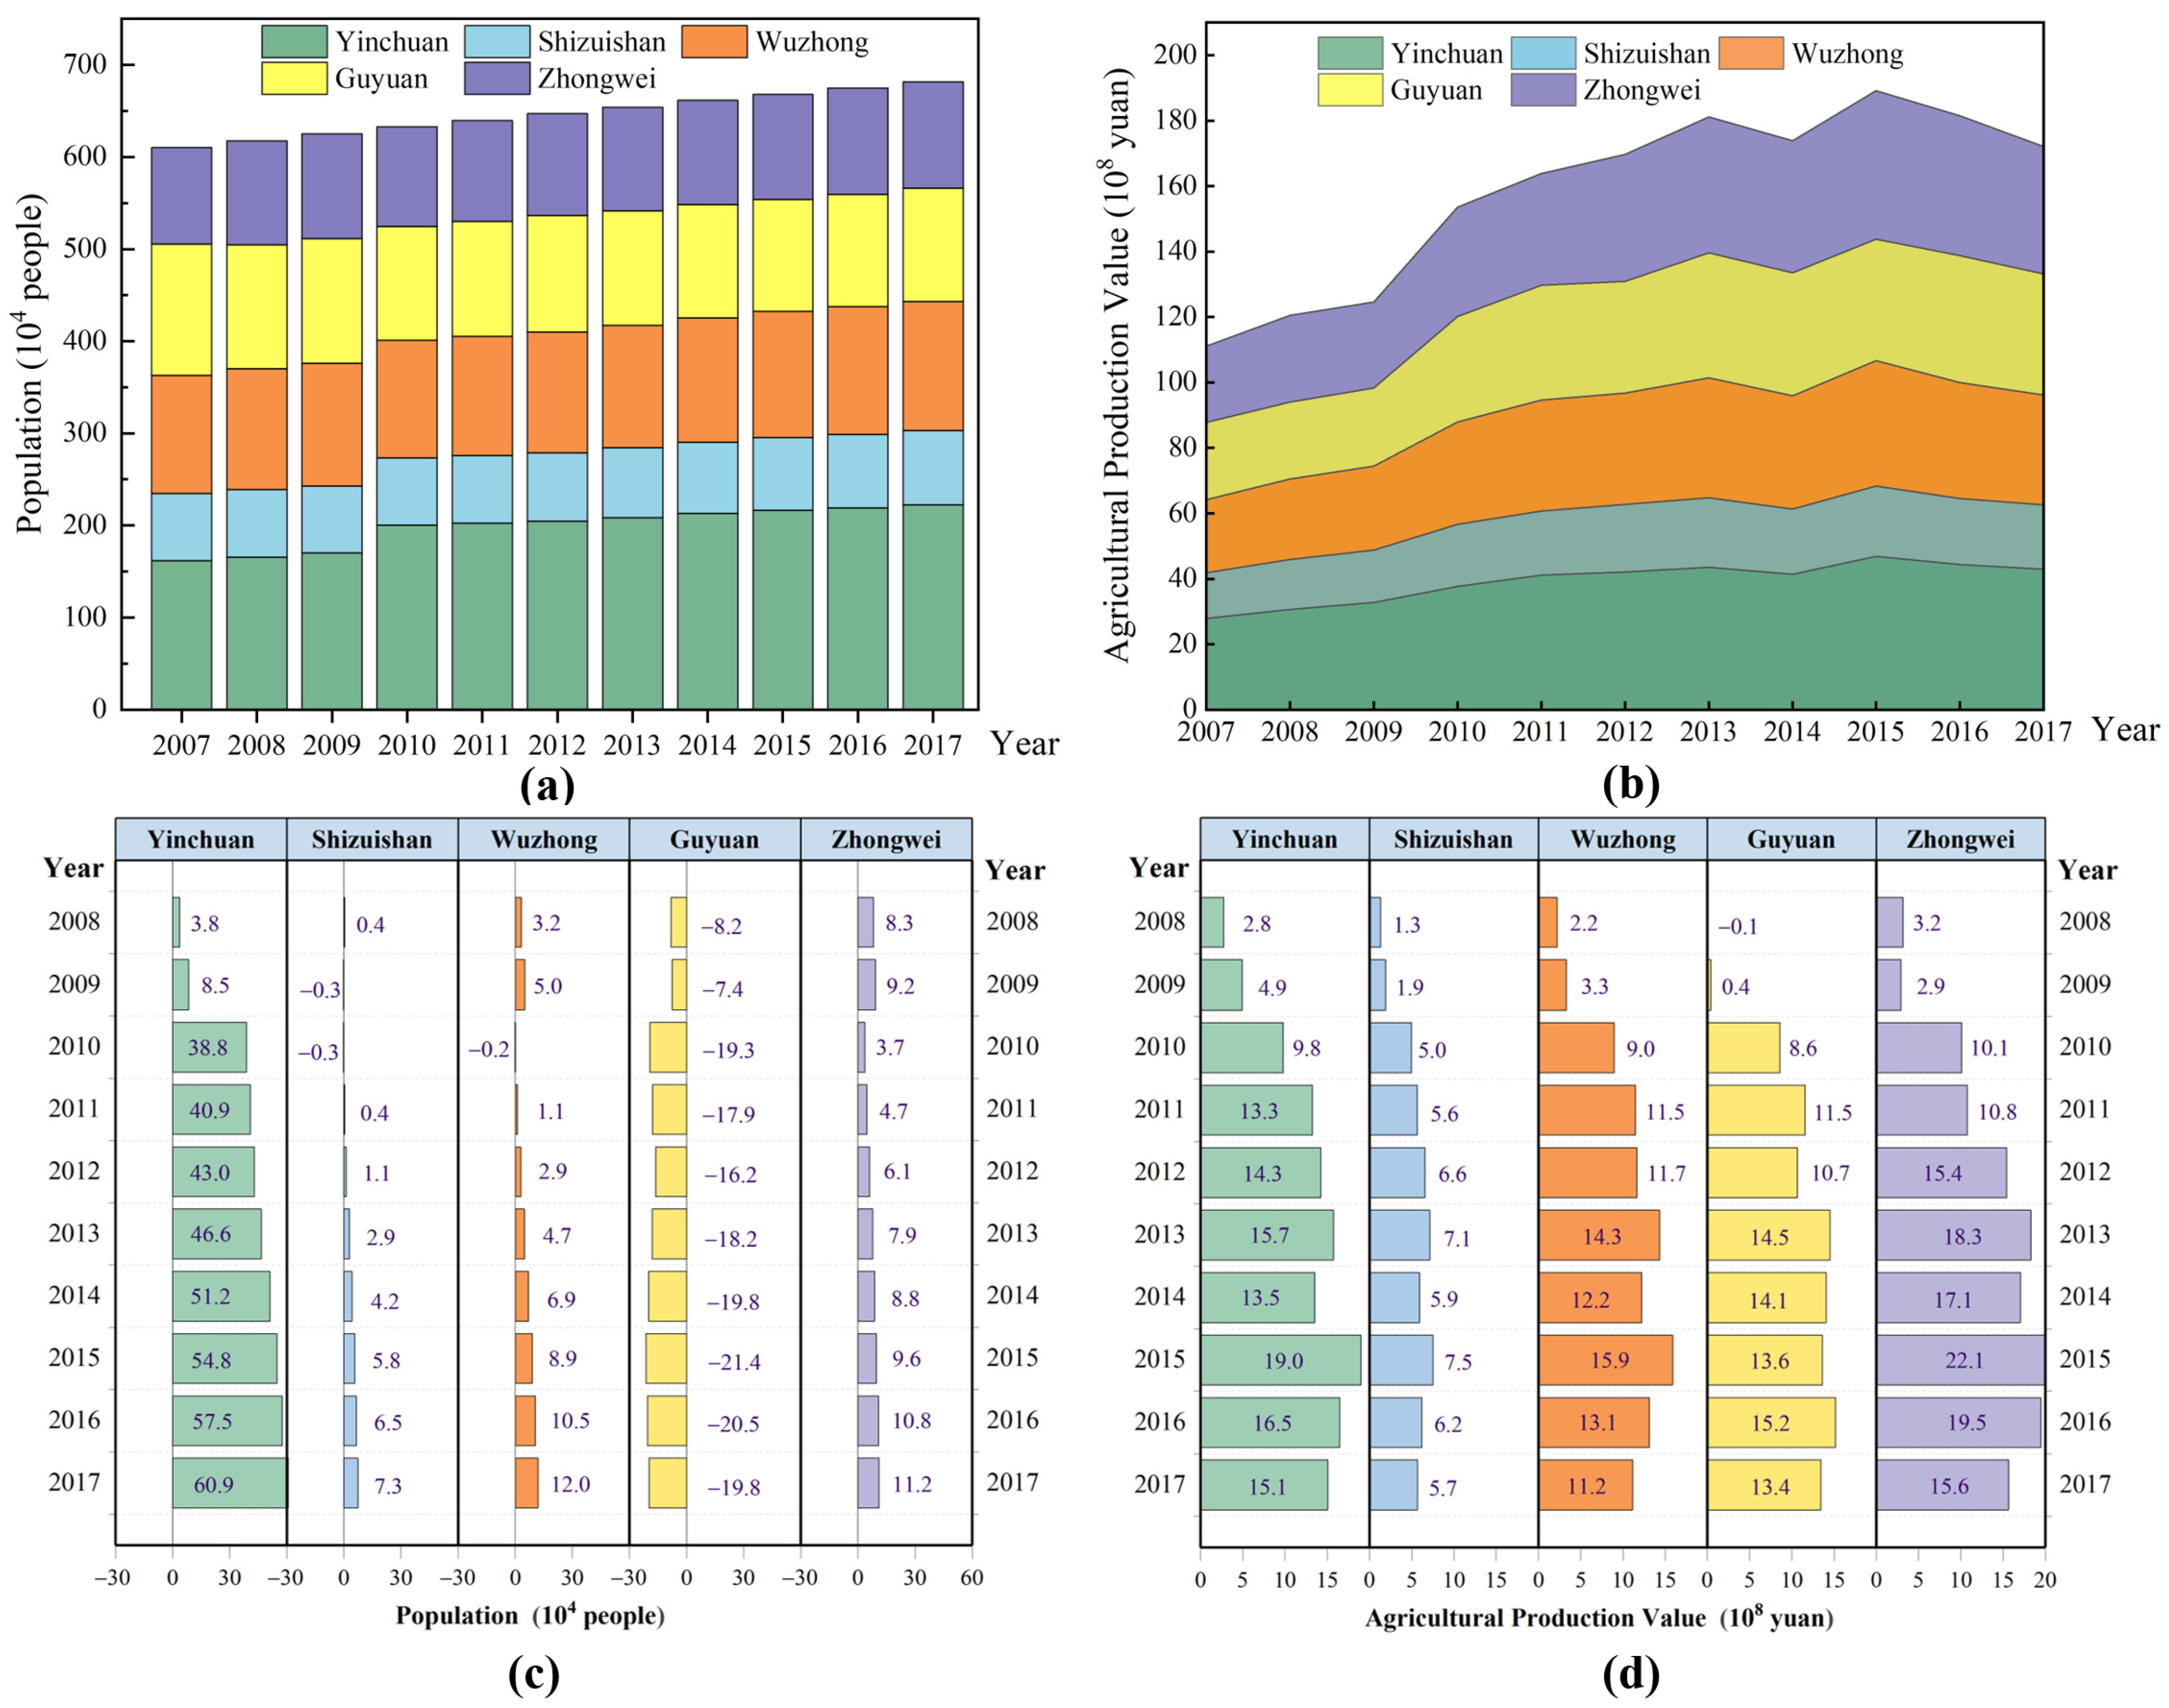
2.2. Data Description

To ensure integrity and uniformity of the data, the period from 2007 to 2017 was used for the decomposition analysis in this study. The agricultural production value and population data were mainly extracted from the Ningxia Statistical Yearbook (http://nxdata.com.cn) (accessed on 5 December 2021). Agricultural water consumption, total water consumption, and other water resources data mainly were from the Ningxia Water Resources Bulletin and Ningxia Water Resources Statistical Bulletin. In order to remove the effects of price changes, we set 2007 as the base year and adjusted agricultural production value to a constant price. Producer price indices for farm products of each city were also obtained from the Ningxia Statistical Yearbook.

2.3. Extended Kaya Identity

On the basis of the IPAT model (I = Human Impact, P = Population, A = Affluence, T = Technology), Yoichi Kaya proposed the Kaya equation at the 1st IPCC conference. Kaya identity was originally employed in investigating the driving factors of CO2 emissions changes at the national level [29,30] and it is now widely used in various applications such as water use [31] and water footprint efficiency [32]. According to extended Kaya identity, factor decomposition of gross agricultural production value based on water utilization can be expressed as follows:
G = G W a × W a W t o t × W t o t W r × W r P × P = e × c × s × n × p
where G is the gross agricultural production value; Wa represents the agricultural water consumption; Wtot signifies the total water consumption; Wr is the local amount of water resources; P is the total population; e is the agricultural production value per unit of water consumption, indicating the efficiency of agriculture water; c is the ratio of agriculture water consumption to total water consumption, reflecting the water utilization structure; s is the ratio of total water consumption to total water resources, indicating water resources stress; n is the per capita water resources, indicating the local water resource endowment; and p is the population effect.
To sum up, agricultural production value can be decomposed into five driving effects, including effect of agriculture water efficiency, effect of water utilization structure, effect of water resources stress, effect of water resource endowment, and effect of population scope, from the perspective of water utilization.

2.4. LDI Methodology

The LMDI model is one of the most popular factorization models that can realize complete decomposition and technically tackle the zero value issue [33]. The LMDI is divided into additive decomposition and multiplicative decomposition, both of which can be transformed into each other [34]. Through the above decomposition, the total change of agricultural production value in the form of additive decomposition can be expressed as follows:
Δ G t o t = G t G 0 = Δ G e + Δ G c + Δ G s + Δ G n + Δ G p
where Δ G t o t is the total change in agricultural production value; G 0 and G t are the agricultural production value in years 0 and t, respectively; Δ G e is the change in agricultural production value caused by changes in agriculture water efficiency; Δ G c is the change in agricultural production value caused by adjusting the water use structure; Δ G s is the change in agricultural production value caused by variations in water resource stress; Δ G n is the change in agricultural production value caused by changes in local water resource endowment; and Δ G p is the change in agricultural production value caused by population change. The contribution of each effect to changes in agricultural production value can be calculated using the following formula:
Δ G e = i Δ G e , i = i G t , i G 0 , i ln G t , i ln G 0 , i × ln ( e t , i e 0 , i )
Δ G c = i Δ G c , i = i G t , i G 0 , i ln G t , i ln G 0 , i × ln ( c t , i c 0 , i )
Δ G s = i Δ G s , i = i G t , i G 0 , i ln G t , i ln G 0 , i × ln ( s t , i s 0 , i )
Δ G n = i Δ G n , i = i G t , i G 0 , i ln G t , i ln G 0 , i × ln ( n t , i n 0 , i )
Δ G p = i Δ G p , i = i G t , i G 0 , i ln G t , i ln G 0 , i × ln ( p t , i p 0 , i )
where Δ G represents the variation in the agricultural production value in city i. A positive value indicates that the factors increase agricultural production value, whereas a negative value indicates that the factors decrease agricultural production value. The larger the absolute value is, the more significant the promotion effect or inhibition effect is.
Based on the multiplicative decomposition model, the formulas for agricultural production value decomposition can be summarized as follows:
D = G t / G 0 = D e × D c × D s × D n × D p
where D is the ratio of agricultural production value in year t to that of in base year, equaling the product of each factor; and De, Dc, Ds, Dn, and Dp represent the effect of agriculture water efficiency, water utilization structure, water resources stress, water resource endowment, and population, respectively. The effect of each factor can be calculated as follows:
D e = exp [ i ( G t , i G 0 , i ) / ( ln G t , i ln G 0 , i ) ( G t G 0 ) / ( ln G t ln G 0 ) × ln ( e t , i e 0 , i ) ]
D c = exp [ i ( G t , i G 0 , i ) / ( ln G t , i ln G 0 , i ) ( G t G 0 ) / ( ln G t ln G 0 ) × ln ( c t , i c 0 , i ) ]
D s = exp [ i ( G t , i G 0 , i ) / ( ln G t , i ln G 0 , i ) ( G t G 0 ) / ( ln G t ln G 0 ) × ln ( s t , i s 0 , i ) ]
D n = exp [ i ( G t , i G 0 , i ) / ( ln G t , i ln G 0 , i ) ( G t G 0 ) / ( ln G t ln G 0 ) × ln ( n t , i n 0 , i ) ]
D p = exp [ i ( G t , i G 0 , i ) / ( ln G t , i ln G 0 , i ) ( G t G 0 ) / ( ln G t ln G 0 ) × ln ( p t , i p 0 , i ) ]
In the multiplicative decomposition form, the effects show promotion and inhibition influence on agricultural production value if D > 1 and D < 1, respectively. The larger the deviation from 1 is, the more significant the promotion or inhibition is; and the closer it is to 1, the less significant the effect is.

3. Results and Discussion

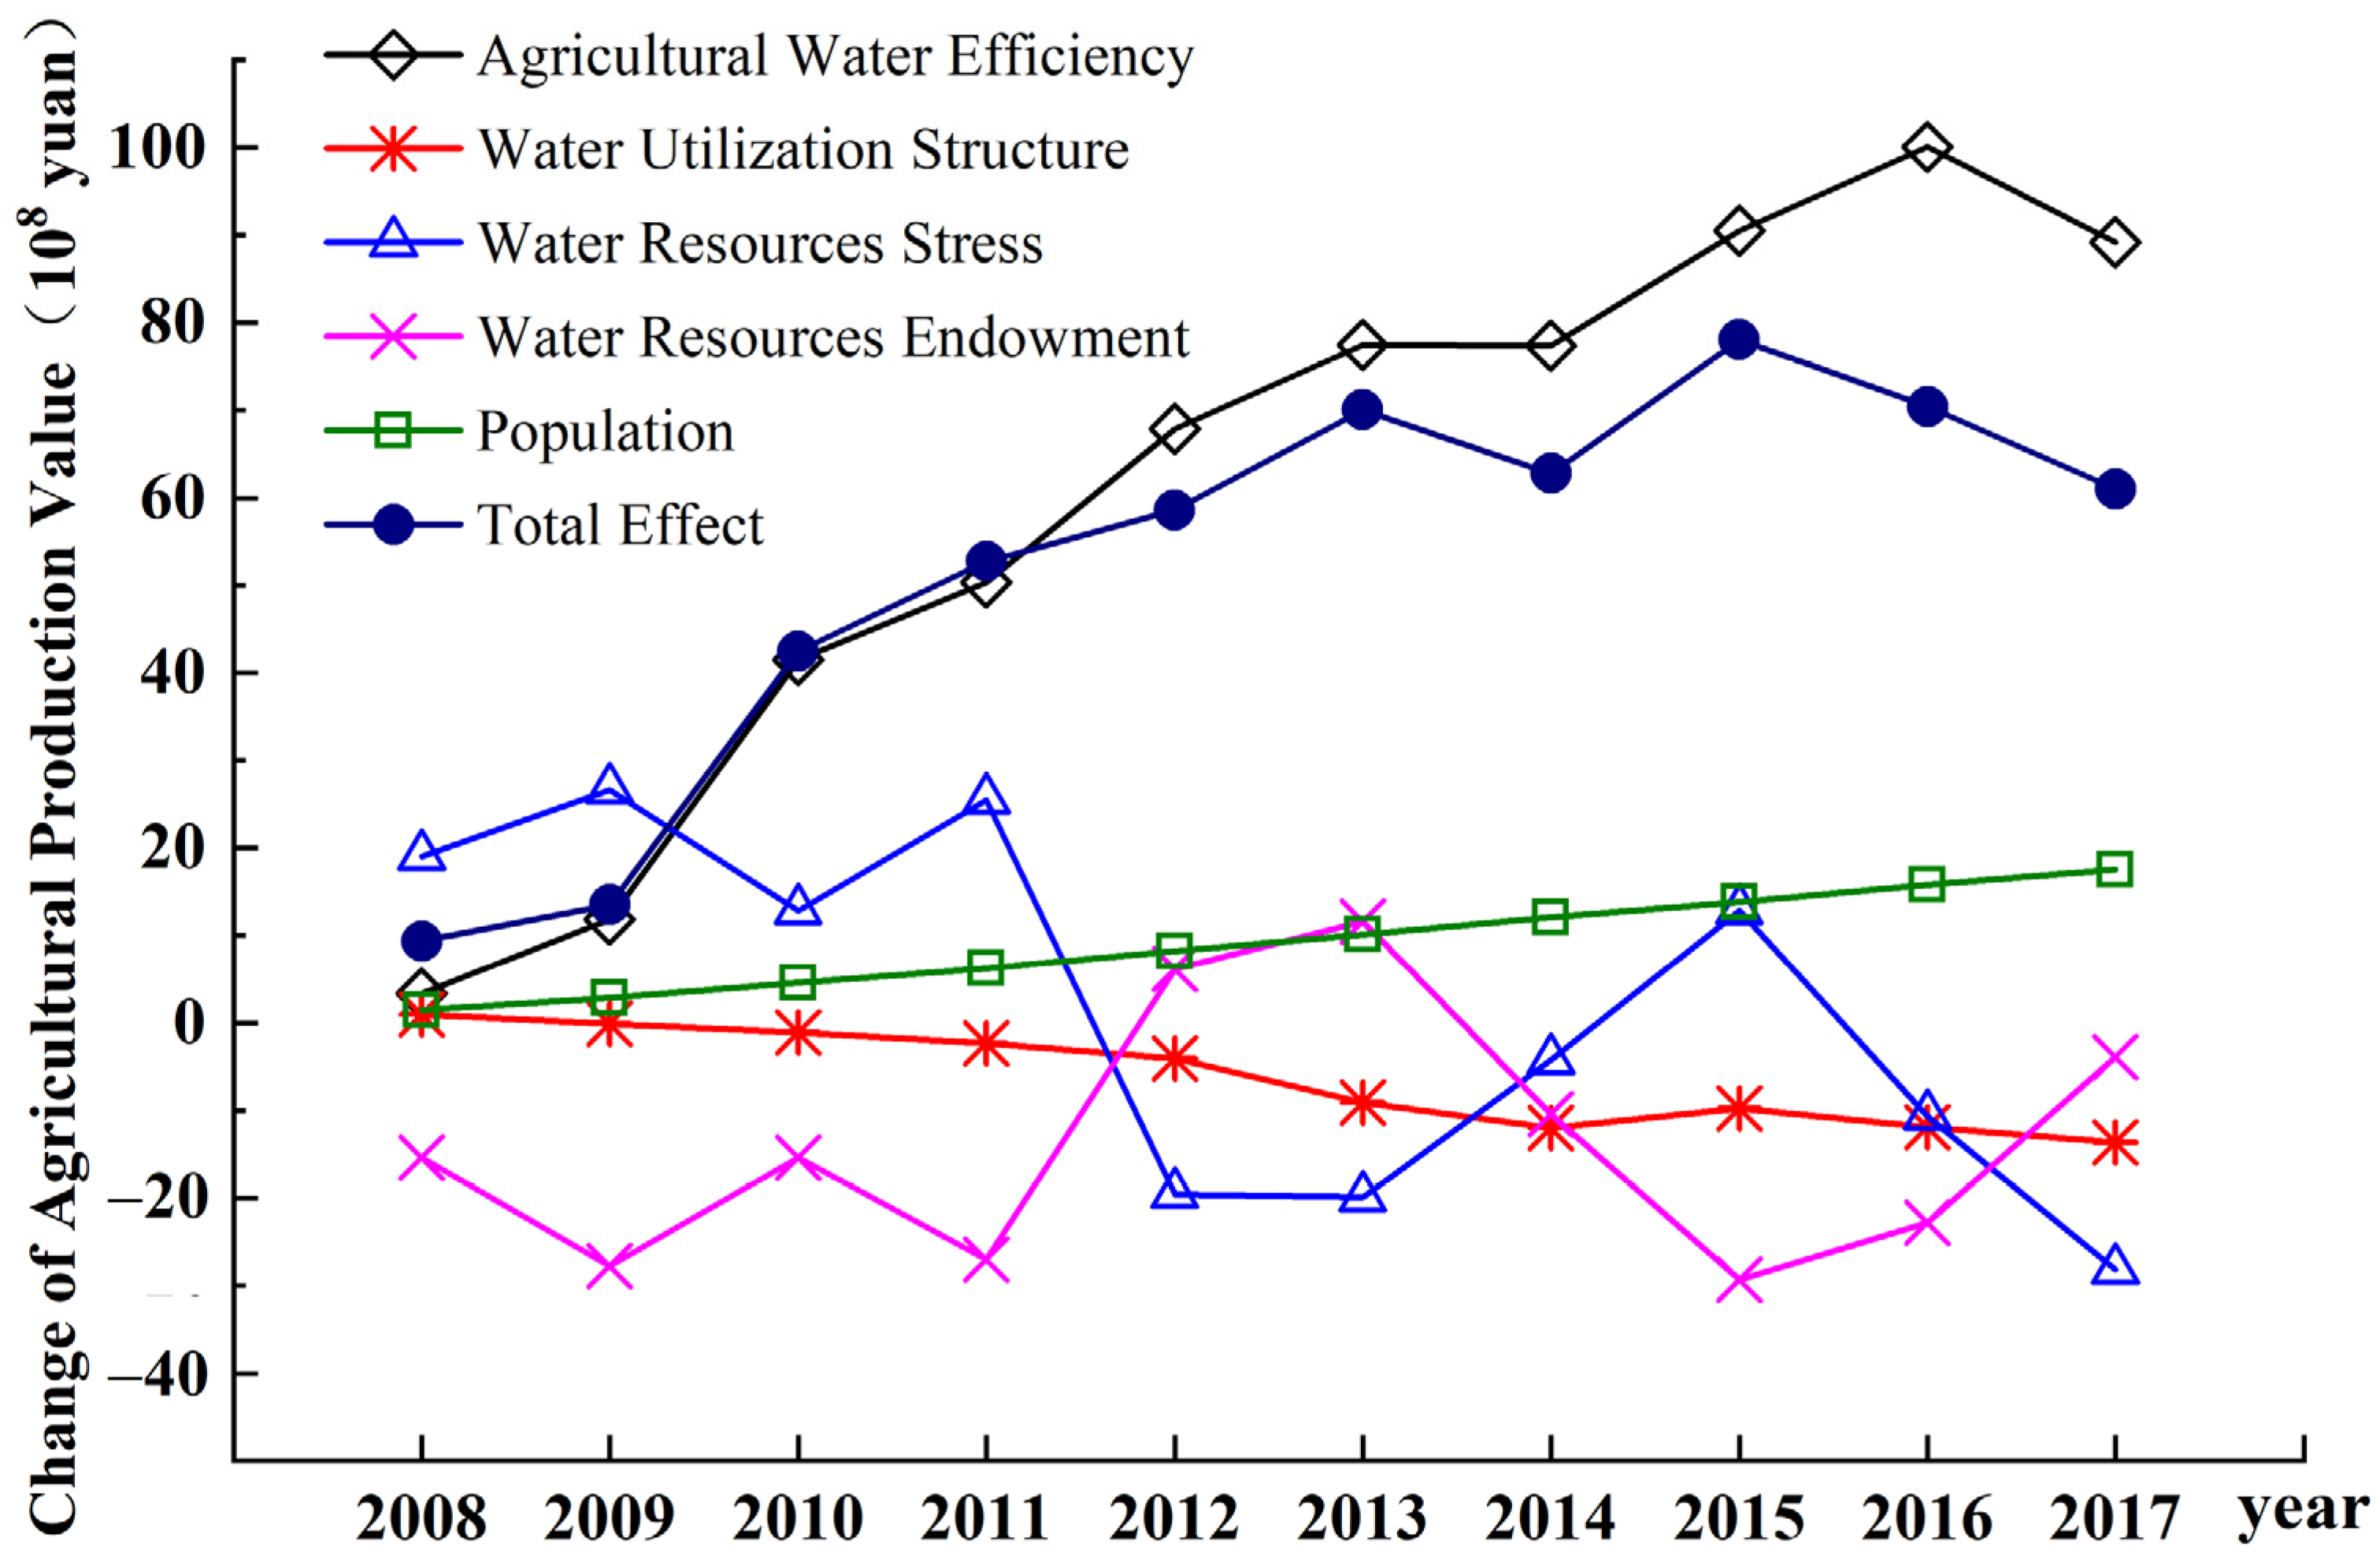
3.1. Changes in Agricultural Production Value and Their Driving Factors

The total population of Ningxia showed an increasing trend from 2007 to 2017, as shown in Figure 2a. Figure 2c reveals the population change of each city since 2007. Yinchuan showed the most population growth, while Guyuan showed a general trend of population decline, and the other three cities showed a fluctuating increase. The difference in population change was mainly the result of ecological migration policy in Ningxia. In order to improve the basic living conditions of the people in the central and southern regions of Ningxia, ecological migration projects were vigorously promoted since 2007. Guyuan is the key area of ecological migration, and its population rapidly emigrated during 2007 to 2010. The population of Wuzhong and Zhongwei firstly increased from 2007 to 2009, then decreased rapidly in 2010, and then gradually increased after 2011, which reflected the temporal difference of the local ecological immigration in and out. Yinchuan city, as the main destination of ecological immigrants, showed a significant increase in population during 2009 to 2010.
Figure 2b reveals that there has been an overall increase in the agricultural economy of Ningxia and its cities. Changes in the agricultural production value in each city are shown in Figure 2d. There was the largest increase of agricultural production value in 2010, and overall, the agriculture economy of the whole area presented good momentum.
As shown in Figure 3, the production value per unit of agricultural water in Ningxia and its cities showed an obvious upward trend from 2007 to 2017. Guyuan had the highest production value per unit of agricultural water, which could be more than CNY 40 yuan/m3, while the production values per unit of agricultural water in other cities were less than CNY 4 yuan/m3. There are two possible explanations for the huge difference in the output value per unit of agricultural water in the north and south of Ningxia. One possible explanation for this might be climate differences. The average annual precipitation in the mountainous areas of southern Ningxia is between 300 mm and 600 mm, while the average annual precipitation in the central and northern Ningxia is less than 300 mm. Particularly, in the north along the Yellow River, the average annual precipitation is only about 200 mm. In contrast to other regions, Guyuan has more natural precipitation, leading to lower agricultural water demand. Another possible explanation is the difference in the irrigation condition. The Yellow River irrigation district in the north has the better irrigation system, but traditional flood irrigation wasted lots of water resources, causing a lower agricultural water efficiency. On the contrary, the southern mountainous region, taking Guyuan as an example, had the higher water use efficiency. Limited by terrain condition, only well and reservoir irrigation were suitable in Guyuan, rather than conventional diversion irrigation. Hence, different irrigation patterns resulted in the difference of agricultural water efficiency among these cities.
Due to the promotion of agricultural water-saving projects, the agricultural water consumption of Ningxia significantly decreased, and the proportion of agricultural water consumption also declined, from 92% in 2007 to 85% in 2017. Wuzhong had the highest proportion of agricultural water use at 90%, whereas Guyuan had the lowest proportion, dropping from 83% to 70% over the decade. The results are shown in Figure 3.
The effects of water resource stress and endowment both varied with the annual variation of the local water resource amount. Figure 4 displays the total water resource amount, water utilization ratio, and water resource per capital of five cities in Ningxia. The developed river system in the southern mountainous region gave Guyuan a further quantity of water resources, as shown in Figure 4a. The water utilization ratio can be calculated by the ratio of water resource utilization to total water resources. According to the degree classification, it refers to high water stress if the water utilization ratio is higher than 0.4. Guyuan had the lowest water utilization ratio, with an average value of 0.31, while the average water utilization ratios in other cities were larger than 10. The extremely high pressure of local water resources in mid-northern Ningxia indicated the excessive dependence on the Yellow River and a local water shortage. Inversely, water resource per capita showed the opposite fluctuation trend compared with the water utilization ratio (Figure 4c). Although water resources per capita in Guyuan (416 m3) were the highest in Ningxia in 2017, they were only about one-fifth of the national average in China (2051 m3). The total amount of local water resources depended on rainfall and runoff generation, which indicated that effects of water stress and water resource endowment could be affected by climate change.

3.2. Analysis of the Driving Factors of Agricultural Production Value in Ningxia

The additive decomposition of water utilization effects on the change of agricultural production value in Ningxia are listed in Table 1, and the aggregate decomposition results are shown in Figure 5. The total change in agricultural production value was 61.00 (CNY 108), but only the effect of agriculture water efficiency and population effect were shown as positive factors.

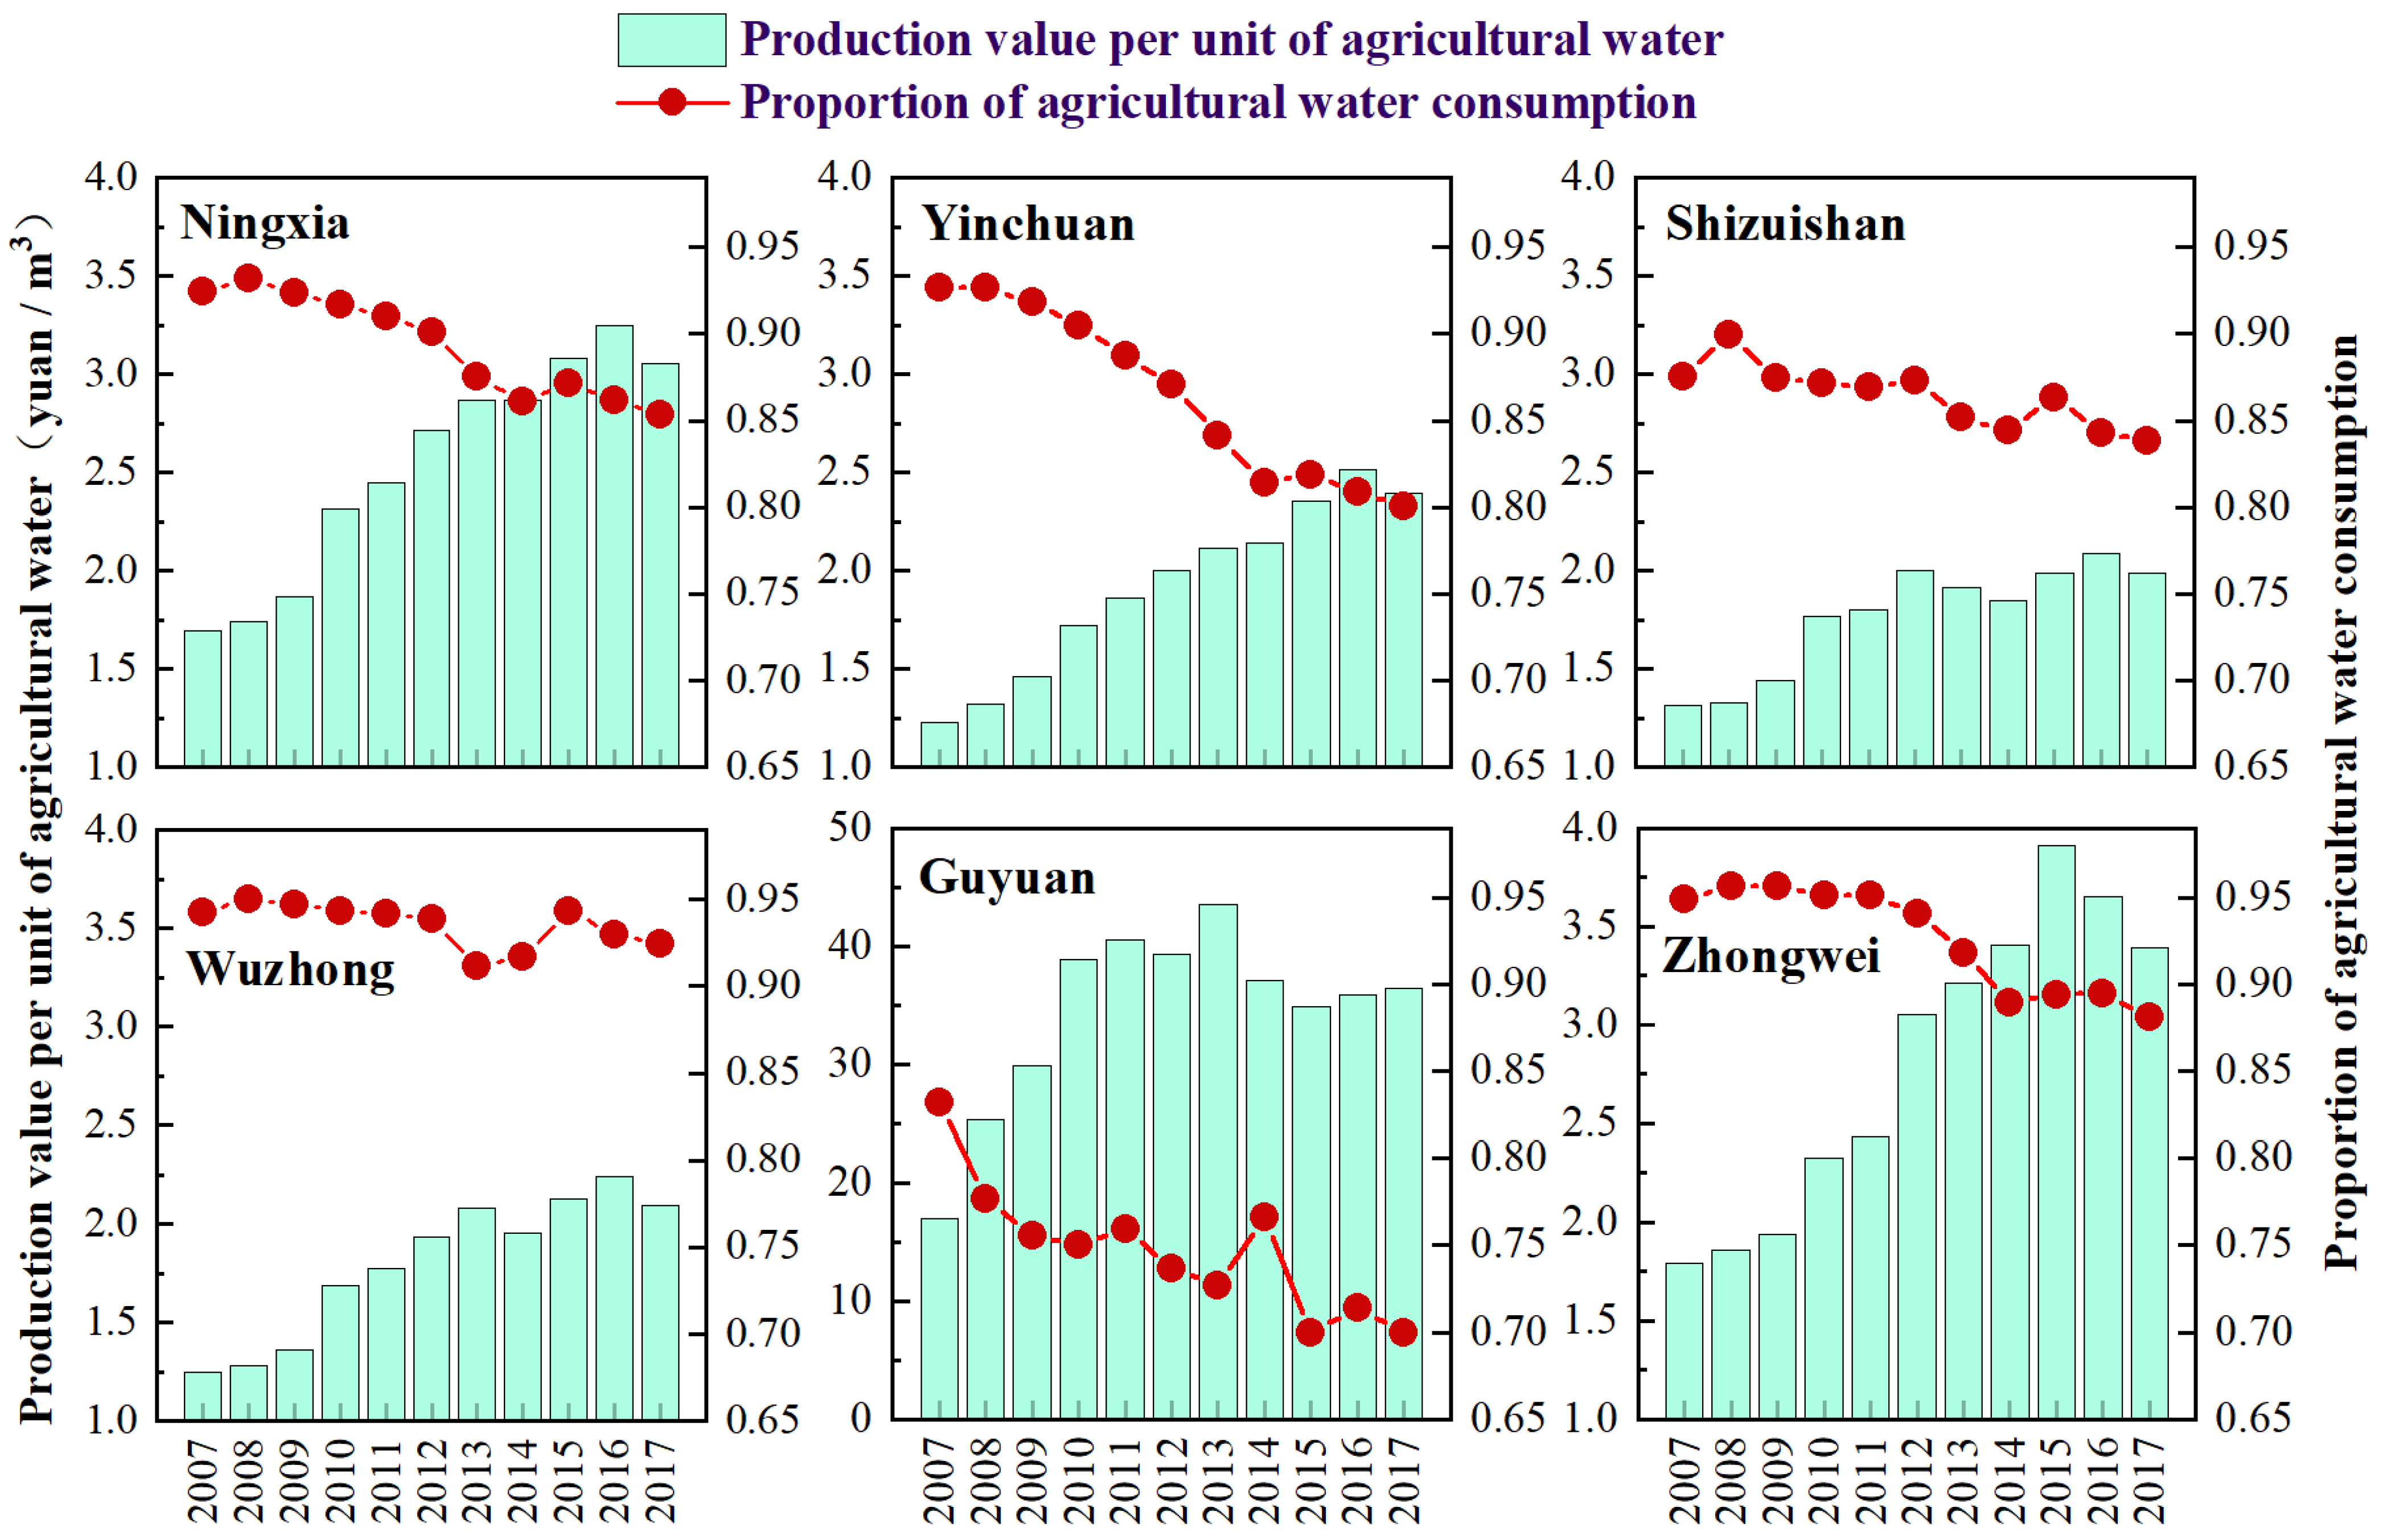
3.2.1. Effect of Agriculture Water Efficiency

As shown in Figure 5, agriculture water efficiency led a positive driving effect on growth of agricultural production value. With the continuous advancement of agricultural water-saving projects, production value per unit of agricultural water of Ningxia gradually increased. It can be seen that the effect of agricultural water efficiency is the most important factor for the increase of agricultural production value in Ningxia, with the cumulative effect value reaching CNY 8.917 billion. A variety of economic, social, technological, and institutional factors may affect agricultural water use efficiency [35]. Limited by the water diversion from the Yellow River, water saving has been always put in a prominent position in Ningxia. The promotion of agricultural water use efficiency could result from upgrade of irrigation facilities, water-saving technologies, water rights, and so forth [36,37,38]. High-efficiency water-saving irrigation technology such as sprinkler irrigation and drip irrigation were consistently promoted in Ningxia, as well as rice controlled irrigation and other economic management measures such as water price adjustment and water-saving publicity, which offers a better guide to agricultural water utilization in the future. In many developed countries, farmers are concerned with raising their net income per unit of water, rather than yield per unit of water [39]. So, apart from saving water, planting more high-value-added crops is of equal importance to raising agriculture water efficiency or productivity.

3.2.2. Effect of Water Utilization Structure

The water utilization structure showed a negative driving effect on the growth of agricultural production value in Ningxia, and the cumulative effect value was CNY −1.362 billion (Table 1), which indicated a right trend of water use structure in local area. The Yellow River Conservancy Commission implemented a water allocation scheme that enforced an upper limit on water withdrawals from the river for the eight provinces [40]. Constrained by total water use control, agricultural water was pressed by increasing industrial and domestic water consumption in Ningxia. Improving water use efficiency is of great significance to reduction of agricultural water consumption in Ningxia. Meanwhile, the importance of planting structure adjustment cannot be ignored. Agricultural layout has been gradually optimized in the whole region by reducing plantation of high-water-consumption crops and developing high-efficiency, water-saving plantations such as watermelon, grape, and greenhouse vegetables. In 2017, the proportion of agricultural water consumption in Ningxia (85%) was still much higher than the national average level (62.3%). Therefore, reducing the quantity and proportion of agricultural water use could be a continuous direction of agricultural development in Ningxia.

3.2.3. Effect of Water Stress

The accumulative effect of water stress showed a trend of fluctuating decline from 2007 to 2017. As shown in Figure 5, the accumulative effect value dropped below zero in 2012, then became positive in 2015, and later rapidly decreased to negative again. The water utilization ratio was influenced by both the total water use and the total amount of water resources. The cumulative value of water stress effect in the whole study period was CNY −2.817 billion, which played a negative driving role on the growth of agricultural production value. Many researchers employed the water stress index to measure the degree of water scarcity and water security in a region. Falkenmark et al. defined the water stress index as water resources per capita [41], while other studies regarded it as the ratio of water demand to water supply, or the relationship between total water use and water availability [42,43]. Limited by local available water in Ningxia, a majority of supply water was taken from the Yellow River. Hence, it was more appropriate to estimate water stress extent by using the water utilization ratio, which is helpful in clearly understanding the relationship between actual water consumption and local water resource quantities.

3.2.4. Effect of Water Resource Endowment

Table 1 shows that from 2007 to 2017, water resource endowment exerted a weak negative effect on the growth of the agricultural production value, with a cumulative contribution of CNY −0.393 billion. Due to the simultaneous influence of water resource quantities, the annual effect value change in water resource endowment and water stress expressed the opposite change rule, since the slight variation of population with water resource quantities per capita was more affected by the change in total water resources. Agricultural production is vulnerable to climate change and extreme weather events [44], so increasing weather fluctuations have contributed to massive changes in the spatial characteristics of agricultural water supply and demand [45]. Previous studies established that the arid tendency has been increasingly obvious in Ningxia during recent decades [46]. Therefore, the impact of climate change on agricultural water security and agricultural production should be highly regarded in the future.

3.2.5. Population Effect

Population exerted a positive effect, pushing forward the growth of the agricultural production value. The cumulative effect value of population has grown steadily, reaching to CNY 1.755 billion in 2017. Population growth increases pressure on food production and indirectly stimulates the development of agricultural economy. Rural aging and population mobilization could pose a challenge to agriculture development, while under the strategy of rural vitalization and the three-child policy, the population effect may continue to play a positive role in the increase in agricultural production value.

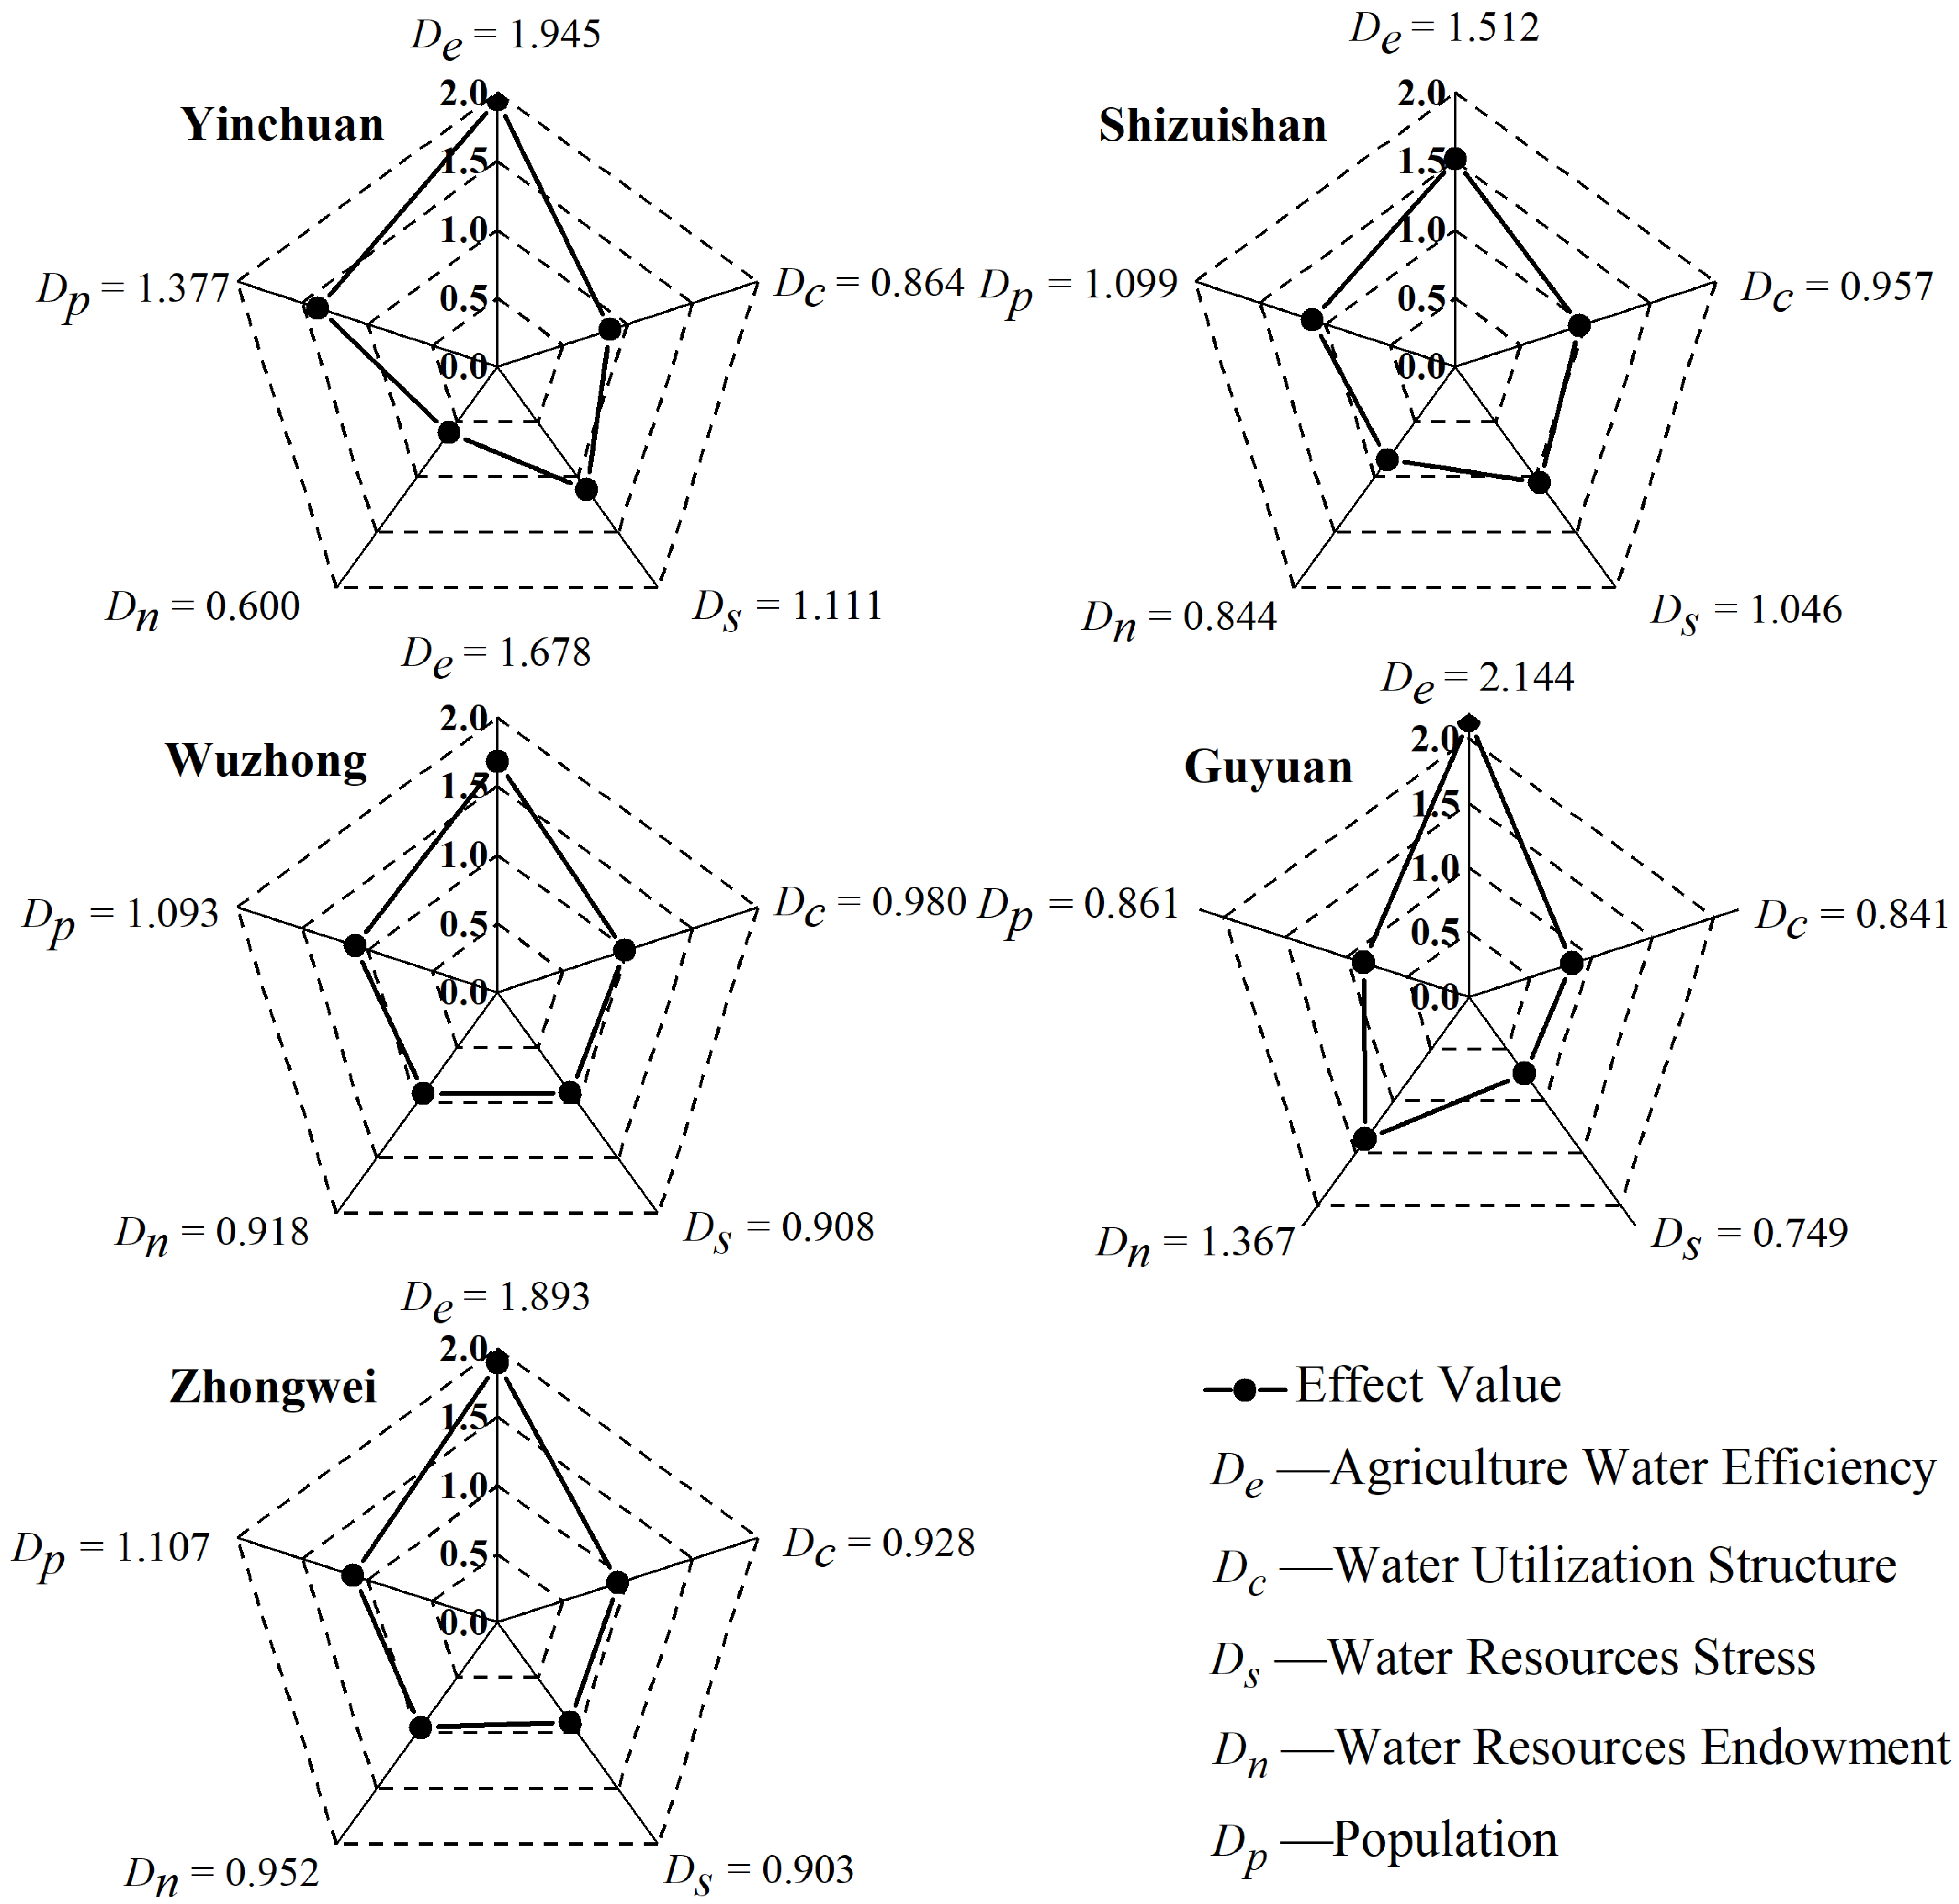
3.3. Analysis on the Driving Factors of Agricultural Production Value in Each City

Due to the differences of natural conditions and water use character, driving factors of agricultural production value were also different among the five cities in Ningxia. Both additive decomposition and multiplicative decomposition were adopted to analyze the influence of water utilization effects.

3.3.1. Additive Decomposition

According to Equations (3)–(7), the driving effects and contribution rates for the spatial difference of agricultural production value in Ningxia were calculated, as shown in Table 2. The effect of agricultural water efficiency was positive, whereas the effect of water use structure was negative for all cities, indicating that agricultural water-saving irrigation and a more rational water-use structure promoted the growth of agricultural production value. In contrast, changes in water stress showed different driving forces of agricultural production value in different cities: Yinchuan and Shizuishan exerted a weak promoting effect, while Wuzhong, Guyuan, and Zhongwei showed an inhibiting effect. Except for Guyuan, the effect of water resource endowment was negative in other cities. The main reason for this particularity was that water resources per capita in Guyuan increased from 304.3 m3 in 2007 to 416 m3 in 2017, which demonstrated that a drought–wet evolution trend existed, with differences between the southern mountainous region and the mid-northern plain in Ningxia. Similarly, population scope only played a negative role in agricultural production in Guyuan, as a consequence of eco-migration or natural population loss.

3.3.2. Multiplicative Decomposition

In order to intuitively estimate the driving force of each effect, a radar map of each city was drawn based on the results of multiplicative decomposition, as can be seen in Figure 6. Agricultural water efficiency was the dominant factor that increased the agricultural production value (De = 1.945), while water resource endowment played a strong decrement effect (Dn = 0.600) in Yinchuan. It showed the same result in Shizuishan. Differently, the effects of agricultural water efficiency (De = 2.144) and water resource endowment (Dn = 1.367) were comprehensively considered as the main factors that impacted the agricultural production value in Guyuan, with other effects’ values less than 0.9. Wuzhong and Zhongwei had similar decomposition results, in that agricultural water efficiency was the biggest contributor to agricultural production value, and other factors revealed relatively weak promoting or inhibiting effects.

3.3.3. Potential Causes and Implications of Spatial Difference

Based on the above analysis, decomposition results for the addictive and multiplicative modes were in accordance. During 2007 to 2017, the effects of agricultural water efficiency and water utilization structure showed no spatial discrepancy among different cities in Ningxia, and revealed positive and negative influences on the growth of agricultural production value, respectively. In terms of the water stress effect, Yinchuan and Shizuishan showed a weak promoting effect, while the other three cities showed the opposite result. At a county scale, areas with sufficient irrigation were mainly distributed in central-northern Ningxia, rather than in the south and the east [47]. Bounded by the Qingtongxia Water Control Project in the Yellow River, the upstream Zhongwei-Zhongning Plain and the downstream Yinchuan Plain have similar natural climatic conditions and agricultural production characteristics. Whereas, different from Yinchuan and Shizuishan in the northern plains, only the urban areas and population center of Zhongwei and Wuzhong are located near the Yellow River. Most parts of these two cities are in a loess hilly area, which caused different water utilization character compared with the plain area. In addition, the other two effects exerted a spatial difference, especially between Guyuan and the rest of the cities. Located in the Liupan Mountain area, relatively ample rainfall made Guyuan the region with the most abundant water resources in Ningxia. However, because of topography restrictions, it is more difficult to develop water resources in Guyuan, therefore prompting Guyuan as the key area of facility agriculture construction in Ningxia. Nevertheless, the relatively abundant precipitation is limited in a city field scope. For example, the Xiji–Haiyuan–Guyuan Region used to be the destitute areas, due to extreme drought and soil erosion, and hundreds of thousands of people have emigrated into the northern plain area. By building projects for drinking water safety, the water shortage here has been in remission, but has not been enough. A reliable water supply network is still needed to ensure the water supply safety for agricultural development, particularly in the mountainous region of southern Ningxia.
Our research confirmed that effect of agricultural water efficiency was the most important factor for increment of agricultural production value and showed no spatial discrepancy among different areas in Ningxia. Except for ensuring food safety, agricultural production pursue high economic effectiveness with less water consumption. In water-limited regions, agricultural profit per unit of irrigation water is a critical index for measuring the performance of agricultural system [48]. From a macro perspective, governmental authorities should further improve the deployment of water-efficient irrigation facilities, in order to save water for allocation in other sectors such as industry, municipal and ecology. In general, the modeling approach by LMDI is proved to be reasonable in similar studies. All five effects linked with one another, which is helpful for understanding the influencing mechanism and interactive relationship of multi-factors.

4. Conclusions

In this paper, driving forces of agricultural production value in Ningxia, northwest China, were explored during the period of 2007 to 2017. The LMDI method was applied to decompose agricultural production value into five influencing factors from the view of water utilization and population, covering the effects of agriculture water efficiency, water utilization structure, water resources stress, water resource endowment, and population. The main conclusions of this study are as follows.
Agricultural production value showed an overall increasing trend from 2007 to 2017 in all of Ningxia and in each city. In addition, the population exerted a similar changing regulation, except for Guyuan, due to its population relocation. The production value per unit of agricultural water and the proportion of agricultural water consumption in Ningxia showed upward and downward trends, respectively, while the water utilization ratio and water resource per capita of Ningxia and each city fluctuated during the study period.
In terms of the entire area of Ningxia, the effect of agriculture water efficiency played the most critical and positive role in the increase in agricultural production values from 2007 to 2017, while the effects of water stress, water utilization structure, and water resource endowment all showed a negative driving force, with diminishing influences in sequence. Moreover, the population factor exerted a positive effect, pushing forward the increase of the agricultural production values.
In the view of prefecture cities in Ningxia, the effect of agriculture water efficiency and water utilization structure had no spatial discrepancy among different districts, and also expressed promoting and inhibiting effects at the scale of Ningxia, respectively. However, the effect of water stress showed different driving force between cities in the northern plain area and southern hilly area. Furthermore, the effects of water resource endowment and population showed spatial differences between Guyuan and other cities due to special natural conditions and agricultural activities in Guyuan.
These findings have significant implications for the understanding of how to strengthen the agricultural economy from the perspective of water use in Ningxia. Developing water-saving irrigation and optimizing agricultural structure are the preferred strategies for agricultural economic growth. From the perspective of water resources, technical development, agricultural structure, and other critical elements affecting agricultural economy in Ningxia were indirectly reflected. However, a limitation of this study was that the extended Kaya identity established in the study only considered five driving factors for sustaining reasonability from one point of view. More possible associated factors such as planting structure and land utilization should be formulated by a similar approach. In addition, variation in water resources and their utilization caused by climate change should be examined more closely in future research.

Author Contributions

Conceptualization, J.D.; methodology, J.D.; formal analysis, J.D. and S.L.; writing—original draft preparation, J.D.; writing—review and editing, Z.Y. and G.Y.; visualization, Z.L.; supervision, Z.Y. All authors have read and agreed to the published version of the manuscript.

Funding

This research was supported by the National Key Research and Development Program (2018YFC0407705), the Science and Technology Project of PowerChina Chengdu Engineering Co., Ltd. (P49221), and the Key Research and Development Plan of Ningxia Hui Autonomous Region (2018BBF02022).

Conflicts of Interest

The authors declare no conflict of interest.

References

  1. Zhang, F.; Zhan, J.; Li, Z.; Jia, S.; Chen, S. Impacts of urban transformation on water footprint and sustainable energy in Shanghai, China. J. Clean. Prod. 2018, 190, 847–853. [Google Scholar] [CrossRef]
  2. Li, Z.; Deng, X.; Jin, G.; Mohmmed, A.; Arowolo, A.O. Tradeoffs between agricultural production and ecosystem services: A case study in Zhangye, Northwest China. Sci. Total Environ. 2020, 707, 136032. [Google Scholar] [CrossRef] [PubMed]
  3. Ma, L.; Long, H.; Tang, L.; Tu, S.; Zhang, Y.; Qu, Y. Analysis of the spatial variations of determinants of agricultural production efficiency in China. Comput. Electron. Agric. 2021, 180, 105890. [Google Scholar] [CrossRef]
  4. Lin, J.Y. Rural Reforms and Agricultural Growth in China. Am. Econ. Rev. 1992, 82, 34–51. [Google Scholar]
  5. Chen, P.; Yu, M.; Chang, C.; Hsu, S. Total factor productivity growth in China’s agricultural sector. China Econ. Rev. 2008, 19, 580–593. [Google Scholar] [CrossRef]
  6. Guo, P.; Yu, K.; Huang, Y. Changes and Decomposition of Agricultural TFP Regional Disparities in China: Study of F(a)re-Primont TFP Index. Econ. Geogr. 2013, 33, 143–147. [Google Scholar]
  7. Richey, A.S.; Thomas, B.F.; Lo, M.; Famiglietti, J.S.; Swenson, S.; Rodell, M. Uncertainty in global groundwater storage estimates in a Total Groundwater Stress framework. Water Resour. Res. 2015, 51, 5198–5216. [Google Scholar] [CrossRef]
  8. Fischer, G.; Tubiello, F.N.; van Velthuizen, H.; Wiberg, D.A. Climate change impacts on irrigation water requirements: Effects of mitigation, 1990–2080. Technol. Soc. 2007, 74, 1083–1107. [Google Scholar] [CrossRef] [Green Version]
  9. Galán-Martín, Á.; Vaskan, P.; Antón, A.; Esteller, L.J.; Guillén-Gosálbez, G. Multi-objective optimization of rainfed and irrigated agricultural areas considering production and environmental criteria: A case study of wheat production in Spain. J. Clean. Prod. 2017, 140, 816–830. [Google Scholar] [CrossRef]
  10. Rosegrant, M.; Ringler, C.; Zhu, T. Water for Agriculture: Maintaining Food Security Under Growing Scarcity. Annu. Rev. Environ. Resour. 2009, 34, 205–222. [Google Scholar] [CrossRef]
  11. Fan, L.; Liu, G.; Wang, F.; Ritsema, C.J.; Geissen, V. Domestic Water Consumption under Intermittent and Continuous Modes of Water Supply. Water Resour. Manag. 2014, 28, 853–865. [Google Scholar] [CrossRef]
  12. Hu, Z.; Chen, Y.; Yao, L.; Wei, C.; Li, C. Optimal allocation of regional water resources: From a perspective of equity–efficiency tradeoff. Resour. Conserv. Recycl. 2016, 109, 102–113. [Google Scholar] [CrossRef]
  13. Levidow, L.; Zaccaria, D.; Maia, R.; Vivas, E.; Todorovic, M.; Scardigno, A. Improving water-efficient irrigation: Prospects and difficulties of innovative practices. Agric. Water Manag. 2014, 146, 84–94. [Google Scholar] [CrossRef] [Green Version]
  14. Jiang, Y.; Xu, X.; Huang, Q.; Huo, Z.; Huang, G. Optimizing regional irrigation water use by integrating a two-level optimization model and an agro-hydrological model. Agric. Water Manag. 2016, 178, 76–88. [Google Scholar] [CrossRef] [Green Version]
  15. Pandey, R.K.; Maranville, J.W.; Admou, A. Deficit irrigation and nitrogen effects on maize in a Sahelian environment: I. Grain yield and yield components. Agric. Water Manag. 2000, 46, 1–13. [Google Scholar] [CrossRef]
  16. Viswanatha, G.B.; Ramachandrappa, B.K.; Nanjappa, H.V. Soil–plant water status and yield of sweet corn (Zea mays L. cv. Saccharata) as influenced by drip irrigation and planting methods. Agric. Water Manag. 2002, 55, 85–91. [Google Scholar] [CrossRef]
  17. Alrwis, K.N.; Ghanem, A.M.; Alnashwan, O.S.; Al Duwais, A.A.M.; Alaagib, S.A.B.; Aldawdahi, N.M. Measuring the impact of water scarcity on agricultural economic development in Saudi Arabia. Saudi J. Biol. Sci. 2021, 28, 191–195. [Google Scholar] [CrossRef]
  18. Wang, W.; Hu, P.; Wang, J.; Zhao, J.; Liu, H.; Yang, Z. Scenario analysis for the sustainable development of agricultural water in the Wuyuer River basin based on the WEP model with a reservoir and diversion engineering module. Sci. Total Environ. 2021, 758, 143668. [Google Scholar] [CrossRef]
  19. Li, M.; Xu, Y.; Fu, Q.; Singh, V.P.; Liu, D.; Li, T. Efficient irrigation water allocation and its impact on agricultural sustainability and water scarcity under uncertainty. J. Hydrol. 2020, 586, 124888. [Google Scholar] [CrossRef]
  20. Ang, B.W.; Choi, K.H. Decomposition of Aggregate Energy and Gas Emission Intensities for Industry: A Refined Divisia Index Method. Energy J. 1997, 18, 59–73. [Google Scholar] [CrossRef]
  21. Ang, B.W.; Zhang, F.Q.; Choi, K. Factorizing changes in energy and environmental indicators through decomposition. Energy 1998, 23, 489–495. [Google Scholar] [CrossRef]
  22. Liu, L.; Fan, Y.; Wu, G.; Wei, Y. Using LMDI method to analyze the change of China’s industrial CO2 emissions from final fuel use: An empirical analysis. Energy Policy 2007, 35, 5892–5900. [Google Scholar] [CrossRef]
  23. Zhang, W.; Xu, Y.; Wang, C.; Streets, D.G. Assessment of the driving factors of CO2 mitigation costs of household biogas systems in China: A LMDI decomposition with cost analysis model. Renew. Energy 2022, 181, 978–989. [Google Scholar] [CrossRef]
  24. Timma, L.; Zoss, T.; Blumberga, D. Life after the financial crisis. Energy intensity and energy use decomposition on sectorial level in Latvia. Appl. Energy 2016, 162, 1586–1592. [Google Scholar] [CrossRef]
  25. Zhao, C.; Chen, B. Driving force analysis of the agricultural water footprint in China based on the LMDI method. Environ. Sci. Technol. 2014, 48, 12723–12731. [Google Scholar] [CrossRef]
  26. Liu, Y.; Lin, J.; Li, H.; Huang, R.; Han, H. Driving Forces of Food Consumption Water Footprint in North China. Water 2021, 13, 810. [Google Scholar] [CrossRef]
  27. Zhao, X.; Tillotson, M.R.; Liu, Y.W.; Guo, W.; Yang, A.H.; Li, Y.F. Index decomposition analysis of urban crop water footprint. Ecol. Model. 2017, 348, 25–32. [Google Scholar] [CrossRef] [Green Version]
  28. Shi, C.; Wang, Y.; Zhang, C.; Zhang, L. Spatial-Temporal Differences in Water Footprints of Grain Crops in Northwest China: LMDI Decomposition Analysis. Water 2019, 11, 2457. [Google Scholar] [CrossRef] [Green Version]
  29. Mahony, T.O. Decomposition of Ireland’s carbon emissions from 1990 to 2010: An extended Kaya identity. Energy Policy 2013, 59, 573–581. [Google Scholar] [CrossRef] [Green Version]
  30. Ortega-Ruiz, G.; Mena-Nieto, A.; García-Ramos, J.E. Is India on the right pathway to reduce CO2 emissions? Decomposing an enlarged Kaya identity using the LMDI method for the period 1990–2016. Sci. Total Environ. 2020, 737, 139638. [Google Scholar] [CrossRef]
  31. Wu, Q.; Zuo, Q.; Ma, J.; Zhang, Z.; Jiang, L. Evolution analysis of water consumption and economic growth based on Decomposition-Decoupling Two-stage Method: A case study of Xinjiang Uygur Autonomous Region, China. Sustain. Cities Soc. 2021, 75, 103337. [Google Scholar] [CrossRef]
  32. Fu, T.; Xu, C.; Yang, L.; Hou, S.; Xia, Q. Measurement and driving factors of grey water footprint efficiency in Yangtze River Basin. Sci. Total Environ. 2022, 802, 149587. [Google Scholar] [CrossRef]
  33. Shao, S.; Yang, L.; Gan, C.; Cao, J.; Geng, Y.; Guan, D. Using an extended LMDI model to explore techno-economic drivers of energy-related industrial CO2 emission changes: A case study for Shanghai (China). Renew. Sustain. Energy Rev. 2016, 55, 516–536. [Google Scholar] [CrossRef] [Green Version]
  34. Zhang, S.; Su, X.; Singh, V.P.; Ayantobo, O.O.; Xie, J. Logarithmic Mean Divisia Index (LMDI) decomposition analysis of changes in agricultural water use: A case study of the middle reaches of the Heihe River basin, China. Agric. Water Manag. 2018, 208, 422–430. [Google Scholar] [CrossRef]
  35. Wang, F.; Yu, C.; Xiong, L.; Chang, Y. How can agricultural water use efficiency be promoted in China? A spatial-temporal analysis. Resour. Conserv. Recycl. 2019, 145, 411–418. [Google Scholar] [CrossRef]
  36. Azad, M.A.S.; Ancev, T. Measuring environmental efficiency of agricultural water use: A Luenberger environmental indicator. J. Environ. Manag. 2014, 145, 314–320. [Google Scholar] [CrossRef] [PubMed]
  37. Veettil, P.C.; Speelman, S.; van Huylenbroeck, G. Estimating the Impact of Water Pricing on Water Use Efficiency in Semi-arid Cropping System: An Application of Probabilistically Constrained Nonparametric Efficiency Analysis. Water Resour. Manag. 2013, 27, 55–73. [Google Scholar] [CrossRef]
  38. Sun, Y.; Liu, N.; Shang, J.; Zhang, J. Sustainable utilization of water resources in China: A system dynamics model. J. Clean. Prod. 2017, 142, 613–625. [Google Scholar] [CrossRef]
  39. Kumar, M.D.; van Dam, J.C. Drivers of change in agricultural water productivity and its improvement at basin scale in developing economies. Water Int. 2013, 38, 312–325. [Google Scholar] [CrossRef]
  40. Cai, X.; Rosegrant, M.W. Optional water development strategies for the Yellow River Basin: Balancing agricultural and ecological water demands. Water Resour. Res. 2004, 40, W08S04. [Google Scholar] [CrossRef] [Green Version]
  41. Falkenmark, M.; Lundqvist, J.; Widstrand, C. Macro-scale water scarcity requires micro-scale approaches. Nat. Resour. Forum 1989, 13, 258–267. [Google Scholar] [CrossRef]
  42. Liu, X.; Shen, Y.; Guo, Y.; Li, S.; Guo, B. Modeling demand/supply of water resources in the arid region of northwestern China during the late 1980s to 2010. J. Geogr. Sci. 2015, 25, 573–591. [Google Scholar] [CrossRef]
  43. Munia, H.; Guillaume, J.H.A.; Mirumachi, N.; Porkka, M.; Wada, Y.; Kummu, M. Water stress in global transboundary river basins: Significance of upstream water use on downstream stress. Environ. Res. Lett. 2016, 11, 14002. [Google Scholar] [CrossRef]
  44. Chen, Y.; Zhang, Z.; Tao, F. Impacts of climate change and climate extremes on major crops productivity in China at a global warming of 1.5 and 2.0 °C. Earth Syst. Dyn. 2018, 9, 543–562. [Google Scholar] [CrossRef] [Green Version]
  45. Su, T.; Feng, G. Spatial-temporal variation characteristics of global evaporation revealed by eight reanalyses. Sci. China Earth Sci. 2015, 58, 255–269. [Google Scholar] [CrossRef]
  46. Zhang, Y.; Zhang, B.; Liu, Y.; Zhang, D.; Zhou, D. Spatial and Temporal Pattern of Strong Drought and Its Influence Factors in Ningxia from 1960–2012. J. Catastrophology 2016, 31, 120–127. [Google Scholar]
  47. Du, J.; Yang, Z.; Wang, H.; Yang, G.; Li, S. Spatial–Temporal Matching Characteristics between Agricultural Water and Land Resources in Ningxia, Northwest China. Water 2019, 11, 1460. [Google Scholar] [CrossRef] [Green Version]
  48. Cai, X.; Rosegrant, M.W.; Ringler, C. Physical and economic efficiency of water use in the river basin: Implications for efficient water management. Water Resour. Res. 2003, 39, 1013. [Google Scholar] [CrossRef]
Figure 1. Location and administrative division of Ningxia Hui Autonomous Region.
Water 13 03639 g001
Figure 2. Changes in agricultural production value and population in Ningxia and five cities from 2007 to 2017: (a) stacked column chart of population in Ningxia; (b) stacked area chart of agricultural production value in Ningxia; (c) population change of each city from 2007; (d) change in agricultural production value in each city from 2007.
Water 13 03639 g002
Figure 3. Agricultural production value per unit of water use and the proportion of agricultural water use in Ningxia during 2007–2017.
Water 13 03639 g003
Figure 4. Indexes related to effects of water resource stress and endowment of each city in Ningxia during 2007–2017: (a) total water resource amount of each city; (b) water utilization ratio of each city; (c) per capita water resource of each city.
Water 13 03639 g004
Figure 5. Aggregate decomposition of water utilization effect on the change in agricultural production value in Ningxia during 2007–2017.
Water 13 03639 g005
Figure 6. Multiplication decomposition results of water utilization effect on the change in agricultural production values in each city of Ningxia during 2007–2017.
Water 13 03639 g006
Table 1. Additive decomposition of water utilization effect on the change in agricultural production values in Ningxia during 2007–2017 (CNY 108).
Year Δ G e Δ G c Δ G s Δ G n Δ G p Total Effect
2007~20083.3440.94919.035−15.3741.4039.358
2008~20098.479−1.0917.639−12.3741.4804.134
2009~201029.684−0.985−13.81012.3631.70828.960
2010~20118.830−1.19712.656−11.6311.62110.279
2011~201217.525−1.724−45.07233.1382.0055.872
2012~20139.595−5.066−0.4015.4401.88811.455
2013~2014−0.094−2.87815.689−21.9751.982−7.276
2014~201513.1292.24117.117−18.9421.73115.275
2015~20169.512−2.161−23.4946.5501.937−7.656
2016~2017−10.837−1.710−17.52518.8781.796−9.398
Accumulative Value89.168−13.623−28.165−3.92717.55161.004
Table 2. Driving effects and contribution rates of the spatial differences in change of agricultural production value in each city of Ningxia during 2007–2017 (CNY 108).
City Δ G e Δ G c Δ G s Δ G n Δ G p Total Effect
Yinchuan25.027−5.9780.751−16.53611.81015.073
166%−40%5%−110%78%100%
Shizuishan7.367−0.9130.546−3.2611.9575.696
129%−16%10%−57%34%100%
Wuzhong15.816−0.709−5.929−1.0062.98011.153
142%−6%−53%−9%27%100%
Guyuan17.924−4.984−6.70711.222−4.01713.438
133%−37%−50%84%−30%100%
Zhongwei21.554−3.036−5.877−0.2753.27815.644
138%−19%−38%−2%21%100%
Publisher’s Note: MDPI stays neutral with regard to jurisdictional claims in published maps and institutional affiliations.

