
Forest Fires Reduce Snow-Water Storage and Advance the Timing of Snowmelt across the Western U.S.


1
Department of Geology, Western Washington University, Bellingham, WA 98225, USA
2
Department of Environmental Science and Management, Portland State University, Portland, OR 97201, USA
*
Author to whom correspondence should be addressed.
Water 2021, 13(24), 3533; https://doi.org/10.3390/w13243533
Submission received: 14 November 2021
/
Revised: 7 December 2021
/
Accepted: 8 December 2021
/
Published: 10 December 2021
(This article belongs to the Section Hydrology)
Abstract
:As climate warms, snow-water storage is decreasing while forest fires are increasing in extent, frequency, and duration. The majority of forest fires occur in the seasonal snow zone across the western US. Yet, we do not understand the broad-scale variability of forest fire effects on snow-water storage and water resource availability. Using pre- and post-fire data from 78 burned SNOTEL stations, we evaluated post-fire shifts in snow accumulation (snow-water storage) and snowmelt across the West and Alaska. For a decade following fire, maximum snow-water storage decreased by over 30 mm, and the snow disappearance date advanced by 9 days, and in high severity burned forests snowmelt rate increased by 3 mm/day. Regionally, forest fires reduced snow-water storage in Alaska, Arizona, and the Pacific Northwest and advanced the snow disappearance date across the Rockies, Western Interior, Wasatch, and Uinta mountains. Broad-scale empirical results of forest fire effects on snow-water storage and snowmelt inform natural resource management and modeling of future snow-water resource availability in burned watersheds.
1. Introduction
Across the western US, the majority of freshwater, critical for drinking, irrigation, industrial use, and ecosystem health, originates as snowpack in mountainous headwaters [1,2,3,4]. The volume of winter snow-water storage controls the volume of downstream water resources the following summer, while the timing of snowmelt is essential for the timing of downstream water resource availability [5,6,7]. Headwater snow storage depends on accumulated snowpacks remaining cold with a negative snowpack energy balance into spring [8].
A warming climate is reducing snow-water storage, driving earlier snowmelt and lower summer stream flows, raising stream temperatures [4,5,6,7,9], and lengthening the summer drought and duration of the fire season [10]. Climate warming is shifting the timing of snowmelt earlier, lengthening the period of snowmelt, and therefore slowing the rate of snowmelt [4,10,11]. Forest fires are increasing in frequency, extent, and duration, particularly during the years of early snowmelt [12,13]. The vast majority of forest fires occur in the seasonal snow zone across the West [14].
Forest canopies reduce snow accumulation in the snowpack through canopy interception of snowfall, and influence snowmelt by shading of the snowpack from shortwave radiation and emission of longwave radiation from trees [15,16,17]. Forest fires further alter snowpack mass and energy balance predominately through changes to the post-fire forest structure and snowpack radiation balance [14,18,19]. The more open post-fire forest structure intercepts less falling snow, so deeper snowpacks may accumulate in burned forests [20,21]. More solar radiation is transmitted through the more open post-fire forest canopy, increasing the total sunlight energy available at the snowpack surface. The post-fire charred forest sheds black carbon (BC) and burned woody debris (BWD) on the snowpack for many winters following fire [19]. These light absorbing particles concentrate on the snowpack surface during snowmelt, darkening the snow surface albedo, and profoundly increasing the net snowpack shortwave radiation [14,18,19]. Post-fire increases in net snowpack shortwave radiation are partially balanced by decreases in net snowpack longwave radiation [22], and are offset by increased snow sublimation [23]. Overall, post-fire changes to the snowpack energy balance drive earlier and potentially increase the speed of snowmelt across burned watersheds for over a decade following forest fire occurrence [14,18,19,22,24]. Post-fire changes to snowpack mass balance are still unknown due to contradictory evidence across study locations in the trade-offs of decreased snowfall interception and increased snowpack energy balance following fire potentially driving increased melt.
Forest fire impacts on snow-water resources are extensive and persistent, and could have profound consequences for water resource availability [19]. However, no previous study has empirically investigated the broad-scale variability of forest fire effects on snow-water storage and snowmelt timing. Existing evidence of forest fire effects on snow accumulation and snowmelt is based on few individual site locations, or coarse resolution remote sensing data. It is critical that we understand the broad-scale impacts of forest fires on snow-water storage and availability to support better management approaches to solving water storage problems and mitigating the effects of climate change across the western US.
The aim of this work was to empirically quantify the magnitude and spatio-temporal variability of forest fire effects on snow-water storage and snowmelt timing across the West (Figure S1). Overall, we anticipated the post-fire environment to have similar impacts as climate warming to snow accumulation and snowmelt metrics. Our hypotheses include, H1, decreased maximum snow-water storage; H2, advanced timing of peak snow water equivalent (SWE); H3, advanced snowmelt; and H4, decreased snowmelt rate, following forest fire in burned forested watersheds (Figure 1).
2. Materials and Methods
Post-fire snow hydrologic responses were evaluated using four annual snow metrics calculated for 78 Snow Telemetry (SNOTEL) stations located within forest fire perimeters burned from 1984–2019 in the eleven western states including, Arizona, California, Colorado, Idaho, Montana, New Mexico, Nevada, Oregon, Washington, Wyoming, and Utah, and Alaska (Figure 2, Table S1).
2.1. Study Sites and Data Availability
Over 900 sites SNOTEL stations, managed by the Natural Resources Conservation Service, are located across the western US and Alaska. These SNOTEL sites have been monitoring snowpack, precipitation, temperature and other climatic conditions for decades. These automated snow monitoring stations are located in remote high-elevation mountain watersheds and use radio telemetry to transmit the data to the Water and Climate Information System database where they are used to make water supply forecasts. These SNOTEL stations are typically located in open clearings in forests at a consistent elevation zone, which is representative of snow-water storage across the greater watershed [25].
Using geospatial analysis, we found 78 SNOTEL sites that were located within the burn perimeters of forest fires which occurred from 1984–2019 and have a record of available snow water equivalent data. Forest fire burn perimeters and burn severity in the location of SNOTEL sites was defined using the Monitoring Trends in Burn Severity (MTBS) database for fires larger than 1000 acres and burned from 1984 to 2019, available at http://www.mtbs.gov/direct-download (accessed on 13 July 2020).
Daily values for SWE, snow-adjusted precipitation, mean air temperature, soil moisture, and solar radiation, were obtained for the 78 SNOTEL sites located within MTBS defined burn perimeters from the NRCS Report generator 2.0 (https://wcc.sc.egov.usda.gov/reportGenerator/ (accessed on 17 April 2020)). All data variables were not available for every site, but if a site had SWE it was used in the analysis. Many of these sites have data collections starting in the nineteen-eighties or earlier, thus, providing a record of almost forty years for this empirical analysis. To evaluate regional trends, the 78 burned SNOTEL sites were classified into eight snow-eco-regions as defined by Sun et al., 2019 (Figure 2). These snow-eco-regions are characterized primarily by temperature and relative humidity regimes, which drive the variability in the snow accumulation and snowmelt patterns across different snow climates [26]. The associated sample size of the 78 burned SNOTEL stations within these regions are, Alaska (n = 2), the Northern Rockies (n = 7), the Middle Rockies (n = 13), the Southern Rockies (n = 5), the Wasatch/Uintas (n = 8), the Western Interior (n = 14), the Cascades (n = 15), and Arizona/New Mexico (n = 14) [26].
2.2. Snow Metrics
We derived and evaluated four snow metrics from daily data available for the 78 burned SNOTEL stations for pre- and post-fire periods, including, peak snow water equivalent (peak SWE), peak SWE date (PSD), snow disappearance date (SDD), and snowmelt rate (SMR). Snow metrics are calculated for 5 and 10 years before and after fire occurrence to evaluate the immediate and near-term impact of the physical and radiative forest fire effects on snow hydrological processes and to minimize uncertainty over longer periods due to vegetation regeneration and smaller sample sizes of stations with data available (Figure 3). Peak SWE was defined as the maximum SWE volume for the water year. Peak SWE date was defined as the date of peak SWE for the water year. SDD was defined as the first snow-free day following peak SWE, where SWE equals zero millimeters. The SMR was calculated using the following formula:
where SMR is snow melt rate in millimeters per day, SDD is snow disappearance date in millimeters, and peak SWE is the peak snow water equivalent in millimeters.
SMR= (〖peak SWE〗 − 〖SDD〗)/(〖PSD〗 − 〖SDD〗)
Snow metrics were normalized in order to evaluate the post-fire hydrologic responses and to remove the influence of interannual climate variability and climate change trends in snow metrics. First, annual snow metrics were differenced from the pre-fire average to produce anomaly residuals and to specifically evaluate the post-fire shift in snow metrics. The pre-fire average snow metric for each site was subtracted from the annual snow metric for the period of record across pre- and post-fire values.
Snow metrics in burned sites were normalized by reference sites to account for interannual hydroclimatic variability, to remove the background trends in snow metrics over time, and to isolate the shift in snow accumulation and snowmelt (Δ snow metric) as a result of the forest fire occurrence (Figure 4). This was done using reference snow metrics from a suite of 91 unburned SNOTEL sites located within 25 km of the burned SNOTEL sites. The unburned reference snow metrics were derived identically to the burned snow metrics for each site, and regionally averaged for 5- and 10-years following fire occurrence. To evaluate the post-fire shift in snow metrics without the underlying background trend due to climate change, the snow metrics from each burned SNOTEL site were then differenced from the regional average snow metric. The associated sample size of the 91 reference SNOTEL stations within the regions are, Alaska (n = 2), the Northern Rockies (n = 3), the Middle Rockies (n = 19), the Southern Rockies (n = 6), the Wasatch/Uintas (n = 21), the Western Interior (n = 15), the Cascades (n = 21), and Arizona/New Mexico (n = 4) [26].
The four final normalized pre- and post-fire snow metrics were analyzed using non-parametric Welch’s T-tests. The T-tests were completed on each standardized metric for each of the eight ecoregions and for the western US, using time periods of five and ten years before and after the burn year of a site. To investigate potential mechanisms driving the shifts in pre- and post-fire snow accumulation and melt metrics, we also evaluated the normalized micrometeorological data available for the 78 burned SNOTEL stations including, air temperature, precipitation, soil moisture, solar radiation, and wind speed. These data were processed and analyzed identically to the snow metric data, but because of the limited sample size and the uneven distribution of stations with these additional sensors, the pre- and post-fire changes for soil moisture, solar radiation, and wind speed were evaluated together across the western US. Significance for a change in the metrics was determined using an alpha value of 0.05. Geospatial analysis was conducted using ArcInfo 10.8.1 [27], and statistical analysis was conducted using R version 4.0.3 [28].
3. Results
Due to climate warming, background trends in snow accumulation and snowmelt patterns were observed over the period of record at all SNOTEL sites. Specifically, over the past 50 years, peak SWE has declined, the peak SWE date advanced earlier in spring, snow disappearance date advanced earlier in spring, and snowmelt rate slowed in all SNOTEL sites across the West (Table 1).
3.1. Post-Fire Change in Volume and Timing of Snow-Water Storage
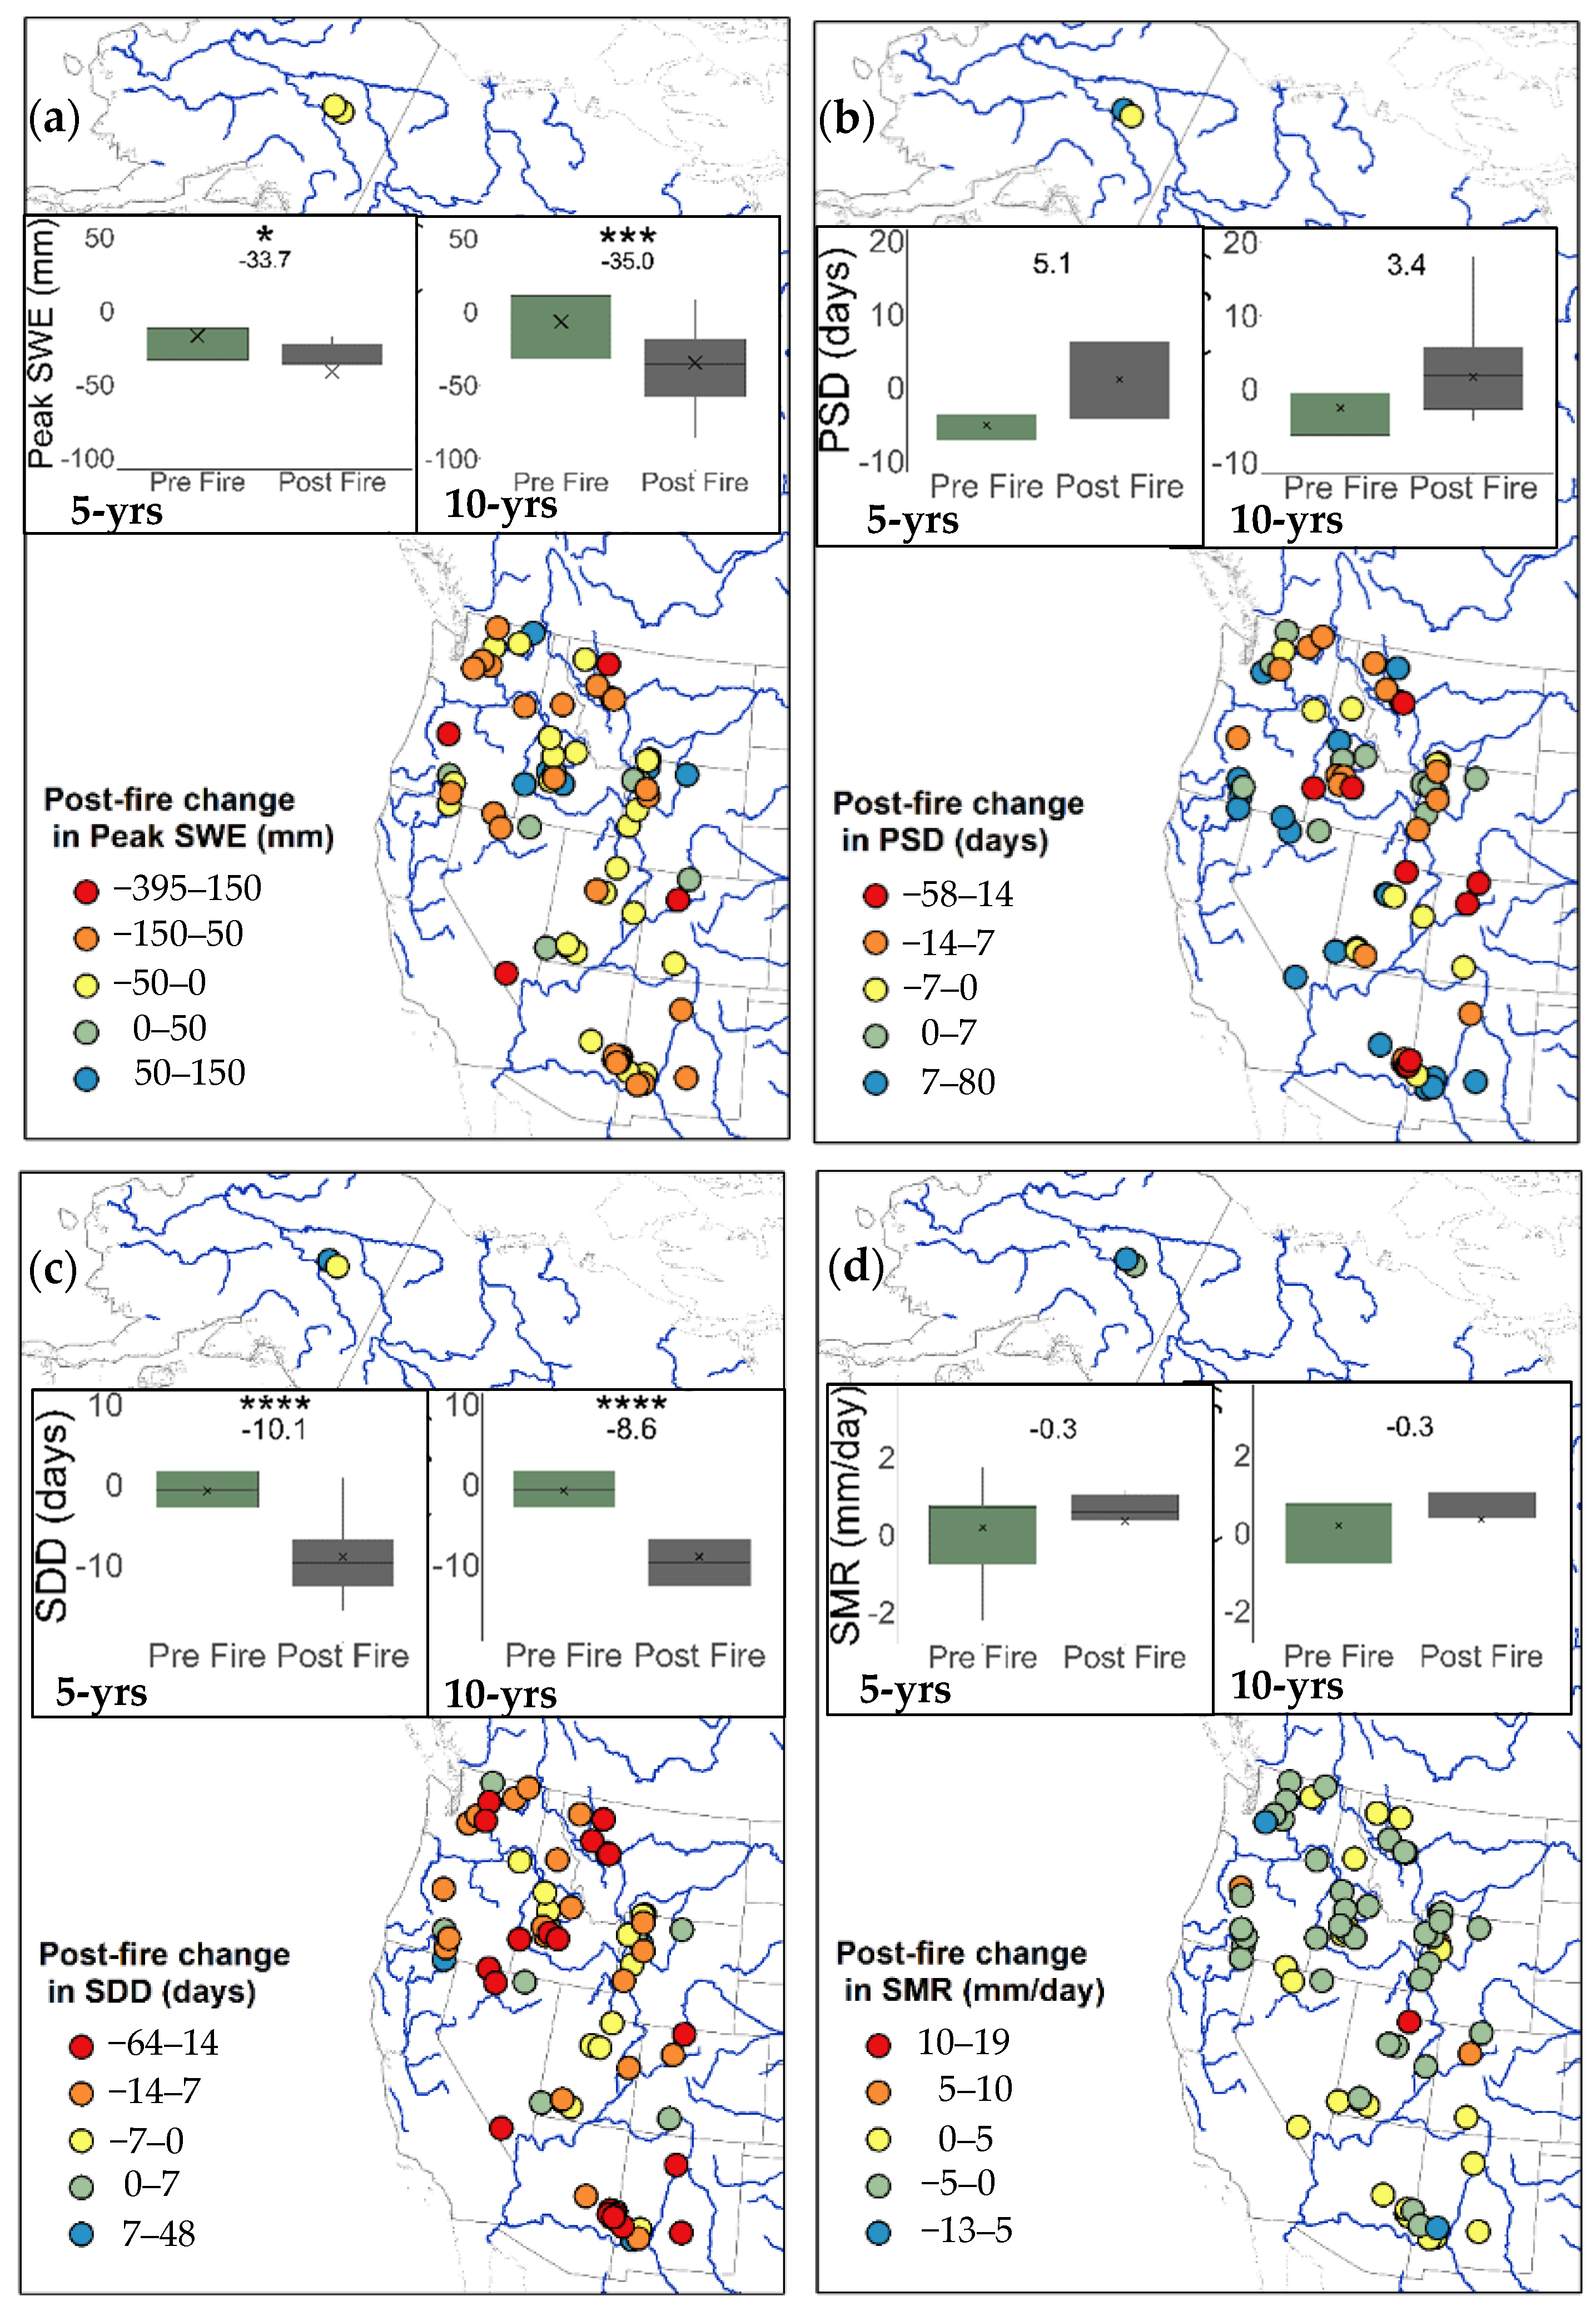
Forest fire disturbance reduced snow-water storage (peak SWE) in sites across the western seasonal snow zone (Figure 5). Maximum annual snowpack volume (peak SWE) decreased persistently for 5- and 10-years following forest fire (Δ peak SWE 5-year mean = −35 mm, Δ peak SWE 10-year mean = −34 mm). Across the West, Δ peak SWE was more profoundly impacted in high severity burned forests than low severity burned forests or unburned forests within the burn perimeter (Δ peak SWE in high severity burned forests, 10-year mean = −86 mm; Δ peak SWE in low severity burned forests, 10-year mean = −37 mm; Table S2).
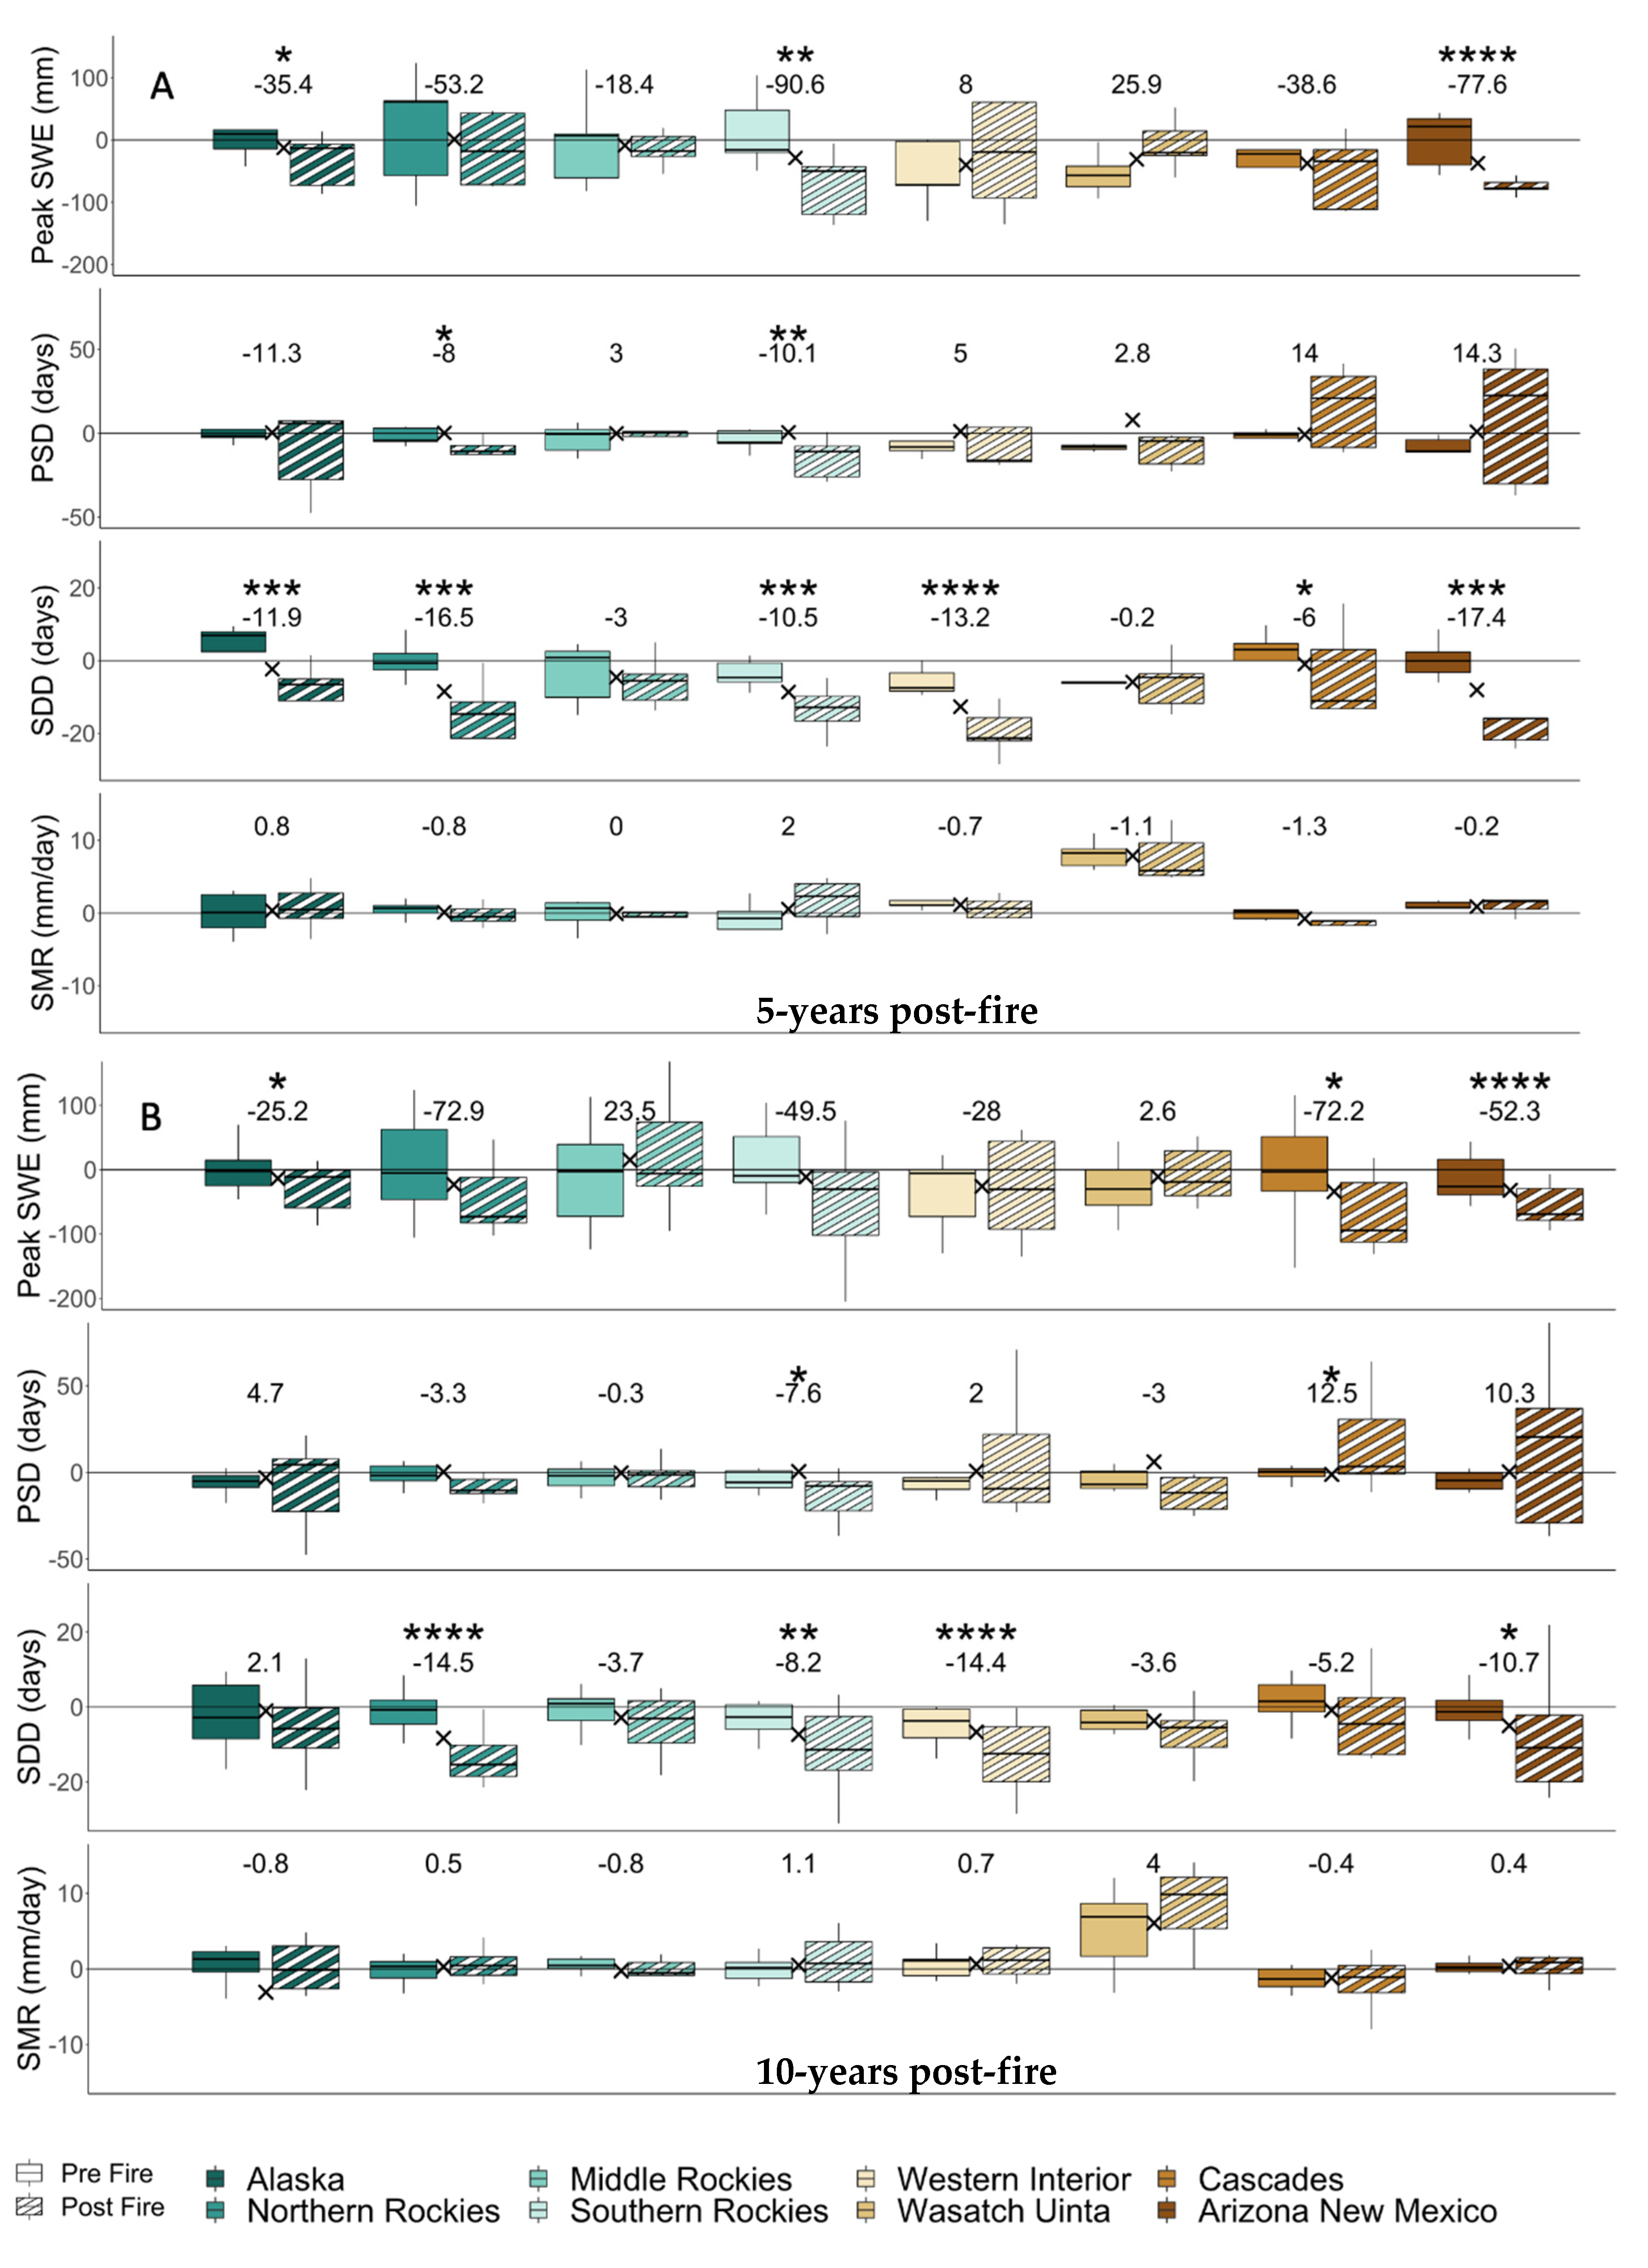
Regionally, forest fires had a variable influence on the total volume of peak SWE (Figure 6). Reductions in peak SWE were observed in the maritime regions and warm snow climates including Alaska (Δ peak SWE 5-year mean = −35 mm, Δ peak SWE 10-year mean = −25 mm), and the Cascades (Δ peak SWE 10-year mean = −72 mm), and the southwest states (Arizona/New Mexico, Δ peak SWE 5-year mean = −78 mm, Δ peak SWE 10-year mean = −52 mm), and in the Southern Rockies (Δ peak SWE 5-year mean = −91 mm). No distinct regional patterns were observed in the influence of burn severity on the regional differences of changes to peak SWE following forest fires.
Across the western US, forest fire disturbances did not significantly influence the timing of peak SWE date, demonstrating that the date of maximum snow accumulation was not shifted overall due to forest fire occurrence. Regional variability of forest fire impacts on peak SWE day demonstrates consistent trends, where the Cascades region experienced advanced peak SWE date (Δ peak SWE day 10-year mean = −5 days), as well as the Southern Rockies (Δ peak SWE day 5-year mean = −10 days, Δ peak SWE day 10-year mean = −8 days) following forest fire (Figure 6).
3.2. Post-Fire Change in Snow Disappearance Date
Forest fire disturbance advanced the timing of snowmelt in sites across the western seasonal snow zone (Figure 5). The snow disappearance date shifted to over a week earlier in spring following forest fire disturbance for 10 years following fire (n = 78, Δ SDD 5-year mean = −10 days, Δ SDD 10-year mean = −9 days). SDD was more immediately impacted at 5 years following fire, than later at 10 years following fire. Across the West, Δ SDD was more profoundly impacted in high severity burned forests than low severity burned forests or unburned forests within the burn perimeter (Δ SDD in high severity burned forests, 10-year mean = −14 days; Δ SDD in low severity burned forests, 10-year mean = −4 days; Table S2).
Forest fire had a significant influence on SDD in most regions including Alaska (Δ SDD 5-year mean = −12 days), the Cascades (Δ SDD 5-year mean = −6 days), the Northern Rockies (Δ SDD 5-year mean = −17 days, Δ SDD 10-year mean = −15 days), Southern Rockies (Δ SDD 5-year mean = −11 days, Δ SDD 10-year mean = −8 days), the Western Interior (Δ SDD 5-year mean = −13 days, Δ SDD 10-year mean = −14 days), and in Arizona/New Mexico (Δ SDD 5-year mean = −17 days, Δ SDD 10-year mean = −11 days, Figure 6). In regions where SDD advanced following forest fire, the magnitude of the changes was generally more profound following a high severity forest fire than a low severity forest fire or unburned forest in the burn perimeter (Table S2).
3.3. Post-Fire Change in Snowmelt Rate
Overall, the snowmelt rate did not significantly shift following forest fire across all 78 burned SNOTEL sites across the West. However, snowmelt occurred faster for 10 years following fire in the sites that experienced high severity forest fire than low severity forest fire across the West (Δ SMR in high severity burned forests, 10-year mean = +3 mm/day; Δ SMR in low severity burned forests, non-significant).
Most regions experienced no significant change in SMR following forest fire overall, except one region, the Cascades, where SMR decreased following forest fire (Δ SMR 5-year mean = 2 mm/day). High severity burned forests had a more profound impact on SMR than low severity burned forests or unburned forests within the burn perimeter in the Cascades where SMR decreased, and in the Northern and Middle Rockies where SMR increased following fire.
3.4. Post-Fire Variability of Snow Accumulation and Snowmelt
Forest fire also increased the variability in snow water storage (peak SWE), and snowmelt (SDD) compared to the pre-fire conditions. Variability of all snow metrics increased following forest fire, which may reflect the post-fire heterogeneity of hydrologic responses, due to the post-fire heterogeneity of burned forest structure and the post-fire radiative forcing on snow, and the greater variability in these related processes across snow climates of the western US.
3.5. Post-Fire Change in Micro-Meteorology
Post-fire shifts in micro-meteorological variables provide an insight into the mechanisms driving the observed post-fire changes in snow accumulation and snowmelt. Following forest fire, the air temperature slightly increased (Δ air temperature, 5-year mean = 0.4 °C, Δ air temperature 10-year mean == 0.2 °C), soil moisture decreased (Δ soil moisture at 2 cm depth, 10-year mean == −7 %), wind speed increased (Δ wind speed, 10-year mean == 6.9 km hr−1, and solar radiation profoundly increased (Δ solar radiation 10-year mean == 1121 W m−2) across the 78 burned SNOTEL sites (Table S3). As the background climate is warming, the additional perturbation of forest fire disturbance further exacerbated hydroclimatic trends.
4. Discussion
Snowmelt drives the spring freshet, and controls the volume of water resources and timing of downstream water resource availability across the West [3]. Climate warming is reducing snow-water storage, advancing the timing of peak SWE, and driving earlier snowmelt and snow disappearance over the period of record [29]. We observed the impact of climate change on all snow metrics, and by normalizing the burned site metrics we highlight the additional compounding changes to snow hydrology occurring after forest fire occurrence. Post-fire changes to the volume of snow-water storage and the timing of snowmelt may alter the quantity and availability of snow-water resources [15,20,30,31]. Multiple positive feedbacks (“vicious cycles”) interact as the climate warms, where earlier snowmelt drives drier summers and increases forest fires [13]; these forest fires then further reduce snow-water resources and advance the timing of snowmelt [19]. Our empirical analysis of snow metrics derived from pre- and post-fire data from 78 SNOTEL sites located in burned forests demonstrates the broad-scale impact on the magnitude and variability of forest fire effects on the bulk of annual total volume of stored snowpack and timing of snowmelt.
Our research demonstrates that forest fires profoundly reduced snow-water storage and advanced snowmelt timing, while high severity forest fires increased snowmelt rates for at least 10 years following fire across the western US and Alaska. The post-fire shifts to snow accumulation and melt are controlled by post-fire shifts in the structure of the forest and the associated shifts in snowpack energy balance [15,22,32,33,34,35]. Similar to previous work focused on individual site locations [22,24,32], our broad-scale evaluation of post-fire snow metrics found that high severity forest fires have the greatest reduction in post-fire snow-water storage. If higher severity fires have a greater forest fire effect on snow hydrology than low severity fires, than reducing the severity of forest fires in the seasonal snow zone may mitigate some of the lasting post-fire effects on snow accumulation and snow melt.
In support of H1, forest fires decreased the total volume of snow-water storage in burned SNOTEL stations across the West. Post-fire forest structural changes open the forest canopy and reduce the forest interception efficiency. In the more open burned forest, less snow is intercepted by the canopy and sublimated or blown away, so more snow may accumulate in the snowpack. However, we observed a reduction in the snow-water storage, which may be explained by post-fire changes in the snowpack energy balance [14,19,22]. The post-fire radiative forcing on snow, including the increased insolation and decreased snow albedo, may increase the net snowpack energy balance and drive mid-winter melt events earlier in the season, reducing maximum snow water storage in burned forests, similar to “slower melt in a warmer world” [11]. Snow loss due to wind redistribution and increased turbulent fluxes over snow due to increased windspeeds in the burned forest are also likely contributing to the overall observed decrease in snow-water storage following forest fire [22].
If earlier mid-winter snowmelt explains the reduction in peak SWE, we expected to see earlier timing of peak SWE due to forest fire occurrence. However, our results demonstrate the conflicting influence of forest fire on the timing of peak SWE, with delayed timings of peak SWE in the Cascades, and advanced timing of peak SWE in the Northern and Southern Rockies, indicating that H2 remains variable across regions.
In support of H3, forest fires advanced the timing of snow disappearance at burned SNOTEL sites across the West and in most regions. Post-fire shifts of earlier snowmelt were more extreme following high severity forest fires than low severity forest fires and unburned forests within the burn perimeter. Similar to previous work on forest fire effects on snow hydrology [14,18,19,22], snow melts earlier in burned forests, and particularly in high severity burned forests. Following forest fires, burned forests increase the net shortwave radiation of the snowpack beneath and surrounding them, due to increased transmissivity and decreased snow albedo in the post-fire forest environment [14,22,33]. Post-fire radiative forcing on snow is driving earlier snowmelt as a result of the additional energy during spring. High severity burned forests experience the most extreme reduction in forest canopy density, the greatest increase in the proportion of edge to interior forest, and greatest associated increase in sunlight energy available for snowmelt. Current work also suggests that high severity burned forests shed the greatest concentrations of BC and BWD and experience the greatest associated reduction in snow surface albedo [24].
Previous work suggests conflicting patterns of both faster snowmelt rates following forest fire due to the positive feedbacks occurring in the post-fire radiative forcing on snow during spring [14,18], and slower snowmelt rates following forest fire due to the extension of the snowmelt period [24]. In H4, we anticipated that the snowmelt rate would decrease following forest fire due to the additional energy earlier in the melt season like “slower melt in a warmer world” [11]. However, in burned SNOTEL sites located in high severity burned forests, the snowmelt rate actually increased, while across all sites we observed no significant change in snowmelt rate. Particularly, in more open high severity burned forests, and during spring when solar radiation is high, the post-fire radiative forcing on snow drives earlier and faster snowmelt across burned forested watersheds.
Forest fire further exacerbates existing climate warming trends and impacts on snow-water storage and snowmelt. In burned watersheds, water yields typically increase following fire due to tree mortality and the associated reduction in evapotranspiration [36,37]. Following forest fire, we observed warmer air temperature and greater insolation, with decreased snow-water storage and advanced snowmelt timing leading to drier post-fire soil moisture (Table S3). Forest fire effects on snow hydrology together lengthen the summer drought, and drive greater soil moisture deficits, further perpetuating the current climate warming trends across the West.
Regional variability of forest fire effects on snow-water storage is likely due to variability in snow climate, and post-fire forest structure surrounding SNOTEL station locations [2,26]. Snowpacks in the warm maritime climates (e.g., the Cascades) and lower latitudes (Arizona/New Mexico) experienced the largest post-fire shift in peak SWE and SDD. These warmer snowpacks are persistently near 0 degrees C and are already vulnerable to climate warming, so an additional contribution of solar forcing due to forest fire occurrence may have more extreme consequences on the overall persistence of snowpack in these regions. Snowpacks are located in more intercontinental climates (e.g., Northern and Southern Rockies, the Wasatch Uinta, and Western Interior), are colder and shallower, but are still sensitive to post-fire effects on snowmelt and snow disappearance.
The significance of the forest fire effect on snow by region relative to burn severity is also influenced by sample size, high variability in the empirical data, and delayed mortality response on forest structure. Specifically, the Alaska region included only two burned SNOTEL sites, and therefore there is more uncertainty concerning the conclusions from the Alaska region. SNOTEL sites are intended to be representative of snow-water storage across the greater watershed and the location and physiographic characteristics are typically standardized to reduce the local effects on snow accumulation and snowmelt. We aimed to correct for the background trends due to climate change by normalizing snow metric data by nearby unburned reference stations. We ensured that total precipitation did not change following forest fire occurrence, indicating the post-fire change in snow metrics was likely due to shifts in the temperature regime of the snowpack. Uncertainty still persists in terms of the complexity of results, and there may still be background influences due to longer scale trends in climate change that were not corrected by the normalized data.
5. Conclusions
Forest fires have widespread and persistent impacts on snow hydrology across the West. Burned forests reduce snow-water storage and advance snowmelt, while high severity burned forests increase snowmelt rates for at least 10 years following fire. Our empirically derived results are corroborated by previous work, but extend these conclusions across the western US and up to a decade following forest fire occurrence [14,18,19]. Warmer climates (Arizona/New Mexico and the Cascades) with warmer, more vulnerable snowpacks experience the greatest post-fire shifts in the volume of snow-water storage and timing of snow melt. High severity burned forests have a greater magnitude forest fire effect on snow accumulation and melt then low severity burned forests, demonstrating the importance of quantifying the spatio-temporal variability of forest fire effects on snow hydrology in water modeling and flood forecasting.
Decreased snow-water storage and earlier snow disappearance indicate that particularly high severity forest fires put the health of downstream habitats at a greater risk during the summer months by decreasing the late spring snowmelt contribution to runoff. These dramatic shifts may have grave consequences to stream volume and stream temperatures during the warm summer months, as snowmelt is a significant control of mountainous headwaters [20,38]. Understanding the broad-scale and regional variability in forest fire effects on snow-water storage and snowmelt is essential to improving water resource and flood forecasting models, and informs future water and forest management policies to mitigate the watershed-scale impacts of high severity forest fires on snow-water resources.
Supplementary Materials
The following are available online at https://www.mdpi.com/article/10.3390/w13243533/s1. Figure S1: Forest fires decrease snow-water storage and advance snowmelt across the West. The annual mean for each year since fire (fire age) for the four pre- and post-fire snow accumulation and snowmelt metrics shown for all 78 burned SNOTEL sites. Standard error shown in error bars. Five year pre- and post-fire averages are shown as dotted line. Ten year pre- and post-fire averages are shown as solid grey line. Snow metrics include (a) peak snow water equivalent (Peak SWE, mm), (b) peak SWE date (PSD, date), (c) snow disappearance date (SDD, date), and (d) snowmelt rate (SMR, mm/melt days)). Subset plots show a box plot for pre- and post-fire median snow metrics and mean snow metrics as black x. Significance of the difference between the pre- and post-fire snow metrics for all burned SNOTEL sites across the west and Alaska are shown as asterixis. Table S1: Study site locations of all burned and reference SNOTEL sites used in analyses for each snow-eco-region, in-cluding Alaska (AK), Arizona/New Mexico (AZ/NM), Cascades (CA), Northern Rockies (NR), Middle Rockies (MR), Southern Rockies (SR), Wasatch/Uinta (W/U), and Western Interior (WI). Also included is the SNOTEL site identifica-tion number (Site_ID), State, Fire Year, Latitude, Longitude, Elevation, and burn severity (Severity) of forest fire which occurred during the period of record. Table S2: Burn severity intensifies forest fire effect on snow-water storage and snowmelt. Mean difference and signif-icance of t-tests comparing normalized pre-fire vs. post-fire snow metrics of burned SNOTEL sites of high severity burned forest, moderate severity burned forest, low severity burned forest and unburned forest within the burn pe-rimeter, for the western US and each snow-eco-region. Significance of the difference between the normalized pre- and post-fire snow metrics for the West and each region are shown as asterixis (**** p-value < 0.001, *** p-value < 0.01, ** p-value < 0.05, * p-value < 0.1). Table S3: Normalized change values for micro-meteorological variables, including precipitation, temperature, soil moisture, and solar radiation at 78 SNOTEL stations located in burned forests for 5-years (5 Yrs) and 10-years (10 Yrs) following fire. (**** p-value < 0.001, *** p-value < 0.01, ** p-value < 0.05, * p-value < 0.1).
Author Contributions
Conceptualization, methodology, writing and editing, visualization, supervision, K.E.G. Data curation, analysis, writing, and visualization, E.E.S. All authors have read and agreed to the published version of the manuscript.
Funding
This research was supported by the McNair Scholars Program and The Louis Stokes Alliance for Minority Participation Fund at Portland State University.
Data Availability Statement
Data used in this analysis for SNOTEL sites located within MTBS defined burn perimeters were obtained from the Natural Resources Conservation Service Report generator 2.0 (https://wcc.sc.egov.usda.gov/reportGenerator/ (accessed on 17 April 2020)).
Acknowledgments
We thank Jessica Lundquist for the initial conversation and Kevan Moffet for the continuing conversation which motivated these questions. Also, we thank our family and childcare providers who supported us through this work.
Conflicts of Interest
The authors declare no conflict of interest. The funders had no role in the design of the study; in the collection, analyses, or interpretation of data; in the writing of the manuscript, or in the decision to publish the results.
References
- Barnett, T.P.; Adam, J.C.; Lettenmaier, D.P. Potential Impacts of a Warming Climate on Water Availability in Snow-Dominated Regions. Nature 2005, 438, 303. [Google Scholar]
- Serreze, M.; Clark, M.; Armstrong, R.; McGinnis, D.; Pulwarty, R. Characteristics of the Western United States Snowpack from Snowpack Telemetry (SNOTEL) Data. Water Resour. Res. 1999, 35, 2145–2160. [Google Scholar] [CrossRef] [Green Version]
- Li, D.; Wrzesien, M.L.; Durand, M.; Adam, J.; Lettenmaier, D.P. How Much Runoff Originates as Snow in the Western United States, and How Will That Change in the Future? Geophys. Res. Lett. 2017, 44, 6163–6172. [Google Scholar]
- Musselman, K.N.; Addor, N.; Vano, J.A.; Molotch, N.P. Winter Melt Trends Portend Widespread Declines in Snow Water Resources. Nat. Clim. Chang. 2021, 11, 418–424. [Google Scholar]
- Yan, H.; Sun, N.; Fullerton, A.; Baerwalde, M. Greater Vulnerability of Snowmelt-Fed River Thermal Regimes to a Warming Climate. Environ. Res. Lett. 2021, 16, 054006. [Google Scholar]
- Kormos, P.R.; Luce, C.H.; Wenger, S.J.; Berghuijs, W.R. Trends and Sensitivities of Low Streamflow Extremes to Discharge Timing and Magnitude in Pacific Northwest Mountain Streams. Water Resour. Res. 2016, 52, 4990–5007. [Google Scholar]
- Luce, C.; Staab, B.; Kramer, M.; Wenger, S.; Isaak, D.; McConnell, C. Sensitivity of Summer Stream Temperatures to Climate Variability in the Pacific Northwest. Water Resour. Res. 2014, 50, 3428–3443. [Google Scholar]
- Marks, D.; Dozier, J. Climate and Energy Exchange at the Snow Surface in the Alpine Region of the Sierra Nevada: 2. Snow Cover Energy Balance. Water Resour. Res. 1992, 28, 3043–3054. [Google Scholar]
- Cline, T.J.; Schindler, D.E.; Walsworth, T.E.; French, D.W.; Lisi, P.J. Low Snowpack Reduces Thermal Response Diversity among Streams across a Landscape. Limnol. Oceanogr. Lett. 2020, 5, 254–263. [Google Scholar]
- López-Moreno, J.; Pomeroy, J.; Alonso-González, E.; Morán-Tejeda, E.; Revuelto, J. Decoupling of Warming Mountain Snowpacks from Hydrological Regimes. Environ. Res. Lett. 2020, 15, 114006. [Google Scholar]
- Musselman, K.N.; Clark, M.P.; Liu, C.; Ikeda, K.; Rasmussen, R. Slower Snowmelt in a Warmer World. Nat. Clim. Chang. 2017, 7, 214–219. [Google Scholar]
- Moritz, M.; Parisien, M.; Batllori, E.; Krawchuk, M.; Van Dorn, J.; Ganz, D.; Hayhoe, K. Climate Change and Disruptions to Global Fire Activity. Ecosphere 2012, 3, 1–22. [Google Scholar] [CrossRef]
- Westerling, A.; Hidalgo, H.; Cayan, D.; Swetnam, T. Warming and Earlier Spring Increase Western US Forest Wildfire Activity. Science 2006, 313, 940–943. [Google Scholar] [CrossRef] [Green Version]
- Gleason, K.; Nolin, A.; Roth, T. Charred Forests Increase Snowmelt: Effects of Burned Woody Debris and Incoming Solar Radiation on Snow Ablation. Geophys. Res. Lett. 2013, 40, 4654–4661. [Google Scholar] [CrossRef]
- Lundquist, J.D.; Dickerson-Lange, S.E.; Lutz, J.A.; Cristea, N.C. Lower Forest Density Enhances Snow Retention in Regions with Warmer Winters: A Global Framework Developed from Plot-scale Observations and Modeling. Water Resour. Res. 2013, 49, 6356–6370. [Google Scholar]
- Jost, G.; Weiler, M.; Gluns, D.R.; Alila, Y. The Influence of Forest and Topography on Snow Accumulation and Melt at the Watershed-Scale. J. Hydrol. 2007, 347, 101–115. [Google Scholar]
- Roth, T.R.; Nolin, A.W. Forest Impacts on Snow Accumulation and Ablation across an Elevation Gradient in a Temperate Montane Environment. Hydrol. Earth Syst. Sci. 2017, 21, 5427–5442. [Google Scholar]
- Gleason, K.; Nolin, A. Charred Forests Accelerate Snow Albedo Decay: Parameterizing the Post-Fire Radiative Forcing on Snow for Three Years Following Fire. Hydrol. Process. 2016, 30, 3855–3870. [Google Scholar] [CrossRef]
- Gleason, K.E.; McConnell, J.R.; Arienzo, M.M.; Chellman, N.; Calvin, W.M. Four-Fold Increase in Solar Forcing on Snow in Western US Burned Forests since 1999. Nat. Commun. 2019, 10, 2026. [Google Scholar]
- Macdonald, J.; Beaudry, P.; MacIsaac, E.; Herunter, H. The Effects of Forest Harvesting and Best Management Practices on Streamflow and Suspended Sediment Concentrations during Snowmelt in Headwater Streams in Sub-Boreal Forests of British Columbia, Canada. Can. J. For. Res. 2003, 33, 1397–1407. [Google Scholar]
- Boon, S. Snow Accumulation Following Forest Disturbance. Ecohydrology 2012, 5, 279–285. [Google Scholar]
- Burles, K.; Boon, S. Snowmelt Energy Balance in a Burned Forest Plot, Crowsnest Pass, Alberta, Canada. Hydrol. Process. 2011, 25, 3012–3029. [Google Scholar] [CrossRef]
- Harpold, A.A.; Biederman, J.A.; Condon, K.; Merino, M.; Korgaonkar, Y.; Nan, T.; Sloat, L.L.; Ross, M.; Brooks, P.D. Changes in Snow Accumulation and Ablation Following the Las Conchas Forest Fire, New Mexico, USA. Ecohydrology 2014, 7, 440–452. [Google Scholar]
- Uecker, T.M.; Kaspari, S.D.; Musselman, K.N.; McKenzie Skiles, S. The Post-Wildfire Impact of Burn Severity and Age on Black Carbon Snow Deposition and Implications for Snow Water Resources, Cascade Range, Washington. J. Hydrometeorol. 2020, 21, 1777–1792. [Google Scholar]
- Nolin, A.W. Perspectives on Climate Change, Mountain Hydrology, and Water Resources in the Oregon Cascades, USA. Mt. Res. Dev. 2012, 32. [Google Scholar] [CrossRef]
- Sun, N.; Yan, H.; Wigmosta, M.S.; Leung, L.R.; Skaggs, R.; Hou, Z. Regional Snow Parameters Estimation for Large-Domain Hydrological Applications in the Western United States. J. Geophys. Res. Atmos. 2019, 124, 5296–5313. [Google Scholar]
- ESRI. ArcGIS Desktop: Release 10.4. 2015. Available online: https://desktop.arcgis.com/zh-cn/arcmap/10.4/extensions/aviation-charting/whats-new-in-arcgis-for-aviation.htm (accessed on 14 November 2021).
- The R Core Team. R: A Language and Environment for Statistical Computing; R Foundation for Statistical Computing: Boston, MA, USA, 2016; Available online: http://web.mit.edu/r_v3.4.1/fullrefman.pdf (accessed on 30 June 2017).
- Mote, P.W.; Li, S.; Lettenmaier, D.P.; Xiao, M.; Engel, R. Dramatic Declines in Snowpack in the Western US. Npj Clim. Atmos. Sci. 2018, 1, 2. [Google Scholar]
- Winkler, R.; Spittlehouse, D.; Boon, S.; Zimonick, B. Forest Disturbance Effects on Snow and Water Yield in Interior British Columbia. Hydrol. Res. 2015, 46, 521–532. [Google Scholar]
- Dickerson-Lange, S.E.; Gersonde, R.F.; Hubbart, J.A.; Link, T.E.; Nolin, A.W.; Perry, G.H.; Roth, T.R.; Wayand, N.E.; Lundquist, J.D. Snow Disappearance Timing Is Dominated by Forest Effects on Snow Accumulation in Warm Winter Climates of the Pacific Northwest, United States. Hydrol. Process. 2017, 31, 1846–1862. [Google Scholar]
- Stevens, J.T. Scale-dependent Effects of Post-fire Canopy Cover on Snowpack Depth in Montane Coniferous Forests. Ecol. Appl. 2017, 27, 1888–1900. [Google Scholar]
- Boon, S. Snow Ablation Energy Balance in a Dead Forest Stand. Hydrol. Process. Int. J. 2009, 23, 2600–2610. [Google Scholar]
- Schwartz, A.; McGowan, H.; Callow, N. Snowpack Thermal Patterns in Pre-and Post-Bushfire Snow Gum Forests. J. Hydrol. 2021, 602, 126789. [Google Scholar]
- Varhola, A.; Coops, N.C.; Bater, C.W.; Teti, P.; Boon, S.; Weiler, M. The Influence of Ground-and Lidar-Derived Forest Structure Metrics on Snow Accumulation and Ablation in Disturbed Forests. Can. J. For. Res. 2010, 40, 812–821. [Google Scholar]
- Stephens, S.L.; Thompson, S.; Boisramé, G.; Collins, B.M.; Ponisio, L.C.; Rakhmatulina, E.; Steel, Z.L.; Stevens, J.T.; van Wagtendonk, J.W.; Wilkin, K. Fire, Water, and Biodiversity in the Sierra Nevada: A Possible Triple Win. Environ. Res. Commun. 2021, 3, 081004. [Google Scholar]
- Rakhmatulina, E.; Boisramé, G.; Stephens, S.L.; Thompson, S. Hydrological Benefits of Restoring Wildfire Regimes in the Sierra Nevada Persist in a Warming Climate. J. Hydrol. 2021, 593, 125808. [Google Scholar]
- Dunham, J.B.; Rosenberger, A.E.; Luce, C.H.; Rieman, B.E. Influences of Wildfire and Channel Reorganization on Spatial and Temporal Variation in Stream Temperature and the Distribution of Fish and Amphibians. Ecosystems 2007, 10, 335–346. [Google Scholar]
Figure 1.
Hypotheses for changes in four snow metrics of snow accumulation and melt due to climate change (C) and as a result of forest fire (F), including peak snow water equivalent (peak SWE), peak SWE date (PSD), snow disappearance date (SDD), and snowmelt rate (SMR).
Figure 1.
Hypotheses for changes in four snow metrics of snow accumulation and melt due to climate change (C) and as a result of forest fire (F), including peak snow water equivalent (peak SWE), peak SWE date (PSD), snow disappearance date (SDD), and snowmelt rate (SMR).
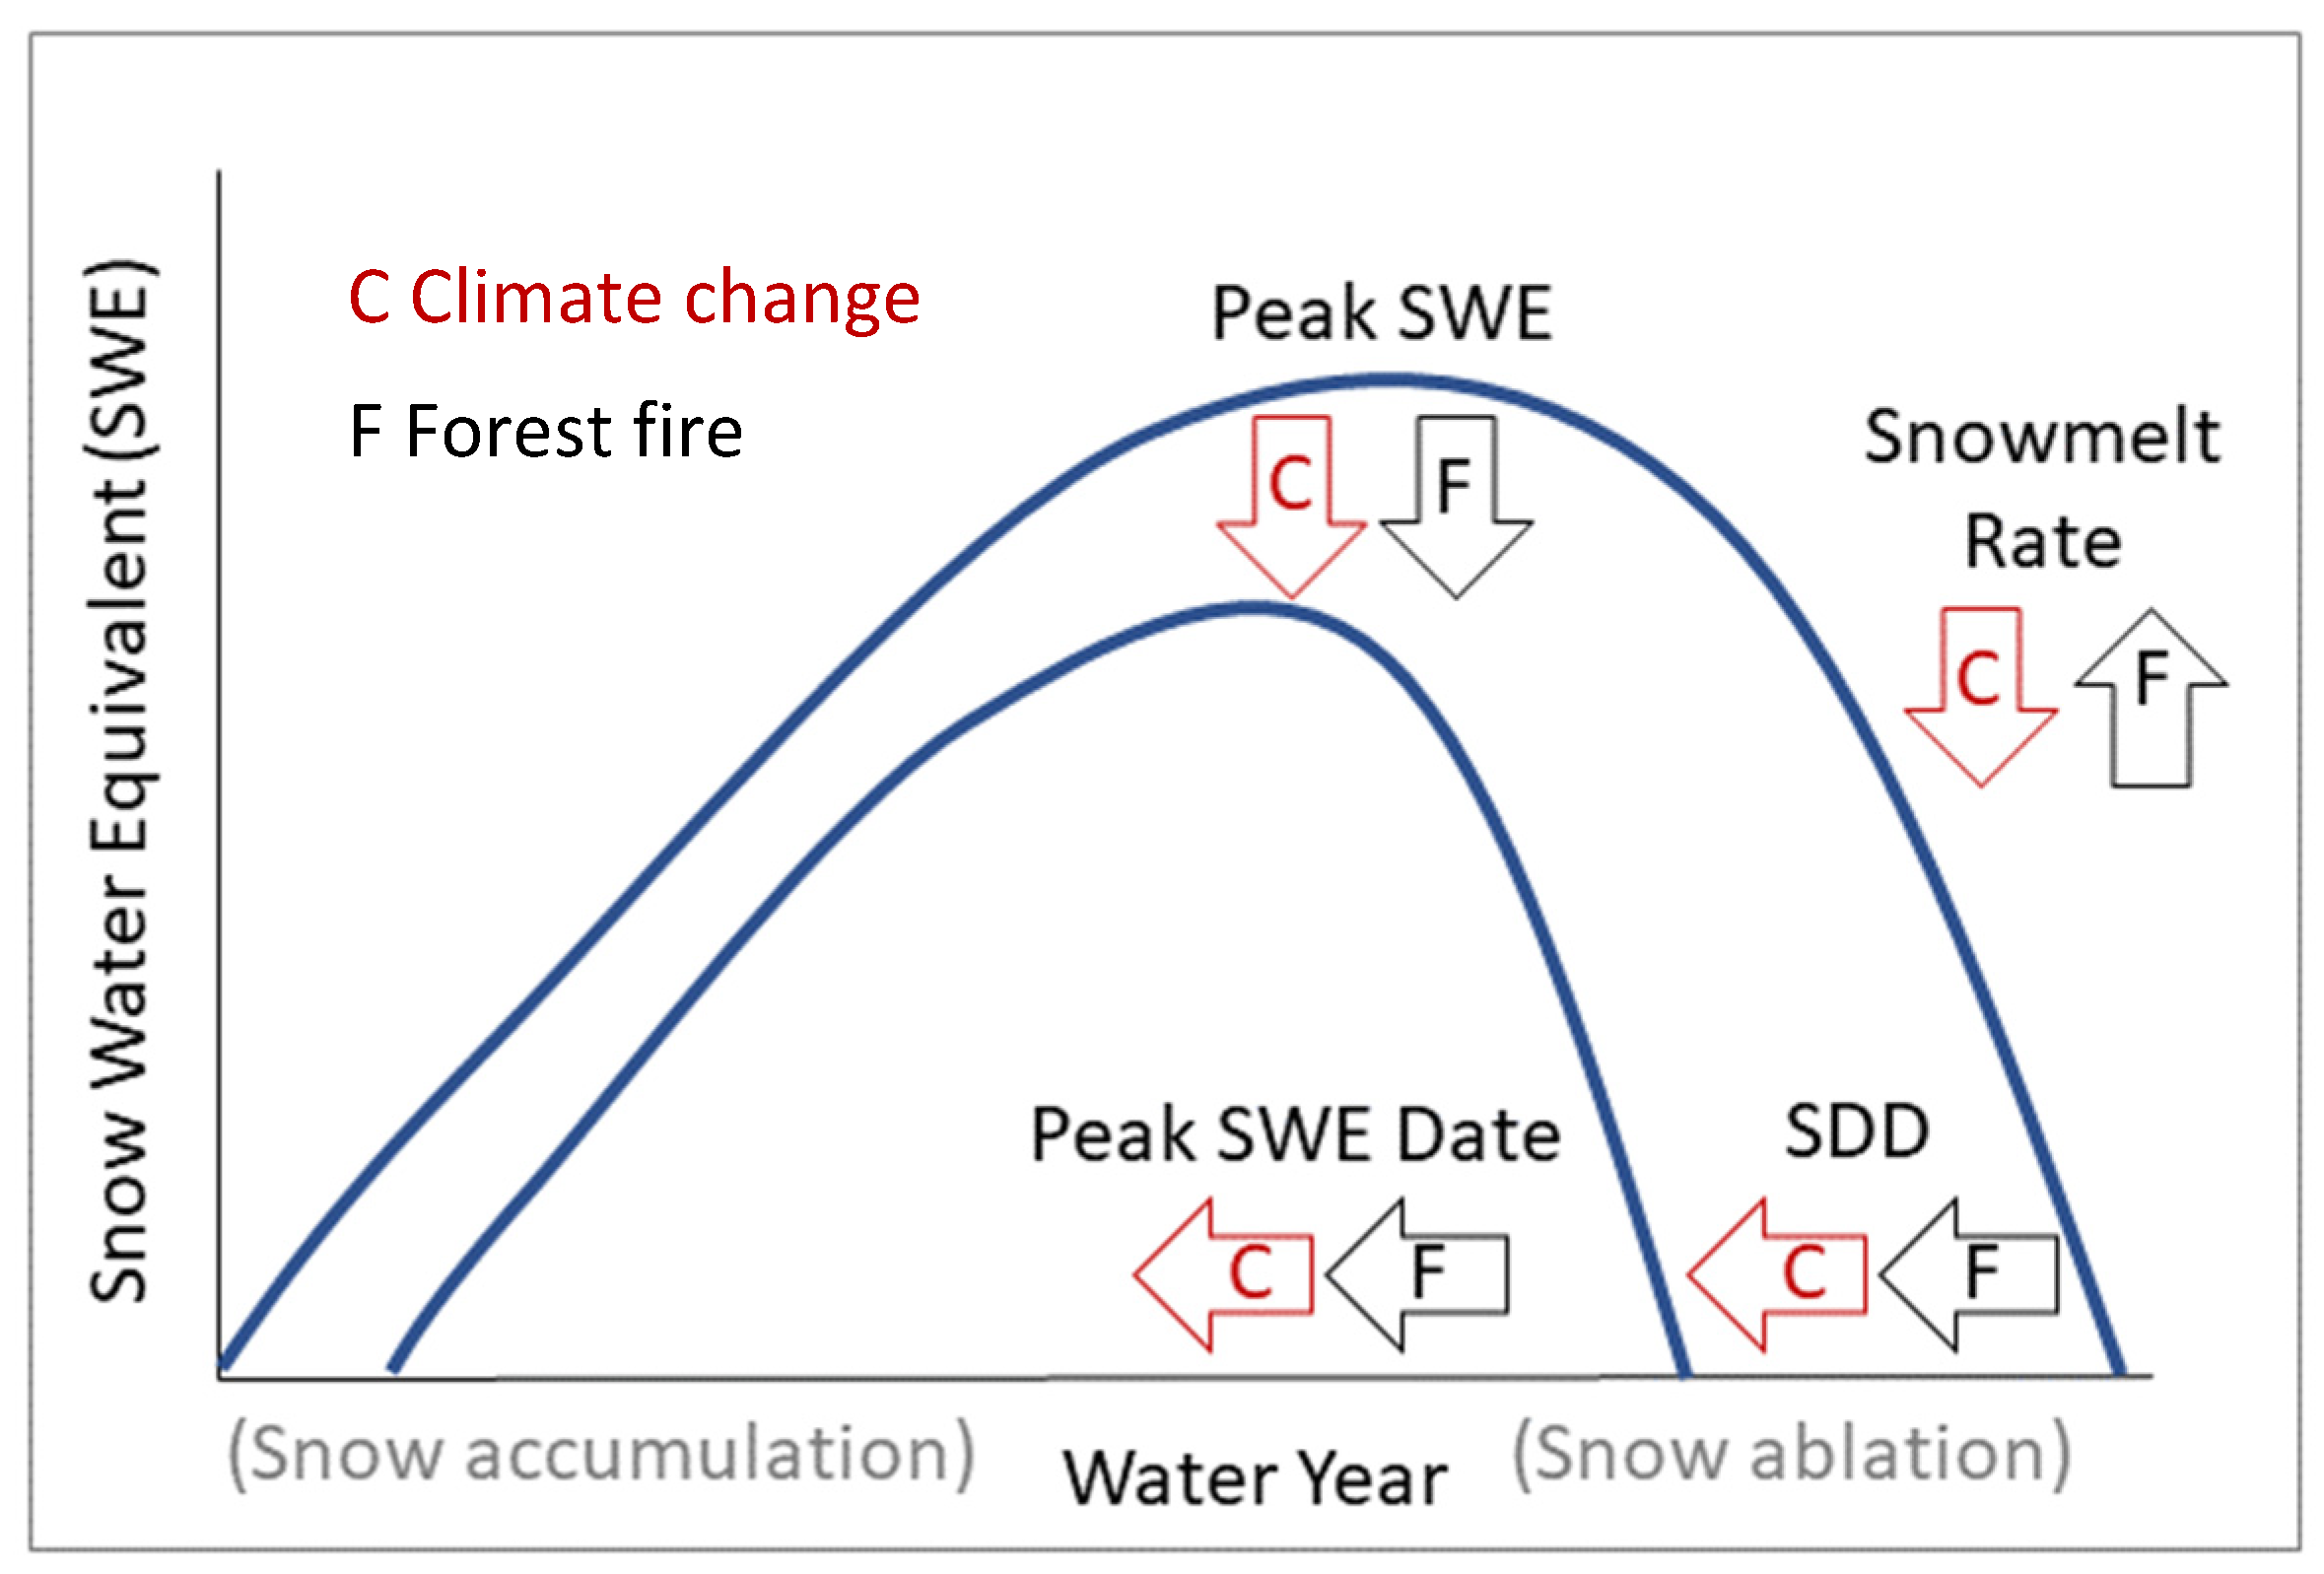
Figure 2.
(a) Locations of 79 burned SNOTEL stations colored by snow-eco-region as defined by Sun et al. 2019 Fire perimeters were obtained from the MTBS database, and snow covered area was obtained from the MOD10C1 product at 500 m resolution. (b) SNOTEL measured mean SWE (1970–2019), and burned forested area in the seasonal snow zone across the West (1984–2019), and (c) photos of nine burned SNOTEL stations.
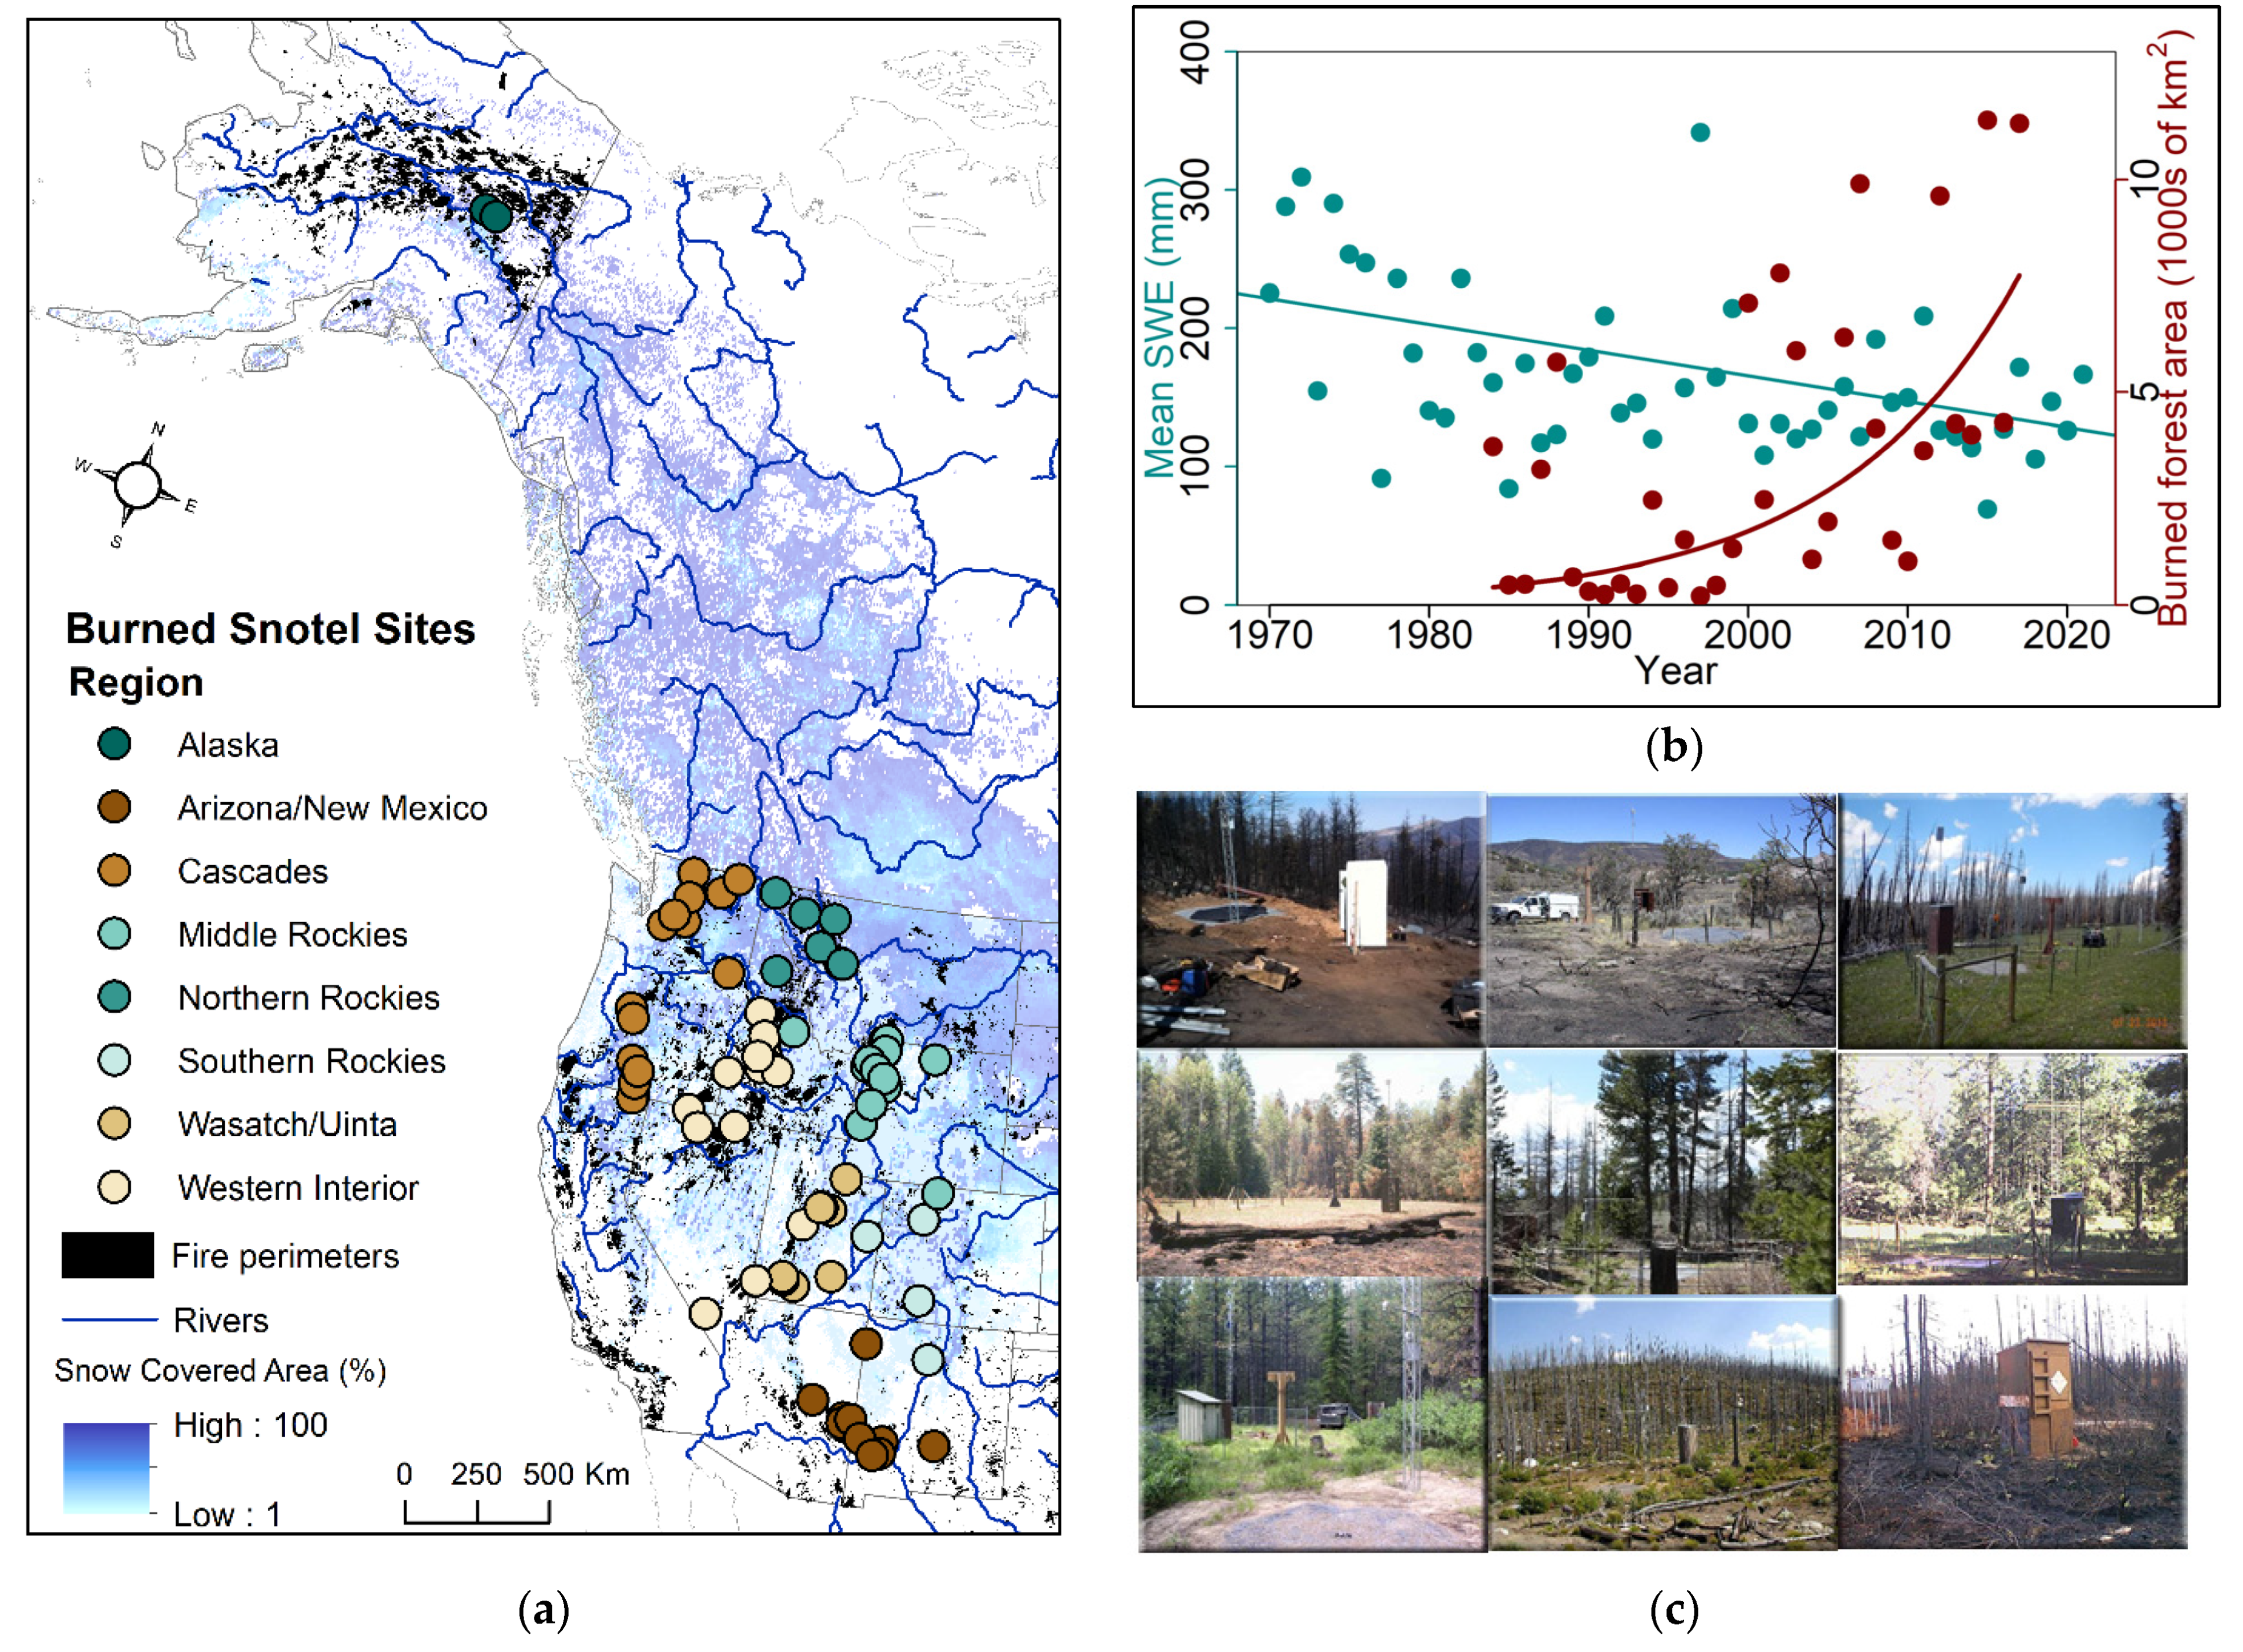
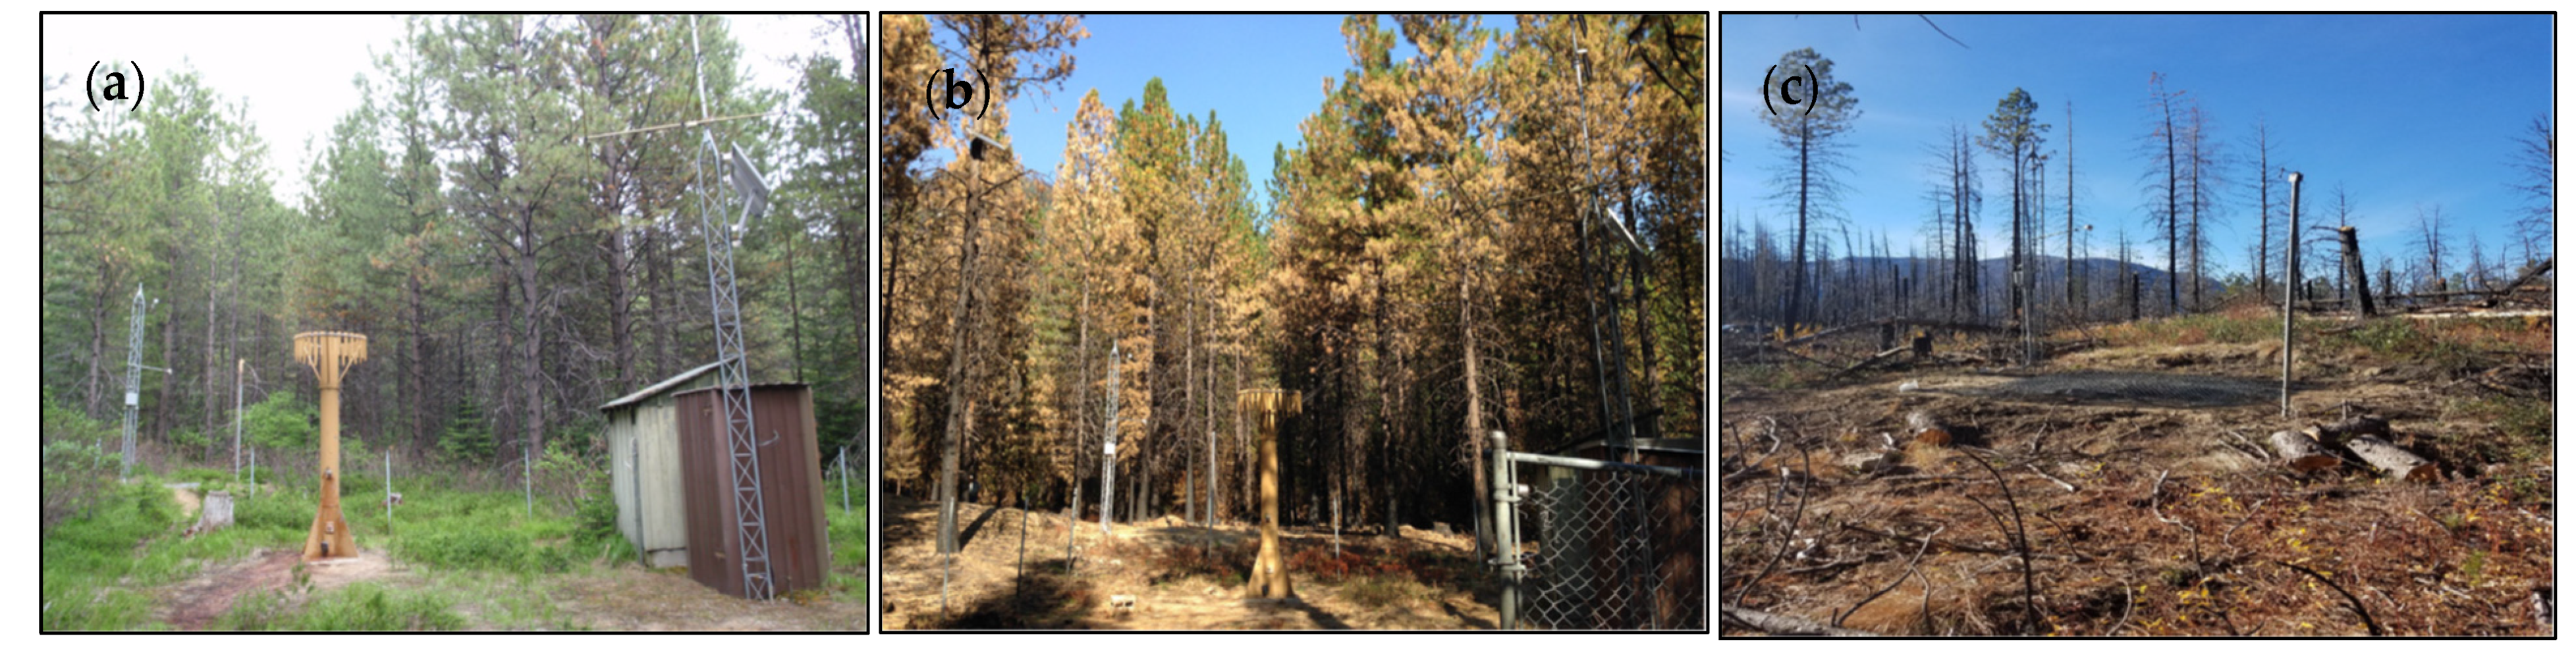
Figure 3.
Photos of post-fire forest degradation around burned SNOTEL site. (a) Pope Ridge SNOTEL site before fire in 2011, (b) Pope Ridge SNOTEL site after fire in 2014, and (c) Pope Ridge SNOTEL site after fire in 2018, located in Washington State. Photos courtesy of the National Resource Conservation Service Oregon Snow Survey.

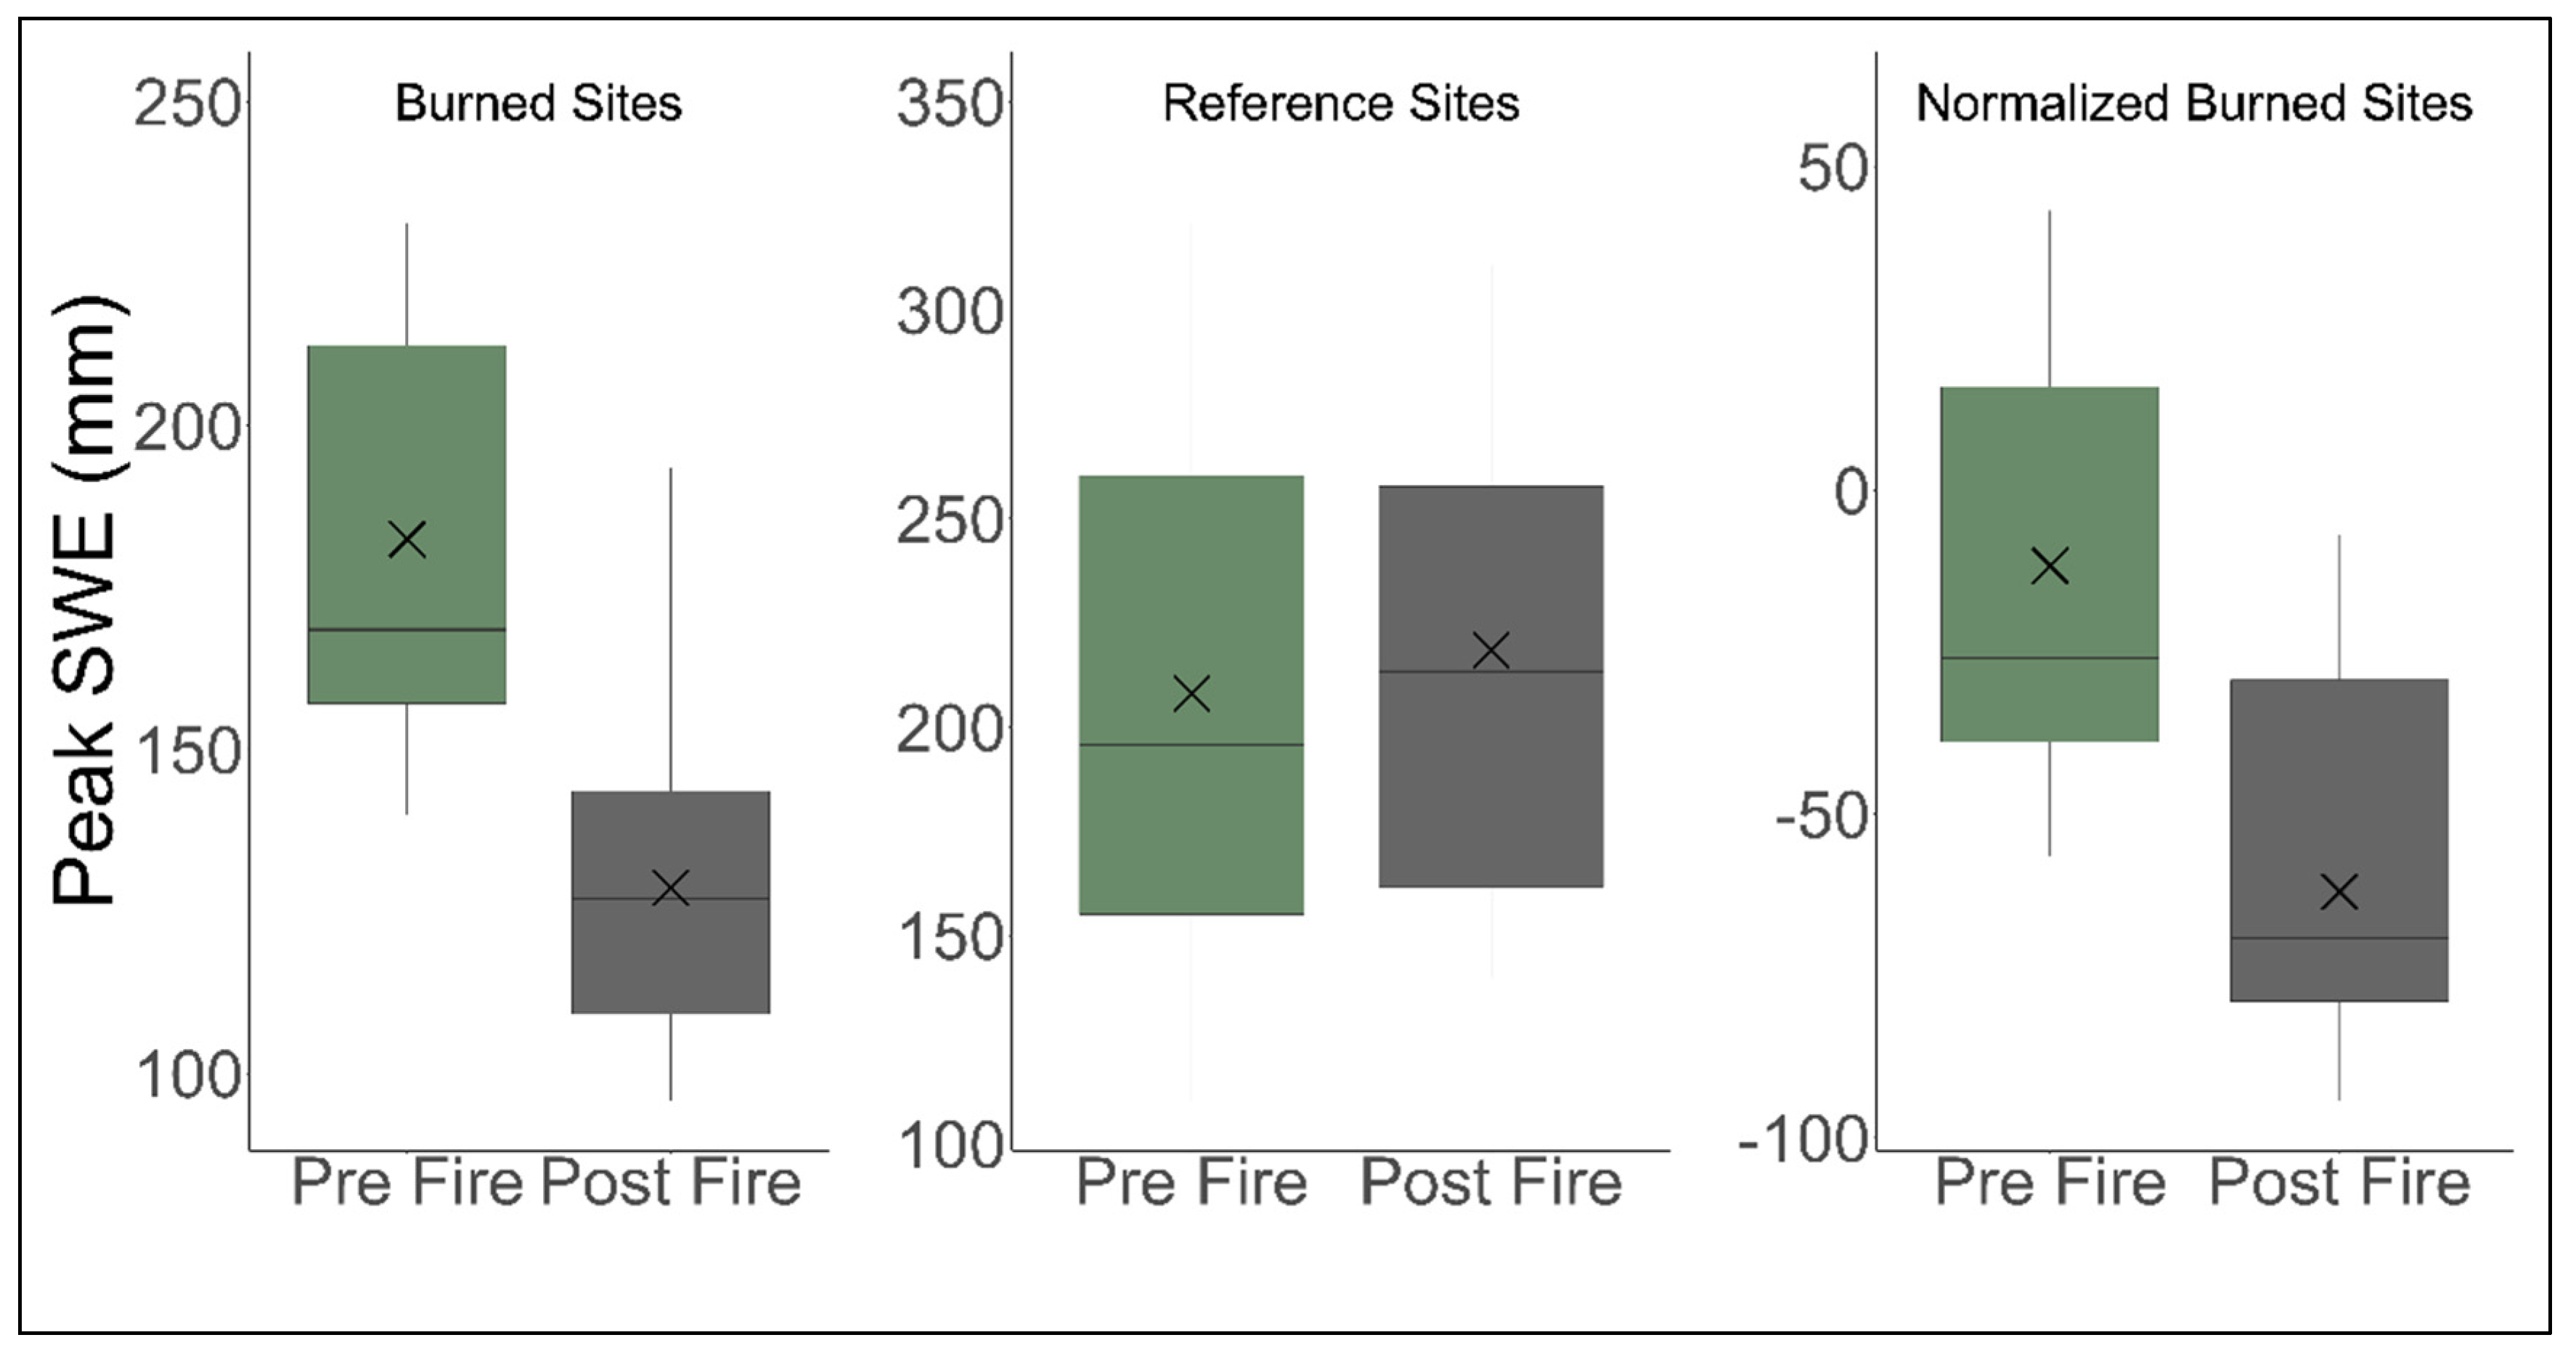
Figure 4.
An example of data normalization. Peak SWE (mm) derived from the burned sites, reference sites, and the difference of burned sites and reference sites as the normalized burned sites from all sites in the Arizona/New Mexico region.
Figure 4.
An example of data normalization. Peak SWE (mm) derived from the burned sites, reference sites, and the difference of burned sites and reference sites as the normalized burned sites from all sites in the Arizona/New Mexico region.

Figure 5.
Forest fires decrease snow-water storage and advance snowmelt across the West. The 10-year post fire change in the four pre- and post-fire snow accumulation and snowmelt metrics shown for all 78 burned SNOTEL sites in the West and Alaska. Snow metrics include (a) peak snow water equivalent (peak SWE, mm), (b) peak SWE date (PSD, date), (c) snow disappearance date (SDD, date), and (d) snowmelt rate (SMR, mm/melt days)). Subset plots show a box plot for pre- and post-fire 5-year and 10-year median snow metrics and mean snow metrics as black x for all sites across the West. Significance of the difference between the pre- and post-fire snow metrics for all burned SNOTEL sites are shown as asterixis (**** p-value < 0.001, *** p-value < 0.01, * p-value < 0.1).

Figure 6.
(A) Post-fire snow metric shifts are variable across eight snow-eco-regions over 10 years following fire. (B) Post-fire snow metrics shifts are variable across eight snow-eco-regions over 5 years following fire. Box plots showing the normalized pre- and post-fire median and interquartile snow metrics for each snow-eco-region, including peak snow water equivalent (Peak SWE, mm), peak SWE date (PSD, date), snow disappearance date (SDD, date), and snowmelt rate (SMR, mm/melt days)). Pre- and post-fire mean snow metrics are shown as black x. Significance of the difference between the pre- and post-fire snow metrics for each region are shown as asterixis (**** p-value < 0.001, *** p-value < 0.01, ** p-value < 0.05, * p-value < 0.1).


Table 1.
Linear regression results of burned sites for the slope across the full period of record. Significance of the linear regression model of raw snow metrics over time across the West and for each region shown as asterixis (**** p-value < 0.001, *** p-value < 0.01, ** p-value < 0.05, * p-value < 0.1).
| Region | Peak SWE Date Trend (Days) | Peak SWE Trend (mm) | SDD Trend (Days) | SMR Trend (mm/Day) |
|---|---|---|---|---|
| West | −0.56 **** | −3.07 **** | −0.78 **** | 0.09 **** |
| Cascades | −0.24 * | −5.72 *** | −0.54 *** | −0.08 ** |
| North Rockies | −0.60 **** | −0.96 | −0.74 ***** | 0.01 |
| Middle Rockies | −0.24 ** | 1.28 | −0.26 ** | −0.03 |
| South Rockies | −0.70 **** | −1.34 | −0.56 ** | 0.08 * |
| West Interior | 0.48 *** | −5.82 *** | −1.00 **** | 0.10 **** |
| Wasatch Uinta | −0.60 *** | −3.35 *** | −0.46 **** | 0.70 ** |
| Arizona/New Mexico | −0.70 **** | −3.00 **** | −0.90 **** | 0.06 ** |
| Alaska | −0.59 * | 0.68 | −0.48 * | −0.17 |
Publisher’s Note: MDPI stays neutral with regard to jurisdictional claims in published maps and institutional affiliations. |
© 2021 by the authors. Licensee MDPI, Basel, Switzerland. This article is an open access article distributed under the terms and conditions of the Creative Commons Attribution (CC BY) license (https://creativecommons.org/licenses/by/4.0/).
Share and Cite
MDPI and ACS Style
Smoot, E.E.; Gleason, K.E. Forest Fires Reduce Snow-Water Storage and Advance the Timing of Snowmelt across the Western U.S. Water 2021, 13, 3533. https://doi.org/10.3390/w13243533
AMA Style
Smoot EE, Gleason KE. Forest Fires Reduce Snow-Water Storage and Advance the Timing of Snowmelt across the Western U.S. Water. 2021; 13(24):3533. https://doi.org/10.3390/w13243533
Chicago/Turabian StyleSmoot, Emily E., and Kelly E. Gleason. 2021. "Forest Fires Reduce Snow-Water Storage and Advance the Timing of Snowmelt across the Western U.S." Water 13, no. 24: 3533. https://doi.org/10.3390/w13243533
Note that from the first issue of 2016, this journal uses article numbers instead of page numbers. See further details here.