
Photosynthetic Characteristics and Yield Response of Isatis indigotica to Regulated Deficit Irrigation in a Cold and Arid Environment

College of Water Conservancy and Hydropower Engineering, Gansu Agricultural University, Lanzhou 730070, China
*
Author to whom correspondence should be addressed.
Water 2021, 13(24), 3510; https://doi.org/10.3390/w13243510
Submission received: 9 November 2021
/
Revised: 2 December 2021
/
Accepted: 5 December 2021
/
Published: 9 December 2021
(This article belongs to the Section Water, Agriculture and Aquaculture)
Abstract
:Water resource scarcity is an important factor restricting the sustainable development of agriculture in Northwest China. Regulated deficit irrigation can conserve water while maintaining high crop yields. A field experiment was conducted to evaluate the effect of regulated deficit irrigation on the photosynthetic characteristics, yield, and water use efficiency of woad (Isatis indigotica) under mulched drip irrigation from 2017 to 2019 in a cold and arid area of the Hexi Oasis irrigation region, China. Sufficient water was supplied during the seedling stage. The control consisted of adequate water supplied during the other growth stages, whereas mild, moderate, and severe water deficits were imposed during the vegetative growth period, and a mild and moderate water deficit was imposed during the fleshy root growth stage. A mild water deficit was imposed during the fleshy root maturity period. The results showed that the net photosynthetic rate, transpiration rate, and stomatal conductance under moderate and severe water deficit were significantly (p < 0.05) decreased compared with the control, respectively, during the vegetative growth period. The economic yield of mild water deficit during the vegetative growth and mild water deficit during the vegetative growth and fleshy root growth did not differ significantly (p > 0.05) from that of the control. Other treatments caused a 6.74–17.74% reduction in the economic yield of woad. The water use efficiency and irrigation water use efficiency were the highest in the mild water deficit during the vegetative growth period and the fleshy root growth period. Therefore, the application of a continuous mild deficit from the vegetative growth stage to the fleshy root growth stage with sufficient water supplied during other growth periods is recommended as the optimal irrigation regime for maximum yield, water use efficiency, and water-saving of woad.
1. Introduction
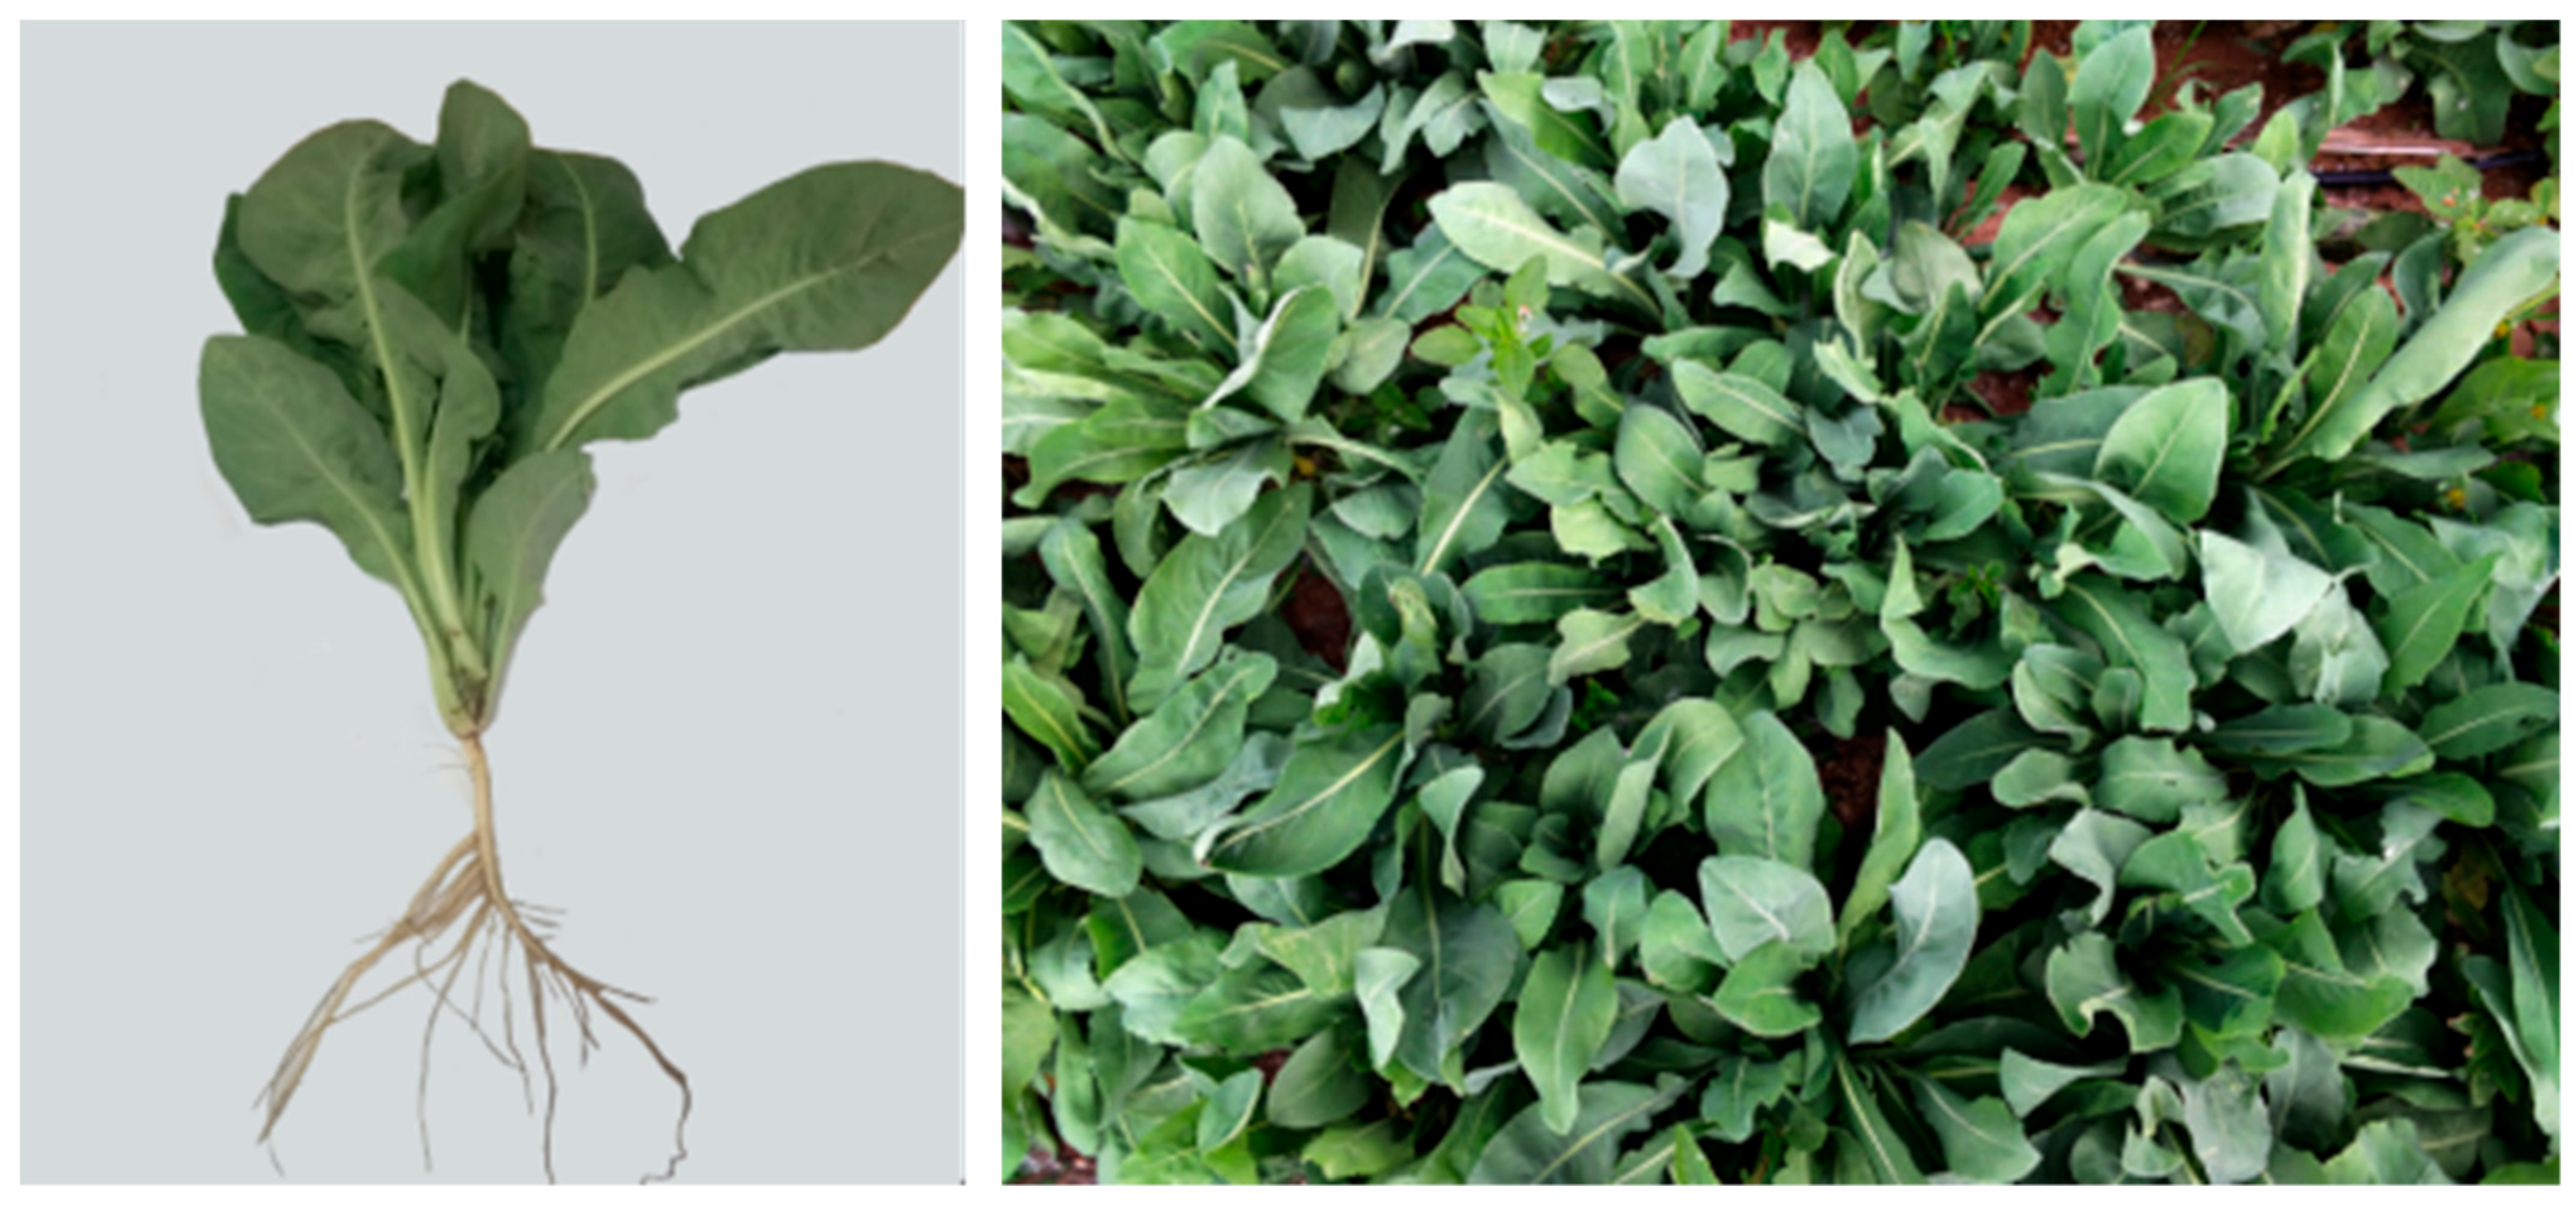
The Hexi Corridor is the main cultivation area of woad (Isatis indigotica) in China due to its unique climatic conditions. However, the shortage of water resources restricts the development of woad plantations. The use of reasonable irrigation planting methods is the key to solving the current problem. Woad (Figure 1) is a traditional Chinese medicinal material, and its leaves (large green leaves) and dried roots (Isatis root) can be used as a medicine, with heat-clearing, detoxification, pharyngeal, pain-relieving, blood-cooling, and anti-inflammatory effects. Woad root can be processed into granules (Isatis root granules). The product is very popular in China and is most often dissolved in hot water or tea [1]. It is the most commonly used heat-clearing and detoxification medicine in China [2,3,4], and is one of the six drugs recommended by the Chinese government for the prevention and control of severe acute respiratory syndrome (SARS) [5]. In recent years, pharmacological studies have found that woad has obvious antiviral activity, as well as anti-inflammatory, anti-tumor, anti-cancer, anti-endotoxin, and immunity enhancement effects [6]. It is clinically used for the treatment of febrile toxin, high fever headache, chickenpox, measles, influenza, and various inflammations of the digestive and respiratory systems. As a type of indigo dye and medicinal plant, woad has become the most important dye in the denim industry because of the absorbability of its indigo pigment to cotton fiber and its non-covalent combination [7]. At present, it is also used in the cosmetics industry, mainly in the production of soaps and creams [8].
With the increasing water consumption of agriculture, industry, and cities, the freshwater shortage has become increasingly serious in recent years in arid and semi-arid areas [9]. The water resource scarcity seriously affects the improvement of China’s national economy, restricts the development of China’s agriculture, and restricts the agricultural production in arid areas in the north [10]. The development of efficient and water-saving agriculture contributes to the sustainable and healthy development of agricultural production [11]. Suitable planting techniques and irrigation methods can increase crop yields while increasing water use. Therefore, the use of reasonable irrigation techniques can both save water and improve economic benefits. Mulched drip irrigation is an irrigation technique that uses plastic film covering and lays drip lines for farmland irrigation. This irrigation method can accurately transport water and nutrients to the soil, while effectively reducing the evaporation of soil water. Reasonable irrigation methods can meet the demands for the normal growth and development of crops and can change the soil physicochemical properties and structure simultaneously, such as changing soil microorganisms, enzyme activities, and other indicators, which in turn affect physiological processes and ultimately lead to increased yields and improved water use efficiency. Deficit irrigation combined with plastic film mulch can reduce crop vegetative growth, increase yield, and improve water use efficiency and is an important water-saving agricultural measure [12].
Water use efficiency (WUE) is an index for determining the relationship between economic yield and water volume, and irrigation water use efficiency (IWUE) is an index to evaluate the efficiency of irrigation in crop production [13,14]. Currently, there are still challenges in maximizing crop productivity, WUE, and IWUE. The deficit irrigation (DI) strategy is a measure that applies less irrigation than optimal crop water requirements to enhance WUE [15,16]. At present, DI is a common irrigation method in arid and semi-arid areas throughout the world. The theory is to maximize crop water productivity rather than harvest per unit of land [17]. Regulated deficit irrigation (RDI), which was first proposed in the mid-1970s, imposes water stress in a certain growth period of crops by changing the allocation of the crop photosynthetic products to various tissues and organs, reduces some vegetative organ growth, increases the economic yield, and achieves the goals of water-saving and yield increase [18]. Reasonably regulated deficit irrigation could enhance the photosynthetic capacity of tomato crops after rehydration, and its WUE was increased while saving irrigation water [19]. Mild water stress improved the structure of the pre-flowering canopy and the distribution of seed assimilates and enhanced the economic yield and WUE of winter wheat [20]. Numerous studies found that RDI can increase crop yield and WUE and has an important impact on a crop’s biological characteristics [21,22,23]. The water deficit period and degree are critical for saving water and maximizing yield [24].
Photosynthesis plays a significant role in crop productivity and may be affected by water deficit. Restrictions on crop growth due to water deficit are always caused by changes in photosynthesis and the distribution of photosynthates [25]. The chloroplast is the main site of photosynthesis in plants. Water stress can damage the photosynthetic mechanism of chloroplasts and reduce the absorption and transformation ability of chlorophyll to light energy. An important link in the physiological process of plants is photosynthesis, and chlorophyll is the basis of photosynthesis and an indicator of photosynthetic capacity. To a certain extent, chlorophyll can reflect the plant’s production and the ability to resist stress. Plant growth and metabolism are influenced by water deficit, which has a particularly prominent effect on photosynthesis [26]. Drought stress limits the photosynthesis and growth of plants, leading to wilting, leaf drop, and even death [27]. The root system of woad is relatively developed, and the requirements for climatic conditions and the soil environment are not strict when this species is planted. Woad can grow normally under certain conditions of drought and low temperature. However, its cultivation in Northwest China was impacted by drought. Water stress will not only impact the growth of woad but also influence its economic yield. We hypothesized that the economic yield and WUE of woad could be improved by mild water deficit regulation. Therefore, the objectives of this study were to determine (1) the effect of RDI under mulched drip irrigation on the photosynthetic characteristics, yield, and WUE of woad and (2) the optimal regulated deficit irrigation degree as well as the optimal regulated deficit irrigation growth period.
2. Materials and Methods
2.1. Experimental Site
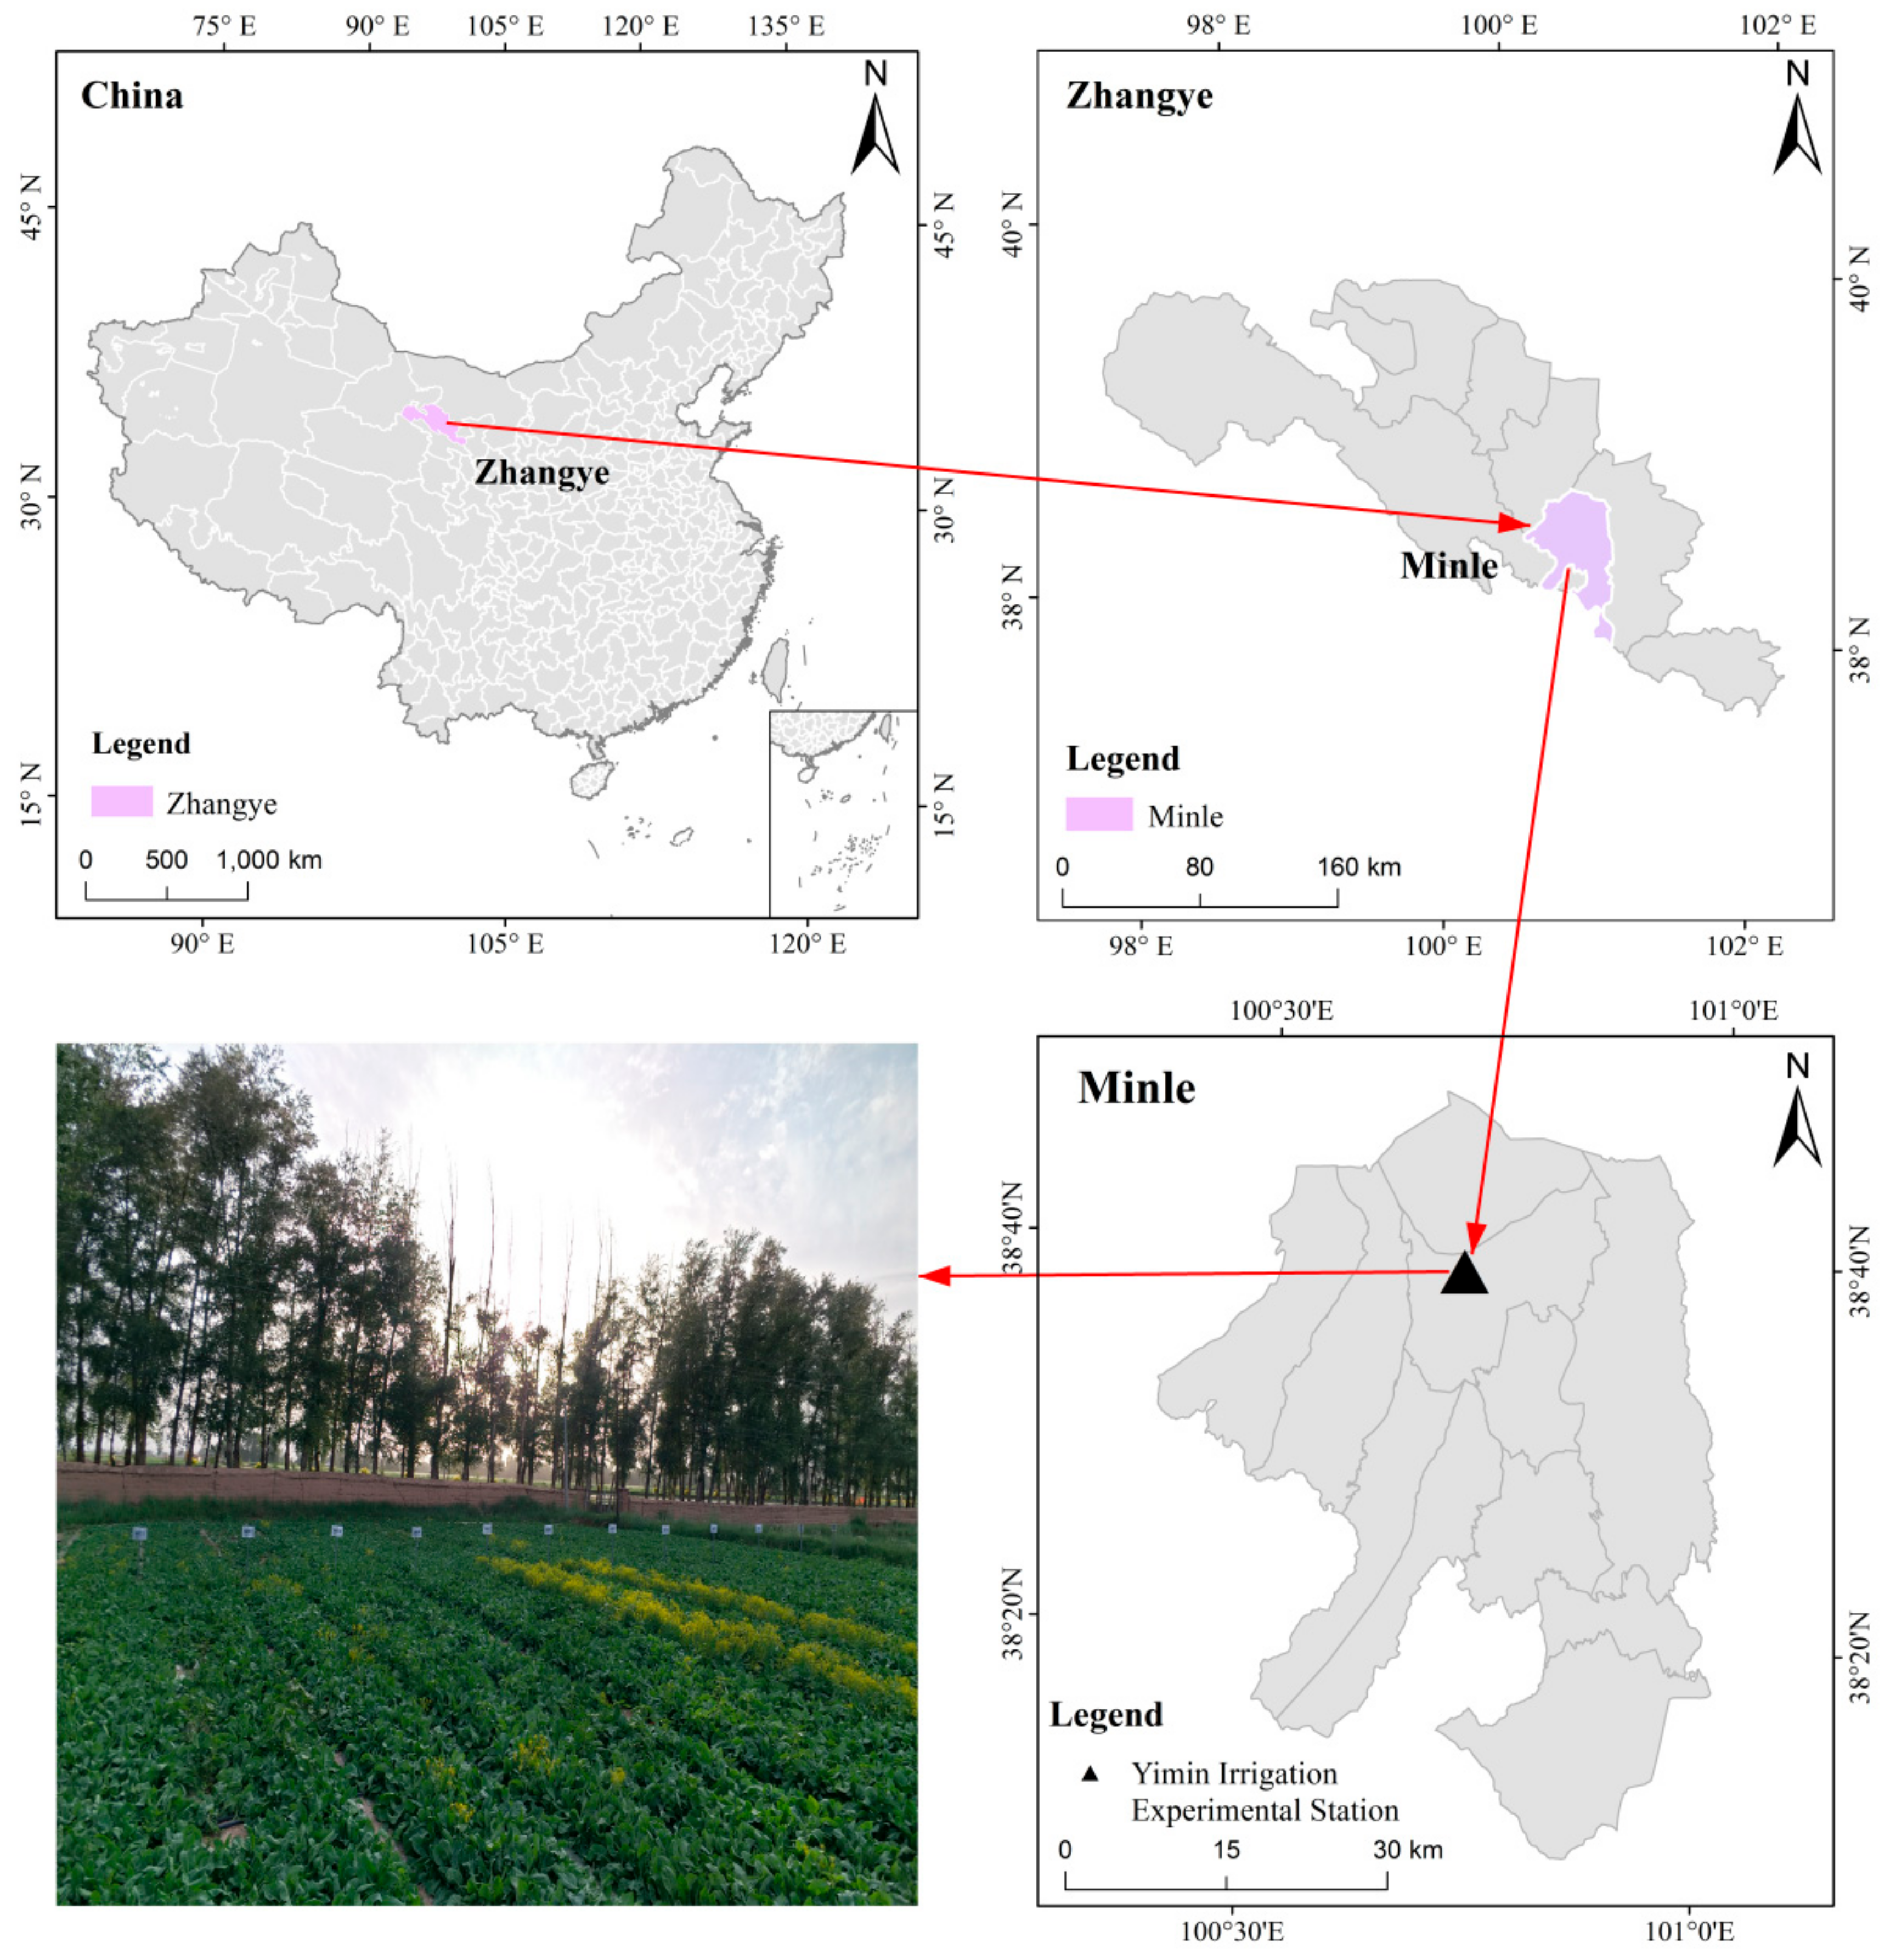
The experiment was performed from May to October 2017 to 2019, at the Yimin Irrigation Experimental Station (Figure 2) in Minle County, Gansu Province, China. The experimental station is located at the east end of the Hexi Corridor in Gansu Province (38°39′ N, 100°43′ E). The average altitude at the experimental station is 1970 m (m), and the area has a typical continental desert grassland climate. The multi-year average precipitation and evaporation are 200 and 1638 mm, respectively. The dryness index is 5.85, and the annual sunshine duration is 2932 h (h). The multi-year average temperature is 7.6 °C, and the cumulative temperature is 3500 °C above 0 °C and 2985 °C above 10 °C over the course of a growing season. The rainfall in 2017, 2018 and 2019 were 196.5, 210.3 and 191.3 mm, respectively. The soil type of the farmland is a light loam, the maximum field water capacity is 24% (gravimetric moisture content), there are about 150 frost-free days, and the soil bulk density is approximately 1.46 g per cubic centimeter (g·cm−3). The contents of the soil organic matter, alkali-decomposed nitrogen, available potassium, and available phosphorus in the 0–20 cm soil layer, based on three-year averages, were 12.4 g per kilogram (g·kg−1), 57.3 milligrams per kg (mg·kg−1), 191.7 mg·kg−1, and 15.9 mg·kg−1, respectively. The groundwater table was measured at a depth of approximately 20 m, and there are no saline-alkaline effects in this area. The study site had low rainfall with uneven distribution and insufficient river water supply, leading to an outstanding contradiction between water supply and demand as well as frequent drought stress.
2.2. Experimental Design and Method
In 2017, 2018, and 2019, woad (Isatis indigotica) was sown on 2 May, 9 May, and 4 May using an open-field planting method and was harvested on 11 October, 12 October, and 10 October, respectively. The seeding rate was 33 kg per hectare (kg·ha−2), and the cropping density was 830,000 plants per hectare (ha). The experimental land was plowed mechanically (depth of 30 cm), and weeds were removed mechanically before planting. In addition, 220, 330, and 120 kg·ha−2 urea (N content 46%), superphosphate (P2O5 content 12%, S content 10%, Ca content 16%) and source potassium (K2O content 60%) were added as basic fertilizers. After land leveling, drip irrigation was installed. Three drip irrigation belts (spaced at a distance of 90 cm) were laid in each plot. The dropper spacing and the average dropper flow during irrigation were 30 cm and 2.4 L per hour (L·h−1), respectively. Colorless plastic film (120 cm wide) was used for overlapping full-film covering, and a 5-cm soil layer was covered. Dividers (60-cm-wide plastic film) were installed to inhibit soil moisture percolation between neighboring plots.
A single-factor randomized experiment was applied. Woad growth duration was classified into four periods: seedling, vegetative growth, fleshy root growth, and fleshy root maturity (Table 1). Four deficit levels were classified for soil moisture: adequate water supply (75–85% field water capacity FC), mild water deficit (65–75% FC), moderate water deficit (55–65% FC), and severe water deficit (45–55% FC). Seedlings were not subjected to water deficit. Mild, moderate, and severe water deficit regulations were established during vegetative growth. Mild and moderate water deficit regulations were established during the fleshy root growth period, and a mild water deficit regulation was established during the fleshy root maturity period. Six water deficit regulation treatments and one control treatment were set. There were 3 repetitions per treatment and 21 plots. The plot area was 13.5 m2 (2.7 × 5 m), and the total effective planting area was 283.5 m2. The irrigation method was mulched drip irrigation, and the irrigation volume was metered by a water meter. Soil moisture was controlled within the designed range. When the soil moisture of the planned wet layer was reduced to the lower design limit, irrigation was applied to reach the upper limit.
2.3. Plant Sampling and Measurements
2.3.1. Photosynthetic Physiological Indices
The photosynthetic indices were measured in each growth period. An LI-6400 portable photosynthesis instrument (LI-COR, Lincoln, Nebraska, USA) was used to measure the daily changes in physiological parameters such as the net photosynthetic rate (Pn), stomatal conductance (Gs), and transpiration rate (Tr) of the third leaf of woad plants. Three plants were selected from each experimental plot, and the average of the results was calculated. The water use efficiency of woad leaves was calculated as follows:
where WUEL is the water use efficiency of woad leaves, Pn is the net photosynthetic rate, and Tr is the transpiration rate.
WUEL = Pn/Tr,
2.3.2. Dry Matter
Three uniformly growing plants were selected to calculate the accumulation of dry matter in different growth periods. Sampled plants were taken indoors, rinsed repeatedly with clean water, and drained of excess water with filter paper. The aboveground parts of the plant were separated from the roots, dried, and weighed separately.
2.3.3. Yield and Harvest Index
When the woad plants were harvested at maturity, a unit area (1 m2) with uniform growth was selected in each plot and used to calculate the total yield per hectare. The calculation formula for the harvest index of woad was as follows:
where HI is the harvest index of woad; Y is the economic yield per unit area (kg·ha−2); and Yb is the biomass per unit area (kg·ha−2).
HI = Y/Yb,
2.3.4. Water Use Efficiency and Irrigation Water Use Efficiency
The calculation formula for water use efficiency and irrigation water use efficiency are as follows:
where WUE is water use efficiency (kg·ha−2·mm−1)) and IWUE is irrigation water use efficiency (kg·ha−2·mm−1). For calculating WUE, Y is the yield per unit area (kg·ha−2) and ET is the water consumption depth (mm) per unit area for the whole growth period. For calculating IWUE, I is the irrigation depth (mm) per unit area during the whole growth period.
WUE = Y/ET,
IWUE = Y/I,
2.4. Statistical Analysis
Microsoft Excel 2013 software was applied to calculate and process the test data. The SPSS 23.0 software was applied to analyze significant differences. The data were analyzed and plotted using three-year averages.
3. Results
3.1. Photosynthetic Characteristics
3.1.1. Net Photosynthetic Rate
The intensity of photosynthesis and accumulation of photosynthesis products in the leaves of woad were closely related to the net photosynthetic rate (Pn). The Pn of woad showed a unimodal curve during the whole growth period (Figure 3). The Pn had increased from the seedling to the fleshy root growth period and reached the maximum in the fleshy root growth period, while that in the fleshy root growth period began to decrease in each treatment. The Pn had increased the most during the vegetative growth period, while that in the fleshy root growth period increased slightly compared with control (CK). Water deficit was not imposed during the seedling stage, and the Pn was the same in each treatment. The Pn of leaves in the vegetative growth period was significantly higher than that at the seedling stage. The Pn of CK with sufficient water supply was the highest during the vegetative growth period, but there was no significant difference between CK and WT4, and the Pn of other deficit treatments were significantly lower than that of CK. The leaf Pn of WT1 and WT6 showed no significant difference, but were significantly (p < 0.05) reduced by 6.61%, and 6.80%, respectively, compared with CK. The Pn of WT3 significantly decreased by 25.39% compared with CK. These finding showed that all water deficit treatments would decrease the Pn, and the decrease would increase with the degree of water deficit regulation. During the fleshy root growth period, the Pn of the leaf was higher than that in the vegetative growth period. The Pn values of WT1 and WT6 leaves that were rehydrated after mild water deficit regulation adjustment increased significantly by 4.13% and 4.82%, respectively, compared with CK, showing a certain rehydration compensation effect. The Pn of WT3 had increased slightly following rehydration after the severe water deficit regulation, but the increase was still significantly lower than that observed in CK. The Pn at fleshy root maturity was lower than that during fleshy root growth. There was no significant difference among WT1, WT4, and CK at fleshy root maturity. The Pn of the remaining treatments were significantly lower at fleshy root maturity compared with CK, with a decrease of 11.12–29.04%.
3.1.2. Transpiration Rate
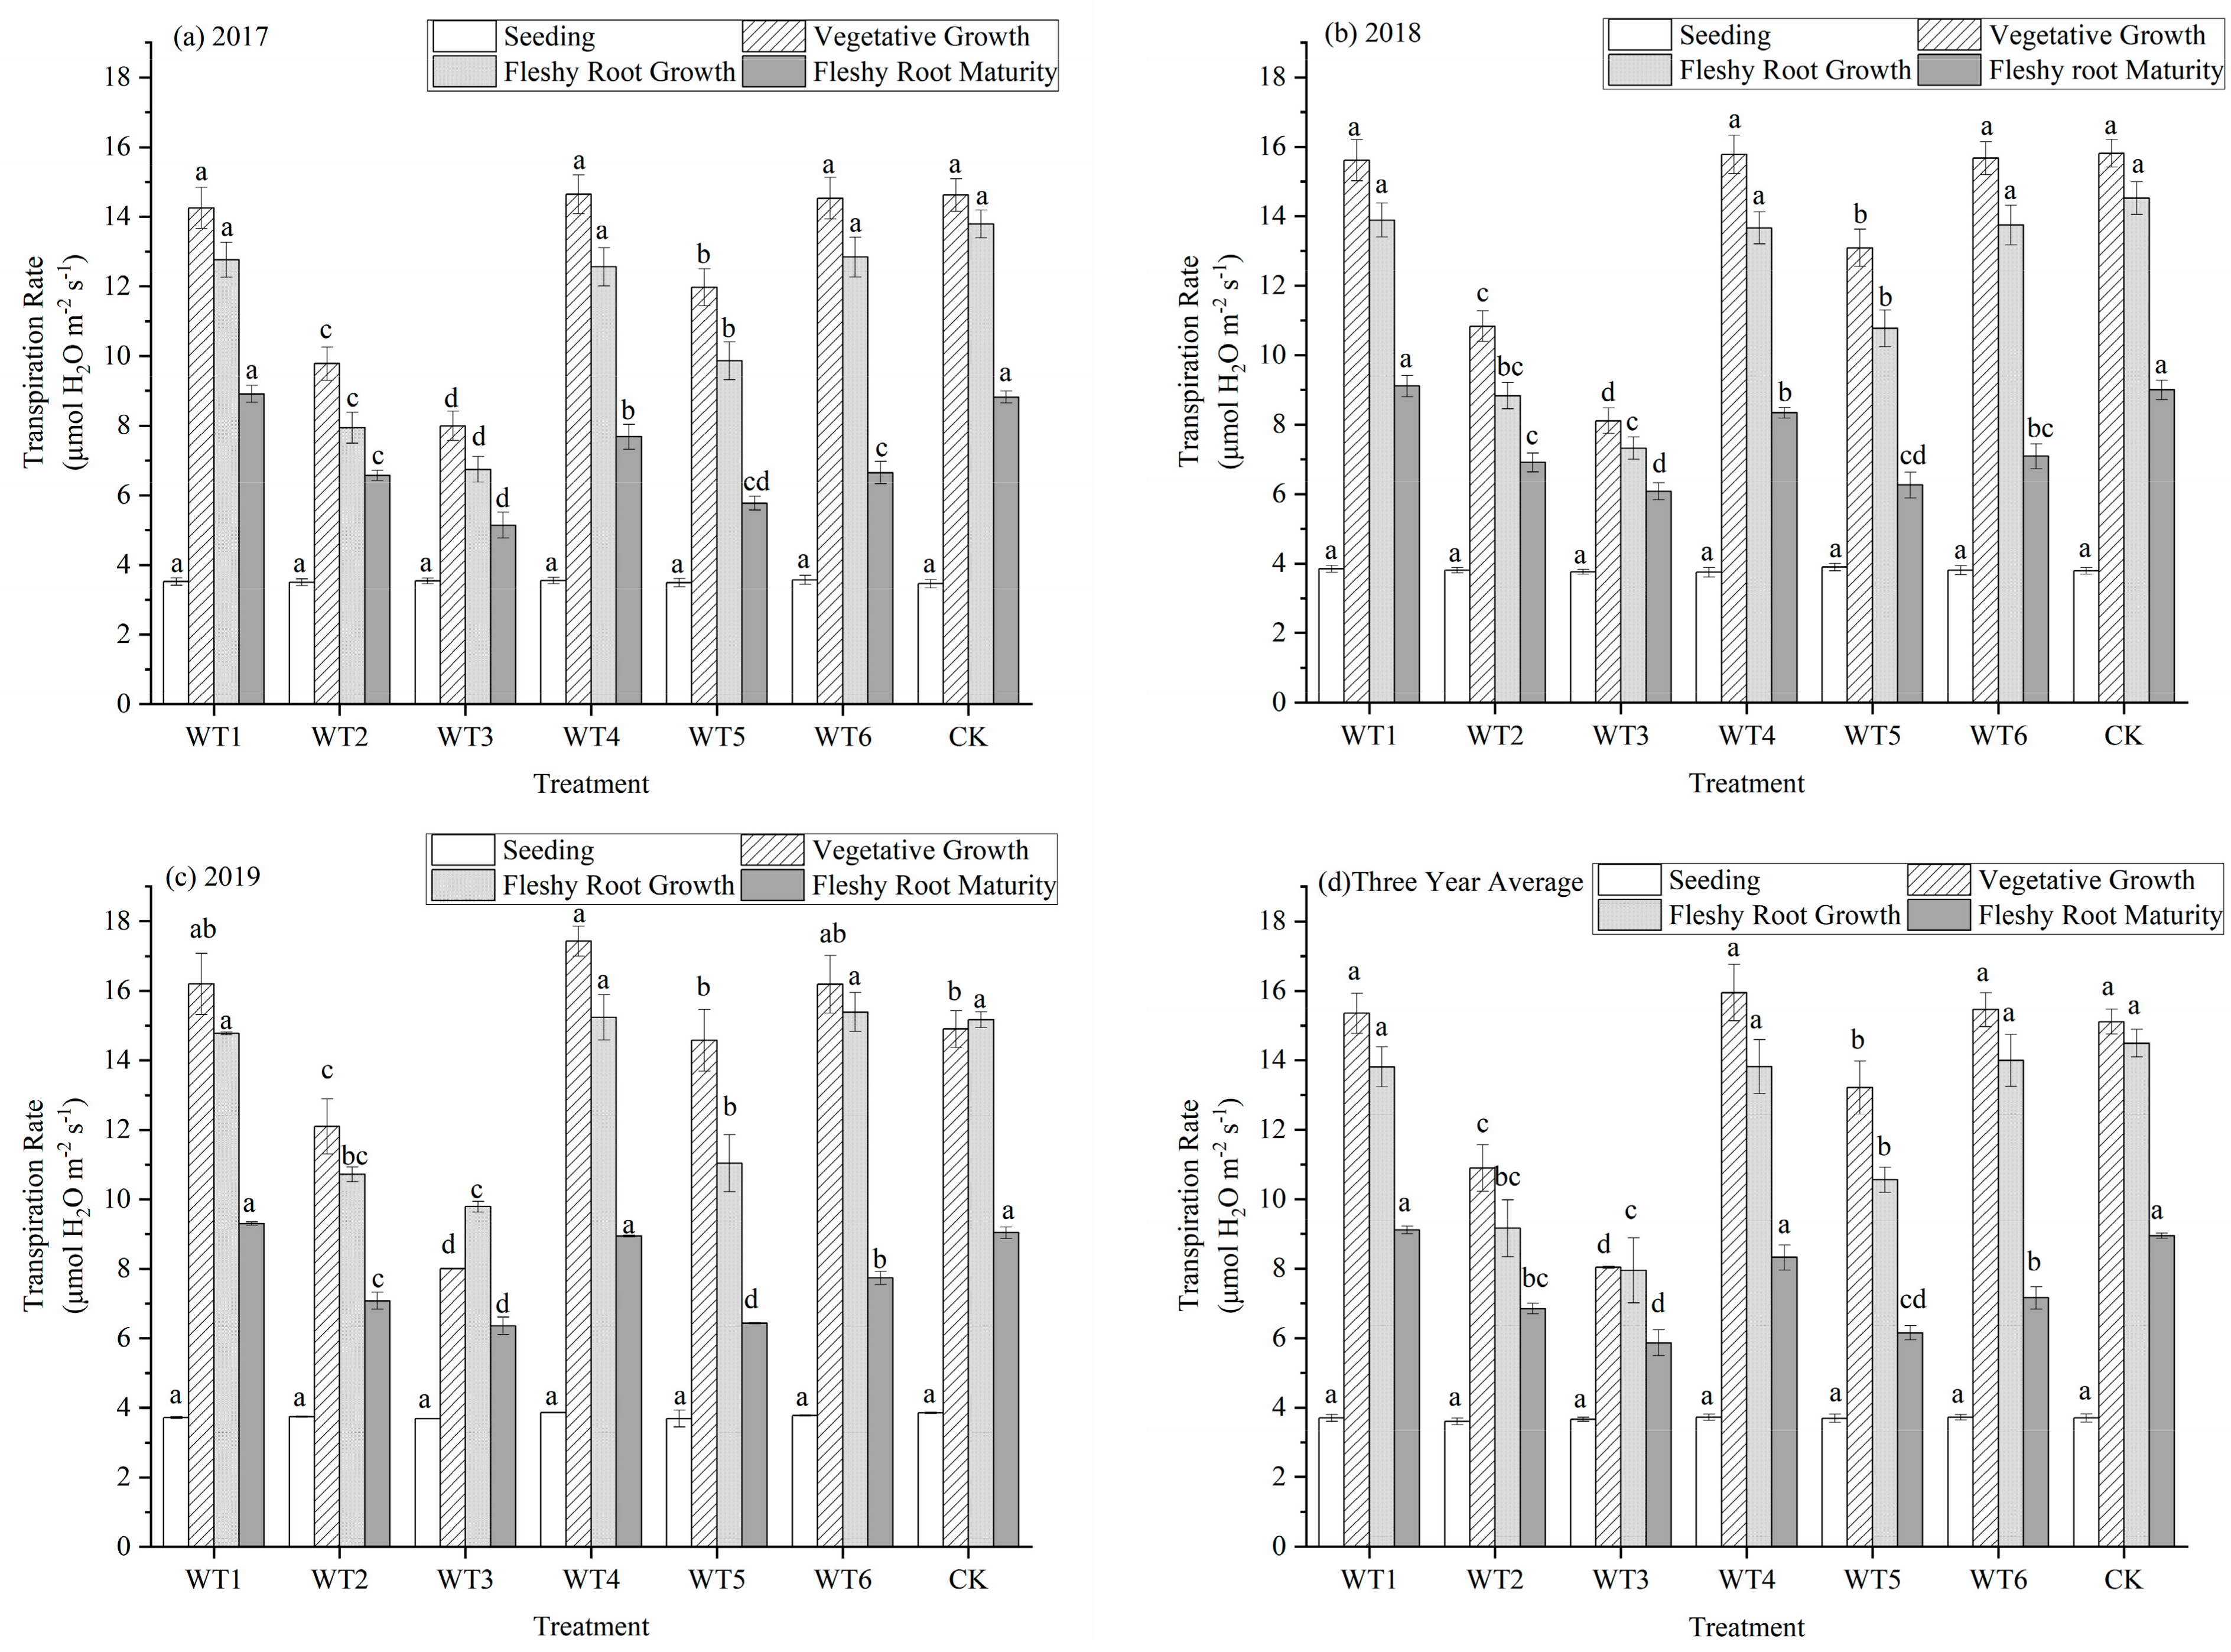
The transpiration rate (Tr) of woad leaves increased first and then decreased during the whole growth period (Figure 4). The increase in the vegetative growth period was the highest and reached the maximum during the vegetative growth and fleshy root growth periods. The Tr was influenced by water deficit regulation during the whole growth period. The Tr was the lowest at the seedling stage; all treatments were lower than 3.75 micromole per square meter per second (μmol·m−2·s−1), and there were no significant differences. During the vegetative growth period, WT4 had the highest Tr, with a value of 15.95 μmol·m−2·s−1, which did not differ significantly from that measured in WT1, WT6, and CK. The Tr of WT2, WT3, and WT5 were significantly reduced by 27.86%, 46.79%, and 12.57%, respectively, compared with CK. Mild water deficit regulation during the vegetative growth period did not cause a significant reduction in Tr, while a moderate and severe water deficit caused a significant reduction in Tr. There were no significant differences among WT1, WT4, WT6, and CK after entering the fleshy root growth period. The Tr of WT2, WT3, and WT5 significantly decreased by 36.78%, 45.13%, and 27.12%, respectively, compared with CK. The Tr at the fleshy root maturity had significantly decreased compared with the fleshy root growth period. The Tr did not differ significantly among WT1, WT4, and CK at fleshy root maturity, while the Tr in the vegetative growth and fleshy root maturity periods under a mild water deficit in WT6 had significantly decreased by 20% compared with CK. This indicates that the mild water deficit regulation at fleshy root maturity would significantly decrease the Tr of woad.
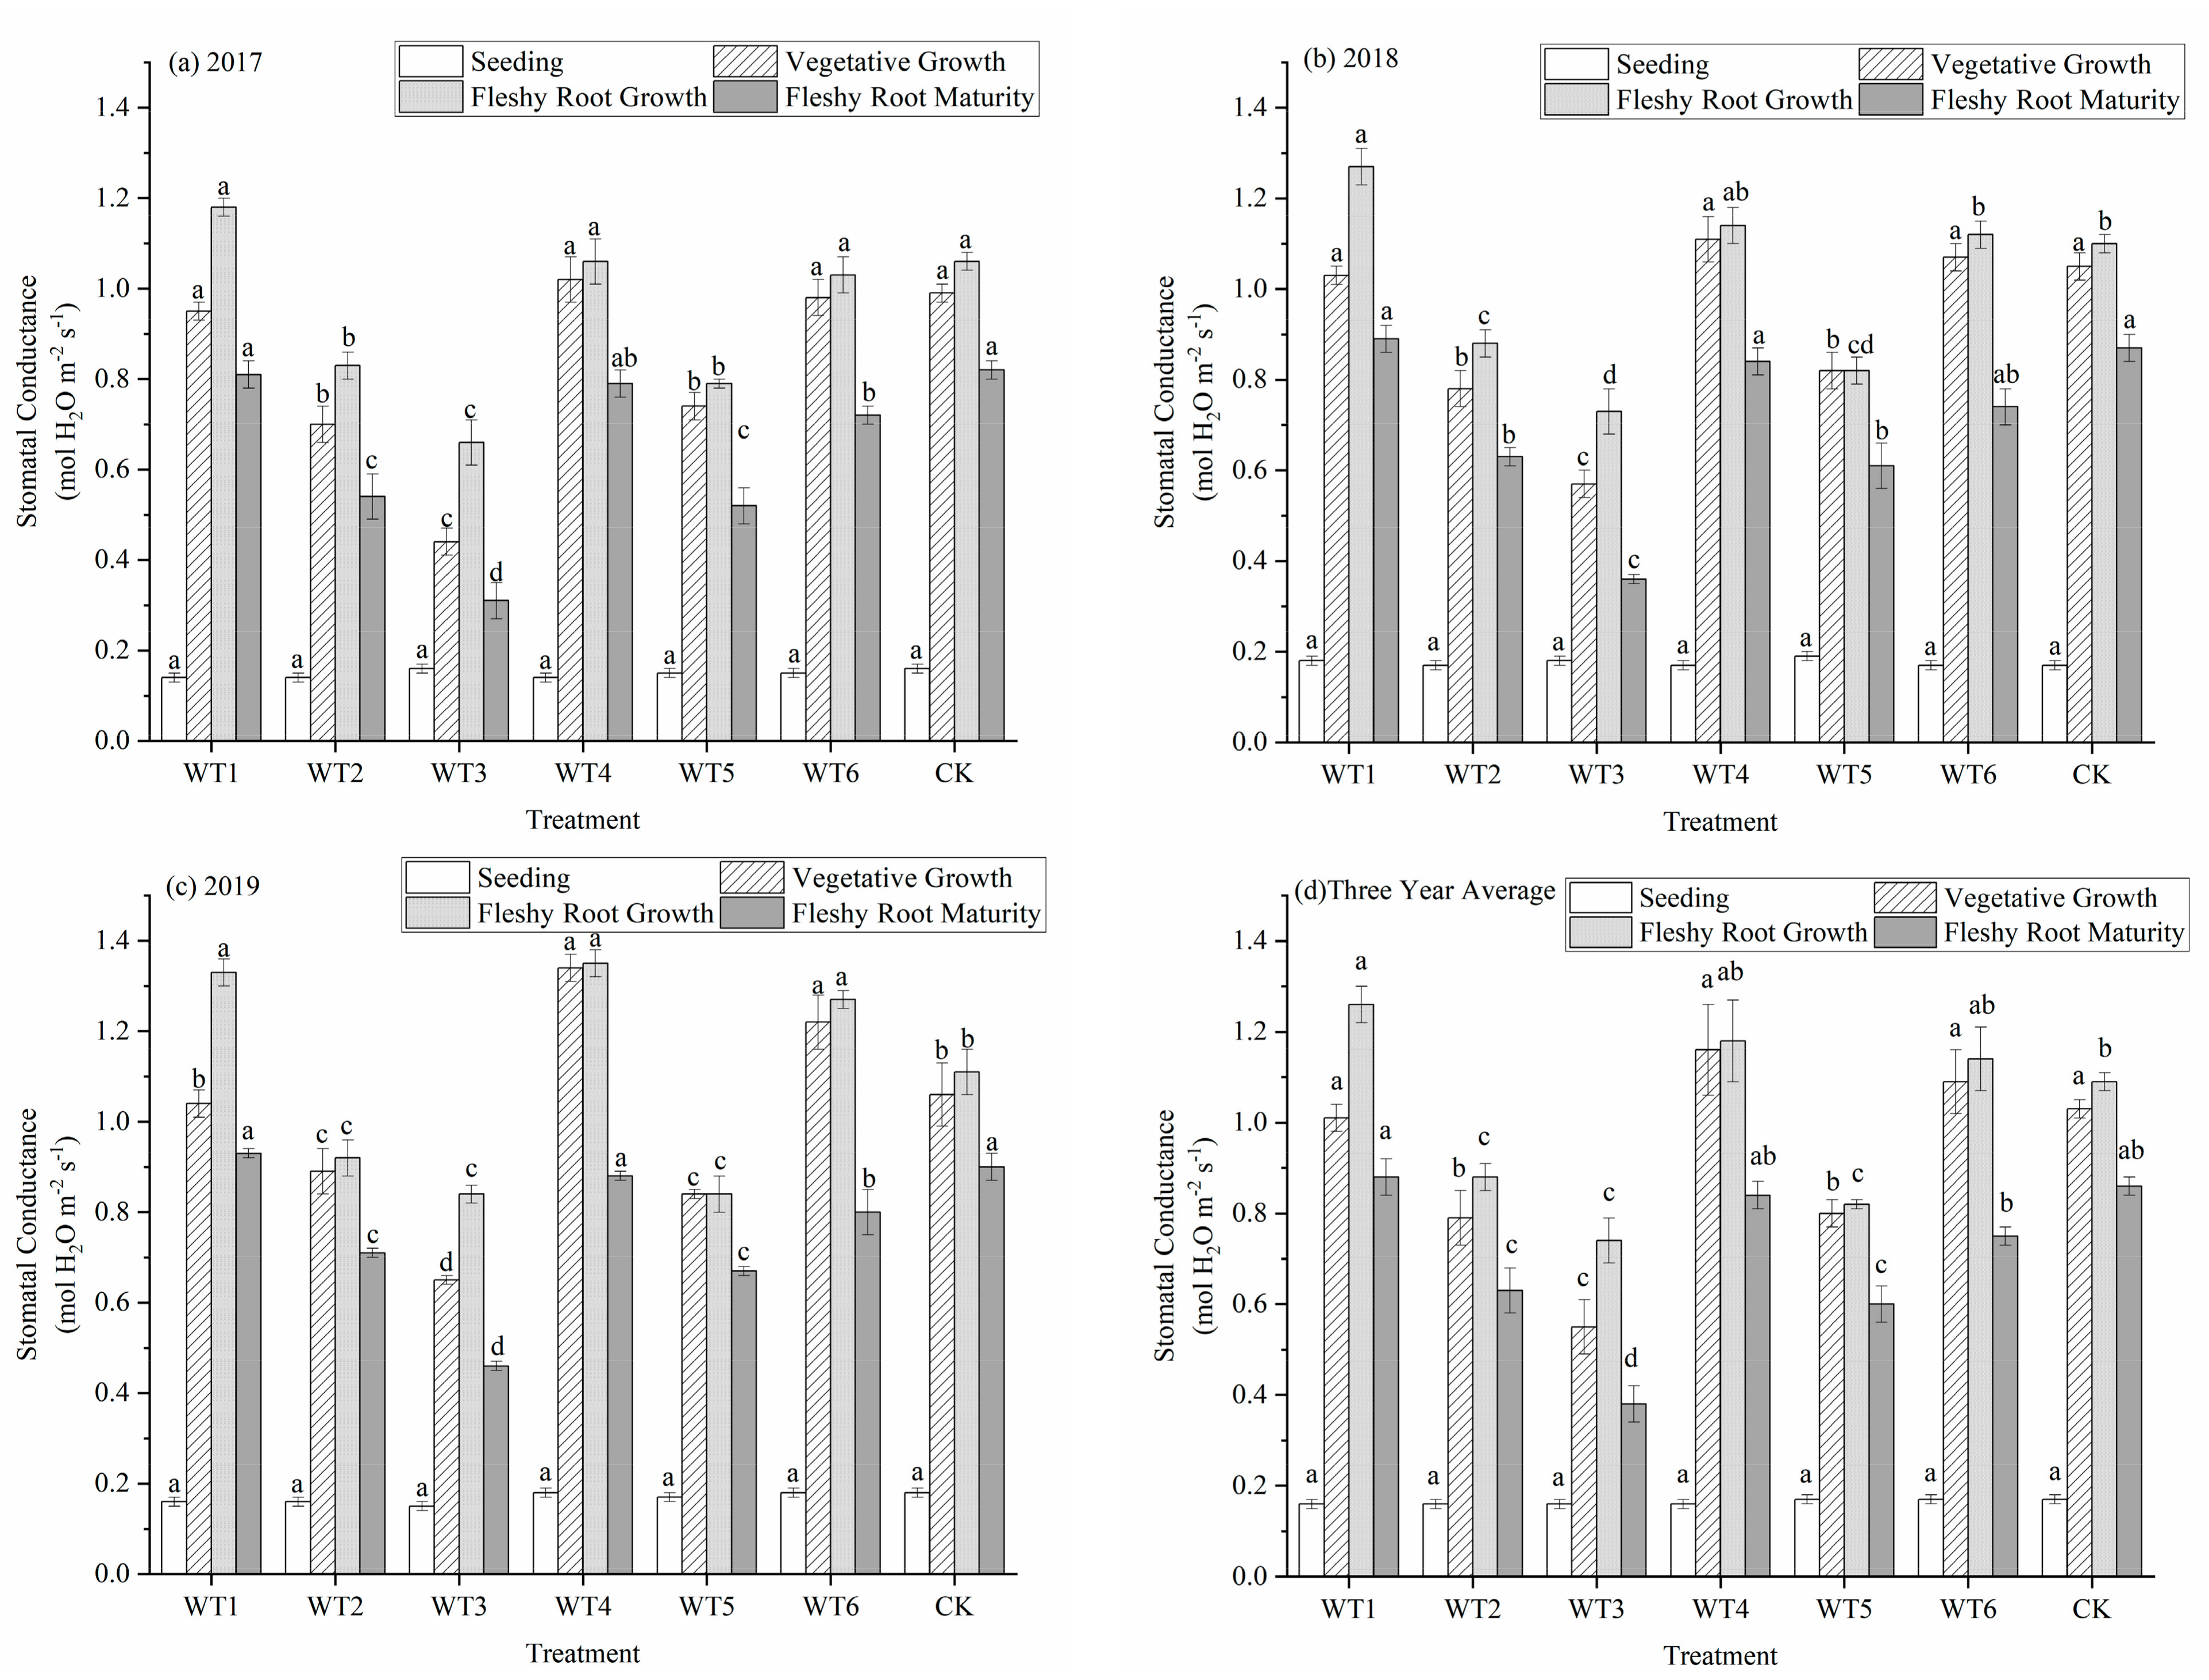
3.1.3. Stomatal Conductance
Stomata are the main outlet of water vapor in the process of plant transpiration and also the channel of gas exchange during photosynthesis and respiration. During gas exchange between plants and the atmosphere, water deficit leads to decreased turgor pressure of mesophyll cells and finally to decreased stomatal conductance (Gs). With growth stage progression, Gs in each treatment gradually increased, mainly from the seedling to the vegetative growth period. The Gs at fleshy root growth reached the maximum and began to decrease after entering the fleshy root maturity period (Figure 5). The variation of Gs in each treatment at the seedling stage was the same, with no significant difference. During the vegetative growth period, the Gs of WT4 (1.16 mol·m−2·s−1) was the highest and did not differ significantly from that of WT1, WT6, and CK. Compared with CK, the Gs of WT2, WT3, and WT5 were significantly reduced by 23.30%, 46.60%, and 22.33%, respectively. This indicates that mild water deficit regulation increased Gs, but moderate and severe water deficit significantly decreased Gs. There was no significant difference among WT1, WT4, and WT6 at the fleshy root growth period, while WT1 was significantly increased by 15.6% compared with CK on Gs. This shows that rehydration after mild water deficit regulation had a certain compensation effect. The Gs of the severe water deficit regulation of WT3 (0.38 mol·m−2·s−1) was the lowest at fleshy root maturity, which was significantly reduced by 55.81% compared with CK. This indicates that the influence of water deficit regulation occurred after severe water deficit regulation during vegetative growth, and rehydration had little influence on Gs.
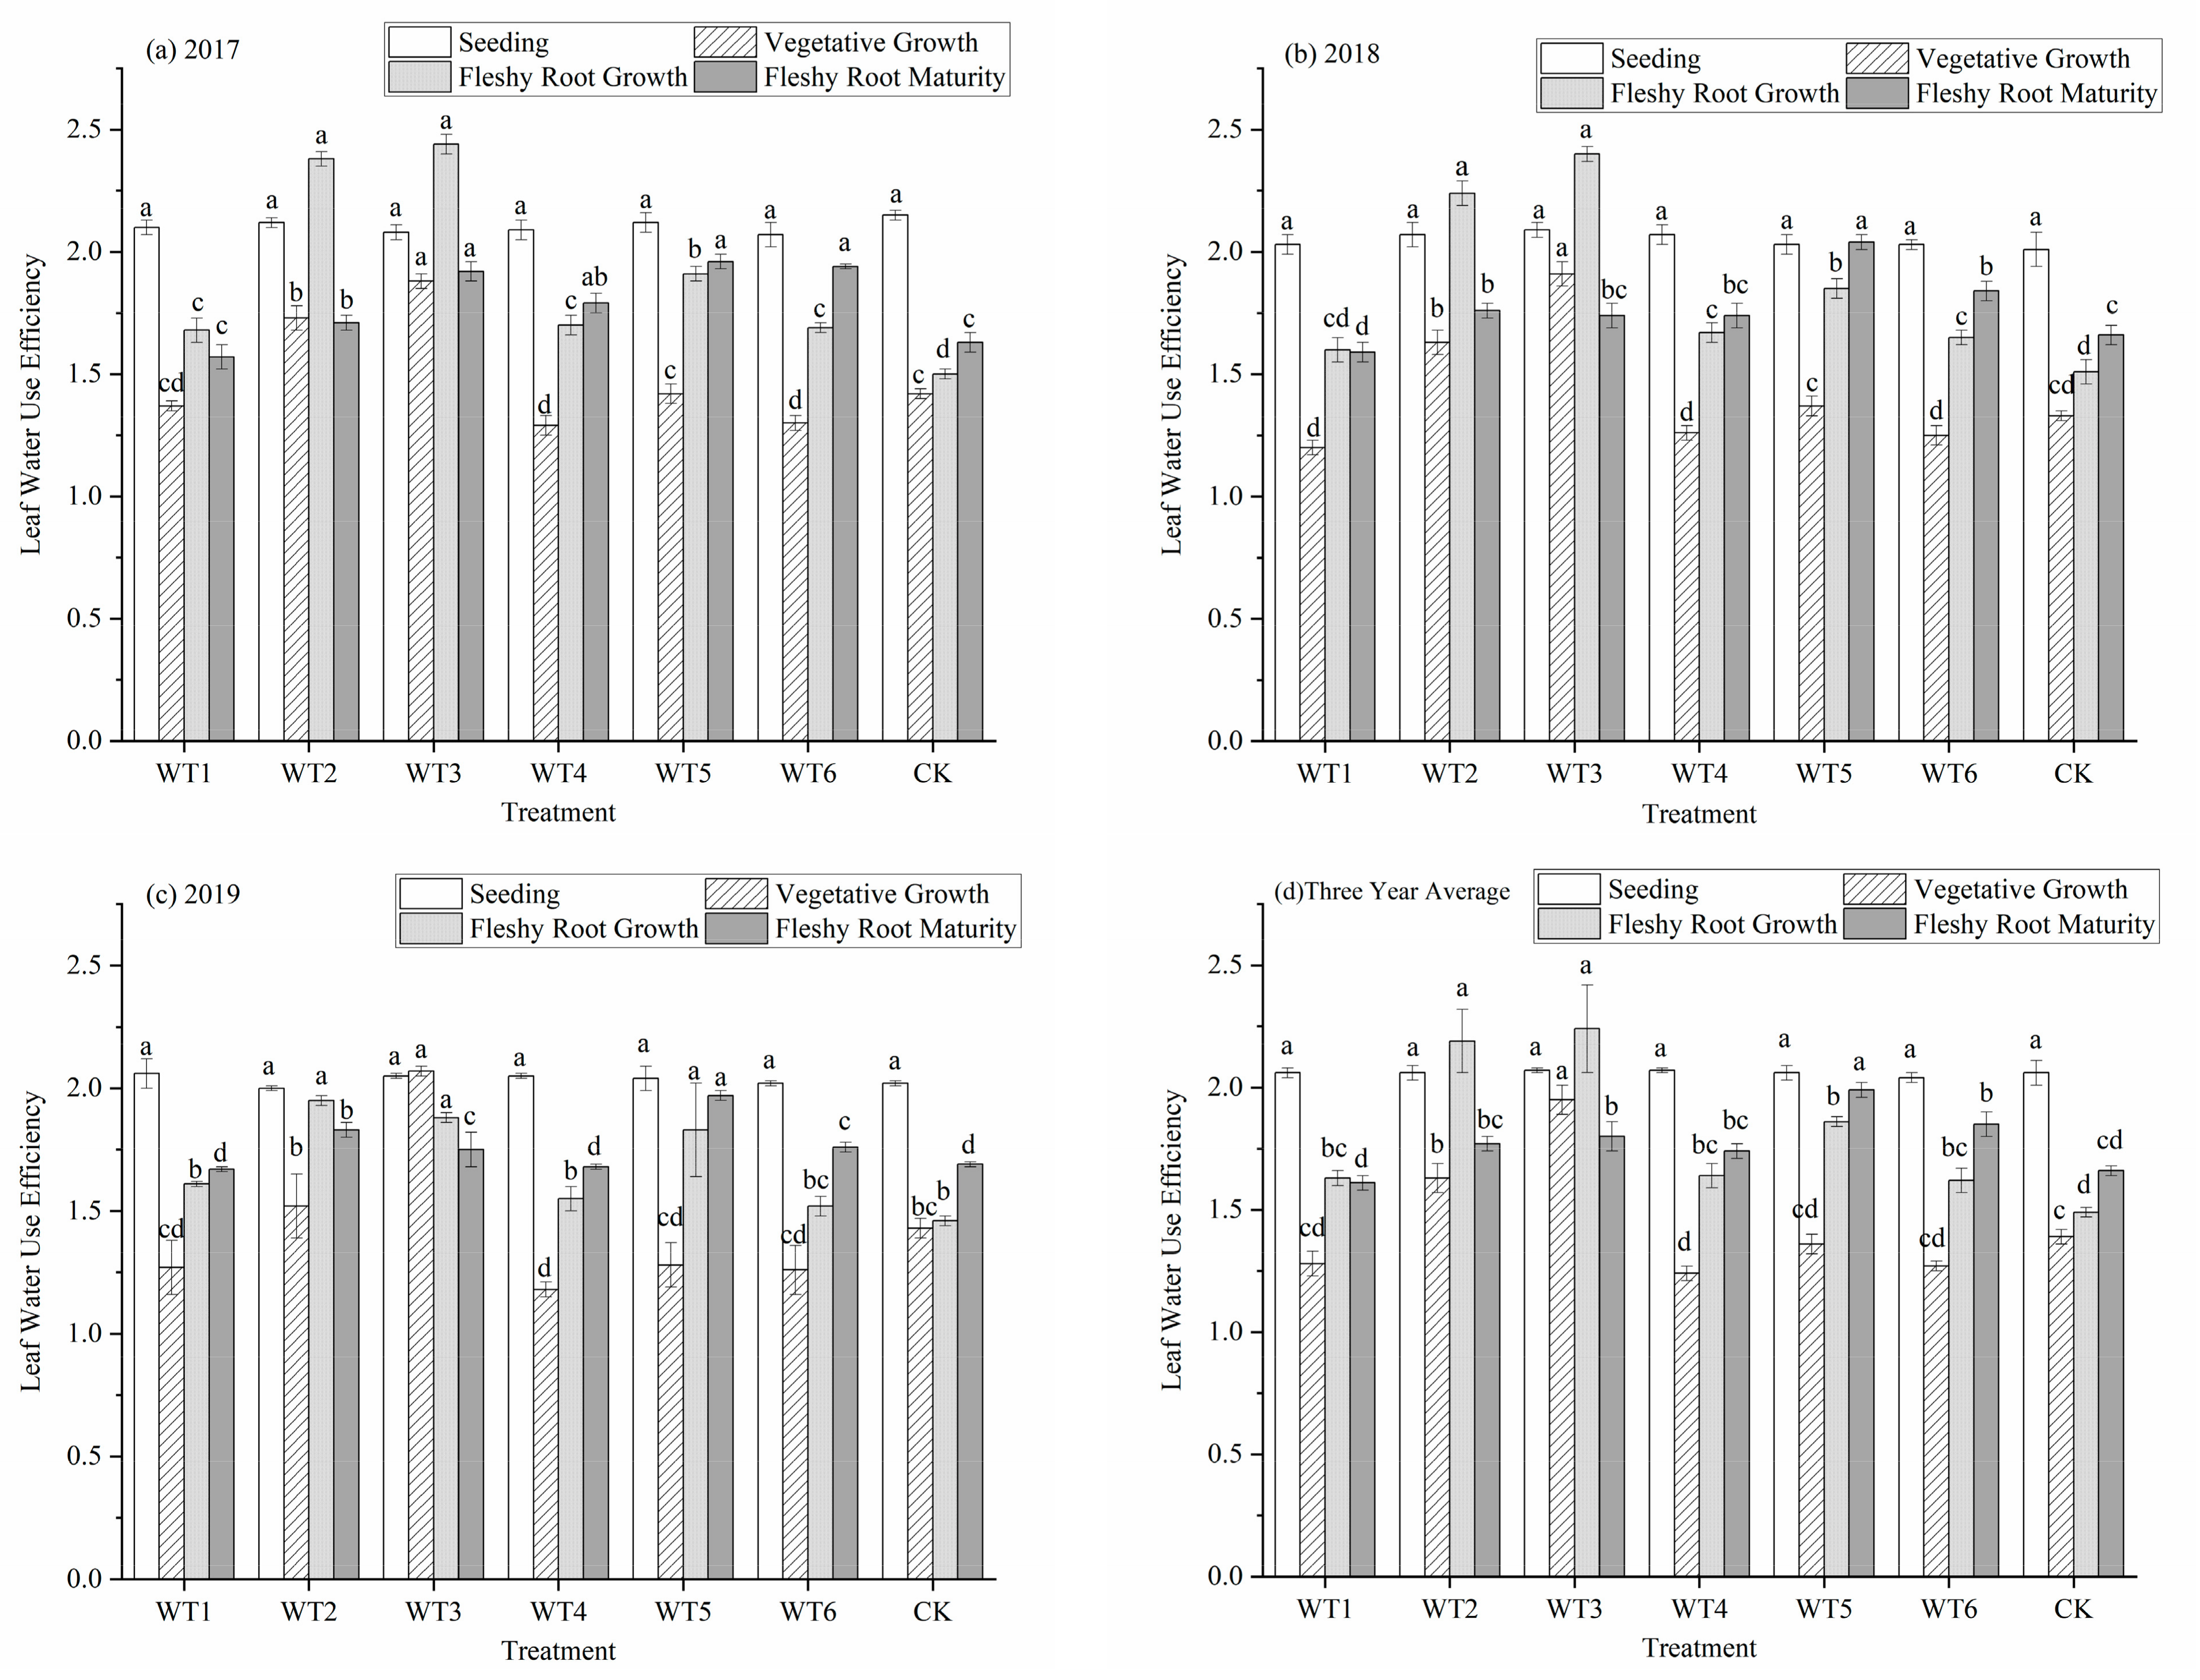
3.1.4. Leaf Water Use Efficiency
With the progression of the growth period, the leaf water use efficiency (WUEL) of each treatment first decreased, reached the lowest value in the vegetative growth period, and then gradually increased (Figure 6). There was no water deficit regulation during the seedling stage and no significant differences in WUEL among treatments. The WUEL of WT1, WT5, and WT6 in the vegetative growth stage was lower than that of CK, and no significant differences were observed. Compared with the control (CK), WT2 and WT3 increased by 17.27% and 40.29%, respectively (p < 0.05). This indicates that moderate and severe deficits improved leaf water use efficiency. During the fleshy root growth stage, the WUEL of each water deficit level increased compared with the CK. No significant difference in WUEL was observed among WT1, WT4, and WT6, while WUEL of WT2, WT3, and WT5 were significantly higher than that of the CK, increasing 46.98%, 50.34%, and 24.83%, respectively. At fleshy root maturity, the WUEL had a smaller increase or decrease compared that during the fleshy root growth period. The WUEL of WT5 was the highest (1.99), with a significant increase of 19.88% compared with the CK. The WUEL of WT3 and WT6 significantly increased by 8.43% and 11.45%, respectively.
3.2. Economic Yield and Yield Components
3.2.1. Economic Yield
The woad economic yield under WT1 was the highest at 8473.45 kg·ha−2, which did not differ significantly from the control (Table 2). The economic yields of WT1, WT4, and the control (CK) showed no significant difference. This indicated that economic yield was not impacted by mild water deficit regulation at the vegetative growth and fleshy root growth periods. The economic yield of the other treatments decreased significantly by 6.74–17.65% compared to the CK (p < 0.05). The economic yields of WT2 and WT3 were significantly reduced by 9.80% and 17.65%, respectively, compared with the CK. This indicates that moderate and severe water deficit regulation would result in a significant decline in the economic yield of woad, which would increase with the aggravation of the water deficit. The economic yield of WT6 was significantly reduced by 6.74% compared with WT4, which showed that economic yield was influenced by the period of the water deficit.
3.2.2. Yield Components
All water deficit levels had an impact on the yield components of woad (Table 2). The control (CK) had the highest number of lateral roots and showed no significant difference from WT1 and WT4. The number of lateral roots in other treatments was significantly (p < 0.05) reduced by 17.09–31.03% compared with the CK. The treatment WT3 had the fewest lateral roots, which were significantly reduced by 31.03% compared with the CK. This shows that the water deficit regulation could inhibit the lateral root growth of the plant, and the inhibition degree increased with the water deficit regulation degree. The taproot length of WT4 was the longest (26.35 cm), which was at the same level as that of WT1 and the CK. Compared with the CK, the taproot length of WT6 decreased by 1% and showed no significant difference. All other water deficits significantly decreased the taproot length by 2.89–16.04%. This indicated that mild water deficit regulation would not influence taproot length significantly, while moderate and severe deficits severely inhibited the taproot length of woad. The taproot diameter of WT4 was the largest (1.78 cm), which was larger than that of CK by 2.89%. The taproot diameter showed no significant difference among WT1, WT4, and the CK, while that for WT2 and WT3 were significantly lower than the taproot diameter of the CK. This indicated that a continuous mild deficit at the vegetative to fleshy root growth stage was conducive to increase the taproot diameter, while moderate and severe deficit could reduce the taproot diameter. The root dry weight of WT1 was significantly increased by 8.49% compared with the CK. The root dry weight of WT3 was significantly reduced by 15.89% compared with the CK. This indicated that mild water deficit regulation was beneficial for the accumulation of root dry matter, while severe deficit inhibited root dry matter accumulation.
3.3. Total Biomass and Harvest Index
The total biomass of CK was the highest (12,576.81 kg·ha−2), which did not differ significantly from that of WT1 and WT4 (Table 2). The total biomass of the other treatments decreased significantly, and the greater the degree of water deficit regulation, the greater the decrease. The total biomass of WT2, WT3, WT5, and WT6 were significantly (p < 0.05) lower than that of the CK by 11.72–18.91%. This indicates that moderate and severe water deficit regulation cause a significant decline in the total biomass of woad. The total biomass of WT5 was significantly reduced by 8.14% compared with WT2, and the total biomass of WT6 was significantly reduced by 8.49% compared with WT1. This showed that continuous moderate water deficit regulation from the vegetative to the fleshy root growth period and mild water deficit regulation at fleshy root maturity significantly decrease the total biomass.
The harvest indexes of the water deficit treatments were between 0.6687 and 0.6830 (Table 2). The harvest index of WT4 was the highest, which was significantly (p < 0.05) higher than that of the CK by 2.29%, indicating that the mild water deficit regulation at the vegetative growth and fleshy root growth stages was beneficial to the improvement of the harvest index. The harvest indexes of WT1, WT2, WT4, WT5, and WT6 showed no significant differences (p > 0.05), with an increase of 0.15–2.29% compared with the CK. The WT3 treatment had the lowest harvest index, which was 0.15% lower than that of the CK, but a significant difference was not observed. This indicates that the harvest index under severe water deficit regulation was not significantly influenced during the vegetative growth period.
3.4. Water Consumption, Water Use Efficiency, and Irrigation Water Use Efficiency
3.4.1. Water Consumption
The woad water consumption (387.38 mm) and irrigation amount (169.96 mm) were the highest in the CK during the whole growth period (Table 3). The total water consumption in other treatments were significantly (p < 0.05) reduced by 4.44–10.21% compared with the CK. Compared with the CK, the irrigation amounts of WT1, WT2, WT4, and WT6 were at the same level, while other treatments were significantly reduced by 15.74–19.45% compared with the CK. The total water consumption showed no significant difference among WT1, WT2, and WT6. The irrigation amounts of WT1, WT2, WT4, and WT6 were at the same level. The total water consumption of WT4 and WT5 were significantly reduced by 7.42% and 8.35%, respectively, compared with the CK. The irrigation amounts of WT4 and WT5 were reduced by 8.23% and 15.74%, respectively, compared with CK, and there were significant differences between WT5 and the CK. The total water consumption and irrigation amount of WT3 were the lowest, and their values were 347.83 mm and 136.90 mm, respectively. The total water consumption and irrigation amount of WT3 were significantly reduced by 10.21% and 19.45%, respectively, compared with the CK.
3.4.2. Water Use Efficiency and Irrigation Water Use Efficiency
Water use efficiency (WUE) and irrigation water use efficiency (IWUE) of WT1 were the highest followed by WT4. There were no significant (p > 0.05) differences between WT1 and WT4. Compared with the CK, the WUE of WT1 and WT4 were significantly (p < 0.05) increased by 7.84% and 6.92%, while their IWUE were significantly increased by 7.95% and 7.91%, respectively. The WUE was at the same level between WT6, and the CK. The WUE of WT5 was the lowest, which was significantly lower than that of the CK by 10.24%. This demonstrated that continuous moderate water deficit regulation would significantly reduce WUE at the vegetative growth and the fleshy root growth stages, and the mild water deficit regulation increased WUE. There were no significant differences in IWUE among WT2, WT3, WT6, and the CK or between WT5 and WT6. The IWUE of WT5 was the lowest, with a reduction of 2.12% compared with the CK, which indicated that a suitable water deficit can improve WUE and IWUE of woad. The IWUE of WT1 and WT6 showed no significant differences, but WUE was significantly different. This shows that the mild water deficit at fleshy root maturity had no significant influence on IWUE, but had a significant impact on WUE.
3.5. Correlations among Various Indices
Table 4 shows the correlation among various indices of woad. The total biomass of woad was significantly positively correlated with net photosynthetic rate (Pn), transpiration rate (Tr), stomatal conductance (Gs), taproot length and diameter, lateral root number, root biomass, and irrigation amount with correlations ranging from 0.888 to 0.984 (Table 4). Total biomass and woad yield were not significantly correlated with water consumption. Similar to total biomass, woad yield was also significantly positively correlated with the exact same plant and root characteristics and irrigation amount with correlations ranging from 0.886 to 0.973 (Table 4).
4. Discussion
4.1. Photosynthetic Characteristics
This study showed that the Tr and Gs of WT4 were the highest in the vegetative growth period of woad, with values of 15.95 μmol·m−2·s−1 and 1.16 mol·m−2·s−1, respectively, which were 5.56% and 12.62% higher than those in the control (CK; p < 0.05), but with no significant difference from WT1 and WT6. The Pn, Tr, and Gs of WT2 were significantly reduced by 16.12%, 27.86%, and 23.30%, respectively, compared with the CK. The Pn, Tr, and Gs of WT3 were significantly reduced by 25.39%, 46.79%, and 46.60%, respectively, compared with the CK. The results indicated that mild water deficit regulation during the vegetative growth period did not significantly decrease the Tr and Gs of woad leaves, while moderate and severe deficit regulation decreased Pn, Tr, and Gs significantly, and the decrease increased with increasing water deficit. The reason may be that water stress resulted in decreased Gs, which inhibited the CO2 entry into leaves, while the photosynthetic activity of the mesophyll cells was decreased [28,29]. This conclusion is similar to that reported in a previous study where the Pn, Tr, and Gs of winter wheat were significantly reduced at different periods by regulated deficit irrigation [20]. The stomatal conductance of leaves decreases with a decrease in the soil moisture content, thus limiting photosynthesis [30]. Past research found that RDI reduced the Pn, Tr, and Gs of winter wheat in diverse periods. The photosynthetic rate decrease was mainly because of the Gs decrease and intercellular CO2 concentration [31].
The physiological indices of crops are affected by rewatering after water deficit, which is also one of the core contents of the research on regulated deficit irrigation theory. The Pn and Gs of WT2 during the fleshy root growth period were 1.12% and 7.31% higher, respectively, than those in WT5. This indicated a certain compensation effect after rehydration. A prior study drew a similar conclusion that the Pn, Tr, and Gs of kidney beans were reduced by water deficit, however after rehydration these characteristics were restored but with different recovery rates [32]. The Pn and Tr recoveries were synchronous, but Gs recovered relatively slowly. This might be correlated with the decrease in the soil water content that caused a variation in the leaf water potential. The photosynthetic characteristics of woad improved by timely and moderate water deficit regulation, similar to a study on winter wheat [33].
In this study, the WUEL of WT2 and WT3 increased by 17.27% and 40.29%, respectively, during the vegetative growth period compared with the CK, while WT2, WT3, and CK did not differ significantly (p > 0.05). This indicates that moderate and severe water deficit regulation increased the WUEL of woad. Similar results have been reported in previous research. In previous research, water deficit resulted in a simultaneous decrease in the Pn and Tr for olive trees [34]. However, due to a greater reduction in Tr, the WUEL of the olive leaves improved. For pear-jujube trees, the transpiration rate and stomatal opening of leaves had a more significant response to water deficit than the photosynthetic rate, and the water deficit increased WUEL [35].
4.2. Yield and Yield Components
For winter wheat, mild water stress could improve canopy structure, while moderate water deficit could improve dry matter distribution, thereby increasing yield [20]. Woad leaves are the main photosynthetic organs, and the roots determine the yield. This study found that the taproot length and taproot diameter of WT4 were the largest, which have no significant differences between WT1 and the control (CK). There were no significant differences in taproot diameter and root biomass among WT1, WT4, and the CK. The taproot length, taproot diameter, root biomass, and the number of lateral roots of WT2 decreased compared with the CK. The taproot length, taproot diameter, root biomass, and lateral root number of WT3 were the lowest, which were significantly reduced by 16.04%, 13.29%, 15.89%, and 31.03%, respectively, compared with the CK. This indicates that a mild water deficit had no significant impact on the taproot length but increased the taproot diameter and root dry matter accumulation. Moderate and severe water deficit could seriously restrict the taproot length and taproot diameter, which is not beneficial for root dry matter accumulation. Mild water stress was found to be conducive for grain accumulation, in contrast to normal irrigation or more severe water stress [36]. A wider canopy structure causes poor ventilation under normal water supply conditions, which in turn reduces the soil oxygen concentration and inhibits root activity, thereby reducing the proportion of the photosynthetic products distributed to grains. For soybeans, dry matter distributed to roots increased with increasing water stress but had no impact of total dry matter [37]. This is not completely consistent with the results of this study and may be because woad has a deep nodular root system, similar to that of sugar beet, and therefore has a complex reaction to water stress [38].
The economic yield of WT1 was the highest, and there were no significant differences among WT1, WT4, and the CK. This indicates that the mild water deficit regulation at the vegetative growth and fleshy root growth stages had little influence on economic yield. Similar results were found for winter wheat in southern Australia where different degrees of water deficit at different crop growth stages impacted dry matter distribution and increased yield [39]. The economic yields of WT2, WT3, and WT5 were significantly (p < 0.05) reduced by 9.80%, 17.65%, and 17.74%, respectively, compared with the CK. This indicates that moderate and severe water deficit regulation would cause a significant decrease in the economic yield of woad, which increases with the water deficit. Drought stress reduced wheat grain yield by 20–80% [40,41], while adequate soil water tempered the impacts of temperature and drought on wheat growth and yield [42,43].
4.3. Total Biomass and Harvest Index
Our research found that regulated deficit irrigation at various growth periods of woad caused different degrees of decline in total biomass, and the greater the water deficit, the greater the decrease. The total biomass of the control (CK) was the highest (12,576.81 kg·ha−2), and that of WT1 and WT4 did not decrease significantly compared with the CK. Other treatments were significantly reduced compared with the CK, with a decrease ranging from 8.59% to 18.91%. Two previous studies found that the use of regulated deficit irrigation technology for crops can increase WUE and obtain a higher yield, thereby improving crop quality [44,45].
The ratio of the economic yield to total biomass is called the crop harvest index, which reflects the level of crop production to a certain extent. An appropriate water deficit can improve the harvest index of crops, but an extreme water deficit will seriously inhibit crop growth, reduce economic yield and total biomass, and lead to a decline in the harvest index. This study found that mild and moderate water deficit regulation increased the harvest index of woad, with an increase of 1.00–2.29% compared to the CK. A severe deficit did not improve the harvest index, which is basically consistent with previous research results. This may be due to the severe water deficit regulation of woad resulting in the hardening of the cell wall and difficulty in recovery after rehydration, resulting in a decline in biomass and a decrease in the harvest index. A certain level of drought could facilitate assimilative translocation and enhance the crop harvest index at a certain period [46].
4.4. Water Consumption
This study showed that the total water consumption of the CK was the highest (387.38 mm) throughout the whole growth period, and other treatments were significantly (p < 0.05) lower, by 4.44–10.21%, compared with the CK. Severe water deficit during the vegetative growth period of WT3 resulted in the lowest water consumption during the whole growth period, which at 347.83 mm had 4.44% lower water consumption compared to the CK. This indicated that the decrease in water consumption of woad during the whole growth period increased with aggravation of the water deficit. These results were similar to those for greenhouse tomatoes where regulated deficit irrigation decreased total water consumption and improved WUE without significantly affecting yield [47]. Using adjusted deficit irrigation can reduce water use when producing woad in this area. Reducing waste of irrigation water can alleviate declines in the groundwater level, conserving the environment and contributing to development that is more sustainable.
4.5. Water Use Efficiency and Irrigation Water Use Efficiency
An improvement in WUE can be realized by increasing dry matter accumulation and reducing water consumption [48]. Excessive irrigation could lead to reduced yield, WUE, and IWUE of winter wheat [49]. Over-irrigation might not result in greater yields or optimal economic benefits [50]. Timely and appropriate regulated (RDI) could reduce the total water consumption of crops during the whole growth period, and improve WUE, with no significant impact on yield, while saving water. Prior research found that RDI could reduce total water consumption and improve WUE without significantly affecting the yield of processed tomatoes [51]. In our research, economic yield was the highest in WT1, and there was no significant difference between WT4 and the control (CK). There were no significant differences in WUE and IWUE between WT1 and WT4, but WUE and IWUE of WT1 and WT4 were significantly higher than that of the CK. The reason was that WT1 and WT4 reduced the water consumption during the whole growth period and increased WUE without significantly affecting the yield of woad. Timely and appropriate deficit irrigation or drought stress was beneficial to improve WUE and optimize various physiological indicators without significantly reducing wheat yield. Water stress was beneficial in reducing water consumption and improving WUE for sugar beet production [52].
5. Conclusions
The photosynthetic characteristics, yield, harvest index, and water use efficiency (WUE) of woad were influenced by different degrees of water deficit regulation. During the vegetative growth stage, mild water deficit regulation increased the transpiration rate (Tr) and stomatal conductance (Gs), while moderate and severe deficit regulation significantly decreased the net photosynthetic rate, Tr, and Gs but increased leaf WUE. Rehydration after water deficit regulation exerted a certain rehydration compensation effect. The total biomass of woad was decreased by regulated deficit irrigation during different growth periods. Mild water deficit regulation increased the taproot diameter and the accumulation of root dry matter but did not have a significant impact on the taproot length, thereby increasing the economic yield. Moderate and severe deficit regulation seriously restricted the taproot length and taproot diameter, which was not beneficial to dry matter accumulation and resulted in a decrease in yield. Mild water deficit regulation improved the harvest index during the whole growth period. The mild water deficit regulation at the vegetative growth and fleshy root growth stages reduced the total water consumption and irrigation water amount without significantly reducing the yield and improved WUE for both woad and water used for irrigation. Therefore, the application of mild water deficit continuously during the vegetative growth and fleshy root growth periods was the optimal irrigation method to save water and to achieve high-yielding woad in this area. The universality and applicability of this method in other regions need to be further verified using more sample data from different years and locations. Therefore, future research could focus on the climate conditions and soil texture of different regions.
Author Contributions
Conceptualization, C.Z., H.Z., F.L. and Z.W.; methodology, C.Z.; software, C.Z.; validation, C.Z., H.Z., F.L., Z.W. and Y.W.; formal analysis, C.Z.; investigation, C.Z. and F.L.; data curation, C.Z.; writing—original draft preparation, C.Z.; writing—review and editing, C.Z. and H.Z.; funding acquisition, H.Z. All authors have read and agreed to the published version of the manuscript.
Funding
This research was funded by the Special Funds for Research Group Construction of Water Conservancy and Hydropower Engineering College, Gansu Agricultural University (No. Gaucwky-07), the Key Research and Developing Planning Projects of Gansu Province (No. 18YF1NA073) and the National Natural Science Foundation of China (No. 51669001).
Institutional Review Board Statement
Not applicable.
Informed Consent Statement
Not applicable.
Data Availability Statement
Not applicable.
Acknowledgments
We would like to thank the Special Funds for Research Group Construction of Water Conservancy and Hydropower Engineering College, Gansu Agricultural University (No. Gaucwky-07), the Key Research and Developing Planning Projects of Gansu Province (No. 18YF1NA073) and the National Natural Science Foundation of China (No. 51669001) for the funding and laboratory facilities. We thank LetPub (www.letpub.com (accessed on 2 July 2021)) for its linguistic assistance during the preparation of this manuscript.
Conflicts of Interest
The authors declare no conflict of interest.
References
- Han, J.; Jiang, X.; Zhang, L. Optimisation of extraction conditions for polysaccharides from the roots of Isatis tinctoria L. by response surface methodology and their in vitro free radicals scavenging activities and effects on IL-4 and IFN-γ mRNA expression in chicken lymphocytes. Carbohydr. Polym. 2011, 86, 1320–1326. [Google Scholar] [CrossRef]
- Hamburger, M. Isatis tinctorial—From the rediscovery of an ancient medicinal plant towards a novel anti-inflammatory phytopharmaceutical. Phytochem. Rev. 2002, 1, 333. [Google Scholar] [CrossRef]
- Recio, M.C.; Cerdá-Nicolás, M.; Potterat, O.; Hamburger, M.; Ríos, J. Anti-Inflammatory and Antiallergic Activity in vivo of Lipophilic Isatis tinctoria Extracts and Tryptanthrin. Planta Med. 2006, 72, 539–546. [Google Scholar] [CrossRef] [Green Version]
- Condurso, C.; Verzera, A.; Romeo, V.; Ziino, M.; Ragusa, S. The Leaf Volatile Constituents of Isatis tinctoria by Solid-Phase Microextraction and Gas Chromatography/Mass Spectrometry. Planta Med. 2006, 72, 924–928. [Google Scholar] [CrossRef]
- Ke, L.; Wen, T.; Bradshaw, J.P.; Zhou, J.; Rao, P. Antiviral Decoction of Isatidis Radix (bn lán gēn) Inhibited Influenza Virus Adsorption on MDCK Cells by Cytoprotective Activity. J. Tradit. Complement. Med. 2012, 2, 47–51. [Google Scholar] [CrossRef] [Green Version]
- Du, Z.; Liu, H.; Zhang, Z.; Li, P. Antioxidant and anti-inflammatory activities of Radix Isatidis polysaccharide in murine alveolar macrophages. Int. J. Biol. Macromol. 2013, 58, 329–335. [Google Scholar] [CrossRef]
- Nagendrappa, G. Chemistry triggered the first civil disobedience movement in India. J. Reson. 2003, 8, 42–48. [Google Scholar] [CrossRef]
- Spataro, G.; Negri, V. Adaptability and variation in Isatis tinctoria L.: A new crop for Europe. Euphytica 2008, 163, 89–102. [Google Scholar] [CrossRef]
- Author Chai, Q.; Gan, Y.T.; Zhao, C.; Xu, H.L.; Waskom, R.M.; Niu, Y.N.; Siddique, K.H.M. Regulated deficit irrigation for crop production under drought stress. A review. Agron. Sustain. Dev. 2016, 36, 3. [Google Scholar] [CrossRef] [Green Version]
- Yang, H.; Du, T.; Qiu, R.; Chen, J.; Wang, F.; Li, Y.; Wang, C.; Gao, L.; Kang, S. Improved water use efficiency and fruit quality of greenhouse crops under regulated deficit irrigation in northwest China. Agric. Water Manag. 2017, 179, 193–204. [Google Scholar] [CrossRef]
- Kang, S.; Zhang, L.; Liang, Y.; Hu, X.; Cai, H.; Gu, B. Effects of limited irrigation on yield and water use efficiency of winter wheat in the Loess Plateau of China. Agric. Water Manag. 2002, 55, 203–216. [Google Scholar] [CrossRef]
- Du, T.; Kang, S.; Sun, J.; Zhang, X.; Zhang, J. An improved water use efficiency of cereals under temporal and spatial deficit irrigation in north China. Agric. Water Manag. 2010, 97, 66–74. [Google Scholar] [CrossRef]
- Tolk, J.A.; Howell, T.A. Water use efficiencies of grain sorghum grown in three USA southern Great Plains soils. Agric. Water Manag. 2003, 59, 97–111. [Google Scholar] [CrossRef]
- Pascual-Seva, N.; San Bautista, A.; Lopez-Galarza, S.; Maroto, J.V.; Pascual, B. Response of drip-irrigated chufa (Cyperus esculentus L. var. sativus Boeck.) to different planting configurations: Yield and irrigation water-use efficiency. Agric. Water Manag. 2016, 170, 140–147. [Google Scholar] [CrossRef]
- Costa, J.M.; Ortuño, M.; Chaves, M.M. Deficit Irrigation as a Strategy to Save Water: Physiology and Potential Application to Horticulture. J. Integr. Plant Biol. 2010, 49, 1421–1434. [Google Scholar] [CrossRef]
- Capra, A.; Consoli, S.; Scicolone, B. Water management strategies under deficit irrigation. J. Agric. Eng. 2008, 39, 27. [Google Scholar] [CrossRef]
- Ruiz-Sanchez, M.C.; Domingo, R.; Castel, J.R. Review. Deficit irrigation in fruit trees and vines in Spain. Span J. Agric. Res. 2010, 8, S5–S20. [Google Scholar] [CrossRef] [Green Version]
- Fereres, E.; Soriano, M.A. Deficit irrigation for reducing agricultural water use. J. Exp. Bot. 2007, 58, 147–159. [Google Scholar] [CrossRef] [Green Version]
- Kuscu, H.; Turhan, A.; Demir, A.O. The response of processing tomato to deficit irrigation at various phenological stages in a sub-humid environment. Agric. Water Manag. 2014, 133, 92–103. [Google Scholar] [CrossRef]
- Liu, E.K.; Mei, X.R.; Yan, C.R.; Gong, D.Z.; Zhang, Y.Q. Effects of water stress on photosynthetic characteristics, dry matter translocation and WUE in two winter wheat genotypes. Agric. Water Manag. 2016, 167, 75–85. [Google Scholar] [CrossRef]
- Igbadun, H.E.; Ramalan, A.A.; Oiganji, E. Effects of regulated deficit irrigation and mulch on yield, water use and crop water productivity of onion in Samaru, Nigeria. Agric. Water Manag. 2012, 109, 162–169. [Google Scholar] [CrossRef]
- Conesa, M.R.; Garcia-Salinas, M.D.; de la Rosa, J.M.; Fernandez-Trujillo, J.P.; Domingo, R.; Perez-Pastor, A. Effects of deficit irrigation applied during fruit growth period of late mandarin trees on harvest quality, cold storage and subsequent shelf-life. Sci. Hortic. 2014, 165, 344–351. [Google Scholar] [CrossRef]
- Marsal, J.; Casadesus, J.; Lopez, G.; Mata, M.; Bellvert, J.; Girona, J. Sustainability of regulated deficit irrigation in a mid-maturing peach cultivar. Irrig. Sci. 2016, 34, 201–208. [Google Scholar] [CrossRef]
- Erdem, Y.; Yuksel, A.N. Yield response of watermelon to irrigation shortage. Sci. Hortic. 2003, 98, 365–383. [Google Scholar] [CrossRef]
- Ghosh, A.; Agrawal, M.; Agrawal, S.B. Effect of water deficit stress on an Indian wheat cultivar (Triticum aestivum L. HD 2967) under ambient and elevated level of ozone. Sci. Total Environ. 2020, 714, 16. [Google Scholar] [CrossRef] [PubMed]
- Jiang, P.; Cai, F.; Zhao, Z.Q.; Meng, Y.; Gao, L.Y.; Zhao, T.H. Physiological and Dry Matter Characteristics of Spring Maize in Northeast China under Drought Stress. Water 2018, 10, 1561. [Google Scholar] [CrossRef] [Green Version]
- Xu, M.; Wang, Y.; Wang, Q.; Guo, S.; Liu, Y.; Liu, J.; Tang, Z.; Wang, Z. Changes in Growth and Photosynthetic Parameters and Medicinal Compounds in Eleutherococcus senticosus Harms under Drought Stress. Hortscience 2019, 54, 2202–2208. [Google Scholar] [CrossRef] [Green Version]
- Chastain, D.R.; Snider, J.L.; Collins, G.D.; Perry, C.D.; Whitaker, J.; Byrd, S.A. Water deficit in field-grown Gossypium hirsutum primarily limits net photosynthesis by decreasing stomatal conductance, increasing photorespiration, and increasing the ratio of dark respiration to gross photosynthesis. J. Plant Physiol. 2014, 171, 1576–1585. [Google Scholar] [CrossRef]
- Tesfaye, S.G.; Ismail, M.R.; Ramlan, M.F.; Marziah, M.; Kausar, H. Effect of soil drying on rate of stress development, leaf gas exchange and proline accumulation in robusta coffee (Coffea canephora Pierre ex Froehner) clones. Exp. Agric. 2014, 50, 458–479. [Google Scholar] [CrossRef] [Green Version]
- Lawlor, D.W.; Cornic, G. Photosynthetic carbon assimilation and associated metabolism in relation to water deficits in higher plants. Plant Cell Environ. 2002, 25, 275–294. [Google Scholar] [CrossRef] [Green Version]
- Ma, S.C.; Duan, A.W.; Wang, R.; Guan, Z.M.; Yang, S.J.; Ma, S.T.; Shao, Y. Root-sourced signal and photosynthetic traits, dry matter accumulation and remobilization, and yield stability in winter wheat as affected by regulated deficit irrigation. Agric. Water Manag. 2015, 148, 123–129. [Google Scholar] [CrossRef]
- Miyashita, K.; Tanakamaru, S.; Maitani, T.; Kimura, K. Recovery responses of photosynthesis, transpiration, and stomatal conductance in kidney bean following drought stress. Environ. Exp. Bot. 2005, 53, 205–214. [Google Scholar] [CrossRef]
- Ali, S.; Xu, Y.; Jia, Q.; Ahmad, I.; Wei, T.; Ren, X.; Zhang, P.; Din, R.; Cai, T.; Jia, Z. Cultivation techniques combined with deficit irrigation improves winter wheat photosynthetic characteristics, dry matter translocation and water use efficiency under simulated rainfall conditions. Agric. Water Manag. 2018, 201, 207–218. [Google Scholar] [CrossRef]
- Ahmed, C.B.; Rouina, B.B.; Boukhris, M. Effects of water deficit on olive trees cv. Chemlali under field conditions in arid region in Tunisia. Sci. Hortic. 2007, 113, 267–277. [Google Scholar] [CrossRef]
- Cui, N.; Du, T.; Li, F.; Ling, T.; Kang, S.; Wang, M.; Liu, X.; Li, Z. Response of vegetative growth and fruit development to regulated deficit irrigation at different growth stages of pear-jujube tree. Agric. Water Manag. 2009, 96, 1237–1246. [Google Scholar] [CrossRef]
- Yan, S.C.; Wu, Y.; Fan, J.L.; Zhang, F.C.; Qiang, S.C.; Zheng, J.; Xiang, Y.Z.; Guo, J.J.; Zou, H.Y. Effects of water and fertilizer management on grain filling characteristics, grain weight and productivity of drip-fertigated winter wheat. Agric. Water Manag. 2019, 213, 983–995. [Google Scholar] [CrossRef]
- Anda, A.; Soos, G.; Menyhart, L.; Kucserka, T.; Simon, B. Yield features of two soybean varieties under different water supplies and field conditions. Field Crop. Res. 2020, 245, 107673. [Google Scholar] [CrossRef]
- Fabeiro, C.; de Santa Olalla, F.M.; Lopez, R.; Dominguez, A. Production and quality of the sugar beet (Beta vulgaris L.) cultivated under controlled deficit irrigation conditions in a semi-arid climate. Agric. Water Manag. 2003, 62, 215–227. [Google Scholar] [CrossRef]
- Zhang, H.P.; Turner, N.C.; Poole, M.L. Increasing the harvest index of wheat in the high rainfall zones of southern Australia. Field Crop. Res. 2012, 129, 111–123. [Google Scholar] [CrossRef]
- Abid, M.; Shao, Y.H.; Liu, S.X.; Wang, F.; Gao, J.W.; Jiang, D.; Tian, Z.W.; Dai, T.B. Pre-drought priming sustains grain development under post-anthesis drought stress by regulating the growth hormones in winter wheat (Triticum aestivum L.). Planta 2017, 246, 509–524. [Google Scholar] [CrossRef]
- Iqbal, M.; Ashraf, M. Gibberellic acid mediated induction of salt tolerance in wheat plants: Growth, ionic partitioning, photosynthesis, yield and hormonal homeostasis. Environ. Exp. Bot. 2013, 86, 76–85. [Google Scholar] [CrossRef]
- Mitchell, J.H.; Rebetzke, G.J.; Chapman, S.C.; Fukai, S. Evaluation of reduced-tillering (tin) wheat lines in managed, terminal water deficit environments. J. Exp. Bot. 2013, 64, 3439–3451. [Google Scholar] [CrossRef] [PubMed] [Green Version]
- Rashid, M.A.; Andersen, M.N.; Wollenweber, B.; Zhang, X.; Olesen, J.E. Acclimation to higher VPD and temperature minimized negative effects on assimilation and grain yield of wheat. Agric. For. Meteorol. 2018, 248, 119–129. [Google Scholar] [CrossRef]
- Faloye, O.T.; Alatise, M.O.; Ajayi, A.E.; Ewulo, B.S. Effects of biochar and inorganic fertiliser applications on growth, yield and water use efficiency of maize under deficit irrigation. Agric. Water Manag. 2019, 217, 165–178. [Google Scholar] [CrossRef]
- Marsal, J.; Lopez, G.; del Campo, J.; Mata, M.; Arbones, A.; Girona, J. Postharvest regulated deficit irrigation in ‘Summit’ sweet cherry: Fruit yield and quality in the following season. Irrig. Sci. 2010, 28, 181–189. [Google Scholar] [CrossRef]
- Yang, J.; Zhang, J.; Huang, Z.; Zhu, Q.; Wang, L. Remobilization of Carbon Reserves Is Improved by Controlled Soil-Drying during Grain Filling of Wheat. Crop Sci. 2000, 40, 1645–1655. [Google Scholar] [CrossRef]
- Chen, J.L.; Kang, S.Z.; Du, T.S.; Qiu, R.J.; Guo, P.; Chen, R.Q. Quantitative response of greenhouse tomato yield and quality to water deficit at different growth stages. Agric. Water Manag. 2013, 129, 152–162. [Google Scholar] [CrossRef]
- Wang, F.; Xie, R.; Ming, B.; Wang, K.; Hou, P.; Chen, J.; Liu, G.; Zhang, G.; Xue, J.; Li, S. Dry matter accumulation after silking and kernel weight are the key factors for increasing maize yield and water use efficiency. Agric. Water Manag. 2021, 254, 106938. [Google Scholar] [CrossRef]
- Sun, H.Y.; Liu, C.M.; Zhang, X.Y.; Shen, Y.J.; Zhang, Y.Q. Effects of irrigation on water balance, yield and WUE of winter wheat in the North China Plain. Agric. Water Manag. 2006, 85, 211–218. [Google Scholar] [CrossRef]
- Belay, S.A.; Schmitter, P.; Worqlul, A.W.; Steenhuis, T.S.; Reyes, M.R.; Tilahun, S.A. Conservation Agriculture Saves Irrigation Water in the Dry Monsoon Phase in the Ethiopian Highlands. Water 2019, 11, 2103. [Google Scholar] [CrossRef] [Green Version]
- Patane, C.; Tringali, S.; Sortino, O. Effects of deficit irrigation on biomass, yield, water productivity and fruit quality of processing tomato under semi-arid Mediterranean climate conditions. Sci. Hortic. 2011, 129, 590–596. [Google Scholar] [CrossRef]
- Bloch, D.; Hoffmann, C.M. Impact of water supply on photosynthesis, water use and carbon isotope discrimination of sugar beet genotypes. Eur. J. Agron. 2006, 24, 218–225. [Google Scholar] [CrossRef]
Figure 1.
Picture of the woad (Isatis indigotica) plant variety used in the experiment.

Figure 2.
Location of the study area in China and picture of the woad experimental site.

Figure 3.
Net photosynthetic rate of woad (Isatis indigotica) under different water deficit treatments averaged across three years. Different lowercase letters within a column indicate a significant difference among treatments at p < 0.05.
Figure 3.
Net photosynthetic rate of woad (Isatis indigotica) under different water deficit treatments averaged across three years. Different lowercase letters within a column indicate a significant difference among treatments at p < 0.05.
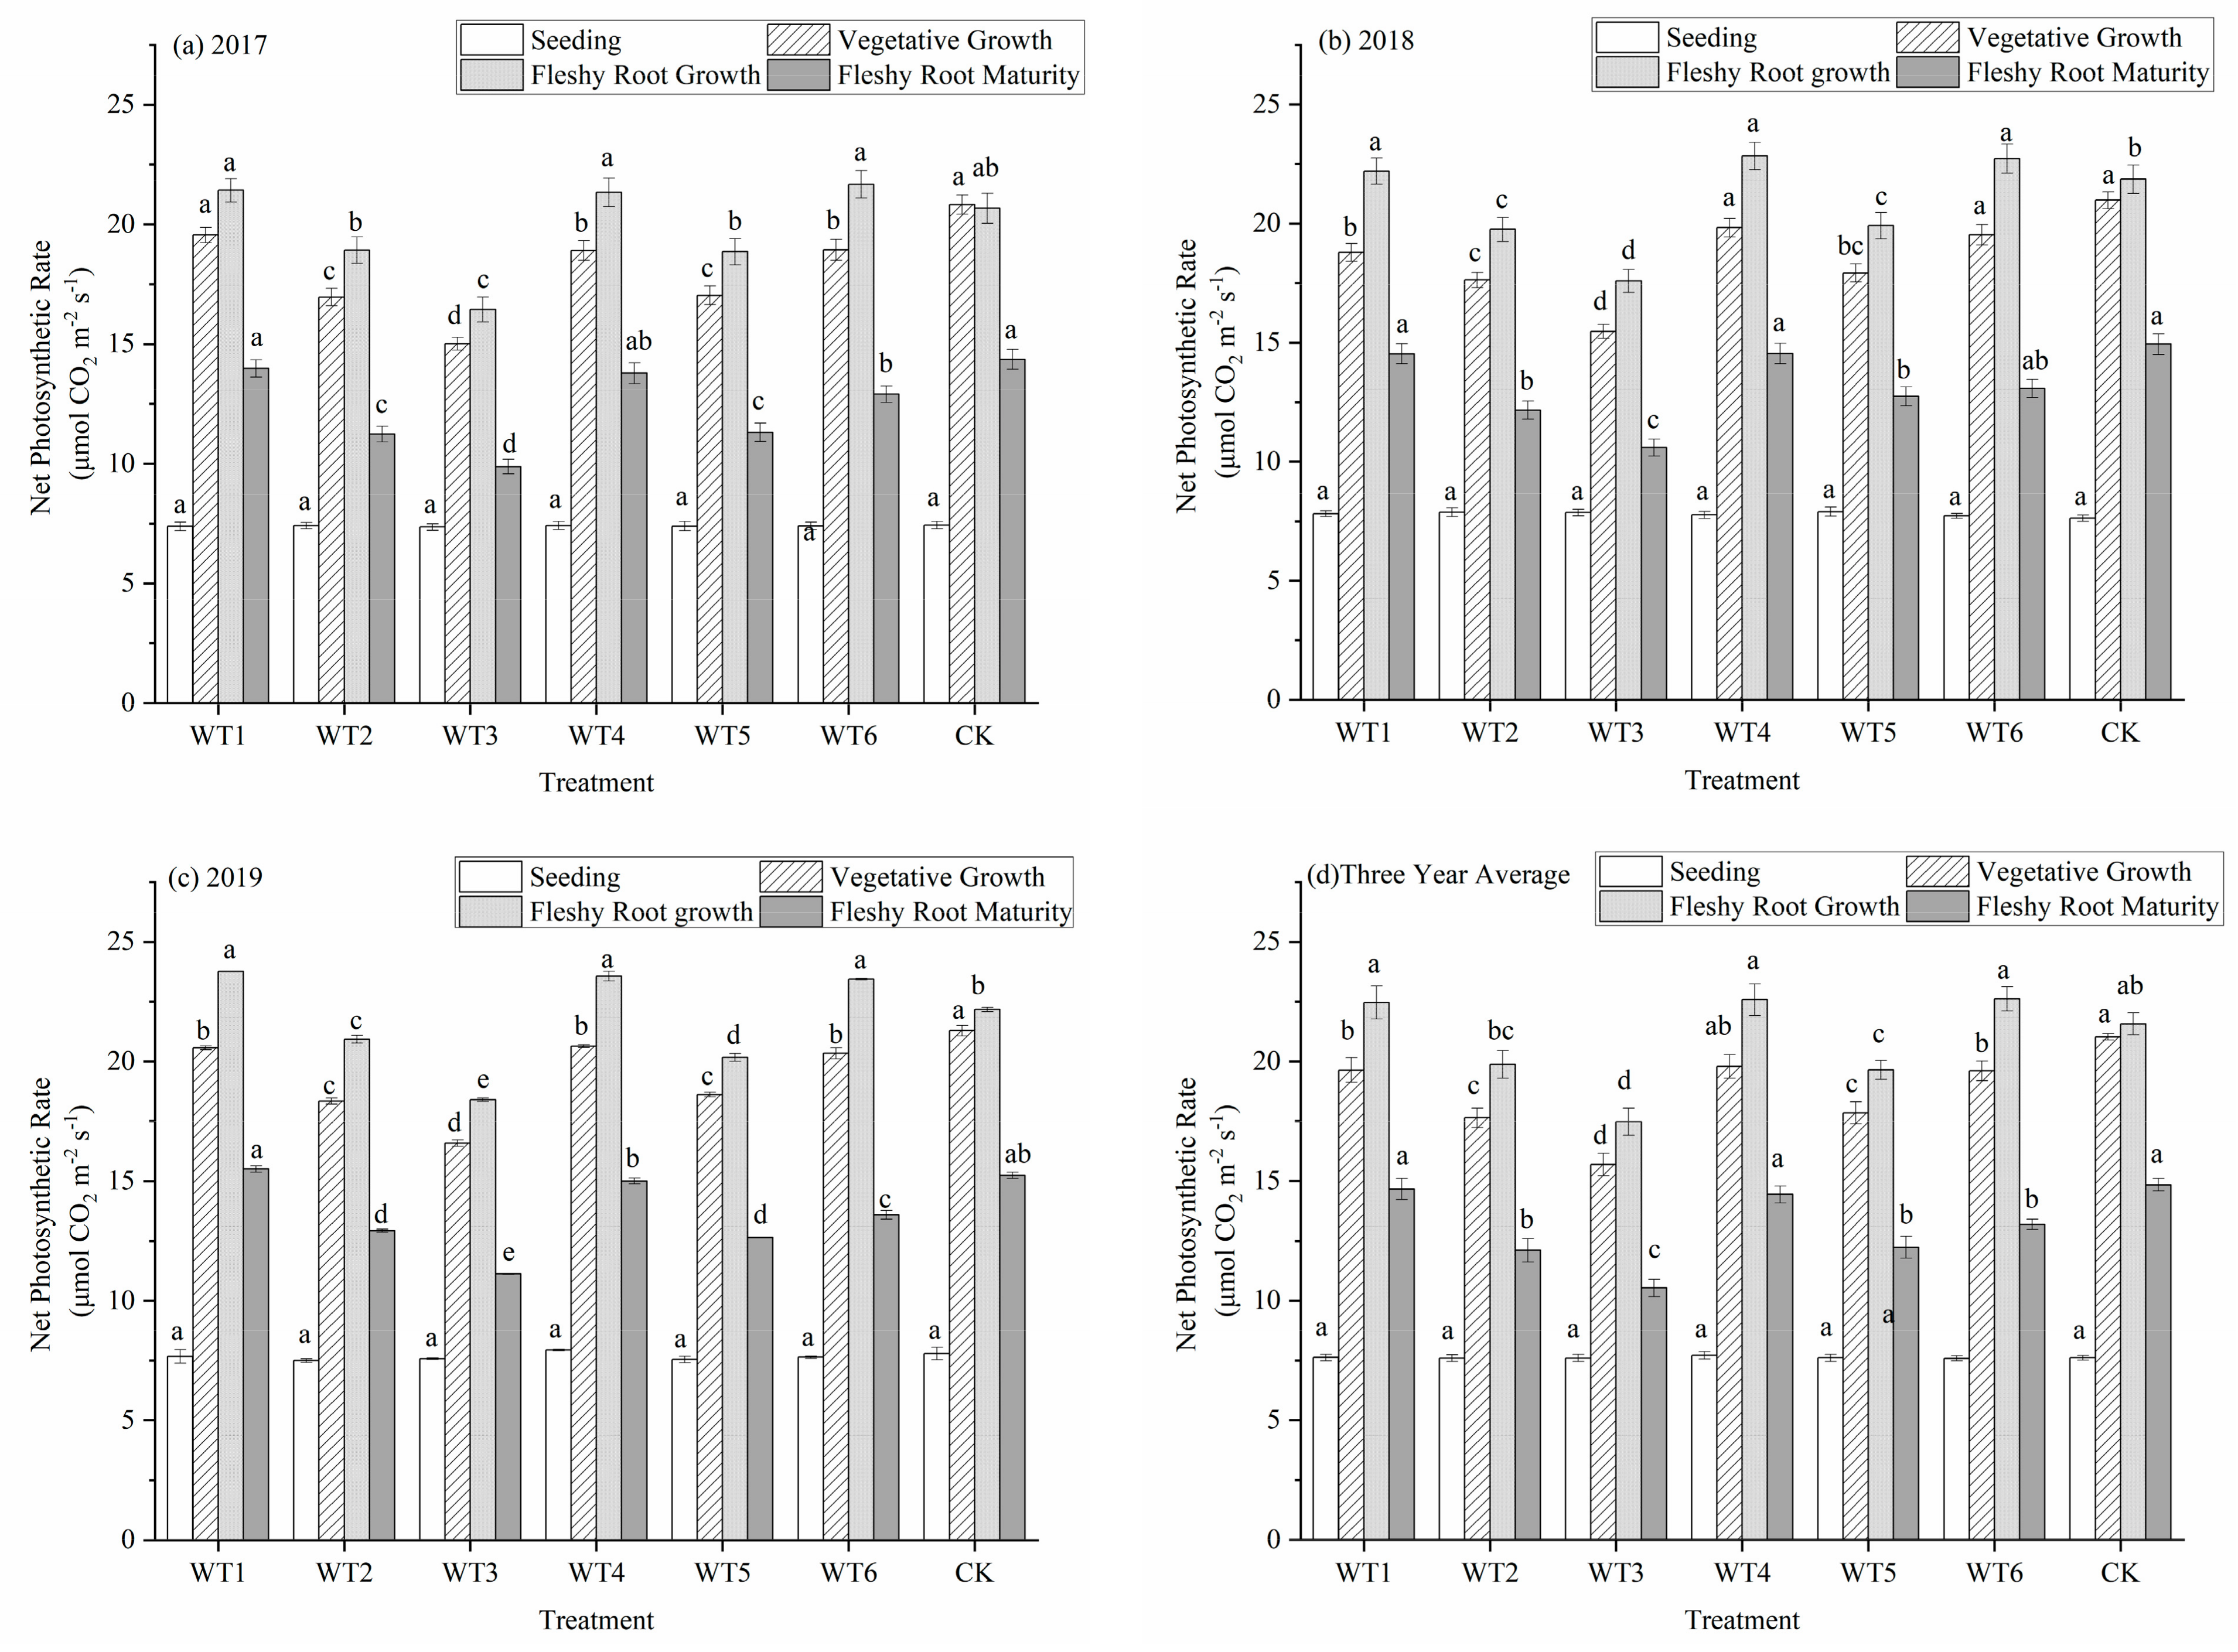
Figure 4.
Transpiration rate of woad (Isatis indigotica) under different water deficit treatments. Different lowercase letters within a column indicate a significant difference among treatments at p < 0.05.
Figure 4.
Transpiration rate of woad (Isatis indigotica) under different water deficit treatments. Different lowercase letters within a column indicate a significant difference among treatments at p < 0.05.

Figure 5.
Stomatal conductance of woad (Isatis indigotica) under different water deficit treatments. Different lowercase letters within a column indicate a significant difference among treatments at p < 0.05.
Figure 5.
Stomatal conductance of woad (Isatis indigotica) under different water deficit treatments. Different lowercase letters within a column indicate a significant difference among treatments at p < 0.05.

Figure 6.
Water use efficiency of leaves of woad (Isatis indigotica) under different water deficit treatments. Different lowercase letters within a column indicate a significant difference among treatments at p < 0.05.
Figure 6.
Water use efficiency of leaves of woad (Isatis indigotica) under different water deficit treatments. Different lowercase letters within a column indicate a significant difference among treatments at p < 0.05.


Table 1.
Irrigation treatment of water deficit at different levels and at different growth stages of woad (Isatis indigotica).
Table 1.
Irrigation treatment of water deficit at different levels and at different growth stages of woad (Isatis indigotica).
| Treatments | Water Deficit Timing | Water Deficit Severity | Seeding | Vegetative Growth | Fleshy Root Growth | Flesh Root Maturity |
|---|---|---|---|---|---|---|
| WT1 | Vegetative growth (VG) | Mild | 75–85% a | 65–75% | 75–85% | 75–85% |
| WT2 | VG | Moderate | 75–85% | 55–65% | 75–85% | 75–85% |
| WT3 | VG | Severe | 75–85% | 45–55% | 75–85% | 75–85% |
| WT4 | VG + Fleshy root growth | Mild | 75–85% | 65–75% | 65–75% | 75–85% |
| WT5 | VG + Fleshy root growth | Moderate | 75–85% | 55–65% | 55–65% | 75–85% |
| WT6 | VG + Fleshy root maturity | Mild | 75–85% | 65–75% | 75–85% | 65–75% |
| CK | N/A | None | 75–85% | 75–85% | 75–85% | 75–85% |
Note: a Percent field capacity (FC).
Table 2.
Effect of different deficit irrigation treatments on the yield components of woad (Isatis indigotica).
Table 2.
Effect of different deficit irrigation treatments on the yield components of woad (Isatis indigotica).
| Year | Treatments | Lateral Root Number | Taproot Length (cm) | Taproot Diameter (cm) | Root Biomass (g) | Total Biomass (kg·ha−2) | Yield (kg·ha−2) | Harvest Index |
|---|---|---|---|---|---|---|---|---|
| 2017 | WT1 | 10.70a | 23.24a | 1.64a | 13.55a | 12,476.23a | 8390.80a | 0.6725ab |
| WT2 | 9.30ab | 22.20ab | 1.55bc | 12.02bc | 11,015.42d | 7462.24b | 0.6774a | |
| WT3 | 7.30b | 18.67c | 1.40d | 10.59d | 10,186.77e | 6800.36c | 0.6676b | |
| WT4 | 10.30ab | 23.25a | 1.66a | 11.08cd | 12,084.28b | 8235.32a | 0.6815a | |
| WT5 | 9.30ab | 19.93b | 1.44c | 11.01cd | 10,111.34e | 6819.79c | 0.6745a | |
| WT6 | 9.33ab | 22.71a | 1.59b | 11.88c | 11,542.37c | 7713.45b | 0.6683b | |
| CK | 10.70a | 23.21a | 1.63a | 12.66ab | 12,489.96a | 8322.25a | 0.6663b | |
| 2018 | WT1 | 10.67a | 24.33a | 1.66a | 13.47a | 12,577.33a | 8475.38a | 0.6739ab |
| WT2 | 9.36b | 23.26b | 1.47bc | 11.94b | 11,116.52bc | 7638.14b | 0.6871a | |
| WT3 | 8.03c | 19.77d | 1.42c | 10.49d | 10,487.87d | 6986.12c | 0.6661b | |
| WT4 | 10.63a | 24.38a | 1.71a | 11.07c | 12,185.38ab | 8308.44a | 0.6818a | |
| WT5 | 9.67b | 20.78c | 1.46bc | 10.94cd | 10,212.44d | 6923.72c | 0.6780ab | |
| WT6 | 8.67bc | 23.86ab | 1.53b | 11.27bc | 11,524.31b | 7846.42b | 0.6809a | |
| CK | 11.00a | 23.20b | 1.65a | 12.58ab | 12,591.06a | 8348.91a | 0.6631b | |
| 2019 | WT1 | 11.33a | 31.28ab | 1.92bc | 14.77a | 12,637.75a | 8554.18a | 0.6769bc |
| WT2 | 9.00b | 30.07c | 1.72d | 13.26b | 11,174.88b | 7623.76c | 0.6822b | |
| WT3 | 7.67c | 26.86d | 1.69d | 11.31d | 10,350.15c | 6959.82d | 0.6724c | |
| WT4 | 11.00a | 31.41ab | 1.97a | 15.08a | 12,247.66a | 8398.70a | 0.6857b | |
| WT5 | 8.67bc | 28.08d | 1.71d | 11.69cd | 10,272.86c | 6979.25d | 0.6794bc | |
| WT6 | 9.33b | 30.45bc | 1.88c | 13.07bc | 11,424.15b | 7934.63b | 0.6945a | |
| CK | 11.67a | 31.37ab | 1.91bc | 13.29b | 12,649.42a | 8521.77a | 0.6737c | |
| Average | WT1 | 10.90a | 26.28a | 1.74a | 13.93a | 12,563.77a | 8473.45a | 0.6744ab |
| WT2 | 9.22b | 25.18b | 1.58c | 12.41ab | 11,102.27c | 7574.71c | 0.6823a | |
| WT3 | 7.67c | 21.77d | 1.50d | 10.80d | 10,341.60d | 6915.43d | 0.6687b | |
| WT4 | 10.64a | 26.35a | 1.78a | 12.41ab | 12,172.44a | 8314.15a | 0.6830a | |
| WT5 | 9.21bc | 22.93c | 1.54cd | 11.21c | 10,198.88d | 6907.59d | 0.6773ab | |
| WT6 | 9.11b | 25.67ab | 1.67b | 12.07b | 11,496.94b | 7831.50b | 0.6812a | |
| CK | 11.12a | 25.93a | 1.73a | 12.84ab | 12,576.81a | 8397.64a | 0.6677b |
Note: Different lowercase letters within a column indicate a significant difference among treatments at p < 0.05.
Table 3.
Water use efficiency of leaves of woad (Isatis indigotica) under different regulated deficit irrigation treatments.
Table 3.
Water use efficiency of leaves of woad (Isatis indigotica) under different regulated deficit irrigation treatments.
| Year | Treatments | Water Consumption (mm) | Irrigation Amount (mm) | WUE (kg·ha−2·mm−1) | IWUE (kg·ha−2·mm−1) |
|---|---|---|---|---|---|
| 2017 | WT1 | 355.25c | 153.76b | 23.62a | 54.57a |
| WT2 | 366.06b | 149.57b | 20.39c | 49.89c | |
| WT3 | 343.62d | 132.12c | 19.79b | 51.47d | |
| WT4 | 353.93c | 152.42b | 23.27a | 54.03a | |
| WT5 | 347.35d | 135.85c | 19.63bc | 50.20d | |
| WT6 | 367.23b | 152.61b | 21.00b | 50.54bc | |
| CK | 381.75a | 165.26a | 21.80bc | 50.36b | |
| 2018 | WT1 | 363.32bc | 153.02b | 23.33a | 53.39a |
| WT2 | 371.17b | 150.87b | 20.58c | 50.63c | |
| WT3 | 348.46bcd | 133.16c | 20.05d | 52.46b | |
| WT4 | 362.12bc | 151.81b | 22.94a | 54.73a | |
| WT5 | 355.95c | 137.64c | 19.45d | 50.30c | |
| WT6 | 362.94bc | 149.35b | 21.62b | 52.34b | |
| CK | 386.55a | 166.26a | 21.60b | 50.22c | |
| 2019 | WT1 | 367.09bc | 170.49ab | 23.20a | 50.17a |
| WT2 | 373.30b | 163.00bc | 20.40bc | 46.77b | |
| WT3 | 351.41d | 145.41c | 19.81bc | 47.86b | |
| WT4 | 359.89cd | 163.69ab | 23.34a | 51.31a | |
| WT5 | 361.75cd | 156.15bc | 19.29c | 44.70c | |
| WT6 | 367.92bc | 171.52ab | 21.57b | 46.26bc | |
| CK | 393.85a | 178.35a | 21.63b | 47.78ab | |
| Average | WT1 | 361.89bcd | 159.09ab | 23.38a | 53.38a |
| WT2 | 370.18b | 154.48ab | 20.46c | 49.10ab | |
| WT3 | 347.83e | 136.90c | 19.88d | 50.60ab | |
| WT4 | 358.65cd | 155.97ab | 23.18a | 53.36a | |
| WT5 | 355.02de | 143.21bc | 19.46d | 48.40b | |
| WT6 | 366.03bc | 157.83ab | 21.40b | 49.71ab | |
| CK | 387.38a | 169.96a | 21.68b | 49.45ab |
Note: Different lowercase letters within a column indicate a significant difference among treatments at p < 0.05.
Table 4.
Correlation analysis of the characteristics of woad (Isatis indigotica).
| Correlation Coefficient | Pn | Tr | Gs | Taproot Length | Taproot Diameter | Lateral Root Number | Root Biomass | Irrigation Amount | Water Consumption | Total Biomass | Yield |
|---|---|---|---|---|---|---|---|---|---|---|---|
| Pn | 1 | ||||||||||
| Tr | 0.953 ** | 1 | . | ||||||||
| Gs | 0.986 ** | 0.925 ** | 1 | ||||||||
| Taproot length | 0.888 ** | 0.862 * | 0.938 ** | 1 | |||||||
| Taproot diameter | 0.955 ** | 0.929 ** | 0.946 ** | 0.915 ** | 1 | ||||||
| Lateral root number | 0.970 ** | 0.942 ** | 0.945 ** | 0.835 * | 0.890 ** | 1 | |||||
| Root biomass | 0.831 * | 0.907 ** | 0.859 * | 0.863 * | 0.792 * | 0.839 * | 1 | ||||
| Irrigation amount | 0.871 * | 0.861 * | 0.885 ** | 0.888 ** | 0.814 * | 0.840 * | 0.795 * | 1 | |||
| Water consumption | 0.600 | 0.599 | 0.606 | 0.621 | 0.483 | 0.621 | 0.543 | 0.891 ** | 1 | ||
| Total biomass | 0.929 ** | 0.984 ** | 0.912 ** | 0.897 ** | 0.944 ** | 0.892 ** | 0.890 ** | 0.888 ** | 0.625 | 1 | |
| Yield | 0.934 ** | 0.973 ** | 0.931 ** | 0.935 ** | 0.962 ** | 0.891 ** | 0.895 ** | 0.886 ** | 0.603 | 0.994 ** | 1 |
Note: * Significant difference (p < 0.05); ** indicates a very significant difference (p < 0.01).
Publisher’s Note: MDPI stays neutral with regard to jurisdictional claims in published maps and institutional affiliations. |
© 2021 by the authors. Licensee MDPI, Basel, Switzerland. This article is an open access article distributed under the terms and conditions of the Creative Commons Attribution (CC BY) license (https://creativecommons.org/licenses/by/4.0/).
Share and Cite
MDPI and ACS Style
Zhou, C.; Zhang, H.; Li, F.; Wang, Z.; Wang, Y. Photosynthetic Characteristics and Yield Response of Isatis indigotica to Regulated Deficit Irrigation in a Cold and Arid Environment. Water 2021, 13, 3510. https://doi.org/10.3390/w13243510
AMA Style
Zhou C, Zhang H, Li F, Wang Z, Wang Y. Photosynthetic Characteristics and Yield Response of Isatis indigotica to Regulated Deficit Irrigation in a Cold and Arid Environment. Water. 2021; 13(24):3510. https://doi.org/10.3390/w13243510
Chicago/Turabian StyleZhou, Chenli, Hengjia Zhang, Fuqiang Li, Zeyi Wang, and Yucai Wang. 2021. "Photosynthetic Characteristics and Yield Response of Isatis indigotica to Regulated Deficit Irrigation in a Cold and Arid Environment" Water 13, no. 24: 3510. https://doi.org/10.3390/w13243510
Note that from the first issue of 2016, this journal uses article numbers instead of page numbers. See further details here.