
Optimal Design of Combined Sewer Overflows Interception Facilities Based on the NSGA-III Algorithm


School of Civil Engineering and Architecture, Wuhan University of Technology, Wuhan 430070, China
*
Author to whom correspondence should be addressed.
Water 2021, 13(23), 3440; https://doi.org/10.3390/w13233440
Submission received: 23 October 2021
/
Revised: 22 November 2021
/
Accepted: 1 December 2021
/
Published: 4 December 2021
(This article belongs to the Special Issue Urban Runoff Control and Sponge City Construction)
Abstract
:The interception facility is an important and frequently used measure for combined sewer overflow (CSO) control in city-scale drainage systems. The location and capacity of these facilities affects the pollution control efficiency and construction cost. Optimal design of these facilities is always an active research area in environmental engineering, and among candidate optimization methods, the simulation-optimization method is the most attractive method. However, time-consuming simulations of complex drainage system models (e.g., SWMM) make the simulation-optimization approach impractical. This paper proposes a new simulation-optimization method with new features of multithreading individual evaluation and fast data exchange by recoding SWMM with object-oriented programming. These new features extremely accelerate the optimization process. The non-dominated sorting genetic algorithm-III (NSGA-III) is selected as the optimization framework for better performance in dealing with multi-objective optimization. The proposed method is used in the optimal design of a terminal CSO interception facility in Wuhan, China. Compared with empirically designed schemes, the optimized schemes can achieve better pollution control efficiency with less construction cost. Additionally, the time consumption of the optimization process is compressed from days to hours, making the proposed method practical.
1. Introduction
Nowadays, many urban areas are still drained by combined sewer systems that collect and transport both municipal wastewater and stormwater/snowmelt runoff with the same pipe network [1]. With rapid economic development and massive population growth, urbanization has become a global trend [2]. Dense urbanization changes the land use of cities and increases surface runoff volume [3,4,5]. Global climate change has also amplified rainfall intensity in some parts of the world [6,7], which generates huge pressure on the urban drainage system. Therefore, the volume of wastewater can sometimes exceed the capacity of the pipe networks, which lead to combined sewer overflows (CSOs) [1,8].
CSO can be controlled in four ways: operation and maintenance practices; collection system controls, including conventional approaches and green infrastructure; storage facilities; and treatment technologies [9]. However, source control measures are difficult to implement in many older urban areas. Therefore, storage tanks are considered as a cost-effective and straightforward solution to reduce peak runoff and CSOs [10]. Many scholars have attempted to limit the frequency, volume, and/or pollutant load of CSOs by optimizing the design of storage tanks. Lu et al. [11] proposed a two-level optimization (TO) scheme to support the optimal design of storage ponds in urban drainage systems. A new method was proposed to identify optimal rainwater storage locations with the goal of reducing urban inundation damage costs [12]. Wang et al. [13] established a two-stage framework for solving the optimal arrangement of storage tanks using hierarchical analysis and the generalized pattern search method. However, the design of the CSO interception facility is still based on the calculation of empirical formulas, which is not targeted and accurate in specific projects and deviates greatly from the results of actual runoff process. In order to increase the quality of the design scheme and operation efficiency, hydro-hydraulic models and optimization algorithms are introduced in the process of optimal design. Optimization algorithms are used as a framework for generating and selecting better design schemes and hydro-hydraulic models are used to evaluate the quality of each design scheme.
With the increasing complexity of engineering problems and the increase of limiting factors, the traditional optimization algorithms cannot fully meet the needs of engineering practice, so scholars put forward an intelligent optimization method imitating biological evolution theory. Additionally, these algorithms, such as Particle Swarm Optimization (PSO), Genetic Algorithm (GA), Simulation Anneal (SA), Differential Evolution Algorithm (DE), and Ant Colony Optimization Algorithm (ACO), have been tested and proved suitable for solving multi-objective, multi-constraint, nonlinear, and discrete problems [14,15,16,17,18]. Cunha et al. [19] established a rainfall-runoff model to simulate water volume, and obtained the objective function of the volume and location of the storage tank related to peak flow, and obtained the optimal solution of the volume and location of the storage tank based on the SA algorithm. Ryu et al. [20,21] studied the location of the storage tanks based on the storm water management model (SWMM) and PSO algorithm and used the simplified mathematical model, which has a certain guiding significance for engineering design. Tao et al. [22] used the non-dominated sorting genetic algorithm (NSGA-II) to seek the optimal equilibrium for decentralized detention, considering flood control, peak reduction, and investment costs. Oxley and Mays [23] optimized the size and location of a detention pond system based on a simulated annealing approach, including outlet structures in a single detention pond system and multiple detention pond systems.
The aforementioned study cases focused on optimal design scheduling specifically regarding part of CSO interception facilities, for example, only focusing on the storage tank. However, CSO interception facilities are mostly composed of both of a storage tank and pump station, and these two parts play a role together and interact with each other. Partially, optimization cannot consider interactions between storage tanks and pump stations so global optimal solutions cannot be obtained. Therefore, a complete optimization method that considers both the storage tank and pump station as optimal objectives in one optimization process should be used.
When solving the process of optimization models, the hydro-hydraulic model is an important tool for scheme evaluation. Currently, SWMM is the most widely used hydro-hydraulic model in simulation-optimization methods due to its unique features of being open-source and extensible. However, SWMM has no interface functions for parameters setting or result reading, so data exchange between the optimization algorithm and SWMM models has to be implemented by file operations. In addition, SWMM is developed with procedural-oriented programming, so the data structure is organized as global variables. This feature means SWMM cannot be called in a multithreading way during the optimization process. These problems seriously impact the solving efficiency of the optimization method and make the simulation-optimization approach impractical.
Aimed at the outstanding problems of solving efficiency and partial optimization, this study proposes a new optimization model, which considers both the storage tank and pump station as optimal objectives. In order to improve the solving efficiency, SWMM is recoded with object-oriented programming, so that the model data structure is encapsulated in classes and the recoded SWMM model can be called in a multithreading way and fast data exchange without file operations can be achieved.
2. Optimization Model
2.1. Decision Variables
A typical CSO interception facility is formed with an opened or underground storage tank used as the detention volume. Because water stored in the storage tank mostly cannot be drained by gravity, a pump station is needed for emptying the tank so that the facility can be prepared for the next rain event as soon as possible. Therefore, the design parameters of the tank and pump station should both be considered as decision variables and be solved in the optimization process. In the present work, the following parameters are regarded as decision variables:
- (1)
- Tank’s cross-sectional area. Most tanks are designed as a columnar shape that has the same cross-section shape and area from top to bottom, and very few tanks will use the sectional area that varied with height. Thus, in this study, only a columnar shape tank is considered and the tank’s cross-sectional area is selected as the decision variable.
- (2)
- Tank’s effective depth. The total depth of the tank is formed with a sedimentary depth, effective depth, and safe super elevation. The sedimentary depth and safe super elevation can generally be determined by codes and standards, and these two parts only represent a small fraction of the total depth. Thus, only the effective depth is considered as a decision variable in this study.
- (3)
- Pump station’s capacity. Generally, the pump station will be formed with several pumps and operated with a scheduling scheme, which describes how pumps start-up or shut off according to pre-specified water depths. In the present work, a simplified scheduling scheme is used, in which all pumps in the pump station are regarded as one pump and start up or shut off together according to pre-specified water depths. Thus, the pump station’s capacity is represented by one decision variable.
- (4)
- The pump station start-up water depths. The pump start-up depth, and shutoff depth needed to be determined to control pump operation. However, the pump shutoff depth is generally set to the same as the minimum design water depth of the storage tank. Therefore, for the start-up/shutoff operation control of pumps, only the pump start-up depth needs to be set. This decision variable is represented with the ratio of the water depths to the tank’s effective depth.
2.2. Model Formulation
In past studies, the purpose of optimization is to obtain the best cost-benefit solutions through evaluation and comparison of different combinations of decision variables. Thus, the economic objective and ecological objective are the most used objectives. These two objectives are also adopted in the present work. In addition, a new objective of the minimum number of pump start-ups is introduced in the proposed optimization model. Because the storage tank and pump stations are both considered in this optimization process, the interactions between these two parts should take into account and find a feasible combination to achieve a better solution not only with less cost and high interception efficiency but also with a simple and reliable operation scheme. The number of pump station start-ups is used as an indicator to measure the quality of the operation scheme of the considered CSO interception facility. Another reason for adding this objective is that SWMM simulations sometimes will give irrational results caused by computational instability. The new objective can effectively recognize and eliminate individuals that lead to unstable simulations.
2.2.1. Objective Functions
The formulations of the objective functions are as follows:
Economic objective f1(x). The economic objective minimizes the construction cost of the storage tank and pump station, and can be expressed as the following formula below:
where CPi is the construction cost of the i-th pump station, Yuan; CSi is the construction cost of the i-th storage tank, Yuan; α is the cost of unit drainage capacity of the i-th pump station, Yuan/m3/s; QPi is the drainage capacity of the i-th pump station, m3/s; β is the unit volume cost of the i-th storage tank, Yuan/m3; SSi is the bottom area of the i-th storage tank, m2; and hSi is the depth of the i-th storage tank, m.
Ecological objective f2(x). In order to reduce the impact of sewage overflow to the receiving water body, the minimum sewage overflow rate is used as the ecological objective, namely:
where VO is the overflow volume of in the study area, m3; and VT is the total volume of the combined sewage conveyed to the CSO facility, m3.
Operational objective f3(x). The operational objective is to minimize the number of pump startup/shutoff times in pump stations, namely:
where is the total number of pump startup/shutoff times.
2.2.2. Constraint Conditions
In the solving process of the optimization model, the calculation of objectives is constrained by several constraints. These constraints can be divided into two categories: general constraints and specific constraints.
General constraints are equations that play roles in the processes of runoff generation and flow conveyance. This kind of constraint follows the same hydro-hydraulic equations for all combined sewer systems and the calculation of the objective values must comply with these general constraints. General constraints in combined sewer systems include the wave surface motion equation to describe the process of runoff generation and St. Venant’s equations to describe flow conveyance in a pipe network.
The runoff generation and confluence of the sub-catchment area is controlled by the following wave surface motion equation:
where d is the depth of the depression below the surface, m; i is the rate of rainfall and snow melt, mm/s; e is the surface evaporation rate, mm/s; f is the permeability, mm/s; and q is the runoff rate, mm/s.
The movement of the unsteady free surface flow through a channel or pipe is governed by the conservation of mass and momentum equations called St. Venant’s equations and can be expressed as:
where t is time, s; x is the distance from a fixed section of the pipeline along the process, m; A is the cross-sectional area of the fixed section, m2; Q is the flow rate, m3; g is the acceleration of gravity, m/s2; H is the water head in the pipeline (Z + Y), m; Z is the bottom elevation of the pipeline, m; Y is the pipeline water depth, m; and Sf is the friction slope (head loss per unit length).
In the present work, general constraints are solved by the object-oriented SWMM.
Specific constraints are constraints related to specific optimized facilities and used to limit the value range of decision variables. In this study, the storage tank’s sectional area and effective depth and flow capacity of the pump station are constrained by specific constraints and limited in certain ranges.
3. The Solution Method of the Optimization Model
A methodology that combined the use of the object-oriented SWMM and the genetic optimization algorithm NSGA-III [24] is developed and applied in the present work.
3.1. Multithreading Evaluation of Design Schemes
In order to implement multithreading evaluation of design schemes in the evolve process, the SWMM data structure and functions are encapsulated with the object-oriented concept and recoded by C++. A simple diagram about the class definition and relationship is shown in Figure 1.
The current data structures in SWMM, such as the sub-catchment, link, node, etc., are encapsulated in the corresponding classes, and embedded into the project class as property members. The object generated from the project class represents an SWMM model, and data accessing, parameter value setting, simulation, and result obtaining can be achieved by calling the function members or visiting variables directly. In the solving process of the optimization model, an SWMM model pool can be generated by declaring an array of project classes, and each element in the array represents an SWMM model of one individual. SWMM models in the model pool can be simulated in parallel.
3.2. Fast Data Exchange
With object-oriented SWMM, the data structure is organized by classes, and parameters and results are declared as public members of the project class. Thus, the data structure of the object-oriented SWMM is transparent to the optimization framework and parameters and results can be obtained at any time in the optimization process. As a result, file operations during the solving process are substantially eliminated and the data exchange efficiency is greatly improved.
Class encapsulation of SWMM and fast data exchange have no effects on the simulation algorithm of SWMM, so the simulation results with these two acceleration measures are totally identical to the results obtained by the original SWMM.
3.3. Simplification of the SWMM Model
The CSO interception facilities are mostly located in the downstream part of sewer systems and their performances are affected by the runoff and flow from the upstream part of the sewer system. In contrast, the performance of these facilities hardly affects the runoff generation and flow conveyance of the upstream part of sewer systems, so that the hydro-hydraulic simulation results of the upstream part of the sewer system can be simulated and saved before solving the optimization model. Additionally, the saved simulation results can be assigned as inflows to nodes located upstream of the CSO interception and storage facilities. With this method, the complexity of the SWMM model is simplified significantly and a lot of simulation time is saved. However, this kind of simplification causes differences between the simulation results of the simplified and original models. According to comparisons between the simulation results, the differences are very little and have almost no effect on the optimization process. However, for the sake of strictness, the practical efficacy of CSO interception facilities should be simulated and evaluated with original models with the optimal schemes obtained.
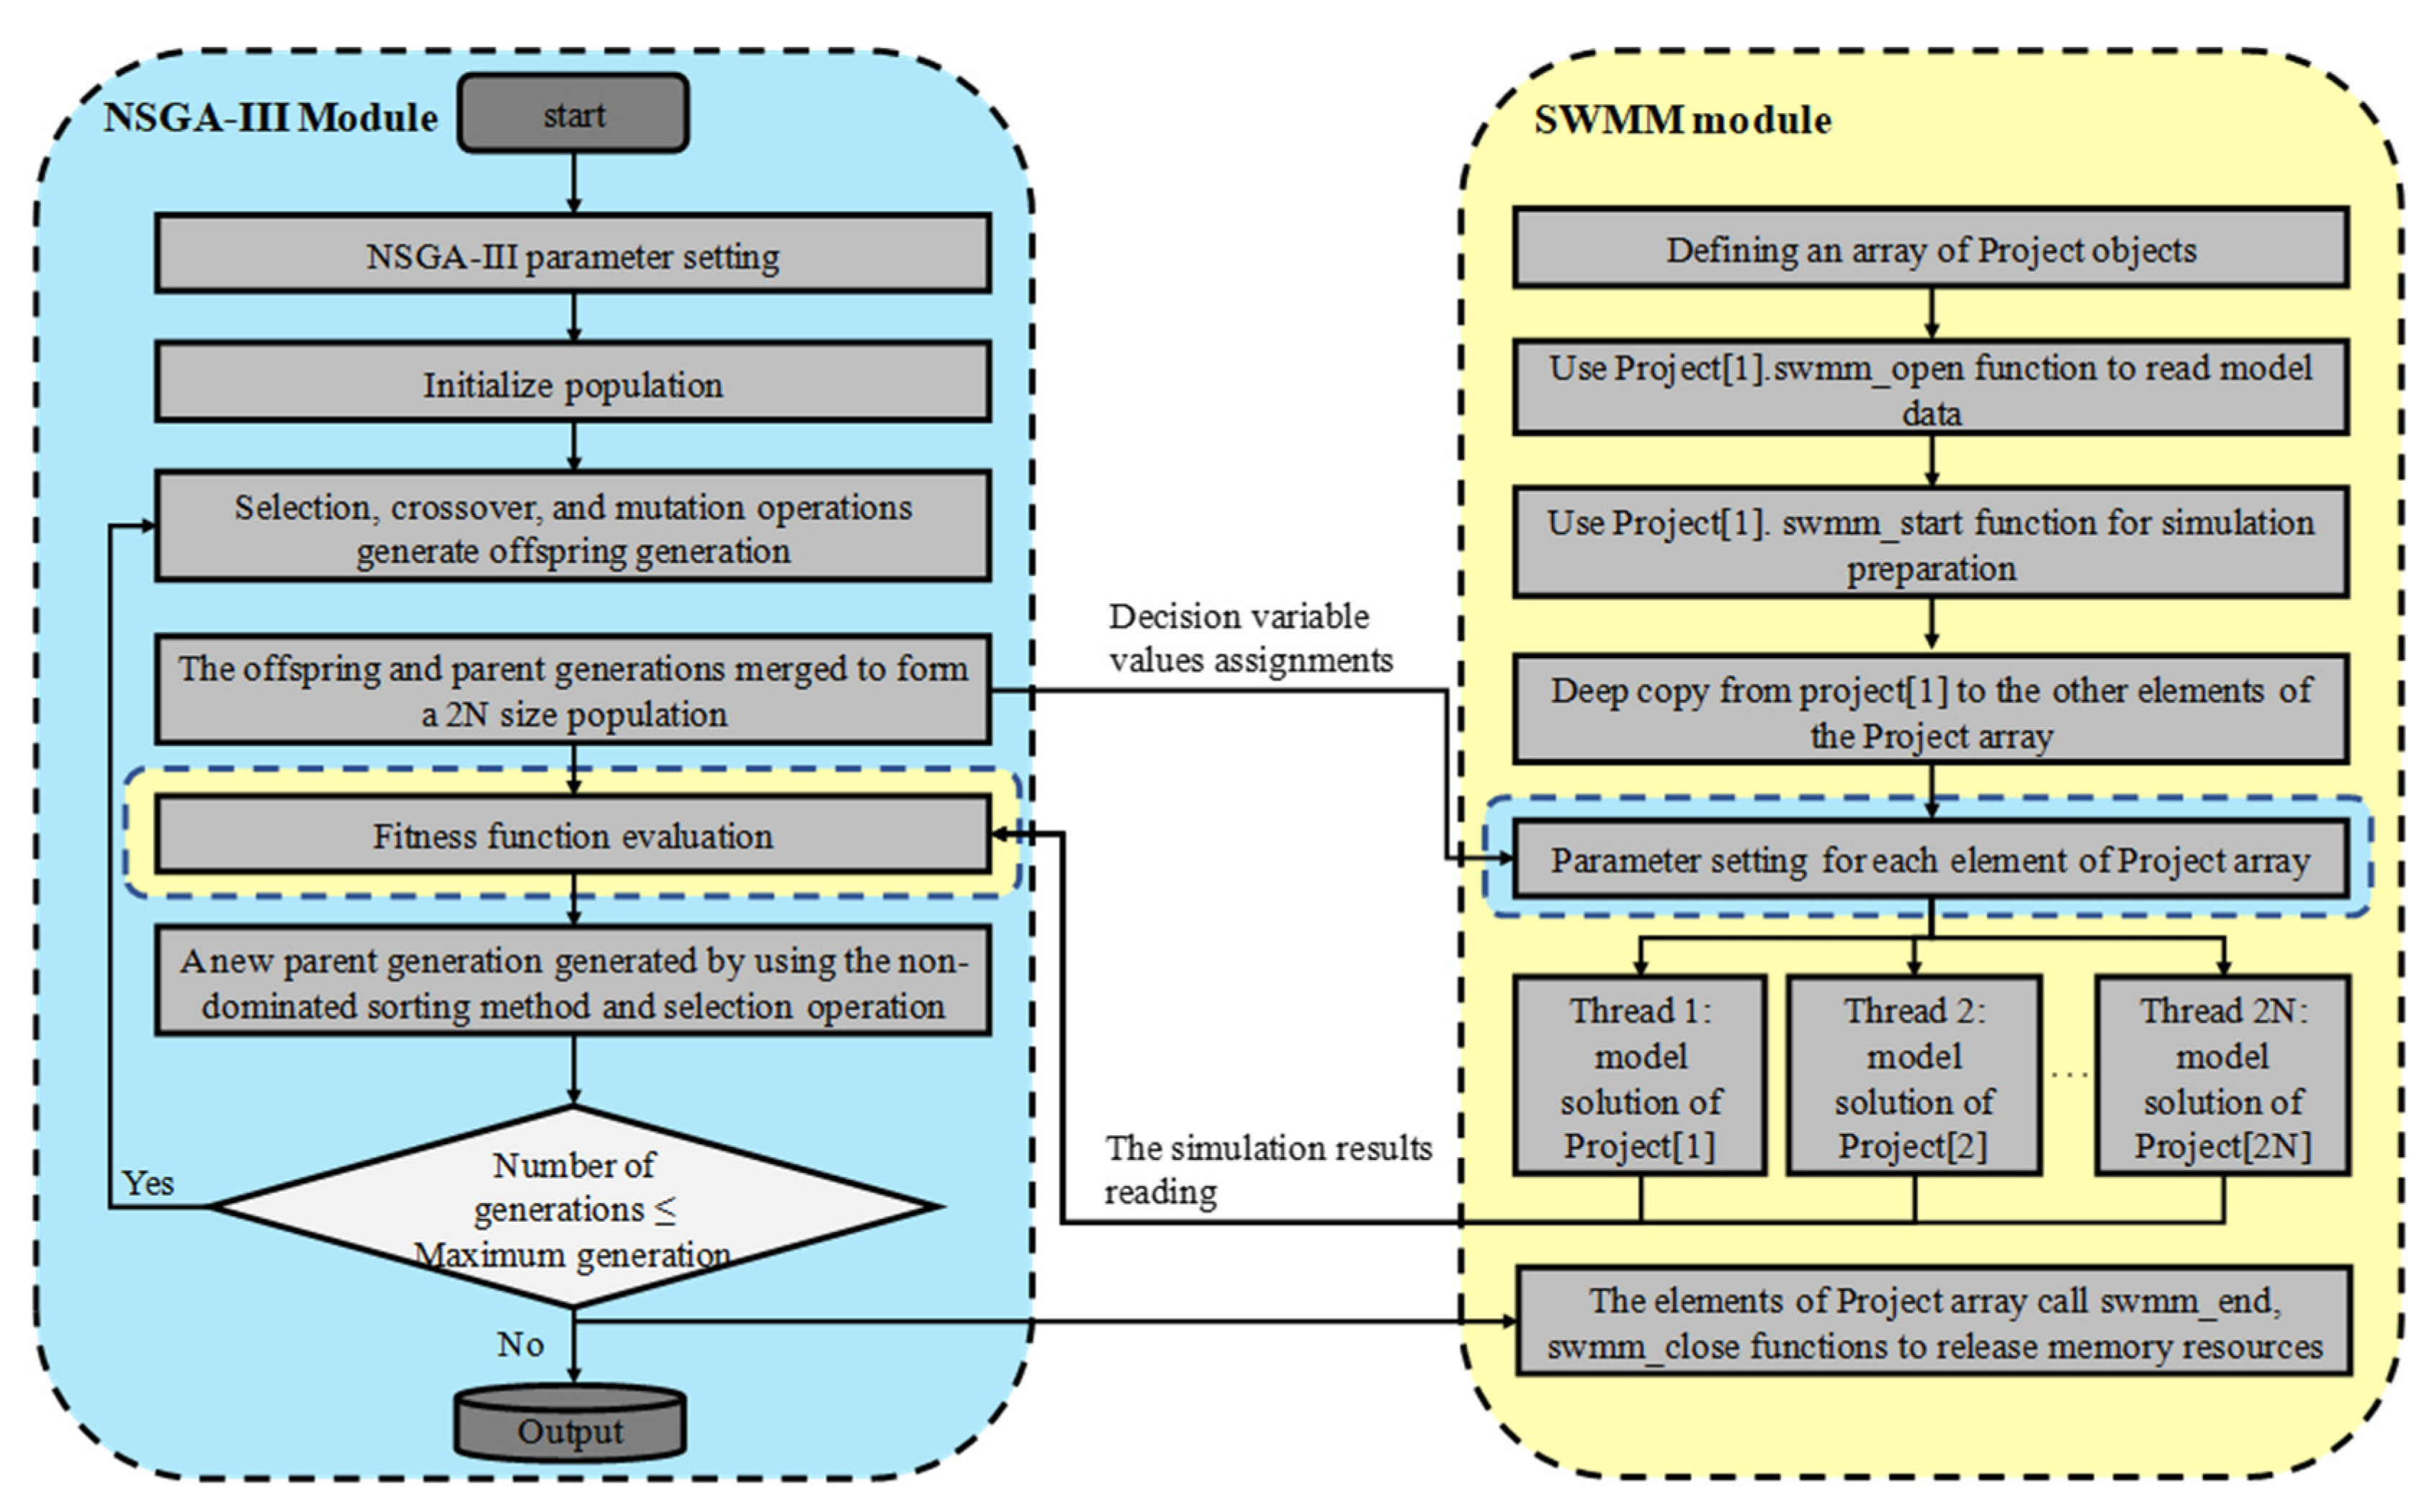
3.4. Overall Solution Framework
The flow chart of the solving process of the optimization model is shown by Figure 2. The overall solution framework can be divided into two modules: the NSGA-III module and SWMM module. The evolutionary functions are implemented by the NSGA-III module to generate and select better solutions and the SWMM module is in charge of hydro-hydraulic simulation and the objective values’ calculation.
In this study, real number coding, elitist selection strategy, uniform crossover, random mutation, and normal evolving steps are used in the NSGA-III module.
For the SWMM module, at the beginning of the optimization process, an array of project classes is defined, and in order to make the CPU achieve its best performance, the length of the project array should equal the logical core number of CPU. For the sake of minimized file operations, only the first element of the project array is used to read and initialize the model data from the input file by calling the swmm_open and swmm_start functions. Additionally, other elements are initialized by deep copying from the first element. After these works, each element is ready for simulation. In each generation of the evolving process, the SWMM module is called by the following steps:
Step1: Parameters setting. The parameter values that are generated by the NSGA-III module are assigned to the project element. Thus, the schemes of each individual in the NSGA-III module can be represented by an element in the project array.
Step2: Parallel simulation. The project elements are simulated in parallel.
Step3: Simulation result reading. The simulation results used in the individual evaluation are obtained by the NSGA-III module by directly visiting the variable members of the project element.
It should be noted that the population size is generally much larger than the project array length. Thus, the three steps are implemented with a loop way in each generation and a certain number (equal to the length of the project array) of individuals are simulated in parallel in one loop until the population size of individuals is simulated.
4. Case Study
The proposed optimization model was applied to the optimal design of a CSO facility serving a combined sewer system located in Wuhan, China. The service area of the sewer system is about 11.5 hectares.
In the current sewer system, combined flows from the service area are intercepted by two intercepting weirs (IW1 and IW2). The intercepted flow is sent to the dry season wastewater treatment plant. The overflow is directly drained into a nearby river and causes serious pollution to the water body. Therefore, a CSO interception facility is going to be built for interception and storage of overflows from IW1 and IW2. Additionally, the intercepted overflows are finally pumped to the dry season wastewater treatment plant with an acceptable flow rate during and after rain events. Because node 1, node 2, and node 3 are located in the terminal of the sewer system, the invert elevations are very low. If the overflows from IW1 and IW2 flow into the storage tank by gravity, the storage tank must be constructed deep underground. This result in many troubles in construction and maintenance and makes the cost rise sharply. Considering the local land use and distance between IW1 and IW2, a scheme of two storage tanks (SU1 and SU2) with inlet (IP1 and IP2) and outlet (OP1 and OP2) pumps is used as the framework for the CSO interception facility. Because the acceptable extra flow rate of the dry season wastewater treatment plant in wet weather is 3 m3/s, in order to maximize the interception rate in wet weather, the capacity of OP2 is set as 2.5 m3/s and is not considered as a decision variable. During rain events when CSOs are generated from IW1 and IW2, the CSOs are pumped into SU1 and SU2 by IP1 and IP2 as much as possible. When CSOs exceed the capacity of IP1 and IP2, the extra part is drained into the nearby river. Additionally, the water stored in SU1 is pumped into SU2 by OP1 and CSOs stored in SU2 are finally pumped by OP2 to the dry season wastewater treatment plant. Due to the complexity of this CSO facility, an optimal design is necessary for obtaining an economical and effective scheme.
The method described in Section 3.3 is used, and the original sewer system model is simplified. The original sewer system model and the simplified model are shown in Figure 3. The simplified model is shown with a sketch map to display the scheme framework clearly.
In the calculation of the economic objective function, the construction cost of the storage tank is calculated based on the unit volume cost. According to the unit costs of similar projects, the value of 4 × 10³ Yuan/m3 is used in the present work. The construction cost of the pump station is calculated by the formula proposed in the Estimation Index of Wuhan Municipal & Transportation Planning Project (2017 Revised), which as follows:
where Z1 is the project investment index of the rainwater pump station (104 Yuan/m3/s), q is the capacity of the rainwater pump station (m3/s), k is the multiple of project price inflation and 1.40 is used.
In order to evaluate the design schemes comprehensively, a one-year (year of 2013) precipitation is used in the SWMM simulation. The annual rainfall in Wuhan 2013 is near the average annual rainfall value in the recent 20 years in Wuhan. It is a representative year to describe the precipitation condition in the study area. If an annual rainfall larger than the average annual rainfall is used in the optimization process, it will most likely obtain optimal design schemes with a high construction cost and low utilization efficiency, and in contrast, an annual rainfall smaller than the average annual rainfall will lead to optimal design schemes that cause heavy CSOs pollution in the nearby river. Thus, the annual rainfall of 2013 is used in this study as the precipitation data. The rainfall pattern used in this study is shown in Figure 4.
According to the local land use and the capacity of downstream treatment facilities, the values or value ranges of parameters and decision variables of NSGA-III are listed in Table 1. The NSGA-III parameter values are selected according to the most used value range of genetic algorithms. For the decision variables, the value ranges, especially the upper boundaries of the value ranges, are mostly constrained by conditions related to specific study cases. In the present work, the value ranges of the tanks’ cross-sectional area and depths are constrained and valued according to the available area and allowable construction depth. The pump stations’ capacities of IP1 and IP2 are constrained by the annual allowable overflow times (a value of 5 is used in this work). The pump stations’ capacities of OP1 is constrained by an emptying time of 7 h of the storage tank to be emptied because in the present study case, if the interval time between two rains is larger than 7 h, the rainfall process is considered as two independent rain events and the pump station should have the ability to empty the storage tank during the no rainfall period. According to this constraint, the maximum capacity of OP1 is valued as 5 m3/s. To make the best use of the storage volume and avoid overflow in the storage tank, the start-up water depth should be limited to a certain scope of the full depth of the storage tank. Here, a scope of 0.5~0.9 is used.
5. Results and Discussion
The proposed optimization method ran 10 times for the study case. Additionally, for the sake of comparison, the NSGA-II method without the operational objective ran three times for the study case. Although the operational objective value was not used in the evolve process, it was recorded for each individual in the NSGA-II method.
5.1. Effect of Operational Objective
NSGA-III did not always outperform NSGA-II when compared on a variety of multi-objective test problems [25]. To figure out which method has a better performance, comparisons were made between the optimization results from NSGA-III and NSGA-II. The evolve lines of the average objective values are used as representations for the comparison. For the sake comparison more clearly, the average objective values obtained during the evolve process were normalized so that they had an identical range. The comparison is shown in Figure 5.
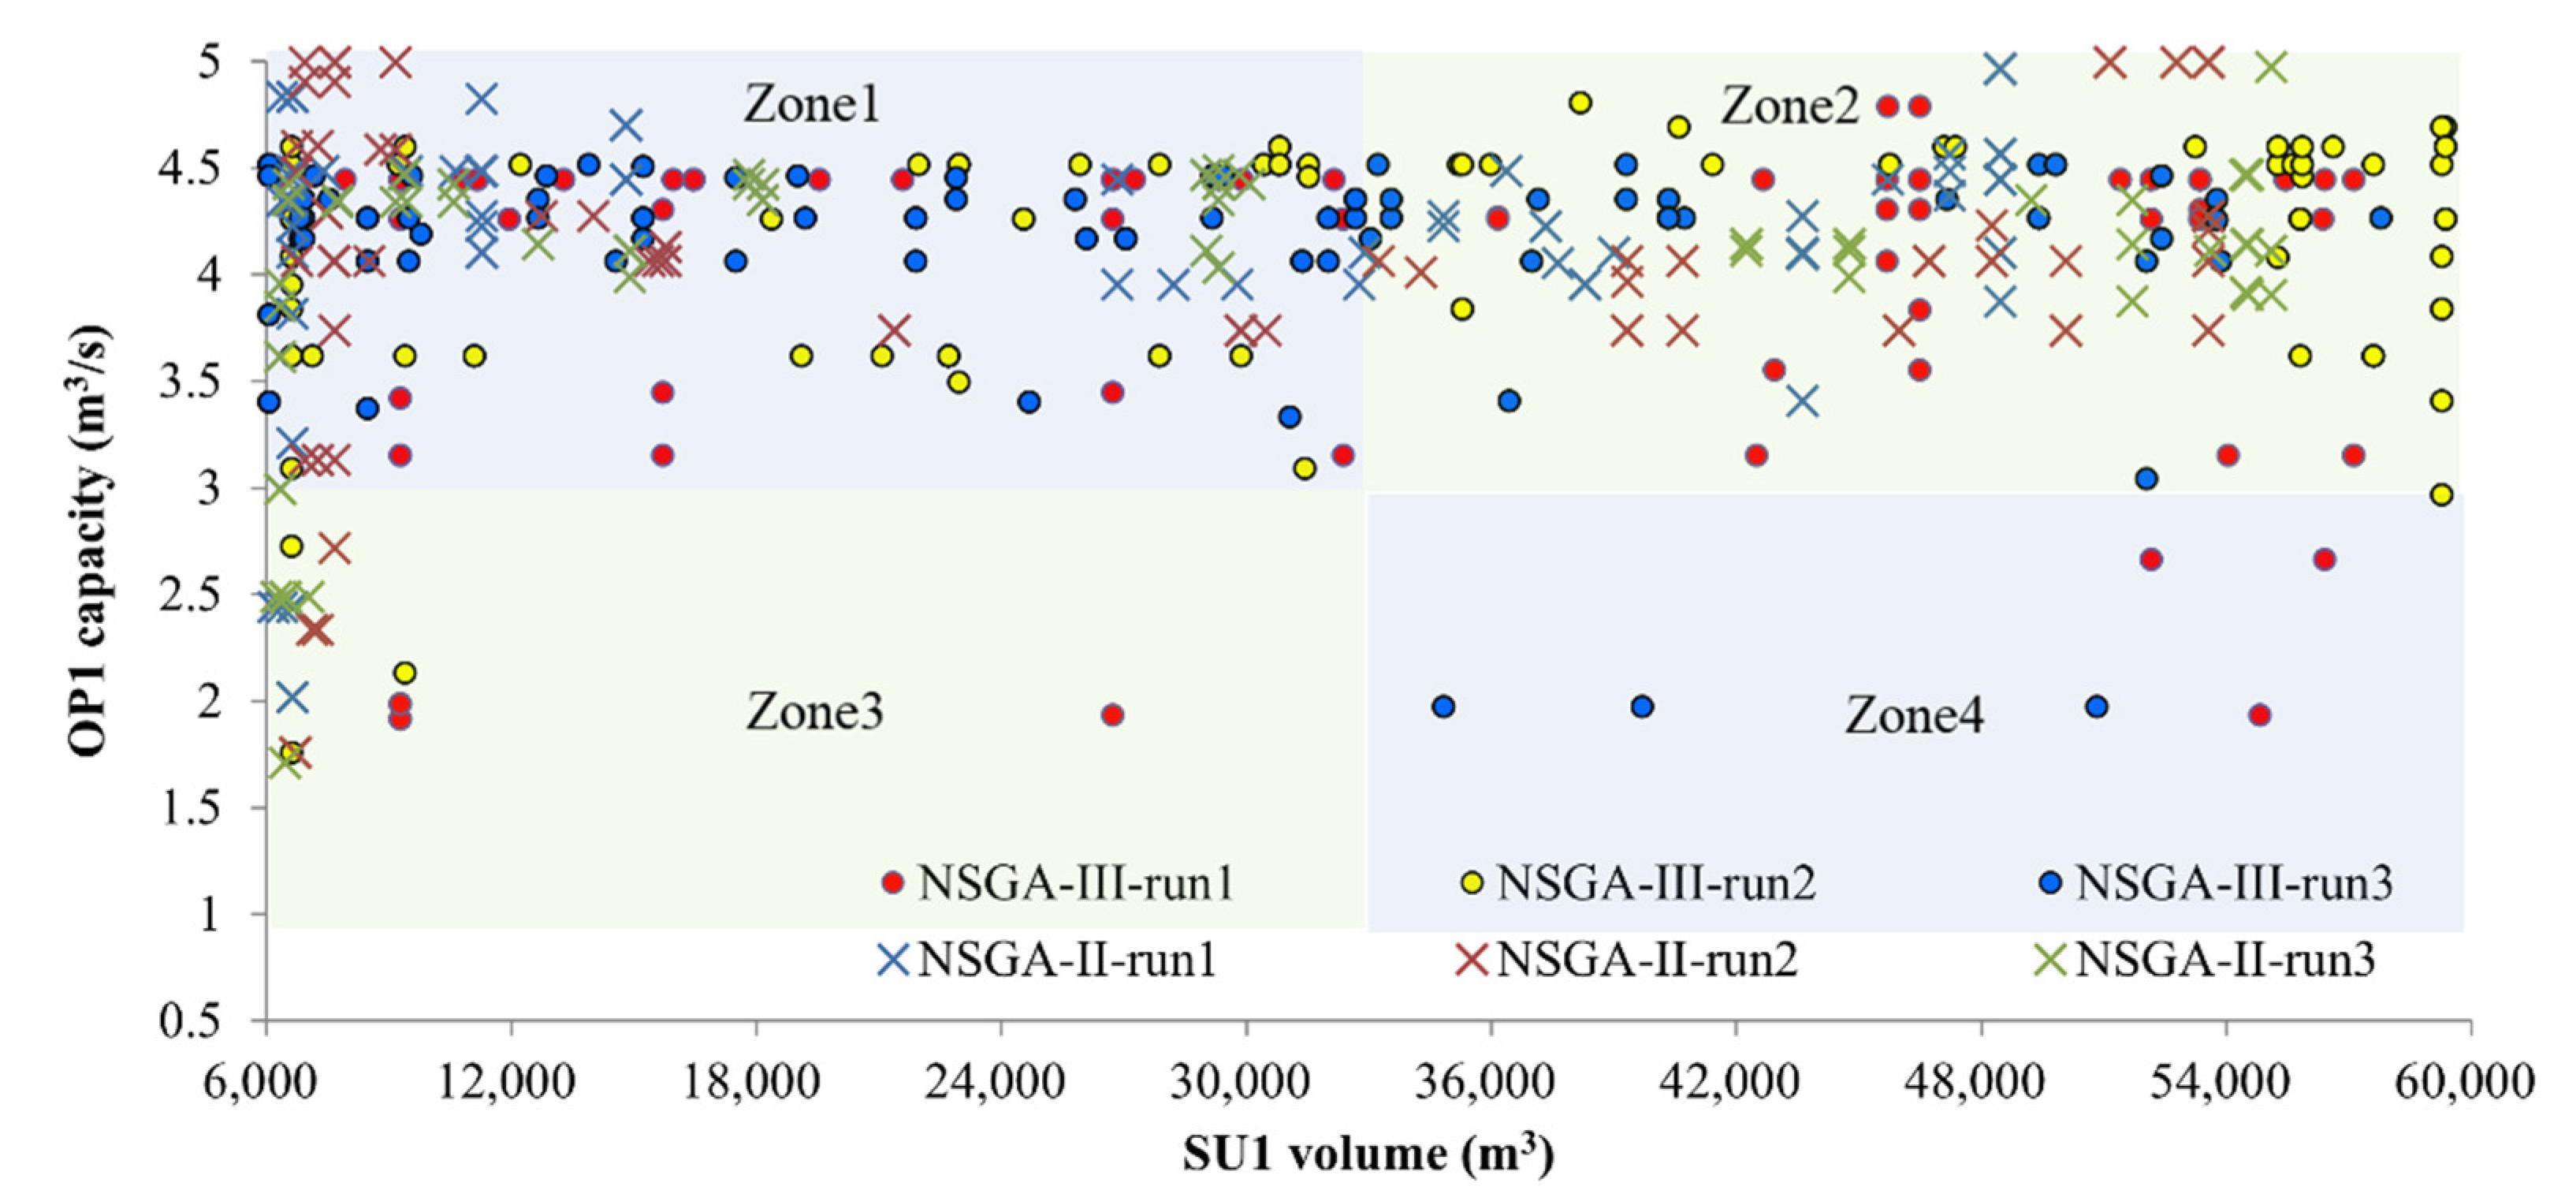
With the comparison of the economic and ecological objective values, it seems that NSGA-II has a better ability to find schemes with a lower construction cost and lower overflow ratio. However, the comparison of the operational objectives shows that this better performance is achieved at the expense of higher pump start-up times. Generally, the pump start-up times of the NSGA-II schemes are two times higher than the NSGA-III schemes. In the present work, SU1 and OP1 is a combination that is suitable to describe the effect of the operational objective. The optimized results of SU1 and OP1 of the last generation from the runs of NSGA-II and NSGA-III are shown in Figure 6.
In Figure 6, the solution space of SU1 and OP1 is evenly divided into four zones. It can be seen that lots of individuals, regardless of whether they are from NSGA-II or from NSGA-III, are located in zone 1 and zone 2 because schemes with a large pump capacity can achieve a lower overflow ratio, so in order to satisfy the ecological objective, individuals are driven to solution spaces with a larger pump capacity. Similarly, individuals from both NSGA-II and NSGA-III are driven to the solution space with a smaller storage volume, such as zone 1 and zone 3, to satisfy the economic objective. Because there is no operational objective for the NSGA-II method, no individual is located in zone 4, which include schemes with a larger storage volume and smaller pump capacity that can achieve less pump start-up times. In contrast, the NSGA-III method always searches in zone 4 to select schemes with better operational performance. The added operational objective means the optimization model has the ability to search the solution space more thoroughly and obtain schemes that can achieve a balance between the economic, ecological, and operational objectives.
5.2. Verification of Proposed Method
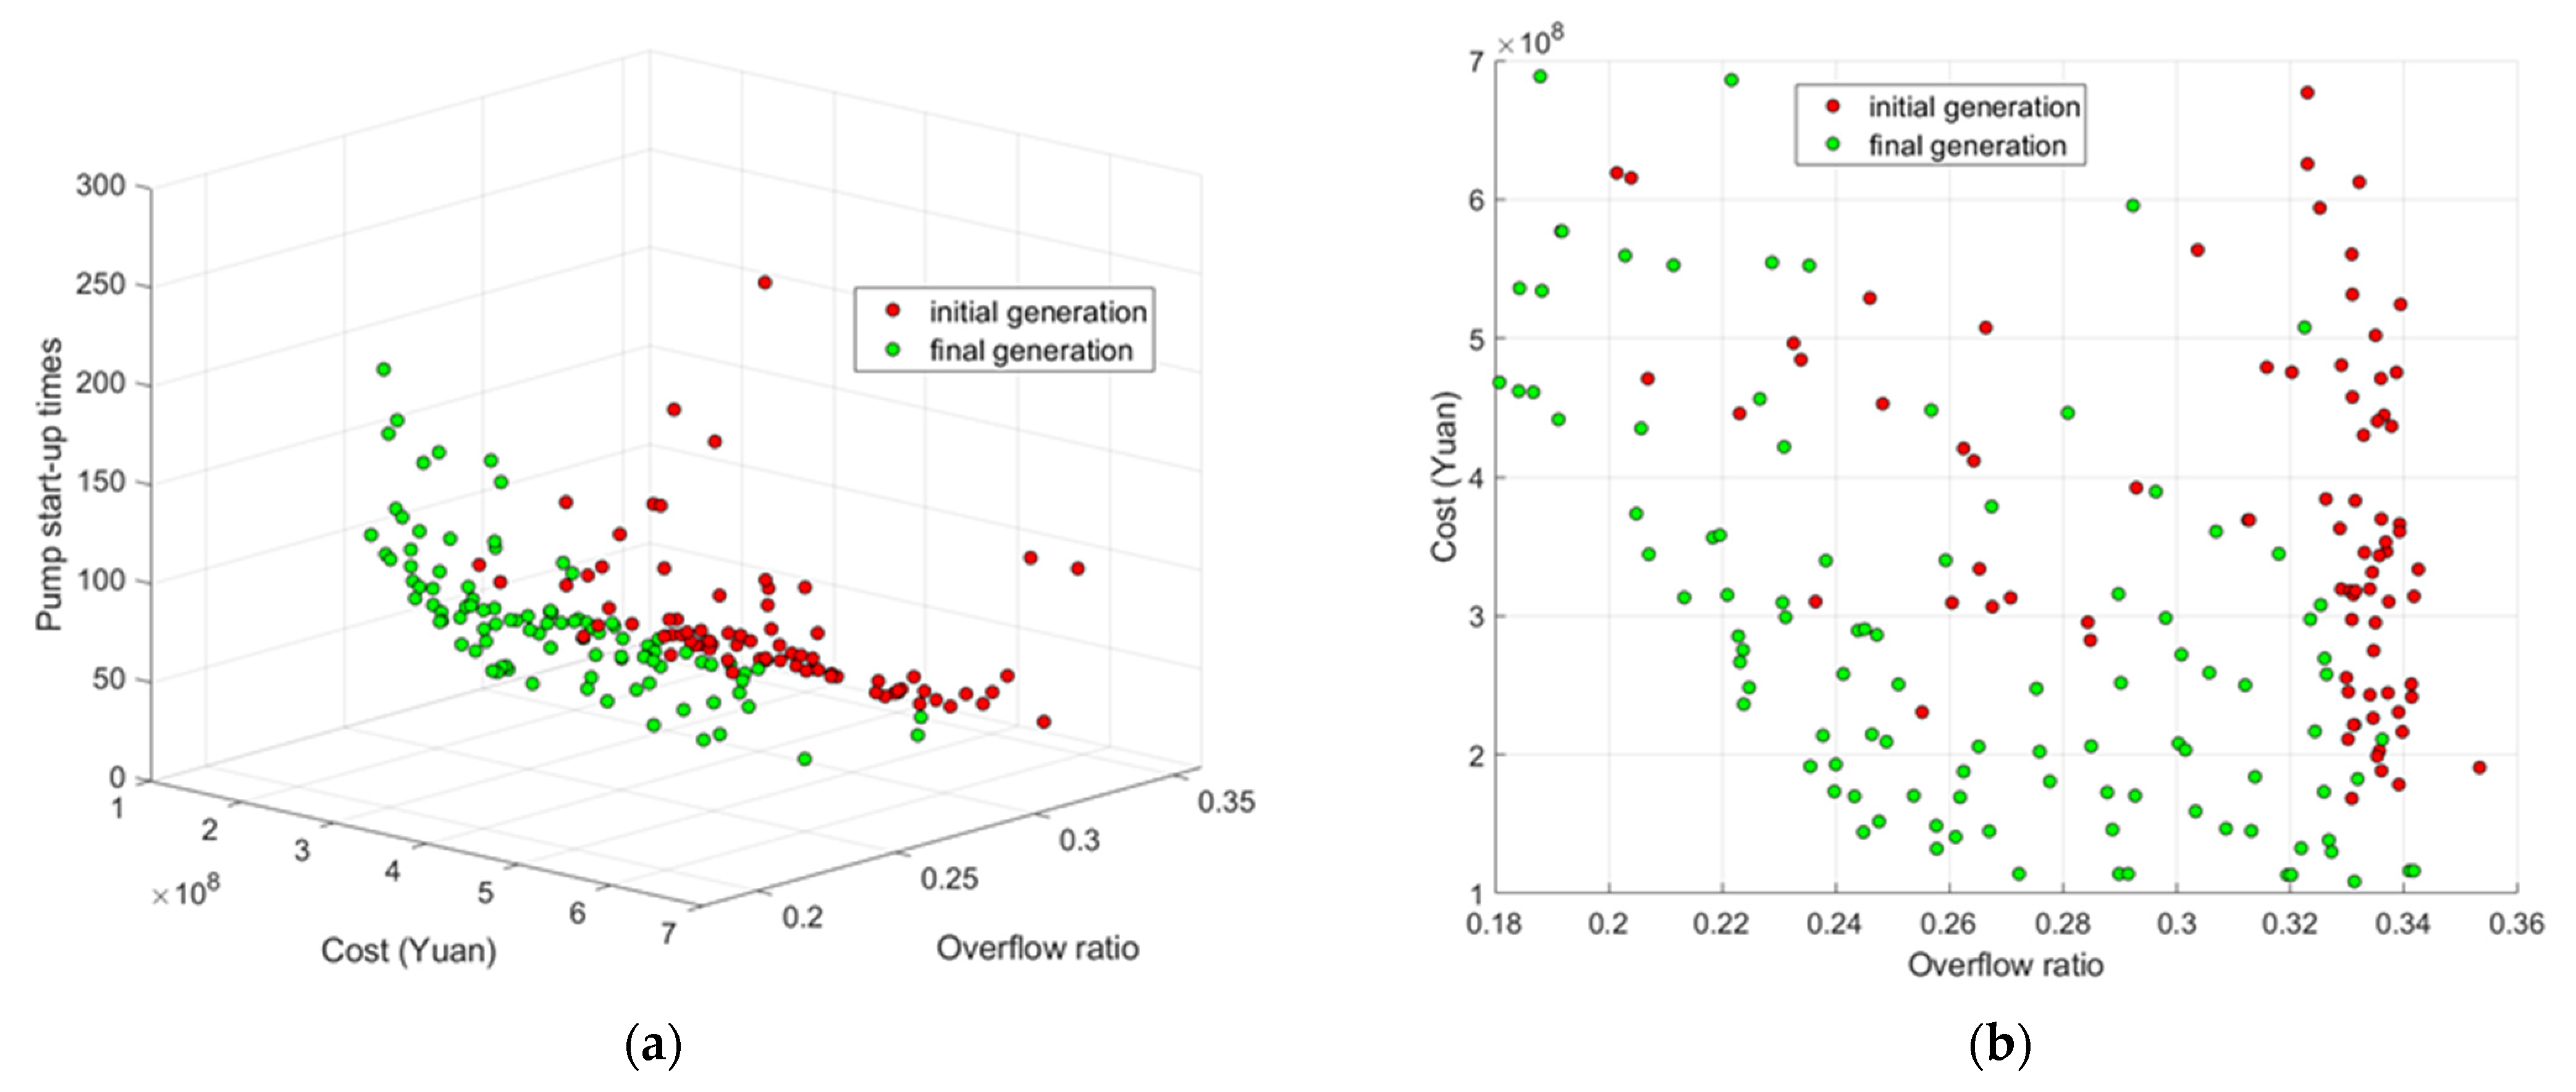
Figure 7 shows the individuals’ distribution of the initial and final generations of one NSGA-III run. Figure 7a shows the individuals from a three-dimensional view and Figure 7b shows the individuals with a two-dimensional view of the cost and overflow ratio.
It can be seen that with the evolutionary process, the final generation is much closer to the origin of the coordinate system and obtained an obvious improvement compared with the initial generation. A more quantitative measurement for the improvement is the dominant numbers between individuals of the initial and final generations. Table 2 shows the dominant results of 10 NSGA-III runs.
Table 2 shows that almost all initial individuals are dominated by the final individuals. This indicates that the Pareto front of the final generation was totally separated from the Pareto front of the initial generation, and the solutions of the final generation show an absolute superiority over the solutions of the initial generation.
Another concerned aspect of the optimization result is the detailed values of the construction cost and overflow ratio. Figure 7b shows that much better schemes are generated. In the last generation, a lot of individuals with less construction cost and a lower overflow ratio are generated. These individuals give decision makers more feasible choices for choosing the final design scheme.
5.3. Comparison of Design Schemes
Technique for Order Preference by Similarity to an Ideal Solution (TOPSIS) is a method that is suitable for selecting the best one from solutions with multiple evaluation objectives [26] because it has the advantages of high applicability and low computational effort [27]. Thus, in this study, it is used for selecting the best design schemes from the Pareto solutions of the last generation.
The top-scoring individual was selected and its decision variable values were entered into the original SWMM model of the study case. The simulation results of the empirically designed scheme (Es) and selected optimal designed scheme (Os) are shown in Table 3.
Table 3 shows that the optimal designed scheme achieves higher interception efficiency with much less construction cost than the empirically designed scheme. In the empirically designed scheme, designers want to reduce the overflow rate with a conservative strategy with a large storage volume, large capacity of the inlet pump, and small capacity of the outlet pump. Thus, the two tanks with large volumes and outlet pumps with a small capacity are used. Due to the expensive unit cost and large volumes of storage tanks, the cost of storage tanks accounts for a large percentage of the total cost of the whole facility and also increased the total cost of the facility.
The simulation results from the original model and simplified model are shown in Table 3. The relative errors between the original model and simplified model are little and the maximum error is smaller than 5%. It proves that the model simplification has little impact on the simulation results and can be used in the optimization process.
Table 4 shows the storage volume utilization of the empirically designed scheme and optimal designed scheme. From Table 4, it can be seen that although storage tanks have large volumes, the volume utilization is relatively low. Especially for SU2, the maximum volume utilization is only 64%. This means that a 36% volume is not used in the whole year. In the optimal designed scheme, smaller volumes are selected. Through the optimal selection of pumps, the volume utilization is increased obviously and the result of the lower overflow ratio and lower construction cost is achieved.
Another concerning aspect of this study is the computational efficiency. With the acceleration measures mentioned in Section 3, the computational efficiency was substantially improved. The proposed optimization model was solved on a computer with 3.6 GHz CPU (4 cores, 8 threads), 16 GB memory, and a thread pool of 8 threads was employed. The mean computation time required for one run was about 8 h. In contrast, the solving process without acceleration measures takes nearly 5 weeks for an optimization run. Thus, the acceleration methods proposed in this study significantly improved the computational efficiency and reduced the computation time to 3.72% compared with the solving method without acceleration. This makes the simulation-optimization approach more practical.
6. Conclusions
In this study, a new optimization model that considered both storage tanks and pump stations as optimized objects was proposed. Additionally, besides the economic and ecological objectives, the operational objective of the minimized the number of pump start-up times was added. The proposed optimization model was solved with the method based on NSGA-III and a new featured SWMM module.
By applying the proposed method to a CSO interception facility in Wuhan, it was found that optimal schemes with a higher CSO interception ratio, less construction cost, and acceptable pump start-up times can be obtained. Compared with schemes obtained by NSGA-II with only economic and ecological objectives, the schemes obtained by the proposed method can achieve a better balance between economic, ecological, and operational objectives.
By using the new featured SWMM module, parallel simulation and fast data exchange can be achieved during the optimization process. Additionally, this makes the solving time compressed from days to hours and makes the proposed method more practical. With the advantage of the high solving efficiency, long-term SWMM simulations can be applied for comprehensive evaluation of individuals. This means the optimization process is no longer an optimization oriented toward a certain rain event, but an optimization oriented to years of precipitation conditions and can give more feasible schemes.
The optimization method developed in this study did not consider the pump electricity cost as an objective. Because the pumps dealing with overflows are generally under intermittent operation, compared with operability and reliability, the electricity cost is not the most important aspect. For the sake of simplification of the optimization model, only the objective of the minimized pump start-up times was considered in the present work. The question of how to combine optimization of the facility design and energy consumption needs further study.
Author Contributions
All authors contributed extensively to the work presented in this paper. Z.P. and X.J. contributed to the subject of research, the development, the writing of the paper and the preparation of algorithms. W.S. adjusted the parameters and performed the simulations and contributed to writing of the paper. X.Z. provided the basics for the optimization algorithm, contributed to the writing of the paper and helped in the final revision. All authors have read and agreed to the published version of the manuscript.
Funding
This research was funded by the National Natural Science Foundation of China for supporting this research project, grant number 31670541.
Institutional Review Board Statement
Not applicable.
Informed Consent Statement
Not applicable.
Data Availability Statement
Not applicable.
Acknowledgments
The kind help of Lei Liu during the submission should be acknowledged.
Conflicts of Interest
The authors declare no conflict of interest.
References
- Marie-Ève, J.; Sophie, D.; Geneviève, P.; Martin, P. Selection of rainfall information as input data for the design of combined sewer overflow solutions. J. Hydrol. 2018, 565, 559–569. [Google Scholar]
- Moore, T.L.; Rodak, C.M.; Ahmed, F.; Vogel, J.R. Urban Stormwater Characterization, Control and Treatment. Water Environ. Res. 2018, 90, 1821–1871. [Google Scholar] [CrossRef] [PubMed] [Green Version]
- O’Sullivan, A.D.; Wicke, D.; Hengen, T.J.; Sieverding, H. Life Cycle Assessment modelling of stormwater treatment systems. J. Environ. Manag. 2015, 149, 236–244. [Google Scholar] [CrossRef] [PubMed]
- Zhou, N.Q.; Zhao, S. Urbanization process and induced environmental geological hazards in China. Nat. Hazards 2013, 67, 797–810. [Google Scholar] [CrossRef]
- Koc, K.; Ekmekciolu, M.; Zger, M. An integrated framework for the comprehensive evaluation of low impact development strategies. J. Environ. Manag. 2021, 294, 113023. [Google Scholar] [CrossRef] [PubMed]
- Chen, Y.; Samuelson, H.W.; Tong, Z. Integrated design workflow and a new tool for urban rainwater management. J. Environ. Manag. 2016, 180, 45–51. [Google Scholar] [CrossRef] [Green Version]
- Ward, P.J.; Jongman, B.; Aerts, J.C.J.H.; Bates, P.D.; Botzen, W.J.W.; Loaiza, M.A.D.; Hallegatte, S.; Kind, J.M.; Kwadijk, J.; Scussolini, P.; et al. A global framework for future costs and benefits of river-flood protection in urban areas. Nat. Clim. Chang. 2017, 7, 642–646. [Google Scholar] [CrossRef]
- Zhang, D.; Martinez, N.; Lindholm, G.; Ratnaweera, H. Manage sewer in-line storage control using hydraulic model and recurrent neural network. Water Resour. Manag. 2018, 32, 2079–2098. [Google Scholar] [CrossRef]
- Tao, W.; Bays, J.S.; Meyer, D.; Smardon, R.C.; Levy, Z.F. Constructed Wetlands for Treatment of Combined Sewer Overflow in the US: A Review of Design Challenges and Application Status. Water 2014, 6, 3362–3385. [Google Scholar] [CrossRef] [Green Version]
- Bellu, A.; Fernandes, L.F.S.; Cortes, R.M.; Pacheco, F.A. A framework model for the dimensioning and allocation of a detention basin system: The case of a flood-prone mountainous watershed. J. Hydrol. 2016, 533, 567–580. [Google Scholar] [CrossRef]
- Lu, W.; Qin, X.; Yu, J. On comparison of two-level and global optimization schemes for layout design of storage ponds. J. Hydrol. 2019, 570, 544–554. [Google Scholar] [CrossRef]
- Choi, H.; Lee, E.H.; Joo, J.G.; Kim, J.H. Determining optimal locations for rainwater storage sites with the goal of reducing urban inundation damage costs. KSCE J. Civ. Eng. 2016, 21, 2488–2500. [Google Scholar] [CrossRef]
- Wang, M.; Sun, Y.; Sweetapple, C. Optimization of storage tank locations in an urban stormwater drainage system using a two-stage approach. J. Environ. Manag. 2017, 204, 31–38. [Google Scholar] [CrossRef]
- Coello, C.C.; Toscano-Pulido, G.; Lechuga, M. Handling multiple objectives with particle swarm optimization. IEEE Trans. Evol. Comput. 2004, 8, 256–279. [Google Scholar] [CrossRef]
- Das, S.; Suganthan, P.N. Differential Evolution: A Survey of the State-of-the-Art. IEEE Trans. Evol. Comput. 2011, 15, 4–31. [Google Scholar] [CrossRef]
- Deb, K.; Pratap, A.; Agarwal, S.; Meyarivan, T. A fast and elitist multiobjective genetic algorithm: NSGA-II. IEEE Trans. Evol. Comput. 2002, 6, 182–197. [Google Scholar] [CrossRef] [Green Version]
- Kirkpatrick, S.; Gelatt, C.D.; Vecchi, M.P. Optimization by Simulated Annealing. Science 1983, 220, 671–680. [Google Scholar] [CrossRef]
- Dorigo, M.; Maniezzo, V.; Colorni, A. Ant system: Optimization by a colony of cooperating agents. IEEE Trans. Syst. Man Cybern. Part B (Cybernetics) 1996, 26, 29–41. [Google Scholar] [CrossRef] [Green Version]
- Cunha, M.C.; Zeferino, J.A.; Simões, N.E.; Saldarriaga, J.G. Optimal location and sizing of storage units in a drainage system. Environ. Model. Softw. 2016, 83, 155–166. [Google Scholar] [CrossRef] [Green Version]
- Ryu, J.; Baek, H.; Lee, G.; Kim, T.-H.; Oh, J. Optimal planning of decentralised storage tanks to reduce combined sewer overflow spills using particle swarm optimisation. Urban Water J. 2017, 14, 202–211. [Google Scholar] [CrossRef]
- Rossman, L.A. Storm Water Management Model User’s Manual; US Environmental Protection Agency: Washington, DC, USA, 2010.
- Tao, T.; Wang, J.; Xin, K.; Li, S. Multi-objective optimal layout of distributed storm-water detention. Int. J. Environ. Sci. Technol. 2014, 11, 1473–1480. [Google Scholar] [CrossRef] [Green Version]
- Oxley, R.L.; Mays, L.W. Optimization–simulation model for detention basin system design. Water Resour. Manag. 2014, 28, 1157–1171. [Google Scholar] [CrossRef]
- Deb, K.; Jain, H. An Evolutionary Many-Objective Optimization Algorithm Using Reference-Point-Based Nondominated Sorting Approach, Part I: Solving Problems with Box Constraints. IEEE Trans. Evol. Comput. 2013, 18, 577–601. [Google Scholar] [CrossRef]
- Ishibuchi, H.; Imada, R.; Yu, S.; Nojima, Y. Performance comparison of NSGA-II and NSGA-III on various many-objective test problems. In Proceedings of the 2016 IEEE Congress on Evolutionary Computation (CEC), Vancouver, BC, Canada, 24–29 July 2016. [Google Scholar]
- Hwang, C.L.; Yoon, K. Methods for Multiple Attribute Decision Making; Springer: Berlin/Heidelberg, Germany, 1981. [Google Scholar]
- Zeng, S.Z.; Xiao, Y. A method based on TOPSIS and distance measures for hesitant fuzzy multiple attribute decision making. Technol. Econ. Dev. Econ. 2018, 24, 969–983. [Google Scholar] [CrossRef] [Green Version]
Figure 1.
Class definition and relationship of the encapsulated SWMM.
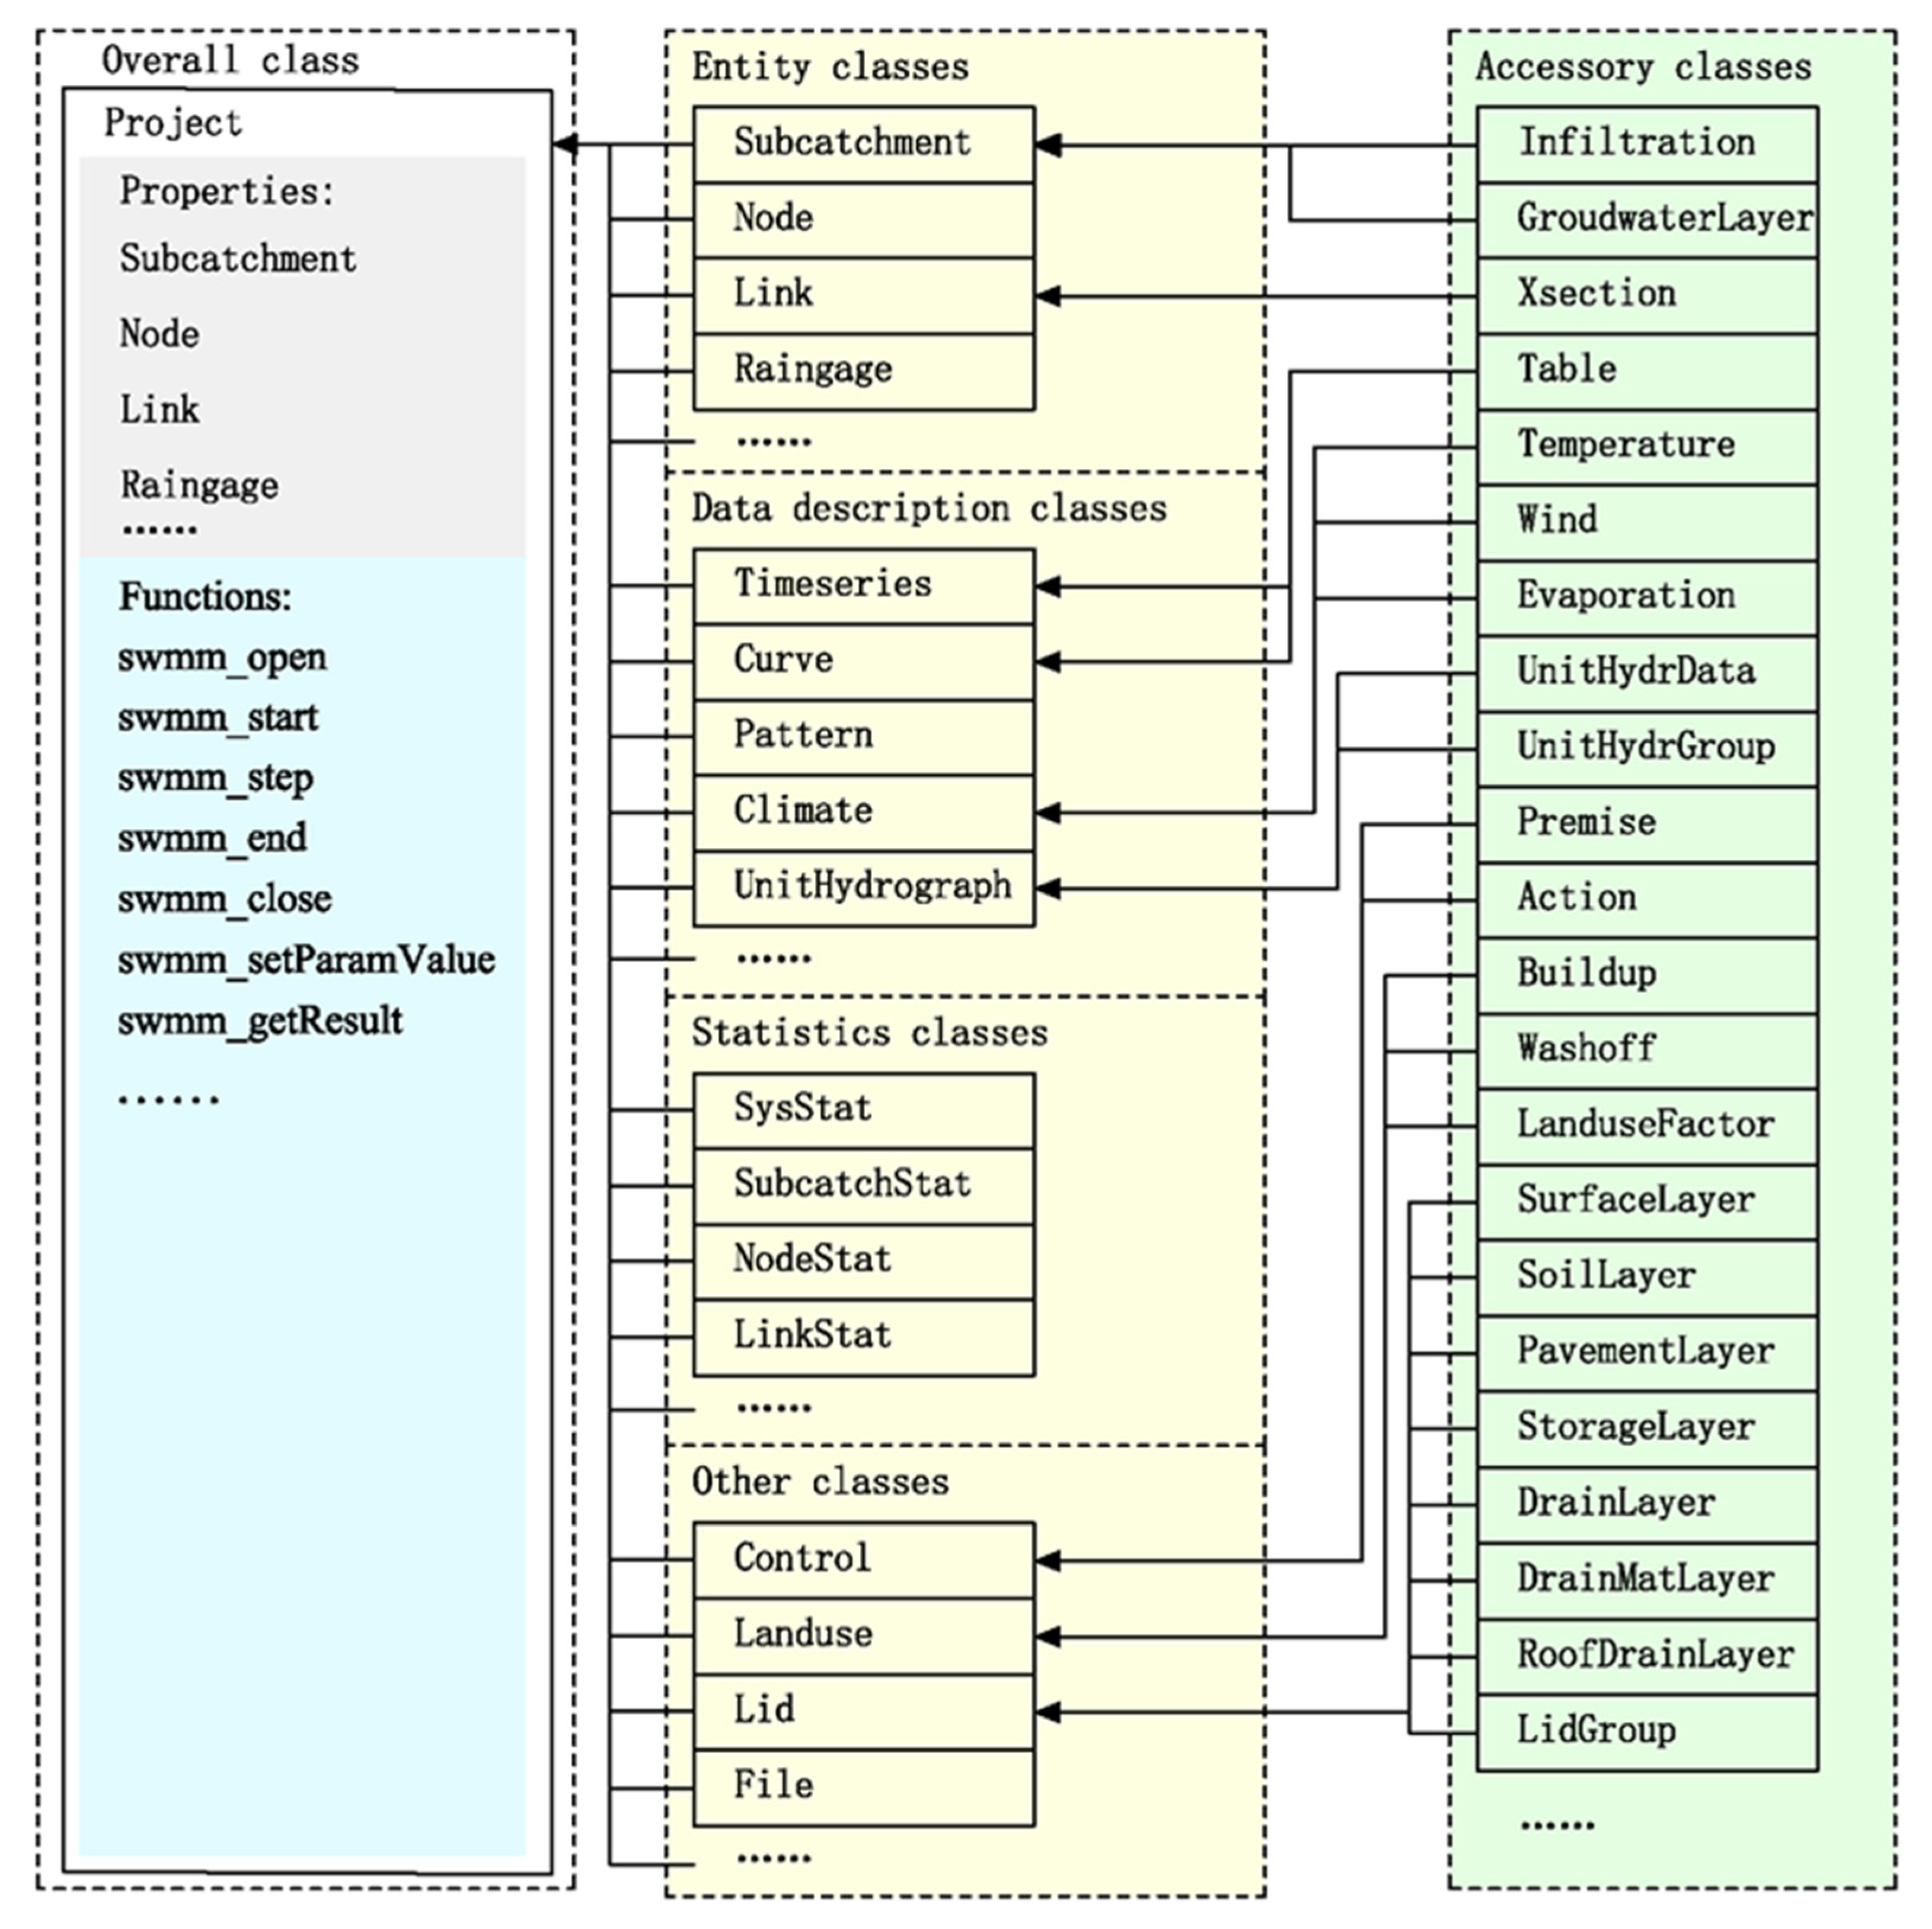
Figure 2.
Flow chart of the solving process of the optimization model.

Figure 3.
Comparison between the original sewer system model and the simplified model.
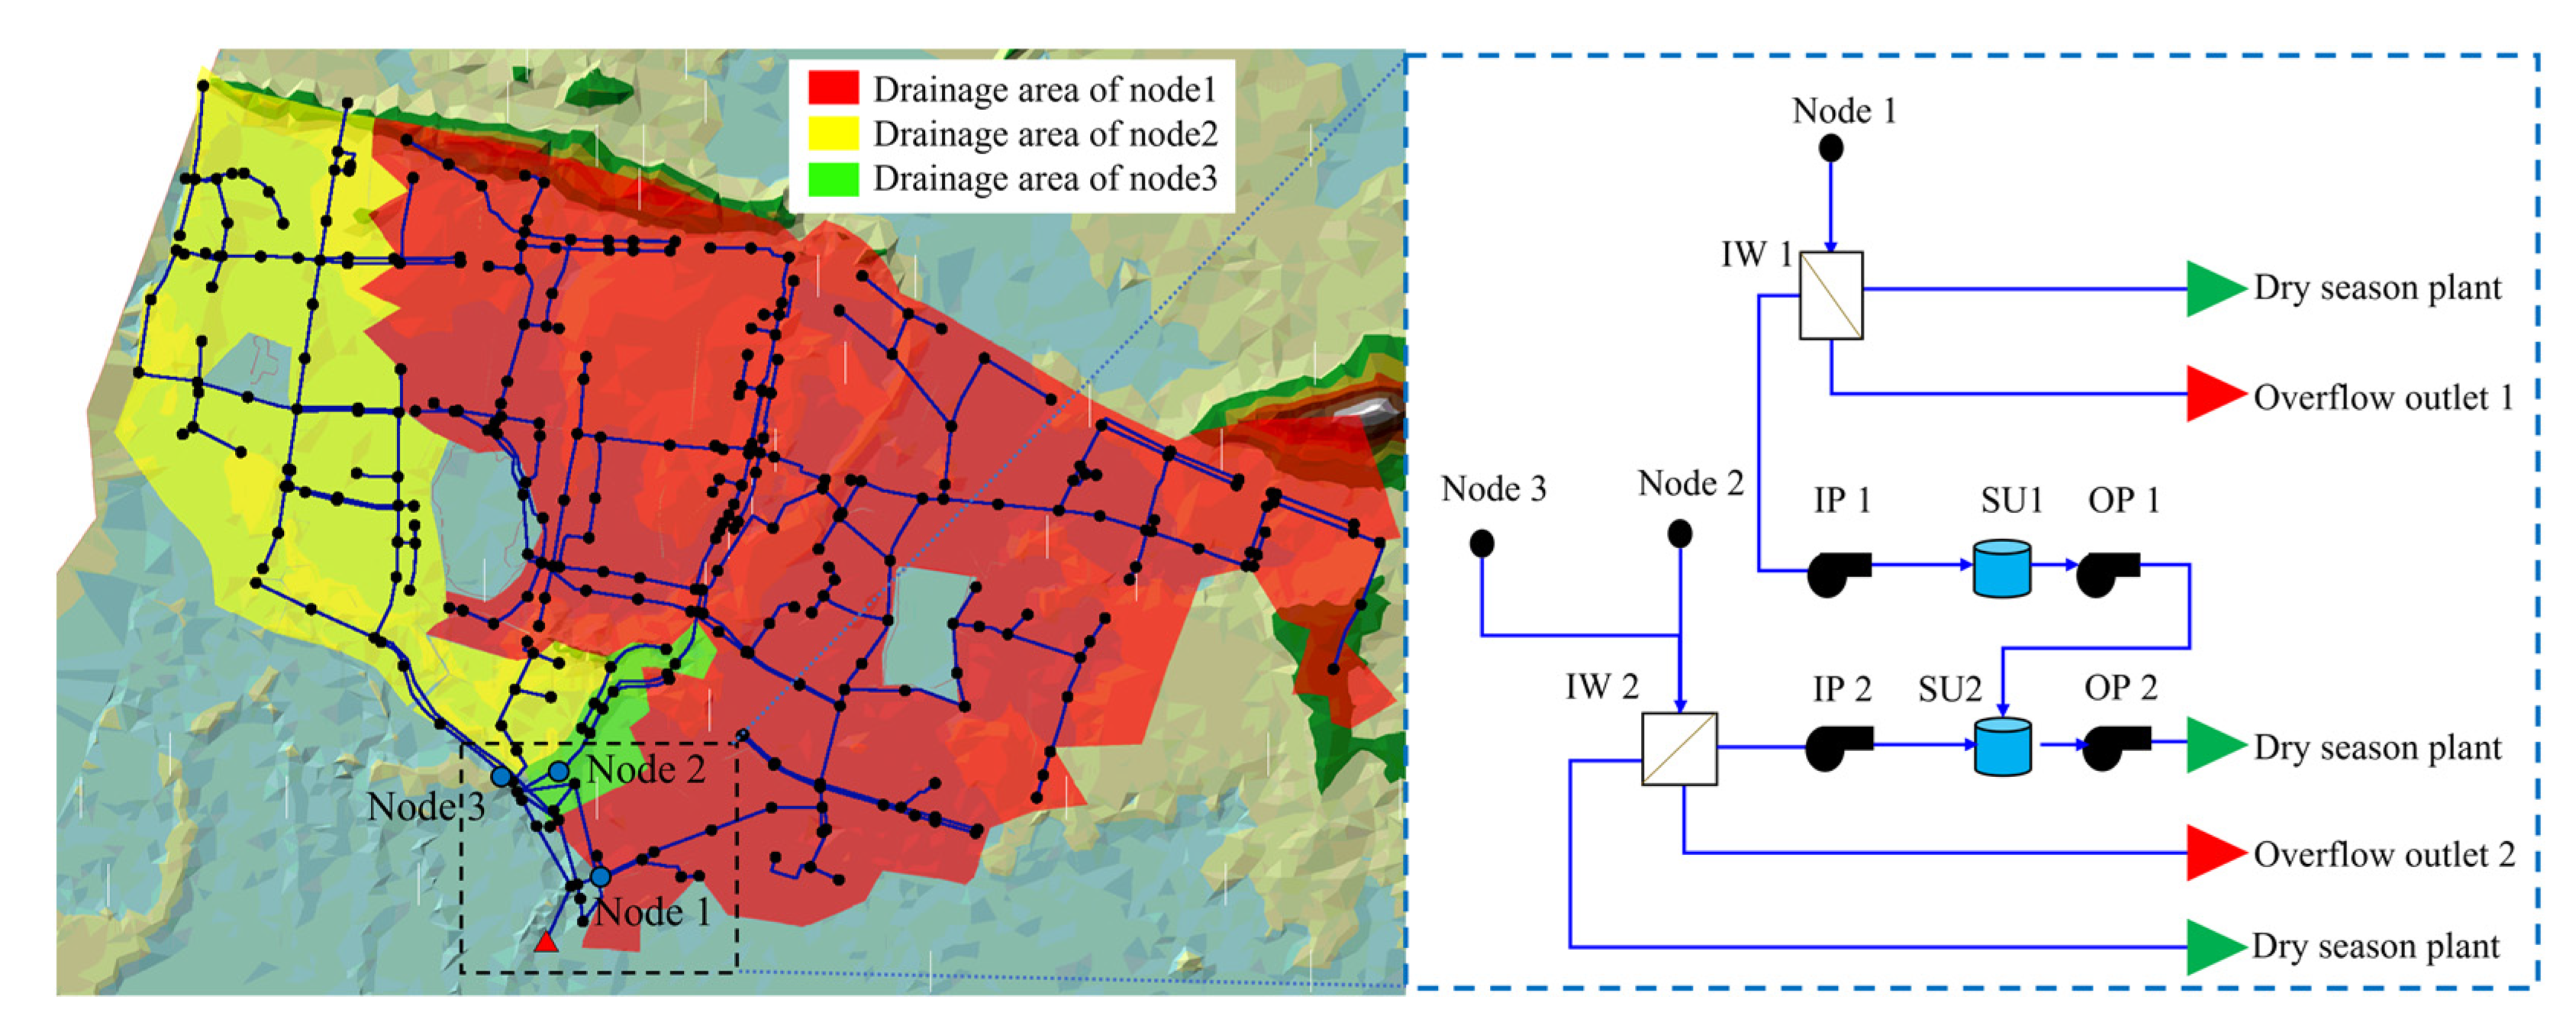
Figure 4.
Rainfall pattern of 2013 in Wuhan.
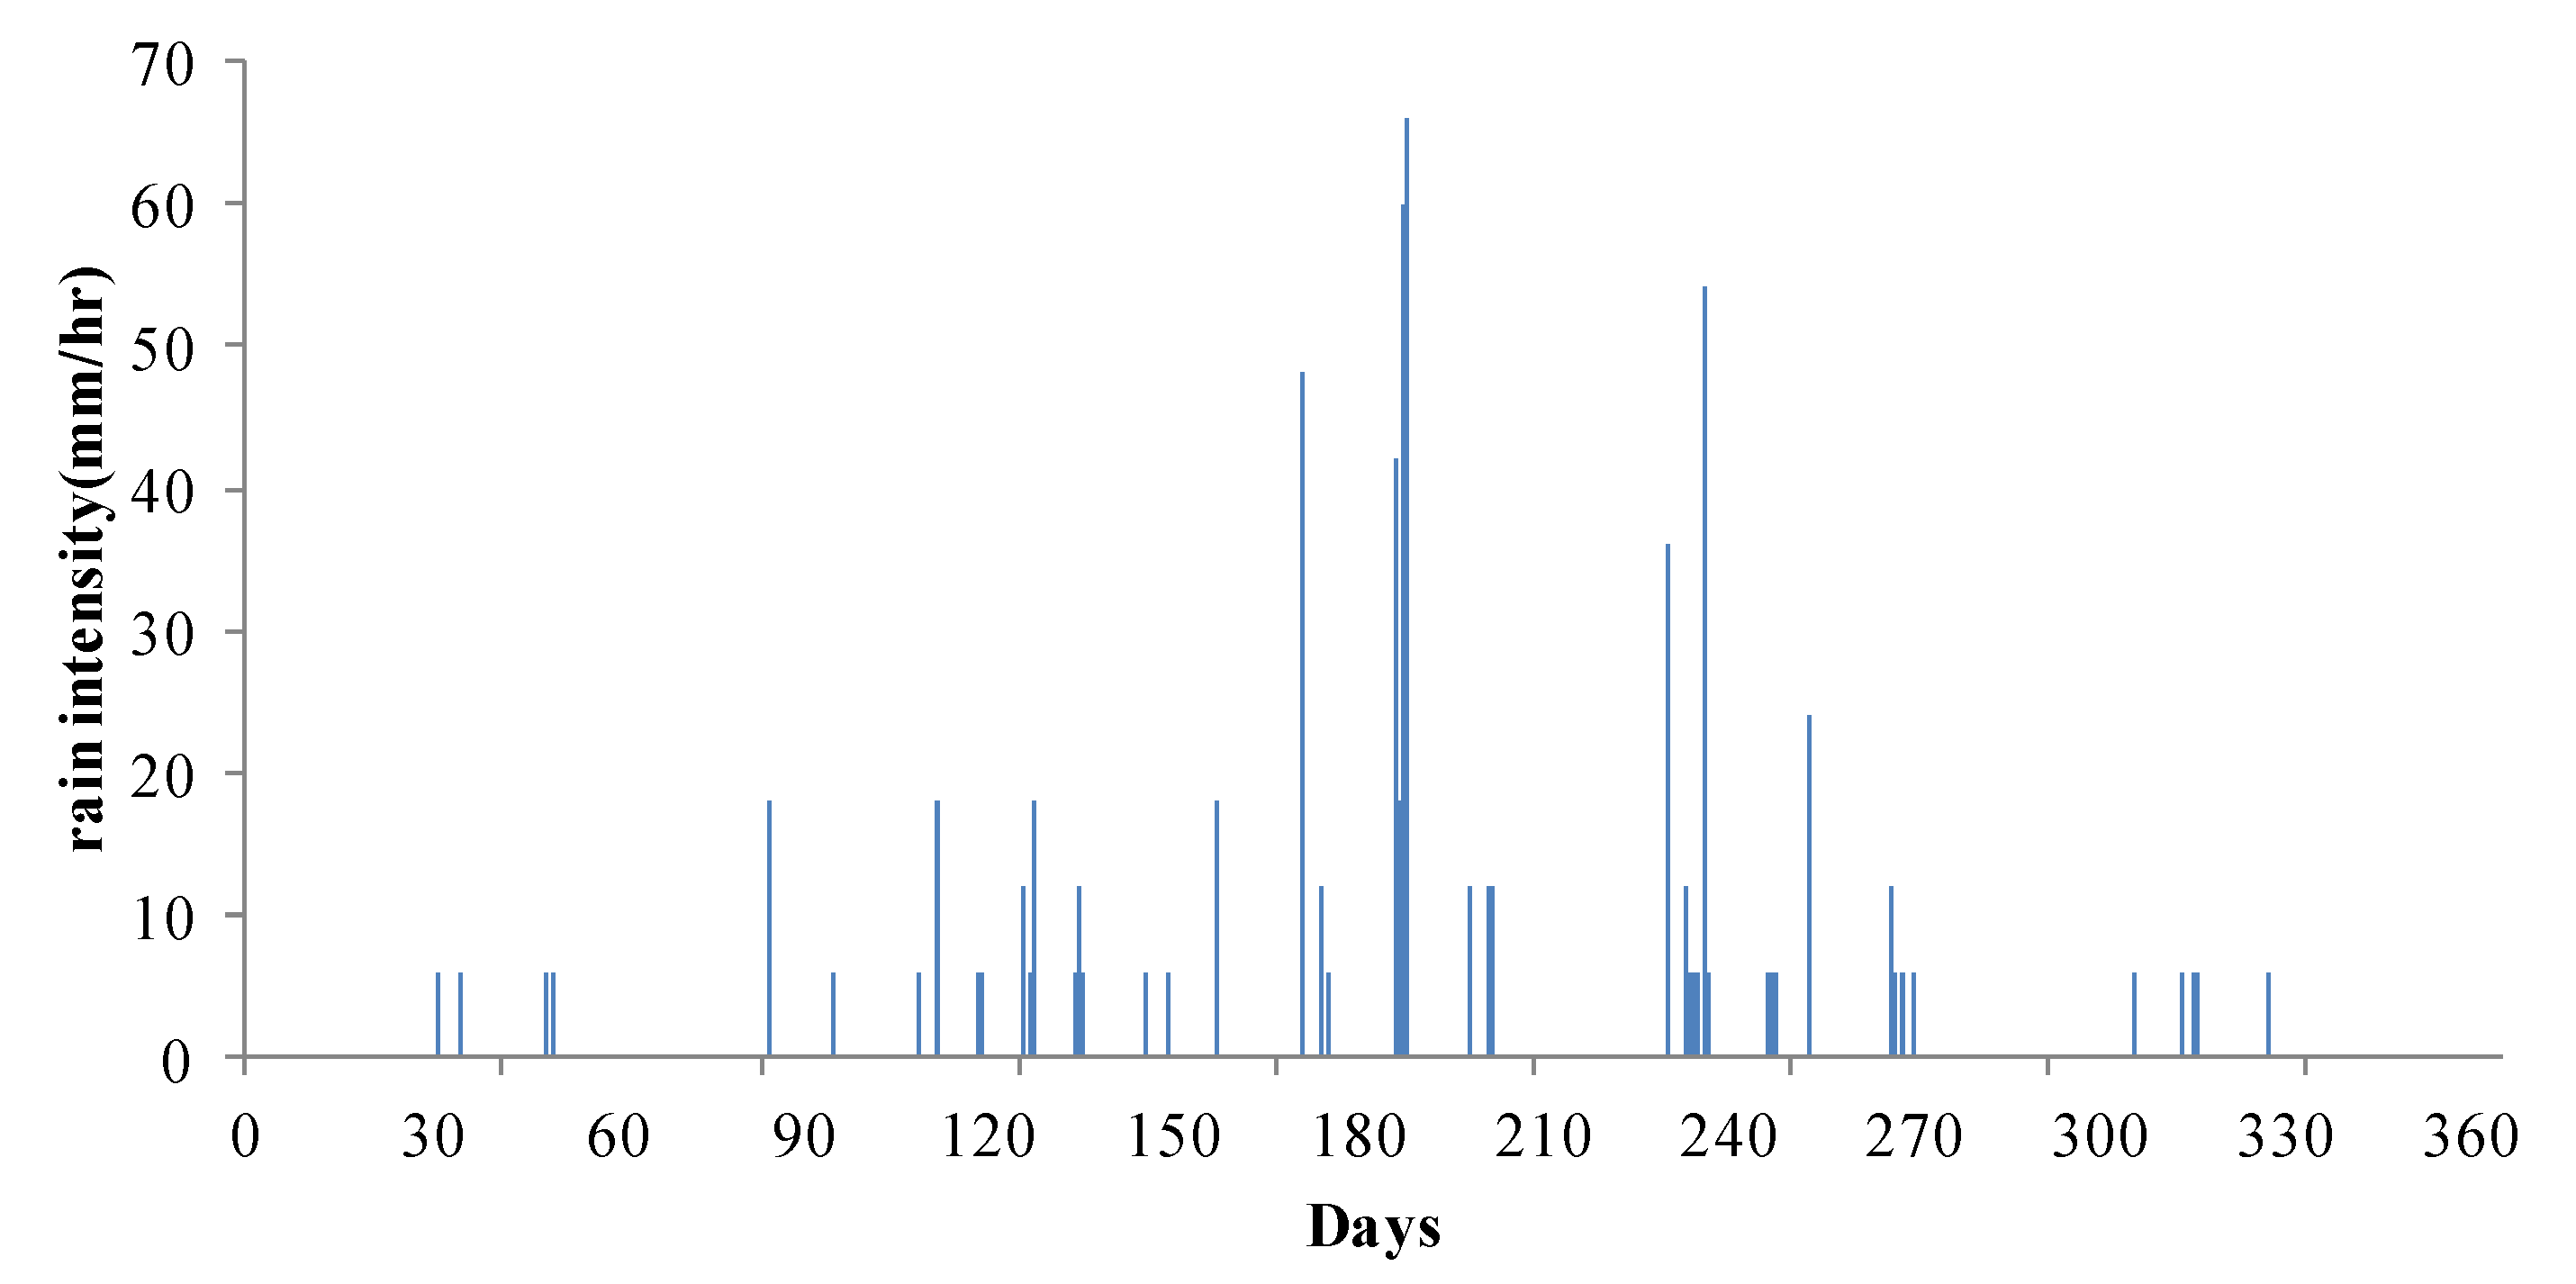
Figure 5.
Comparison between the optimization results from NSGA-II and NSGA-III.
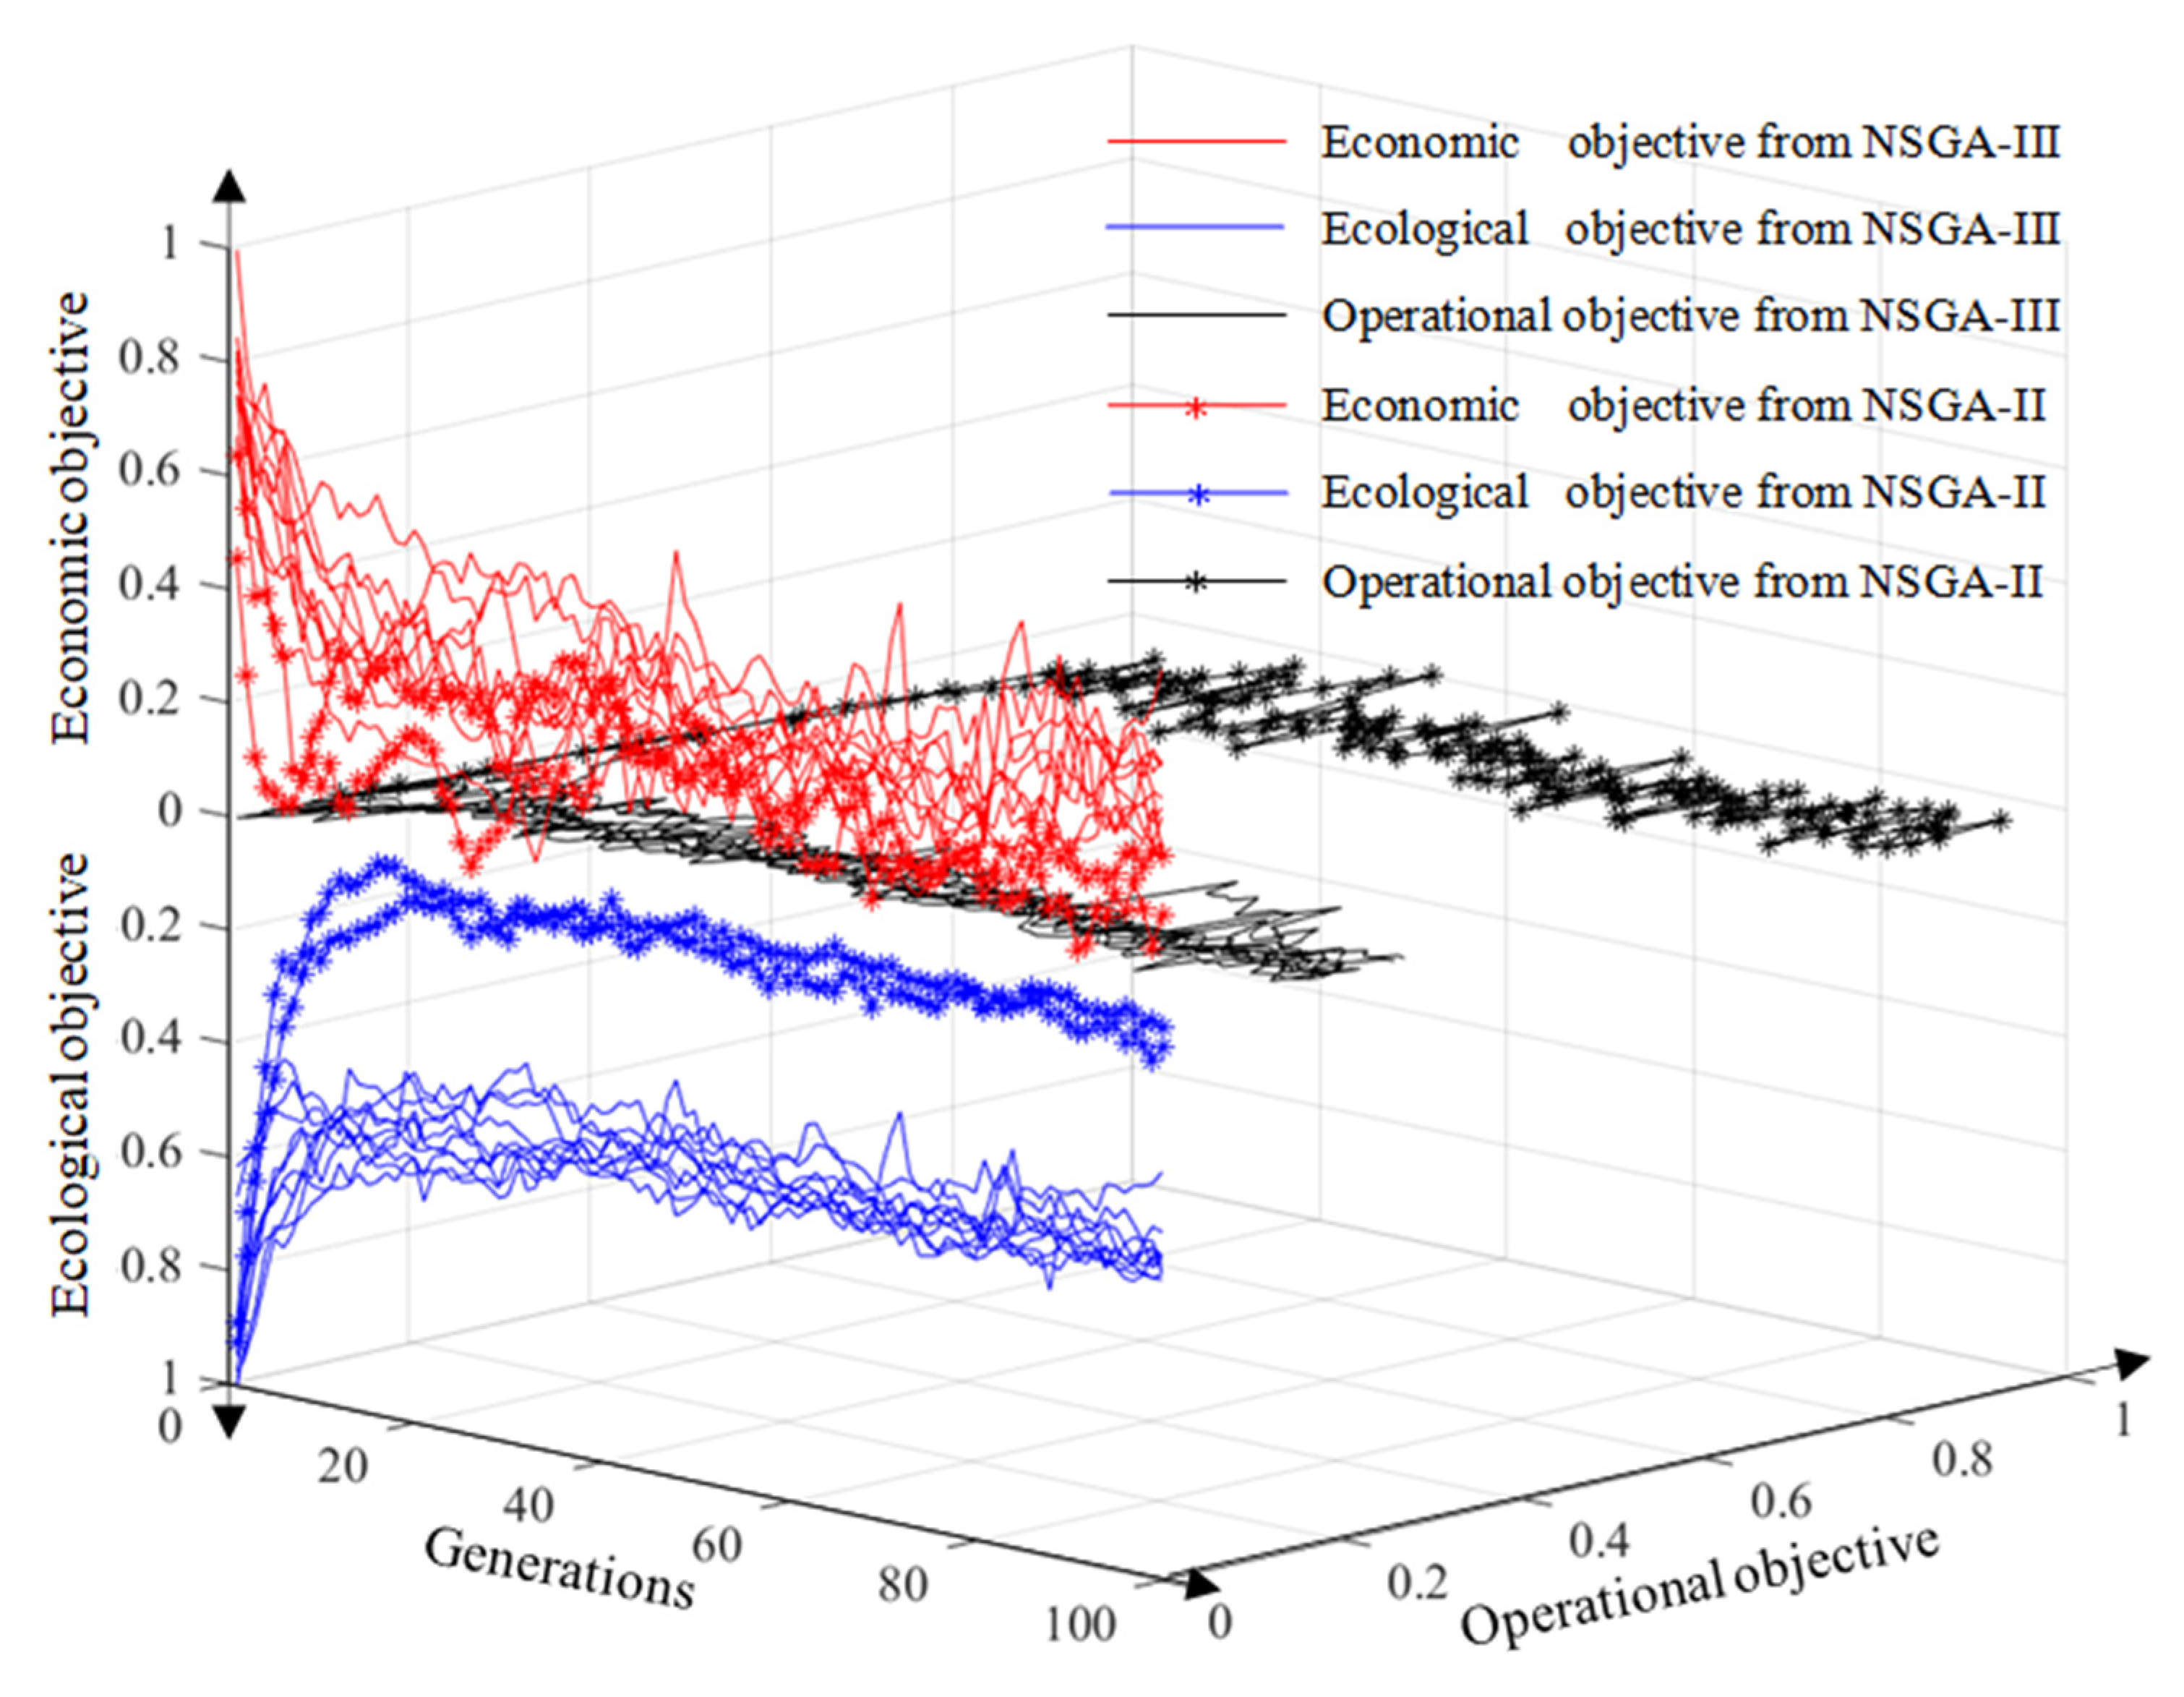
Figure 6.
The optimized decision variable values of SU1 and OP1 obtained by NSGA-II and NSGA-III.

Figure 7.
Distribution of individuals of the initial and last generations; (a) three-dimensional view; (b) two-dimensional view.
Figure 7.
Distribution of individuals of the initial and last generations; (a) three-dimensional view; (b) two-dimensional view.


Table 1.
Values or value ranges of the parameters and decision variables of NSGA-III.
| Parameter | Category | Value/Value Range |
|---|---|---|
| Population size | NSGA-III parameter | 100 |
| Generation size | NSGA-III parameter | 100 |
| Crossover probability | NSGA-III parameter | 0.6 |
| Mutation probability | NSGA-III parameter | 0.1 |
| SU1 tank’s cross-sectional area (m2) | Decision variable | 2000~10,000 |
| SU2 tank’s cross-sectional area (m2) | Decision variable | 2500~20,000 |
| SU1 and SU2 tank’s effective depth (m) | Decision variable | 3~6 |
| IP1 pump station’s capacity (m3/s) | Decision variable | 1~10 |
| IP2 pump station’s capacity (m3/s) | Decision variable | 1~3 |
| OP1 pump station’s capacity (m3/s) | Decision variable | 1~5 |
| Pump station start-up water depth (ratio) | Decision variable | 0.5~0.9 |
Table 2.
Dominant numbers between individuals of the initial and final generations of the NSGA-III runs.
Table 2.
Dominant numbers between individuals of the initial and final generations of the NSGA-III runs.
| Run | Times of Final Individuals Dominated by Initial Individuals | Times of Initial Individuals Dominated by Final Individuals | Run | Times of Final Individuals Dominated by Initial Individuals | Times of Initial Individuals Dominated by Final Individuals |
|---|---|---|---|---|---|
| 1 | 0 | 1091 | 6 | 0 | 589 |
| 2 | 0 | 976 | 7 | 0 | 1171 |
| 3 | 0 | 512 | 8 | 0 | 1040 |
| 4 | 2 | 539 | 9 | 0 | 822 |
| 5 | 0 | 959 | 10 | 0 | 929 |
Table 3.
Comparison of empirically designed schemes and optimal designed schemes.
| Scheme | SU1 (103 m3) | SU2 (103 m3) | IP1 (m3/s) | IP2 (m3/s) | OP1 (m3/s) | OP2 (m3/s) | CC (108 Yuan) | Interception Efficiency (%) | Pump Start-Up Times | ||||
|---|---|---|---|---|---|---|---|---|---|---|---|---|---|
| OM | SM | RE (%) | OM | SM | RE (%) | ||||||||
| Es | 50.00 | 100.00 | 12.00 | 2.00 | 2.00 | 2.50 | 6.32 | 78.78 | 78.98 | 0.25 | 475 | 479 | 0.84 |
| Os 1 | 55.00 | 35.50 | 8.30 | 2.90 | 3.00 | 2.50 | 3.93 | 81.38 | 81.58 | 0.25 | 156 | 158 | 1.28 |
| Os 2 | 55.13 | 10.00 | 8.90 | 2.40 | 2.60 | 2.50 | 3.57 | 81.11 | 80.11 | −1.23 | 158 | 156 | −1.27 |
| Os 3 | 55.85 | 16.67 | 8.90 | 2.70 | 1.30 | 2.50 | 3.80 | 79.52 | 79.62 | 0.13 | 100 | 101 | 1.00 |
| Os 4 | 57.77 | 14.27 | 6.70 | 2.40 | 2.50 | 2.50 | 3.74 | 82.11 | 80.89 | −1.49 | 98 | 96 | −2.04 |
| Os 5 | 47.00 | 16.00 | 7.40 | 2.90 | 2.40 | 2.50 | 3.44 | 79.88 | 79.48 | −0.50 | 145 | 145 | 0.00 |
| Os 6 | 49.41 | 10.35 | 7.30 | 2.70 | 1.70 | 2.50 | 3.25 | 81.42 | 79.83 | −1.95 | 155 | 157 | 1.29 |
| Os 7 | 51.40 | 27.78 | 8.80 | 2.70 | 2.40 | 2.50 | 4.13 | 82.66 | 81.27 | −1.68 | 182 | 185 | 1.65 |
| Os 8 | 49.74 | 27.63 | 6.20 | 2.50 | 2.50 | 2.50 | 3.94 | 81.31 | 80.18 | −1.39 | 163 | 160 | −1.84 |
| Os 9 | 43.00 | 17.00 | 7.80 | 2.50 | 2.30 | 2.50 | 3.32 | 81.33 | 80.05 | −1.57 | 164 | 165 | 0.61 |
| Os 10 | 50.00 | 10.00 | 8.50 | 2.60 | 2.00 | 2.50 | 3.29 | 79.97 | 80.30 | 0.41 | 190 | 191 | 0.53 |
Note: CC—construction cost, OM—original model, SM—simplified model, RE—relative error.
Table 4.
Comparison of the storage volume utilization of empirically and optimal designed schemes.
| Scheme | Storage Tank | Volume (103 m3) | Average Volume Used (103 m3) | Average Volume Utilization (%) | Maximum Volume Used (103 m3) | Maximum Volume Utilization (%) |
|---|---|---|---|---|---|---|
| Es | SU1 | 50.00 | 13.50 | 27.00 | 48.25 | 95.50 |
| SU2 | 100.00 | 5.00 | 5.00 | 64.13 | 64.13 | |
| Os 1 | SU1 | 55.00 | 15.72 | 28.58 | 54.51 | 99.10 |
| SU2 | 35.50 | 3.24 | 9.13 | 34.88 | 98.26 | |
| Os 2 | SU1 | 55.13 | 17.85 | 32.38 | 54.15 | 98.22 |
| SU2 | 10.00 | 1.06 | 10.60 | 9.82 | 98.20 | |
| Os 3 | SU1 | 55.85 | 11.52 | 20.63 | 55.29 | 99.00 |
| SU2 | 16.67 | 0.785 | 4.71 | 16.47 | 98.80 | |
| Os 4 | SU1 | 57.77 | 12.58 | 21.78 | 57.19 | 99.00 |
| SU2 | 14.27 | 0.86 | 6.03 | 14.11 | 98.88 | |
| Os 5 | SU1 | 47.00 | 13.44 | 28.60 | 46.60 | 98.00 |
| SU2 | 16.00 | 1.13 | 7.06 | 15.78 | 98.62 | |
| Os 6 | SU1 | 49.97 | 15.56 | 31.14 | 49.59 | 99.24 |
| SU2 | 10.35 | 0.867 | 8.36 | 10.13 | 97.90 | |
| Os 7 | SU1 | 51.40 | 13.91 | 27.06 | 51.26 | 99.73 |
| SU2 | 27.78 | 1.57 | 5.65 | 27.68 | 99.64 | |
| Os 8 | SU1 | 49.74 | 16.88 | 21.17 | 49.57 | 99.66 |
| SU2 | 27.63 | 1.79 | 6.48 | 27.53 | 99.64 | |
| Os 9 | SU1 | 43.00 | 11.86 | 27.58 | 42.73 | 99.37 |
| SU2 | 17.00 | 1.22 | 7.18 | 16.65 | 97.94 | |
| Os 10 | SU1 | 50.00 | 13.39 | 26.78 | 49.79 | 99.58 |
| SU2 | 10.00 | 0.68 | 6.80 | 9.88 | 98.80 |
Publisher’s Note: MDPI stays neutral with regard to jurisdictional claims in published maps and institutional affiliations. |
© 2021 by the authors. Licensee MDPI, Basel, Switzerland. This article is an open access article distributed under the terms and conditions of the Creative Commons Attribution (CC BY) license (https://creativecommons.org/licenses/by/4.0/).
Share and Cite
MDPI and ACS Style
Peng, Z.; Jin, X.; Sang, W.; Zhang, X. Optimal Design of Combined Sewer Overflows Interception Facilities Based on the NSGA-III Algorithm. Water 2021, 13, 3440. https://doi.org/10.3390/w13233440
AMA Style
Peng Z, Jin X, Sang W, Zhang X. Optimal Design of Combined Sewer Overflows Interception Facilities Based on the NSGA-III Algorithm. Water. 2021; 13(23):3440. https://doi.org/10.3390/w13233440
Chicago/Turabian StylePeng, Zhouyang, Xi Jin, Wenjiao Sang, and Xiangling Zhang. 2021. "Optimal Design of Combined Sewer Overflows Interception Facilities Based on the NSGA-III Algorithm" Water 13, no. 23: 3440. https://doi.org/10.3390/w13233440
Note that from the first issue of 2016, this journal uses article numbers instead of page numbers. See further details here.