
Key Drivers Influencing the Presence and Absence of Micropterus salmoides and Their Effect on Native Fish Communities and Biotic Integrity


Department of Bioscience and Biotechnology, Chungnam National University, Daejeon 34134, Korea
*
Author to whom correspondence should be addressed.
†
Indicates equal author contributions.
Water 2021, 13(23), 3430; https://doi.org/10.3390/w13233430
Submission received: 6 August 2021
/
Revised: 29 November 2021
/
Accepted: 1 December 2021
/
Published: 3 December 2021
(This article belongs to the Section Biodiversity and Functionality of Aquatic Ecosystems)
Abstract
:Invasive alien fish species (IAFS) influence recipient ecosystems in multiple ways, from altered native fish communities to poor ecological health and higher economic losses to control and eradication. We tested key drivers and connections between an IAFS (Micropterus salmoides) presence, absence, geomorphological, hydro-chemical, physical habitat, native fish assemblages, and large river basins biotic integrity during 2016–2019. A total number of 62,121 individuals (TNI) representing 74 fish species were observed, out of which 68 species (45,677 TNI) belonged to the Geum River (GR) basin, while 63 species (16,444 TNI) were from the Mankyong/Dongjin River (MDR) basin. The results illustrated a significant contrast based on stream order, catchment area, altitude, stream gradient, and width among the sites with and without largemouth bass. However, fluctuations in nutrients (nitrogen and phosphorus) were not affected by variations in pH, dissolved oxygen, conductivity, suspended solids, and river flow. The largemouth bass has emerged as the 8th largest fish population in the GR and swiftly occupies the MDR basin with a constancy value of 45.5. Native sensitive (r = −0.38), insectivore (r = −0.252), carnivores (r = −0.085), and TNI (r = −0.512) displayed a negative correlation with increasing largemouth bass abundance. Largemouth bass induced significant regime transformation in the carnivore species. A significant difference (p < 0.01) of biotic integrity was illustrated among the largemouth bass population sites. A conspicuous interplay between ‘poor’ ecological health (r = 0.33, p = 0.038, n = 41) sites and ‘fair–excellent’ (r = −0.38, p < 0.001, n = 622) sites as compared to the overall ecological health linked with largemouth bass abundance (r = −0.397, p < 0.001, n = 663) alluded to stronger impact of the IAFS. In conclusion, the largemouth bass has potentially altered the native fish assemblage and ecological health. Further, we conclude that rapidly shifting flow patterns supported by the expanding anthropogenic interventions (weirs and dam) are the most approving factors of impending fish invasions.
1. Introduction
Among the perpetually harmful anthropic actions against nature, the introduction of exotic species and concomitant biological invasions are continuously jeopardizing the local, regional, and global ecological systems [1,2,3]. Such introductions, translocations, and biological invasions are the major adversities that have affected conservation efforts and environmental integrity as invasive alien species (IAS) actively compete for space and food [4,5]. IAS is a widespread and universally shared crisis of the 21st century [6], endangering livelihoods, biodiversity, and environmental sustainability [7].
Likewise, freshwater invasive alien fish species (IAFS) recently have emerged as a significant threat to freshwater ecology, biodiversity, economy, and integrity at local to global scale [8,9]. Most importantly, the increasingly rapid spread and establishment of non-native fish species (NNFS) outside their native ranges is a pervasive threat to the native fish biodiversity, habitat, water quality, and overall ecological health [2,6,10]. Moreover, unwarranted anthropogenic activities reinforce the community-level changes through water quality deterioration, habitat degradation, and landscape-wide ecological disruptions facilitating the quick establishment of NNFS and outcompeting the native fish populations [11,12]. Apart from a globally shared concern, the other reasons for increasing investigations into alien species include the multiple impacts on species to ecosystem ecology, economic losses, and biodiversity conservation [13]. Anthropogenic disruptions are critical to limiting the native fish species and favoring the invasive species [12,14,15].
Largemouth bass (Micropterus salmoides) is one of the worst and globally acknowledged IAFS originating from North America [16] and is listed by IUCN as one of the 100 worst IAS worldwide. Reports show their presence either as introduced or established all over the world, including Europe [17], Asia [18,19], and Africa [20]. It is causing severe damage to the native fish fauna, habitat, community composition, and the ecosystem at large since it was introduced [2,21].
The impacts of IAFS, such as largemouth bass, on the invaded ecosystems could be classified as genetic, individual, population, community, and ecosystem-level [22,23]. Other significant ecological damages include predation of native species, reduced abundance, community disturbance, and an overall decline of native populations [2,5,24]. For instance, the Cichlids extinction was influenced by the invasion of Nile Perch [25,26,27]. Similarly, largemouth bass’s higher predation can be highly damaging, leading to an overall decline in native biodiversity, endangered and threatened species. Furthermore, it affects the whole ecosystem, from algae and primary producers to the top of the trophic cascade [25]. Therefore, it must be explored for its large-scale impacts on the fish biodiversity in rivers, streams, and combined river basins and the key factors that could aid in its spread and establishment into unexplored areas.
The devastating impacts of IAFS can be determined by analyzing their distribution range (R), abundance (A), and effects per individual or biomass (E) [28]. According to Dick et al. [29], the impact per individual of the invasive species can be characterized by a functional response. Moreover, some studies show that largemouth bass has a higher effect than native predators in the invaded area [30]. Although it is a piscivorous fish species, it has demonstrated high trophic plasticity, such as eating crustaceans and insects [21,31,32]. Therefore, identifying other factors that affect or facilitate the distribution and abundance of IAFS is equally essential to consider the ecological impacts. Furthermore, it is a widely studied fish species in its native range, providing details applicable in other parts of the world [33].
Largemouth bass prefers lentic ecosystems, such as reservoirs and lakes [17,34], but it has also been reported in streams, which has led to adverse effects on native fish assemblages [19,20,24]. However, it has also been reported from the connected tributaries of the main river channel introduced [24]. Unlike the lentic system, the lotic ecosystems are controlled by the dynamic longitudinal gradient of multiple environmental factors upstream to downstream [35]. Therefore, the largemouth bass distribution and abundance could fluctuate depending on the longitudinal gradient and variations in the invaded ecosystem’s environmental factors [36,37].
One of the notable factors influencing the distribution of largemouth bass in the lotic ecosystems is the stream or river flow. However, measuring the current velocity is a lengthy and cumbersome process owing to low efficiency and water velocity fluctuations within microhabitats. Under these circumstances, characteristics such as the altitude, basin area, and gradient of the stream channel may well explain the distribution tendencies of IAS. The key factors that control the environmental streamflow are the overall current velocity, substrate characteristics, sediment transportation, and ecosystem extent [38,39]. Some studies show that the ichthyo-faunal zonation is distinguished by the elevation and stream gradient [40,41,42]. However, studies illustrating the interactions between trophic and tolerance guilds, the overall ecological health of riverine fish assemblages, and invaded habitat are relatively scarce. Such a multi-level study deciphering the variety of impacts of invasions could help clarify how strong invaders are altering the recipient ecosystems and help predict invaders, hotspots, and consequences.
By considering the details above, we targeted two different large river watersheds to explore the dynamics of largemouth bass presence and absence. We investigated (i) the effect of the presence and absence of largemouth bass on the native fish assemblages and the study sites in context to the largemouth bass presence and vice versa. Further, we explored various (ii) factors that could impact the distribution of largemouth bass in the lotic ecosystems; (iii) checked if environmental disturbance could have facilitated the species, and (iv) tried to identify its impact on the trophic and tolerance assemblages of the native fish community. Furthermore, (v) we investigated the effect of largemouth bass on overall ecological health assessment based on the biotic integrity index (IBI).
2. Materials and Methods
2.1. Study Area
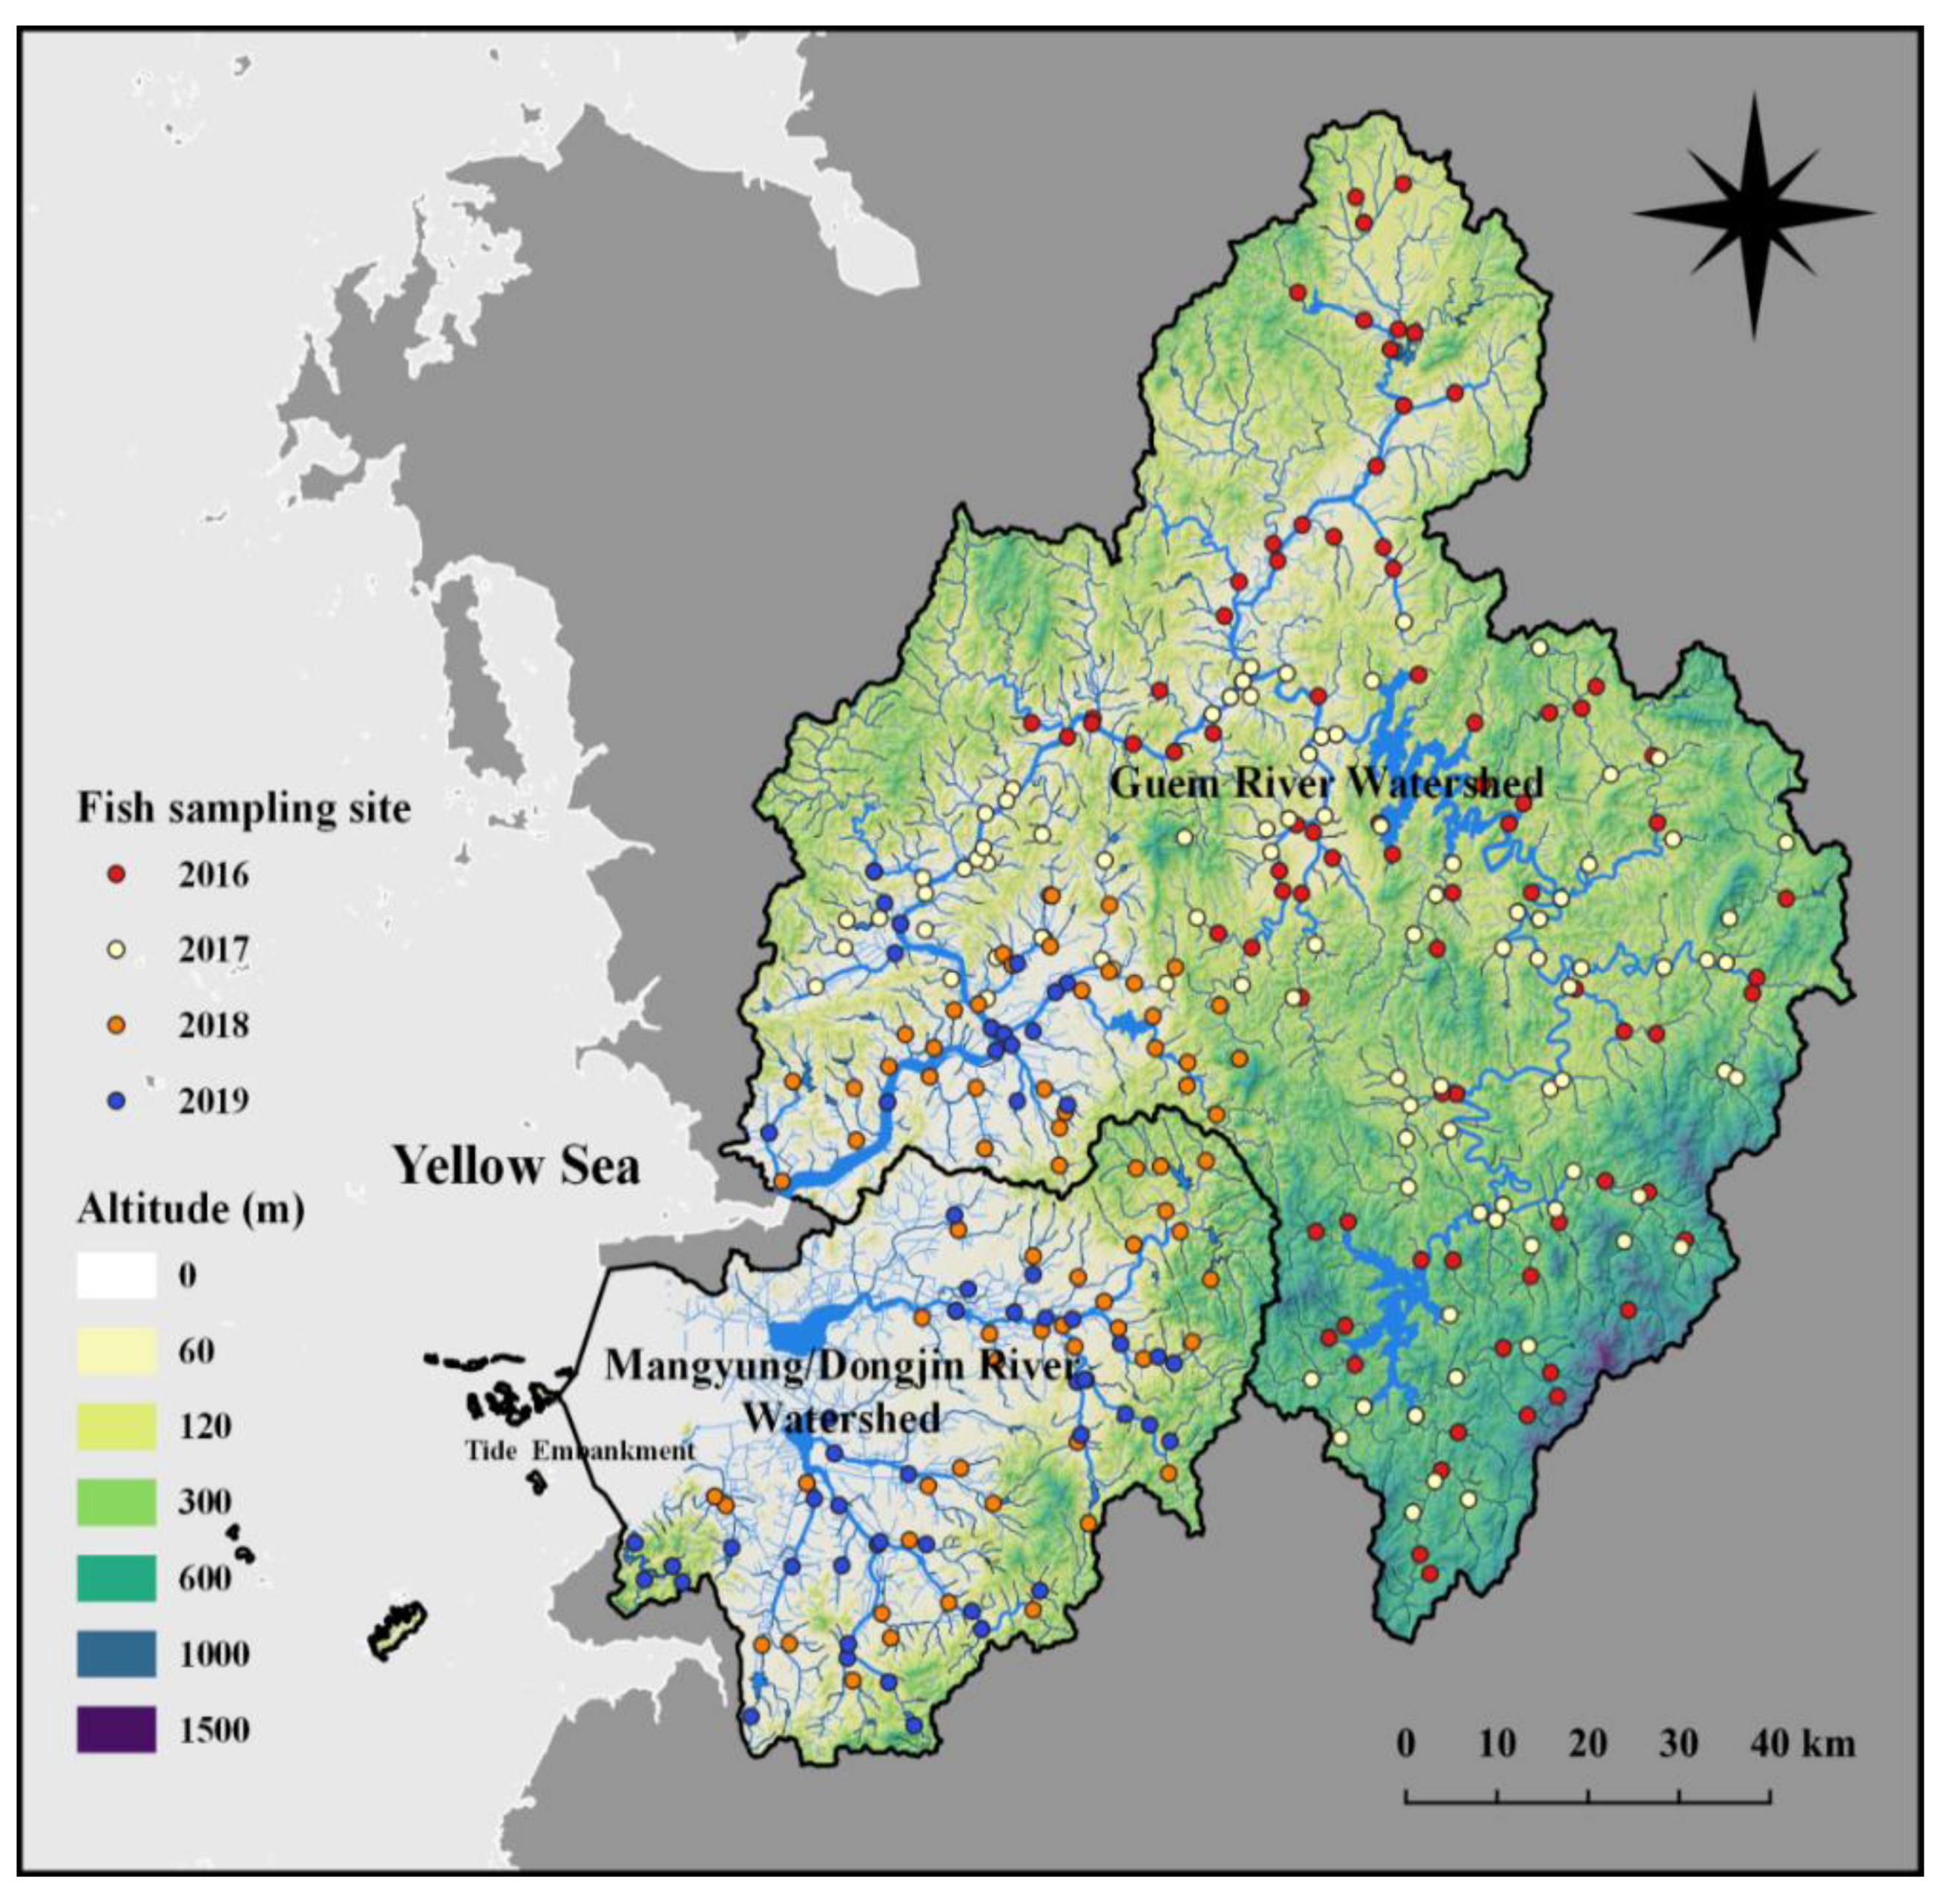
This study was performed in three large river watersheds: (1) the Geum River (GR) watershed, which is Korea’s third-largest river of 394.79 km of river length and 9912.15 km2 of basin area, (2) the Mankyeong River watershed, 80.86 km of river length and 1504.35 km2 of basin area and (3) Dongjin River watershed, 44.7 km of river length and 1034 km2. We studied the Mankyong and Dongjin rivers together (Mankyeong/Dongjin rivers: MDR), as they share the same watershed. These watersheds are mainly part of the 3rd largest water river watershed in South Korea, characterized by intensive anthropogenic activities. The GR’s middle and upper zones are at higher altitudes in the mountainous regions, providing diverse habitat types. Two large artificial reservoirs, viz. Yongdam Dam and Daecheong Dam, are built on the Geum River’s mainstream channel, necessitating several weirs. This river is fed by various tributaries that flow through different urban, agricultural, and mountainous landscapes. However, the MDR mostly flow through the plain farmland regions, except for upstream (Figure 1).
2.2. Geographical Distribution of Fish Sampling Sites
301 sites were examined for fish sampling at 224 locations in the GR watershed, while 77 were in the MDR. The fish biodiversity survey was conducted twice per year from 2016 to 2019 before and after the monsoon months (July–August). The study surveyed 102 sites in 2016, 98 sites in 2017, and 79 stations in 2018. In 2019, a survey was conducted on 16 locations of GR and 34 points of MDR. Of the 34 sites, two or three overlapping surveys were conducted over two to three years. All the study sites are part of national-level fish biomonitoring study sites designated by the Korean Ministry of Environment, South Korea.
In this study, we selected the salient geographical factors such as basin area, elevation, and gradient as the primary factors that could help determine the characteristics of the stream’s various physical environments. Each survey point’s corresponding location was calculated using the Korean Ministry of Environment information in the catchment area. For altitude, the calculation was performed using QGIS, an open-source geographic information system, using the 30 m resolution Digital Elevation Model (DEM) provided by the National Aeronautics & Space Administration (NASA). The gradient was calculated using the previously prepared DEM and QGIS programs. The gradient calculation included several upstream and downstream reaches around the survey point and set up segments that better reflect the area’s waterways characteristics. The altitude of the upper and lower ends of the component was subtracted and divided by the length of the set segments to represent the ratio (%). For calculating gradient using DEM, the size of segments was usually set at 1 km for first and second order streams, five km for third and fourth order streams, and five km to 10 km for fifth and sixth order streams, as the effects of the errors of the DEM [43] vary depending on the degree of slope and stream size [44,45]. Considering the environment of the survey interval, the length setting of the segments slightly deviated.
2.3. Fish Sampling
The fish survey was conducted per the Korean Ministry of Environment (MOE) guidelines, based on the catch per unit effort (CPEU). The sampling method is based on the wading method proffered by Ohio EPA [46] and the Rapid Bioassessment Protocol (RBP) of Barbour et al. [47]. Among the fishing gears, we used the casting net (5 × 5 mm) and kick net (5 × 5 mm) to examine a 200 m stretch, covering 100 m upstream and downstream of each study site. Each sampling effort was accomplished for 10–15 times with the help of a casting net for 30 minutes, and with the help of a kicking net for more than 50 minutes. We also adjusted the sampling strategy depending on the stream’s size or the weather conditions on the sampling day. All the fish data acquired based on CPUE was then used to characterize the stream ecological health based on IBI, developed for the Korean streams and rivers. However, the dataset used in the present study were mainly extracted from the IBI data. It is essential to mention that we have not used the fish abundance data directly in this study, and the fish analyses are mainly based on the largemouth bass presence and absence data.
2.4. Chemical Water Quality Analysis
The physicochemical water quality data set was procured from the MOE South Korea, which collects it regularly every month. The electrical conductivity (EC) was determined using a portable multi-parameter analyzer (YSI Sonde Model 6600, YSI Incorporated, Yellow Springs, OH, USA). Total phosphorus (TP), total nitrogen (TN), biological oxygen demand (BOD), chemical oxygen demand (COD), and total suspended solids (TSS) were estimated by the standard testing protocol approved by the MOE, South Korea. The chlorophyll-a (Chl-a) concentration was assessed in the field with a multiprobe instrument (YSI Sonde 6600, Environmental Monitoring System, Yellow Springs, OH, USA). The nutrients (TN, TP), and allied chemical parameters were estimated in triplicates, while the estimation of BOD was performed in duplicates.
2.5. Physical Habitat Evaluation
The physical condition and habitat investigation are based on the qualitative habitat evaluation index (QHEI). QHEI has been used extensively to evaluate the physical health of the riverine channel habitat. It was primarily developed by Plafkin et al. [48], and later modified by Barbour et al. [47]. Kim and An [49] complimented it for its applications in the South Korean riverine and stream channels in South Korea. The QHEI is composed of 11 metrics covering all the main aspects of the riverine habitat. The eleven metrics are: M1: Substrate/Instream cover, M2: Embeddedness, M3: Flow velocity/depth combination, M4: Bottom scouring and sediment deposition, M5: Channel flow status, M6: Channel alteration, M7: Frequency of riffles or bends, M8: Bank stability, M9: Bank vegetative protection, M10: Riparian vegetative zone width, M11: Dam construction impact. Each metric maximum allocated score was 20, where the final output of the index was designated after the sum of all the 11 metrics. The scores finally provided a snapshot of the physical health of study sites based on the QHEI total score. The final QHEI score guided us to classify the study sites based on their physical health, and the physical health ranges were termed as excellent (182–220), good (124–168), fair (64–110), or poor (8–52).
2.6. Ecological Health Assessment
We evaluated the ecological health of the two watersheds using the index of biotic integrity (IBI) developed by Karr [50]. We compared the impacts of largemouth bass presence and absence on the ecological integrity of the native fish communities. The IBI consisted of eight metrics mainly comprised of three key categories: species richness and composition, the trophic and tolerance assemblages, and the fish abundance. The first set of metrics represented the ecological indicator (M1–M4), reflecting upon the component characteristics of fish communities. The second category covered the trophic level composition (M5–M6), while the third set (M7–M8) mainly reflected the fish’s physical health and abundance. The metrics (M) details and their scoring criteria are shown in the IBI table. Each metric was ascribed a score of 5, 3, or 1 according to the type and characteristic of the fish community it symbolized. The summation of all the metrics scores obtained guided to materializing the outcome as the final IBI score that later represented the biological integrity classes. The biotic integrity classes and their ranges based on IBI scores are: excellent (36–40), good (28–34), fair (20–26), poor (14–18) and very poor (8–13).
2.7. Statistical Analyses
All the data were checked for normality by the Kolmogorov–Smirnov normality test before performing log transformations and employing further statistical analyses. We used the principal component analysis (PCA) to see the data dimensions and interactions between water quality parameters, physical habitat, hydrogeological aspects, and fish assemblages. We also used the t-test to test the significance of difference based on largemouth bass presence and absence in the study sites, and Spearman’s correlation was also calculated. We used the PAST software (ver. 3.18) to perform the dimensional analysis (PCA), while SigmaPlot (v. 12.5) was used to prepare the illustrations and linear relationships.
3. Results
3.1. Geomorphological Characteristic and Largemouth Bass
All geomorphological variables (stream order, catchment area, altitude, stream gradient, and stream width) indicated a statistically significant difference (p < 0.01) between study sites based on the presence and absence of largemouth bass (Table 1). The average values of geomorphological stream variables were higher in sites with bass presence. The largemouth bass preferred sites with smaller catchment areas (log-transformed catchment area 0.5~1.5) to those with greater extent (log-transformed catchment area 3.0~4.0). In contrast, largemouth bass displayed negative correlations with altitude (−0.351) and stream gradient (−0.462) variables, showing fewer chances of largemouth bass at higher altitudes.
The relative abundance (RA) of largemouth bass increased with the catchment area (Figure 2a). The stream gradient also indicated a tendency similar to altitude in largemouth bass’s occurrence and RA (Figure 2c). The average value of the stream gradient in the sites with largemouth bass presence was lower than in the absence sites. The distribution of the largemouth bass was restricted in streams with a gradient of 0.5 or higher, regardless of the degree of weir impact. In contrast, the RA of largemouth bass tended to show higher values from 0.1% or lower in the low weir impact and then gradually decreased to 0.5%. The RA of the largemouth bass represented a statistically significant linear and monotonic correlation with the gradient. Stream gradient was significantly related to the RA of largemouth bass by negative exponential function (R2 = 0.23, p < 0.0001, n = 340). The major distribution of the largemouth bass was limited to below 100 m altitude (Figure 2b). Although the RA of largemouth bass indicated dominance at an altitude of 20 m, the maximum RA value decreased at 100 m as the altitude increased. In contrast, altitude displayed significant relationship with largemouth bass abundance with a negative exponential function (R2 = 0.28, p < 0.0001, n = 340).
3.2. Hydro-Chemical Factors and Largemouth Bass Distribution
The chemical (BOD, COD), nutrient (Chl-a, CHL:TP), and organic matter (TOC) indicators, and maximum summer temperature showed highly significant (p < 0.01) impact on the distribution and presence of largemouth bass in the river basins (Table 1), indicating a statistically significant correlation with the RA of largemouth bass. The TSS and EC exhibited similar trends with a resembling effect on largemouth bass presence and absence. For instance, the mean TSS value was 10.6 mg/L at the sites with bass presence and a statistically significant difference compared to the 8.1 mg/L at the bass absence sites. Similarly, the average EC value was 306.3 mS/cm in the locations where the largemouth bass appeared and significantly higher than the places where the bass was absent. However, a significant but monotonic correlation was revealed by the Spearman’s analysis. The mean values of Chl-a and CHL/TP were also higher at the sites where the largemouth bass was detected, indicating a positive correlation with the RA of the largemouth bass. We also measured a higher mean water flow in the sites with largemouth bass presence.
3.3. Habitat Quality and Largemouth Bass
The QHEI was applied to evaluate links between the presence and absence of largemouth bass and the river sites’ geomorphological features and to determine the habitat quality. The substrate was characterized as the epifaunal substrate in terms of available cover, pool substrate categorization, water velocity and depth combination, pool variability, frequency of riffles, channel sinuosity, and vegetation-assisted riverbank protection. However, the riparian zone width was significantly higher in the study sites without largemouth bass and negatively correlated with the bass abundance (Table 2).
Among the 11 QHEI metrics, the mean difference in bank stability among study sites with bass presence and absence was also significant, nevertheless, with a bit of contrast. However, metrics denoting embeddedness, sediment deposition, and weir effect indicated a decline in the overall habitat quality. It showed a higher mean value in the bass’s presence and a significant positive correlation. The mean value of channel flow status was higher in the sites with bass presence, indicating a significant correlation.
3.4. Relationship between Weir Impacts and Largemouth Bass
The overall RA of largemouth bass identified substantial damming impacts facilitating largemouth bass wherever the large weirs are present (Table 2, Figure 3). The study sites with higher and lower effects of weirs indicated an overall disparity between the fish community structure. At sites with a logarithmic basin area of 1.5 or less, the mean relative abundance of the largemouth bass was close to zero in most study sites, even if the weir’s impact was low. Nevertheless, if the weir’s effect was high, several sites with an RA of more than 10% and extreme values showed an RA in the range of 20% to 80%. In the logarithmic catchment area between 1.5 and 2.5, a relatively higher RA of the largemouth bass was observed with increasing impacts of the weir. In contrast, in the logarithmic catchment area of 2.5 or higher, the RA of largemouth bass near 0% was rare in most study sites designated with a higher weir impact (Figure 3a).
The largemouth bass was absent at altitudes above 100 m, regardless of the weir’s impact; therefore, the difference between high and low weir impact was insignificant (Figure 2b). However, at altitudes below 100 m, there were statistically significant differences depending on the intensity of the weir’s impact (Figure 3b). At a gradient of more than 0.5%, there was no significant difference in the RA of largemouth bass, depending on the weir’s impact (Figure 3c). However, within the range of 0.1% to 0.5% gradient, the largemouth bass RA was 0%. The number of largemouth bass increased significantly under the increasing effect of weirs. At the gradient of less than 0.1%, the abundance of largemouth bass was generally high. However, it significantly corroborated with the weir’s effect. However, largemouth bass rarely occurred in the sites with low weir impact, particularly in the smaller catchments (near log-transformed catchment area 1.0). Most of the variables, including the catchment area, showed a significant positive linear and monotonic correlation with the RA of largemouth bass (Table 1).
3.5. Occurrence and Impact of Largemouth Bass on Native Fish Communities
Table 3 presents the classification of fish species examined from the GR and MDR basins as fish individuals and percent RA. Moreover, the fish species were classified according to their origins (native or exotic), feeding preferences (omnivorous, insectivorous, carnivorous), tolerance guild (sensitive, tolerant, and intermediate), TNI, and presence sites. Overall, the 664 sampling events performed at 303 locations revealed 74 species, 62,121 TNI, with 68 and 63 fish species in GR and MDR, respectively. However, the disparity among the river basins based on TNI was roughly three times higher in the GR basin, which resembled the extent of the watershed.
At 138 (45.54% constancy value) locations, the increasing appearance of largemouth bass alluded to its prolific spread and presence as an ecosystem disturbing fish species. Based on study sites and constancy value, the largemouth bass ranked 8th and the 11th highest species according to percent RA. However, it occurred at considerably elevated RA% in the MDR basin as contrasted to the GR basin. We sampled 493 (3.0 RA%) largemouth bass individuals from the MDR basin, while 801 (1.8 RA%) fish individuals were recorded from the GR basin with a nearly three times larger basin area. It is essential to mention that among the top 33 fish species (with RA% equal to or higher than 0.5%) sampled during this investigation, there was another exotic fish (Bluegill: Lepomis macrochirus), which is frequently sampled with largemouth bass and occupied the 14th spot based on overall relative abundance. However, this study mainly deals with largemouth bass only; therefore, bluegill’s impact is not part of this study. Itis important to mention that we have studied the combined impact of largemouth bass and bluegill in our recent publication on the four major rivers in South Korea [3]. Therefore, we believe that providing a comparative account of both species would not add any significant details in this paper. Furthermore, we trimmed off the fish species table (Table 3) and retained only those with an RA% more than or equal to 0.5 % due to there being many fish species.
3.6. Native vs. Native’ and Largemouth Bass Abundance and Constancy
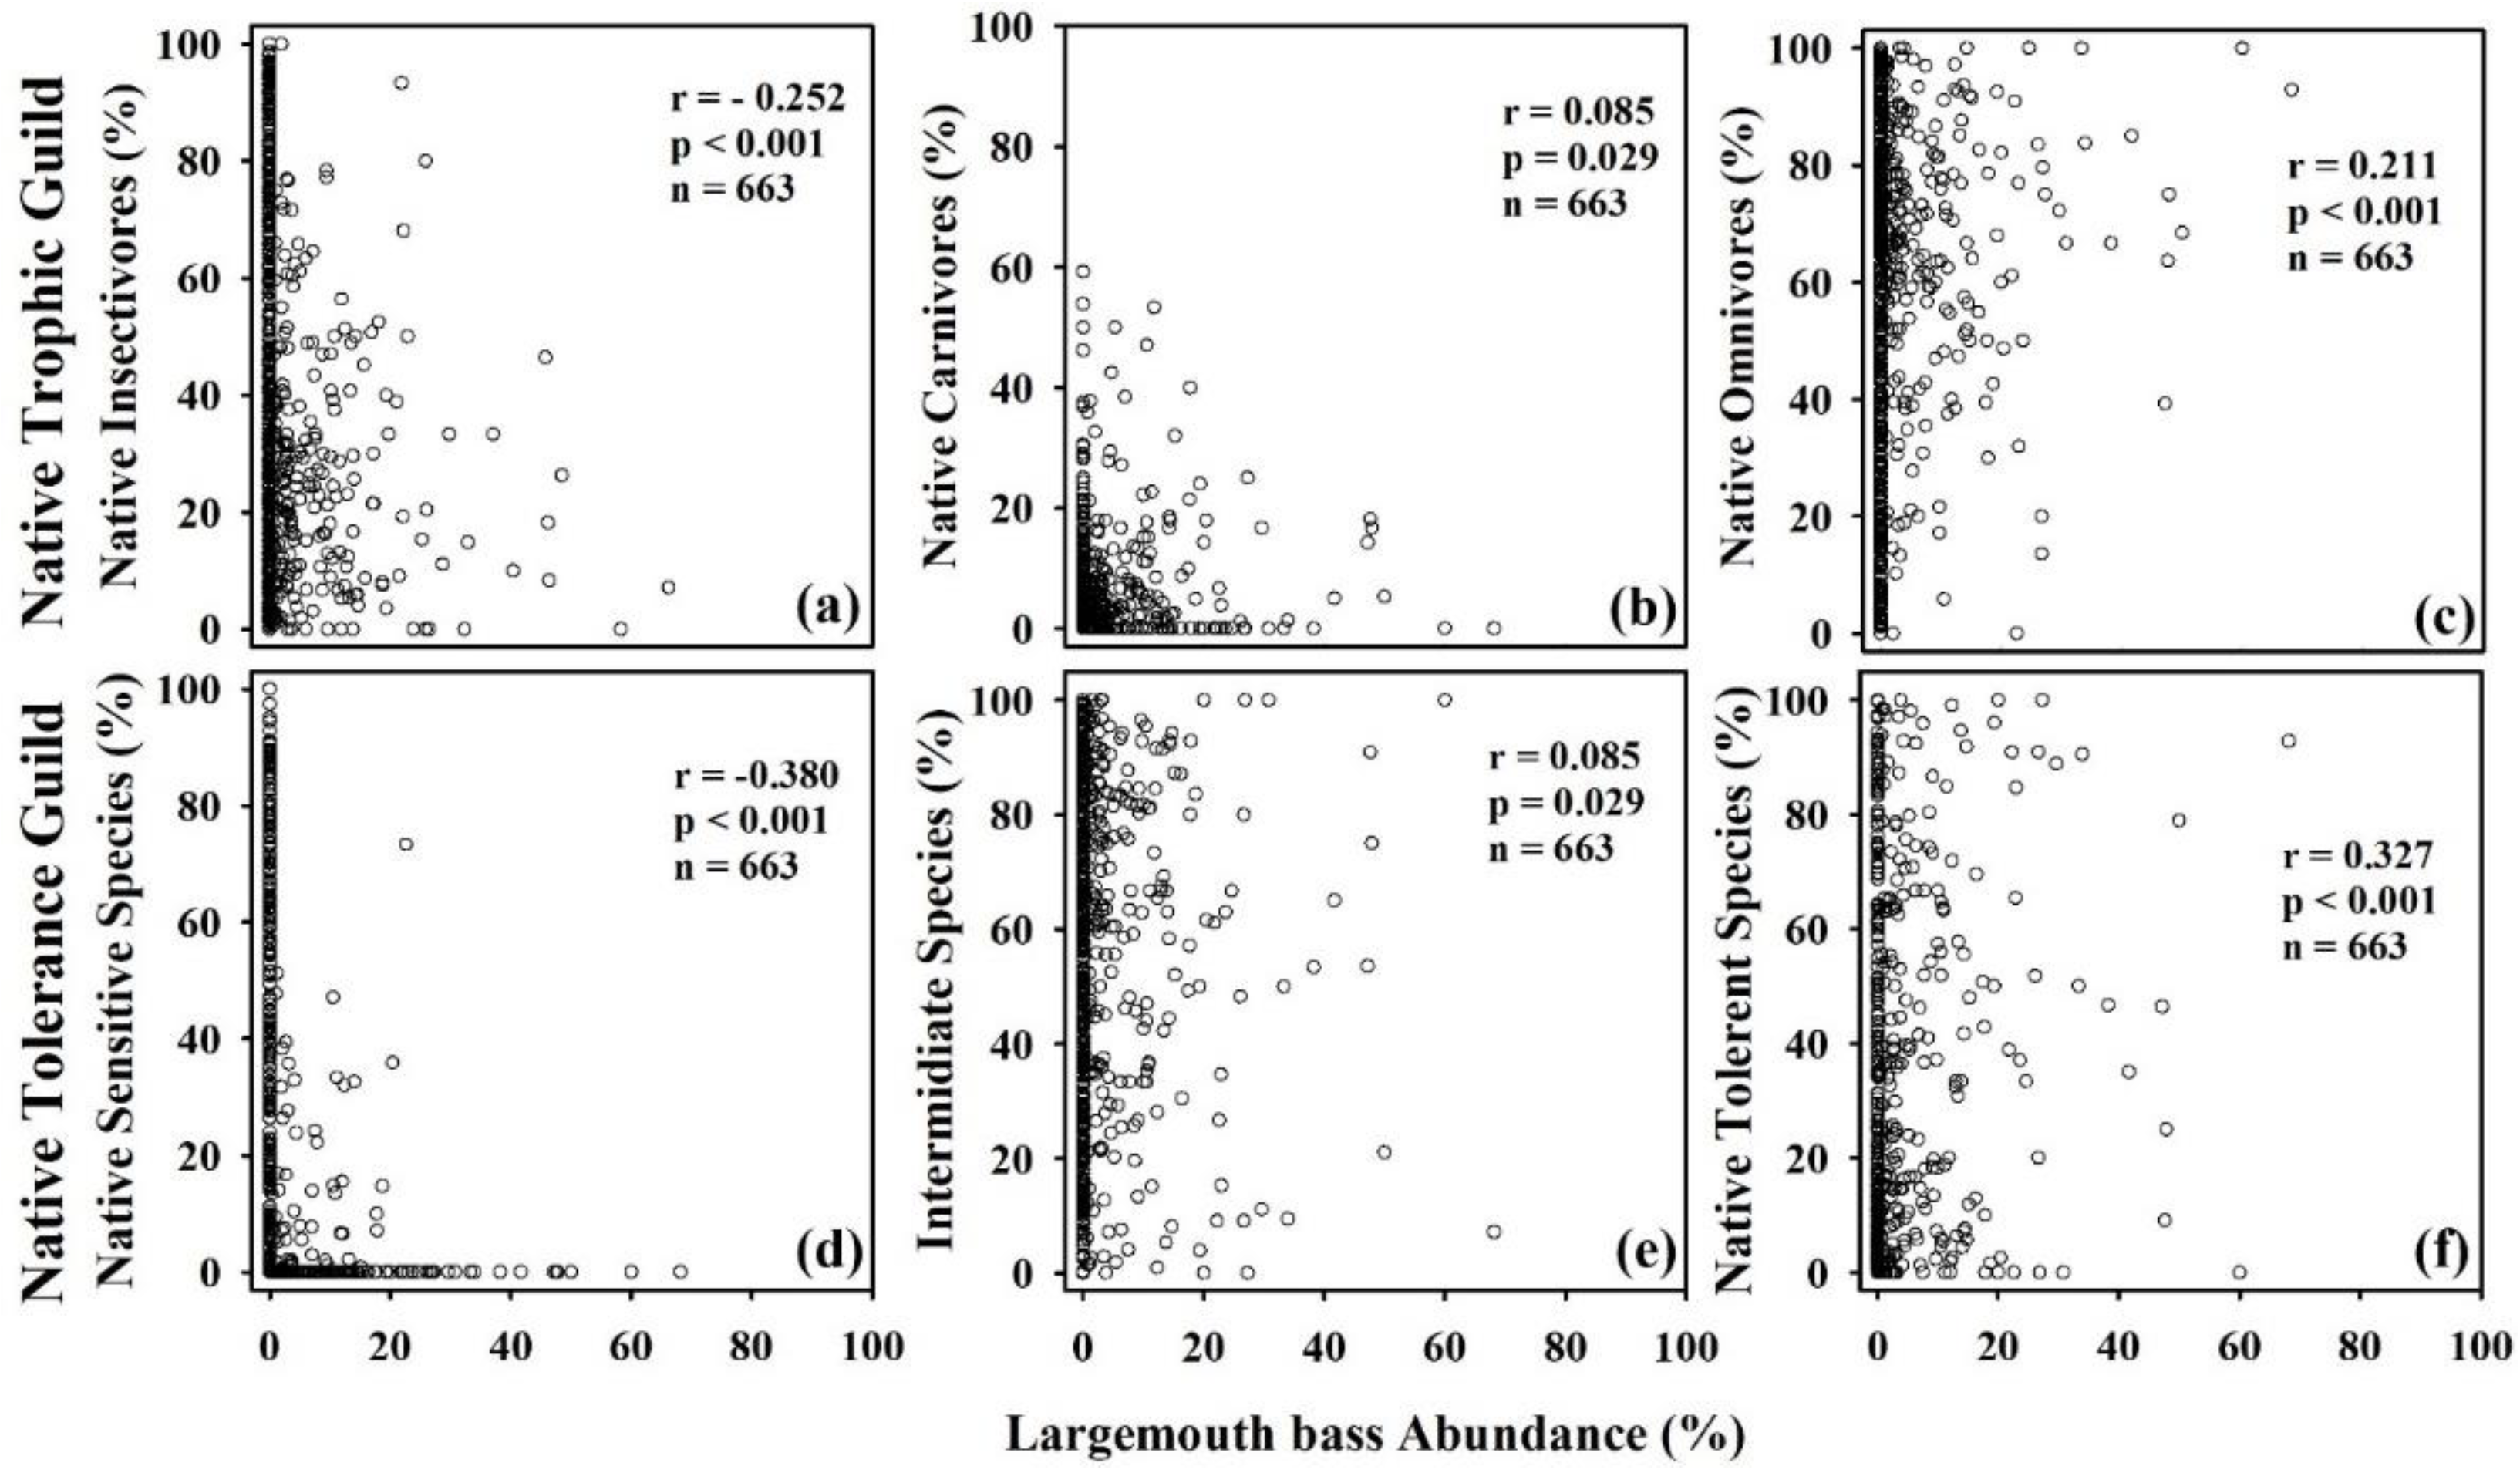
The RA% of largemouth bass showed a significant negative relationship (r = 0.512, p < 0.001, n = 232) with the TNI, indicating a high monotonic correlation. The native individuals sampled from all study locations (n = 634) displayed a weak negative association with the proportion of native insectivores (Figure 4). On the other hand, there was a strong negative decline (r = −0.53, p < 0.001, n = 479) in the proportion of native carnivores linked with the increasing presence of largemouth bass in both river basins. We also plotted the native fish species trophic and tolerance guilds against the RA% of the largemouth bass, and the illustrations are presented in Figure 5. The proportion of native carnivorous species displayed a moderately negative correlation (r = −0.327, p < 0.001, n = 663) with the RA% of largemouth bass. Similarly, the native sensitive species and native insectivorous fish species showed a declining tendency with a moderately weak association with the largemouth bass abundance.
The largemouth bass were sampled from 138 of the 303 sampling points, representing a constancy value of 45.5%. It showed the second-highest constancy value among the 12 carnivore fish spiciest that we collected (Table 4). The other native predatory fish species with the highest presence was the Odontobutis interrupta (56.4%). On the other hand, at the stream gradient below 0.1%, the largemouth bass constancy value was 77.5 percent, the highest carnivore species. Nonetheless, in the range of 0.1% to 0.5% gradient, the largemouth bass’s constancy value was 50.0%, the second-highest among all predatory fish species. In the sites with a more than 0.5% gradient, the largemouth bass’s constancy value was reduced by 12.6% (Table 3).
3.7. Linking Largemouth Bass, Geomorphology, Habitat, and Water Quality
The ordination analysis based on principal component analysis (PCA) exhibited the data dimensionality between geomorphological variables (catchment area, altitude, and gradient), largemouth bass abundance in two ways. First, we checked the response of physical habitat (Figure 6a) and the physicochemical water quality, including the maximum temperature (Maxtemp) with the same aspects (Figure 6b). The first two principal components (PC) of the physical habitats variables and bass abundance explained 57.4% of the total variance. The PC 1 displayed strong positive correlations (r > 0.5) with altitude, gradient, epifaunal substrate/available cover, riffle/pool/run variability, riffles/bends abundance, riparian zone width, while it displayed negative correlations (r < −0.5) with sedimentation, channel alteration, and weir effect. Besides, PC 2 showed a positive correlation of more than 0.5 with the catchment area, stream width, and flow status. The relative abundance of largemouth bass was opposite to the stream gradient (Figure 6a). On the other hand, the PCA involving the geomorphological variables, water quality variables, and bass abundance explained 60.7% of the total variance in the first two principal components, with PC1 as 46.9, and PC 2 explained 13.8% of the total variance (Figure 6b). The PC 1 indicated a strong positive correlation (r > 0.5) of largemouth bass abundance and among BOD, COD, TSS, TN, TP, TOC, EC, CHL, CHL/TP, and catchment area, while a negative correlation (r < −0.5) with altitude and gradient. PC 2 also alluded to a positive relationship of less than −0.5 with the catchment area, CHL/TP, and correlated more than 0.4 with altitude and TP. The largemouth bass abundance and gradient displayed nearly opposite tendencies in similarity with the catchment area, CHL/TP, and maximum summer temperature.
3.8. Biotic Integrity and Largemouth Bass Abundance
The increasing largemouth bass abundance significantly impacted the study area’s overall ecological integrity, which substantially influenced the native fish assemblages (Table 5). We analyzed the biotic integrity of the native fish communities, tested their significance, and observed statistically significant differences based on the presence or absence of largemouth bass. The IBI outcomes showed the study sites with bass obtained 21.4 (showing ‘fair’ biotic integrity). In contrast, the final IBI score (26.3) illustrated ‘good’ ecological health status in the areas where largemouth bass were not reported. The native fish assemblages indicated the highest impact of largemouth bass, as evident from the higher degree of freedom (661) shown in the two metrics, i.e., M1 (total number of native fish species) and M7 (total number of native fish individuals). On the other hand, the proportion of individuals as tolerant species (M4) displayed the lowest degree of freedom (423.2), showing the complacent behavior of the tolerant species with the largemouth bass.
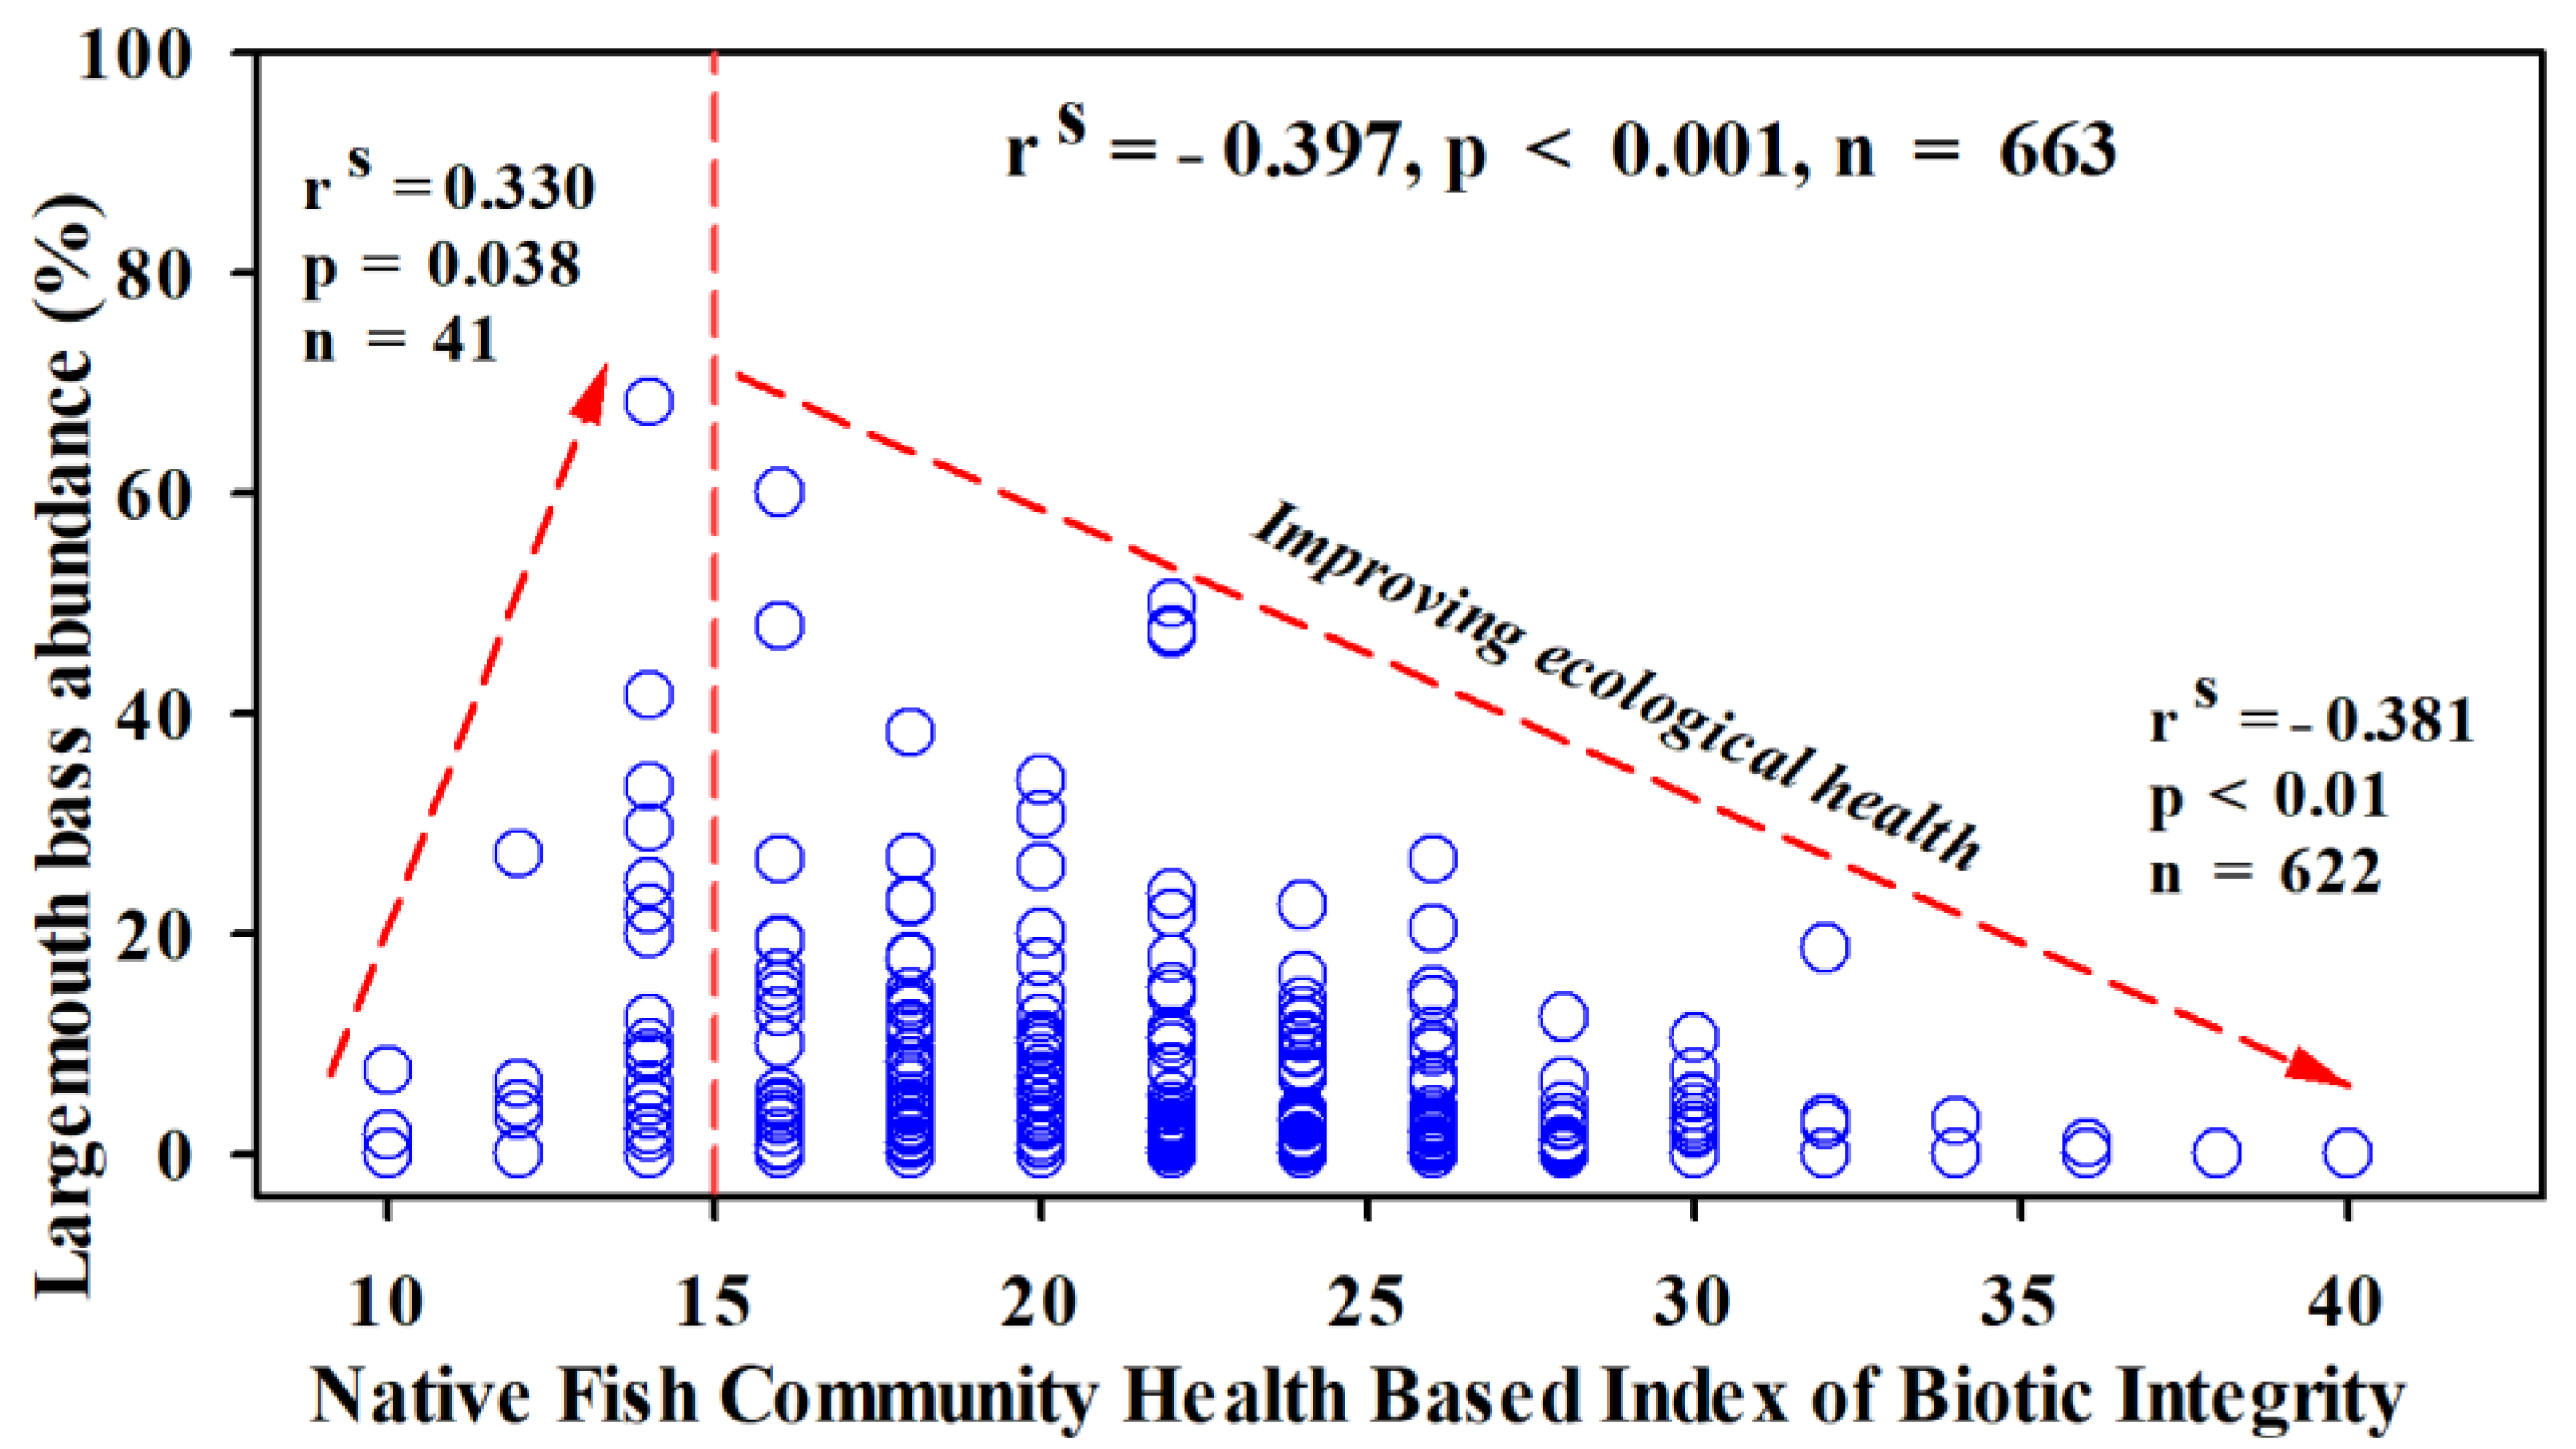
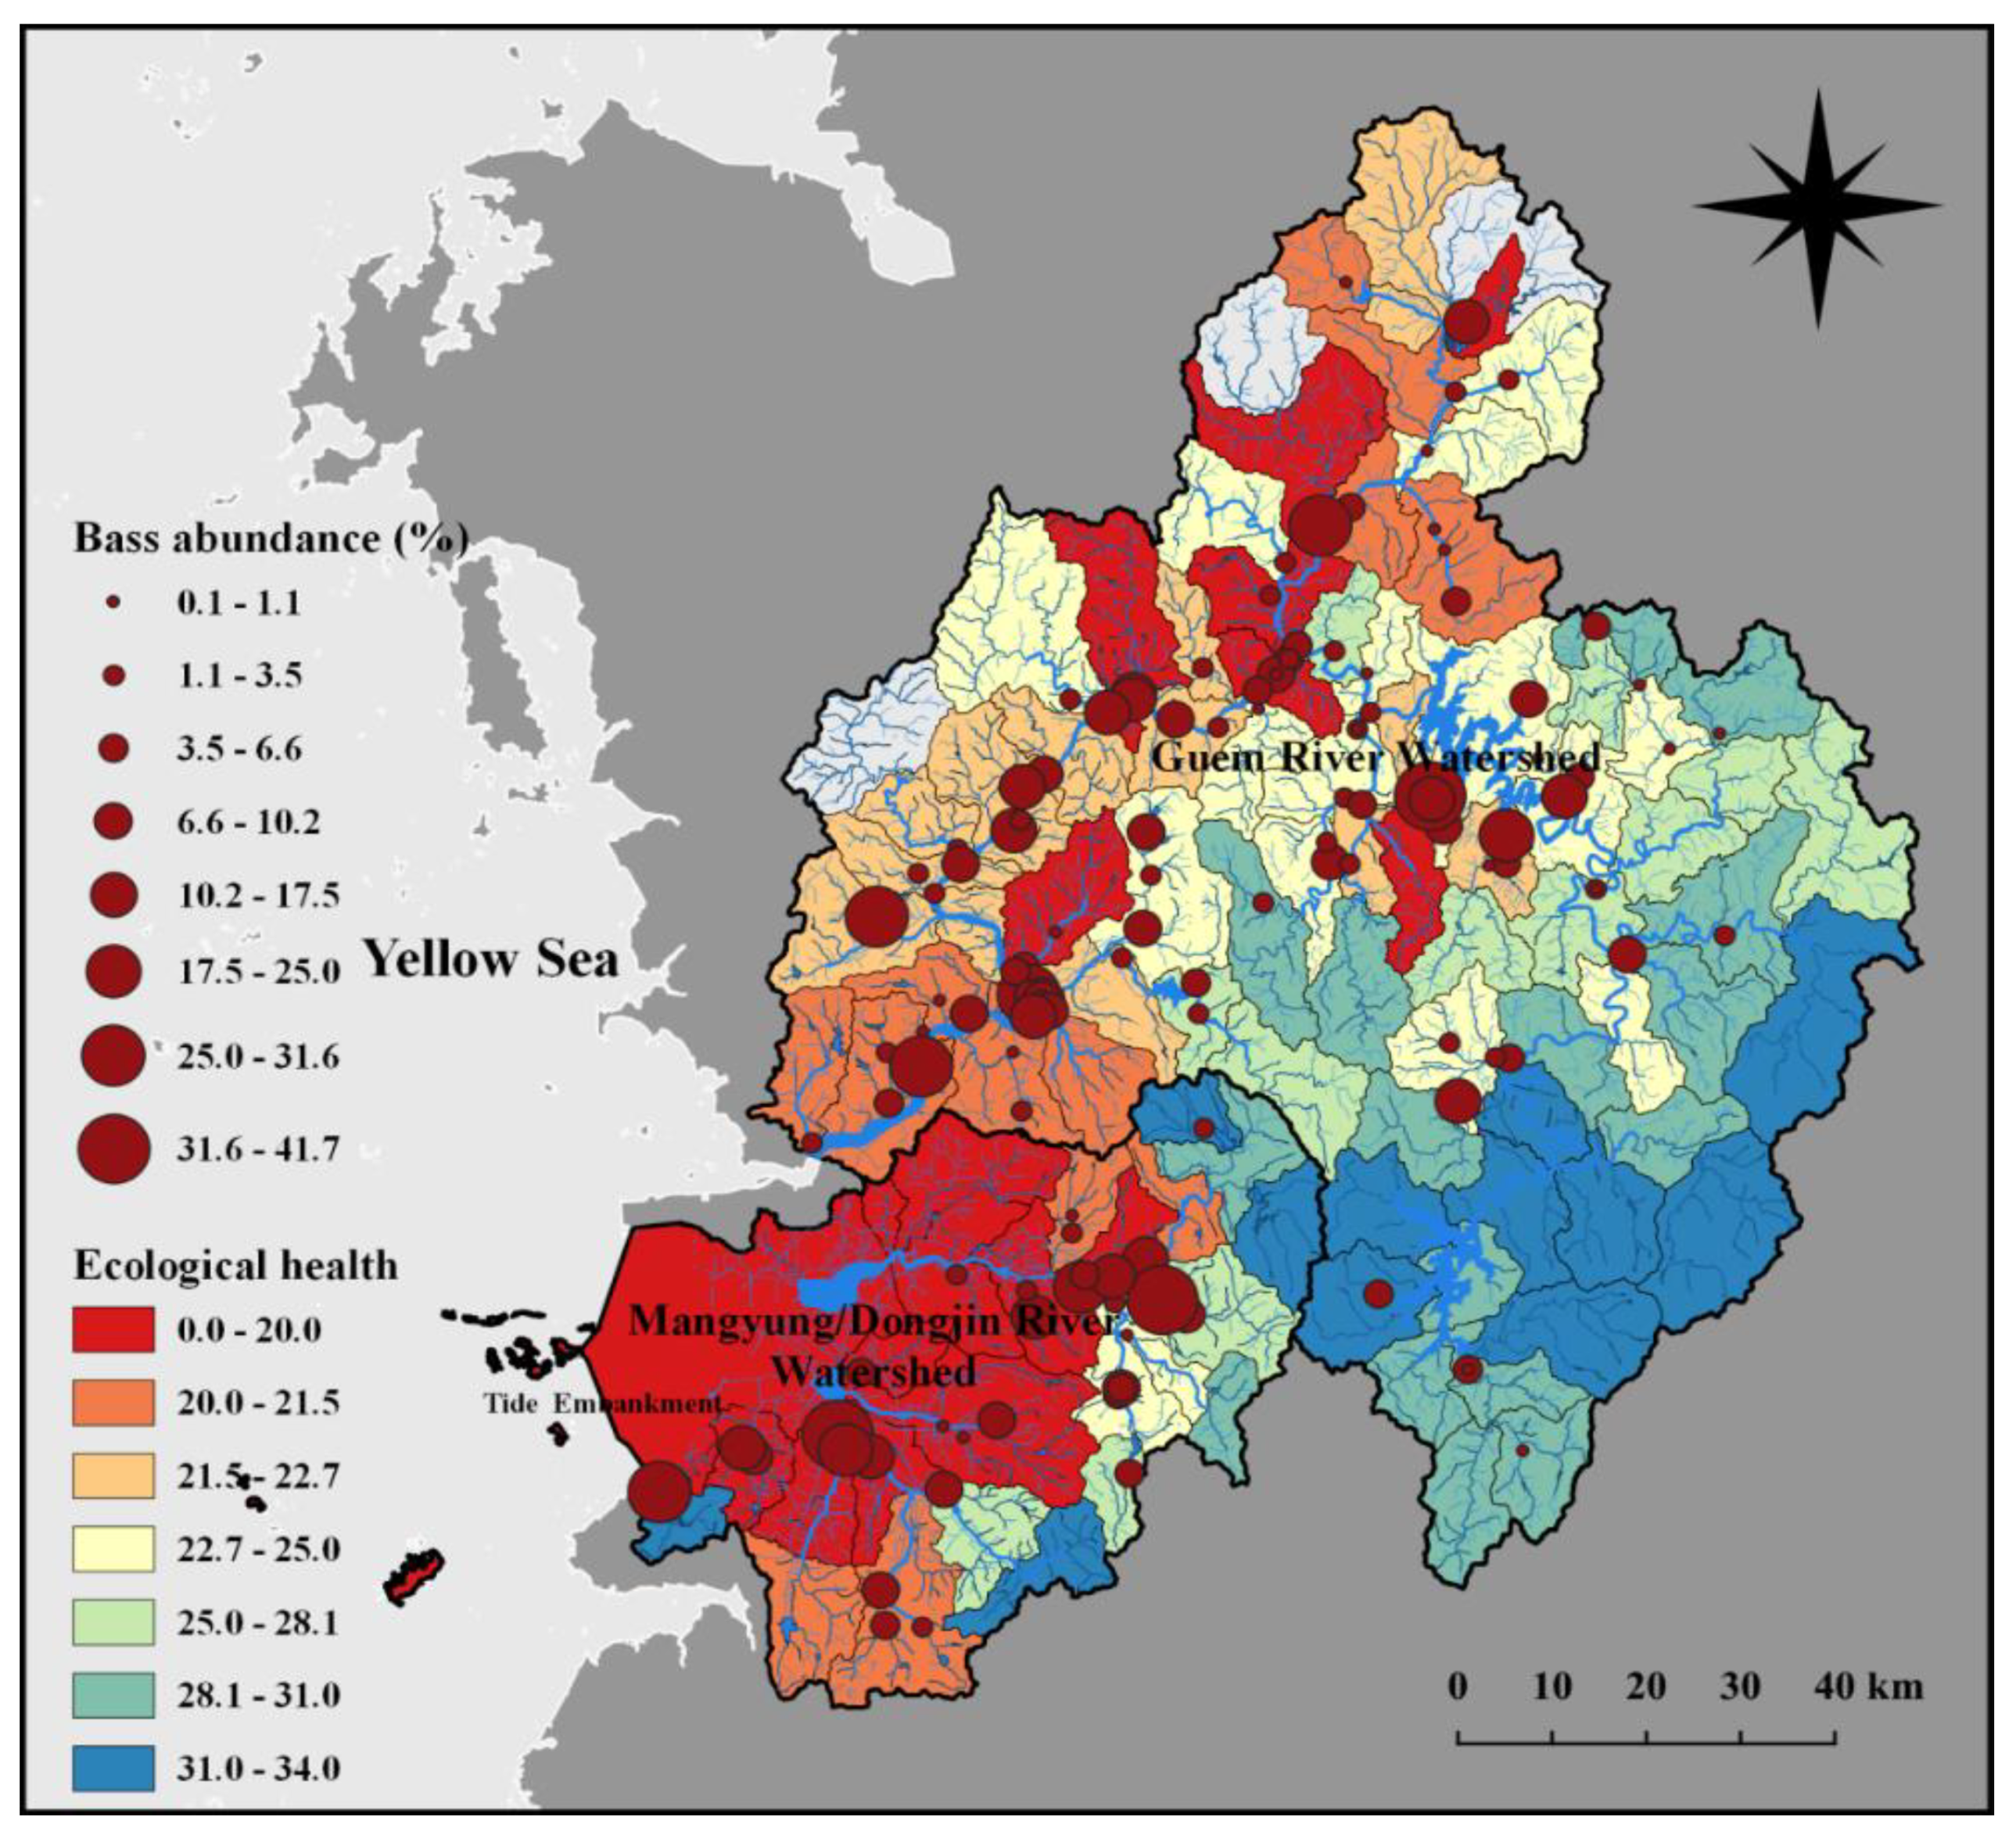
Figure 7 shows the cumulative impact of largemouth bass abundance (%) on the biotic integrity of the two river basin sites based on native fish community health through IBI. The largemouth bass abundance displayed an overall moderately strong negative (r = −0.38) correlation with the biotic integrity of the two river basin sites. However, in the study sites with ‘poor to very poor’ biotic integrity, largemouth bass abundance (%) showed an abrupt increase, indicating its critical impacts on the riverine ecological integrity. Similarly, largemouth bass showed a lower tendency in areas with higher ecological integrity based on native fish assemblages, and vice versa (Figure 8).
4. Discussion
4.1. Largemouth Bass in South Korea
Intentional and accidental introductions, translocations, and escape of NNS are a global concern for their large-scale ecological problems [7]. The largemouth bass, an aggressive carnivorous fish, was introduced to Korea in 1973 [51]. It has broad feeding tendencies exploiting native fish, crustaceans, amphibians, and other aquatic organisms. Therefore, it is actively modifying the native fish communities due to high predation pressure. It has no known natural predators in the riverine ecosystems of Korea. It has seriously affected the aquatic food webs through voracious feeding, fast-growing populations, disrupting the freshwater ecosystems, and it has no known natural enemies. Therefore, the Korean MOE labeled it as one of the worst IAFS in Korea.
4.2. Water Chemistry and Physical Habitat Quality
It was previously observed that water quality degradation is a preferable characteristic of a waterbody for successful establishment of invasive fish species. However, our data approved this observation, as we found that the increasing BOD, COD, TOC, and Chl-a levels study sites were more populated with largemouth bass, and vice versa. Similarly, Crooks et al. [52] summarized that deteriorating water quality intensified by aquatic pollution increased the relative ability of IAFS to invade, supported by other abiotic conditions [53,54,55]. We observed a significant difference between the study locations with and without largemouth bass based on epifaunal substrate and available cover, embeddedness, pool substrate conditions, water flow velocity, depth features, and sedimentation. However, channel alteration and riverbank stability did not show any difference. On the other hand, weir installation, riparian zone vegetation, and stream sinuosity showed relatively higher differences among sites with and without largemouth bass. The anthropogenic disturbances reportedly facilitate successful fish invasions in the disturbed ecosystems [56]. It appears that IAFS prefer the lentic habitats with hydrological disturbances such as dam construction [17,57] and weir impacts [21] for their rapid spread and concomitant establishment. The construction of the weir on streams and rivers regularly hinders the water currents, leading to unexpected micro-habitat structure changes [58]. Such unintended habitat alterations are unsuitable for native species, while facilitating the exotic species [59]. Previously, it has been reported that the abundance of largemouth bass increased after the construction of dams and weirs in large rivers in Korea [60,61].
4.3. Influence of Weir
Dams and weirs that broadly represent the instream infrastructure are widespread, and their installation continues at an unprecedented rate across the globe [62,63]. Our findings demonstrated that rampant construction of instream infrastructure (weirs and dams, culverts) not only facilitated the spread of largemouth bass but severely damaged the variety and extent of habitat utilization by the native fish communities. These structures can substantially modify the riverine ecosystems irrespective of their size [58,64,65]. Even small weirs and dams can impede the free movement of fish species, natural streamflow, enhance sediment deposition, and concentrate nutrients and undesired materials [22,63,66]. The habitat disruptions prompted by the weirs and dams not only destroy subsisting native fish species, but they provide a desirable environment to largemouth bass for successful spread across the habitat range [2,3].
4.4. Geomorphology, Catchment Size and Largemouth Bass Distribution
The potential connections between the largemouth bass presence and absence, geomorphological stream characteristics (altitude, order, and gradient), and habitat alterations in two river watersheds were examined. The negative monotonic association of largemouth bass abundance with the stream gradient and altitude alluded to gradient and altitude’s primary effect, limiting the quantity. Although the increase in altitude is usually connected with increasing river gradient, higher altitudes do not inevitably imply a high gradient, depending on geographical characteristics. The altitude is considered a critical factor in conjunction with the fish species’ biological characteristics. The results indicated that largemouth bass preferred the study sites with higher space and resources in the ecosystem. The stream gradient is essential because it has shown a negative relationship to the largemouth bass abundance due to the overall flow and various physical habitat factors. Exotic species manage to share and avail themselves of the habitat modifications that could benefit their rapid establishment and spread. Species richness (abundance) has a negative correlation with altitude [67].
Rivers are the most suitable ecosystems where IAFS management plans can be executed [68]. Our findings reported the river catchment area is strongly associated with largemouth bass presence and absence. In general, the larger the basin area, the lesser is the stream slope. This catchment-wide topographical configuration induces the slower water flow (rampant stagnant zones), and the water depth grows more suitable for the largemouth bass to populate. This is how it can be widely dispersed without any stream size limitations. Besides, the more organic and abundant food resource availability caused a significant influence on largemouth bass abundance. It indicated that largemouth bass preferred sites that are characterized by higher water flow. This feature becomes particularly harmful to the sensitive fish species that prefer the higher water current velocity.
The catchment-scale biomonitoring field surveys and modeling studies could detect multiple pressures on freshwater ecosystems, especially in critically essential aspects of river connectivity (longitudinal and vertical) [63,69]. To adequately control the menace of IAFS, multi-zonal plans at the catchment level could help recognize the critical priority areas at local to regional levels. It further entails studying the riverscapes’ hydro-geomorphological settings to help decision-makers manage the river catchment [70]. It is also important to mention that macro-and micro-habitat and river catchment features (land use, geography, size, and altitude) regulate the incidence and structure of IAFS communities [21]. Therefore, spatial-scale basin investigations could help understand their more significant spatial variability, distribution, and spreading potential rather than exclusively going for the microhabitat studies [67,71].
4.5. Largemouth Bass and Native Fish Communities
Predation by IAFS greatly influences threatened native fish and macroinvertebrate communities by shaping and restructuring the most vulnerable species [72]. When an alien species is introduced, the native fish assemblages and their habitat undergo relatively adverse changes. For instance, the invasion of bluegill (Lepomis macrochirus) played an active role in restructuring the native communities in North Carolina [73]. Similarly, brown trout (Salmo trutta) introduced into the New Zealand streams in the 1860s caused the decline and disruption in the invertebrates and native fish communities [74]. Chick et al. [75] reported the invasive silver carp to be empirically linked to the declines of native sport fish in the Upper Mississippi River system. Likewise, the increasing largemouth bass presence and declining native carnivorous fish species showed a distinct negative correlation between the investigated population size. However, this phenomenon was not observed in the native insectivore or omnivore fish assemblages. It may further decline native fish assemblages due to higher predation pressure on the native carnivorous fish species.
Haubrock et al. [76] have reported an entire community turnover from the native to aliens in Arno River (Italy) due to multidimensional factors. One such critical factor enlisted the introduction of an IAFS for angling and food security (as is the case of largemouth bass in South Korea). The other pressure factors could be induced by geomorphological, hydro-morphological, and physical habitat alterations, a further environmental deterioration facilitating their rapid establishment and spread.
The native fish guild composition and largemouth bass relationship were driven by environmental determinants rather than by direct influence. The largemouth bass is classified as a tolerant species (TS) by the Korean MOE. It prefers an organic-rich environment that can provide plenty of food resources. However, we observed that an increase in the abundance of largemouth bass led to a drop in the abundance of native carnivorous fish species, which could be linked to the extent of challenging competition for food and shelter; however, more specific research is needed to establish this association. Nevertheless, the increasing number of fish individuals and the higher constancy value of largemouth bass than native carnivores implies severe damage at the community level, rather than affecting the native carnivores.
4.6. River Health and Exotic Fish Species
Recently, several researchers have addressed the effect of alien species, provoking the contracted populations and resultant destruction of native fish species; however, IAFS can affect freshwater fish communities at multiple levels [2,3,5,30,77], extending from individuals to ecosystems. For instance, an IAFS may alter the behavioral and functional response of native species at the individual level, affecting their habitat utilization and foraging. Maezono and Miyashita [78] showed the community-wide impacts of largemouth bass in fish farming ponds by causing the trophic cascade with top-down effects. It may cause variations in the presence, abundance, and dissemination of associated fish species. It can also induce trophic cascades at the community level by altering primary and secondary interactions among fish populations. Conclusively, the IAFS may modify the magnitude and make pathways more convenient to the native fish communities [23,77,79,80].
The IAFS can help characterize both symptoms and causes of declining river health and biotic integrity based on native fish communities [12]. In the present study, the riffle benthic fish species showed non-significant differences among the study sites, while the proportion of fish individuals with abnormalities exhibited a slight difference. However, overall ecological health based on IBI showed significant differences based on largemouth bass. The native fish community thrived in the sites without largemouth bass, specifying the devastating impact on overall biotic integrity. Therefore, it could be claimed that the presence of IAFS could be used as an indicator of river health degradation, and their presence could pinpoint the areas requiring immediate attention [5]. However, there are several confounding factors to be held responsible for the overall decline of ecological integrity. The potential confounding factors that have severely affected the riverine biotic integrity and functionality, other than the IAFS, could be regarded as changing climate, surmounting chemical and nutrient enrichment, altered flow regime, habitat degradation, and in-stream installments [8,9,81,82,83,84]. The IAFS can exploit the empty niches, eventually declining the functional richness and causing the ultimate loss of functional diversity. The loss of functional diversity could alter overall community composition and the attendant ecological health of the riverine ecosystem. The avid response of IBI to the abundance and presence of largemouth bass depicted the confounding impact of three central pressures: water quality degradation, habitat alteration, and disruption of native fish communities [85,86].
5. Conclusions and Further Research
Invasion ecology has recently become a hot topic of investigation in freshwater ecology as biological invasions are recognized as the greatest threat to biodiversity. We investigated the key factors influencing the distribution and abundance of the largemouth bass (Micropterus salmoides) in two river basins, where the study sites were selected for the national biomonitoring survey in South Korea from 2016–2019. The links between largemouth bass’s presence, absence, geomorphological, hydrology, in-stream structures and habitat, native fish assemblages, and riverine ecological health provided valuable insights. The altitude and stream gradient were the key factors limiting the largemouth bass’s distribution and abundance. The increase in the catchment area affected the increasing abundance of largemouth bass. Similarly, the changes in geomorphological factors can be attributed to the physical habitat and water quality. The largemouth bass affected the native fish assemblages, particularly the native carnivore fish species. Under optimal habitat conditions, it displayed extensive distribution and higher abundance than native carnivores, indicating the extent of adverse impacts on native fish communities and biotic integrity. The largemouth bass abundance showed an inverse relationship with the overall ecological health status of the riverine sites.
The changing climatic conditions and anthropogenic activities are likely to cause drastic shifts in native fish species and pave the road for increasing biological invasions. Even the IAFS established decades ago are anticipated to face the consequences of shifting climatic regimes and deviate from their historical abundance patterns. The successful invaders alter their new ecosystems to render those ecosystems for new species, thus changing them entirely. Similarly, the changes caused by freshwater IAFS can be complicated, and their consequences affect the inclusive aquatic environment. Such impacts are diverse, ranging from individual to ecosystem levels. Therefore, quick response to the new invasions and introductions of IAFS and mitigation of individuals to ecosystem-level effects is key to effective handling. A global-scale concerted effort is needed to regulate live translocation and implication of early-warning frameworks. Equally important is the initiation of targeted restoration measures to promptly contain the ecological degradations and eradication programs.
Author Contributions
Conceptualization, J.-J.K., U.A., K.-G.A.; Data curation, J.-J.K., U.A., K.-G.A.; Formal analysis, J.-J.K., U.A.; Funding acquisition, K.-G.A.; Investigation, J.-J.K., U.A., K.-G.A.; Methodology, J.-J.K., U.A.; Project administration, U.A., K.-G.A.; Resources, U.A.; Software, J.-J.K., U.A.; Supervision, K.-G.A.; Validation, U.A.; Visualization, J.-J.K., U.A.; Writing—original draft, U.A.; Writing—review & editing, U.A., J.-J.K. and U.A. have equally participated in this study. All authors have read and agreed to the published version of the manuscript.
Funding
This work was funded by ‘Korea Environment Industry & Technology Institute (KEITI)’ through “Exotic Invasive Fish Species Management Project”, funded by the Ministry of Environment, Korea (2018002270003, RE201807019).
Institutional Review Board Statement
Not applicable.
Informed Consent Statement
Not applicable.
Data Availability Statement
The data presented in this study maybe available on request from the corresponding author, however, it is with subject to approval from the funding agency.
Acknowledgments
This research was supported by the ‘Korea Environment Industry & Technology Institute (KEITI)’ through “Exotic Invasive Fish Species Management Project”, funded by the Ministry of Environment, Korea (2018002270003, RE201807019) and by Daejeon Green Environment Center under the Research Development Program (Yr 2016). Therefore, the authors would like to acknowledge for their support.
Conflicts of Interest
The authors declare no conflict of interest.
References
- Vitule, J.R.S.; Freire, C.A.; Simberloff, D. Introduction of non-native freshwater fish can certainly be bad. Fish Fish. 2009, 10, 98–108. [Google Scholar] [CrossRef]
- Kim, J.-J.; Atique, U.; An, K.-G. Long-Term Ecological Health Assessment of a Restored Urban Stream Based on Chemical Water Quality, Physical Habitat Conditions and Biological Integrity. Water 2019, 11, 114. [Google Scholar] [CrossRef] [Green Version]
- Kim, J.Y.; Atique, U.; An, K.-G. Relative Abundance and Invasion Dynamics of Alien Fish Species Linked to Chemical Conditions, Ecosystem Health, Native Fish Assesmblage, and Stream Order. Water 2021, 13, 158. [Google Scholar] [CrossRef]
- Essl, F.; Lenzner, B.; Bacher, S.; Bailey, S.; Capinha, C.; Daehler, C.; Dullinger, S.; Genovesi, P.; Hui, C.; Hulme, P.E.; et al. Drivers of future alien species impacts: An expert-based assessment. Glob. Chang. Biol. 2020, 26, 4880–4893. [Google Scholar] [CrossRef]
- Atique, U.; Byungjin, L.; Johee, Y.; An, K.-G. Biological Health Assessments of Lotic Waters by Biotic Integrity Indices and their Relations to Water Chemistry. Water 2019, 11, 436. [Google Scholar] [CrossRef] [Green Version]
- Early, R.; Bradley, B.A.; Dukes, J.S.; Lawler, J.J.; Olden, J.D.; Blumenthal, D.M.; Gonzalez, P.; Grosholz, E.D.; Ibañez, I.; Miller, L.P.; et al. Global threats from invasive alien species in the twenty-first century and national response capacities. Nat. Commun. 2016, 7, 1–9. [Google Scholar] [CrossRef]
- Copp, G.H.; Vilizzi, L.; Wei, H.; Li, S.; Piria, M.; Al-Faisal, A.J.; Almeida, D.; Atique, U.; Al-Wazzan, Z.; Bakiu, R.; et al. Speaking their language—Development of a multilingual decision-support tool for communicating invasive species risks to decision makers and stakeholders. Environ. Model. Softw. 2021, 135, 104900. [Google Scholar] [CrossRef]
- Reid, A.J.; Carlson, A.K.; Creed, I.F.; Eliason, E.J.; Gell, P.A.; Johnson, P.T.J.; Kidd, K.A.; MacCormack, T.J.; Olden, J.D.; Ormerod, S.J.; et al. Emerging threats and persistent conservation challenges for freshwater biodiversity. Biol. Rev. 2019, 94, 849–873. [Google Scholar] [CrossRef] [PubMed] [Green Version]
- Stefani, F.; Schiavon, A.; Tirozzi, P.; Gomarasca, S.; Marziali, L. Functional response of fish communities in a multistressed freshwater world. Sci. Total Environ. 2020, 740, 139902. [Google Scholar] [CrossRef]
- Preston, D.L.; Hedman, H.D.; Johnson, P.T.J. Nutrient availability and invasive fish jointly drive community dynamics in an experimental aquatic system. Ecosphere 2018, 9, e02153. [Google Scholar] [CrossRef]
- Flood, P.J.; Duran, A.; Barton, M.; Mercado-Molina, A.E.; Trexler, J.C. Invasion impacts on functions and services of aquatic ecosystems. Hydrobiologia 2020, 847, 1571–1586. [Google Scholar] [CrossRef]
- Kennard, M.J.; Arthington, A.H.; Pusey, B.J.; Harch, B.D. Are alien fish a reliable indicator of river health? Freshw. Biol. 2005, 50, 174–193. [Google Scholar] [CrossRef] [Green Version]
- Roy, H.E.; Bacher, S.; Essl, F.; Adriaens, T.; Aldridge, D.C.; Bishop, J.D.D.; Blackburn, T.M.; Branquart, E.; Brodie, J.; Carboneras, C.; et al. Developing a list of invasive alien species likely to threaten biodiversity and ecosystems in the European Union. Glob. Chang. Biol. 2019, 25, 1032–1048. [Google Scholar] [CrossRef] [Green Version]
- Haque, M.A.; Paul, S.; Jewel, M.A.S.; Atique, U.; Ahmed, Z.; Paul, A.K.; Iqbal, S.; Mahboob, S. Seasonal analysis of food items and feeding habits of endangered riverine catfish Rita rita (Hamilton, 1822). Braz. J. Biol. 2021, 82, 1–11. [Google Scholar] [CrossRef]
- Kim, J.Y.; Atique, U.; Mamun, M.; An, K.-G. Long-Term Interannual and Seasonal Links between the Nutrient Regime, Sestonic Chlorophyll and Dominant Bluegreen Algae under the Varying Intensity of Monsoon Precipitation in a Drinking Water Reservoir. Int. J. Environ. Res. Public Health 2021, 18, 2871. [Google Scholar] [CrossRef]
- Lowe, S.; Browne, M.; Boudjelas, S.; De Poorter, M. 100 of the World’s Worst Invasive Alien Species: A Selection from the Global Invasive Species Database; Invasive Species Specialist Group: Auckland, New Zealand, 2000. [Google Scholar]
- Hermoso, V.; Blanco-Garrido, F.; Prenda, J. Spatial distribution of exotic fish species in the Guadiana river basin, with two new records. Limnetica 2008, 27, 189–194. [Google Scholar]
- Xiong, W.; Sui, X.; Liang, S.-H.; Chen, Y. Non-native freshwater fish species in China. Rev. Fish Biol. Fish. 2015, 25, 651–687. [Google Scholar] [CrossRef]
- Maezono, Y.; Kobayashi, R.; Kusahara, M.; Miyashita, T. Direct and indirect effects of EXOTIC Bass and Bluegill on exotic and native organisms in farm ponds. Ecol. Appl. 2005, 15, 638–650. [Google Scholar] [CrossRef]
- Wasserman, R.J.; Strydom, N.A.; Weyl, O.L.F. Diet of largemouth bass, Micropterus salmoides (Centrarchidae), an invasive alien in the lower reaches of an Eastern Cape River, South Africa. Afr. Zool. 2011, 46, 378–386. [Google Scholar] [CrossRef]
- Atique, U.; Kwon, S.; An, K.G. Linking weir imprints with riverine water chemistry, microhabitat alterations, fish assemblages, chlorophyll-nutrient dynamics, and ecological health assessments. Ecol. Indic. 2020, 117, 106652. [Google Scholar] [CrossRef]
- Cucherousset, J.; Olden, J.D. Ecological Impacts of Nonnative Freshwater Fishes. Fisheries 2011, 36, 215–230. [Google Scholar] [CrossRef]
- Pereira, F.W.; Vitule, J.R.S. The largemouth bass Micropterus salmoides (Lacepède, 1802): Impacts of a powerful freshwater fish predator outside of its native range. Rev. Fish Biol. Fish. 2019, 29, 639–652. [Google Scholar] [CrossRef]
- Tsunoda, H.; Mitsuo, Y.; Ohira, M.; Doi, M.; Senga, Y. Change of fish fauna in ponds after eradication of invasive piscivorous largemouth bass, Micropterus salmoides, in north-eastern Japan. Aquat. Conserv. Mar. Freshw. Ecosyst. 2010, 20, 710–716. [Google Scholar] [CrossRef]
- Goudswaard, P.C.; Witte, F.; Katunzi, E.F.B. The tilapiine fish stock of Lake Victoria before and after the Nile perch upsurge. J. Fish Biol. 2002, 60, 838–856. [Google Scholar] [CrossRef]
- Witte, F.; Msuku, B.S.; Wanink, J.H.; Seehausen, O.; Katunzi, E.F.B.; Goudswaard, P.C.; Goldschmidt, T. Recovery of cichlid species in Lake Victoria: An examination of factors leading to differential extinction. Rev. Fish Biol. Fish. 2000, 10, 233–241. [Google Scholar] [CrossRef]
- Power, M.E.; Matthews, W.J.; Stewart, A.J. Grazing Minnows, Piscivorous Bass, and Stream Algae: Dynamics of a Strong Interaction. Ecology 1985, 66, 1448–1456. [Google Scholar] [CrossRef]
- Parker, I.M.; Simberloff, D.; Lonsdale, W.M.; Goodell, K.; Wonham, M.; Kareiva, P.M.; Williamson, M.H.; Von Holle, B.; Moyle, P.B.; Byers, J.E.; et al. Impact: Toward a Framework for Understanding the Ecological Effects of Invaders. Biol. Invasions 1999, 1, 3–19. [Google Scholar] [CrossRef]
- Dick, J.T.A.; Alexander, M.E.; Jeschke, J.M.; Ricciardi, A.; Macisaac, H.J.; Robinson, T.B.; Kumschick, S.; Weyl, O.L.F.; Dunn, A.M.; Hatcher, M.J.; et al. Advancing impact prediction and hypothesis testing in invasion ecology using a comparative functional response approach. Biol. Invasions 2014, 16, 735–753. [Google Scholar] [CrossRef] [Green Version]
- Alexander, M.E.; Dick, J.T.A.; Weyl, O.L.F.; Robinson, T.B.; Richardson, D.M. Existing and emerging high impact invasive species are characterized by higher functional responses than natives. Biol. Lett. 2014, 10, 20130946. [Google Scholar] [CrossRef]
- Almeida, D.; Almodóvar, A.; Nicola, G.G.; Elvira, B.; Grossman, G.D. Trophic plasticity of invasive juvenile largemouth bass Micropterus salmoides in Iberian streams. Fish. Res. 2012, 113, 153–158. [Google Scholar] [CrossRef]
- Park, J.-S.; Kim, S.-H.; Kim, H.-T.; Kim, J.-G.; Park, J.-Y.; Kim, H.-S. Study on feeding habits of Micropterus salmoides in habitat types from Korea. Korean J. Ichthyol. 2019, 31, 39–53. [Google Scholar] [CrossRef]
- Egnew, N.; Renukdas, N.; Ramena, Y.; Yadav, A.K.; Kelly, A.M.; Lochmann, R.T.; Sinha, A.K. Physiological insights into largemouth bass (Micropterus salmoides) survival during long-term exposure to high environmental ammonia. Aquat. Toxicol. 2019, 207, 72–82. [Google Scholar] [CrossRef]
- Stuber, R.J.; Gebhart, G.; Maughan, O.E. Habitat Suitability Index Models: Largemouth Bass; FWS/OBS-82/10.16; U.S. Department of the Interior: Washington, DC, USA, 1982; p. 32.
- Vannote, R.L.; Minshall, G.W.; Cummins, K.W.; Sedell, J.R.; Cushing, C.E. The river continuum concept. Can. J. Fish. Aquat. Sci. 1980, 37, 130–137. [Google Scholar] [CrossRef]
- Atique, U.; An, K.-G. Stream health evaluation using a combined approach of multi-metric chemical pollution and biological integrity models. Water 2018, 10, 661. [Google Scholar] [CrossRef] [Green Version]
- Atique, U.; An, K.-G. Reservoir Water Quality Assessment Based on Chemical Parameters and the Chlorophyll Dynamics in Relation to Nutrient Regime. Pol. J. Environ. Stud. 2019, 28, 1043–1061. [Google Scholar] [CrossRef]
- Buffington, J.M.; Montgomery, D.R.; Greenberg, H.M. Basin-scale availability of salmonid spawning gravel as influenced by channel type and hydraulic roughness in mountain catchments. Can. J. Fish. Aquat. Sci. 2004, 61, 2085–2096. [Google Scholar] [CrossRef]
- Montgomery, D.R.; Buffington, J.M. Channel-reach morphology in mountain drainage basins. GSA Bull. 1997, 109, 596–611. [Google Scholar] [CrossRef]
- McGarvey, D.J. Quantifying ichthyofaunal zonation and species richness along a 2800-km reach of the Rio Chama and Rio Grande (USA). Ecol. Freshw. Fish 2011, 20, 231–242. [Google Scholar] [CrossRef]
- McGarvey, D.J.; Ward, G.M. Scale dependence in the species-discharge relationship for fishes of the southeastern U.S.A. Freshw. Biol. 2008, 53, 2206–2219. [Google Scholar] [CrossRef]
- Rahel, F.J.; Hubert, W.A. Fish assemblages and habitat gradients in a Rocky Mountain–Great Plains stream: Biotic zonation and additive patterns of community change. Trans. Am. Fish. Soc. 1991, 120, 319–332. [Google Scholar] [CrossRef]
- Massong, T.M.; Montgomery, D.R. Influence of sediment supply, lithology, and wood debris on the distribution of bedrock and alluvial channels. GSA Bull. 2000, 112, 591–599. [Google Scholar] [CrossRef]
- Nagel, D.; Buffington, J.M.; Isaak, D. Estimating stream gradient using NHD stream lines and DEM data. In Proceedings of the ESRI International User Conference, San Diego, CA, USA, 12–16 July 2010. [Google Scholar]
- Nagel, D.; Buffington, J.; Isaak, D. Comparison of Methods for Estimating Stream Channel Gradient Using GIS; USDA Forest Service, Rocky Mountain Research Station Boise Aquatic Sciences Lab: Boise, ID, USA, 2006.
- Ohio Environmental Protection Agency. Biological criteria for the protection of aquatic life. In Standardized Biological Field Sampling and Laboratory Methods for Assessing Fish and Macroinvertebrate Communities; Ohio Environmental Protection Agency: Columbus, OH, USA, 1989; Volume III. [Google Scholar]
- Barbour, M.T.; Gerritsen, J.; Snyder, B.D.; Stribling, J.B. Rapid Bioassessment Protocols for Use in Streams and Wadeable Rivers: Periphyton, Benthic Macroinvertebrates and Fish; US Environmental Protection Agency, Office of Water: Washington, DC, USA, 1999.
- Plafkin, J.; Barbour, M.; Porter, K.; Gross, S.; Hughes, R. Rapid Assessment Protocols for Use in Streams and Rivers: Binthic Macroinvertebrats and Fish; EPA/444/4-89-001; Office of Water Regulations and Standards, US EPA: Washington, DC, USA, 1989.
- Kim, J.-H.; An, K.-G. A diagnosis of ecological health using a physical habitat assessment and multi-metric fish model in Daejeon Stream. Korean J. Ecol. Environ. 2005, 38, 361–371. [Google Scholar]
- Karr, J.R. Assessment of biotic integrity using fish communities. Fisheries 1981, 6, 21–27. [Google Scholar] [CrossRef]
- Choi, J.W.; An, K.G. Hydrodynamic fish modeling for potential expansion evaluations of exotic species (largemouth bass) on waterway tunnel of Andong-Imha reservoir. J. Ecol. Environ. 2016, 40, 1–11. [Google Scholar] [CrossRef] [Green Version]
- Crooks, J.A.; Chang, A.L.; Ruiz, G.M. Aquatic pollution increases the relative success of invasive species. Biol. Invasions 2011, 13, 165–176. [Google Scholar] [CrossRef] [Green Version]
- Atique, U.; An, K.-G. Landscape heterogeneity impacts water chemistry, nutrient regime, organic matter and chlorophyll dynamics in agricultural reservoirs. Ecol. Indic. 2020, 110, 105813. [Google Scholar] [CrossRef]
- Bae, D.-Y.; Atique, U.; Yoon, J.; Lim, B.; An, K.-G. Ecological Risk Assessment of Urban Streams Using Fish Biomarkers of DNA Damages and Physiological Responses. Pol. J. Environ. Stud. 2020, 29, 1–10. [Google Scholar] [CrossRef]
- Moon, W.-K.; Atique, U.; An, K.-G. Ecological risk assessments and eco-toxicity analyses using chemical, biological, physiological responses, DNA damages and gene-level biomarkers in Zebrafish (Danio rerio) in an urban stream. Chemosphere 2020, 239, 124754. [Google Scholar] [CrossRef]
- Marchetti, M.P.; Light, T.; Moyle, P.B.; Viers, J.H. Fish invasions in california watersheds: Testing hypotheses using landscape patterns. Ecol. Appl. 2004, 14, 1507–1525. [Google Scholar] [CrossRef]
- Johnson, P.T.; Olden, J.D.; Vander Zanden, M.J. Dam invaders: Impoundments facilitate biological invasions into freshwaters. Front. Ecol Environ. 2008, 6, 357–363. [Google Scholar] [CrossRef] [Green Version]
- Mueller, M.; Pander, J.; Geist, J. The effects of weirs on structural stream habitat and biological communities. J. Appl. Ecol. 2011, 48, 1450–1461. [Google Scholar] [CrossRef]
- Gido, K.B.; Propst, D.L.; Olden, J.D.; Bestgen, K.R. Multidecadal responses of native and introduced fishes to natural and altered flow regimes in the American Southwest. Can. J. Fish. Aquat. Sci. 2013, 70, 554–564. [Google Scholar] [CrossRef]
- Bae, M.J.; Murphy, C.A.; García-Berthou, E. Temperature and hydrologic alteration predict the spread of invasive Largemouth Bass (Micropterus salmoides). Sci. Total Environ. 2018, 639, 58–66. [Google Scholar] [CrossRef]
- Jo, H.; Jeppesen, E.; Ventura, M.; Buchaca, T.; Gim, J.S.; Yoon, J.D.; Kim, D.H.; Joo, G.J. Responses of fish assemblage structure to large-scale weir construction in riverine ecosystems. Sci. Total Environ. 2019, 657, 1334–1342. [Google Scholar] [CrossRef] [Green Version]
- Grill, G.; Lehner, B.; Thieme, M.; Geenen, B.; Tickner, D.; Antonelli, F.; Babu, S.; Borrelli, P.; Cheng, L.; Crochetiere, H.; et al. Mapping the world’s free-flowing rivers. Nature 2019, 569, 215–221. [Google Scholar] [CrossRef]
- Januchowski-Hartley, S.R.; Mantel, S.; Celi, J.; Hermoso, V.; White, J.C.; Blankenship, S.; Olden, J.D. Small instream infrastructure: Comparative methods and evidence of environmental and ecological responses. Ecol. Solut. Evid. 2020, 1, 1–7. [Google Scholar] [CrossRef]
- Olden, J.D. Challenges and opportunities for fish conservation in dam-impacted waters. In Conservation of Freshwater Fishes; Closs, G.P., Krkosek, M., Olden, J.D., Eds.; Cambridge University Press: Cambridge, UK, 2016; pp. 107–148. [Google Scholar]
- HaRa, J.; Atique, U.; An, K.-G. Multiyear Links between Water Chemistry, Algal Chlorophyll, Drought-Flood Regime, and Nutrient Enrichment in a Morphologically Complex Reservoir. Int. J. Environ. Res. Public Health 2020, 17, 3139. [Google Scholar] [CrossRef] [PubMed]
- Oele, D.L.; Gaeta, J.W.; Rypel, A.L.; McIntyre, P.B. Growth and recruitment dynamics of young-of-year northern pike: Implications for habitat conservation and management. Ecol. Freshw. Fish 2019, 28, 285–301. [Google Scholar] [CrossRef]
- Sax, D.F. Latitudinal gradients and geographic ranges of exotic species: Implications for biogeography. J. Biogeogr. 2001, 28, 139–150. [Google Scholar] [CrossRef]
- Boon, P.J. The catchment approach as the scientific basis of river basin management. River Syst. 2005, 16, 29–58. [Google Scholar] [CrossRef]
- Van Wilgen, B.W.; Nel, J.L.; Rouget, M. Invasive alien plants and South African rivers: A proposed approach to the prioritization of control operations. Freshw. Biol. 2007, 52, 711–723. [Google Scholar] [CrossRef]
- Forsyth, G.G.; Le Maitre, D.C.; O’farrell, P.J.; Van Wilgen, B.W. The prioritisation of invasive alien plant control projects using a multi-criteria decision model informed by stakeholder input and spatial data. J. Environ. Manag. 2012, 103, 51–57. [Google Scholar] [CrossRef] [PubMed]
- Magliozzi, C.; Tsiamis, K.; Vigiak, O.; Deriu, I.; Gervasini, E.; Cardoso, A.C. Assessing invasive alien species in European catchments: Distribution and impacts. Sci. Total Environ. 2020, 732, 138677. [Google Scholar] [CrossRef]
- Weyl, P.S.R.; de Moor, F.C.; Hill, M.P.; Weyl, O.L.F. The effect of largemouth bass Micropterus salmoides on aquatic macroinvertebrate communities in the Wit River, Eastern Cape, South Africa. Afr. J. Aquat. Sci. 2010, 35, 273–281. [Google Scholar] [CrossRef]
- Gilinsky, E. The role of fish predation and spatial heterogeneity in determining benthic community structure. Ecology 1984, 65, 455–468. [Google Scholar] [CrossRef]
- Flecker, A.S.; Townsend, C.R. Community-Wide Consequences of Trout Introduction in New Zealand Streams. Ecol. Appl. 1994, 4, 798–807. [Google Scholar] [CrossRef]
- Chick, J.H.; Gibson-Reinemer, D.K.; Soeken-Gittinger, L.; Casper, A.F. Invasive silver carp is empirically linked to declines of native sport fish in the Upper Mississippi River System. Biol. Invasions 2020, 22, 723–734. [Google Scholar] [CrossRef] [Green Version]
- Haubrock, P.J.; Pilotto, F.; Innocenti, G.; Cianfanelli, S.; Haase, P. Two centuries for an almost complete community turnover from native to non-native species in a riverine ecosystem. Glob. Chang. Biol. 2020, 27, 606–623. [Google Scholar] [CrossRef]
- Simon, K.S.; Townsend, C.R. Impacts of freshwater invaders at different levels of ecological organisation, with emphasis on salmonids and ecosystem consequences. Freshw. Biol. 2003, 48, 982–994. [Google Scholar] [CrossRef] [Green Version]
- Maezono, Y.; Miyashita, T. Community-level impacts induced by introduced largemouth bass and bluegill in farm ponds in Japan. Biol. Conserv. 2002, 109, 111–121. [Google Scholar] [CrossRef]
- Beatty, S.J.; Morgan, D.L. Introduced freshwater fishes in a global endemic hotspot and implications of habitat and climatic change. BioInvasions Rec. 2013, 2, 1–9. [Google Scholar] [CrossRef]
- Bezerra, L.A.V.; Angelini, R.; Vitule, J.R.S.; Coll, M.; Sa´nchez-Botero, J.I. Food web changes associated with drought and invasive species in a tropical semiarid reservoir. Hydrobiologia 2018, 817, 475–489. [Google Scholar] [CrossRef]
- Rolls, R.J.; Hayden, B.; Kahilainen, K.K. Conceptualising the interactive effects of cli- mate change and biological invasions on subarctic freshwater fish. Ecol. Evol. 2017, 7, 4109–4128. [Google Scholar] [CrossRef] [PubMed]
- Khanom, D.A.; Nesa, A.; Jewel, M.A.S.; Haque, M.A.; Paul, A.K.; Iqbal, S.; Atique, U.; Alam, L. Muscular Tissue Bioaccumulation and Health Risk Assessment of Heavy Metals in Two Edible Fish Species (Gudusia chapra and Eutropiichthys vacha) in Padma River, Bangladesh. Punjab Univ. J. Zool. 2020, 35, 81–89. [Google Scholar] [CrossRef]
- Haque, M.A.; Jewel, M.A.S.; Akhi, M.M.; Atique, U.; Paul, A.K.; Iqbal, S.; Islam, M.S.; Das, S.K.; Alam, M.M. Seasonal dynamics of phytoplankton community and functional groups in a tropical river. Environ. Monit. Assess. 2021, 193, 1–16. [Google Scholar] [CrossRef]
- Atique, U.; Iqbal, S.; Khan, N.; Qazi, B.; Javeed, A.; Anjum, K.M.; Haider, M.S.; Khan, T.A.; Mahmood, S.; Sherzada, S. Multivariate Assessment of Water Chemistry and Metals in a River Impacted by Tanning Industry. Fresenius Environ. Bull. 2020, 29, 3013–3025. [Google Scholar]
- Colin, N.; Villéger, S.; Wilkes, M.; de Sostoa, A.; Maceda-Veiga, A. Functional diversity measures revealed impacts of non-native species and habitat degradation on species-poor freshwater fish assemblages. Sci. Total Environ. 2018, 625, 861–871. [Google Scholar] [CrossRef]
- Alexander, M.E.; Kaiser, H.; Weyl, O.L.F.; Dick, J.T.A. Habitat simplification increases the impact of a freshwater invasive fish. Environ. Biol. Fishes 2015, 98, 477–486. [Google Scholar] [CrossRef] [Green Version]
Figure 1.
Sampling sites in the Geum River and Mankyeong/Dongjin River basins, along with geomorphological characteristics of streams and reservoirs. Symbol color indicates each site’s sampling period, and altitude is presented by color of the area. The light gray region marks the yellow sea; the dark gray part indicates land.

Figure 2.
Relationship between stream channel geomorphological characteristics (a) catchment area, (b)Altitude, and (c) stream gradient with the abundance of Largemouth bass from 664 samples. Gray dots and black triangles represent low weir impacted (QHEI scores between 0–10) sites and high weir impacted (samples of QHEI scores between 11–20). Regression lines (red) derived from low weir influenced samples are presented.
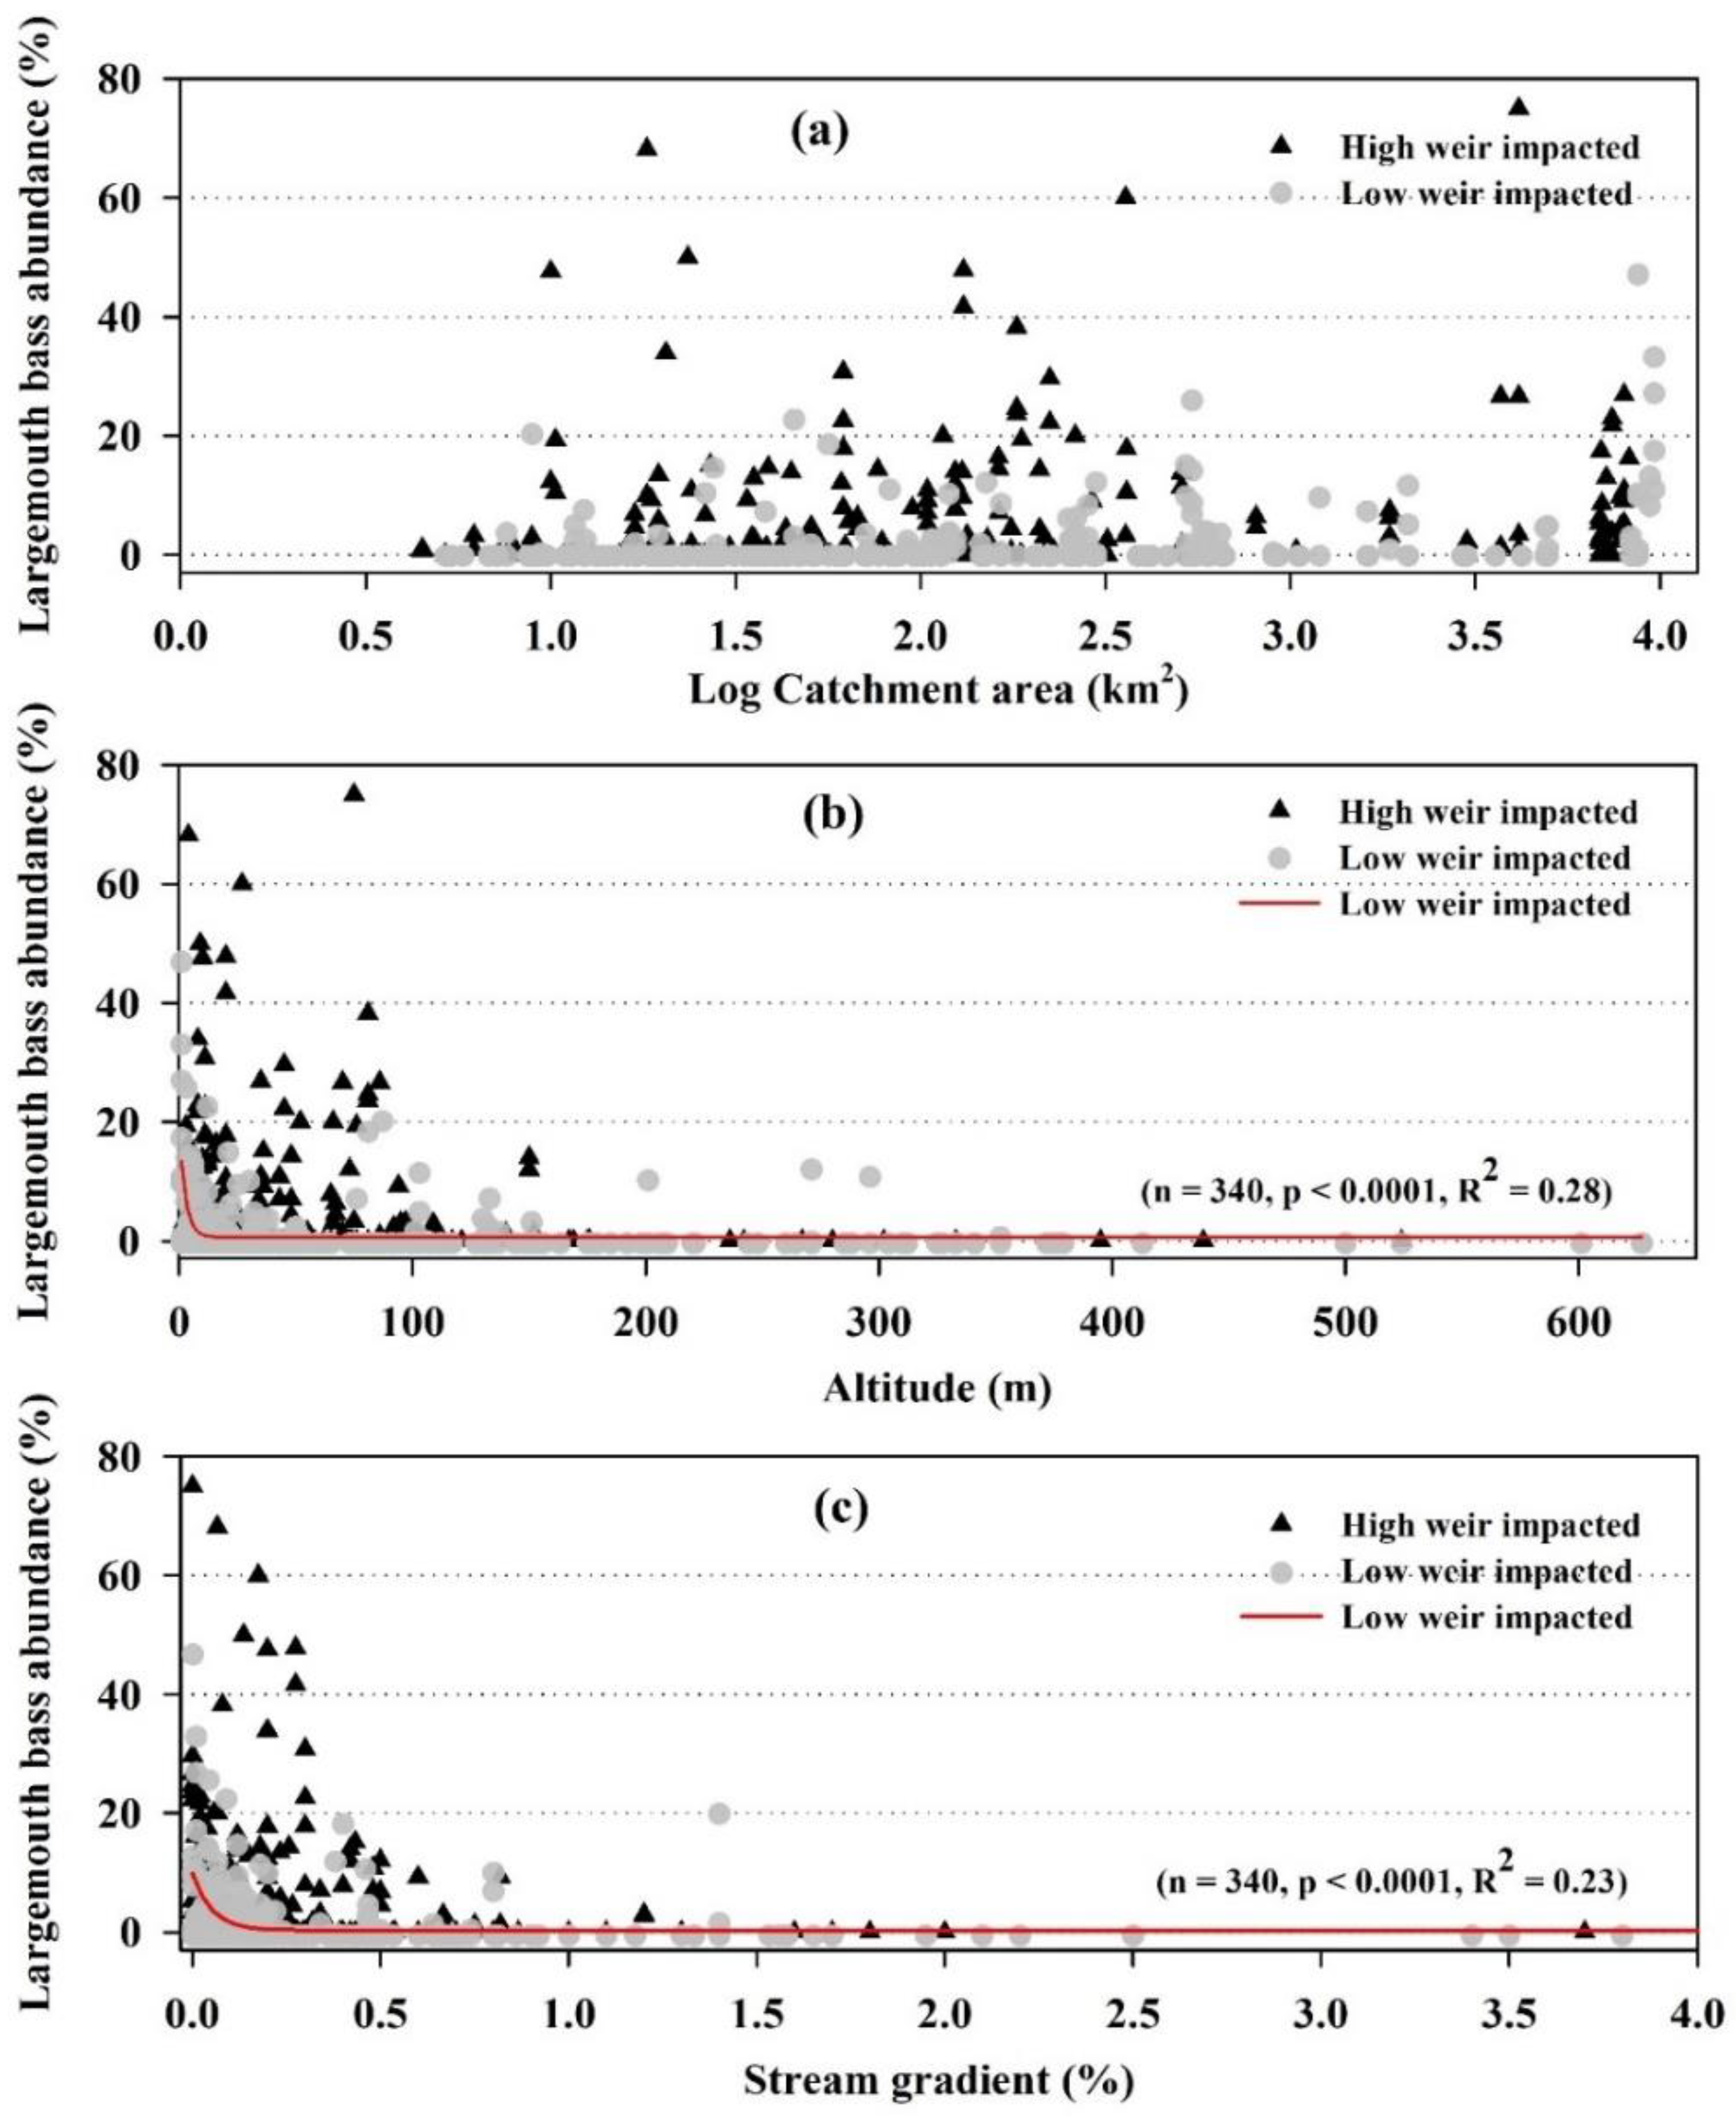
Figure 3.
Comparison of relative abundance (RA%) of largemouth bass between sites impacted by low and high weirs based on different ranges of the catchment area (a), altitude (b), and stream gradient (c). The catchment area values were processed after log transformation. (*: p < 0.05, **: p < 0.01, NS: Non-significant). Red lines denote mean.
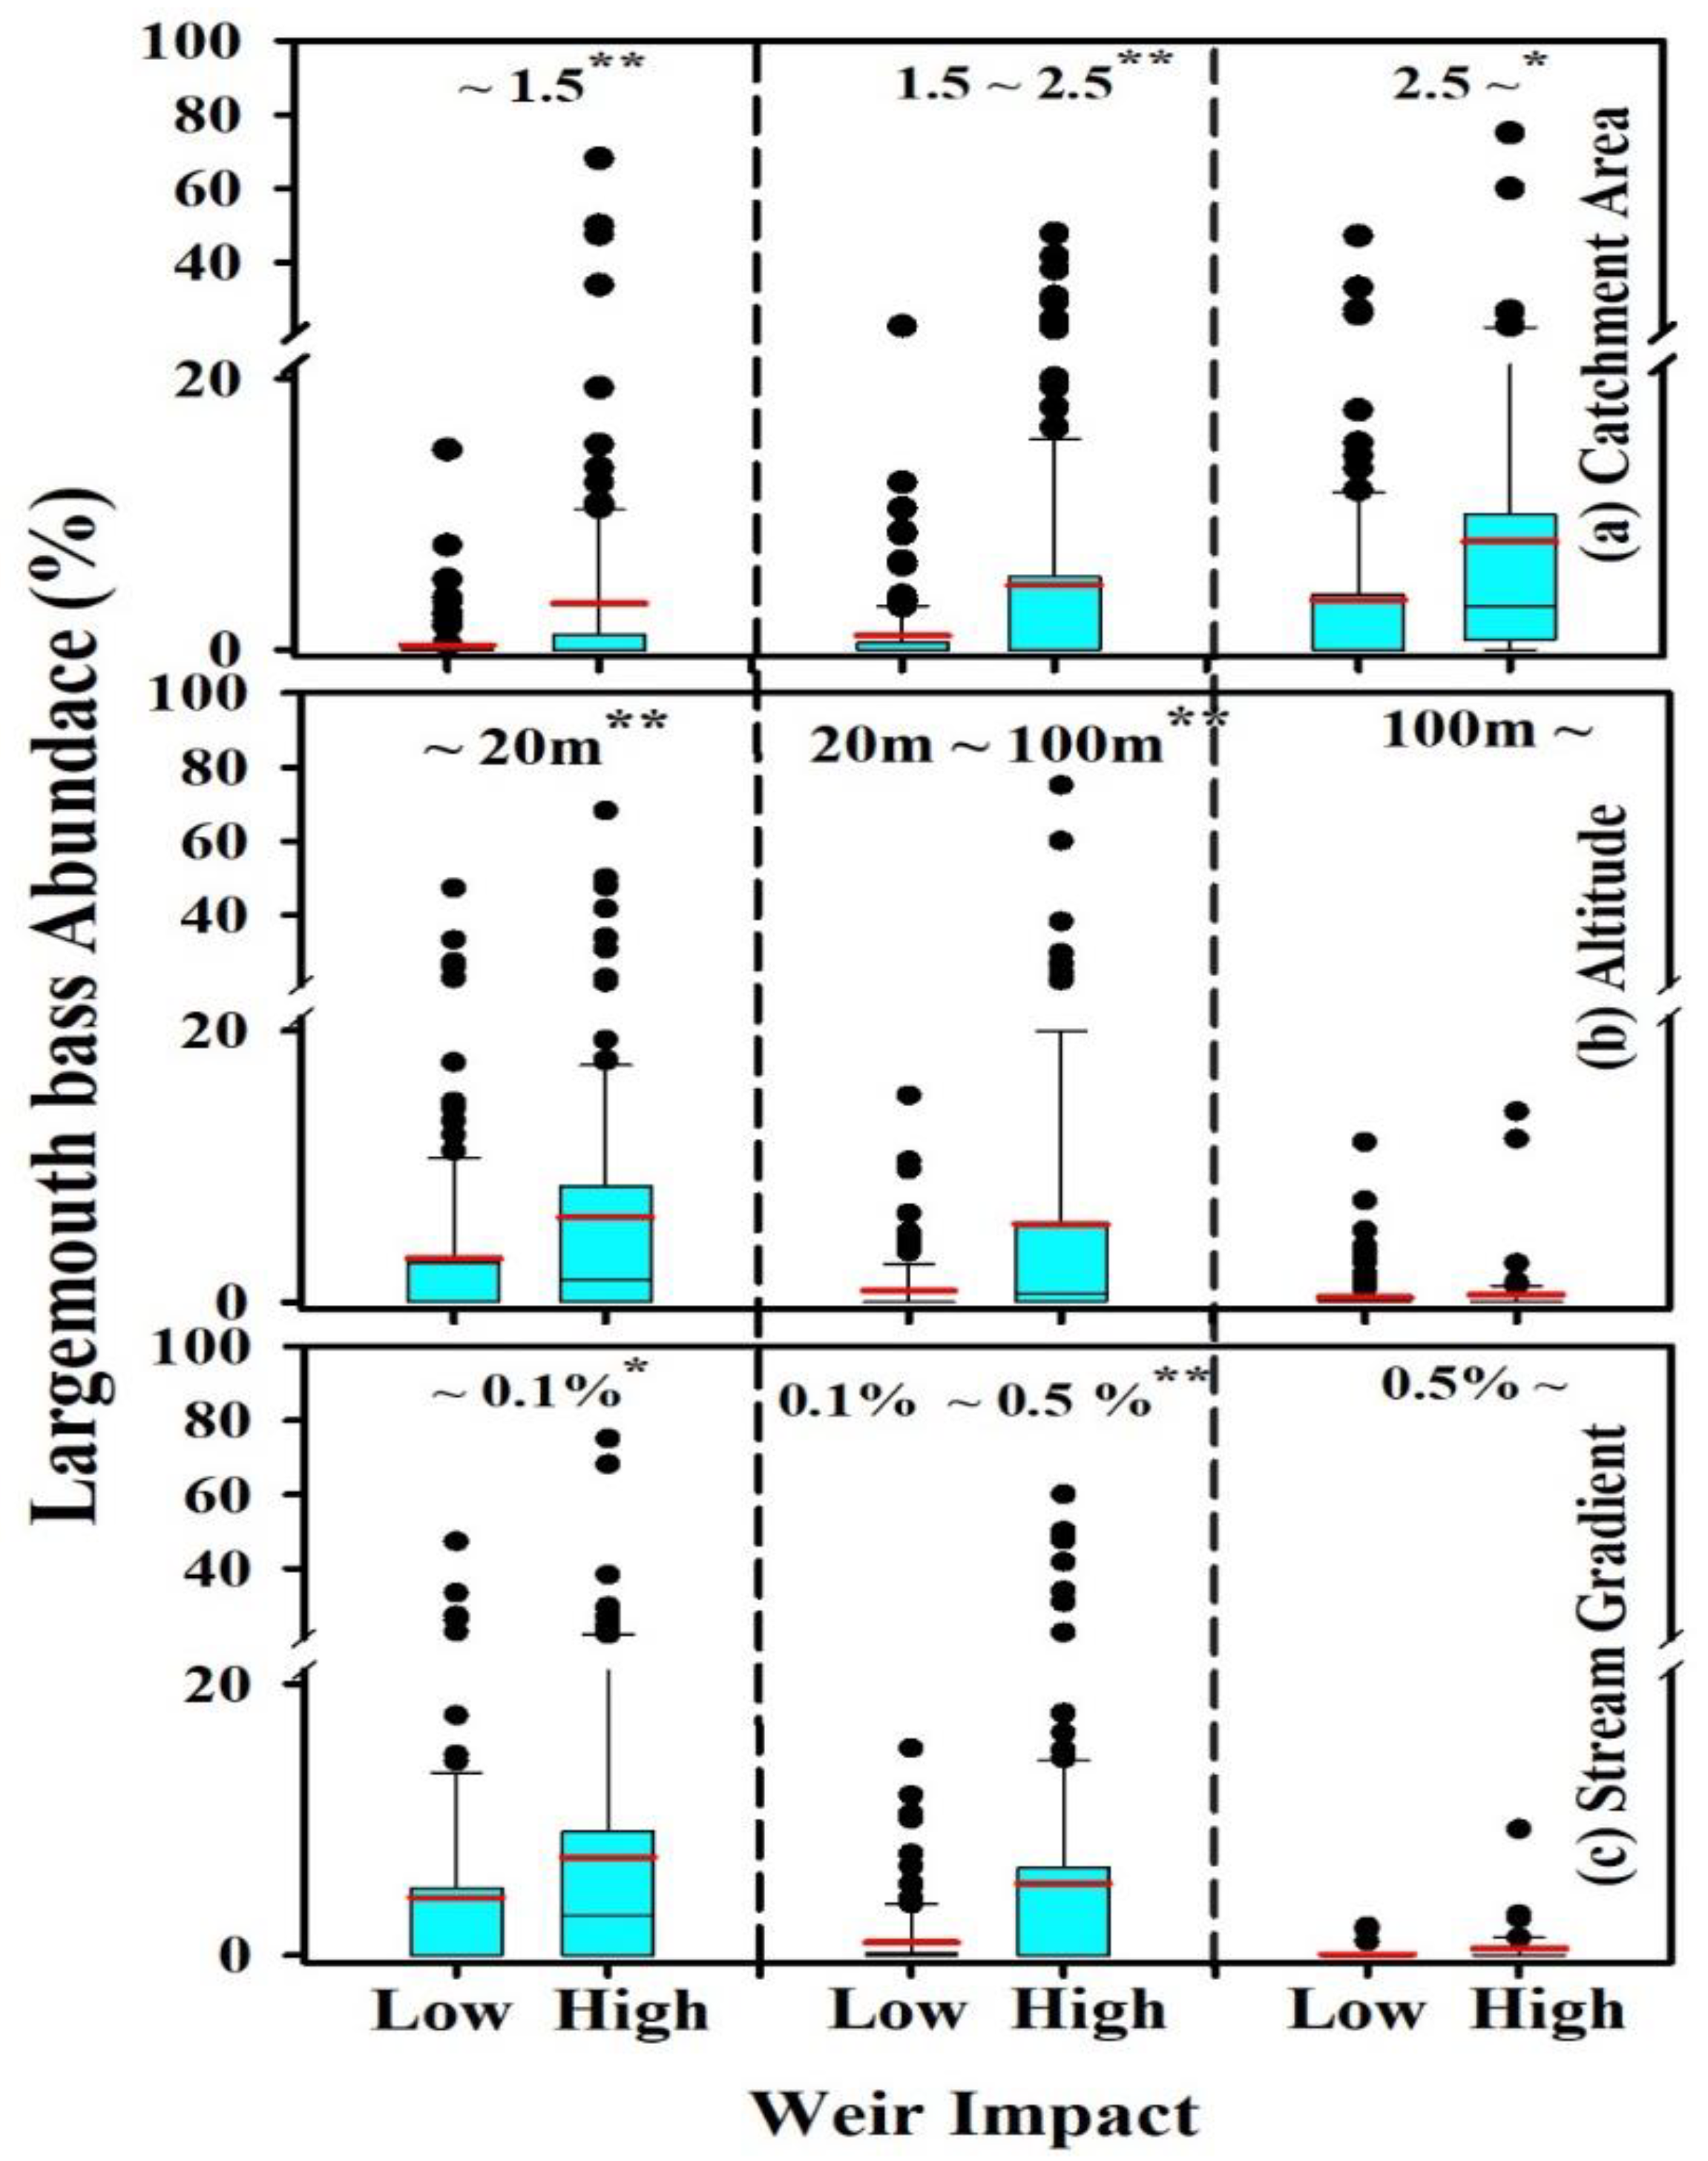
Figure 4.
Relationships between RA% of (a) largemouth bass and TNI, and links between native individuals and (b) native insectivores (c) native omnivores, and (d) native carnivores illustrating on the composition dynamics of native fish communities. Spearman’s correlation coefficient (r), statistical significance (p), and the number of samples (n) are also mentioned.
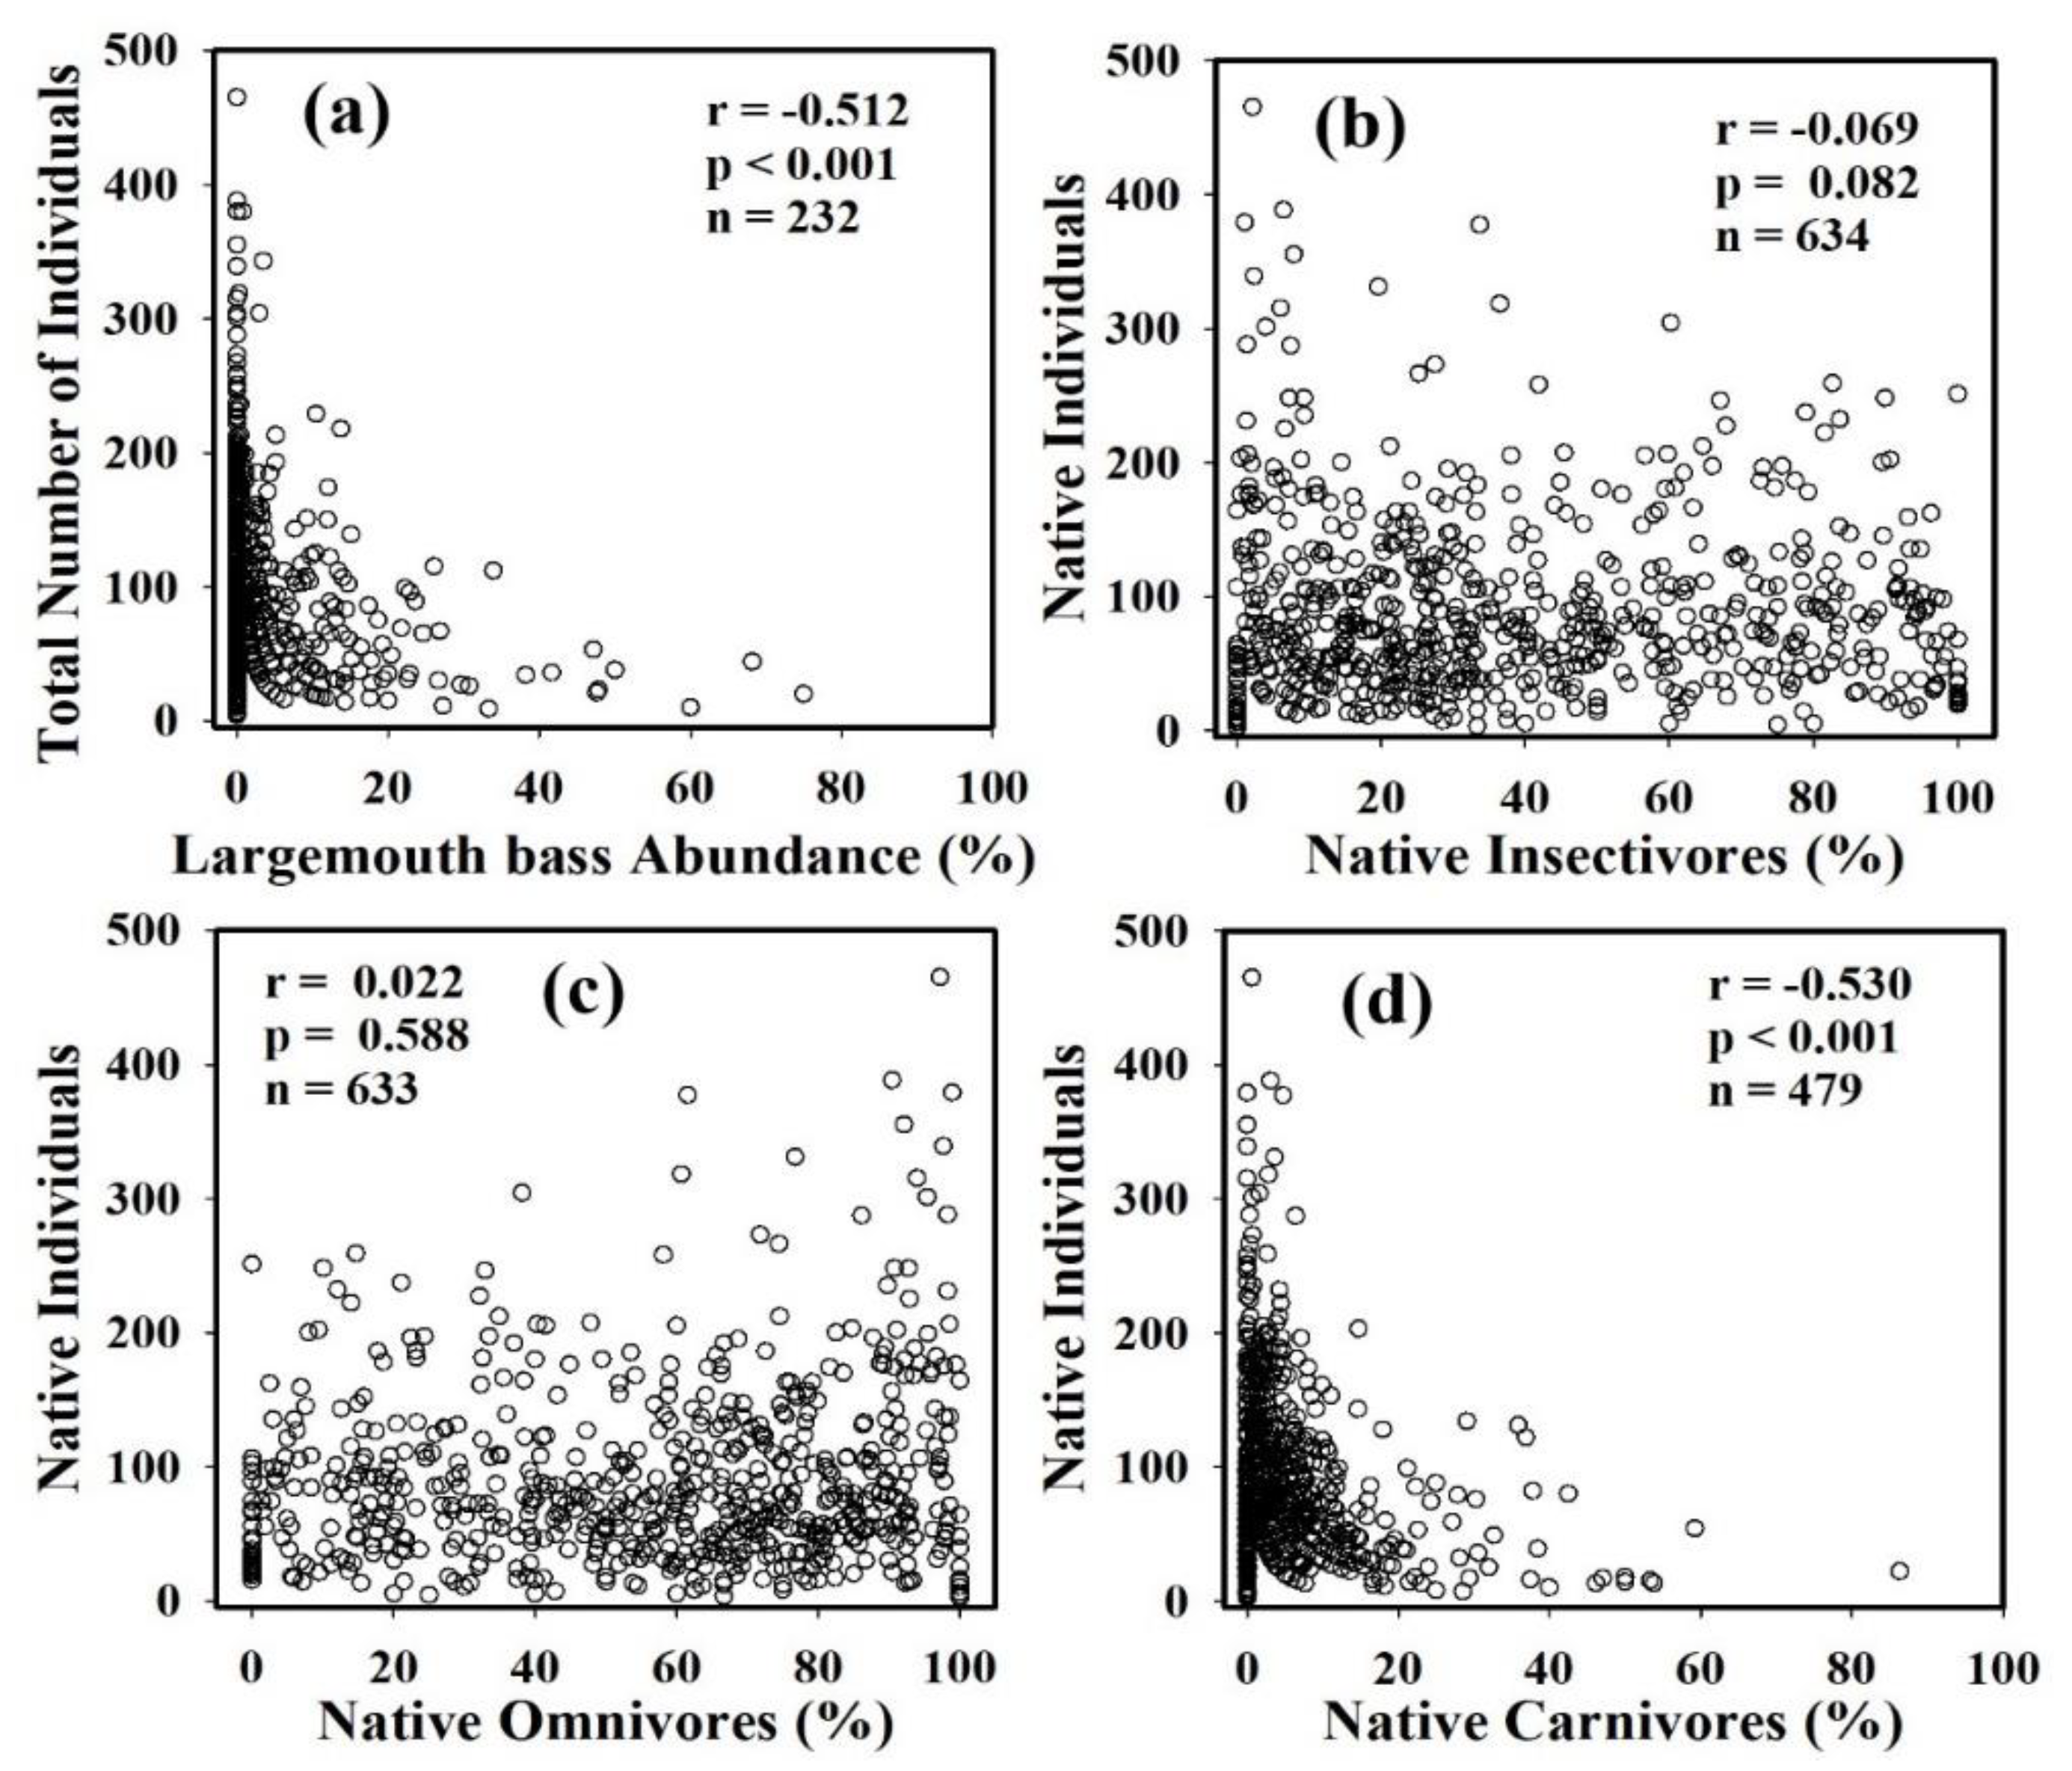
Figure 5.
Relationships between largemouth bass abundance (%) and (a–c) native trophic guild and (d–f) native tolerance guild in study sites. Spearman’s correlation coefficient (r), statistical significance (p), and the number of samples (n) are also mentioned.
Figure 5.
Relationships between largemouth bass abundance (%) and (a–c) native trophic guild and (d–f) native tolerance guild in study sites. Spearman’s correlation coefficient (r), statistical significance (p), and the number of samples (n) are also mentioned.

Figure 6.
The PCA plot shows the relationships of largemouth bass with (a) habitat and geomorphological features and (b) water quality and geomorphological characteristics. Gray dots: sites without largemouth bass; black dots: sites with largemouth bass.
Figure 6.
The PCA plot shows the relationships of largemouth bass with (a) habitat and geomorphological features and (b) water quality and geomorphological characteristics. Gray dots: sites without largemouth bass; black dots: sites with largemouth bass.
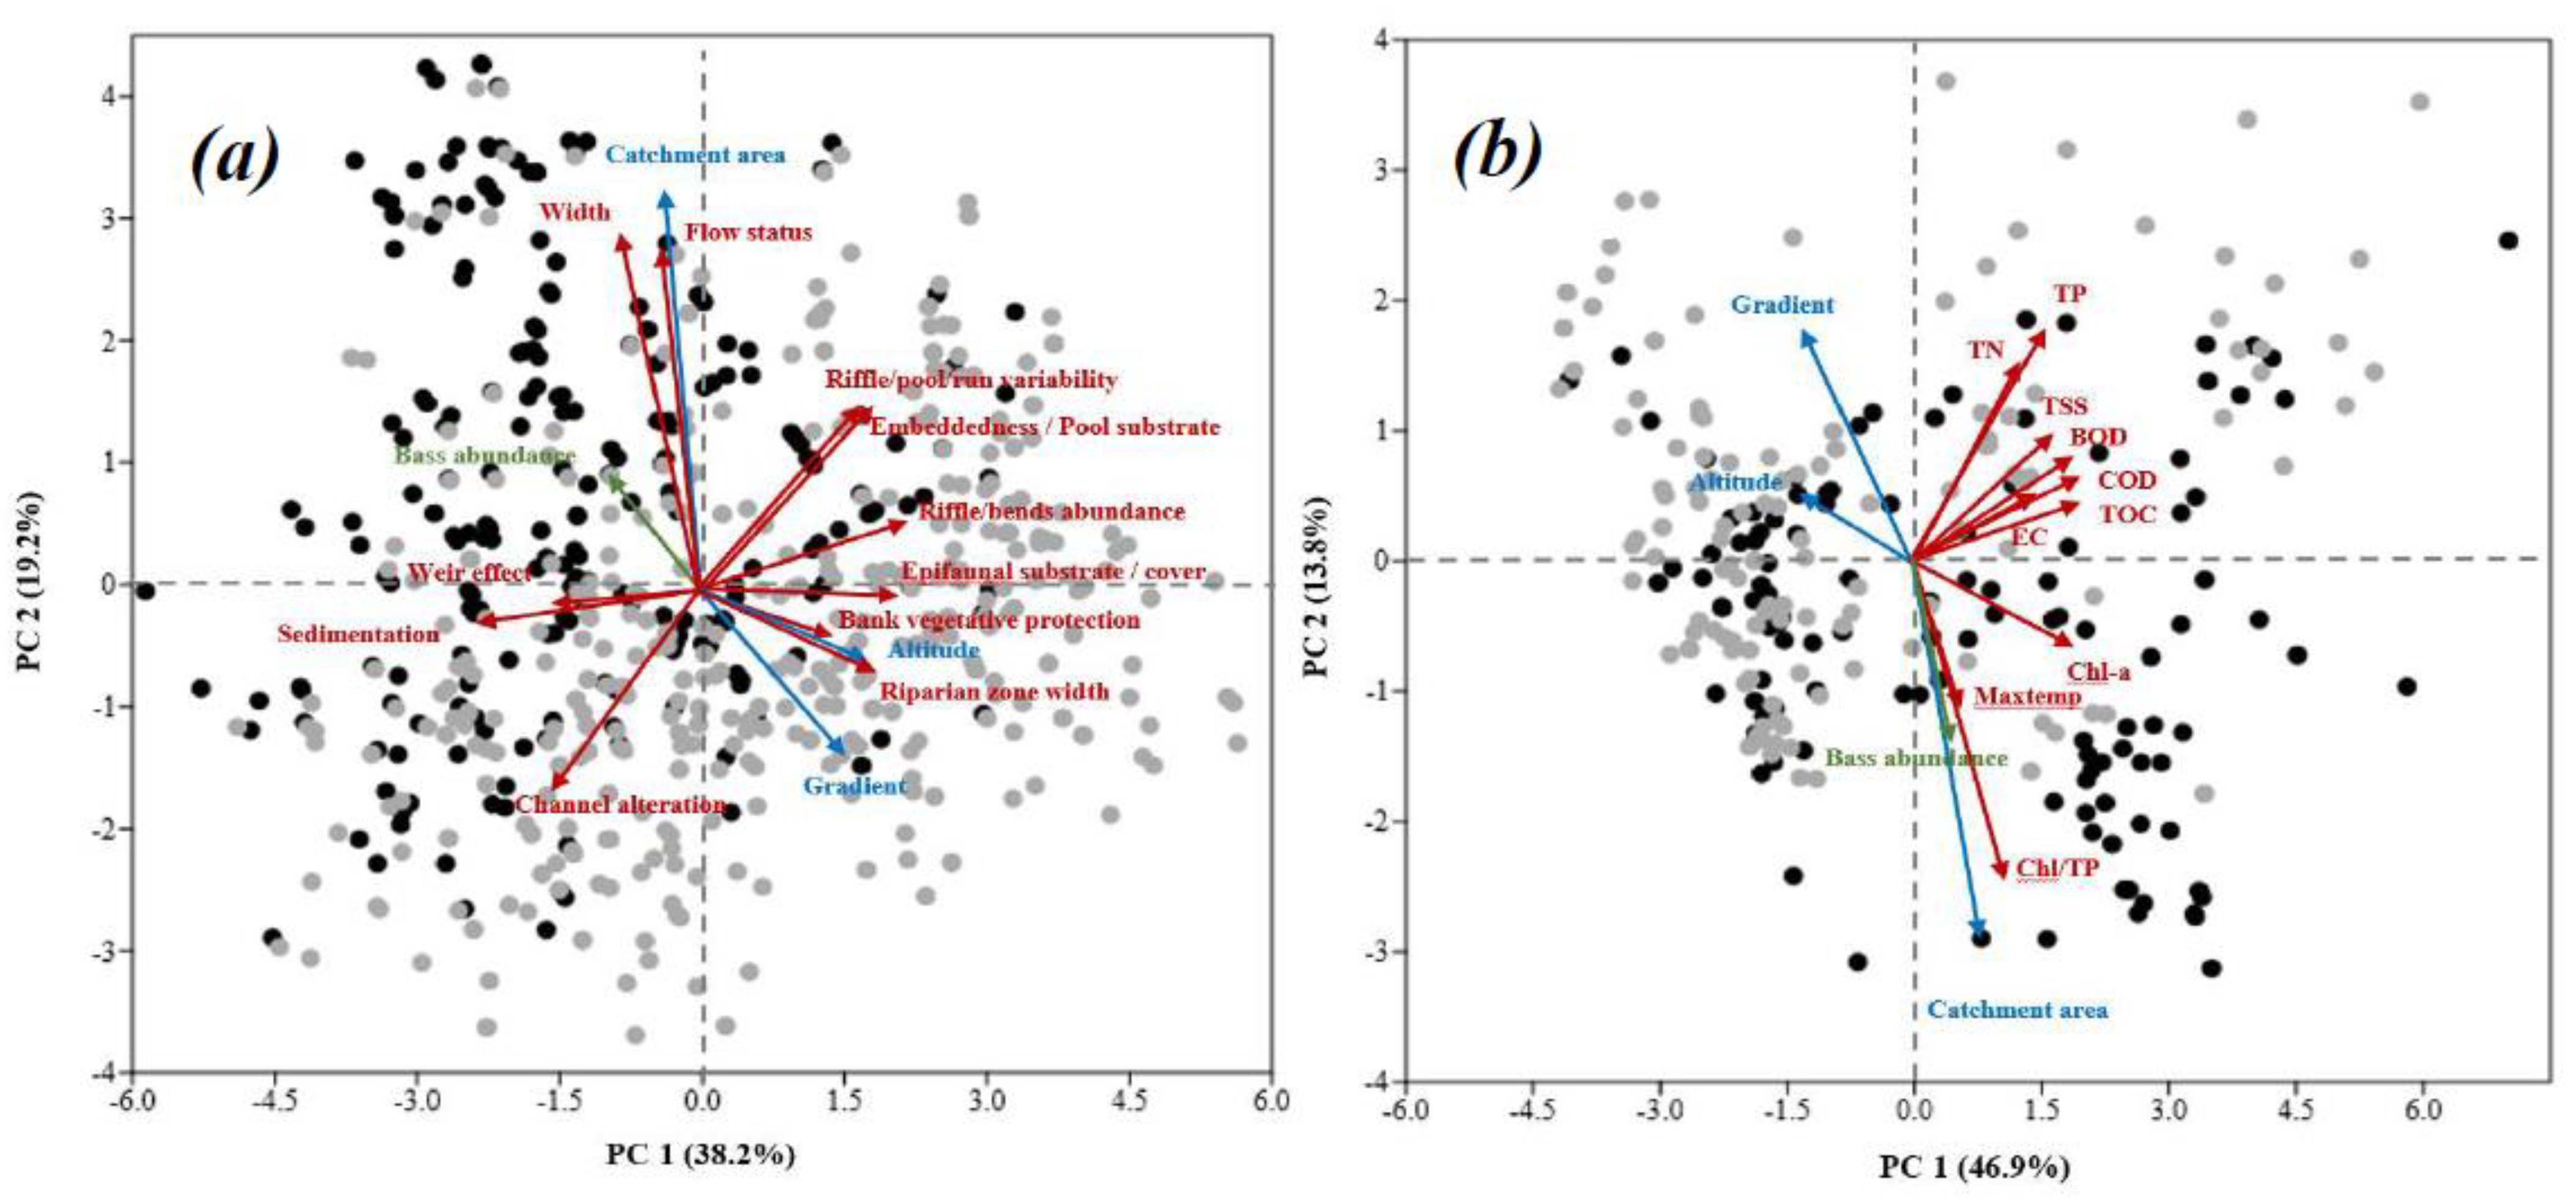
Figure 7.
Relationship between native fish community-based ecological health assessment following the IBI scores and largemouth bass’s relative abundance (RA%). Spearman’s correlation coefficient (rs), statistical significance (p), and the number of samples (n) are also presented.
Figure 7.
Relationship between native fish community-based ecological health assessment following the IBI scores and largemouth bass’s relative abundance (RA%). Spearman’s correlation coefficient (rs), statistical significance (p), and the number of samples (n) are also presented.

Figure 8.
Largemouth bass abundance vs. ecological health assessment based on IBI; geographical comparisons in the two rivers watershed indicate intensifying largemouth bass abundance (%) and declining environmental health based on native fish assemblages.
Figure 8.
Largemouth bass abundance vs. ecological health assessment based on IBI; geographical comparisons in the two rivers watershed indicate intensifying largemouth bass abundance (%) and declining environmental health based on native fish assemblages.


Table 1.
Summary of environmental variables including geomorphological characteristics, physicochemical water quality factors, flow, and maximum summer temperature related to the mean values with a standard deviation of sites with largemouth bass presence and absence. Statistical significance (p-value) from the t-test and Spearman’s correlation coefficients are also presented (*: p < 0.05, **: p < 0.01, NS: Non-significant). The values in parenthesis are the standard deviations: (SD).
| Variables | Abbr. & Unit | Largemouth Bass | Significance (t-Test) | SpearMan’s Coefficient | ||
|---|---|---|---|---|---|---|
| Overall (SD) | Bass Present (SD) | Bass Absent (SD) | ||||
| Geomorphological stream characteristics | ||||||
| Stream order | - | 3.1 (1.3) | 3.7 (1.3) | 2.7 (1.1) | ** | 0.332 ** |
| Catchment area (km2) | - | 604.9 (1754.0) | 1135.8 (2448.2) | 173.2 (554.9) | ** | 0.321 ** |
| Altitude (m) | - | 89.3 (113.1) | 43.6 (57.8) | 126.5 (132.1) | ** | −0.351 ** |
| Stream gradient (%) | Gradient | 0.53 (0.79) | 0.21 (0.26) | 0.79 (0.96) | ** | −0.462 ** |
| Stream width (m) | Width | 130.7 (175.4) | 207.2 (233.2) | 68.9 (57.7) | ** | 0.392 ** |
| Physicochemical water quality | ||||||
| pH | - | 7.9 (0.4) | 7.9 (0.4) | 7.9 (0.4) | NS | NS |
| Dissolved oxygen | DO (mg/L) | 10.0 (1.1) | 10.0 (1.1) | 10.0 (1.1) | NS | NS |
| Biological oxygen demand | BOD (mg/L) | 2.2 (1.8) | 2.6 (2.0) | 1.8 (1.6) | ** | 0.250 ** |
| Chemical oxygen demand | COD (mg/L) | 5.8 (3.2) | 6.5 (3.4) | 5.3 (2.9) | ** | 0.210 ** |
| Total suspended solids | TSS (mg/L) | 9.3 (10.0) | 10.6 (9.6) | 8.1 (10.3) | * | 0.242 ** |
| Total nitrogen | TN (mg/L) | 2.5 (1.1) | 2.6 (1.1) | 2.4 (1.1) | NS | 0.158** |
| Total phosphorus | TP (µg/L) | 71.1 (59.9) | 77.0 (47.2) | 66.1 (68.5) | NS | 0.233 ** |
| Total organic carbon | TOC (mg/L) | 3.6 (2.0) | 4.1 (2.0) | 3.2 (1.9) | ** | 0.232 ** |
| Electrical conductivity | EC (mS/cm) | 283.8 (132.8) | 306.3 (116.1) | 264.9 (143.1) | * | 0.225 ** |
| Chlorophyll-a | Chl-a (µg/L) | 22.0 (26.4) | 30.3 (30.4) | 14.2 (19.2) | ** | 0.291 ** |
| Chlorophyll-a: TP | CHL/TP | 0.32 (0.27) | 0.42 (0.31) | 0.25 (0.21) | ** | 0.295 ** |
| Flow (m3/s) | - | 16.1 (22.8) | 19.4 (25.2) | 14.0 (21.1) | ** | 0.308 ** |
| Max. summer temperature | Max temp (°C) | 28.5 (3.1) | 29.1 (2.7) | 27.9 (3.3) | ** | 0.199 ** |
Table 2.
Summary of qualitative habitat evaluation index (QHEI) metrics based on sites with largemouth bass presence, absence. Statistical significance (p-value) from the t-test and Spearman’s correlation coefficients are also presented. (*: p < 0.05, **: p < 0.01, NS: Non-significant). The values in parenthesis are the standard deviations: (SD).
| QHEI Metrics | Abbr. | Largemouth Bass | Significance (t-Test) | Spearman’s Coefficient | ||
|---|---|---|---|---|---|---|
| Overall (SD) | Present (SD) | Absent (SD) | ||||
| Epifaunal substrate/available cover (0–20) | M1 | 12.8 (5.5) | 10.2 (4.7) | 14.2 (5.4) | ** | −0.349 ** |
| Embeddedness (0–20) | M2-1 | 7.1 (5.8) | 9.3 (4.9) | 6.7 (5.9) | ** | 0.194 ** |
| Pool substrate characterization (0–20) | M2-2 | 13.7 (4.5) | 12.9 (4.0) | 14.5 (4.9) | ** | −0.202 ** |
| Velocity/depth combinations (0–20) | M3-1 | 11.8 (4.7) | 10.8 (4.2) | 12.2 (4.8) | ** | −0.124 * |
| Pool variability (0–20) | M3-2 | 13.9 (3.5) | 12.8 (3.0) | 15.2 (3.6) | ** | −0.351 ** |
| Sediment deposition (0–20) | M4 | 11.0 (6.3) | 14.0 (4.3) | 9.4 (6.6) | ** | 0.327 ** |
| Channel flow status (0–20) | M5 | 15.4 (4.1) | 17.0 (3.4) | 14.5 (4.1) | ** | 0.330 ** |
| Channel alteration (0–20) | M6 | 8.6 (4.1) | 8.9 (4.1) | 8.4 (4.1) | NS | NS |
| Frequency of riffles (0–20) | M7-1 | 10.4 (5.9) | 8.0 (5.1) | 11.1 (6.0) | ** | −0.231 ** |
| Channel sinuosity (0–20) | M7-2 | 8.3 (4.5) | 7.3 (3.7) | 9.6 (5.2) | ** | −0.219 ** |
| Bank stability (0–20) | M8 | 19.3 (2.1) | 19.6 (1.4) | 19.2 (2.4) | NS | NS |
| Bank vegetative protection (0–20) | M9 | 14.2 (4.6) | 13.1 (4.7) | 14.8 (4.5) | ** | −0.198 ** |
| Riparian vegetative zone width (0–20) | M10 | 10.9 (5.5) | 8.7 (5.2) | 12.0 (5.3) | ** | −0.302 ** |
| Weir effect (0–20) | M11 | 7.3 (7.2) | 10.4 (7.3) | 5.7 (6.6) | ** | 0.319 ** |
Table 3.
Sampled fish species based on trophic and tolerance guild attributions, origin, and RA% in relation to largemouth bass.
Table 3.
Sampled fish species based on trophic and tolerance guild attributions, origin, and RA% in relation to largemouth bass.
| Scientific Name | Tro. G. | Tol. G. | Ori | GR Basin | MDR Basin | TNI | RA (%) | Presence Sites (n = 303) | Const. (%) | ||
|---|---|---|---|---|---|---|---|---|---|---|---|
| Fish ind. | RA (%) | Fish ind. | RA (%) | ||||||||
| Zacco platypus | O | IS | N | 12,784 | 28.0 | 3593 | 21.8 | 16,377 | 26.4 | 252 | 83.2 |
| Zacco koreanus | I | SS | N | 6590 | 14.4 | 1884 | 11.5 | 8474 | 13.6 | 137 | 45.2 |
| Carassius auratus | O | TS | N | 2721 | 6.0 | 1755 | 10.7 | 4476 | 7.2 | 183 | 60.4 |
| Acheilognathus lanceolatus | O | IS | N | 2214 | 4.8 | 148 | 0.9 | 2362 | 3.8 | 147 | 48.5 |
| Rhinogobius brunneus | I | IS | N | 1802 | 3.9 | 427 | 2.6 | 2229 | 3.6 | 199 | 65.7 |
| Pungtungia herzi | I | IS | N | 1779 | 3.9 | 385 | 2.3 | 2164 | 3.5 | 152 | 50.2 |
| Pseudogobio esocinus | I | IS | N | 1706 | 3.7 | 330 | 2.0 | 2036 | 3.3 | 184 | 60.7 |
| Pseudorasbora parva | O | TS | N | 954 | 2.1 | 572 | 3.5 | 1526 | 2.5 | 117 | 38.6 |
| Hemiculter eigenmanni | O | TS | N | 610 | 1.3 | 873 | 5.3 | 1483 | 2.4 | 83 | 27.4 |
| Rhynchocypris oxycephalus | I | SS | N | 1046 | 2.3 | 292 | 1.8 | 1338 | 2.2 | 72 | 23.8 |
| Micropterus salmoides | C | TS | E | 801 | 1.8 | 493 | 3.0 | 1294 | 2.1 | 138 | 45.5 |
| Squalidus japonicus coreanus | O | TS | N | 793 | 1.7 | 490 | 3.0 | 1283 | 2.1 | 66 | 21.8 |
| Oryzias sinensis | O | TS | N | 786 | 1.7 | 397 | 2.4 | 1183 | 1.9 | 58 | 19.1 |
| Lepomis macrochirus | I | TS | E | 774 | 1.7 | 312 | 1.9 | 1086 | 1.7 | 70 | 23.1 |
| Iksookimia koreensis | I | IS | N | 707 | 1.5 | 323 | 2.0 | 1030 | 1.7 | 110 | 36.3 |
| Hemibarbus labeo | I | TS | N | 729 | 1.6 | 202 | 1.2 | 931 | 1.5 | 92 | 30.4 |
| Odontobutis interrupta | C | IS | N | 736 | 1.6 | 176 | 1.1 | 912 | 1.5 | 171 | 56.4 |
| Acheilognathus koreensis | O | IS | N | 739 | 1.6 | 6 | 0.0 | 745 | 1.2 | 46 | 15.2 |
| Coreoleuciscus splendidus | I | SS | N | 665 | 1.5 | 28 | 0.2 | 693 | 1.1 | 56 | 18.5 |
| Zacco temminckii | I | SS | N | 23 | 0.1 | 665 | 4.0 | 688 | 1.1 | 10 | 3.3 |
| Opsarichthys uncirostris amurensis | C | TS | N | 486 | 1.1 | 122 | 0.7 | 608 | 1.0 | 90 | 29.7 |
| Squalidus gracilis majimae | I | IS | N | 272 | 0.6 | 279 | 1.7 | 551 | 0.9 | 55 | 18.2 |
| Rhodeus notatus | O | IS | N | 369 | 0.8 | 166 | 1.0 | 535 | 0.9 | 53 | 17.5 |
| Misgurnus anguillicaudatus | O | TS | N | 367 | 0.8 | 163 | 1.0 | 530 | 0.9 | 116 | 38.3 |
| Squaliobarbus curriculus | O | IS | N | 456 | 1.0 | 27 | 0.2 | 483 | 0.8 | 44 | 14.5 |
| Hemibarbus longirostris | I | IS | N | 421 | 0.9 | 42 | 0.3 | 463 | 0.7 | 95 | 31.4 |
| Acanthorhodeus macropterus | O | IS | N | 361 | 0.8 | 85 | 0.5 | 446 | 0.7 | 43 | 14.2 |
| Tridentiger brevispinis | I | IS | N | 389 | 0.9 | 48 | 0.3 | 437 | 0.7 | 60 | 19.8 |
| Acanthorhodeus gracilis | O | IS | N | 218 | 0.5 | 213 | 1.3 | 431 | 0.7 | 54 | 17.8 |
| Microphysogobio yaluensis | O | IS | N | 392 | 0.9 | 23 | 0.1 | 415 | 0.7 | 74 | 24.4 |
| Rhodeus uyekii | O | IS | N | 289 | 0.6 | 115 | 0.7 | 404 | 0.7 | 53 | 17.5 |
| Pseudopungtungia nigra | I | SS | N | 332 | 0.7 | 332 | 0.5 | 25 | 8.3 | ||
| Odontobutis platycephala | C | SS | N | 228 | 0.5 | 95 | 0.6 | 323 | 0.5 | 85 | 28.1 |
| Total number of species | 68 | 63 | 74 | ||||||||
| Total number of individuals | 45,677 | 16,444 | 62,121 | ||||||||
Note: I: Insectivore, O: Omnivore, C: Carnivore, H: Herbivore, TS: Tolerant species, IS: Intermediate species, SS: Sensitive species, Ori. Origin, N: Native, E: Exotic, Const.: Constancy value, GR: Geum River, MDR: Mankyong/Dongjin River, Ind: Individuals.
Table 4.
The number of sites of occurrence, constancy, and mean dominance in areas of occurrence of largemouth bass and native carnivore fish species according to the different stream gradient range.
Table 4.
The number of sites of occurrence, constancy, and mean dominance in areas of occurrence of largemouth bass and native carnivore fish species according to the different stream gradient range.
| Native vs. Invasive | Number of Sites | Constancy Value | Mean Dominance at Sites of Occurrence | |||||||||
|---|---|---|---|---|---|---|---|---|---|---|---|---|
| ~0.1% n = 80 | 0.1~0.5% n = 128 | 0.5%~ n = 95 | Total Sites n = 303 | ~0.1% | 0.1~0.5% | 0.5%~ | Total Sites | ~0.1% | 0.1~0.5% | 0.5%~ | Total Sites | |
| Invasive carnivore species | ||||||||||||
| Micropterus salmoides | 62 | 64 | 12 | 138 | 77.5 | 50.0 | 12.6 | 45.5 | 9.92 | 8.62 | 5.61 | 9.1 |
| Native carnivore species | ||||||||||||
| Odontobutis interrupta | 39 | 84 | 48 | 171 | 48.8 | 65.6 | 50.5 | 56.4 | 4.97 | 5.52 | 7.26 | 5.9 |
| Opsarichthys uncirostris | 42 | 46 | 1 | 89 | 52.5 | 35.9 | 1.1 | 29.4 | 7.94 | 4.22 | 1.85 | 6.3 |
| Odontobutis platycephala | 4 | 41 | 40 | 85 | 5.0 | 32.0 | 42.1 | 28.1 | 1.37 | 2.79 | 3.84 | 3.2 |
| Erythroculter erythropterus | 31 | 5 | 0 | 36 | 38.8 | 3.9 | 0.0 | 11.9 | 8.64 | 2.86 | NA | 7.8 |
| Pseudobagrus fulvidraco | 29 | 35 | 6 | 70 | 36.3 | 27.3 | 6.3 | 23.1 | 2.97 | 2.52 | 2.79 | 2.8 |
| Coreoperca herzi | 3 | 27 | 20 | 50 | 3.8 | 21.1 | 21.1 | 16.5 | 3.25 | 3.10 | 2.85 | 3.0 |
| Silurus asotus | 12 | 19 | 7 | 38 | 15.0 | 14.8 | 7.4 | 12.5 | 2.12 | 2.44 | 2.90 | 2.4 |
| Channa argus | 9 | 7 | 3 | 19 | 11.3 | 5.5 | 3.2 | 6.3 | 3.81 | 2.57 | 0.85 | 2.9 |
| Siniperca scherzeri | 2 | 12 | 1 | 15 | 2.5 | 9.4 | 1.1 | 5.0 | 0.67 | 1.50 | 3.33 | 1.5 |
| Monopterus albus | 5 | 9 | 3 | 17 | 6.3 | 7.0 | 3.2 | 5.6 | 1.90 | 1.26 | 1.58 | 1.5 |
| Anguilla japonicai | 1 | 0 | 0 | 1 | 1.3 | 0.0 | 0.0 | 0.3 | 0.85 | NA | NA | 0.9 |
Table 5.
Ecological health status based on multi-metric IBI, with standard deviation for each metric from largemouth bass present/absent sites. Statistical significance was analyzed with a t-test between largemouth bass presence and absence samples.
Table 5.
Ecological health status based on multi-metric IBI, with standard deviation for each metric from largemouth bass present/absent sites. Statistical significance was analyzed with a t-test between largemouth bass presence and absence samples.
| Category | Metrics | Scoring Criteria | Bass Present | Bass Absent | df | Significance Level (t-Test) | ||
|---|---|---|---|---|---|---|---|---|
| 5 | 3 | 1 | ||||||
| Species richness and composition | M1. Total number of native fish species | Metric score vary with stream order | 3.2 (1.5) | 3.9 (1.3) | 661 | ** | ||
| M2. Number of riffle benthic dwelling species | Metric score vary with stream order | 1.5 (1.1) | 1.6 (1.2) | 510.3 | NS | |||
| M3. Number of sensitive species | Metric score vary with stream order | 1.1 (0.4) | 1.9 (1.3) | 548.6 | ** | |||
| M4. Proportion of individual as tolerant species | <5% | 5~20% | >20% | 3.6 (1.5) | 4.3 (1.4) | 423.2 | ** | |
| Trophic composition | M5. Proportion of individuals as tolerant species | <20% | 20~45% | >45% | 2.2 (1.3) | 3.0 1.6) | 580.9 | ** |
| M6. Proportion of individuals as native insectivore species | >45% | 20~45% | <20% | 2.5 (1.5) | 3.4 (1.7) | 521.2 | ** | |
| Fish abundance and condition | M7. Total number of native individuals | Metric score vary with stream order | 2.6 (1.7) | 3.4 (1.6) | 661 | ** | ||
| M8. Proportion of individuals as abnormalities | 0 | 0~1 | >1 | 4.6 (1.0) | 4.8 (0.9) | 406.4 | NS | |
| Total scores | 21.4 (4.9) | 26.3 (6.2) | 572.9 | |||||
df: Degree of freedom, *: p < 0.05, **: p < 0.01, NS: No significant.
Publisher’s Note: MDPI stays neutral with regard to jurisdictional claims in published maps and institutional affiliations. |
© 2021 by the authors. Licensee MDPI, Basel, Switzerland. This article is an open access article distributed under the terms and conditions of the Creative Commons Attribution (CC BY) license (https://creativecommons.org/licenses/by/4.0/).
Share and Cite
MDPI and ACS Style
Kim, J.-J.; Atique, U.; An, K.-G. Key Drivers Influencing the Presence and Absence of Micropterus salmoides and Their Effect on Native Fish Communities and Biotic Integrity. Water 2021, 13, 3430. https://doi.org/10.3390/w13233430
AMA Style
Kim J-J, Atique U, An K-G. Key Drivers Influencing the Presence and Absence of Micropterus salmoides and Their Effect on Native Fish Communities and Biotic Integrity. Water. 2021; 13(23):3430. https://doi.org/10.3390/w13233430
Chicago/Turabian StyleKim, Jung-Jae, Usman Atique, and Kwang-Guk An. 2021. "Key Drivers Influencing the Presence and Absence of Micropterus salmoides and Their Effect on Native Fish Communities and Biotic Integrity" Water 13, no. 23: 3430. https://doi.org/10.3390/w13233430
Note that from the first issue of 2016, this journal uses article numbers instead of page numbers. See further details here.