
Analysis of Water Resources and Water Environmental Carrying Capacity of Animal Husbandry in China—Based on Water Footprint Theory


Institute of Agricultural Economics and Development, Chinese Academy of Agricultural Sciences, Beijing 100081, China
*
Author to whom correspondence should be addressed.
Water 2021, 13(23), 3386; https://doi.org/10.3390/w13233386
Submission received: 24 October 2021
/
Revised: 22 November 2021
/
Accepted: 28 November 2021
/
Published: 1 December 2021
(This article belongs to the Section Water Resources Management, Policy and Governance)
Abstract
:Water shortage and water pollution have become the key factors restricting the sustainable development of animal husbandry in China. In this study, the water footprint model was used to analyze the water resource carrying capacity and water environment bearing pressure of animal husbandry in 31 provinces of China from 2001 to 2019. The findings indicate that: (1) The development of animal husbandry has exacerbated the regional water deficiency problem. Shandong, Henan, Hebei, and Liaoning have become the most serious water deficit areas of animal husbandry in China. The decreasing water resource carrying capacity indicates that water resources are difficult in supporting the growth of animal husbandry; (2) the change of animal feeding structures has led to the decrease of gray water footprint and the alleviation of the water environment bearing pressure; however, the water environment of animal husbandry in northern China and the northwest is still overburdened, which poses a major challenge to the control of agricultural non-point source pollution; (3) furthermore, according to the spatial and temporal characteristics of the water resource carrying capacity and water environment bearing pressure, the main livestock-producing areas in the north are facing a profound “water-livestock” contradiction and showing an increasing trend. The research results will help decision-makers to adjust the development mode of animal husbandry, optimize resource allocation, and promote the sustainable development of resource-saving and environment-friendly animal husbandry.
1. Introduction
Since the reform and opening-up, China’s animal husbandry has made brilliant achievements, but at the same time, it has brought a series of resource and environmental problems. The country continues to expand domestic livestock products’ production and supply scale while facing severe resource and environmental challenges [1,2]. According to the Second National Pollutant Census Bulletin, the chemical oxygen demand (COD) discharged by livestock and poultry breeding industries reaches 10.053 million tons, accounting for 46.67% of the COD discharged by all pollutants in China and 93.76% of the COD discharged by agricultural pollutants. Animal husbandry is a large source of environmental water pollution [3]. In addition, a number of water resources need to be utilized throughout the processes, from feed grain production to livestock and poultry breeding, slaughtering, and processing. Further, as a high water consumption industry, animal husbandry also aggravates the shortage of water resources. However, for ensuring the high-quality development of animal husbandry, scientific measurement of water resources and the animal husbandry water environment bearing pressure will help us to better understand the supply and demand of water resources in animal husbandry and quantitatively analyze how water resources support or constrain animal husbandry in various regions of the country.
The concept of a water footprint was first offered by Hoekstra, as the number of water resources used for human production and consumption activities. The water footprint of an industry or a product refers to the total amount of water resources consumed by the industry and product throughout production and development [4]. Research on the water footprint is gradually growing. Researchers pay more attention to the utilization of water resources in agricultural production [5,6,7]. Several studies were carried out on the water footprint from the perspective of consumption. For example, Wahba Shimaa M [8] studied the impact of income and lifestyle differences on the imbalance of the water footprint within Egyptian households through follow-up investigation. Eva Gómez-Llanos [9] discussed consumers’ cognition of sustainable water consumption based on the concept of the water footprint. In China, researchers have carried out a large number of evaluation studies on regional or industrial water resource supply and demand by applying water footprint theory. For instance, Xiaomeng Wang et al. [10] and Guangyao Deng [11] measured China’s water footprint in the industrial sectors and China’s various industries on both sides of supply and demand, An’e Pan et al. [12] and Qingkai Shang et al. [13] discussed the utilization of water resources in Hubei and Qinghai, respectively, from the perspective of the water footprint. Regarding the utilization of water resources, Shikun Sun et al. [14] and Lijie Shi et al. [15] studied the water footprint and spatial differences of wheat, grain crops in the arid area of northwest China. In addition, Yi Yu et al. [16], Ximing Hou [17], Dengying Huang [18], and Jingru Cheng et al. [19] successively applied the water footprint theory to explore the animal husbandry water resource carrying capacity and evaluate regional animal husbandry water consumption. These studies have significantly enriched the research content and application fields of the water footprint, but few studies are available on the problem of the water footprint in the field of animal husbandry in China; moreover, these studies ignored the carrying capacity of water as a resource subject and an environmental subject for the development of animal husbandry, which is not conducive to accurately grasping the sustainability of water resources and the water environment with a background of high-quality development. Thus, with these research gaps in mind, this study focuses on the water utilization in the field of animal husbandry from the perspective of research and divides the guaranteed ability of water resources and water environment in the development of animal husbandry.
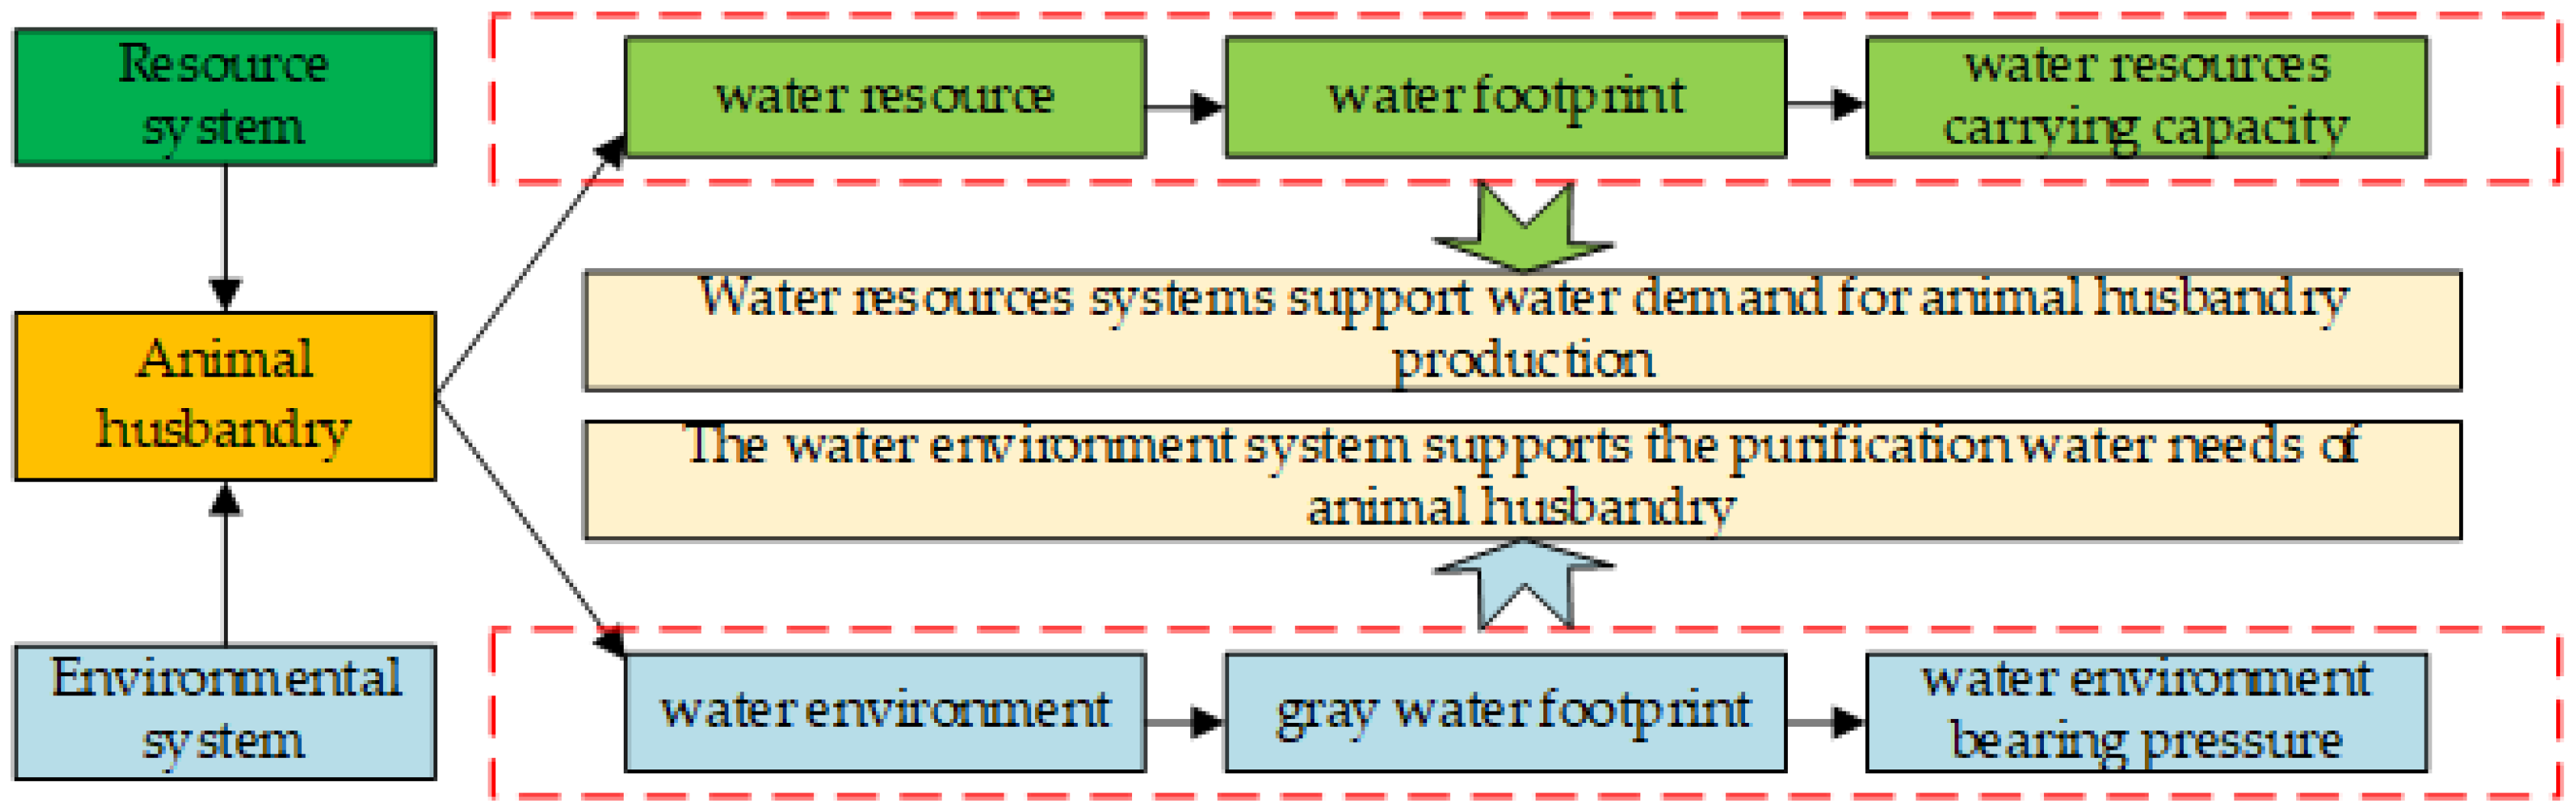
Animal husbandry is an important part of agriculture in China, and it is also a consumption and pollution industry that aggravates resource shortage and environmental pollution. In the future, it is necessary to continue to expand the scale of animal husbandry production to meet the needs of animal protein of Chinese residents. At the same time, the constraints of resource environment systems and policy environment on the sustainable development of animal husbandry are also increasing. In particular, the spatial dislocation of “water-livestock” brings major challenges to the sustainable development of animal husbandry. In response to the contradictory reality between the development of animal husbandry and water, based on the water footprint theory, this paper calculates the required level of supply and demand of water resources and water environment for developing animal husbandry, as water resources refer to the total amount of water resources required for human intervention, investment or livestock, and poultry production in the entire animal husbandry process, and water environment refers to the total amount of water resources required to eliminate livestock and poultry feces, and other pollutants from the natural environment. Therefore, this paper uses the water resource carrying capacity to measure the support capacity of the regional water resource system for the development of animal husbandry water resource demand, and the water environment bearing pressure to measure the support capacity of the regional water environment system for the purification of animal husbandry pollutants, such as COD(Figure 1). The essence of the two is the support performance of regional water bodies for the development of animal husbandry from the perspective of resources and environment. The study will explore the supply and demand of water resources and the water environment for animal husbandry across the country and sub-provinces. The carrying capacity of water resources and the carrying pressure of the water environment are calculated, and the problem of water use for animal husbandry is studied from the two aspects of water resource consumption and the environmental impact of pollutant discharge. Finally, the performance of spatial differences is explored by using the Dagum Gini coefficient to analyze the overall evolution trend and realize a green provider decision-making reference for the sustainable, high-quality development of animal husbandry.
2. Materials and Methods
2.1. Animal Husbandry Water Footprint and Carrying Capacity
2.1.1. Animal Husbandry Water Footprint
The animal husbandry water footprint is the total water resources consumed by all animal husbandry production links (including plant production links, such as feed and grain). It is the sum of all of the water for livestock and poultry diet, drinking water and cleaning, including virtual water contained in the feed, livestock, and poultry drinking water, and the livestock house cleaning water. In addition, the total water footprint should also include the gray water footprint of eliminating excess COD, TN, TP, and other pollutants. In this paper, the gray water footprint is separated to calculate the water environment bearing pressure, and only the carrying capacity of other water resources is analyzed in the animal husbandry water footprint. The animal husbandry water footprint calculation formula is mentioned below:
Equation (1). is an animal husbandry water footprint (108 m3); is the water footprint of species of livestock and poultry(m3); is the breeding scale of species of livestock and poultry (108 heads), where the scale of the average is calculated for beef cattle, cows, pigs, and meat sheep, and the annual scale of production is calculated for poultry.
Equations (2)–(4). , , and represent the water footprint of livestock feed, drinking water and cleaning services per unit i (m3); is the feed quantity for each animal in the whole life cycle (kg); is the water footprint of unit feed (m3); is the water charge for livestock and poultry through the whole life cycle (yuan); and is the price of water consumption (yuan/m3).
2.1.2. Animal Husbandry Water Resources Carrying Capacity
Equations (5)–(7). is the carrying capacity of water resources for livestock; is the supply amount of water resources for animal husbandry (108 m3); is the total water resources of the region (108 m3); is the industrial water consumption (108 m3); is the domestic water consumption (108 m3); is the ecological water supply (108 m3); is the water consumption of the planting industry (108 m3), which indicates the water for crop planting other than feed grains; is the regional livestock water surplus (108 m3); is the provincial livestock water deficit (108 m3).
2.2. Animal Husbandry Water Environment Bearing Pressure
2.2.1. Animal Husbandry Gray Water Footprint
The gray water footprint represents the total amount of water pollution caused by unrecycled livestock and poultry manure. This study uses the reference of existing research [20] to select COD for calculating the animal husbandry gray water footprint. The overall form of the framework is mentioned below:
Equations (8) and (9). is the animal husbandry gray water footprint (108 m3); is the gray water footprint of kinds of livestock and poultry (m3); is the specific gravity of dry manure, and is the specific gravity of water flushing feces (%); is the dry manure discharge coefficient, and is the coefficient of water flushing and excrement discharge; is the water intake rate of livestock and poultry manure (%); is the breeding time; livestock storage is based on 365 days, the poultry output is calculated based on 42 days; is the COD discharge standard of 20 mg/L based on the Class Ⅲ contaminant content of water stipulated in China’s “Environmental Quality Standard for Surface Water” (GB3838–2002). COD emission parameters in Table 1.
2.2.2. Animal Husbandry Water Environment Bearing Pressure
The equation for estimation water environment bearing pressure is specified as:
Equation (10). is the pressure of the animal husbandry water environment; is the total amount of water resources in the region (108 m3).
2.3. Dagum Gini Coefficient
The advantage of the Dagum Gini coefficient is that it can effectively solve the source problem of regional differences and describe the distribution of subsamples to solve the problem of cross overlap between samples [21]. The calculation formula of the Dagum Gini coefficient is represented as follows [22]:
Equations (11) and (12). ) is the level of carrying capacity of any province area in the region; is the national average bearing capacity; is the number of provinces; is the number of individual regions; ) is the number of provinces in ). Before calculating the Dagum Gini coefficient, it is necessary to rank the average development level of bearing capacity in each region, as shown in Equation (12).
Dagum C (1997) decomposes the Gini coefficient into the contribution g of the regional , the contribution of interregional disparities and the three parts of hypervariable density contribution such that . It should be noted that the hypervariable density contribution represents the contribution to the overall gap due to the presence of cross-terms when dividing molecular groups, and the without cross-terms is 0. The decomposition of the Dagum Gini coefficient is:
Equations (13)–(20). Equations (13) and (14) represent the Gini coefficient of the region and the contribution of the regional difference ; Equation (15) represents the Gini coefficient in the and regions; Equation (16) represents the contribution of the net worth difference between regions and ; Equation (17) represents the contribution of hypervariable density, where , , and ; Equation (18) represents the relative influence of the bearing capacity level between regions and ; are calculated as shown in Equations (19) and (20); and () is the cumulative density distribution function of the ) region. In this paper, is defined as the difference of the bearing capacity between regions, and it can be understood as the mathematical expectation of the sum of all sample values of in regions and ; is defined as the first-order moment of the super variable, and it can be understood as the mathematical expectation of the sum of all sample values of n regions and .
2.4. Data Sources
The study uses statistical data from 2001 to 2019 in 31 provinces in the mainland of China. The number of breeding and sales data are from the China Animal Husbandry and Veterinary Yearbook and China Rural Statistical Yearbook. Water resource data and industrial water use data are from the China Statistical Yearbook. For the amount of COD discharged per unit of livestock and poultry per day, refer to the First National Pollution Source Census Livestock and Poultry Breeding Industry Pollution Coefficient Manual. The water consumption data of livestock and poultry breeding are calculated according to the National Compilation of Cost-Benefit Data of Agricultural Products. The data sources and explanations of this study are shown in Table 2.
3. Results and Discussion
3.1. Temporal and Spatial Differences in the Water Resource Carrying Capacity
3.1.1. Animal Husbandry Water Footprint
From 2001 to 2019, China’s animal husbandry water footprint increased significantly, causing the water surplus drop from 1551.60 × 108 m3 to 477.48 × 10⁸ m3 (Figure 2). The increase of water footprint and the decrease of water surplus reached 40.92% and 69.23%, respectively; this shows that the development of animal husbandry has an important influence on the quantity of water resources. During this period, China’s animal husbandry production scale has made significant breakthroughs. The trend of the water footprint of animal husbandry is very close to the growing trend of the animal husbandry production scale. Specifically, 2001–2006 was the first growth period of the livestock water footprint, with an average annual growth rate of 4.56%; in 2007, the water footprint of animal husbandry decreased significantly, at the same time, the meat in China decreased compared with the previous year, and the growth rate of egg and milk production slowed down. The second growth period of the animal husbandry water footprint was from 2008 to 2018 with an average annual growth rate of 2.58%. The growth rate was stable after 2015, which was mainly affected by the gentle fluctuation of meat, egg, and milk production capacity during the same period. In 2019, under the impact of the African swine fever epidemic, China’s pork production decreased by 17.06% compared with 2018, and the water footprint driving livestock decreased by 6.93% compared with the previous year.
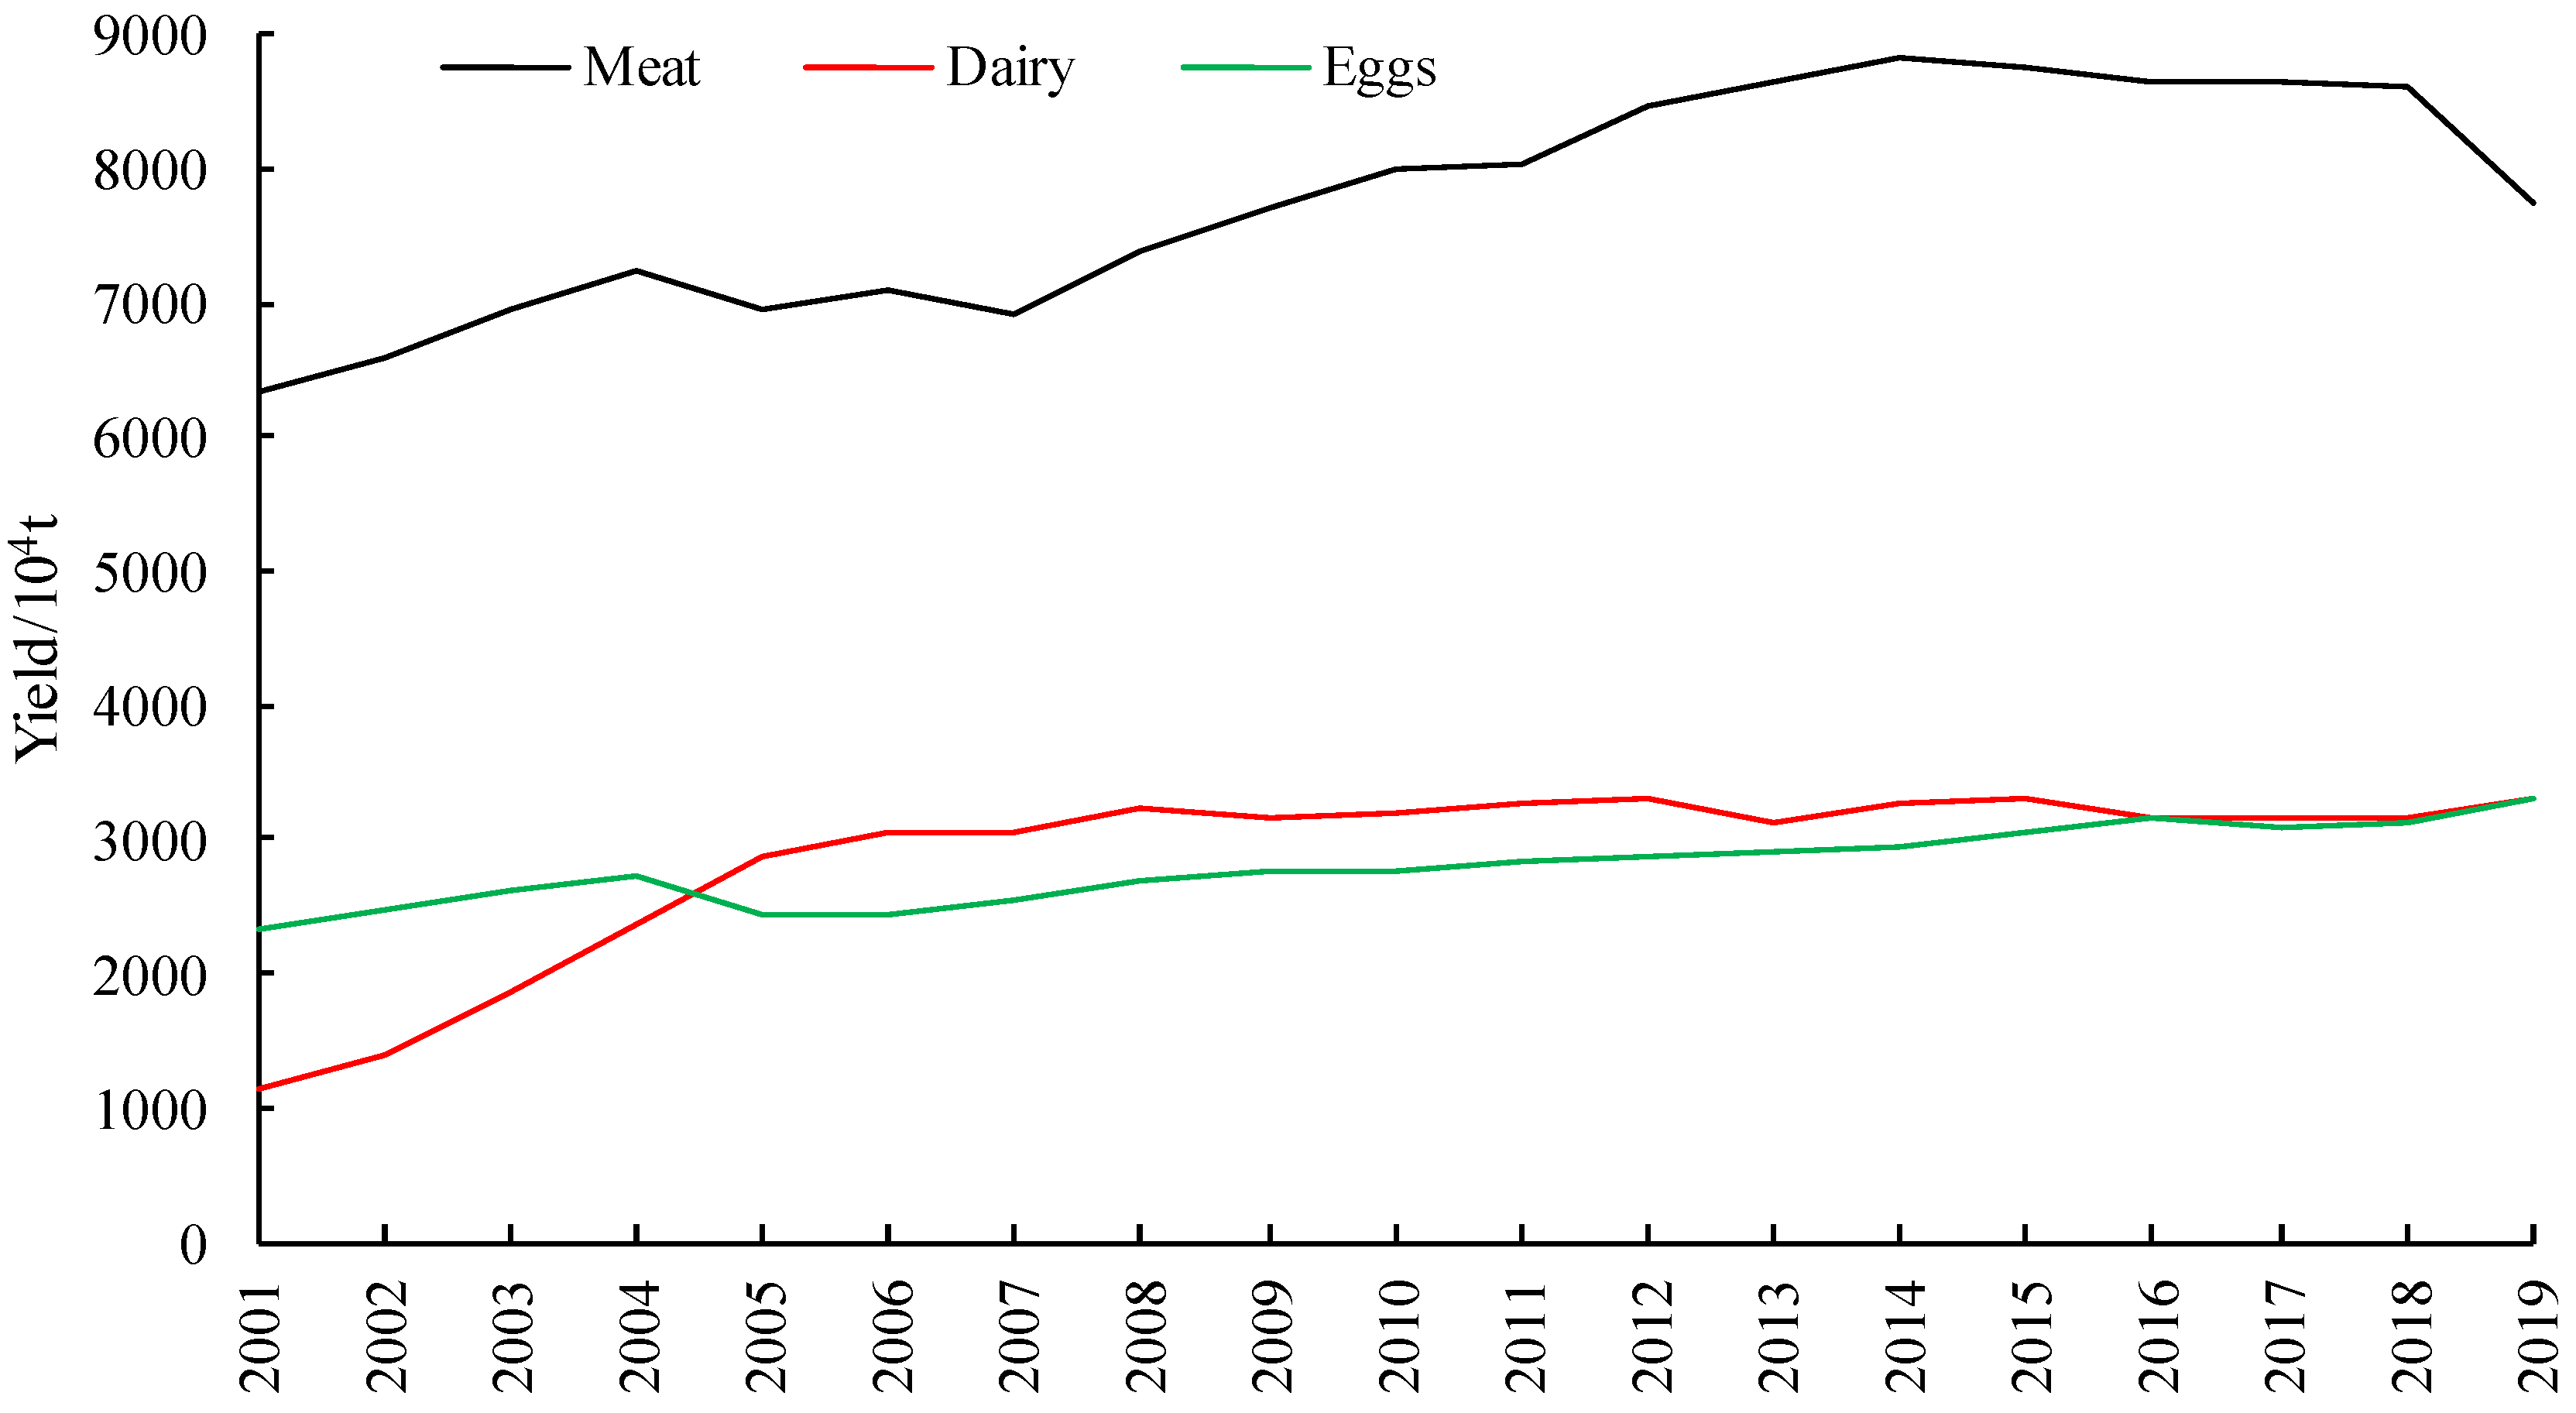
In summary, the water footprint of animal husbandry fluctuates with the fluctuation of the animal husbandry production scale. Our findings confirmed that in 2018 the production of meat, egg, and milk in China increased by 36.17%, 33.88%, and 182.91%, respectively, compared with that in 2001 (Figure 3) driving the water footprint of animal husbandry to achieve an average annual growth rate of 51.70 × 10⁸ m3. As of 2019, China is still in a state of surplus water for animal husbandry, and the water resources available for animal husbandry are relatively abundant in general. However, facing the realistic problem of continuous compression of surplus space, the surplus water for animal husbandry in China in 2019 is only 30.77% of the surplus water in 2001, with an average annual decrease of 59.67 × 10⁸ m3. According to this speed, China will enter the period of water deficit for animal husbandry in about eight years, which will intensify the resource constraints of animal husbandry development.
From the spatial point of view, although the overall water resources in the country are still surplus, the regional water deficit is still increasing. There is a significant spatial dislocation between animal husbandry production and the water resource distribution, showing a water deficit of “north heavy south light, west heavy east light” (Figure 4). Figure 4 shows the surplus and deficit of the water resources of animal husbandry in different provinces of China in 2001, the result indicates that the water deficit in Hebei, Shandong, and Henan is the most severe, generally exceeding 28.00 × 10⁸ m3, and the water deficit in Henan Province is as high as 52.19 × 10⁸ m3. Moreover, in addition to Inner Mongolia and Heilongjiang, the vast number of provinces and regions in the north and west are generally in a state of water deficit or near deficit. After nearly 20 years of development, the demand for water resources in China’s animal husbandry is increasing, which intensifies the contradiction between the development of animal husbandry and the reserve of water resources. Especially in the northern region with poor “water-livestock” collocation, the water deficit of animal husbandry is increasing and the scope is expanding, Shandong has replaced Henan as the most serious province of animal husbandry water deficit in China. In 2019, the deficit scale climbed to 174.68 × 10⁸ m3, the severe water deficit area centred on Shandong, Hebei, and Henan expanded outward; the Loess Plateau and Northwest China gradually changed from an endangered deficit to a deficit area. The southern region with abundant precipitation and dense water network presents a completely different situation from the north. Water surplus is an important feature of animal husbandry in the south. However, it is worth noting that the water surplus space in the southern region, especially in the southeast coastal areas such as Guangdong, is obviously narrowing.
From the perspective of the time dimension, there are two main trends of deficit space expansion and surplus space reduction. Hebei, Shandong, Henan, Liaoning, Gansu, and other provinces are traditional farming and animal husbandry production areas or arid climate areas; at the beginning of this century, they were affected by the scale of farming, animal husbandry production, and climate conditions, and have faced the overall water deficit. As the scale of animal husbandry production continues to expand, the scale of the deficit of these five provinces has expanded by approximately four times. The scale of the water deficit of Shandong and Henan provinces ranks first and second in China, respectively. Most areas in the south and west face were shrinking surplus space or even moving towards a deficit. The water surplus space in the middle and lower reaches of the Yangtze River and the Pearl River Basin has been reduced by 24.08% and 34.01%, respectively; the rich water resource advantage of the south is facing a situation of gradual tension.
3.1.2. Animal Husbandry Water Resource Carrying Capacity
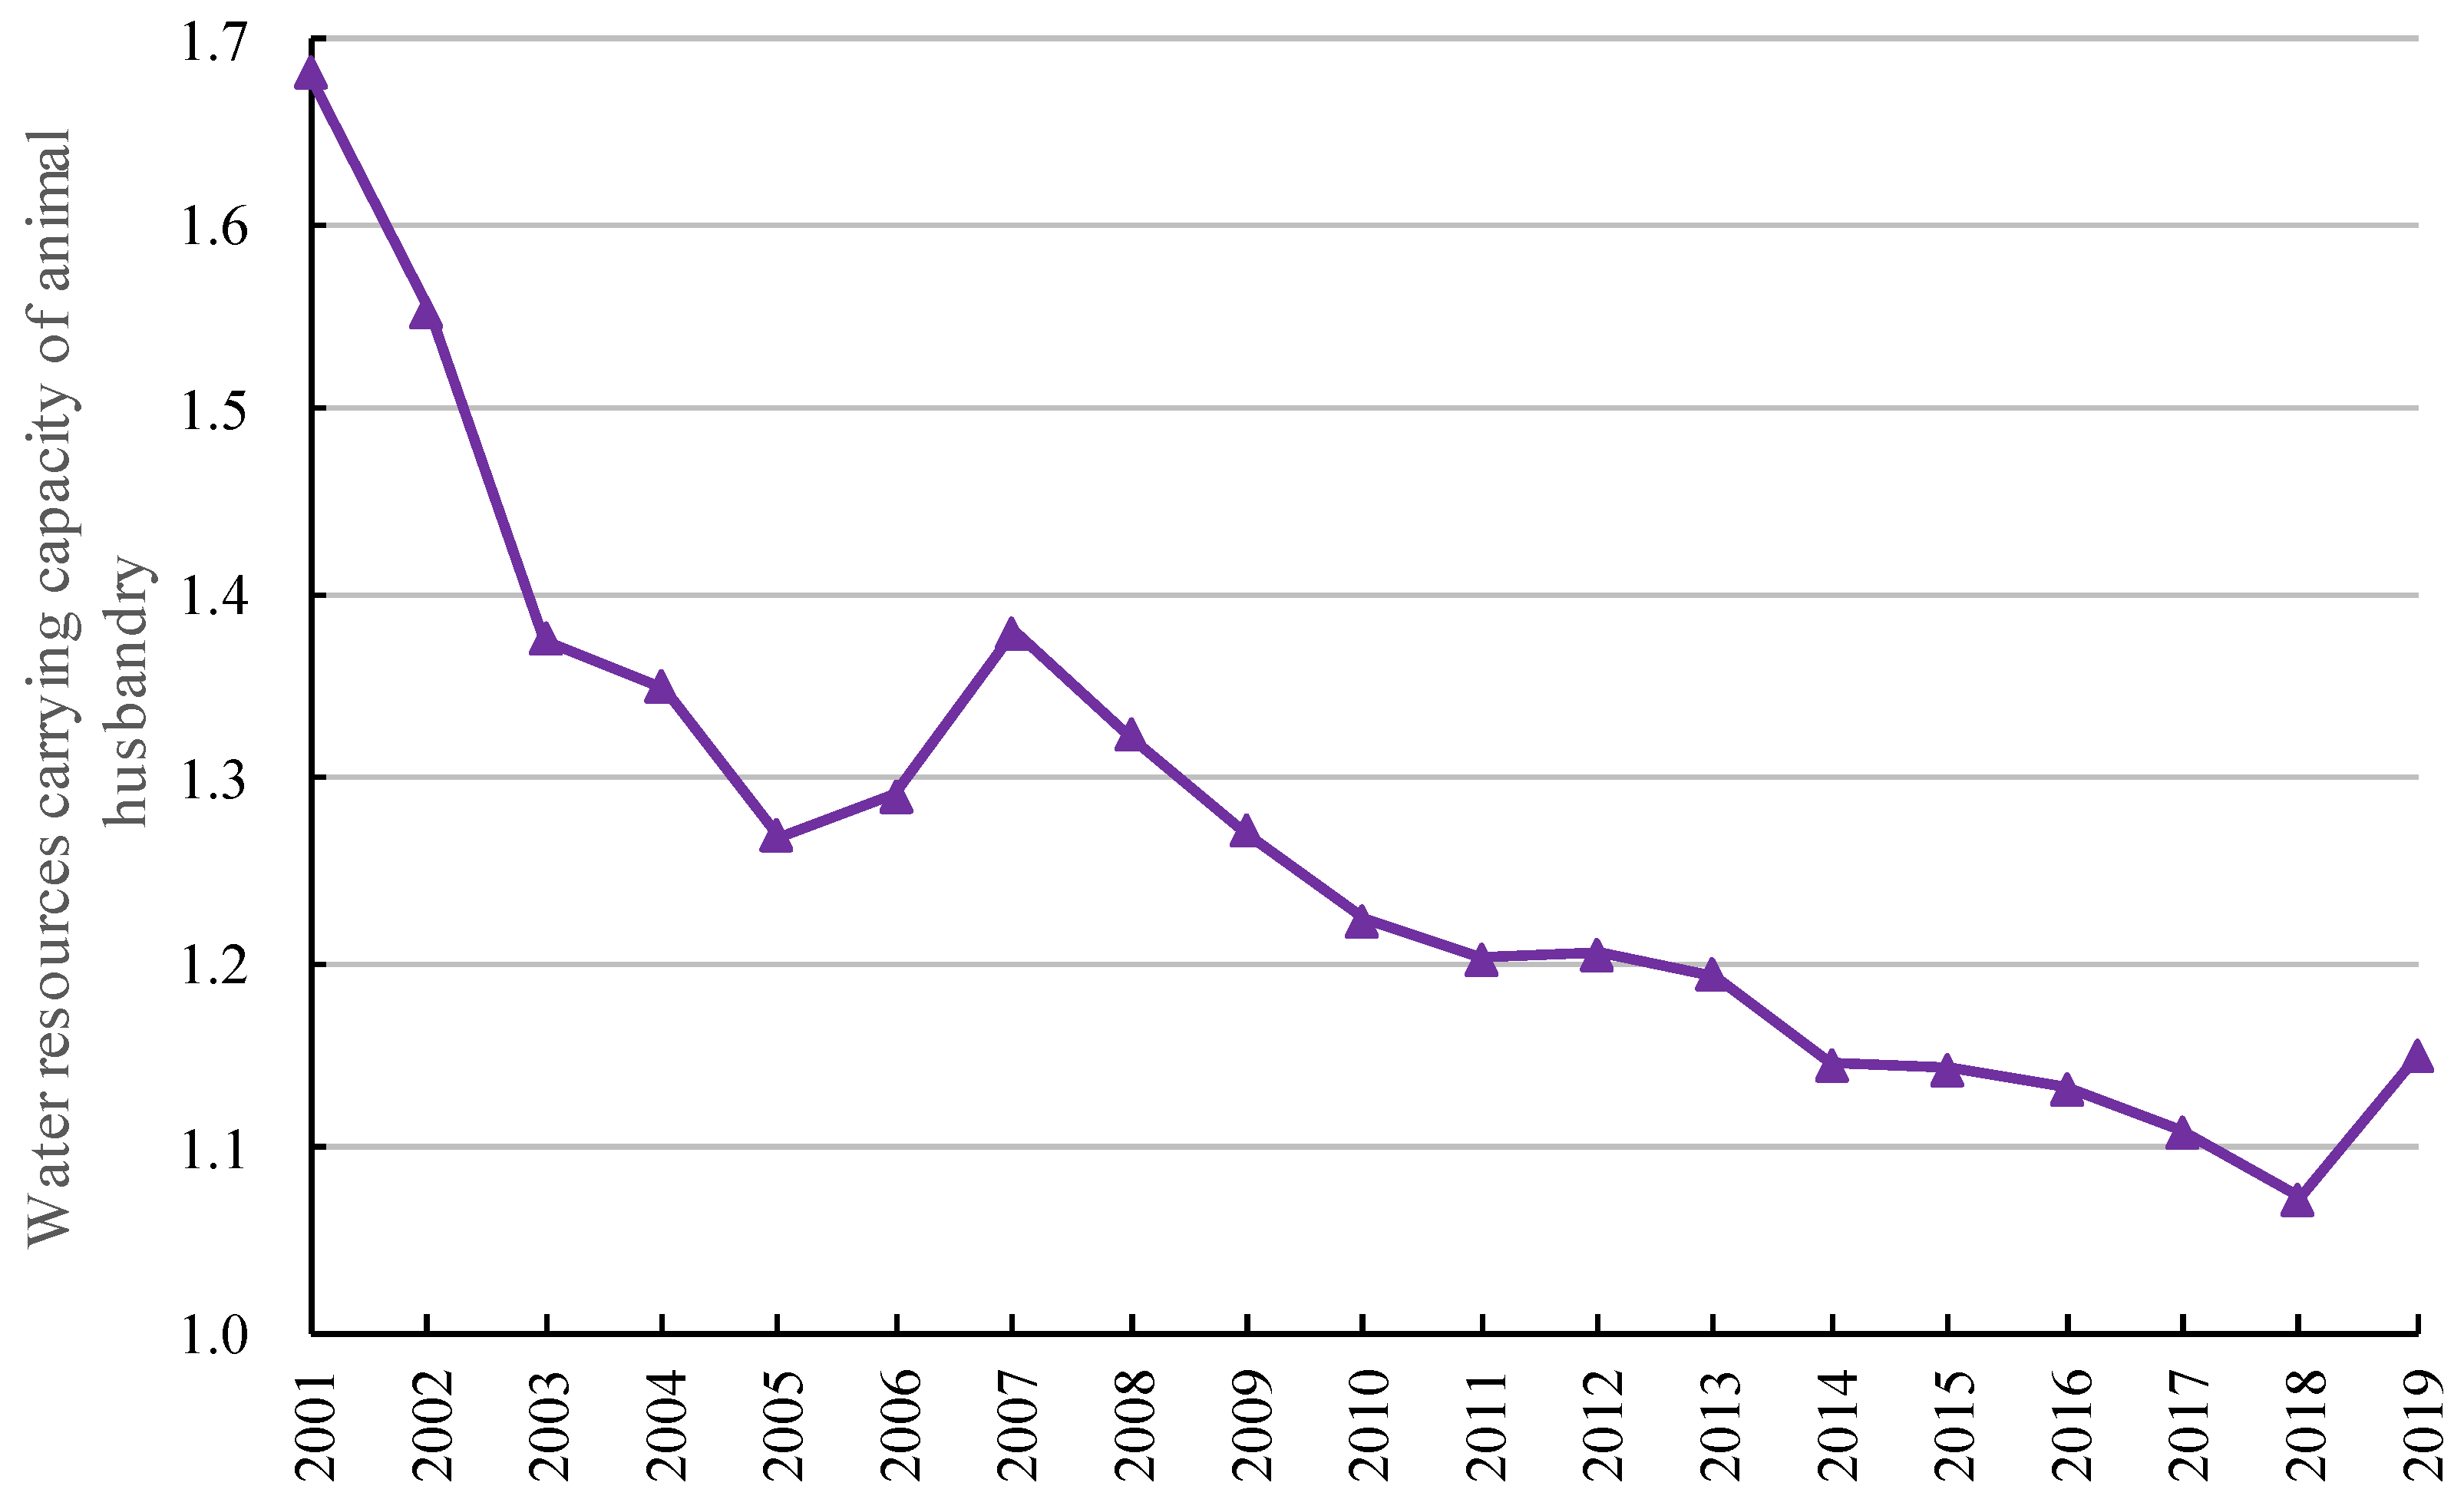
During the study period, the water resource carrying capacity at the national level decreased by 31.70%. Although it is still in a loadable stage, it tends to be balanced or overloaded (Figure 5). Specifically, animal husbandry water resource carrying capacity showed two obvious decline periods; 2001–2005 was the first decline period of carrying capacity. Due to the rapid expansion of the animal husbandry production scale, the carrying capacity also showed the fastest and largest decline in the study period, with an average annual decrease of 6.76%; 2008–2018 is the second decline period of carrying capacity, characterized by a slow decline but a long decline period, with an average annual decrease of 2.25%.
The analysis shows that two factors mainly drive the decline of animal husbandry water resource carrying capacity. On the one hand, the rapid growth of water footprint caused by the expansion of animal husbandry production scale is the main reason for the decline of the water resource carrying capacity of animal husbandry. It is also the internal reason for the decrease of the water resource carrying capacity. On the other hand, it is mainly affected by reducing the scale of water resources available for animal husbandry. According to the data of the China Statistical Yearbook, the water consumption of industry, life, and ecology in 2019 increased by 6.89%, 51.63%, and nearly twice that, compared with the beginning of this century, which severely reduced the number of water resources available for animal husbandry.
The change rate of animal husbandry water resource carrying capacity in different provinces during the study period was significantly different. All provinces except Beijing, Shanghai, Jiangsu, and Sichuan showed different degrees of decline in carrying capacity (Table 3). Among them, the growth of animal husbandry water resource carrying capacity in Beijing, Shanghai, and Jiangsu is mainly affected by the compression of the animal husbandry production scale and the transformation of industrial development mode in economically developed regions. Policy adjustment and technological progress are important factors driving the improvement of carrying capacity in these regions; for example, Jiangsu issued the “Opinions on Accelerating the Green Development of Animal Husbandry”, which combines the scientific planning of the spatial layout of farming with the resources and environment, and it promotes ecological farming and intelligent feeding. The decline rate of carrying capacity in other province shows obvious regional differences; Ningxia, Inner Mongolia, and Tibet exceeded the national average, especially the carrying capacity level of Ningxia, which dropped rapidly from 3.37 in 2001 to 0.91 in 2019. Only 25.8% of the provinces’ carrying capacity decline rate is lower than the national average, mainly concentrated in the middle and lower reaches of the Yangtze River and other southern regions. In 2019, the number of provinces in water availability was 19, increasing by four in 2001. In general, the animal husbandry water resource carrying capacity in the north, especially in the northwest region, is in a significant decline stage; insufficient water resources have become an important constraint for the development of local animal husbandry.
Using the Dagum Gini coefficient to analyze the spatial difference in the animal husbandry water resource carrying capacity, it was found that the overall difference in the animal husbandry water resource carrying capacity was significantly reduced during the study period (Table 4). From the perspective of the intraregional differences, the bearing capacity gap in the east is the largest, but it shows a downward trend, which is mainly affected by the clear north-south difference in the east; the bearing capacity of the southeastern coastal area is significantly higher than that of Hebei, Shandong and other provinces in the north, which directly widens the bearing capacity gap in the east; the spatial difference of the carrying capacity in the western region is second to that in the eastern region and is also decreasing; the narrowing of the spatial difference of the carrying capacity in the western and eastern regions is mainly reflected in the general reduction of water surplus space within the region, resulting in the deterioration of the carrying capacity in these regions; the spatial difference of the carrying capacity in the central region is the smallest, but it had an expanding trend from 2001 to 2009, which was mainly caused by the difference in the development speed of animal husbandry in different provinces. The geographical environment and socioeconomic environment in the east, middle and west are quite different, and the affected animal husbandry water resource carrying capacity also shows significant geographical differences, therefore, from the perspective of regional disparity: the eastern-central region gap is the largest, the eastern-western region gap is highly close to the eastern-central region gap, and the central-western region gap is the smallest, which is mainly affected by the high carrying capacity of the eastern and western regions but the rapid decline and the long-term stability of the central region. Through the analysis of the source of the regional carrying capacity difference, it is found that the contribution of interregional and hypervariable density changes greatly, but the changing trend is the opposite. The contribution rate of hypervariable density increases by 26.39%, while the contribution rate of the interregional differences decreases by 44.30%, and the contribution rate of the intraregional differences remains at approximately 33% for a long time.
3.2. Spatiotemporal Analysis of the Water Environment Bearing Pressure
3.2.1. Animal Husbandry Gray Water Footprint
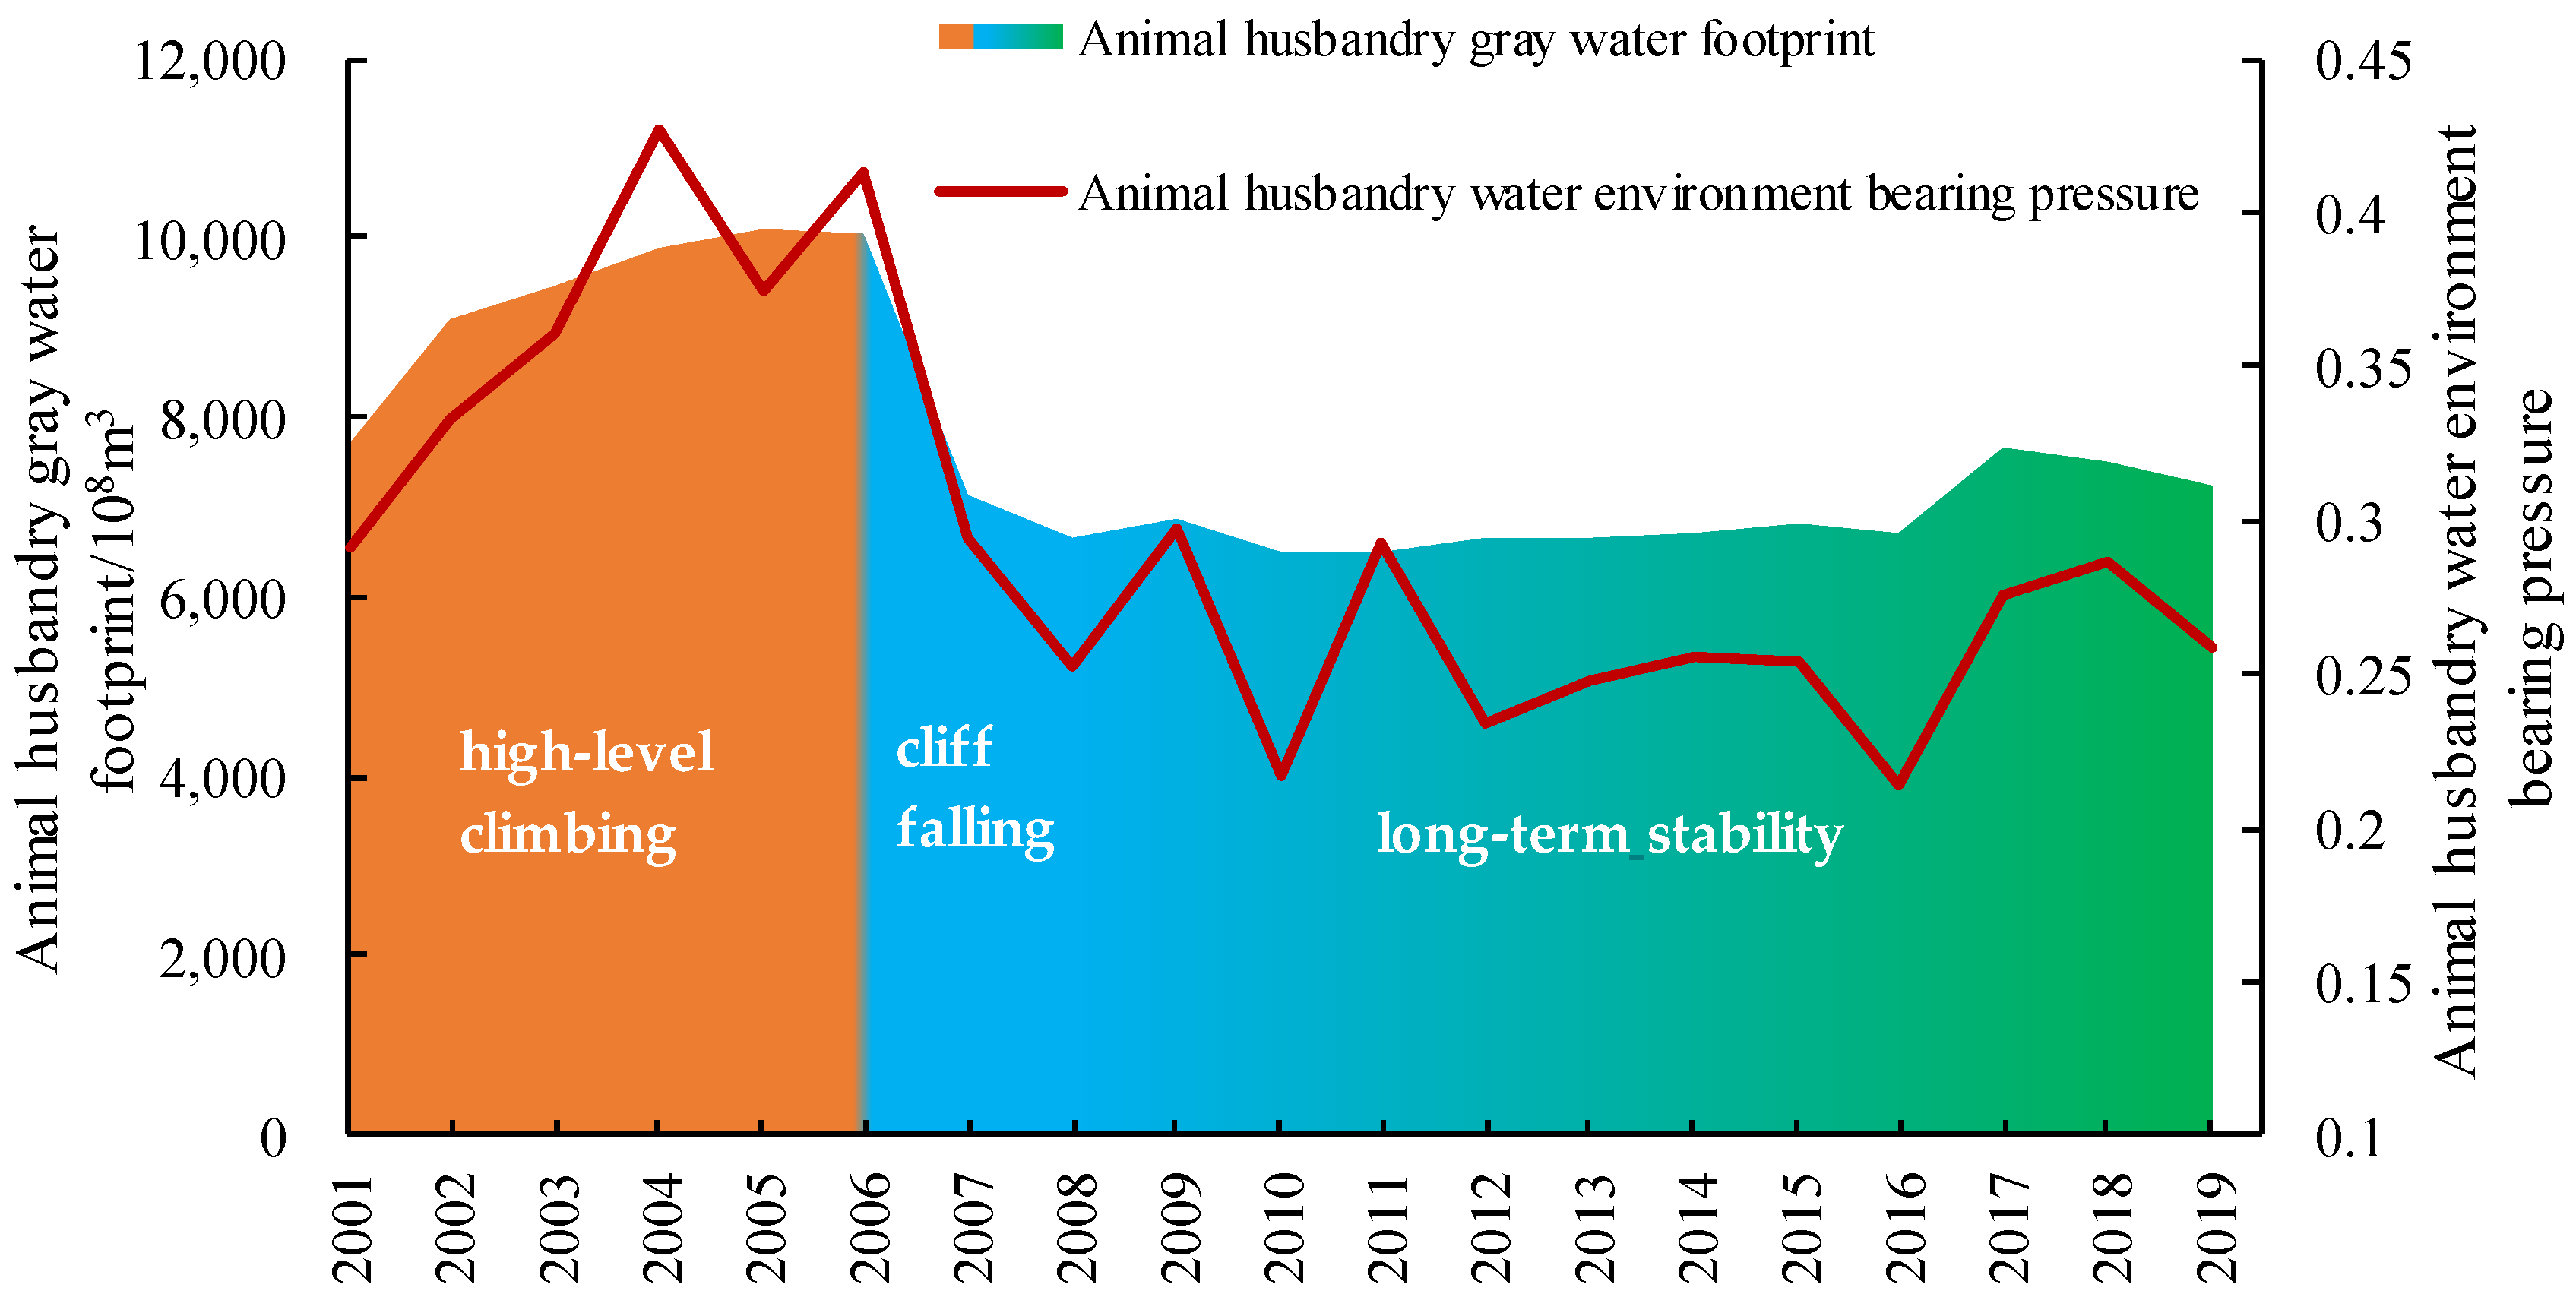
The gray water footprint reflects the ability of the water environment to absorb regional livestock and poultry manure. The animal husbandry gray water footprint in China showed a downward trend from 2001 to 2019, generally experiencing three stages: high-level climbing, cliff-falling, and long-term stability (Figure 6) of pollution pressure of livestock and poultry breeding on water environment released. According to the China Animal Husbandry and Veterinary Statistics, the stock of beef cattle in China reached a peak size of 12,000 × 104 in 2005, which was very close to the peak time of the gray water footprint of animal husbandry. It is believed that due to the differences between unit COD emissions of different livestock species, the change of livestock species structure has an important impact on the COD emissions and gray water footprint of the whole animal husbandry. In addition, according to the COD emission parameters of unit livestock and poultry in different regions given in Section 2.2, it can be seen that the daily COD emission of unit beef cattle is up to 10 times that of live pigs. The daily COD emission of unit dairy cattle is up to nearly 20 times that of live pigs. Combined with the calculation of livestock and poultry inventory scale, it is found that the COD emission scale of cattle accounts for more than half of the whole animal husbandry and has the greatest impact on water footprint in all livestock breeds. In the future, beef cattle and dairy farming will expand or continue to raise the gray water footprint of animal husbandry.
3.2.2. Animal Husbandry Water Environment Bearing Pressure
The fluctuation of the animal husbandry water environment bearing pressure clearly decreased. The national animal husbandry water environment bearing pressure in 2019 decreased by 23.90% compared with 2001 (Table 5), indicating that the pressure space of the animal husbandry water environment continued to expand. The analysis shows that the main factors causing the decline of the water environment bearing pressure are the reduction of the gray water footprint caused by the adjustment of livestock and poultry breeding and the decline of the scale of beef cattle stock. In addition, the change in the absorptive space capacity also acts on the fluctuation of the water environment pressure in the other direction. China Animal Husbandry and Veterinary Statistics data show China’s beef cattle inventory in 2008 before and after a substantial reduction, which contributed to the animal husbandry water environment bearing pressure and fell to 0.24; since then, the size of the national beef cattle inventory was relatively stable and the water environment bearing pressure showed a relatively steady trend.
In terms of provinces, the regions in a state of water environment overload in 2019 include most of northern China, northeastern China, and most of the Central Plains and the northwestern parts, which mainly include Tianjin, Hebei, Shanxi, Inner Mongolia, Shandong, Henan, Gansu, Ningxia and other provinces and urban areas. Geographically, they all belong to the northern region and are mainly concentrated in the North China Plain and its surrounding areas. These areas also belong to the important meat, egg, and milk production functional areas in China, and the task of realizing the stable production and supply of livestock products alongside green transformation and development is very arduous. From the perspective of time, while the pressure bearing space of the national water environment is expanding, the bearing pressure of the water environment in most provinces and regions is significantly improved, especially in Beijing, Liaoning and other places, shifting from an overload to a loadable state. Most of the south has been stable at a low-pressure level of the water environment for a long time (Table 5).
The Dagum Gini coefficient was used to analyze the spatial difference in the animal husbandry water environment bearing pressure. It was found that the animal husbandry water environment bearing pressure fluctuated to a high level of 0.7 during the study period, showing a trend of first decreasing and then increasing (Table 6). From the perspective of regional differences, the bearing pressure difference in the west is the largest and has an upward trend, which is mainly affected by the high proportion of beef cattle and dairy cattle breeding in the Western Pastoral Area and the large difference in the total regional water body, causing the distribution of surface water resources in the whole western region to be extremely unbalanced. The differences in the bearing pressure in the eastern region are second to that in the western region, but the changing trend decreased first and then increased. Although the total amount of water body available to absorb faecal pollution in the eastern region is the most abundant, the difference between the north and south water resource endowments is too large, which has a clear regional impact on the bearing pressure of the water environment, especially in recent years.
The expansion of the production scale of beef cattle and dairy cows in the north and the policies of raising pigs in the south and the north have increased the pressure on the water environment in most of North China. The difference in the carrying capacity in the central region is the smallest, but the fluctuation growth characteristics are very clear. The transfer of livestock and poultry from the east to the central region will further aggravate the water environment bearing pressure in the central region. From the perspective of regional differences: the difference between the east and the west is the largest and changes steadily, the difference between the central region and the west is expanding rapidly and is very close to the difference between the east and the west. The difference between the east and the central region decreases first and then increases. Through the analysis of the sources of the regional bearing pressure differences, it is found that the contribution rate of the intraregional differences has been very stable, at approximately 33% for a long time, the contribution rate of the interregional difference has fluctuated from 44.94% to 15.68%, and the contribution rate of the over-variable density has expanded from 23.40% to 50.44%.
3.3. Discussion
By measuring the animal husbandry water resource carrying capacity and water environment bearing pressure, we have made an overall grasp of the status of animal husbandry water resources and water environment in China, which has certain policy significances for guiding the management of animal husbandry water resources and optimizing the allocation of animal husbandry water resources. Compared with the existing research, this paper can quantify the water consumption of animal husbandry in time and space. It can support the research conclusion through rigorous methods and detailed data. In particular, the division of water resource carrying capacity and water environment bearing pressure of animal husbandry is innovative, and the whole research process and calculation results are reliable. According to the results, we put forward the following suggestions: Firstly, promote water-saving production technology in the main animal husbandry producing areas (especially in North China), develop modern water-saving animal husbandry, focus on improving water-use efficiency and animal production efficiency, and accelerate the transformation of traditional farming methods to modern high-quality animal husbandry; secondly, from the perspective of “water-livestock” collocation, accelerate the optimization of the animal husbandry production layout, promote animal husbandry production to adapt to the carrying capacity of the resources and environment, and develop resource–environment coordinated animal husbandry; thirdly, in view of the gray water footprint, by strengthening livestock and poultry manure remediation, the implementation of the combination of planting and breeding to reduce animal husbandry pollutant emissions from the source to suppress the ecological pressure of animal husbandry development on the water environment, and increase the policy support for green animal husbandry; finally, promote the exchange of experience and learning between different regions, strengthen the circulation of technology and other elements between the eastern and western regions, and respond to water shortage and water environmental pollution through industrial upgrading.
4. Conclusions
Based on the water footprint theory and related methods, this paper quantitatively analyzes the water footprint and gray water footprint of China’s animal husbandry from 2001 to 2019 and obtains the water resource carrying capacity and water environment bearing pressure. The conclusions are as follows: During the study period, the water footprint of animal husbandry in China increased by 40.92%. The water deficit in Shandong, Henan, and Hebei was the most serious, and most of the northwest, north, and central plains were facing increasingly serious water shortages. The increase in the water footprint of animal husbandry has led to the decrease of the water resource carrying capacity by 31.70%. With the expansion of animal husbandry, the contradiction between livestock breeding and water resources is bound to be more prominent. Compared with the rapid growth of the water footprint, the grey water footprint has gradually stabilized; we find that a gray water footprint is much better than a water footprint, and the change has been relatively stable since 2008. Its scale is closely related to the quantity of beef and dairy cattle and the overall water environment bearing pressure in the country has weakened, but the pressure in the vast arid areas of the north is still heavy. In general, the problem of water resources in China’s animal husbandry is more serious than that of the water environment. Continued expansion of the scale of animal husbandry production in accordance with the current method will face more severe pressure of water shortage. Animal husbandry production and water resource distribution have obvious spatial dislocation characteristics.
This study clearly defines the supporting performance of water as a resource and environment for the development of animal husbandry. At the same time, the results revealed the intrinsic link between the development of animal husbandry and water in China, which met the needs of research objectives. However, there are some limitations to this study that need to be addressed in the future. First of all, this study ignored the impact of factors such as the breeding scale on water resource demand, which requires a wider range of breeding experiments to obtain specific parameters under different scales and different breeding modes in the future. Secondly, this paper takes the number of regional water resources other than water used by other sectors, such as life, as the supply of animal husbandry water resources. Therefore, a topic worthy of further discussion is how to allocate regional water resources or coordinate the relationship between water resource utilization in different sectors in a practical production practice.
Author Contributions
Conceptualization, funding acquisition, supervision of the study, review, and editing, Z.H.; investigation, resources, visualization, and writing of the manuscript, L.Y.; methodology and formal analysis, X.X.; validation, S.A.S. All authors have read and agreed to the published version of the manuscript.
Funding
This work was received funding support from the Science and Technology Innovation project of the Chinese Academy of Agricultural Sciences (Grant No. ASTIP-IAED-2021-02).
Institutional Review Board Statement
Not applicable.
Informed Consent Statement
Not applicable.
Data Availability Statement
The data presented in this study are available on request from the corresponding author. The processed data are not publicly available as the data also forms part of an ongoing study.
Conflicts of Interest
The author declares that there are no conflicts of interest.
References
- Meng, X. Study on Prevention Problem of China Livestock Environment Pollution; Huazhong Agricultural University: Wuhan, China, 2014. [Google Scholar]
- Liu, G.; Luo, Q.; Zhang, L. The Development of Animal Husbandry Since 40 Years of Reform and Opening-up: Achievements, Challenges and Countermeasures. Chin. Rural Econ. 2018, 12, 19–36. [Google Scholar]
- Ministry of Ecological Environment of the People’s Republic of China, National Bureau of Statistics, Ministry of Agriculture and Rural Areas of the People’s Republic of China. Bulletin of the Second National Survey of Pollution Sources; Ministry of Ecological Environment of the People’s Republic of China, National Bureau of Statistics, Ministry of Agriculture and Rural Areas of the People’s Republic of China: Beijing, China, 2020.
- Wu, Z.; Upmanu, L.; Wang, Z.; Tian, Z. Regional Disparity of Water Footprint in China in the Production Perspective: The Analytical Framework of “Amount-Structure-Efficiency”. China Popul. Resour. Environ. 2015, 25, 85–94. [Google Scholar]
- Di Martino, M.; Avraamidou, S.; Cook, J.; Pistikopoulos, E.N. An optimization framework for the design of reverse osmosis desalination plants under food-energy-water nexus considerations. Desalination 2021, 503, 114937. [Google Scholar] [CrossRef]
- Vanessa, N.; Ramón, A.; Octavio, R.; Munizaga, J.; Sáez, K.; Arumí, J.L. Sustainability assessment of the agricultural water footprint in the Cachapoal River basin, Chile. Ecol. Indic. 2019, 98, 19–28. [Google Scholar]
- Andrei, J.V.; Gogonea, R.-M.; Zaharia, M.; Patrascu, A.; Bălăcescu, A.; Ladaru, R. A Critical Approach on Using Total Water Footprint of Agricultural Products as a Potential Sustainable Development Indicator. Teh. Vjesn. 2020, 27, 671–679. [Google Scholar]
- Wahba, S. Understanding internal water footprint inequality of the Egyptian households based on different income and lifestyles. J. Clean. Prod. 2020. prepublish. [Google Scholar]
- GómezLlanos, E.; MatíasSánchez, A.; DuránBarroso, P. Wastewater Treatment Plant Assessment by Quantifying the Carbon and Water Footprint. Water 2020, 12, 3204. [Google Scholar] [CrossRef]
- Wang, X.; Huang, K.; Yang, S.; Wang, Z.; Hu, T. Temporal Variability and Influencing Factors of Sectoral Water Footprint in China. J. Nat. Resour. 2014, 29, 2114–2126. [Google Scholar]
- Deng, G. Water Footprint Research on Supply Side and Demand Side of Various Industries in China: Based on a World Input-output Model. Stat. Decis. 2021, 37, 73–77. [Google Scholar]
- Pan, A.; Chen, L. Decoupling and Water Footprint Analysis of the Coordinated Development Between Water Utilization and the Economy in Hubei. Resour. Sci. 2014, 36, 328–333. [Google Scholar]
- Shang, Q.; Yin, K.; Mi, W. Assessing water resources in Qinghai province based on theory of water footprint. J. Arid Land Resour. Environ. 2020, 34, 70–77. [Google Scholar]
- Sun, S.; Wang, Y.; Wu, P.; Zhao, X. Spatial variability and attribution analysis of water footprint of wheat in China. Trans. Chin. Soc. Agric. Eng. 2015, 31, 142–148. [Google Scholar]
- Shi, L.; Wu, P.; Wang, Y.; Sun, S.K.; Liu, J. Assessment of water stress in Shaanxi Province based on crop water footprint. Chin. J. Eco-Agric. 2015, 23, 650–658. [Google Scholar]
- Yu, W.; Zhang, H.; Hu, H. Water Resources Carrying Capacity of Livestock Husbandry in China Based on Water Footprint Theory. Resour. Sci. 2012, 34, 394–400. [Google Scholar]
- Hou, X. Water Footprint and Influence Factors of Livestock Husbandry in Jilin Province; Northeast Agricultural University: Haerbin, China, 2016. [Google Scholar]
- Huang, D.; Yang, H. A Study on Water Use of Xinjiang Animal Husbandry Development from the Perspective of Water Footprint. Water Sav. Irrig. 2018, 4, 96–104. [Google Scholar]
- Cheng, J.; Qin, L.; Hou, X. The Space-time Disparity and Optimal Distribution of Water Footprint of Pig Industry in Jilin Province. Chin. Agric. Sci. Bull. 2019, 35, 126–134. [Google Scholar]
- Meng, X.; Zhang, J.; Li, P. Analyze on Spatial-temporal Characteristics of Livestock Husbandry Resources and Environment Pressure in China. Res. Agric. Mod. 2012, 33, 556–560. [Google Scholar]
- Zhang, H.; Zhou, D. China’s regional Disparities and Convergence Evolution of Regional Innovation Level from the Perspective of Innovative Value Chain—Empricical Study Based on Dagum’s Gini Coefficient Decomposition and Spatial Markov Chain. RD Manag. 2016, 28, 48–60. [Google Scholar]
- Dagum, C. A new Approach to the Decomposition of the Gini Income Inequality Ratio. Empir. Econ. 1997, 22, 515–531. [Google Scholar] [CrossRef]
Figure 1.
Research framework for animal husbandry water resources and water environmental carrying capacity based on Water Footprint Theory.
Figure 1.
Research framework for animal husbandry water resources and water environmental carrying capacity based on Water Footprint Theory.

Figure 2.
Changes in the animal husbandry water footprint and water surplus in China.
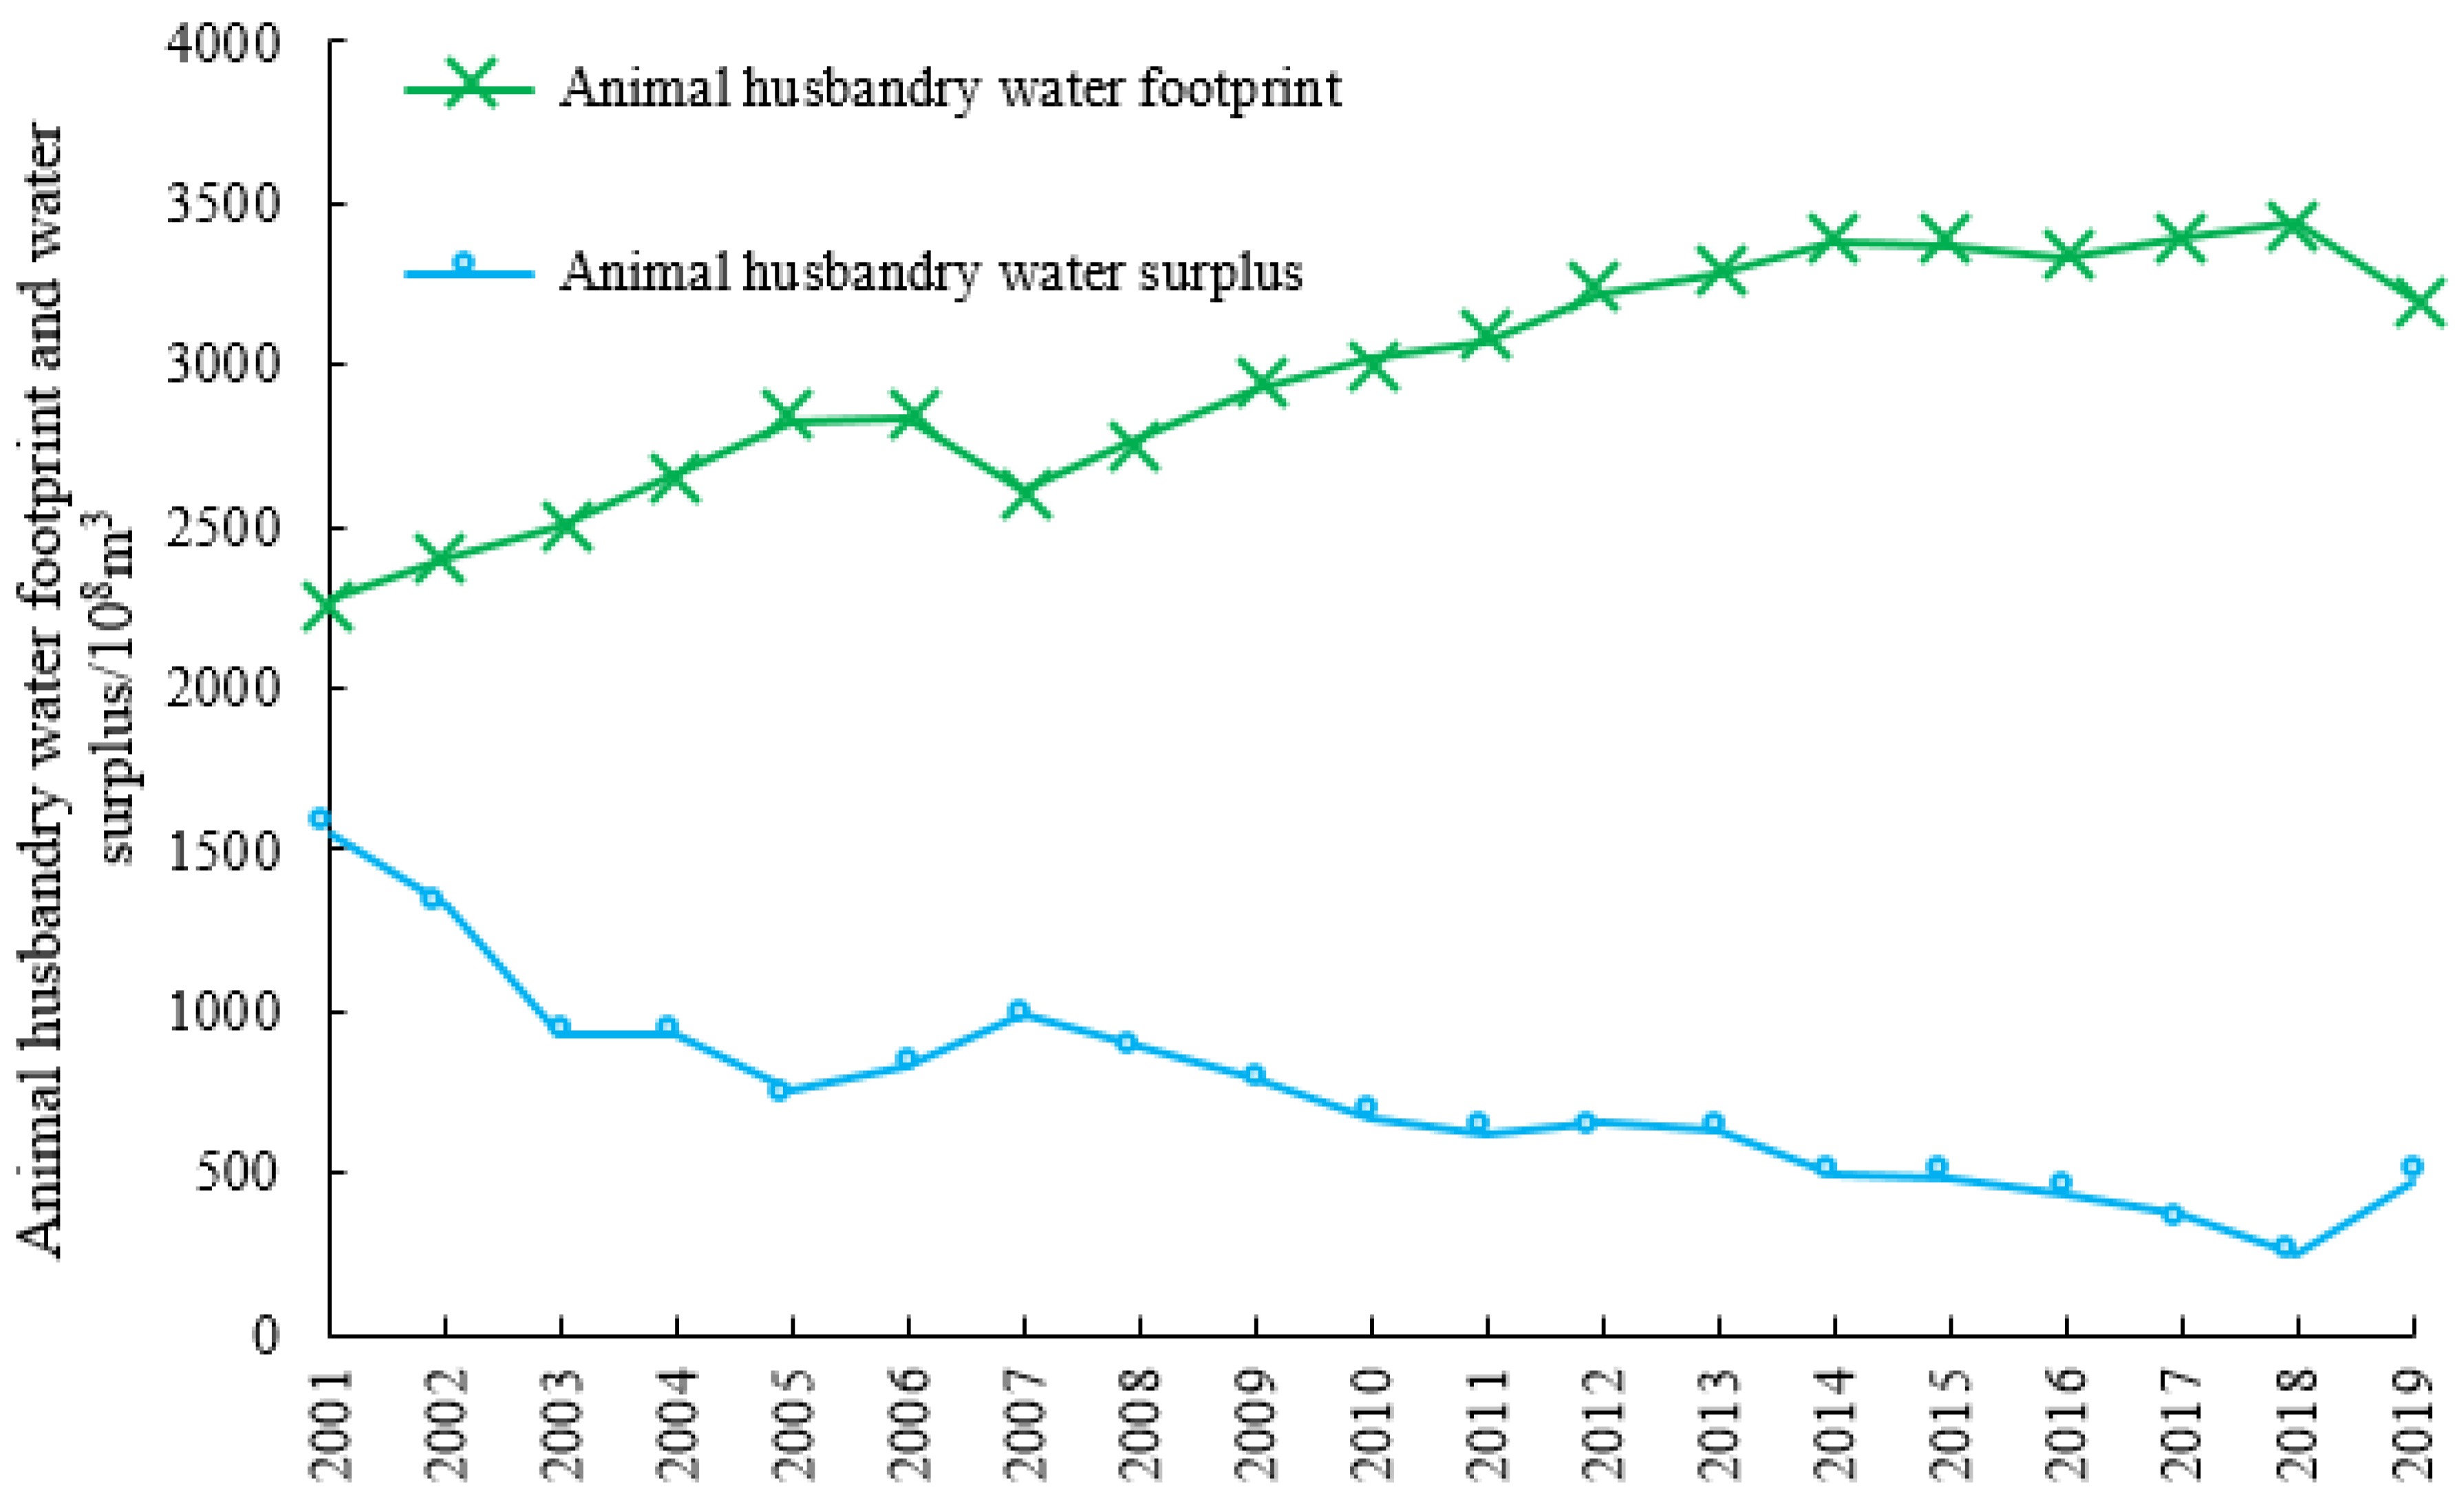
Figure 3.
Changes of meat, egg, and milk yield in China.

Figure 4.
Water surplus and deficit of animal husbandry in 2001 and 2019.
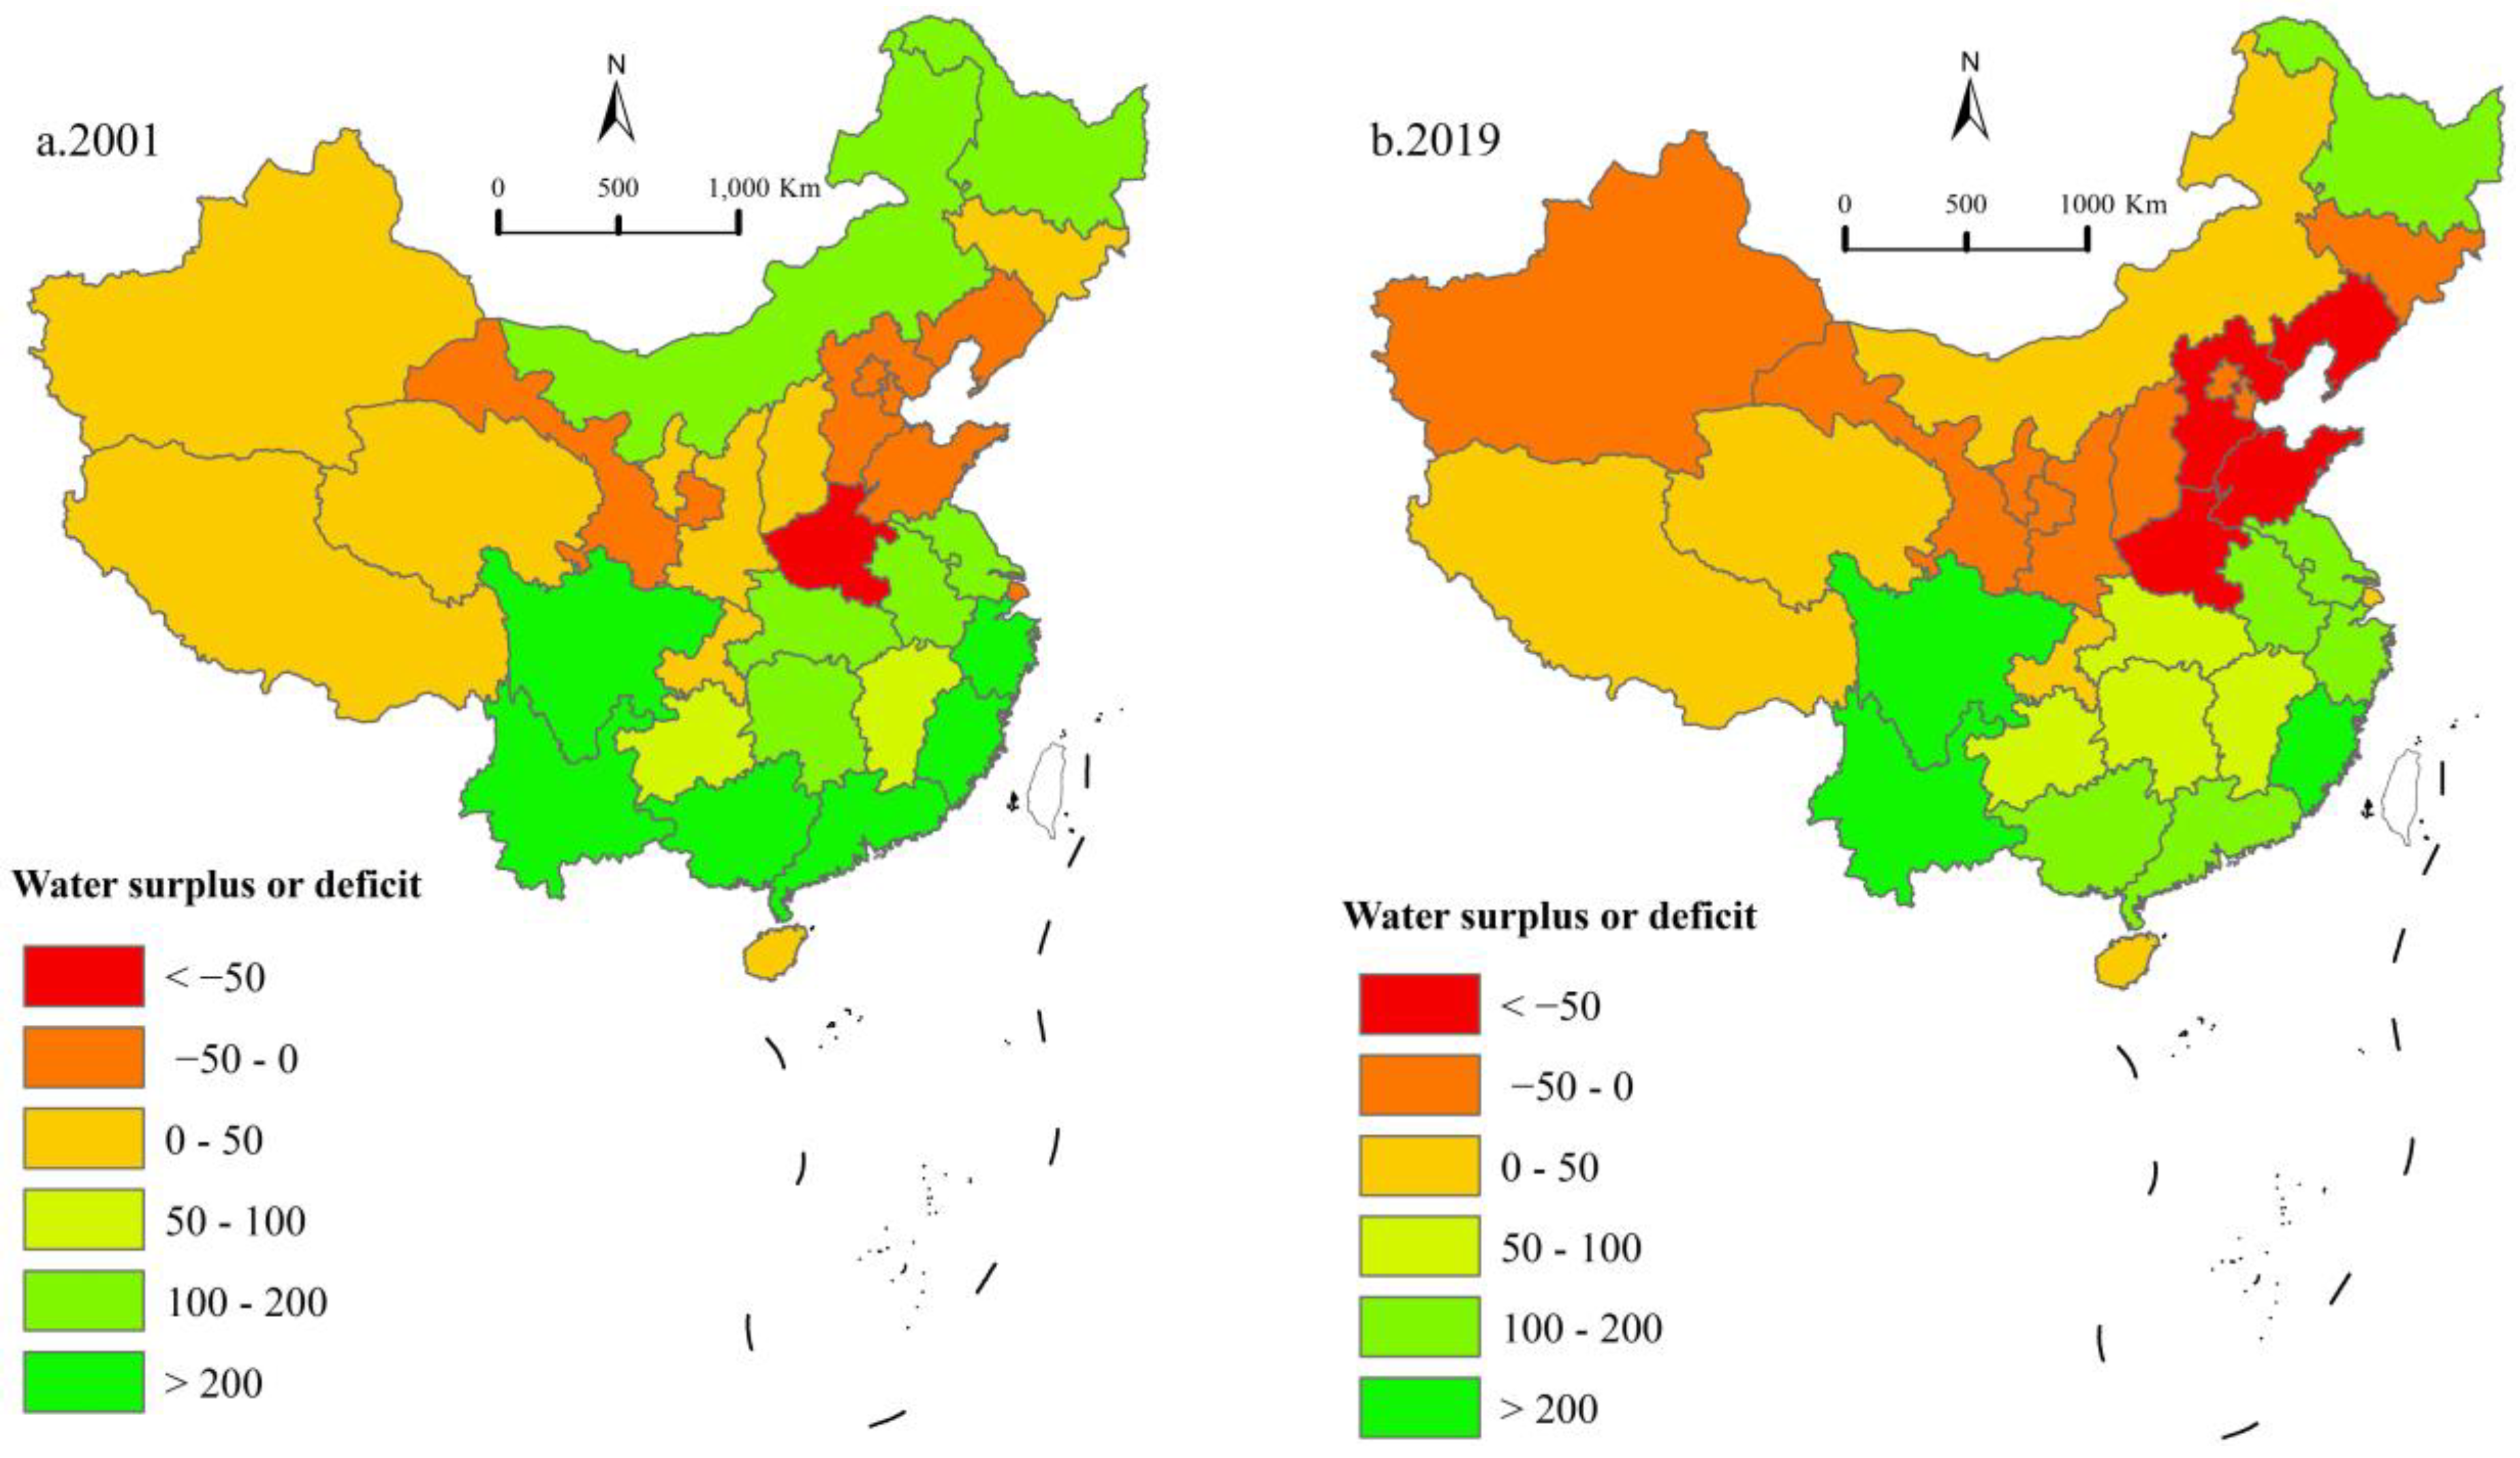
Figure 5.
Changes of water resource carrying capacity of animal husbandry in China.

Figure 6.
Animal husbandry gray water footprint and the variation trend of the water environment bearing pressure in China.
Figure 6.
Animal husbandry gray water footprint and the variation trend of the water environment bearing pressure in China.

Table 1.
COD emission parameters of main livestock species in different regions.
| Region | Type | COD/g·Day−1 | Region | Type | COD/g·Day−1 |
|---|---|---|---|---|---|
| Northern China | Live pig | 130.90 | Southern China | Live pig | 110.11 |
| Cow | 2385.40 | Cow | 2479.56 | ||
| Beef cattle | 1007.92 | Beef cattle | 880.16 | ||
| Sheep | 0.17 | Sheep | 0.17 | ||
| Poultry | 8.71 | Poultry | 6.12 | ||
| Northeast China | Live pig | 125.22 | Southwest China | Live pig | 115.51 |
| Cow | 2257.57 | Cow | 2092.07 | ||
| Beef cattle | 1126.53 | Beef cattle | 815.85 | ||
| Sheep | 0.17 | Sheep | 0.17 | ||
| Poultry | 10.19 | Poultry | 6.12 | ||
| Eastern China | Live pig | 102.28 | Northwest China | Live pig | 121.88 |
| Cow | 2092.07 | Cow | 1314.06 | ||
| Beef cattle | 1136.61 | Beef cattle | 815.85 | ||
| Sheep | 0.17 | Sheep | 0.17 | ||
| Poultry | 11.10 | Poultry | 10.19 |
Table 2.
Summary for the sources of all the original data used in current study.
| Type of Data | Parameters | Source | Regions | Frequency |
|---|---|---|---|---|
| Production scale | Number of breeding and sales | China Animal Husbandry and Veterinary Yearbook and China Rural Statistical Yearbook | 31 provinces | Annual data |
| Pollutant discharge | The amount of COD discharged per unit of livestock and poultry per day | The First National Pollution Source Census Livestock and Poultry Breeding Industry Pollution Coefficient Manual | 31 provinces | Fixed parameter |
| Water consumption of animal husbandry | Water consumption of livestock and poultry | National Compilation of Cost-Benefit Data of Agricultural Products | 31 provinces | Annual data |
| Water resources supply and demand | Water resources storage; Water consumption of different industrial sectors | China Statistical Yearbooks 2000–2019 | 31 provinces | Annual data |
Table 3.
Water resource carrying capacity and its change rate of animal husbandry in China.
| Province | 2001 | 2005 | 2010 | 2015 | 2019 | Rate of Change |
|---|---|---|---|---|---|---|
| National Average | 1.68 | 1.27 | 1.22 | 1.14 | 1.15 | −31.70% |
| Beijing | 0.67 | 0.53 | 0.56 | 0.37 | 0.83 | 23.81% |
| Tianjin | 0.68 | 0.59 | 0.57 | 0.60 | 0.60 | −11.54% |
| Hebei | 0.85 | 0.59 | 0.72 | 0.59 | 0.51 | −40.47% |
| Shanxi | 1.33 | 1.01 | 1.00 | 0.96 | 0.82 | −38.20% |
| Inner Mongolia | 3.48 | 1.58 | 1.20 | 1.25 | 1.28 | −63.30% |
| Liaoning | 0.92 | 0.62 | 0.52 | 0.48 | 0.45 | −51.06% |
| Jilin | 1.31 | 0.76 | 0.85 | 0.91 | 0.82 | −37.75% |
| Heilongjiang | 2.99 | 2.29 | 2.50 | 2.79 | 2.41 | −19.40% |
| Shanghai | 0.36 | 0.95 | 1.00 | 1.00 | 1.31 | 260.35% |
| Jiangsu | 2.21 | 1.92 | 2.09 | 1.83 | 2.32 | 5.13% |
| Zhejiang | 7.29 | 5.45 | 4.47 | 5.15 | 5.74 | −21.34% |
| Anhui | 2.41 | 1.90 | 2.44 | 2.00 | 1.84 | −23.54% |
| Fujian | 9.12 | 6.91 | 6.31 | 5.15 | 3.68 | −59.63% |
| Jiangxi | 2.15 | 1.71 | 1.54 | 1.31 | 1.48 | −30.98% |
| Shandong | 0.83 | 0.53 | 0.54 | 0.44 | 0.44 | −46.57% |
| Henan | 0.74 | 0.44 | 0.46 | 0.41 | 0.45 | −39.19% |
| Hubei | 2.10 | 1.76 | 1.45 | 1.39 | 1.57 | −25.27% |
| Hunan | 1.68 | 1.38 | 1.29 | 1.20 | 1.33 | −21.23% |
| Guangdong | 2.93 | 2.32 | 1.94 | 1.96 | 1.76 | −39.88% |
| Guangxi | 3.65 | 3.92 | 2.09 | 1.97 | 1.95 | −46.59% |
| Hainan | 4.10 | 2.69 | 2.12 | 1.85 | 2.00 | −51.20% |
| Chongqing | 1.26 | 1.06 | 0.90 | 1.03 | 1.24 | −2.21% |
| Sichuan | 2.75 | 2.20 | 2.24 | 2.53 | 2.97 | 8.09% |
| Guizhou | 2.59 | 1.96 | 1.72 | 1.61 | 1.75 | −32.35% |
| Yunnan | 7.45 | 5.28 | 4.11 | 3.69 | 3.40 | −54.37% |
| Tibet | 7.72 | 6.28 | 4.41 | 3.40 | 3.04 | −60.55% |
| Shaanxi | 1.15 | 0.88 | 0.84 | 0.75 | 0.74 | −35.04% |
| Gansu | 0.97 | 0.75 | 0.67 | 0.58 | 0.49 | −49.63% |
| Qinghai | 3.44 | 3.02 | 2.52 | 1.83 | 1.53 | −55.42% |
| Ningxia | 3.37 | 2.15 | 1.65 | 1.21 | 0.91 | −72.88% |
| Xinjiang | 1.83 | 1.17 | 1.19 | 1.03 | 0.82 | −55.53% |
Table 4.
Gini coefficient and its decomposition results of the animal husbandry water resource carrying capacity in China.
Table 4.
Gini coefficient and its decomposition results of the animal husbandry water resource carrying capacity in China.
| Year | On the Whole | Gini Coefficient in the Region | Interregional Gini Coefficient | Contribution Rate | ||||||
|---|---|---|---|---|---|---|---|---|---|---|
| East of China | Center of China | West of China | East-Center | East-West | Center-West | Interregional | Within the Region | Hypervariable Density | ||
| 2001 | 0.4184 | 0.5221 | 0.2046 | 0.3343 | 0.4685 | 0.4615 | 0.3708 | 27.00 | 32.48 | 40.52 |
| 2003 | 0.4220 | 0.5179 | 0.2145 | 0.3335 | 0.4791 | 0.4603 | 0.3795 | 27.40 | 32.38 | 40.22 |
| 2005 | 0.4184 | 0.4935 | 0.2373 | 0.3631 | 0.4495 | 0.4509 | 0.3861 | 26.73 | 33.24 | 40.03 |
| 2007 | 0.3924 | 0.4728 | 0.2282 | 0.3431 | 0.4267 | 0.4266 | 0.3332 | 17.81 | 33.70 | 48.50 |
| 2009 | 0.3795 | 0.4684 | 0.2599 | 0.3144 | 0.4189 | 0.4155 | 0.3135 | 13.83 | 33.52 | 52.64 |
| 2011 | 0.3803 | 0.4660 | 0.2607 | 0.3171 | 0.4197 | 0.4156 | 0.3192 | 15.19 | 33.41 | 51.40 |
| 2013 | 0.3652 | 0.4571 | 0.2682 | 0.2954 | 0.4046 | 0.4048 | 0.2974 | 11.04 | 33.27 | 55.69 |
| 2015 | 0.3823 | 0.4770 | 0.2686 | 0.3011 | 0.4323 | 0.4241 | 0.3053 | 12.12 | 33.07 | 54.81 |
| 2017 | 0.3745 | 0.4721 | 0.2643 | 0.2967 | 0.4196 | 0.4139 | 0.2994 | 11.88 | 33.30 | 54.81 |
| 2019 | 0.3656 | 0.4493 | 0.2476 | 0.3096 | 0.3958 | 0.3995 | 0.3026 | 15.04 | 33.74 | 51.22 |
Table 5.
Water environment bearing pressure and its change rate of animal husbandry in China.
| Province | 2001 | 2005 | 2010 | 2015 | 2019 | Rate of Change |
|---|---|---|---|---|---|---|
| National Average | 0.29 | 0.33 | 0.23 | 0.26 | 0.22 | −23.90% |
| Beijing | 6.54 | 5.08 | 4.18 | 2.57 | 0.81 | −87.69% |
| Tianjin | 7.03 | 6.18 | 5.48 | 3.46 | 4.80 | −31.70% |
| Hebei | 14.13 | 11.74 | 6.53 | 7.54 | 6.08 | −57.01% |
| Shanxi | 2.37 | 3.40 | 1.76 | 2.12 | 1.89 | −20.13% |
| Inner Mongolia | 1.22 | 1.73 | 2.42 | 1.52 | 1.81 | 48.66% |
| Liaoning | 1.14 | 0.69 | 0.46 | 1.57 | 0.95 | −17.00% |
| Jilin | 0.60 | 0.37 | 0.30 | 0.68 | 0.36 | −39.54% |
| Heilongjiang | 0.42 | 0.53 | 0.58 | 0.58 | 0.23 | −46.10% |
| Shanghai | 0.92 | 0.69 | 0.52 | 0.22 | 0.18 | −80.38% |
| Jiangsu | 0.52 | 0.50 | 0.54 | 0.27 | 0.58 | 11.35% |
| Zhejiang | 0.09 | 0.09 | 0.06 | 0.03 | 0.03 | −66.77% |
| Anhui | 0.31 | 0.36 | 0.18 | 0.18 | 0.33 | 6.66% |
| Fujian | 0.10 | 0.07 | 0.05 | 0.05 | 0.07 | −22.71% |
| Jiangxi | 0.11 | 0.13 | 0.07 | 0.08 | 0.07 | −34.63% |
| Shandong | 2.82 | 2.19 | 2.24 | 5.05 | 3.65 | 29.54% |
| Henan | 2.31 | 2.29 | 1.65 | 3.72 | 3.77 | 63.03% |
| Hubei | 0.22 | 0.31 | 0.18 | 0.25 | 0.29 | 28.83% |
| Hunan | 0.18 | 0.28 | 0.17 | 0.19 | 0.15 | −17.80% |
| Guangdong | 0.18 | 0.16 | 0.09 | 0.08 | 0.06 | −63.89% |
| Guangxi | 0.22 | 0.26 | 0.10 | 0.07 | 0.07 | −66.66% |
| Hainan | 0.26 | 0.26 | 0.13 | 0.21 | 0.13 | −49.48% |
| Chongqing | 0.20 | 0.24 | 0.20 | 0.21 | 0.14 | −29.06% |
| Sichuan | 0.21 | 0.19 | 0.15 | 0.18 | 0.12 | −39.33% |
| Guizhou | 0.22 | 0.31 | 0.15 | 0.13 | 0.14 | −37.92% |
| Yunnan | 0.15 | 0.16 | 0.15 | 0.16 | 0.20 | 36.29% |
| Tibet | 0.01 | 0.01 | 0.03 | 0.04 | 0.04 | 157.00% |
| Shaanxi | 0.46 | 0.48 | 0.31 | 0.47 | 0.31 | −32.86% |
| Gansu | 1.22 | 1.07 | 1.46 | 2.02 | 1.02 | −16.21% |
| Qinghai | 0.44 | 0.31 | 0.38 | 0.48 | 0.31 | −29.22% |
| Ningxia | 5.13 | 11.59 | 10.70 | 12.76 | 10.44 | 103.37% |
| Xinjiang | 0.43 | 0.57 | 0.30 | 0.49 | 0.58 | 33.72% |
Table 6.
Gini coefficient of the animal husbandry water environment bearing pressure in China and its decomposition results.
Table 6.
Gini coefficient of the animal husbandry water environment bearing pressure in China and its decomposition results.
| Year | On the Whole | Gini Coefficient in the Region | Interregional Gini Coefficient | Contribution Rate | ||||||
|---|---|---|---|---|---|---|---|---|---|---|
| East of China | Center of China | West of China | East-Center | East-West | Center-West | Interregional | Within the Region | Hypervariable Density | ||
| 2001 | 0.7081 | 0.6619 | 0.5317 | 0.6330 | 0.7579 | 0.7718 | 0.6161 | 44.94 | 31.66 | 23.40 |
| 2003 | 0.6997 | 0.6494 | 0.4705 | 0.6587 | 0.7569 | 0.7560 | 0.6098 | 46.41 | 31.98 | 21.60 |
| 2005 | 0.7102 | 0.6677 | 0.5473 | 0.7380 | 0.7153 | 0.7459 | 0.6976 | 28.33 | 33.61 | 38.06 |
| 2007 | 0.6957 | 0.6754 | 0.4717 | 0.7285 | 0.6958 | 0.7254 | 0.6795 | 26.85 | 34.26 | 38.90 |
| 2009 | 0.6970 | 0.6219 | 0.5591 | 0.7569 | 0.6645 | 0.7384 | 0.7134 | 21.91 | 33.73 | 44.36 |
| 2011 | 0.6702 | 0.5744 | 0.4884 | 0.7547 | 0.5990 | 0.7213 | 0.6984 | 15.01 | 33.86 | 51.13 |
| 2013 | 0.6830 | 0.5721 | 0.6348 | 0.7326 | 0.6618 | 0.7254 | 0.7106 | 11.07 | 32.50 | 56.43 |
| 2015 | 0.7116 | 0.6360 | 0.5927 | 0.7649 | 0.6766 | 0.7496 | 0.7308 | 17.83 | 33.90 | 48.27 |
| 2017 | 0.6976 | 0.6090 | 0.4587 | 0.7619 | 0.6697 | 0.7227 | 0.7322 | 21.33 | 34.45 | 44.22 |
| 2019 | 0.7178 | 0.6519 | 0.6187 | 0.7641 | 0.6889 | 0.7515 | 0.7342 | 15.68 | 33.88 | 50.44 |
Publisher’s Note: MDPI stays neutral with regard to jurisdictional claims in published maps and institutional affiliations. |
© 2021 by the authors. Licensee MDPI, Basel, Switzerland. This article is an open access article distributed under the terms and conditions of the Creative Commons Attribution (CC BY) license (https://creativecommons.org/licenses/by/4.0/).
Share and Cite
MDPI and ACS Style
Yu, L.; Xiong, X.; Samim, S.A.; Hu, Z. Analysis of Water Resources and Water Environmental Carrying Capacity of Animal Husbandry in China—Based on Water Footprint Theory. Water 2021, 13, 3386. https://doi.org/10.3390/w13233386
AMA Style
Yu L, Xiong X, Samim SA, Hu Z. Analysis of Water Resources and Water Environmental Carrying Capacity of Animal Husbandry in China—Based on Water Footprint Theory. Water. 2021; 13(23):3386. https://doi.org/10.3390/w13233386
Chicago/Turabian StyleYu, Lin, Xuezhen Xiong, Sayed Alim Samim, and Zhiquan Hu. 2021. "Analysis of Water Resources and Water Environmental Carrying Capacity of Animal Husbandry in China—Based on Water Footprint Theory" Water 13, no. 23: 3386. https://doi.org/10.3390/w13233386
Note that from the first issue of 2016, this journal uses article numbers instead of page numbers. See further details here.