Article

Simulation of an Oxic-Settling-Anaerobic Pilot Plant Operated under Real Conditions Using the Activated Sludge Model No.2d

1
Department of Engineering and Architecture, University of Trieste, Via Alfonso Valerio, 6/1, 34127 Trieste, Italy
2
Department of Environmental Engineering, Democritus University of Thrace, 67100 Xanthi, Greece
*
Author to whom correspondence should be addressed.
Water 2021, 13(23), 3383; https://doi.org/10.3390/w13233383
Submission received: 29 September 2021 / Revised: 16 November 2021 / Accepted: 20 November 2021 / Published: 1 December 2021

Abstract

:
Oxic-settling-anaerobic (OSA) process has been introduced into the treatment line of wastewater in order to upgrade activated sludge processes and to reduce the production of excess sludge. The aim of the present study was to simulate the performance of an OSA pilot plant by implementing the Activated Sludge Model No.2d (ASM2d) into a mathematical modelling software (BioWin). The stepwise calibration, performed both by off-line experiments and software dynamic calibration, was carried out in a heuristic way, adjusting the parameters values that showed a major influence to the effluent and internal concentrations. All the reduction factors introduced into ASM2d to simulate the processes occurring in anoxic and anaerobic conditions were lowered in order to reproduce the concentrations of interest. In addition, the values of parameters of the PAOs (polyphosphate accumulating organisms)-related process (namely qPHA and YPO4) were found lower than those usually adopted. In general, theoretical results were in good agreement with the experimental data obtained from plant’s operation, showing an accurate predictive capacity of the model. Good performance was achieved considering the phosphorus removal related process, while some failures were detected in COD and ammonia simulations.

1. Introduction

The excess sludge produced in wastewater treatment plants (WWTPs) is recognized as one of the most critical issues in the conventional activated sludge (CAS) process, both from an environmental and an economical point of view [1]. In an effort to minimize sludge yield, side-stream technologies have been developed, such as mechanical, physicochemical and biological methods. Starting from its first appearance in earlier 90s [2], the oxic-settling-anaerobic (OSA) process modifies the CAS systems by inserting an anaerobic sludge holding tank (SHT) in the sludge return line. A portion of the recalculated sludge is treated in the SHT, and then, it is introduced into the aerobic reactor. This cyclic stress condition alters bacterial metabolism, leading to biomass reduction [3]. OSA is a cost-effective, in-situ process that does not have unfavorable effects on sludge settling properties and effluent quality and therefore has attracted several pilot and full-scale applications with the aim to reduce the excess sludge production [1,3,4,5,6]. In recent years, the combination of the OSA process with other technologies capable of sludge volume reduction, such as thermal and mechanical treatment, was also studied [7,8]. Although the implementation of an additional tank in the return sludge line increases the investment cost, OSA process is an environmental-friendly technology with several advantages: (i) the proven excess sludge reduction [1,4,9,10], (ii) the process stability, and (iii) the easy implementation in current conventional activated sludge system (CAS) associated to low operational costs [3,11].
As reviewed by Semblante et al. [11], several hypotheses have been proposed about the mechanisms that underlies the sludge reduction in OSA process: enhanced endogenous decay, EPS destruction, biomass feasting/fasting, energy uncoupling, slow-growing bacteria selection, and predation on bacteria by higher organisms. Additionally, the coupling between the anaerobic sludge hydrolysis and the aerobic cell lysis is reported to promote the sludge reduction [12]. However, it is likely that the excess sludge minimization is the result of a combination of multiple factors [11].
Yağci et al. [13] aimed to investigate the cause of sludge reduction in OSA process through the system kinetics and stoichiometry. For this purpose, an OSA lab-scale plant and a CAS lab-scale system were operated under identical conditions, and their performance was evaluated by respirometry tests. The substrate removal process was simulated with the Activated Sludge Model No.1 [14], and the results showed that the heterotrophic maximum growth rate and the maximum hydrolysis rate (for the hydrolysable COD) were lower for the OSA system compared to the control system (CAS), while no differences were found for the endogenous decay rate. Since the systems were both designed for only organic carbon removal, autotrophic biomass and polyphosphate accumulating organisms (PAOs) were not taken in account. However, several OSA experimentations performed with real or synthetic wastewater showed phosphorous release/accumulation phenomena, suggesting that PAO dynamics occurred [1,2,15]. Among the ASM family models, those allowing the simulation of phosphorus removal process, due to PAOs metabolism, are the Activated Sludge Model No.2 (ASM2) [16] and the Activated Sludge Model No.2d (ASM2d) [17]. The two similar models were proposed by the IWA Task Group to simulate the combined biological processes for chemical oxygen demand (COD) and nitrogen and phosphorus removal in activated sludge systems [18]. In particular, the ASM2d was developed to fix the ASM2 unresolved issue related to the demonstrated fact that the PAOs can denitrify using cell internal organic storage products as electron donor. To the purpose, the ASM2d assumes that these organisms may grow in an anoxic as well as in an aerobic environment [18].
In the present study, the simulation of an OSA pilot plant (with a total volume of about 4 m3) is presented. The pilot plant, described in depth in a previous work [1], operated for 16 months with real wastewater feeding. The previous findings from analysis, mass balances, and batch tests were utilized to simulate the plant operations by BioWin software (EnviroSim Associates Ltd., Hamilton, ON, Canada) with the implementation of the Activated Sludge Model No.2d. BioWin software is a recognized software used for WWTPs simulating purposes, providing accurate simulating results. The mathematical modelling presented in this study provides a simulating tool that has been validated under real operating conditions. The model can be used as a prediction tool for monitoring and control OSA processes implanted in WWTPs. The concept of the present work is of highly importance towards the optimization of waste management strategies. To the best of our knowledge, the work is new since no similar modelling study has been reported to the literature.

2. Materials and Methods

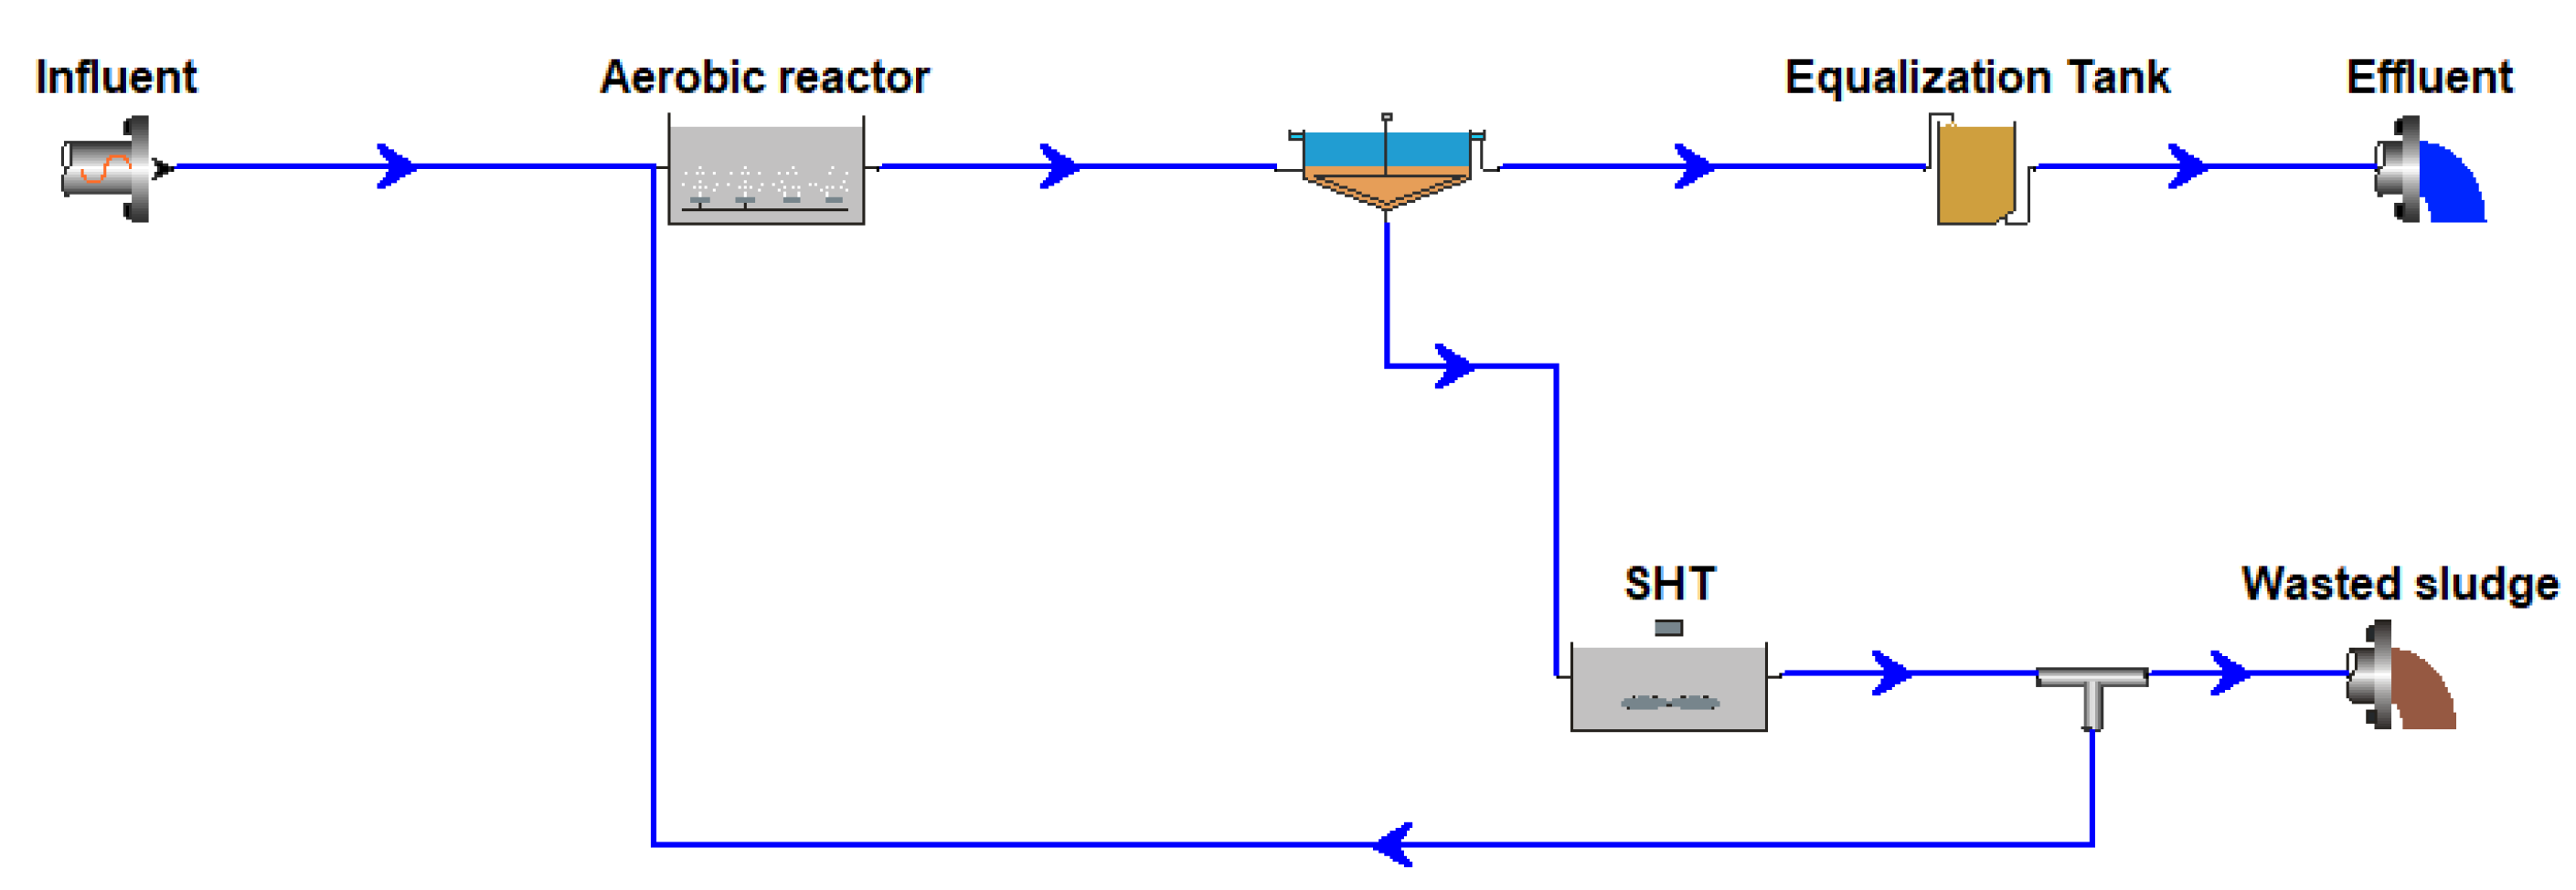
2.1. OSA Pilot Plant Operation

As has been previously reported [1], the OSA pilot plant, designed and built in cooperation with C.A.F.C. S.p.A. (Consorzio Acquedotti Friuli Centrale, Italy), was realized close to the Terenzano (UD) WWTP and was supplied with the real incoming sewage of the WWTP (after grit pretreatment).
It consisted of:
-
An aerobic reactor, with a variable volume of 0.5–1.08 m3. In the aerobic reactor, the aeration and the mixing were provided by four air diffusers. It was continuously fed by gravity from an influent reservoir with a volume of 0.373 m3;
-
A settling tank with a volume of 0.8 m3; and
-
An anoxic/anaerobic sludge holding tank (SHT) of 2.0 m3, where the total sludge flowrate from the settler was recirculated. The SHT was equipped of a mechanical stirrer to maintain the sludge suspended with homogeneous composition.
The treated effluent was collected into a 0.2-m3 tank before its final discharge. All the tanks were made of stainless steel and were placed into a small hangar. The pilot plant was equipped with pH, ORP, temperature, and dissolved oxygen (DO) probes and a programmable logic controller (PLC). Although DO concentration in the activated sludge process (aerobic reactor) is usually set at 2 mg/L, in the present work, a higher concentration was selected based on previous studies on OSA process [4,8,9,10], which reported a wide range of DO concentrations, ranging from 2 to 7 mg O2/L. The DO set-point concentration into the aerobic tank of this study was 4.0 mg O2/L, providing also the mixing of the aerobic reactor. The sludge retention time (SRT) of the system was controlled by periodic discharge of excess sludge from the bottom of the sludge holding tank. The wastage volume of sludge was selected in order to obtain a certain SRT value.
The schematic diagram of the OSA pilot plant was given in our previous work [1]. The pilot plant was in operation for 16 months under several operating conditions. The modifications of the HRT and the SRT values resulted in six different periods of operations [1]. Table 1 summarizes the significant characteristics of plant operations.

2.2. Mathematical Modeling Using the Activated Sludge Model No.2d

The processes occurring into the aerobic reactor and into the sludge holding tank were modeled by applying the Activated Sludge Model No.2d [18].
According to the developers, the Activated Sludge Model No.2d is a minor extension of ASM2 introduced in order to account for the fact that PAOs can use cell internal organic storage products for denitrification. To the purpose, two new processes were added: the polyphosphate storage and the growth of PAOs under anoxic conditions.
As reported by García-Usach et al. [19], given the proven fact that the polyphosphate accumulating organisms can use nitrate as an electron acceptor in the absence of molecular oxygen, it is unclear whether PAOs are able to change their metabolisms depending on the electron acceptor or whether two PAOs groups coexist: denitrifying PAO (dPAO) and non-denitrifying PAO. The ASM2d addresses the issue by introducing the reduction factor ηPAO to adapt the kinetic equations (initially developed for the aerobic processes) to the anoxic conditions. In this manner, one can consider the ηPAO factor as a ratio of the dPAO to the total PAO population or as a reduction factor accounting for lower kinetics in anoxic conditions.
In our previous work on the OSA pilot plant [1], a persistent denitrification process was noticed into the sludge holding tank, with an efficiency ranging from 48.4% to 78.6%; however, no study was performed in order to determinate whether denitrification was accomplished by ordinary denitrifiers or by dPAOs. In addition, results from several anoxic batch tests showed that the anoxic phosphorus uptake was noticed just once, with a specific P removal rate of 0.22 mg P/(g VSS·h) [1]. Nevertheless, it was chosen to use the ASM2d in the simulation in order to account for a possible dPAOs dynamics not noticeable in laboratory batch tests.

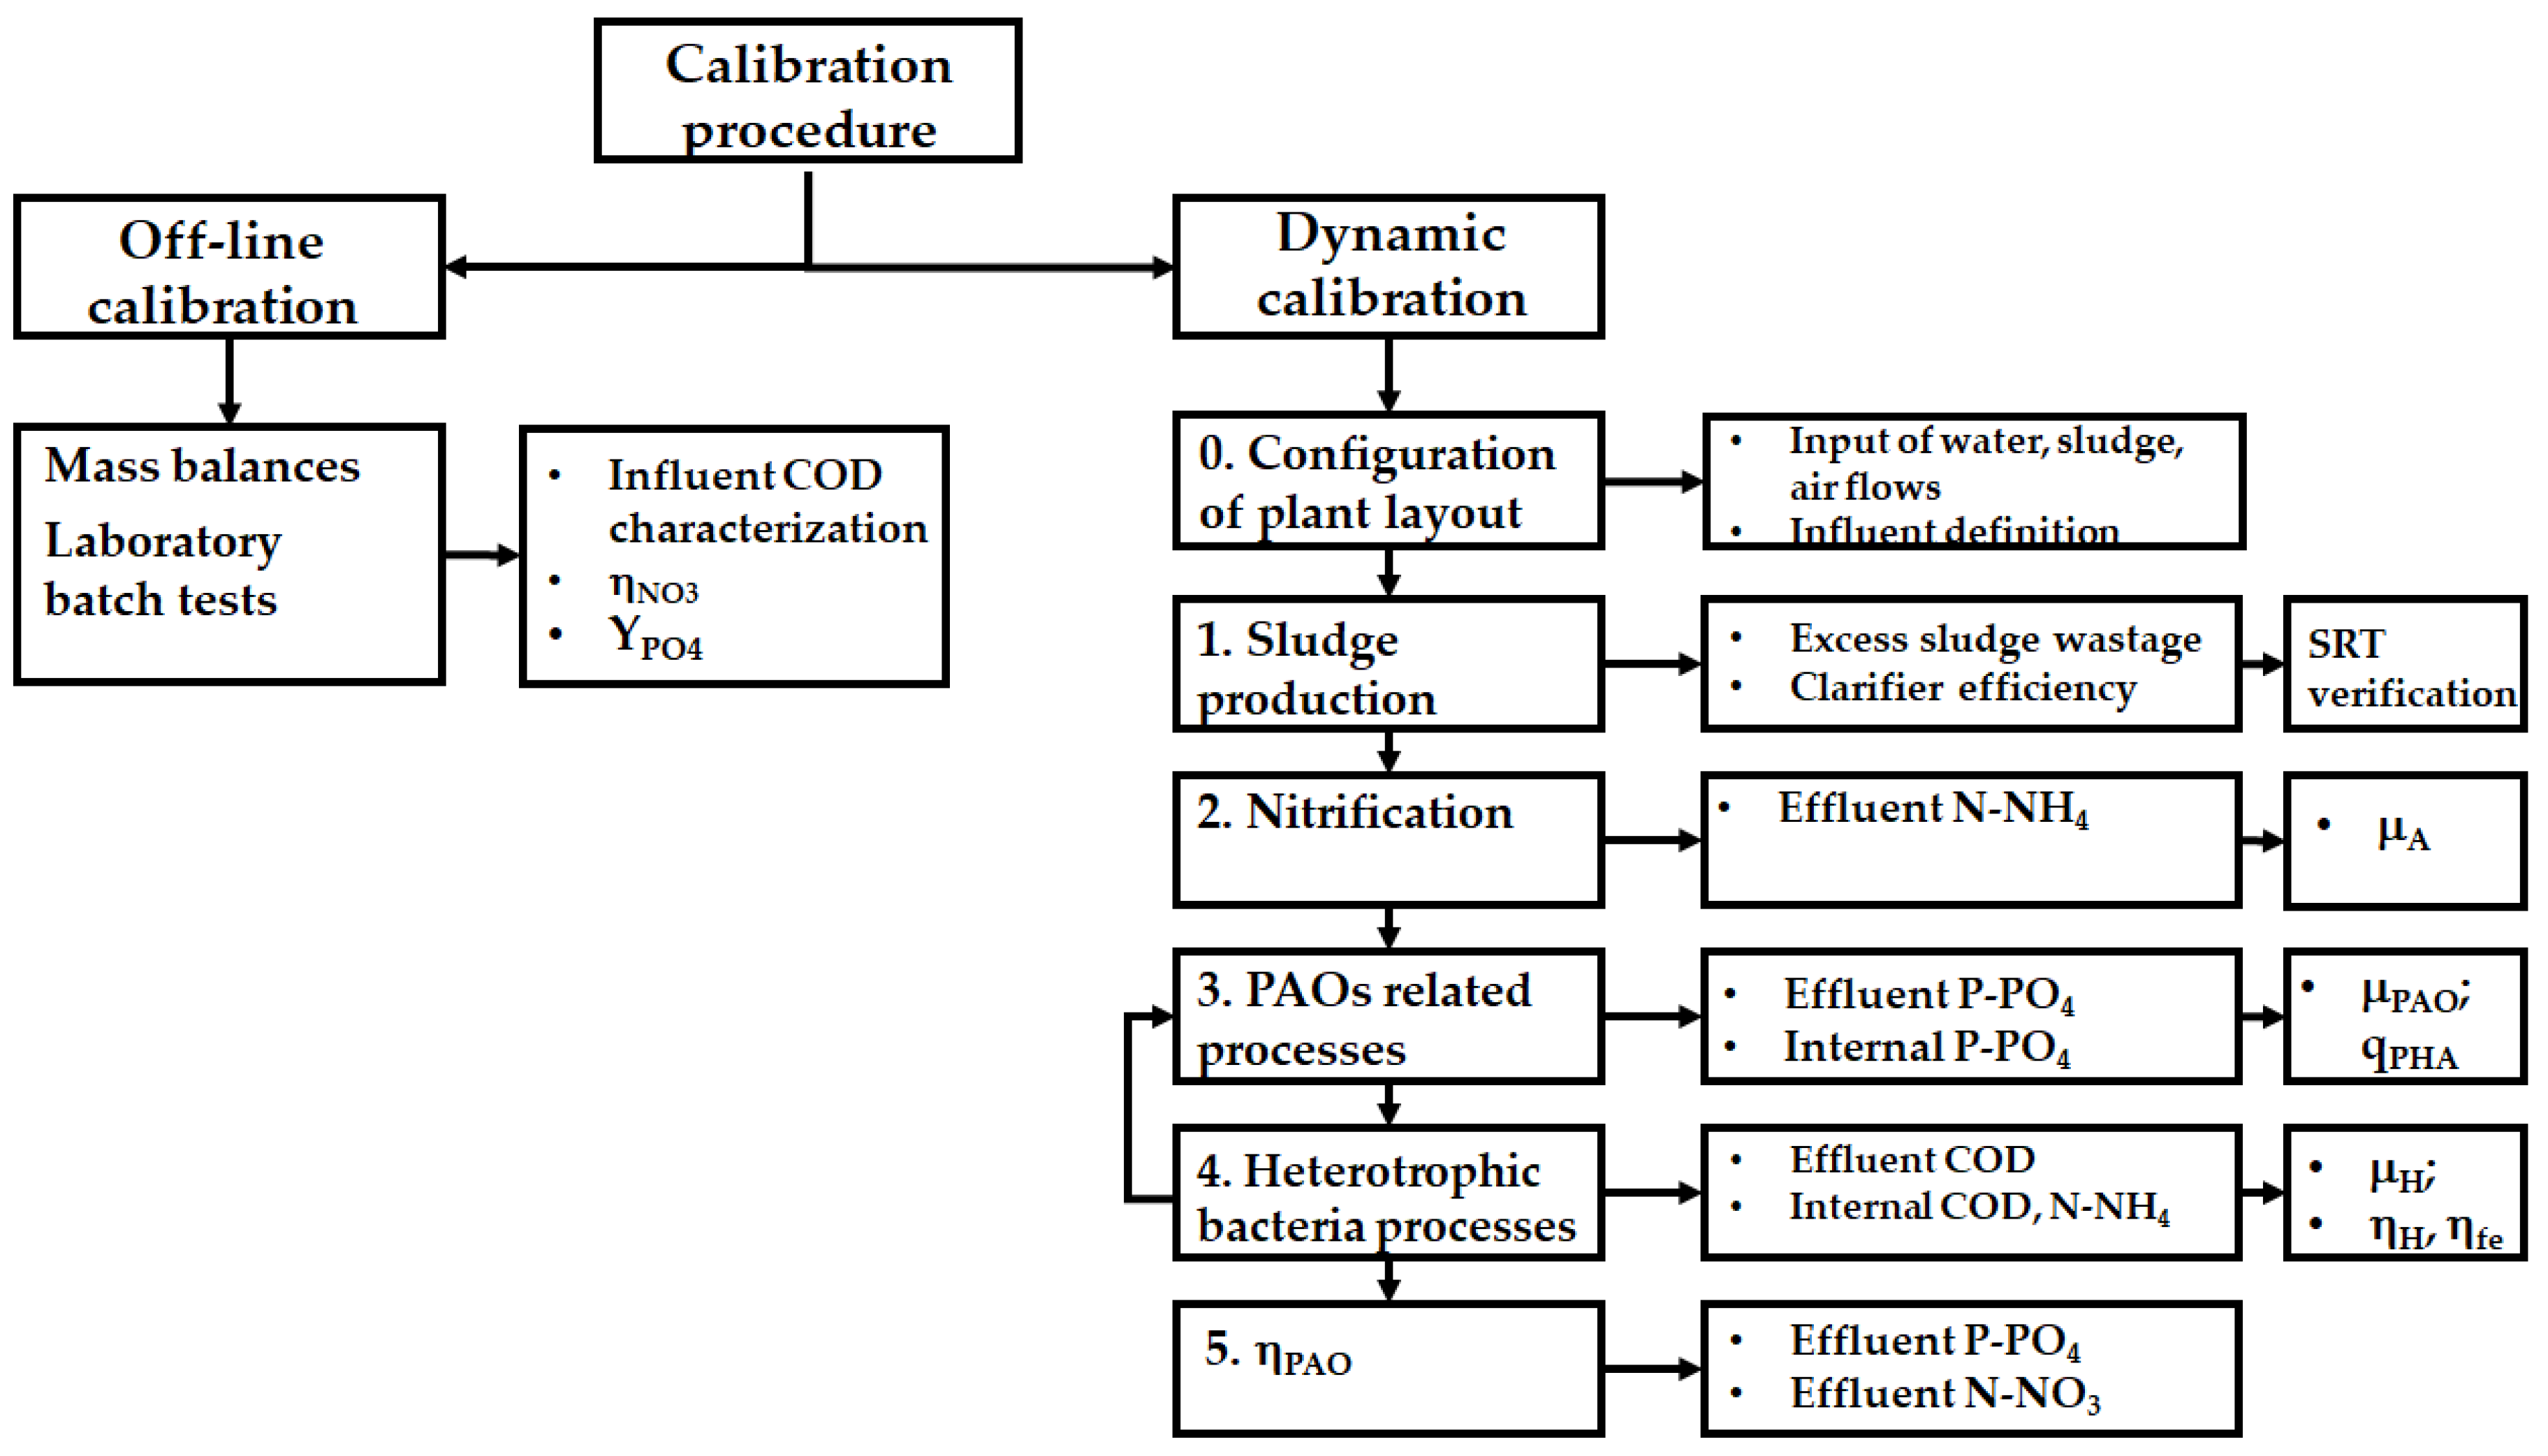
2.3. System Calibration Methodology

The pilot plant was simulated by implementing the ASM2d model into the BioWin software.
The calibration of the system followed a stepwise procedure, including an off-line calibration and a dynamic calibration with BioWin software. A schematic presentation of calibration procedure is given in Figure 1.
As mentioned before, the OSA pilot plant was extensively studied in a previous work [1]; therefore, analysis and characterization data and mass balance results were already available.
The off-line calibration, based on laboratory batch tests and mass balance calculations, provided the following information (Figure 1):
  • The COD fractions;
  • The reduction factor for heterotrophic denitrification, ηNO3; and
  • The amount of P released per g of PHA stored, YPO4 (g P/g COD).
The parameters estimated by the BioWin dynamic calibration were (Figure 1):
  • The maximum growth rate of autotrophic organisms μA (d−1);
  • The rate constant for storage of XPHA (base XPP) qPHA (d−1);
  • The maximum growth rate of PAOs, μPAO (d−1), and the reduction factor for PAOs anoxic activity, ηPAO;
  • The anoxic hydrolysis reduction factor, ηH, and the anaerobic hydrolysis reduction factor, ηfe; and
  • The maximum heterotrophic growth rate μH (d−1).

2.3.1. Off-Line Calibration

As stated above, the results from previous experiments [1] were utilized to obtain the COD fractions, the ηNO3 factor and the amount of P released per PHA stored (YPO4) (Figure 1).
According to the ASM2d notation, the influent total COD (tCOD) was considered as the sum of five COD fractions:
t C O D = S A + S F + S I + X S + X I
where:
  • SA, represents the fermentation products (while it is assumed to be acetate, it encompasses a whole range of other fermentation products);
  • SF is the fermentable readily biodegradable organic substrates;
  • SI stands for the inert soluble organic material;
  • XS represents the slowly biodegradable organic substrates (particulate); and
  • XI represents the inert particulate organic substrates.
Indicating with S the soluble components and with X the particulate ones, it follows that the soluble COD was done by:
s C O D = S A + S F + S I
and the particulate COD by:
x C O D = X S + X I
In the present work, soluble and particulate components were differentiated by filtration through 0.45-μm membrane filters.
Moreover, distinguishing between biodegradable COD (bioCOD) and non-biodegradable COD (nbioCOD), the two following amounts could be calculated:
b i o C O D = S A + S F + X S
n b i o C O D = S I + X I
In the light of the above, the COD fractions were obtained in the following steps:
  • The total COD (tCOD) was determined analyzing the un-filtrated samples with HACH test cuvettes according with the Reactor Digestion Method approved by USEPA [20];
  • The soluble COD (sCOD) was determined in the same manner of tCOD, but analyzing samples filtrated at 0.45 μm;
  • The particulate COD was calculated by the difference between the total and the soluble COD;
  • The biodegradable COD was determined by mass balances in respirometric tests performed with real wastewater;
  • The non-biodegradable COD was found by the difference between tCOD and bioCOD;
  • The inert soluble SI was esteemed by a respirometric test performed with real filtered wastewater and addition of allylthiourea (ATU) to avoid nitrification. Although the SI fraction is usually assumed being equal to effluent soluble COD (or at least as a fraction of it), in this work, it was established to not consider the effluent soluble COD concentration since its value could be influenced by the hydrolysis processes occurring into SHT;
  • The inert particulate XI fraction was obtained by the Equation (5); and
  • The soluble biodegradable fraction, given by the sum of SF and SA, was obtained by the Equation (2).
It is worth noting that the procedure just described enabled to estimate the whole readily biodegradable COD, usually named SS, not distinguishing between SA and SF (therefore, in the simulation, the proposed default BioWin value for SA fraction was adopted).
The found values of COD fractions were: SI = 6.9%; SS (SA + SF) = 28.2%; XI = 10.9%; XS = 53.9%.
The reduction factor for heterotrophic denitrification ηNO3 accounts for the fact that not all heterotrophic organisms XH may be capable of denitrification or that denitrification may only proceed at a reduced rate [18]. Its value was calculated from the maximum nitrate uptake rate (NURMAX) and the maximum oxygen uptake rate (OURMAX), which were obtained in two parallel batch reactors after the addition of the same amount of soluble COD. According to Henze et al. [18], the reduction factor was obtained as:
η N O 3 = 2.86 · N U R M A X O U R M A X
The YPO4 parameter was obtained from an anaerobic batch test with addition of acetic acid (HAc). The sludge from SHT with an initial concentration of 11 mg P-PO4/L and of 0.2 mg N-NO3/L was fed with a HAc solution in order to achieve an initial concentration of around 150 mg COD/L. The system was then monitored by analyzing periodic samples for P-PO4 and COD. YPO4 was obtained from the linear fitting of P-PO4 vs. COD, as reported in Figure 2.

2.3.2. BioWin Dynamic Calibration

The dynamic calibration was performed by implementing the ASM2d into the model builder reaction section of the BioWin software (EnviroSim Associates Ltd., Hamilton, ON, Canada). The original model structure was slightly modified by excluding the influence of alkalinity.
The dynamic influent concentration profiles were obtained from the extensive sampling campaign performed in a previous study [1]. The wastewater characterization data were indeed utilized to edit the influent type. The BDF (Backward Differentiation Formula) method was selected in the BioWin dynamic simulator option since it has good stability properties, and it is well suited to stiff problems (the default values of 0.0001 for the relative error tolerance and of 10−6 for the absolute error tolerance were selected).
The calibration was performed in a heuristic way. The choice of parameters to calibrate was done with a process engineer approach, based on process and model knowledge rather than on the sensitivity analysis [21]. The adjusted parameters were those that exhibited a major effect not only in the effluent concentration but also in the SHT concentration. Van Veldhuizen et al. [21] emphasized the importance to consider also the “internal concentration” in calibration procedure.
As aforementioned, a stepwise procedure was followed (Figure 1). The preliminary step was the configuration of the OSA pilot plant layout (Figure 3) by inputting the actual values of all water, sludge, and air flows. The variable COD input type was set up, with the COD fractions previous determined. Since no determination was done for the SA fraction, the default value of 0.15 gCOD/g of readily biodegradable COD was adopted. The value of the initial biomass concentration was chosen equal to 30% of the activated sludge particulate COD.
The six periods of operations were simulated. At the initial stage of each run, the initial conditions of the simulation were set based on the field analysis and on the concentration simulated in the previous run.
At each run, before the parameters’ adjustment, the total (aerobic reactor + SHT) sludge retention time SRT was verified since the value of SRT is considered as a crucial parameter for the reliability of simulation [22,23]. In general, good agreement between simulated and measured SRT values were obtained by inputting into the BioWin software the actual values of withdrawn sludge flow.
An ideal clarifier with a percent removal of 99.82 ± 0.07% (the default BioWin value is 99.80) was set up for the secondary settling. It was not considered necessary to characterize in detail the settling since the satisfying agreement obtained during simulation with regard to effluent solids concentration.
Once verified the fluxes and the sludge retention time, the biological processes were calibrated following approximately the following order: (i) nitrification; (ii) PAOs-related processes; and (iii) heterotrophic bacteria-related processes. However, since the modelled processes influence each other, the calibration procedure was performed in several loops in order to obtain an optimized set of parameters values.
The nitrification process was calibrated by adjusting the μA value on the ammonium effluent content. The PAOs-related processes were calibrated by tuning the qPHA and μPAO values in order to simulate the P-PO4 concentrations inside the SHT and in the effluent. The anoxic reduction factor for PAO, ηPAO, was adjusted by considering the effluent P-PO4 and N-NO3 concentrations. ηH and ηfe were adjusted based on the COD and N-NH4 concentrations inside the SHT. The heterotrophic growth rate, μH, was changed in order to simulate the effluent COD concentration (its effect on ammonia effluent was also monitored).
The set of the adjusted parameters found in the previous run served as starting point for further calibration of the next calibrated period (it should be noted that six periods of experiments were simulated).
The optimized set of adjusted parameters are reported in Table 2. No univocal value for ηPAO was established since this parameter was left free to vary during the time (as better explained later).
The goodness of fit was evaluated by calculating the root mean squared error (RMSE) by the formula:
R M S E   ( mg / L ) = 1 N · i = 1 N ( m i p i ) 2
where
  • mi is the measured value of the given pollutant effluent concentration;
  • pi is the correspondent BioWin simulated value; and
  • N is the number of observations.

3. Results and Discussion

The values of the calibrated parameters are reported in Table 2 beside the defaults ASM2d ones [18].
The first fact standing out from the comparison between default and simulated parameters are the low calibrated values of qPHA and YPO4. The qPHA value is also lower than values found in literature for simulation of PAOs related processes, ranging from 3.57 d−1 to 6 d−1 [19,24]. This was probably due to the fact that the intracellular storage of SA from polyphosphate accumulating organisms was hindered by the competition with ordinary heterotrophs. The values of μA and μPAO were higher than those proposed by the IWA task group [18].
As regards the calibration of the anoxic factor for PAOs, ηPAO, no univocal value was determined, but it was left free to change during the experiment periods. In particular, during the dynamic calibration the ηPAO value increased from 0.07 to 0.16. This was done under the hypothesis that the denitrification process accomplished by PAO bacteria improved over time due to an increased amount of dPAO fraction or an enhancement of anoxic process rates. However, the final found value of 0.16 is lower than 0.60, as proposed by ASM2d developers [18], but comparable to those found by García-Usach et al. [19], ranging from 0.23 to 0.25. The low value of calibrated ηPAO is in agreement with results from previous batch tests [1], where the anoxic P uptake was noticed occasionally.
The Figure 4 and Figure 5 report the calibration results for the period IV (the long-lasting one). The results of the other simulated periods are presented in the Supplementary Material. The calculated RMSE are reported in Table 3.
As it can be seen from the results, the general agreement between measured and simulated data is satisfactory. Differences emerge among the simulated periods. The first period of operation is well simulated (Figures S1 and S2 of the Supplementary Material). In the second period, differences between simulated and measured N values begin to appear in the last days of plant operations (Figures S3 and S4 of the Supplementary Material). These gaps become more pronounced during the third simulated period (Figures S5 and S6 of the Supplementary Material). It should be noted that in these days, the pilot plant experienced a worsening in the operations that led to a modification in the operating conditions [1]. The fourth period of plant operation is well simulated except for COD concentration. Indeed, in the last month of this period (lasting 119 days), the simulated COD concentration exhibits a remarkable deviation from the measured values (Figure 3 and Figure 4). It is unclear whether this is due to a failure in simulating the hydrolysis occurring into the SHT or in simulating the effects of single peaks in influent concentration. Satisfactory fitting was performed as regards the V period (Figures S7 and S8 of the Supplementary Material), while in the last period, a similar trend as the fourth one for the COD concentration was noticed (Figures S9 and S10 of the Supplementary Material). In a previous paper, Larrea et al. [24] stated that the carbon removal model in ASM2d was found unsuitable for predicting the values of effluent filtered COD. In the present work, occasional deviations of simulated values from the actual ones were noticed, but more data are needed to investigate the reason.
As regards the phosphorus removal, the simulation showed a good predictive capacity.
The lowering of ηh and ηfe, the factors accounting for the reduction of hydrolysis rate in anoxic and anaerobic conditions, respectively, allowed to simulate the COD, N-NH4, and P concentrations inside the sludge holding tank with a fair approximation.

4. Conclusions

The present paper shows the results obtained by simulating an OSA pilot plant process with the Activated Sludge Model No.2d. The simulation was carried out implementing the system into the BioWin software. The calibration was performed both by off-line experiments and by BioWin dynamic simulation. The adjusted parameters were: μA, μH, μPAO, ηNO3, ηPAO, ηH, ηfe, qPHA, and YPO4. They were selected by a process engineer approach, based on process and model knowledge rather than on the sensitivity analysis. The results show that the application of the ASM2d to OSA-like processes produce accurate results that can be used as a prediction and decision-maker tool towards minimization of excess sludge produced in WWTPs.
The main emerging finding could be summarized as follows:
  • The values of reduction factor accounting for processes accomplished in anoxic and anaerobic conditions—ηNO3, ηPAO, ηH, and ηfe—were found lower than those proposed by ASM2d, indicating that in the sludge holding tank, the reactions proceeded generally with slower kinetics.
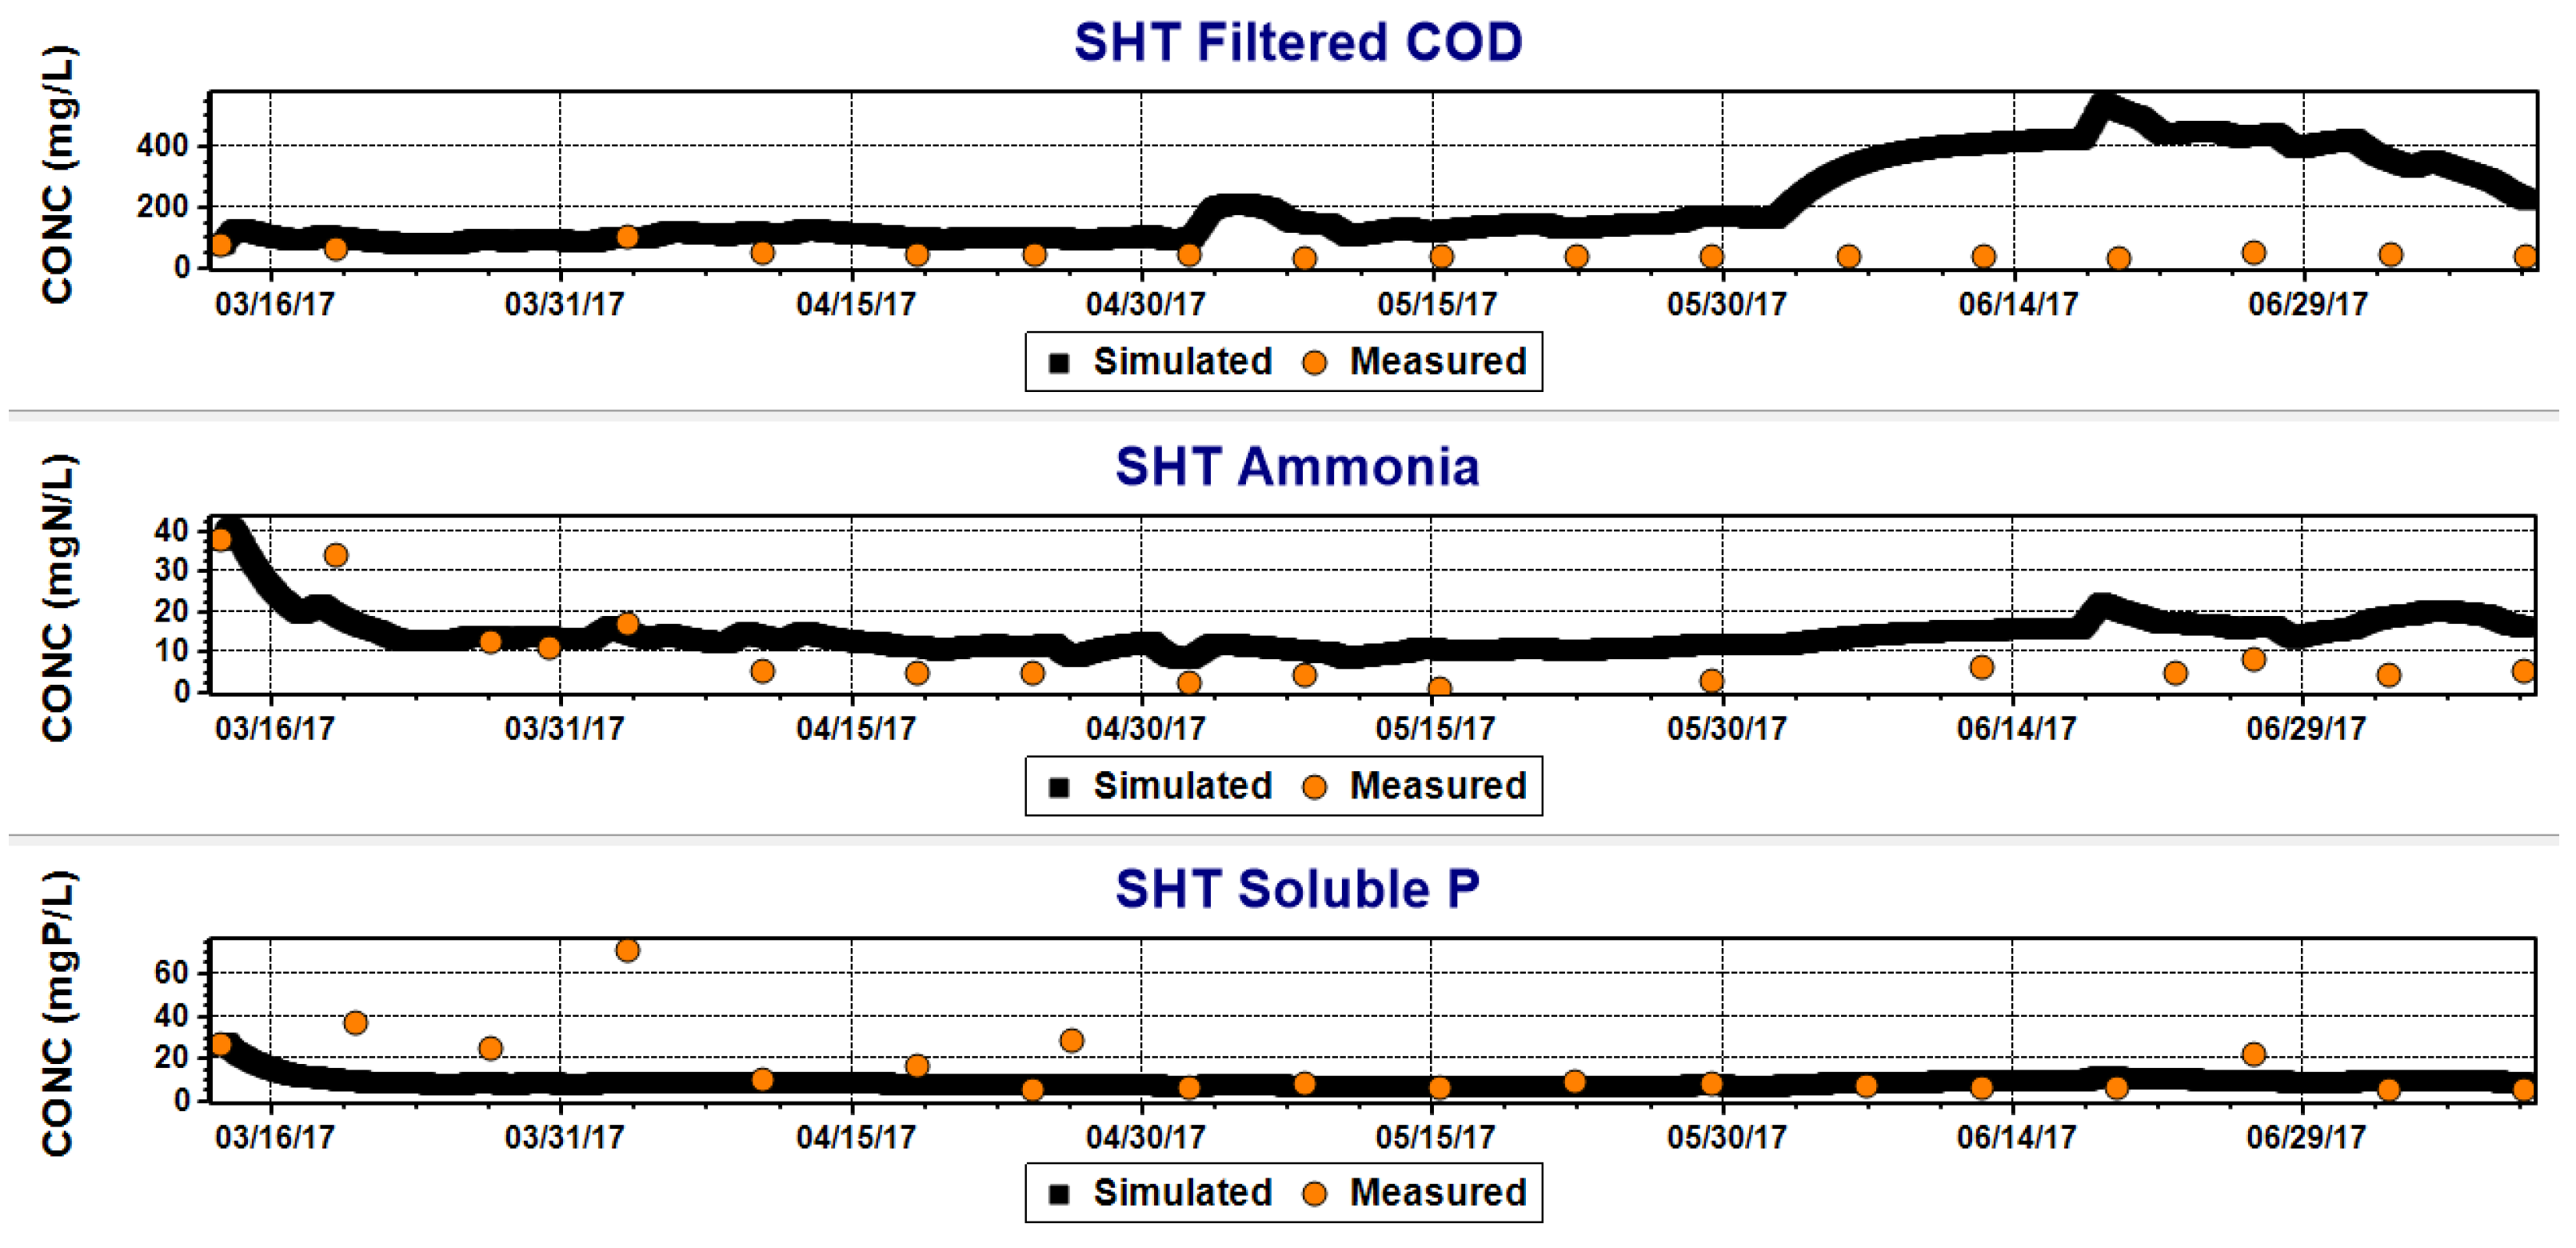
  • Good reproducibility of soluble P concentrations was obtained with adjusted parameters of Activated Sludge Model No.2d as regards both the effluent and the trend inside the SHT.
  • The simulation of the ammonia concentrations was satisfying except for period III of operations when a relevant ammonia accumulation was noticed in the system. On that occasion, the simulated values diverged from the measured one, showing a failure of the simulation.
  • Some issues were observed in COD simulation, but it is unclear whether they are due to a failure in simulating the hydrolysis into the SHT or in simulating the effects of single peaks in influent concentration.
It should be noted that the present study is the first that reports the mathematical simulation of OSA process using Activated Sludge Model No.2, aiming to put the bases for the development of fruitful simulation techniques/methods for OSA process.

Supplementary Materials

The following are available online at https://www.mdpi.com/article/10.3390/w13233383/s1, Figure S1: Period I—Effluent simulated concentrations VS measured; Figure S2: Period I—SHT simulated concentrations vs. measured; Figure S3: Period II—Effluent simulated concentrations vs. measured; Figure S4: Period II—SHT simulated concentrations vs. measured; Figure S5: Period III—Effluent simulated concentrations vs. measured; Figure S6: Period III—SHT simulated concentrations vs. measured; Figure S7: Period V—Effluent simulated concentrations vs. measured; Figure S8: Period V—SHT simulated concentrations vs. measured; Figure S9: Period VI—Effluent simulated concentrations vs. measured; Figure S10: Period VI—SHT simulated concentrations vs. measured.

Author Contributions

Conceptualization, R.V., A.C., M.E.D.A., V.G. and I.A.V.; methodology, R.V., A.C. and V.G.; validation, R.V. and V.G.; formal analysis, R.V. and V.G.; investigation, R.V., M.E.D.A. and I.A.V.; resources, A.C. and V.G.; data curation, R.V., A.C. and V.G.; writing—original draft preparation, R.V.; writing—review and editing, A.C. and I.A.V.; visualization, R.V; supervision, A.C. and V.G.; project administration, A.C. All authors have read and agreed to the published version of the manuscript.

Funding

This research received no external funding.

Institutional Review Board Statement

Not applicable.

Informed Consent Statement

Not applicable.

Data Availability Statement

The data presented in this study are available in the paper in question, in the supplementary material, and in https://doi.org/10.1016/j.jwpe.2019.100902 (accessed on 19 November 2021).

Acknowledgments

The authors are grateful to CAFC S.p.A. for cooperation in building and managing the OSA pilot plant.

Conflicts of Interest

The authors declare no conflict of interest.

Abbreviations

AbbreviationDescription
ASMActivated sludge model
CASConventional activated sludge
CODChemical oxygen demand
EPSExtracellular polymeric substances
HRTHydraulic retention time
MLSS Mixed liquor suspended solids
MLVSSMixed liquor volatile suspended solids
ORPOxidation reduction potential
OSAOxic settling anaerobic
PAOPolyphosphate accumulating organism
PHAPolyhydroxyalkanoates
QINInfluent flowrate
QOUTEffluent flowrate
QRReturn flowrate
sCODSoluble chemical oxygen demand
SRTSolids retention time
SSSuspended solids
SVISludge volume index
TTemperature
VAERVolume of the aerobic reactor
WWTPWastewater treatment plant
YobsObserved yield

References

  1. Vitanza, R.; Cortesi, A.; De Arana-Sarabia, M.E.; Gallo, V.; Vasiliadou, I.A. Oxic settling anaerobic (OSA) process for excess sludge reduction: 16 months of management of a pilot plant fed with real wastewater. J. Water Process. Eng. 2019, 32, 100902. [Google Scholar] [CrossRef]
  2. Chudoba, P.; Morel, A.; Capdeville, B. The case of both energetic uncoupling and metabolic selection of microorganisms in the OSA activated sludge system. Environ. Technol. 1992, 13, 761–770. [Google Scholar] [CrossRef]
  3. Martins, C.L.; Velho, V.F.; Magnus, B.S.; Xavier, J.A.; Guimarães, L.B.; Leite, W.R.; Costa, R.H.R. Assessment of sludge reduction and microbial dynamics in an OSA process with short anaerobic retention time. Environ. Technol. Innov. 2020, 19, 101025. [Google Scholar] [CrossRef]
  4. Demir, Ö.; Filibeli, A. The investigation of the sludge reduction efficiency mechanisms in oxic–settling–anaerobic (OSA) process. Water Sci. Technol. 2017, 73, 2311–2323. [Google Scholar] [CrossRef] [PubMed]
  5. Velho, V.F.; Foladori, P.; Andreottola, G.; Costa, R.H.R. Anaerobic side-stream reactor for excess sludge reduction: 5-year management of a full-scale plant. J. Environ. Manag. 2016, 177, 223–230. [Google Scholar] [CrossRef] [PubMed]
  6. Wang, J.; Zhao, Q.; Jin, W.; Lin, J. Mechanism on minimization of excess sludge in oxic-settling anaerobic (OSA) process. Front. Environ. Sci. Eng. China 2008, 2, 36–43. [Google Scholar] [CrossRef]
  7. Corsino, S.F.; Capodici, M.; Di Trapani, D.; Torregrossa, M.; Viviani, G. Combination of the OSA process with thermal treatment at moderate temperature for excess sludge minimization. Bioresour. Technol. 2020, 300, 122679. [Google Scholar] [CrossRef] [PubMed]
  8. Nazif, S.; Mehrdadi, N.; Zare, S.; Mosavari, S. Improvement and prediction of OSA system performance in sludge reduction through integration with thermal and mechanical treatment. Water Sci. Technol. 2016, 74, 2087–2096. [Google Scholar] [CrossRef] [PubMed] [Green Version]
  9. Romero-Pareja, P.M.; Aragon-Cruz, C.A.; Quiroga-Alonso, J.M.; Coello-Oviedo, M.D. Incorporating the Oxic-Settling-Anaerobic (OSA) process into an anoxic–oxic-system for sewage sludge reduction and nutrient removal. Environ. Prog. Sustain. Energy 2017, 37, 1068–1074. [Google Scholar] [CrossRef]
  10. Saby, S.; Djafer, M.; Chen, G.H. Effect of low ORP in anoxic sludge zone on excess sludge production in oxic-settling-anoxic activated sludge process. Water Res. 2003, 37, 11–20. [Google Scholar] [CrossRef]
  11. Semblante, G.U.; Hai, F.I.; Ngo, H.H.; Guo, W.; You, S.J.; Price, W.E.; Nghiem, L.D. Sludge cycling between aerobic, anoxic and anaerobic regimes to reduce sludge production during wastewater treatment: Performance, mechanisms, and implications. Bioresour. Technol. 2014, 155, 395–409. [Google Scholar] [CrossRef] [PubMed] [Green Version]
  12. Foladori, P.; Velho, V.F.; Costa, R.H.R.; Bruni, L.; Quaranta, A.; Andreottola, G. Concerning the role of cell lysis-cryptic growth in anaerobic side-stream reactors: The single-cell analysis of viable, dead and lysed bacteria. Water Res. 2015, 74, 132–142. [Google Scholar] [CrossRef] [PubMed]
  13. Yağci, N.; Pala-Özkök, Í.; Sarialioğlu, F.; Alli, B.; Artan, N.; Orhon, D.; Sözen, S. Respirometric anatomy of the OSA process: Microbial basis of enhanced sludge reduction mechanism. J. Chem. Technol. Biotechnol. 2018, 93, 3462–3471. [Google Scholar] [CrossRef]
  14. Henze, M.; Grady, C.P.L., Jr.; Gujer, W.; Marais, G.v.R.; Matsuo, T. Activated Sludge Model No. 1., IAWPRC Scientific and Technical Report No. 1; IAWPRC: London, UK, 1987. [Google Scholar]
  15. Ferrentino, R.; Langone, M.; Villa, R.; Andreottola, G. Strict anaerobic side-stream reactor: Effect of the sludge interchange ratio on sludge reduction in a biological nutrient removal process. Environ. Sci. Pollut. Res. 2018, 25, 1243–1256. [Google Scholar] [CrossRef] [PubMed]
  16. Henze, M.; Gujer, W.; Mino, T.; Matsuo, T.; Wentzel, M.C.; Marais, G.v.R. Activated Sludge Model No. 2., IAWQ Scientific and Technical Report No. 3; IAWQ: London, UK, 1995. [Google Scholar]
  17. Henze, M.; Gujer, W.; Mino, T.; Matsuo, T.; Wentzel, M.C.; Marais, G.v.R.; van Loosdrecht, M.C.M. Activated Sludge Model No.2d. Water Sci. Technol. 1999, 39, 165–182. [Google Scholar] [CrossRef]
  18. Henze, M.; Gujer, W.; Mino, T.; van Loosdrecht, M. Activated Sludge Models, ASM1, ASM2, ASM2d and ASM3. Scientific and Technical Report (Volume 5); IWA Publishing: London, UK, 2000. [Google Scholar] [CrossRef]
  19. Garcıa-Usach, F.; Ribes, J.; Ferrer, J.; Seco, A. Calibration of denitrifying activity of polyphosphate accumulating organisms in an extended ASM2d model. Water Res. 2010, 44, 5284–5297. [Google Scholar] [CrossRef] [PubMed]
  20. HACH DR/2010 Spectrophotometer Handbook; Hach Company: Loveland, CO, USA, 1999.
  21. van Veldhuizen, H.M.; van Loosdrecht, M.C.M.; Heijnen, J.J. Modelling biological phosphorus and nitrogen removal in a full scale activated sludge process. Water Res. 1999, 33, 3459–3468. [Google Scholar] [CrossRef]
  22. Drewnowski, J.; Makinia, J.; Szaja, A.; Łagód, G.; Kopeć, Ł. Comparative Study of Balancing SRT by Using Modified ASM2d in Control and Operation Strategy at Full-Scale WWTP. Water 2019, 11, 485. [Google Scholar] [CrossRef] [Green Version]
  23. Vanrolleghem, P.A.; Insel, G.; Petersen, B.; Sin, G.; De Pauw, D.; Nopens, I.; Weijers, S.; Gernaey, K. A comprehensive model calibration procedure for activated sludge models. In Proceedings of the 76th Annual WEF Technical Exhibition and Conference (WEFTEC2003), Los Angeles, CA, USA, 11–15 October 2003. [Google Scholar]
  24. Larrea, L.; Irizar, I.; Hidalgo, M.E. Improving the predictions of ASM2d through modelling in practice. Water Sci. Technol. 2002, 45, 199–208. [Google Scholar] [CrossRef]
Figure 1. Schematic presentation of calibration procedure.
Water 13 03383 g001
Figure 2. Linear fitting of P-PO4 vs. COD for YPO4 estimation.
Water 13 03383 g002
Figure 3. A schematic presentation of BioWin plant configuration.
Water 13 03383 g003
Figure 4. Period IV—simulated effluent concentration of COD, ammonia, soluble P, and nitrate vs. measured data.
Water 13 03383 g004
Figure 5. Period IV—SHT simulated concentration of COD, ammonia, and soluble P vs. measured data.
Water 13 03383 g005
Table 1. Significant characteristics of the six periods of operation (extracted from [1]).
IIIIIIIVVVI
QIN(m3/d)1.441.471.471.471.471.44
QR(m3/d)3.023.023.022.042.042.04
VAER(m3)0.500.500.500.880.880.88
SRT(d)20137819265406
SS(mg SS/L)111.0 ± 79.1 178.0 ± 70.7114.4 ± 136.6137.5 ± 108.870.7 ± 77.9143.3 ± 167.1
COD(mg COD/L)260.0 ± 94.0293.0 ± 59.1228.0 ± 81.6340.0 ± 289.8213.0 ± 149.0332.4 ± 235.0
sCOD(mg COD/L)106.0 ± 37.5131.0 ± 27.7109.0 ± 62.0105.0 ± 28.183.6 ± 90.9106.4 ± 17.7
N-NH4(mg N/L)27.3 ± 9.836.7 ± 5.732.3 ± 15.226.6 ± 12.220.1 ± 3.619.7 ± 9.2
N-NO3(mg N/L)2.2 ± 0.75.4 ± 1.43.2 ± 1.32.0 ± 1.40.8 ± 0.80.4 ± 0.5
P-PO4(mg P/L)2.5 ± 1.74.3 ± 0.94.0 ± 1.54.0 ± 1.43.7 ± 2.12.4 ± 1.2
MLSS (mg SS/L)3198 ± 4763120 ± 6593016 ± 2622452 ± 7001432 ± 2081720 ± 833
MLVSS(mg VSS/L)2279 ± 3742423 ± 4342492 ± 2241968 ± 5831048 ± 2591553 ± 648
ORP(mV)+73+53+7+133+148+153
T(°C)20.510.312.818.027.720.1
SS(mg SS/L)4461 ± 8133427 ± 5873748 ± 3953808 ± 4872128 ± 4202563 ± 1294
VSS(mg VSS/L)3032 ± 5612733 ± 3793172 ± 3642992 ± 4791604 ± 2892002 ± 857
pH-7.27.26.97.17.46.9
ORP(mV)−227−331−411−323−56−140
T(°C)22.311.114.520.030.322.1
Yobs(g TSS/g COD)0.4650.3660.4570.2460.1120.318
SVI(mL/g TSS)971262171987385
Table 2. Parameter values obtained from calibration process and comparison with the literature values.
ParameterUnitCalibratedDefault ASM2d
ηNO3-0.46 (a)0.80
YPO4gP/gCOD0.112 (a)0.40
μAd−11.40 (b)1.00
μHd−11.88 (b)6.00
μPAOd−11.23 (b)1.00
qPHAd−10.57 (b)3.00
ηh-0.30 (b)0.60
ηfe-0.20 (b)0.40
ηPAO *-0.07–0.160.60
(a) Off-line calibration. (b) BioWin dynamic calibration. * the ηPAO value increased from 0.07 for the first period to 0.16 for the last one.
Table 3. BioWin-calculated SRT (d) for each period and RSME (mg/L) valuation for data agreement.
RSME
(Effluent Concentrations)
RSME
(SHT Concentrations)
PeriodSRT CalculatedCODN-NH4N-NO3P-PO4CODN-NH4P-PO4
I21816.82.34.52.320.65.65.5
II3814.116.97.22.121.215.33.0
III7824.729.29.74.247.130.416.0
IV91157.86.73.93.0227.09.017.6
V6760.95.23.52.093.59.43.2
VI464165.07.54.02.3222.010.94.5
Publisher’s Note: MDPI stays neutral with regard to jurisdictional claims in published maps and institutional affiliations.

